investment climate and foreign direct investement: a …€¦ · investment climate and foreign...
TRANSCRIPT

GLOBAL JOURNAL OF BUSINESS RESEARCH ♦ Volume 1 ♦ Number 2 ♦ 2007
INVESTMENT CLIMATE AND FOREIGN DIRECT INVESTMENT: A STUDY OF SELECTED COUNTRIES
IN LATIN AMERICA Rahim M. Quazi, Prairie View A&M University
ABSTRACT
Since the early 1980s, developing countries around the world have lifted restrictions on foreign capital inflow. Among the Latin American countries, Mexico has now become a prime destination of FDI. There are however eight other countries in the region --Argentina, Bolivia, Brazil, Costa Rica, Ecuador, Nicaragua, Panama, and Peru, that have emerged as Mexico’s main regional rivals as FDI destinations. For this sample of nine countries, this study econometrically estimates the determinants of FDI, examines the relationship between FDI and economic freedom, and analyzes the investment climate from foreign firms’ perspective. Using panel regression models, this study finds that FDI inflow is significantly boosted by foreign investors’ increased familiarity with the host economy, better infrastructure, higher return on investment, and greater trade openness, but the inflow is significantly depressed by lack of economic freedom. Furthermore, this study finds that FDI inflow is negatively correlated with policy changes that result in higher trade barriers, more repressive taxation, more restrictive foreign investment code, more repressive financial system, and further price and wage controls. Finally, this study identifies two factors --excessive bureaucracy and inefficient financial markets, which have possibly created locational disadvantages for Mexico vis-à-vis its regional rival countries. INTRODUCTION
oreign direct investment (FDI) can be generally defined as the process that allows investors of a source country to acquire substantial ownership of capital and controlling interest in an enterprise in a host country. The IMF Balance of Payments Manual defines FDI as “an investment that is
made to acquire a lasting interest in an enterprise operating in an economy other than that of the investor, the investor’s purpose being to have an effective voice in the management of the enterprise” (Moosa, 2002).
F FDI not only serves the long-term financial interests of foreign investors, it can also play a critical role in the growth dynamics of host countries. The literature holds that FDI can fill at least three “development gaps” in developing countries. FDI can fill, first, the “investment gap” by providing the much-needed capital for domestic investment; secondly, the “foreign exchange gap” by providing foreign currency through initial investments and subsequent export earnings; and finally, the “tax revenue gap” by generating tax revenues through creation of additional economic activities (Smith, 1997). FDI can also help generate domestic investment in matching funds, facilitate transfer of managerial skills and technological knowledge, increase local market competition, create modern job opportunities, increase global market access for locally produced export commodities, etc., all of which should ultimately contribute to host countries’ economic growth. Recognizing the benefits of FDI, developing countries have generally eased restrictions on the inflow of foreign capital since the early 1980s. Furthermore, the end of the Cold War in the early 1990s resulted in a new political dynamics that forced LDCs, hitherto heavily dependent on foreign public aid regardless of their political ideological leanings, to seek out alternative sources of foreign private capital. As a result, the annual FDI inflow to developing countries increased manifold from $23 billion (0.7% of their combined GDP) in 1990 to about $211 billion (2.6% of combined GDP) in 2004 (World Bank, 2006).
1

R. M. Quazi ⎪ Global Journal of Business Research ♦Vol. 1 ♦ No. 2 ♦ 2007
Among developing regions, Latin America receives a very high share of FDI. This perhaps can be explained by two factors --first, having formed many trade blocks (such as MERCOSUR, Andean Community, etc.), these countries are at the forefront of free trade movement, which helps attract FDI to the entire region, and secondly, the geographical proximity to the U.S. and Japan --the two most significant source countries of FDI, can also boost their locational advantage. The World Bank (2006) reports that the annual FDI inflow to Latin America & Caribbean countries jumped from $8 billion (0.8% of regional GDP) in 1990 to about $61 billion (3.0% of regional GDP) in 2004. One country in this region that deserves special attention is Mexico, which, due to its membership in NAFTA, has become a magnet for FDI and is currently among the most important destinations of FDI in the world. There are eight other countries in Latin America --Argentina, Bolivia, Brazil, Costa Rica, Ecuador, Nicaragua, Panama, and Peru, that have emerged as Mexico’s main rivals as FDI destinations in the region. Table 1 below shows ten year (1995-2004) averages of FDI inflow as a ratio of GDP for each one of the sample countries and their differences with Mexico’s average FDI/GDP ratio. Table 1: FDI/GDP Ratio for Selected Countries in Latin America
Country Average FDI/GDP (%) (1995-2004) Difference with Mexico
Argentina 2.94 + 0.01
Bolivia 7.46 + 4.53
Brazil 3.24 + 0.31
Costa Rica 3.38 + 0.45
Ecuador 4.09 + 1.16
Mexico 2.93 ---
Nicaragua 5.33 + 2.40
Panama 6.13 + 3.20
Peru 4.74 + 1.81 Source: World Development Indicators, World Bank (2006) For this sample of nine countries in Latin America, this study econometrically estimates the determinants of FDI, examines the relationship between FDI and economic freedom, and analyzes the investment climate from foreign firms’ perspectives. The results found in this study further our knowledge of the factors that affect FDI, which should be helpful for devising effective strategies to attract more FDI into this region. LITERATURE REVIEW An extensive empirical literature exists on the flow of FDI to developing countries. Most of these studies have identified domestic economic environment, market size, quality of infrastructure, labor cost, economic openness, return on capital, political stability, etc. among the key variables that drive the flow of FDI. There are many instances of conflicting results regarding the direction of influence of the determinants of FDI (Chakrabarti, 2001). For example, Wheeler and Mody (1992) found that labor cost has positive effects on FDI, but Schneider and Frey (1985) found the opposite, and Schneider and Frey (1985) found that political instability significantly depresses FDI, while Loree and Guisinger (1995) found the effects to be insignificant. Notwithstanding these differences, the FDI literature has continued to grow and capture the fascination of applied development economists. Many studies have found that political instability seriously erodes foreign investors' confidence in the local investment climate repelling foreign investment away. Barro (1991) and Corbo and Schmidt-Hebbel (1991) stated that political instability creates an uncertain economic environment detrimental to long-term planning, which reduces economic growth and investment opportunities. Leavell et al. (2004)
2

GLOBAL JOURNAL OF BUSINESS RESEARCH ♦ Volume 1 ♦ Number 2 ♦ 2007
addressed the importance of political structure, level of political corruption, efficient markets, enforceable contracts and property rights in attracting FDI. Asiedu (2002) and Haque et al. (1997) contended that countries located in Sub-Saharan Africa are perceived as inherently risky, which likely keeps foreign investors away from that region. Quazi and Rashid (2004) found that when economic freedom is incorporated as a determinant of FDI, there remains no inherent bias against Sub Saharan Africa, but there is indeed a regional bias in favor of countries located in Latin America & Caribbean vis-à-vis other developing regions. Many empirical studies in the FDI literature have found domestic market size to be a significant and robust determinant of FDI. Scaperlanda and Mauer (1969) put forth the hypothesis that FDI inflow responds positively to the recipient country’s market size once it grows beyond a threshold level that is large enough to allow economies of scale. Many studies, such as Root and Ahmed (1979), Schneider and Frey (1985), Wheeler and Mody (1992), and Tsai (1994), have empirically confirmed this hypothesis for developing countries. Availability of skilled workers can significantly boost the international competitiveness of a host country. Hanson (1996), Root and Ahmed (1979), and Schneider and Frey (1985) found that the level of human capital, which is a good indicator of the availability of a skilled work force, is a significant determinant of the locational advantage of a host country and plays a key role in attracting FDI. Noorbakhsh et al. (2001) also found that human capital, which can also be a proxy for investment attractiveness, is a key determinant of FDI. Among the other variables, Noorbakhsh et al (2001) found that FDI inflow responds positively to lagged changes in FDI, which can be used as a proxy for the level of familiarity foreign investors have about a particular country. Edwards (2000), Jaspersen et al (2000), and Asiedu (2002) found that the rate of return on investment positively affects the FDI inflow, while Edwards (1990) and Gastanaga et al (1998) found that trade openness also causes the same. Finally, Wheeler and Mody (1992), Loree and Guisinger (1995), and Asiedu (2002) found that availability (and quality) of infrastructure, a critical determinant of international competitiveness, significantly affects the FDI inflow. Among recent studies of FDI in Mexico, Cuevas et al (2005) and Aroca and Maloney (2005) found that NAFTA has substantially boosted the FDI inflow to Mexico, however Quazi (2007) found that, accounting for the economic fundamentals, NAFTA has created an insignificant locational advantage for Mexico vis-à-vis other countries in Latin America. These apparently contradictory results can be reconciled by the fact that since other Latin American countries already belong to several trade blocks, such as MERCOSUR (Argentina, Brazil, Paraguay, and Uruguay), Andean Community (Bolivia, Colombia, Ecuador, Peru, and Venezuela), etc., they had been enjoying the fruits of free trade agreements long before Mexico was afforded the same by the creation of NAFTA. This study makes three contributions to the FDI literature --first, it investigates the determinants of FDI in the sample countries, secondly, it examines the relationship between FDI and economic freedom, and thirdly, it analyzes foreign firms’ perspectives about the host country investment climate. THE ECONOMETRIC MODEL The empirical models found in the FDI literature have typically included subsets of the following variables --incremental lagged changes in FDI (ΔFDIt–1), economic freedom, trade openness, domestic market size, human capital, infrastructure, return on investment, political instability, etc. In the absence of a consistent theoretical framework to guide the empirical work, this study formulates the following general-to-specific model. Since the model is estimated with panel data (time-series data over 1995-2004 from a cross-section of nine countries), subscript i refers to countries and t refers to time.
3
R. M. Quazi ⎪ Global Journal of Business Research ♦Vol. 1 ♦ No. 2 ♦ 2007
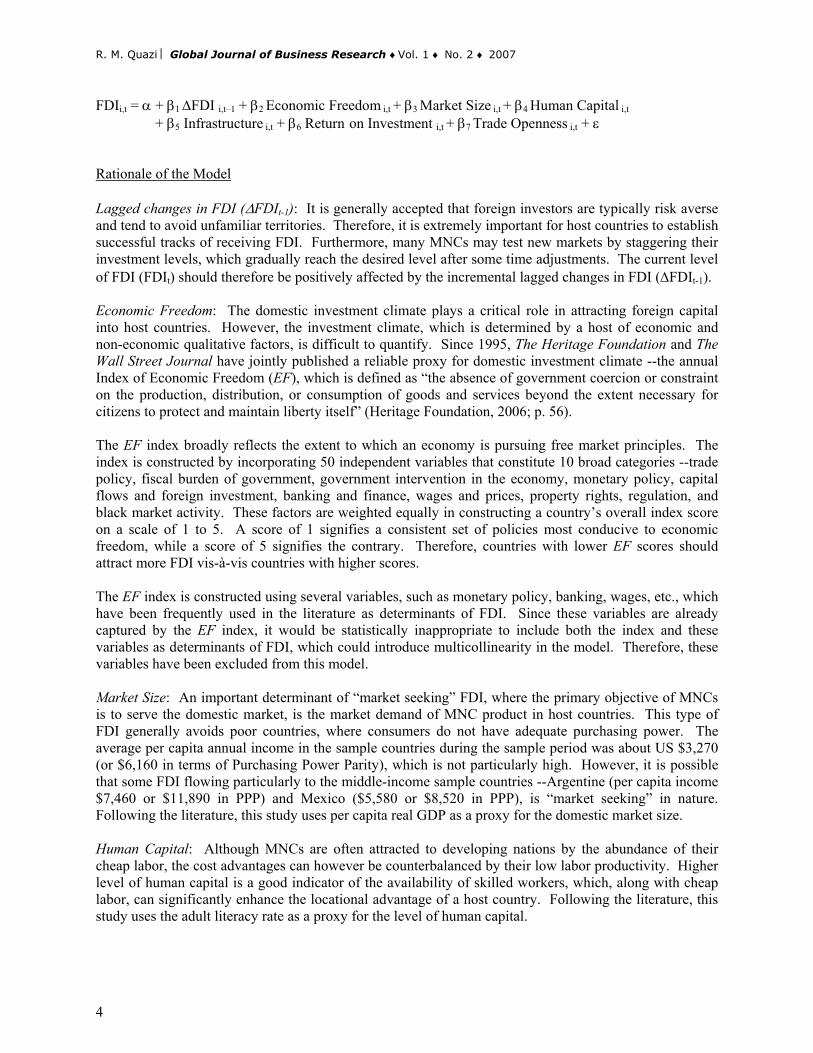
FDIi,t = α + β1 ΔFDI i,t–1 + β2 Economic Freedom i,t + β3 Market Size i,t + β4 Human Capital i,t
+ β5 Infrastructure i,t + β6 Return on Investment i,t + β7 Trade Openness i,t + ε Rationale of the Model Lagged changes in FDI (ΔFDIt-1): It is generally accepted that foreign investors are typically risk averse and tend to avoid unfamiliar territories. Therefore, it is extremely important for host countries to establish successful tracks of receiving FDI. Furthermore, many MNCs may test new markets by staggering their investment levels, which gradually reach the desired level after some time adjustments. The current level of FDI (FDIt) should therefore be positively affected by the incremental lagged changes in FDI (ΔFDIt-1). Economic Freedom: The domestic investment climate plays a critical role in attracting foreign capital into host countries. However, the investment climate, which is determined by a host of economic and non-economic qualitative factors, is difficult to quantify. Since 1995, The Heritage Foundation and The Wall Street Journal have jointly published a reliable proxy for domestic investment climate --the annual Index of Economic Freedom (EF), which is defined as “the absence of government coercion or constraint on the production, distribution, or consumption of goods and services beyond the extent necessary for citizens to protect and maintain liberty itself” (Heritage Foundation, 2006; p. 56). The EF index broadly reflects the extent to which an economy is pursuing free market principles. The index is constructed by incorporating 50 independent variables that constitute 10 broad categories --trade policy, fiscal burden of government, government intervention in the economy, monetary policy, capital flows and foreign investment, banking and finance, wages and prices, property rights, regulation, and black market activity. These factors are weighted equally in constructing a country’s overall index score on a scale of 1 to 5. A score of 1 signifies a consistent set of policies most conducive to economic freedom, while a score of 5 signifies the contrary. Therefore, countries with lower EF scores should attract more FDI vis-à-vis countries with higher scores. The EF index is constructed using several variables, such as monetary policy, banking, wages, etc., which have been frequently used in the literature as determinants of FDI. Since these variables are already captured by the EF index, it would be statistically inappropriate to include both the index and these variables as determinants of FDI, which could introduce multicollinearity in the model. Therefore, these variables have been excluded from this model. Market Size: An important determinant of “market seeking” FDI, where the primary objective of MNCs is to serve the domestic market, is the market demand of MNC product in host countries. This type of FDI generally avoids poor countries, where consumers do not have adequate purchasing power. The average per capita annual income in the sample countries during the sample period was about US $3,270 (or $6,160 in terms of Purchasing Power Parity), which is not particularly high. However, it is possible that some FDI flowing particularly to the middle-income sample countries --Argentine (per capita income $7,460 or $11,890 in PPP) and Mexico ($5,580 or $8,520 in PPP), is “market seeking” in nature. Following the literature, this study uses per capita real GDP as a proxy for the domestic market size. Human Capital: Although MNCs are often attracted to developing nations by the abundance of their cheap labor, the cost advantages can however be counterbalanced by their low labor productivity. Higher level of human capital is a good indicator of the availability of skilled workers, which, along with cheap labor, can significantly enhance the locational advantage of a host country. Following the literature, this study uses the adult literacy rate as a proxy for the level of human capital.
4

GLOBAL JOURNAL OF BUSINESS RESEARCH ♦ Volume 1 ♦ Number 2 ♦ 2007
Infrastructure: Availability and quality of roads, highways, airports, seaports, electricity, telecommunication networks, etc. should increase productivity and thereby boost the locational advantage of a host country. This study uses the natural log of mobile phone connections per capita as a proxy for the availability of infrastructure. In addition to availability, reliability of infrastructure (such as the frequency of network outage) could also be a crucial indicator of the overall quality of infrastructure, for which data is not readily available for most countries in the sample. Return on Investment: Higher rate of return on investment should attract higher levels of foreign capital into a host country. However, due to the absence of well-developed capital markets in most developing countries, measuring the rate of return on investment is difficult. Several studies, such as Edwards (1990) and Jaspersen et al. (2000), have proposed a solution to this problem --the inverse of per capita income in natural log can be used as a proxy for the return on investment. The rationale is that return on investment should be positively correlated with the marginal product of capital, which should be high in capital-scarce poor countries where per capita income is low (or the inverse of per capita income is high). Therefore, the inverse of per capita income should be positively related to FDI inflow. Following the literature, this study uses the natural log of inverse of per capita real GDP as a proxy for return on investment. Trade Openness: Foreign investors typically have favorable impressions of countries that are open to international trade (for example, the Asian tigers). It should be noted here that since the end of the WWII and until the 1980s, Latin America had followed the lead of Mexico and Brazil to embrace the Import Substitution Industrialization (ISI) strategy that emphasized economic self-sufficiency and turned these countries inward. After more than three decades of economic disappointment, these countries abandoned the ISI strategy for Export Oriented Industrialization (EOI) strategy and turned themselves outward toward globalization. This change of economic philosophy should have positively affected the FDI inflow. Following the literature, trade openness is measured by the share of total volume of trade (exports plus imports) in GDP. Although political instability is frequently found in the literature as a significant determinant of FDI, this study did not include this variable in the model. The reason is that the sample period used in this study is 1995-2004 --a period of relative political stability in the region. DATA, METHODOLOGY AND ESTIMATION The regression model is estimated using panel data from nine Latin American countries covering the period 1995-2004. Data for FDI (annual FDI inflow as a percentage of GDP), trade openness (volume of trade as a share of GDP), per capita income, per capita mobile phone connections, and adult literacy rate are collected from the World Development Indicators (World Bank, 2006), while data for economic freedom are collected from the 2006 Index of Economic Freedom (Heritage Foundation, 2006). The timeframe covered by the dataset (1995-2004) was determined by the availability of data. The EF index is available only from 1995 and the WDI CD-ROM 2006 reports annual FDI inflow until 2004. The model has been estimated using panel regression methods. To ensure robustness of the estimated results, two widely used methods --Generalized Least Squares (GLS) and Random Effects, have been used. The estimated results, presented in Table 2, reveal that among the explanatory variables incremental lagged changes in FDI, economic freedom, infrastructure, return on investment, and trade openness turned out highly significant with the correct a priori signs. Only two explanatory variables --market size and human capital, turned out statistically insignificant. As discussed before, the sample countries are not very wealthy, which perhaps makes their domestic markets unattractive for “market seeking” type of FDI. It is also plausible that the proxy variables used for market size and human capital --per capita income and adult literacy rates, are perhaps poor proxies for these variables. Nevertheless,
5

R. M. Quazi ⎪ Global Journal of Business Research ♦Vol. 1 ♦ No. 2 ♦ 2007
the overall diagnostic statistics appear satisfactory for each model. The White test for heteroscedasticity revealed signs of heteroscedasticity; therefore, the GLS model was estimated with heteroscedastic panels. It was also assumed that the panels had panel-specific autocorrelation parameters (estimation details are available from the author).
Table 2: Determinants of FDI in Sample Latin American Countries
Explanatory Variables GLS Model Random Effects Model
Coefficient Z stat Coefficient Z stat
Intercept 25.77 13.76 28.76 4.88
ΔFDIt-1 0.18 2.69** 0.43 4.45**
Economic Freedom -1.02 -4.75** -1.30 -1.90*
Infrastructure 0.34 3.66** 0.24 1.75* Return on Investment 2.44 12.89** 2.60 4.29**
Trade Openness 0.01 4.63** 0.01 1.83*
Diagnostic Statistics
Sample size = 90 Sample size = 90
Log likelihood = -124.12 R2 Overall = 0.44
Wald χ25
= 202.42 (P value = 0.00) Wald χ25
= 42.83 (P value = 0.00) ** Coefficient is significant at 5% level of significance; * Coefficient is significant at 10% level of significance The estimated results confirm the a priori hypothesis that while FDI inflow is significantly boosted by incremental lagged changes in FDI, better infrastructure, higher return on investment, and greater trade openness, the inflow is also significantly depressed by lack of economic freedom. Although these results are generally consistent with the FDI literature, the result that economic freedom (or the lack of it) is a significant determinant of FDI deserves further analysis. The FDI literature has not yet fully addressed the importance of economic freedom (or investment climate), as quantitative data on investment climate was generally lacking until the Economic Freedom Index became available in 1995. Therefore, it is important to adequately analyze the relationship between FDI and economic freedom (and the 10 independent variables that constitute the index). As mentioned before, the Economic Freedom Index is constructed by incorporating 10 broad categories, which in turn are constructed by 50 independent variables. Table 1A in the Appendix section lists the disaggregated broad categories and their underlying independent variables. According to the methodologies discussed in 2006 Index of Economic Freedom (Heritage Foundation, 2006), each one of the 50 underlying variables is evaluated annually to reflect the institutional environment in each country. Based on the individual score of each underlying variable (which is not reported by the publication), the 10 disaggregated categories are graded on a scale of 1 to 5, where a lower score signifies policies conducive to economic freedom, and conversely a higher score signifies the contrary. Since this study found that lack of economic freedom significantly depresses FDI, it is rational to hypothesize that similar negative relationships should be found between most of the individual disaggregated categories of the index and FDI inflow (a higher score is reflective of worse policy setting, which should result in reduced FDI inflow). To test the hypothesis, a pair-wise correlation matrix was computed, which is presented in Table 3 below.
6

GLOBAL JOURNAL OF BUSINESS RESEARCH ♦ Volume 1 ♦ Number 2 ♦ 2007
Table 3: Pair-wise Correlation between FDI and Categories of EF Index
Disaggregated Categories of EF Index Correlation Coefficient with FDI Significance of Coefficient
Trade Policy -0.22 0.03**
Fiscal Burden of Government -0.25 0.02**
Govt. Intervention in the Economy 0.13 0.22
Monetary Policy -0.12 0.27
Capital Flows & Foreign Investment -0.22 0.03**
Banking and Finance -0.27 0.01**
Wages and Prices -0.27 0.01**
Property Rights 0.03 0.79
Regulation 0.18 0.09*
Informal Market Activity 0.19 0.07* ** Coefficient is significant at 5% level of significance; * Coefficient is significant at 10% level of significance The correlation matrix presented in Table 3 reveal that the correlation coefficients between FDI inflow and 6 out of the 10 disaggregated categories have the correct a priori negative signs and 7 out of 10 categories are statistically significant (albeit with wrong signs for 2 coefficients, which is reconciled below). As expected, FDI inflow is negatively correlated with policy changes that result in higher trade barriers (category - trade policy), more repressive taxation (category - fiscal burden of the government), more restrictive foreign investment code (category - capital flows and foreign investment), more repressive financial system (category - banking and finance), and further price and wage controls (category - wages and prices). No significant correlation was found in this study between FDI inflow and three categories --government intervention, inflation, and property rights, which perhaps is idiosyncratic of this particular sample. However, there seems to be a simple explanation of the apparently puzzling result --the significantly positive correlation found between FDI inflow and more repressive regulation and informal markets. Besides Argentina and Mexico (which have a combined average score of 3.05 for regulation category and 2.93 for informal market category), the other seven countries in the sample are heavily regulated (average score is 3.56) and have significant economic activities in informal markets (average score is 3.84); however, these seven countries have also received far more FDI inflow (average FDI/GDP ratio over the sample period is 4.5%) vis-à-vis Argentina and Mexico (average FDI/GDP ratio is 2.93%), which is what the statistically positive correlation coefficients have captured. Evidently, these seven countries have scored better in other EF categories to compensate for the loss in the above two categories. Furthermore, their combined average EF index (2.76) is better than the combined average index for Argentina and Mexico (2.89), which explains why the seven countries’ overall investment climate is more conducive to attracting FDI. INVESTMENT CLIMATE: FOREIGN FIRMS’ PERSPECTIVES This section analyzes the sample countries’ investment climate from foreign firms’ perspectives and attempts to identify a few factors that have created locational disadvantage for Mexico vis-à-vis the other eight countries as FDI destinations. It should be noted here again (from Table 1) that the average FDI/GDP ratio for each one of these eight sample countries is higher than that of Mexico. The dataset used in this section is published by the Enterprise Analysis unit of the World Bank (Enterprise Surveys data), which captures over 150 business environment indicators, based on surveys of more than 58,000 firms in 91 countries.
7

R. M. Quazi ⎪ Global Journal of Business Research ♦Vol. 1 ♦ No. 2 ♦ 2007
The nature and scope of this survey is described on the Enterprise Surveys website as: “The Enterprise Surveys capture business perceptions on the biggest obstacles to enterprise growth, the relative importance of various constraints to increasing employment and productivity, and the effects of a country’s investment climate on its international competitiveness” (Enterprise Surveys, 2007). The core survey is organized into two parts --the first part seeks managers’ opinions on the main constraints in the business environment, and the second part focuses on productivity measures. Although the Enterprise Surveys data are presented for both domestic and foreign firms, since the focus of this study is analyzing factors relevant to FDI, this section uses data from only foreign firms. Table 4 below shows two important factors --bureaucracy and financial markets, where foreign firms based in Mexico have responded more unfavorably vis-à-vis foreign firms based in the other countries (labeled as “Rivals”). The first section of Table 4 shows that foreign firms in Mexico spend significantly more senior management time, vis-à-vis foreign firms in rival countries, in dealing with requirements of government regulation and the regulatory climate in Mexico is perceived to be more uncertain vis-à-vis the rival countries. Since dealing with excessive bureaucracy and an uncertain regulatory climate can consume a large amount of time and resources, these negative perceptions are not conducive to attracting FDI to Mexico. These perceptions are consistent with the EF score for Mexico in the regulation category (average score over the sample period is 3.80) vis-à-vis the combined average score for the rival countries (3.40). Therefore, data from two independent sources --EF Index and Enterprise Survey data, seem to suggest that an important pre-condition for Mexico to attract more foreign investment is to improve its regulatory environment. Table 4: Factors Creating Locational Disadvantages for Mexico
Excessive Bureaucracy Rivals Mexico
Senior management time spent in dealing with requirements of government regulation (%) 13.03 19.23
Consistency/predictability of officials' interpretations of regulations affecting the firm 44.13 40.16
Underdeveloped Financial Markets Rivals Mexico
Internal financing (%) 56.61 80
Bank financing (%) 18.68 0.84
Supplier credit financing (%) 13.35 17.48
Equity, sale of stock for financing (%) 2.89 0
Internal finance for investment (%) 60.80 69.38
Bank finance for investment (%) 18.93 5.5
Supplier credit finance for investment (%) 6.35 16.13
Equity, sale of stock for investment (%) 5.01 0
A recent study by the U.S. Department of State (2007) also found that, according to foreign investors, bureaucracy, slow government decision-making, and lack of transparency, among other factors, are the main obstacles to investment in Mexico. The study also noted that Mexico has made some progress in recent year in improving its regulatory environment. For example, the Comisión Federal de Mejora Regulatoria (COFEMER), or Federal Regulatory Improvement Commission has removed almost 50% of the information, registration, and permit requirements imposed on businesses by 11 federal government ministries and simplified 90% of the remaining requirements. To improve transparency of current processes, COFEMER has further compiled all business formalities in the Federal Registry of Business Formalities and made it available online. The Secretariat of Public Administration has set up several internet sites to improve transparency of government decision-making. Among these sites, “Normateca” provides information on government regulations, “Compranet” permits online government procurements,
8

GLOBAL JOURNAL OF BUSINESS RESEARCH ♦ Volume 1 ♦ Number 2 ♦ 2007
and “Tramitanet” allows electronic processing of government transactions, which reduces the risk for bribes (Ibid). These regulatory improvements should help boost Mexico’s long-run FDI prospects. The second section of Table 4 shows that for financing and investment purposes, foreign firms in Mexico rely much more on their internal resources and supplier credit, and much less on the financial markets (banks, stock market, etc.) than in rival countries. Since foreign firms find access to efficient financial markets lagging in Mexico, this can create a negative perception not conducive to attracting FDI. Again, these perceptions are consistent with the EF score for Mexico in the banking & finance category (3.30) vis-à-vis the combined average score for the rival countries (2.48). Furthermore, one of the underlying variables for the capital flows & foreign investment category was availability of local financing for foreign companies, which is essentially what theses figures show in Table 4. The EF score in this category for Mexico is 2.40 --worse than the average score for the rivals (2.15), which is consistent with the figures in Table 4. The current inefficiencies in the Mexican financial sector can be partially traced back to the peso crisis of 1994 (also called the Tequila crisis). Caused by a combination of overvalued fixed exchange rate, non-independent Central Bank, weak financial regulation, and political crisis, the massive peso devaluation wrecked havoc in the financial sector whose crippling aftershocks could be felt for years. Since the crisis, Mexico has introduced many financial reforms that are gradually restoring financial stability. These reforms, together with sound macroeconomic fundamentals, should eventually bring about a sound financial sector and capital market in Mexico (U.S. Department of State, 2007). Since the passage of NAFTA, many U.S. and Canadian firms have entered the Mexican financial services market. For example, the U.S. banking giant Citigroup has acquired Banamex and Canada’s Scotia Bank has acquired Inverlat. Another country that has a significant presence in the Mexican capital market is Spain, whose BBVA (Banco Bilbao Vizcaya) has acquired Bancomer, reputed to be the most prestigious of Mexico’s banks. These foreign banks through their Mexican subsidiaries control over 80 percent of the banking system, which should contribute positively to the long-term prospect of the banking sector. Not only the patronage of these foreign banks should provide Mexican banks with much greater access to capital than before, but also close collaboration with foreign banks should improve the banking system’s risk management techniques, such as standards in auditing, disclosures, etc. (U.S. Department of State, 2007). It appears that the Mexican banking system is on track to catch up with its regional rivals. Despite the presence of two factors identified above that are not conducive to attracting FDI, Mexico does host quite a few factors that are very much favorable to FDI. Table 5 below shows that, compared with foreign firms in rival countries, foreign firms in Mexico believe they face lower corruption, lower crime-related costs, and more efficient tax and trade regimes. Table 5: Factors Creating Locational Advantage for Mexico
Corruption Rivals Mexico
Unofficial payments for typical firm to get things done (% of sales) 1.09 0.19
Firms expected to give gifts in meetings with tax inspectors (%) 5.66 2.86
Value of gift expected to secure government contract (% of contract) 2.06 0.25
Pays Bribes to get things done (% firms) 27.63 14.16
Crime Rivals Mexico
Security costs (% of sales) 3.33 2.31
Losses due to theft, robbery, vandalism, and arson against the firm (% of sales) 0.25 0.20
9
R. M. Quazi ⎪ Global Journal of Business Research ♦Vol. 1 ♦ No. 2 ♦ 2007
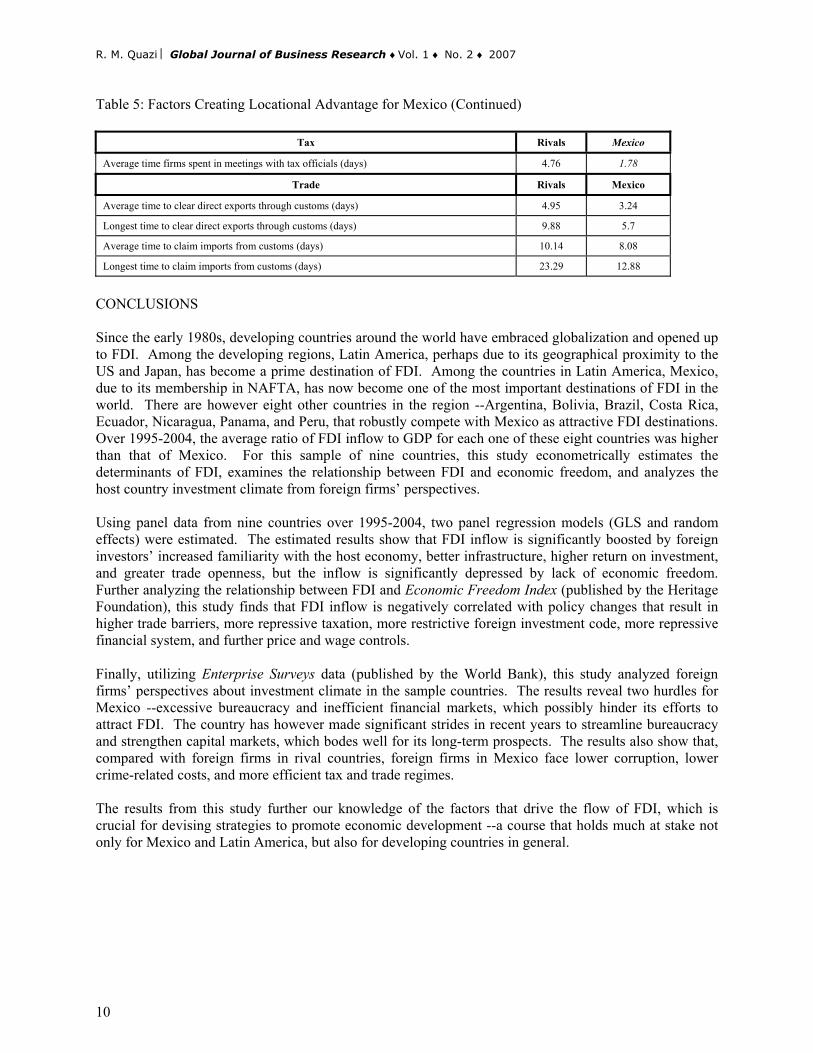
Table 5: Factors Creating Locational Advantage for Mexico (Continued)
Tax Rivals Mexico
Average time firms spent in meetings with tax officials (days) 4.76 1.78
Trade Rivals Mexico
Average time to clear direct exports through customs (days) 4.95 3.24
Longest time to clear direct exports through customs (days) 9.88 5.7
Average time to claim imports from customs (days) 10.14 8.08
Longest time to claim imports from customs (days) 23.29 12.88
CONCLUSIONS Since the early 1980s, developing countries around the world have embraced globalization and opened up to FDI. Among the developing regions, Latin America, perhaps due to its geographical proximity to the US and Japan, has become a prime destination of FDI. Among the countries in Latin America, Mexico, due to its membership in NAFTA, has now become one of the most important destinations of FDI in the world. There are however eight other countries in the region --Argentina, Bolivia, Brazil, Costa Rica, Ecuador, Nicaragua, Panama, and Peru, that robustly compete with Mexico as attractive FDI destinations. Over 1995-2004, the average ratio of FDI inflow to GDP for each one of these eight countries was higher than that of Mexico. For this sample of nine countries, this study econometrically estimates the determinants of FDI, examines the relationship between FDI and economic freedom, and analyzes the host country investment climate from foreign firms’ perspectives. Using panel data from nine countries over 1995-2004, two panel regression models (GLS and random effects) were estimated. The estimated results show that FDI inflow is significantly boosted by foreign investors’ increased familiarity with the host economy, better infrastructure, higher return on investment, and greater trade openness, but the inflow is significantly depressed by lack of economic freedom. Further analyzing the relationship between FDI and Economic Freedom Index (published by the Heritage Foundation), this study finds that FDI inflow is negatively correlated with policy changes that result in higher trade barriers, more repressive taxation, more restrictive foreign investment code, more repressive financial system, and further price and wage controls. Finally, utilizing Enterprise Surveys data (published by the World Bank), this study analyzed foreign firms’ perspectives about investment climate in the sample countries. The results reveal two hurdles for Mexico --excessive bureaucracy and inefficient financial markets, which possibly hinder its efforts to attract FDI. The country has however made significant strides in recent years to streamline bureaucracy and strengthen capital markets, which bodes well for its long-term prospects. The results also show that, compared with foreign firms in rival countries, foreign firms in Mexico face lower corruption, lower crime-related costs, and more efficient tax and trade regimes. The results from this study further our knowledge of the factors that drive the flow of FDI, which is crucial for devising strategies to promote economic development --a course that holds much at stake not only for Mexico and Latin America, but also for developing countries in general.
10

GLOBAL JOURNAL OF BUSINESS RESEARCH ♦ Volume 1 ♦ Number 2 ♦ 2007
APPENDIX
Table 1A: Categories and Underlying Variables of Economic Freedom Index
Broad Categories Underlying Variables
1. Trade policy • Weighted average tariff rate • Non-tariff barriers • Corruption in the customs service
2. Fiscal Burden of Government • Top marginal income tax rate • Top marginal corporate tax rate • Year-to-year change in government expenditures as a percent of GDP
3. Government Intervention in the Economy
• Government consumption as a percentage of the economy • Government ownership of businesses and industries • Share of government revenues from state owned enterprises and government
ownership of property • Economic output produced by the government
4. Monetary policy • Weighted average inflation rate from 1995 to 2004
5. Capital Flows and Foreign Investment
• Foreign investment code • Restrictions on foreign ownership of business • Restrictions on industries and companies open to foreign investors • Restrictions and performance requirements on foreign companies • Foreign ownership of land • Equal treatment under the law for both foreign and domestic companies • Restrictions on repatriation of earnings • Restrictions on capital transactions • Availability of local financing for foreign companies
6. Banking and Finance
• Government ownership of financial institutions • Restrictions on the ability of foreign banks to open branches and subsidiaries • Government influence over the allocation of credit • Government regulations that inhibit financial activity • Freedom to offer all types of financial services, securities, and insurance
policies
7. Wages and Prices
• Minimum wage laws • Freedom to set prices privately without government influence • Government price controls • Extent to which government price controls are used • Government subsidies to businesses that affect prices
8. Property Rights
• Freedom from government influence over the judicial system • Commercial code defining contracts • Sanctioning of foreign arbitration of contract disputes • Government expropriation of property • Corruption within the judiciary • Delays in receiving judicial decisions and/or enforcement • Legally granted and protected private property
9. Regulation
• Licensing requirements to operate a business • Ease of obtaining a business license • Corruption within the bureaucracy • Labor regulations, such as established workweeks, paid vacations, and parental
leave, as well as selected labor regulations • Environmental, consumer safety, and worker health regulations • Regulations that impose a burden on business
10. Informal Market Activity
• Smuggling • Piracy of intellectual property in the informal market • Agricultural production supplied on the informal market • Manufacturing supplied on the informal market • Services supplied on the informal market • Transportation supplied on the informal market • Labor supplied on the informal market
11

R. M. Quazi ⎪ Global Journal of Business Research ♦Vol. 1 ♦ No. 2 ♦ 2007
REFERENCES Aroca, P. and Maloney, W. (2005) “Migration, Trade, and Foreign Direct Investment in Mexico,” The World Bank Economic Review, vol. 19(3), pp. 449-472 Asiedu, E. (2002) “On the Determinants of Foreign Direct Investment to Developing Countries: Is Africa Different?” World Development, vol. 30(1), pp. 107-118 Barro, R. (1991) “Economic Growth in Cross Section of Countries,” Quarterly Journal of Economics, vol. 106, pp. 407-444 Chakrabarti, A. (2001) “The Determinants of Foreign Direct Investment: Sensitivity Analyses of Cross-country Regressions,” KYKLOS, vol. 54, pp. 89-114 Corbo, V. and Schmidt-Hebbel, K. (1991) “Public Policies and Savings in Developing Countries,” Journal of Development Economics, vol. 36, pp. 89-115 Cuevas, A., Messmacher, M. and Werner, A. (2005) “Foreign Direct Investment in Mexico since the Approval of NAFTA,” The World Bank Economic Review, vol. 19(3), pp. 473-488 Edwards, S. (1990) Capital Flows, Foreign Direct Investment, and Debt-Equity Swaps in Developing Countries, NBER working paper no. 3497 Enterprise Surveys (2007) World Bank Enterprise Analysis Unit (http://www.enterprisesurveys.org) Gastanaga, V., Nugent, J. and Pashamiova, B. (1998) “Host Country Reforms and FDI Inflows: How Much Difference Do They Make?” World Development, vol. 26(7), pp. 1299-1314 Hanson, J. (1996) “Human Capital and Direct Investment in Poor Countries,” Explorations in Economic History, vol. 33, pp. 86-106 Haque, N., Mathieson, D. and Sharma, S. (1997) “Causes of Capital Inflows and Policy Responses to Them,” Finance & Development, March, pp. 3-6 Jaspersen, F., Aylward, A. and Knox, A. (2000) “The Effects of Risk on Private Investment: Africa Compared with Other Developing Areas,” in P. Collier and C. Pattillo (Eds.), Investment and Risk in Africa, New York: St. Martin’s Press, pp. 71-95 Loree, D. and Guisinger, S. (1955) “Policy and Non-policy Determinants of US Equity Foreign Direct Investment,” Journal of Business Studies, vol. 26(2), pp. 281-299 Moosa, I. (2002) Foreign Direct Investment: Theory, Evidence and Practice (1st Edition), New York: Palgrave Noorbakhsh, F., Paloni, A. and Youssef, A. (2001) “Human Capital and FDI Inflows to Developing Countries: New Empirical Evidence,” World Development, vol. 29(9), pp. 1593-1610 Quazi, R. (2007) “Foreign Direct Investment in Latin America: A Panel Regression Study,” International Journal of Business and Finance Research, vol. 1(1), pp. 59-67
12

GLOBAL JOURNAL OF BUSINESS RESEARCH ♦ Volume 1 ♦ Number 2 ♦ 2007
Quazi, R. and Mahmud, M. (2006) “Determinants of Foreign Direct Investment in South Asia,” The International Journal of Business and Public Administration, vol. 3(1), pp. 1-13 Scaperlanda, A. and Mauer, L. (1969) “The Determinants of US Direct Investment in the EEC,” American Economic Review, vol. 59, pp. 558-568 Smith, S. (1997) “Restrictive Policy toward Multinationals: Argentina and Korea,” Case Studies in Economic Development, 2nd Edition, pp. 178-189 U.S. Department of State (2007) Investment Climate Statement – Mexico (http://www.state.gov/e/eeb/ifd/2007/80727.htm) Wheeler, D. and Mody, A. (1992) “International Investment Location Decisions: The Case of US Firms,” Journal of International Economics, vol. 33, pp. 57-76 World Bank (2006) World Development Indicators (CD-ROM) BIOGRAPHY Dr. Rahim Quazi is an Associate Professor of Economics and the Director of the Center for International Business Education at Prairie View A&M University, Texas. He earned a PhD in economics from the University of Illinois, Urbana-Champaign. He has taught at Knox College and the University of Georgia. He has published refereed journal articles on policy-oriented issues, including foreign aid, foreign direct investment, capital flight, and water resource planning. ACKNOWLEDGEMENTS This study received generous research support from the Center for International Business Education, Prairie View A&M University.
13