investment behaviour among generation y by …eprints.utar.edu.my/1687/1/investment_behaviour... ·...
TRANSCRIPT
Investment Behaviour among Gen Y
i
INVESTMENT BEHAVIOUR AMONG GENERATION Y
BY
LINDA CHEAH SZU MIN
PEH SOON GEE
WOON WEE KIAN
A research project submitted in partial fulfillment of the
requirement for the degree of
BACHELOR OF ECONOMICS (HONS) GLOBAL
ECONOMICS
UNIVERSITI TUNKU ABDUL RAHMAN
FACULTY OF ACCOUNTANCY AND MANAGEMENT
DEPARTMENT OF ECONOMICS
NOVEMBER 2014

Investment Behaviour among Gen Y
ii
Copyright @ 2014
ALL RIGHTS RESERVED. No part of this paper may be reproduced, stored in a
retrieval system, or transmitted in any form or by any means, graphic, electronic,
mechanical, photocopying, recording, scanning, or otherwise, without the prior
consent of the authors.

Investment Behaviour among Gen Y
iii
DECLARATION
We hereby declare that:
(1) This undergraduate research project is the end result of our own work and that
due acknowledgement has been given in the references to ALL sources of
information be they printed, electronic, or personal.
(2) No portion of this research project has been submitted in support of any
application for any other degree or qualification of this or any other university,
or other institutes of learning.
(3) Equal contribution has been made by each group member in completing the
research project.
(4) The word count of this research report is 15799.
Name of Student: Student ID: Signature:
1. Linda Cheah Szu Min 12UKB04938 __________________
2. Peh Soon Gee 11UKB00074 __________________
3. Woon Wee Kian 12UKB03134 __________________
Date: 28 November 2014

Investment Behaviour among Gen Y
iv
ACKNOWLEDGEMENT
We would like to take this opportunity to thank each and every person who has been
helping us along the journey in completing this research project.
First and foremost, we would like to express our deepest gratitude to our wonderful
supervisor, Mr. Sia Bik Kai for sparing his time and continuously giving us advice
and support whenever we need. Without his guidance and persistence help, we would
not be able to complete this research project.
Also, we would like to thank to our families and friends who always been there for us.
Lastly, we would like to thank our senior, Amirtha Sangeetha Ganesan, for providing
us materials to complete this research project.
Investment Behaviour among Gen Y
v
TABLE OF CONTENTS
Page
Copyright Page............................................................. Error! Bookmark not defined.
Declaration ................................................................................................................... iii
Acknowledgement ....................................................................................................... iv
Table of Contents ......................................................... Error! Bookmark not defined.
List of Tables ............................................................................................................... ix
List of Figures ............................................................................................................. xii
List of Abbreviations ................................................................................................. xiii
List of Appendices ..................................................................................................... xiv
Preface......................................................................................................................... xv
Abstract ...................................................................................................................... xvi
CHAPTER 1: INTRODUCTION ....................................................................... xvii
1.0 Introduction ......................................................................................... xvii
1.1 Research Background ......................................................................... xvii
1.2 Problem Statement ............................................................................. xviii
1.3 Research Objectives ............................................................................. xix
1.4 Research Questions .............................................................................. xix
1.5 Significant of Study .............................................................................. xx
1.6 Chapter Layout...................................................................................... xx
1.6.1 Introduction ...................................................................................... xxi
1.6.2 Literature Review ............................................................................. xxi
1.6.3 Methodology .................................................................................... xxi
1.6.4 Data Analysis ................................................................................... xxi
1.6.5 Conclusion and Recommendation ................................................... xxii
CHAPTER 2: LITERATURE REVIEW ........................................................... xxiii
2.0 Introduction ........................................................................................ xxiii
Investment Behaviour among Gen Y
vi
2.1 Generation Y ...................................................................................... xxiii
2.2 Investment Behaviour ......................................................................... xxv
2.3 Saving Behaviour ............................................................................... xxix
2.4 Consumption ..................................................................................... xxxii
2.4.1 Gen Y‟s Consumption Behaviour ................................................ xxxiii
2.4.2 Relationship between Consumption Behaviour and Investment
Behaviour ........................................................................................ xxxv
2.5 Risk Behaviour................................................................................. xxxvi
2.5.1 Gen Y‟s risk behavior .................................................................. xxxvi
2.6 Demographic Variable .................................................................... xxxvii
2.7 Review of Relevant Theoretical Models.......................................... xxxix
2.7.1 Saving-Investment Approach ....................................................... xxxix
2.8 Conclusion ............................................................................................. xl
CHAPTER 3: METHODOLOGY ........................................................................ xli
3.0 Introduction ........................................................................................... xli
3.1 Research Design.................................................................................... xli
3.2 Conceptual Framework ....................................................................... xliii
3.3 Hypotheses Statements ........................................................................ xlv
3.4 Data Collection Methods .................................................................... xlvi
3.4.1 Primary Data ................................................................................... xlvi
3.4.2 Secondary Data ............................................................................... xlvi
3.5 Sampling Design ................................................................................ xlvii
3.5.1 Target Population ........................................................................... xlvii
3.5.2 Sampling Frame and Sampling Location ....................................... xlvii
3.5.3 Sampling Technique ...................................................................... xlviii
3.5.4 Sampling Size ................................................................................ xlviii
3.6 Research Instrument.......................................................................... xlviii
3.7 Constructs Measurement (Scale and Operational Definitions) ................ l
3.7.1 Nominal scale ....................................................................................... l
3.7.2 Ordinal scale ..................................................................................... l
3.7.3 Ratio scale ........................................................................................... li
Investment Behaviour among Gen Y
vii
3.8 Data Analysis .......................................................................................... li
3.8.1 Descriptive Analysis .......................................................................... lii
3.8.1.1 Frequency Analysis ....................................................................... liii
3.8.2 Inferential Analysis ........................................................................... liii
3.8.2.1 Logistic Regression Analysis ........................................................ liv
3.9 Conclusion ............................................................................................ liv
CHAPTER 4: DATA ANALYSIS ........................................................................ lv
4.0 Introduction ............................................................................................ lv
4.1 Descriptive Analyses (Respondent Demographic Profile) .................... lv
4.1.1 Age profile of respondent ................................................................... lv
4.1.2 Gender profile of respondents .......................................................... lvii
4.1.4 Race of Respondents ....................................................................... lviii
4.1.5 Education level of Respondents ........................................................ lix
4.1.6 Saving behavior of respondents ........................................................ lix
4.1.7 Spending behavior of respondents ................................................... lxii
4.1.8 Investment Risk Profile of Malaysian Generation Y ...................... lxiv
4.2 Central Tendencies Measurement of Constructs ................................ lxvi
4.3 Inferential Analyses / Statistical Models ........................................... lxvii
4.3.1 Binary Logistic regression ............................................................. lxvii
4.3.1.1 Share as dependent variable ....................................................... lxvii
4.3.1.2 Property as dependent variable .................................................. lxxv
4.4 Discussion of Results and Hypotheses testing conclusion .............. lxxxii
4.5 Conclusion ...................................................................................... lxxxiii
CHAPTER 5: CONCLUSION AND RECOMMENDATION ....................... lxxxv
5.0 Introduction .............................................................................. lxxxv
5.1 Managerial Implications and Recommendation ............................ lxxxv
5.1.1 Share Investment ..................................................................... lxxxvi
5.1.1.1 Gender ..................................................................................... lxxxvi
5.1.1.2 Race ......................................................................................... lxxxvi
5.1.1.3 Education ................................................................................ lxxxvii
5.1.1.4 Risk Appetite .......................................................................... lxxxvii
Investment Behaviour among Gen Y
viii
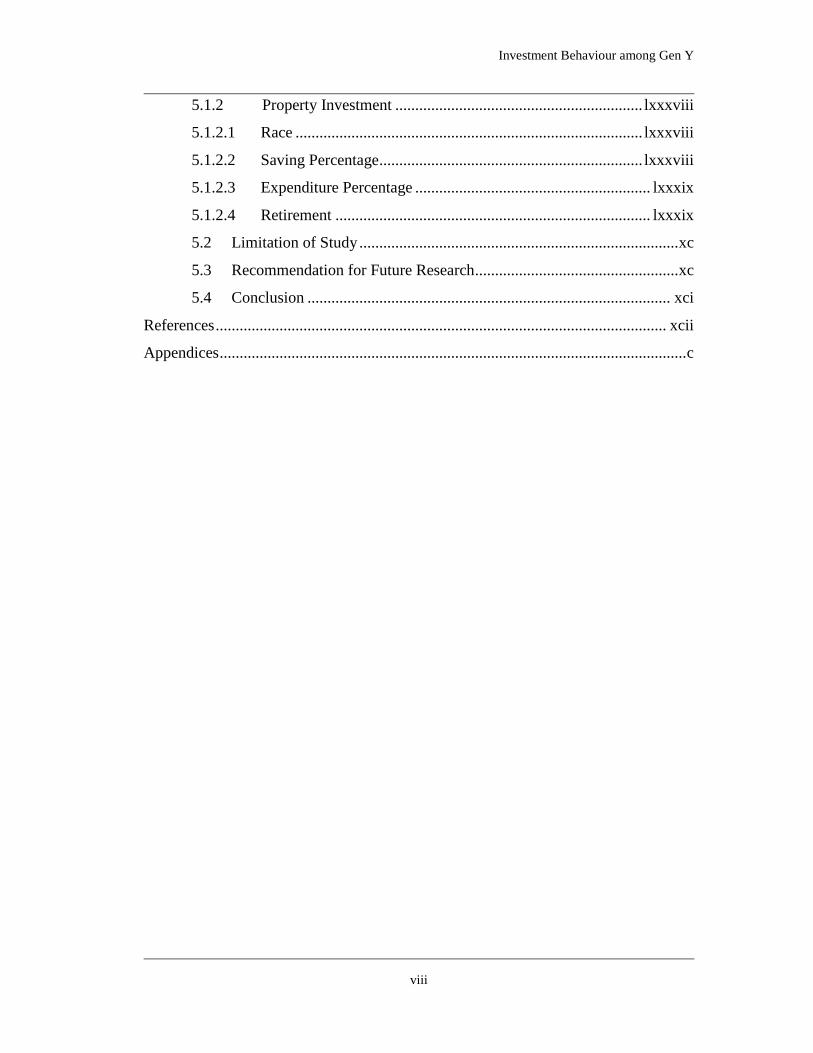
5.1.2 Property Investment .............................................................. lxxxviii
5.1.2.1 Race ....................................................................................... lxxxviii
5.1.2.2 Saving Percentage .................................................................. lxxxviii
5.1.2.3 Expenditure Percentage ........................................................... lxxxix
5.1.2.4 Retirement ............................................................................... lxxxix
5.2 Limitation of Study ................................................................................ xc
5.3 Recommendation for Future Research ................................................... xc
5.4 Conclusion ........................................................................................... xci
References ................................................................................................................. xcii
Appendices ..................................................................................................................... c
Investment Behaviour among Gen Y
ix
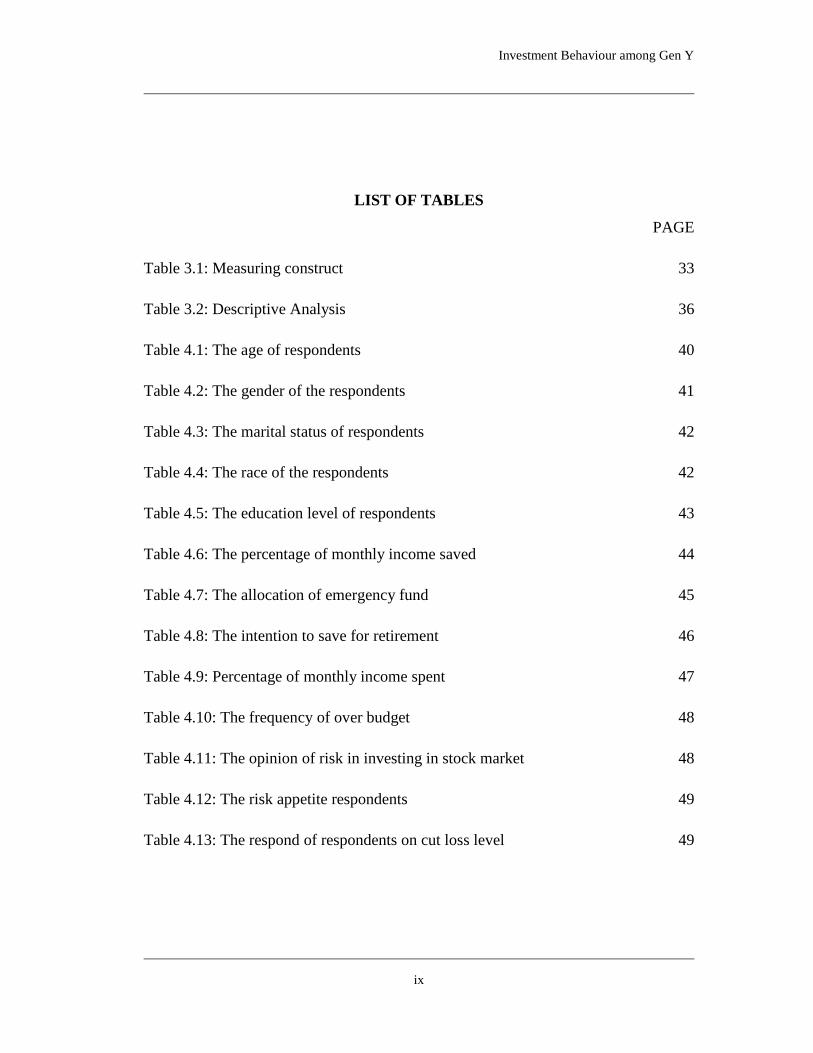
LIST OF TABLES
PAGE
Table 3.1: Measuring construct 33
Table 3.2: Descriptive Analysis 36
Table 4.1: The age of respondents 40
Table 4.2: The gender of the respondents 41
Table 4.3: The marital status of respondents 42
Table 4.4: The race of the respondents 42
Table 4.5: The education level of respondents 43
Table 4.6: The percentage of monthly income saved 44
Table 4.7: The allocation of emergency fund 45
Table 4.8: The intention to save for retirement 46
Table 4.9: Percentage of monthly income spent 47
Table 4.10: The frequency of over budget 48
Table 4.11: The opinion of risk in investing in stock market 48
Table 4.12: The risk appetite respondents 49
Table 4.13: The respond of respondents on cut loss level 49
Investment Behaviour among Gen Y
x
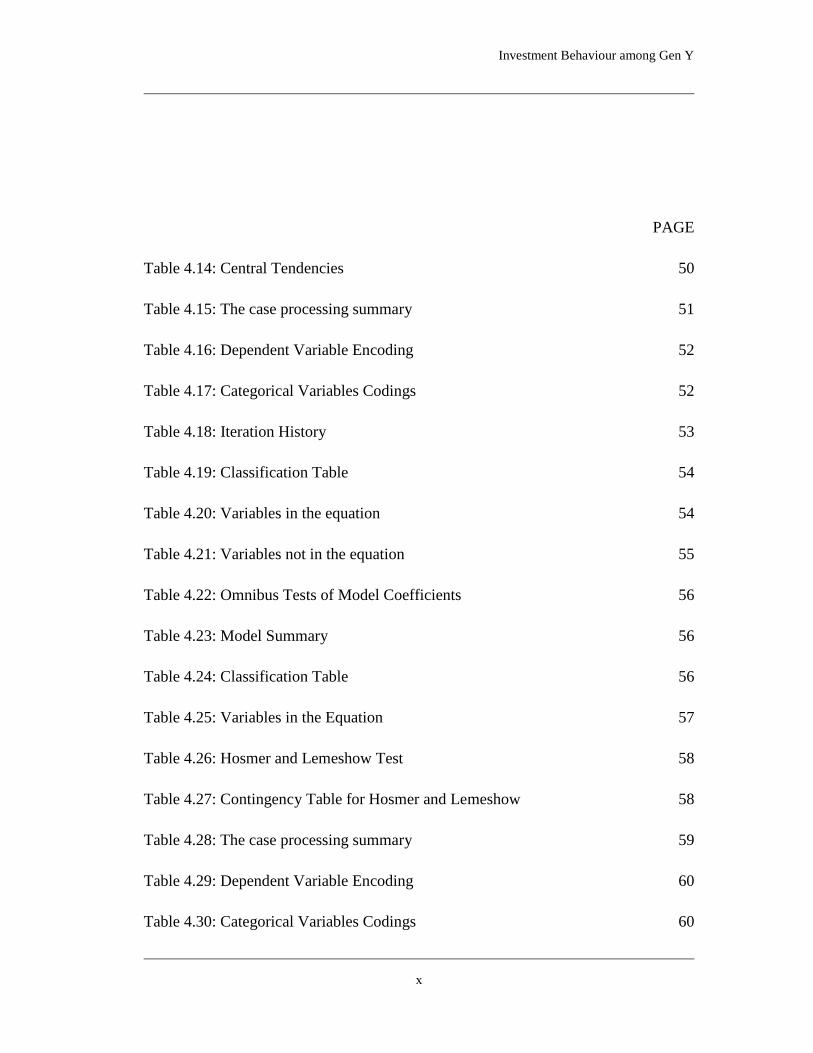
PAGE
Table 4.14: Central Tendencies 50
Table 4.15: The case processing summary 51
Table 4.16: Dependent Variable Encoding 52
Table 4.17: Categorical Variables Codings 52
Table 4.18: Iteration History 53
Table 4.19: Classification Table 54
Table 4.20: Variables in the equation 54
Table 4.21: Variables not in the equation 55
Table 4.22: Omnibus Tests of Model Coefficients 56
Table 4.23: Model Summary 56
Table 4.24: Classification Table 56
Table 4.25: Variables in the Equation 57
Table 4.26: Hosmer and Lemeshow Test 58
Table 4.27: Contingency Table for Hosmer and Lemeshow 58
Table 4.28: The case processing summary 59
Table 4.29: Dependent Variable Encoding 60
Table 4.30: Categorical Variables Codings 60
Investment Behaviour among Gen Y
xi
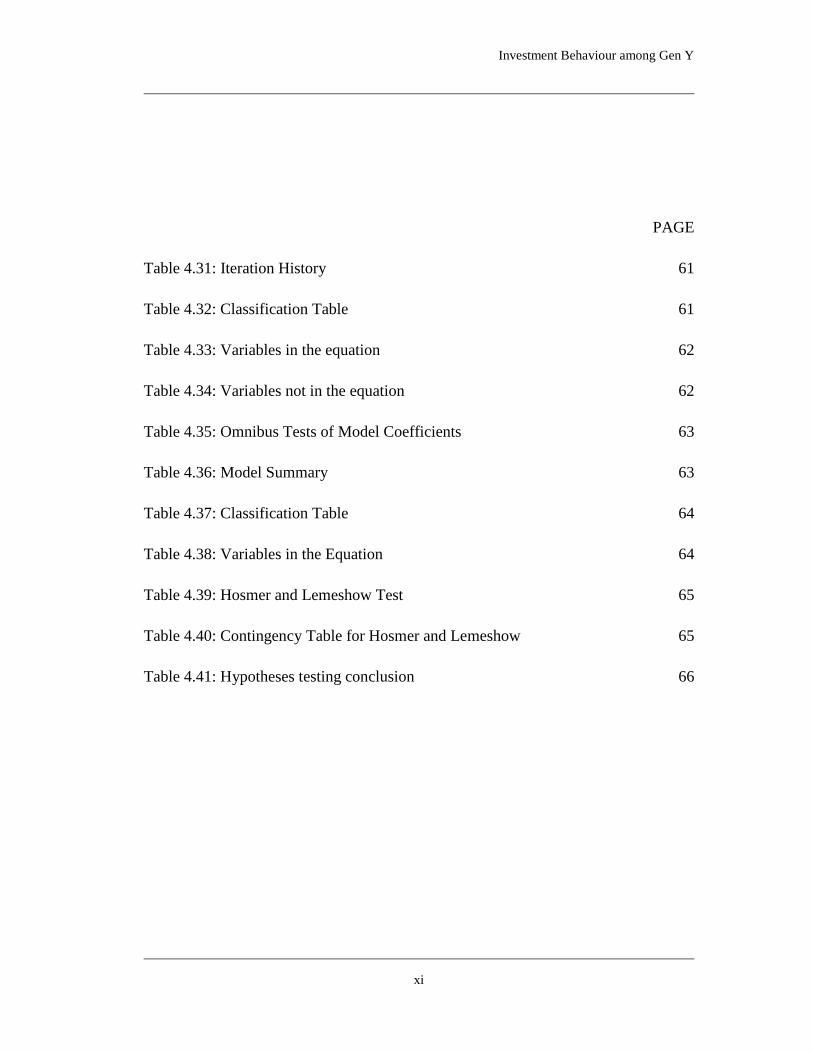
PAGE
Table 4.31: Iteration History 61
Table 4.32: Classification Table 61
Table 4.33: Variables in the equation 62
Table 4.34: Variables not in the equation 62
Table 4.35: Omnibus Tests of Model Coefficients 63
Table 4.36: Model Summary 63
Table 4.37: Classification Table 64
Table 4.38: Variables in the Equation 64
Table 4.39: Hosmer and Lemeshow Test 65
Table 4.40: Contingency Table for Hosmer and Lemeshow 65
Table 4.41: Hypotheses testing conclusion 66

Investment Behaviour among Gen Y
xii
LIST OF FIGURES
PAGE
Figure 3.1: Conceptual framework of share investment 27
Figure 3.2: Conceptual framework of property investment 28

Investment Behaviour among Gen Y
xiii
LIST OF ABBREVIATIONS
BMO Bank of Montreal
GEN Generation
HBA National House Buyers Association
HSBC Hongkong and Shanghai Banking Corporation
LIMRA Life Insurance and Market Research Association
MFS Massachusetts Financial Services
SPSS Statistical Package for Social Science

Investment Behaviour among Gen Y
xiv
LIST OF APPENDICES
Appendix A - Questionnaire

Investment Behaviour among Gen Y
xv
PREFACE
The reason we choose this study is to unveil the investment patterns of the Malaysian
Generation Y. Gen Y, who represents a large portion of the Malaysian population, is
being the engine of the economic growth. This group of people is going to cover the
major workforce of the nation. It is necessary to recognise their characteristics and
behaviours in order to capture this young blood generation to stimulate the country
economies. Investment has always been an important component in determining a
country growth. We are curious to know how the behaviour of Gen Y towards
investment is. Would they invest in the stock market or property market? If they
would, what are their characteristics in forming their investment behaviour? These are
the questions that we want to find out for answers and therefore we study on this
matter. We hope that the results found in this paper would help us clear our doubts
and are useful for academic information.
Investment Behaviour among Gen Y
xvi
ABSTRACT
This study examines the determinants of investment behaviour among the Malaysian
Generation Y, by looking into their saving behaviour, consumption behaviour and
risk behaviour as well as their demographic characteristics. In Malaysia, there are
little studies done on Generation Y‟s investment behaviour. This study will help to
shed a light in understanding their specific behaviour in saving, consumption and risk
that will affect their investment pattern. The purpose of this study is to identify
whether there is a significant relationship between investment behaviour and its
determinants which consists of saving factor, consumption factor, risk factor and
demographic factor among the Generation Y. Policymaker may take appropriate
action in engaging these millennial, which is also known as Generation Y or Gen Y,
who are currently being the engine of economic growth.
This research is using quantitative approach which the data is collected through
survey method focusing on Malaysian Generation Y who has an age between 18 and
34. A total number of 482 sets of data have been collected manually and via online
survey form in 11 capital city of peninsular Malaysia. The results show that gender,
race, education level and risk appetite have significant relationship with share
investment; while race, saving percentage, expenditure percentage and retirement are
statistically significant towards property investment. Furthermore, this study also
finds that males are more likely to invest in stock market than females.

Investment Behaviour among Gen Y
xvii
CHAPTER 1: INTRODUCTION
1.0 Introduction
This chapter provides an overview of the research project and explains the research
problem. It elaborates the research objectives to be achieved and the research
questions to be answered as well as the significance of the study.
1.1 Research Background
The focus on studying Generation Y is significant as this group of the population will
soon dominate the consumer market. The increasing population Gen Y and the
decreasing of population Gen X by getting retirement soon affect the purchasing
power of Gen Y increase and the purchasing power of Gen X decrease. The Gen Y
will take over Gen X soon. Gen Y will bring more effect to market compare with Gen
X. The policy maker and marketers will put more focus on Gen Y. Gen Y have
different characteristic compared to Gen X and policy makers as well as marketers
are required to change their strategies to accommodate this generation. Generation Y
are viewed “as a generation with very high buying power” as they have annual
incomes totaling USD211 billion and spend USD39 billion per year (Nowak, Thach
and Olsen 2006). In (Visa USA Inc., 2007) statistics it stated that by 2015 Generation
Y will account for approximately USD2.45 trillion in annual spending. Many
factories or businesses want to capture the Gen Y needs and spending habits.
Generation Y also can call Millennial.

Investment Behaviour among Gen Y
xviii
In Malaysia, the population of Gen Y is 6.2 million. This amount of population have
right to affect the consumer market. The spending habit of Gen Y will affects the
industry return or profit. Gen Y grew up with modern technology and good situation
of education. With modern technology, Gen Y easy handles the technology product
such as Iphone, Twitter, Facebook. Gen Y easy to get information from internet.
Growth up situation is different for Gen X and Gen Y after then they have different
thinking. To allocate their income or financial planning is different for Gen X and
Gen Y. Investment habit also different for this two generation, Gen Y may averse the
risk, prefer low risk investment.
1.2 Problem Statement
The lager population of Gen Y has attracted various research group attentions. The
larger population of Gen Y will cause the high purchasing power. Many factories or
businesses want to capture the Gen Y needs and spending habits. USA, Canada,
Australia and the European Union also do a lot of study on Gen Y but don‟t know the
study are same can applied to investment behavior in Malaysia. The reason is that
may be caused by other factors such as race, education level of consumer, the level of
income and the environment. Malaysia is different from other country.
In Malaysia, there is little research on Generation Y consumption, savings and
investment risks directly affect their investment decisions. The economic conditions,
the level of the education system and the environment awareness among Malaysian is
different with others country after then need to use the survey data which is focused
on the Malaysian. The research focused on the Gen Y decision making on income.
The main objective of this study is to learn more about Gen Y in Malaysia, to clarify
their consumption, savings and risk behavior to affects their decision making.
Investment Behaviour among Gen Y
xix
1.3 Research Objectives
To identify the investment behaviour of Gen Y.
To investigate the saving pattern of Gen Y.
To assess the spending behaviour of Gen Y.
To evaluate the risk behaviour of Gen Y.
To examine the relationship between investment behaviour and its
determinants including saving behaviour, consumption behaviour and risk
behaviour.
To examine the possible connection between demographic factors and
investment behaviour.
1.4 Research Questions
Which investment method does Gen Y prefer?
What is the percentage of income Gen Y save?
Does Gen Y allocate money for emergencies?
Has Gen Y started to save for retirement?
How much does Gen Y spend their income?
How often does Gen Y spend out of budget?
What is Gen Y‟s risk appetite in investing?
How much is Gen Y‟s cut loss level in investing?
Does Gen Y consider stock market as risky investment?

Investment Behaviour among Gen Y
xx
1.5 Significant of Study
This paper will be greatly beneficial to the government, the financial sector as well as
the business firms, to have a better picture on Gen Y who is rapidly taking over the
Baby Boomers. Currently Gen Y is in their 20s and 30s who is getting their footing in
the adult world. Their increasing purchasing power has continually drive consumer
demand. It is therefore necessary to reassess this bunch of people and to develop
strategies that are designated for capturing them. With a sizable population of Gen Y,
their impact to the society should not be underestimated. Hence, the findings of this
study shall provide a better insight of Gen Y for policymakers to develop appropriate
products and services which are in line with Gen Y‟s consumption, saving, risk and
investment behaviours.
This study is expected to contribute to the following scopes:
1. To shed light on the consumption, saving, risk and investment patterns of
Malaysian Gen Y.
2. To help business firms to understand the behaviour of Malaysian Gen Y in
order to develop suitable products and services.
3. To help policymakers to design appropriate policy based on Malaysian Gen
Y‟s consumption, saving and investment behaviours.
1.6 Chapter Layout
The entire research project has been arranged into five chapters.

Investment Behaviour among Gen Y
xxi
1.6.1 Introduction
This chapter gives an overview of the research project. It includes background
of study, problem statement, research objectives, research questions and
significance of this research study.
1.6.2 Literature Review
This chapter provides a critical review on previous studies and relevant theory
that are regarding to this research topic.
1.6.3 Methodology
This chapter explains on the methodology that has been used for this study. It
comprises research design, theoretical framework, hypotheses statements, data
collection method, sampling design, research instrument, construct
measurement and data analysis.
1.6.4 Data Analysis
This chapter presents the findings of this study. Statistical Package of Social
Science is used to process the data. Descriptive analysis and logistic
regression have been applied in this study.

Investment Behaviour among Gen Y
xxii
1.6.5 Conclusion and Recommendation
This chapter discusses on the research results. Implication of study and
recommendations for future research will be given in this chapter.

Investment Behaviour among Gen Y
xxiii
CHAPTER 2: LITERATURE REVIEW
2.0 Introduction
Overall this chapter provides a better understanding on the characteristics of Gen Y
along with the dependent variable, which is investment behaviour; and independent
variables, which includes saving, consumption and risk behaviour. The theory found
is supported with the review of the relevant research done.
2.1 Generation Y
Generation Y came after Generation X. This generation including the child who was
born between 1980 and 2000. These people are sometimes called Generation Y,
Millennials, simply Millennials or Echo Boomers (Hyler, J. N. 2013). The current
population is 71 million. Because of the largest population of baby boomers will
increase the number born Generation Y. Generation Y has been shaped by the
technological revolution that occurred throughout their youth. Generation Y grew up
in technology so connectivity and technological knowledge in their DNA. Generation
Y easy to handles the latest technology and tools, such as iPhone, laptop and tablet
computers. Y generation is online one day a week access, 24 hours a year, 7 days, 365
days. Many Millennials grew up to see their baby-boomer parents are working day
and night to do intense enterprises. This has formed concept to Gen Y, need for work
to balance the life.
Investment Behaviour among Gen Y
xxiv
2.1.1 Characteristics of Generation Y
Generation Y is less brand loyalty (Hyler, J. N. 2013). Generation Y is
flexible, changing its fashion, style-conscious. Gen Y has financial supported
by parents. Generation Y has a credit card signed parents. Millennium
generation has been the most difficult management (cited in the psychological
characteristics of Generation Y, rights and career expectations, 2012) in the
world.
Gen Y grew up in multicultural school is proficient in technology, passion,
self-centered, self-confidence and very in network. Gen Y also have oriented
by their parents with successful experience. Millennials have received the best
education of a generation in history. The parents of Gen Y have closer
relationship, Gen Y‟s parents important their education level and always
arrange the daily schedules for Gen Y. Gen X to introduce Gen Y to good
structure on study to leading Gen Y have confidence to facing future
challenges. Millennium had told their parents that they can do anything. Gen
X encourages Gen Y do everything to leading Gen Y increase the confidences.
Generation Y is part of their lives is the first to grow up with computers and
internet. In the online world continues to experience to deal with them in case
of problem-solving style had a profound impact. This generation of workers is
about the network and more global awareness traditionalists and Baby
Boomers cannot imagine the skilled workforce (Martin, C. A. 2005).
Millennium wanted to know what they are doing is valuable company or the
environment and valuable to them and their careers. They have their company
and their strong desire for a favorable opportunity. They drive less money but
also by achievement. Millennium wanted to express their creativity and use
Investment Behaviour among Gen Y
xxv
their own methods to complete their task. They will familiar using network to
get information. They are learning-oriented and if they do something wrong,
they want to know now so they can move forward.
Millennium usually will ask question senior or parents for settle their working
problem. Millennium parents and teachers gave a lot of praise and the second,
third and fourth chance connected. They want to show their right track and did
a great job. Millennium clearly know what they want but let them decide how
to get there (Campbell, Mr. Bonacci, Shelton, Exline, and Bushman, 2010) for
details. Make work and important to them and companies associated with
them. Millennials are accustomed to new ideas and situations learning a
constant opportunity. Millennials will be loyal to the company but does not
provide blind loyalty. As long as their personal interests and career needs are
met, the company is socially responsible, will be loyal to the Millennium. But
they do not care about quit. Now, they will quit later found work, if you do
not work, they can always have the support of their parents.
2.2 Investment Behaviour
Investment has becoming an alternative for people to seek for financial security. By
its definition, investment is the purchase of asset in expecting to create more money
or to appreciate in the later future. In economic view, investment is the acquisition of
goods which are not consumed now but later in the future to generate wealth. While
in the finance perspective, investment is a monetary asset purchased that expects the
asset will generate income in the future or appreciate and sell for higher price to gain
profit (Investopedia, n.d.).

Investment Behaviour among Gen Y
xxvi
2.2.1 Gen Y’s Investment Behaviour
Based on the study conducted by Fidelity Investment in United State, a high
percentage of Gen Y considers themselves more knowledgeable in finance
than the older generations. The study was conducted to examine the attitudes
and behaviours of investors after the 2008 financial crisis happened five years
ago. The study shows that Gen Y has probably experienced a positive
transform after the crisis (Fidelity.com, 2013).
The study reveals that:
(1) 81 percent of Gen Y believes that they are more knowledgeable in
their finances, compared to 66 percent of older generations.
(2) 55 percent of Gen Y feels more confident in investing than 47 percent
of older generations.
(3) 64 percent of Gen Y versus 54 percent of their elders saves more
systematically.
(4) 52 percent of Gen Y versus 41 percent of older respondents feels more
confident in general.
(5) 50 percent of Gen Y versus 30 percent of Gen X says the economy has
become better than five years ago.
(6) 76 percent of Gen Y versus 56 percent of Boomers thinks their
investments have performed better after crisis.
Overall, Gen Y is prominent as the most optimistic age group when
comparing against older generations. Despite of suffering investment losses,
Gen Y still remains astonishingly confident. This may because of Gen Y
perceives a safety net due to the wealth of their Boomer parents (Sullivan,
2013). Gen Y has taken a more prudent approach to their finances,
Investment Behaviour among Gen Y
xxvii
acknowledging the need to manage their spending and investing pattern, and
changing the way of doing things. They prefer more to conduct online
research (34 percent) as well as use online tools and calculator (23 percent) in
their finances (Fidelity.com, 2013).
2.2.2 Gen Y in Stock Investment
Many young people in United State have no confidence on the stock market
with their savings ever since the financial market collapsed back in 2008.
Based on a survey done by MFS Investment Management, 52 percent of Gen
Y investors below aged 31 say that it is uncomfortable for them to invest in
stock market. This large number may indicate that a great amount of Gen Y
investors will opt to avoid investing in stocks. It is not surprised with the
result since many young investors consider stock market as a risky place.
They rather hold their money in cash instead of placing in the market (Taylor,
2012).
The MFS survey further presents that only 18 percent of Americans, which is
about half of the number of previous year, consider equities as a great place to
invest. While the majority prefer safer bank products like certificate of
deposits (CDs), saving accounts and money market. It shows that the younger
generation of investors become very conservative and more favour to bank
products (Taylor, 2012). Gen Y investors show no intention to make long-
term investment in stock market and are less likely to go for aggressive
investment with their retirement accounts (Palmer, 2014).
Similarly in Malaysia, Gen Y comprises only 12% in the stock exchange
market, which is considered less, according to Bursa Malaysia (as cited in
Weiler, 2014). Just when Gen Y was trying to invest, they witnessed the
dotCom crash as well as the financial crisis. Gen Y does not consider the need

Investment Behaviour among Gen Y
xxviii
to invest as they get most of the needs and wants from their parents; and is
unlikely to invest in stock market due to lack of knowledge in underlying area,
said the licensed financial adviser and syariah financial advisory for
Excellentte Consultancy Jeremy Tan (as cited in Mahalingam, 2014).
2.2.3 Gen Y in Property Investment
According to the 2014 National Association of Realtors® Home Buyer and
Seller Generational Trends study, Gen Y comprises the largest slice of home
buyers at 31 percent compared to other generations and it has the biggest
share of first-time buyers at 76 percent. Unlike the older generations, Gen Y
buyers stay positive and consider property as a good investment. Currently
Gen Y is in their 20s and early 30s, who wants to buy their first home, is
demonstrating a great potential for strong property demand. Their desire of
owning a home or looking for long-term investment still remains firm.
However, they are facing challenges like tight credit, shortage of inventory,
eroding affordability and high debt burden that have hindered them from
owning a home (National Association of Realtors®, 2014).
It is natural to realize that parents want to help their children in the area of
education and home purchases. Transferred of wealth from one generation to
the next is getting common nowadays (Johnston, 2013). To purchase a home,
buyers have often relied on their savings. However, a variety of outside
resources is now available to finance home purchases. Amongst them all,
receiving a gift from parents and relatives are the most common one. About
26 percent of Gen Y received a gift from their parents and relatives for use as
a down payment to finance their home purchase (National Association of
Realtors®, 2014). It can be seen that aids received from parents have greatly
influence in Gen Y‟s home purchase decision.

Investment Behaviour among Gen Y
xxix
A survey done by US-based urban development researcher Demographia (as
cited in Ng, 2014) classifies Malaysia‟s residential housing market as
“severely unaffordable”, which is even more unattainable than residents in
countries like Singapore, Japan and the United States. This could trigger the
risks for “homeless generation” which consist mainly the younger Malaysians
from lower and middle income group who are incapable to own a home, said
by National House Buyers Association (HBA) honorary secretary general
Chang Kim Loong (as cited in Ng, 2014). Whether Gen Y in Malaysia will
invest in property market still remains questionable.
Hence, this research paper is designated to find out which investment methods,
either stock or property investment, is preferable for Malaysian Gen Y as well
as how it relates to their risk preferences, consumption and saving patterns.
2.3 Saving Behaviour
According to Keynes (1937), savings can be defined as the leftover amount after
deducted the expenses from the disposable income. Hence, saving = income -
consumption. Saving behaviour referred to the methods of using and allocating saving
by the consumer.
The whole idea of the „thrift of paradox‟ or „thrift of saving‟ which are raised by
economist John Maynard Keynes where saving is bad for the economy (Keynes,
1937), is commonly known by the mostly economists in the world. Keynes‟s General
Theory became even famous after World War II and a subfield of macroeconomics,
Keynesian economics is arisen in order to study the theory and the way to apply.
Keynes (1937) believed that increase in saving during the recession will make the
situation of the economy worsen, because more saving means less consumption
which caused the demand for goods to be reduce. As the demand reduced, the

Investment Behaviour among Gen Y
xxx
economic growth will stop and caused economic problems such as unemployment,
fail in business, bankruptcy and so on (Keynes, 1937). However, economists argue
that the idea is failed because when the demand for goods reduced, the price will fall
and the people are willing to spend more and the business will continues to run.
Moreover, the saving money is not just stored in the bank. The money is lent for the
business and it became the funds for the business to grow. The business will have
more funds when more people save.
2.3.1 Gen Y’s Saving Behaviour
The journal “Saving Behaviour in Ten Developing Countries”, found that high
growth rates, a low dependency ratio, and high income levels are proportional
to the saving rates (Collins, 1989). Saving rates in Asian commonly was
higher and the countries with the high growth rate at 1960-1984 were having
highest saving rates. The study also investigated the difference in saving
behaviour between the low-income countries and middle-income countries.
The low-income countries had a lower sensitivity of household savings to the
age distribution and changes in income. Other than that, the study found that
living standards and age distribution affected the saving behaviour.
Thejournal “Should Households Establish Emergency Funds?” found
emergency savings are only most favourable when the rates of return on
alternative investments or frequent rates of emergencies are quite low
(Hatcher,2000).
From the report of Bank of Montreal (BMO), “Wealth Generation: The
Financial Challenges for Generations X & Y”, both Generation X and Y have
confirmed the importance of saving for the emergency purpose. According to
the report, 93% of both Generation X and Y think that emergency fund is
important in order to overcome the emergency problems. However, although

Investment Behaviour among Gen Y
xxxi
there are 93% of respondents having knowledge on the importance of
emergency fund, but only 44% of Generation Y respondents had practice on
this which they have a secure saving that equal to at least 3 months of
expenditures.
When shall we start to save for our retirement? And how much shall we save
for our retirement age? For the first question, it is obviously that it is better
that you start to save earlier since you won‟t know what will happen in the
future. Moreover, you surely hope that you won‟t face with the problem that
you have insufficient money to spend after 10 years you have retired. You
would not have ability to go for hard work at that time. Other than that, you
have to consider your health care at the time. From the article, “How much do
you need to retire?”, it was found that it is simple question to ask how much to
save for retirement but it is hard to answer since the life is full with
uncertainties. These uncertainties caused that the money you saved might not
enough to face with those problems. However, this article commented that a
person should have saving at least 8 times of his or her ending annual income
(Fidelity Viewpoint, 2014).
If a person has to enjoy his retirement life of 25 years without facing the
problem of insufficient money to overcome the uncertainty happened in his
life, then he should save an amount that more than 8 times of his ending
annual income. For example, if a person starts to work at 23 years old with an
annual income of RM 30,000, and he retired at 60 years old with an annual
income of RM 48,000, then he should save at least RM 384,000. However, if
the person have a saving of RM 384,000, his actual amount of saving will be
great than RM 384,000 due to the saving plan he has invested. It was clearly
that it is almost impossible to save RM 384,000 if the person starts to save at
50 years old. Hence, it is important to save the money when you are young if
you want to have a comfortable retirement life.

Investment Behaviour among Gen Y
xxxii
According to the research done by LIMRA, “Sowing the Seeds for Retirement:
Gen X and Gen Y Markets”, it was found that the concept of Generation Y in
purpose of saving is differed from others. The retirement sector is suggested
to provide more aids in suggestion for Generation X and Y in order to propose
a method of saving that is suitable for them because they are facing with the
change of retirement landscape (Cecilia M. Shiner, 2013).
According to “Sowing the Seeds for Retirement: Gen X and Gen Y Markets”,
the most important factor that Generation Y save their money is not for the
retirement life, 41% of them think that they save money mostly for the
purpose of travel or vacation, and then just come to saving for retirement
which is 31%. The other purpose they save their money are: buying a house
(25%), starting a family (25%), and household consumption (24%). Other
than that, almost half of the Generation Y respondents (45%) are not confident
that their current savings will enough to support their retirement age.
2.4 Consumption Behaviour
Conspicuous consumption has been used for more than a century to describe the
acquirement of luxury goods and services to publicly demonstrate economic power
(Mair, n.d.). It was first introduced by Thorstein Veblen in the 19th
century, in his
book “The Theory of the Leisure Class: An Economic Study in the Evolution of
Institution”published in 1899. According to Veblen (2005), the basis of good
reputation is ultimately depends on pecuniary strength; where the means of showing
pecuniary strength as well as of obtaining or retaining a good name, are leisure and a
conspicuous consumption of goods. Veblen‟s study suggests that pecuniary strength
grants individuals honour, prestige and esteem rather than just invidious distinction
(Veblen, 2005). He argued that spending wastefully was the symptomatic of the
excessive lifestyle of the wealthy (Veblen, 2005). To Veblen, conspicuous

Investment Behaviour among Gen Y
xxxiii
consumption was said to be wasteful, or spending for useless thing, just to show off
one‟s reputation (Veblen, 2005).
Later in the 1920s, economist Paul Nystrom came out with the idea of “philosophy of
futility” that would increase fashionable consumption. The idea behind (as cited in De
Vogli, 2013) is simply saying that individuals have no better things to do than
focusing on superficial consumerism and fashionable status signal. It indicates a trend
that people are vying to get the latest product before anyone else, as they start to
spend money on unnecessary things rather than using it for actual utility. In that
context, Nystrom conferred the idea of conspicuous consumption (as cited in Mair,
n.d.) as behavioural addiction or narcissistic behaviour, or both, to use as a way to
fulfill consumers‟ desire for immediate gratification of hedonic expectations.
While previously, conspicuous consumption was mainly for the rich, however the
latest study done by Kerwin Kofi Charles, Erik Hurst, and Nikolai Roussanov (2007)
has showed a different perspective, that conspicuous consumption is general among
the poorer social classes and emerging economies. Charles et al. (2007) suggested
that individuals in lower economic status or emerging economies serve conspicuous
consumption as a means to fight the negative impression of being poor. They argued
that visible consumption is negatively related to the mean income of the individual‟s
reference group (Charles et al., 2007). In simple term, the more affluent a society or
peer group is, the less important visible consumption becomes (Charles et al., 2007).
2.4.1 Gen Y’s Consumption Behaviour
Study of O‟cass and McEwen (as cited in Kim and Jang, 2014) suggests that
status and prestige considerations are currently playing an important role in
forming consumer behaviours. Especially for Gen Y who born between 1977
and 1994 (Paul, 2001) has been acculturated into a materialistic society
(Bakewell and Mitchell, 2003). According to Ger and Belk (as cited in
Investment Behaviour among Gen Y
xxxiv
Bakewell and Mitchell, 2003), the promulgation of the “America Dream” with
the support of technologies has indoctrinated the concept that material goods
and wealth are good and desirable. Roberts and Manolis found that (as cited in
Bakewell and Mitchell, 2003) younger generations are induced to “trade up”
as they tend to relate higher prices per se with better quality and value. In
addition to the availability of credit cards and student loans, Gen Y has been
socialized into a world where debt is used to finance spending (Kara et al.,
1994; Ritzer, 1995). Schor‟s study (as cited in Roberts and Jones, 2001)
suggests that access to easy credit plays a major part in causing overspending.
As compared with the previous generation, Gen Y has been socialized into an
environment that supplies more opportunities and reasons to shop (Bakewell
and Mitchell, 2003).
In fact, one of the important factors that shape consumer behaviour is others‟
influence (Bearden et al., 1989). Bearden, Netemeyer and Teel (1989) defined
consumer susceptibility to interpersonal influence as “the need to identify with
or enhance one‟s image in the opinion of significant others through the
acquisition and the use of products and brands, the willingness to conform to
the expectations of others regarding purchase decisions.” Study of Argo and
Main (as cited in McFerran et al., 2010) further discusses that consumers are
sensitive of others‟ behaviour in a retail context. Kim and Jang (2014) noted
that Gen Y may have a strong desire to express a certain impression or social
norms as they are susceptible to their reference group. It is parallel with the
study of Twenge (2010) as extrinsic values like materialism and status appear
gradually across generation. It is found that Gen Y will continue to pursue
extrinsic goals with consumerism and define themselves via their purchases or
experiences (Kim and Jang, 2014).
Furthermore, Gen Y is more likely to experience overspending due to have
extra money from their parents. Unlike previous generations, Gen Y grew up
with fewer siblings and more-affluent parents in which their parents are
Investment Behaviour among Gen Y
xxxv
typically both working (Kotler et al., 2012). Hence, they have more disposable
income as their parents gave them more pocket money than they had enjoyed
themselves (Kotler et al., 2012). This has related to O‟Curry‟s study (as cited
in O‟Curry and Strahilevitz, 2001) which suggests that easy money is easier to
spend on hedonic goods compared to regular income. The reason is that it
feels less guilt in acquiring hedonic goods by using easy money than hard
earned money (O‟Curry and Strahilevitz, 2001). As a result, easy money
obtained from parents appears to promote more hedonic choices, which will
consequently lead to overspending due to excessive pursue of pleasure.
2.4.2 Relationship between Consumption Behaviour and
Investment Behaviour
In fact, study of the relationship between consumption behaviour and
investment behaviour is limited, there is no specific study found on this topic.
However, it can be related indirectly from others‟ researchers‟ studies.
Keynes‟s study suggests that (as cited in Garegnani, 1978) consumption
should be discouraged if it is to increase investment volume. High
consumption with respect to income contributes low investment and slow
growth; while high saving creates high investment and rapid growth
(Samuelson and Nordhaus, 2010). Thus, it is believed that consumption is
kind of negatively related to investment. It is considerably reasonable to think
that by given an amount of income, increase in consumption will decrease in
saving which will then lessen the amount to invest.

Investment Behaviour among Gen Y
xxxvi
2.5 Risk Behaviour
Purpose to have investment is to earn more income. Investment has many ways and
many choices. For investment to get high return will facing the high risk. The risk or
reward tradeoff lies at the heart of portfolio construction. In essence the concept
suggests that the higher the risk inherent in an investment, the larger the potential
return. HSBC defines it as follows: "Low risks are associated with low potential
returns. High risks are associated with high potential returns. The risk return tradeoff
is an effort to achieve a balance between the desire for the lowest possible risk and
the highest possible return. Higher risk means higher standard deviation and higher
returns. Consumer behavior can be seen as an instance of the adventure (Bohn, H., &
Deacon, R. T. 2000). Perceived risk to the consumer effect the investment decision
making.
2.5.1 Gen Y’s risk behavior
Generation Y includes more than 76 million people in nearly 900 billion
spending power. In contrast, the baby boomers, are also numbered 76 million,
there are $ 2.5 trillion in spending power. They harvest the golden age of
revolution return chemistry, manufacturing, technology revolution, the
information age, abundant energy and globalization. For the MFS result, for
the statement „I will never feel comfortable investing in the stock market‟. 40%
of Gen Y agree this statement. In Gen Y investors, 54% feel overwhelmed to
choose from, 47% tend to postpone investment decisions. Due to fear of risk,
30% of Gen Y will protect their principal for the primary investment objective.
33% of the Gen Y will invest to the share. In 2010, in financial planning or

Investment Behaviour among Gen Y
xxxvii
control cash by themselves aged 25-35 is more than 80%. Protect the principal
to investment are important but too much risk aversion is not suitable for long
term investment.
The risk averseness and high volatility of risk leading Gen Y to use the
recommendation from financial advisers and other experts. Survey research
by the Investment Company Institute does show a lower stated risk tolerance
in Gen Y compared with what analysts observed in Gen X at the same age.
Gen Y will more aver risk compare to Gen X. To attract some young investors,
advisers will need a Gen Y investors may have with the stock and ready to
make long-term investments, a source of anxiety for the case-sensitive. Many
young employees are invested in target maturity fund. It tends to have a high
concentration of stocks far retired workers and gradually turned to the
investment structure become more conservative over time.
Gen Y interesting to investment but lack of confidences to invest. They full
with financial information and taking control of their financial management.
Gen Y will to regular deposited money into their investment account but for
choose the investment product will depends the advisor suggestion. Gen Y
lack of patient, usually will choose the short term product and low risk
product.
2.6 Demographic Variable
Age is found to have significant effect towards investment behaviour according to
previous studies. Kreinin (1959) found that there is a positive relationship between
age and stock ownership. Zhong and Xiao (1995) also found that age has a positive
effect on stock holdings. They further explained that holding stock investment is a
complement for retirement funds. Hossain and Nasrin (2012) had also found that age
has significant effect on equity selection decision.

Investment Behaviour among Gen Y
xxxviii
An increasing number of researches implied that gender differences affect investment
decision. Studies show that women are more conservative in making investment
decision (Bajtelsmit and Bernasek, 1996; Sunden and Surette, 1998) and are more
risk averse than men (Cronson and Gneezy, 2009). These are supported by the study
of Embrey and Fox (1997) which found that women are more likely to invest in less
risky assets than men. One study concluded that women are less knowledgeable in
personal finance than men (Chen and Volpe, 2002). However, there are also previous
studies found that gender has no significant effect on investment behaviour. Zhong
and Xiao (1995) found that gender affects only bond holdings but no effects on stock
holdings.
Sunden and Surette (1998) concluded that gender marital status has significantly
affect individuals‟ attitude in selecting the allocation of assets in defined-contribution
plans. Women who are older and had experience on marital dissolution, are more
likely to invest in housing market (Embrey and Fox, 1997). Study revealed that
marital status has a major impact on investment decision (Jain and Mandot, 2012).
Roussanov and Savor (2012) found that single CEOs who like to demonstrate status
concerns, are worked with firms that show higher stock return volatility and practise
more aggressive investment policies.
Study analysis provides evidence that race has play a role in investment preferences
(Farrell, 2011). Zhong and Xiao (1995) revealed that whites has higher investments
than nonwhites in both stock and bond holdings. The study result is found consistent
with Kreinin‟s (1959) study, where Kreinin pointed out that the degree of exposure to
banks and other financial institutions may contribute to the differences in investments
between whites and nonwhites (as cited in Zhong and Xiao, 1995).
Many studies indicate that education level has significant effect on investment
behaviour. Embrey and Fox (1997) found that women with a lower education level
are less likely to invest in housing market. Kreinin (1959) concluded that education is
powerful in determining whether a person would own stocks. This is consistent with
Investment Behaviour among Gen Y
xxxix
the study done by Hossain and Nasrin (2012) who found that education level is
significantly affecting stock investment decision.
2.7 Review of Relevant Theoretical Models
2.7.1 Saving-Investment Approach
Saving equals to investment, this idea was first appeared in the classical
theory. According to the classical theory (as cited in Cui, 2000), high saving
rates will offer a way for investment at low interest rates. Since more people
choose to save, more loanable fund is able to loan at low interest rate which
encouraging investment. Conversely, low saving rates provide less fund which
resulting in high interest rate and discouraging investment. Due to the interest-
rate variation, saving and investment entered into equilibrium in the long run
and the equilibrium is named as “natural rate of interest”. This saving-drive-
investment theory gives an idea that investment is affected by saving which is
corresponding with the model suggested in this paper.
In fact, the saving-investment approach was later revised by John Maynard
Keynes with a more refine theoretical framework. In Keynesian conception
(as cited in Cui, 2000), income is equal to the value of output, where the value
of output is the sum of consumption and investment; on the other hand, saving
is the surplus of income after consumption, this gives a result that saving is
equal to investment. However, instead of agreeing with the classic saving-
drive-investment theory, Keynes suggests that investment is based on future
profit expectation. Investment spending via the multiplier effect raises
aggregate income, accordingly increases saving. Investment is seen as self-
liquidating fund, which is not determined by the prior saving level. Moreover,
Investment Behaviour among Gen Y
xl
banks allow a temporary decline in liquidity enables initial investment
financed without prior saving.
Still, critics from Robertson (1936) and Ohlin (1937) (as cited in Cui, 2000)
contended that banks would charge a high interest rate as compensation to
offset the reduction of their liquidity. As a result, high interest rates cause high
cost of capital which will then discourage investment. The casual relationship
of investment determines saving exchanges back to the origin. The propose
model of this paper, saving as independent variable affects investment is still
valid. Issahaku (2011) found that saving is one of the factors that drive
household investment in Nadowli.
2.8 Conclusion
Overall this chapter provides a better understanding on the characteristics of Gen Y
along with the dependent variable, which is investment behaviour; and independent
variables, which includes saving, consumption and risk behaviour.
Investment Behaviour among Gen Y
xli
CHAPTER 3: METHODOLOGY
3.0 Introduction
The main objective of this study is to investigate the relationship in between the
investment behavior with the saving, consumption and risk. This chapter will discuss
about the method that used to examine the main objectives of this study. The research
design, theoretical framework, hypotheses statements, data collection methods,
sampling design, construct measurement and data analyzing are included in this
chapter.
3.1 Research Design
The research done is considered as a causal research. This type of research can be
conducted to determine the cause and effect relationship among the variables.
Moreover, causal research is also used to compute the degree of the effect of a change
in an independent variable towards a change in a dependent variable (DJS Research
Ltd., 2005). Causal research is used as the research designfor this research since it is
able canidentify the cause and effect relationship between the independent variables
(saving behavior, spending behavior, risk behavior and demographic profile) and the
dependent variable (investment behavior).
The research in this paper can be considered as quantitative research. Quantitative
research is used to determine the relationship between the independent variable and
the dependent variable (Hopkins, 2000). This type of research uses numerical data to

Investment Behaviour among Gen Y
xlii
establish a mathematical model, theories or hypothesis that can be used to describe a
situation or condition (Sibanda, 2009). Therefore, this research is conducted under
quantitative research since the data is tabulated in numerical form.
Investment Behaviour among Gen Y
xliii
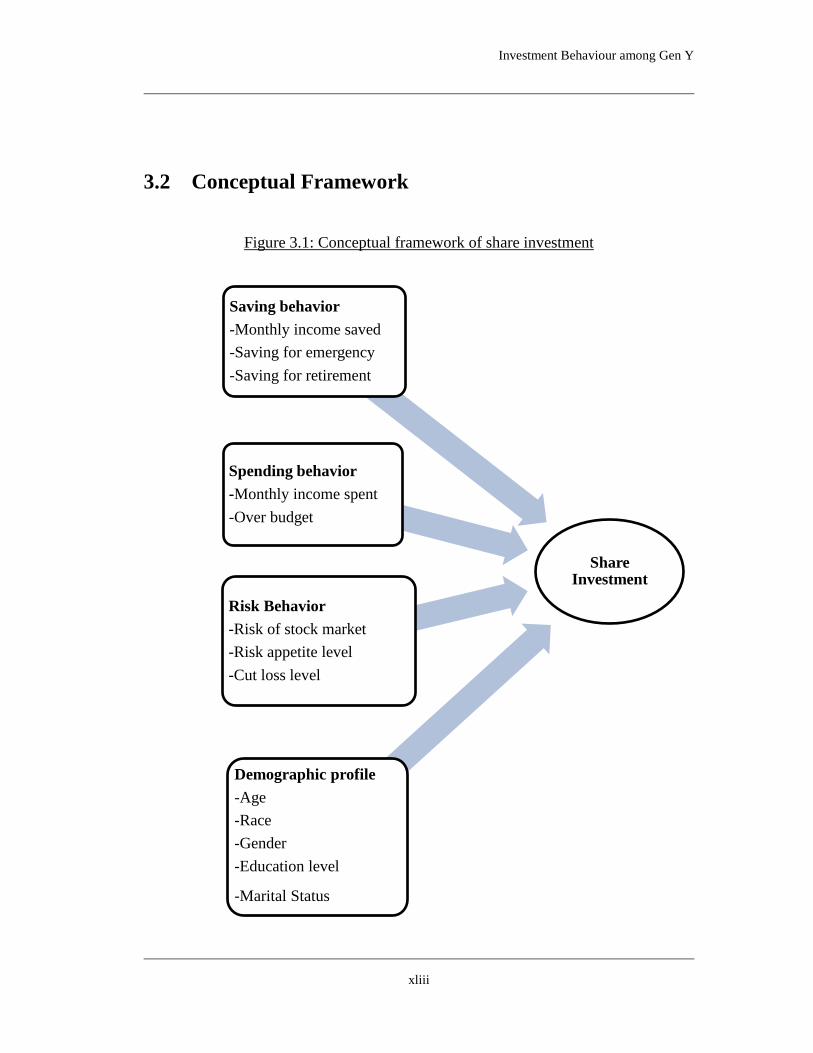
3.2 Conceptual Framework
Figure 3.1: Conceptual framework of share investment
Share Investment
Risk Behavior
-Risk of stock market
-Risk appetite level
-Cut loss level
Saving behavior
-Monthly income saved
-Saving for emergency
-Saving for retirement
Spending behavior
-Monthly income spent
-Over budget
Demographic profile
-Age
-Race
-Gender
-Education level
-Marital Status

Investment Behaviour among Gen Y
xliv
Figure 3.2: Conceptual framework of property investment
Prpperty Investment
Risk Behavior
-Risk of stock market
-Risk appetite level
-Cut loss level
Saving behavior
-Monthly income saved
-Saving for emergency
-Saving for retirement
Spending behavior
-Monthly income spent
-Over budget
Demographic profile
-Age
-Race
-Gender
-Education level
-Marital Status

Investment Behaviour among Gen Y
xlv
3.3 Hypotheses Statements
H1: There is a significant relationship between monthly income saved and share.
H2: There is a significant relationship between saving for emergency and share.
H3: There is a significant relationship between saving for retirement and share.
H4: There is a significant relationship between monthly income spent and share.
H5: There is a significant relationship between over budget and share.
H6: There is a significant relationship between risky level of stock market and share.
H7: There is a significant relationship between risk appetite level and share.
H8: There is a significant relationship between cut loss level and share.
H9: There is a significant relationship between age and share.
H10: There is a significant relationship between gender and share.
H11: There is a significant relationship between marital status and share.
H11: There is a significant relationship between race and share.
H13: There is a significant relationship between education level and share.
H14: There is a significant relationship between monthly income saved and property.
H15: There is a significant relationship between saving for emergency and property.
H16: There is a significant relationship between saving for retirement and property.
H17: There is a significant relationship between monthly income spent and property.
H18: There is a significant relationship between over budget and property.
H19: There is a significant relationship between risky level of stock market and
property.
H20: There is a significant relationship between risk appetite level and property.
H21: There is a significant relationship between cut loss level and property.
H22: There is a significant relationship between age and property.
H23: There is a significant relationship between gender and property.
H24: There is a significant relationship between marital status and property.

Investment Behaviour among Gen Y
xlvi
H25: There is a significant relationship between race and property.
H26: There is a significant relationship between education level and property.
3.4 Data Collection Methods
3.4.1 Primary Data
The source of the primary data was come from the existing questionnaire
which is done by Ganesan (2012). This study aimed the working Generation
Y of Malaysia which normally refers to the people born in 1980s until early
1990s which are result of baby boom. Hence, the targeted population will be
in the range of 18 to 34 years old in Malaysia. However, those who are still
study in high schools, colleges or universities are excluded from this research.
Both convenience sampling and simple random sampling were used in this
research. Convenience sampling choose the people who are easy to reach
while simple random sampling make sure that each people in the range of
easy-to-reach have the same opportunity of being chosen.
The questionnaire was distributed through the hardcopy form to the targeted
group in certain area which is easy to reach. At the same time, the
questionnaire was also being distributed as the online survey through the
online social media and e-mail.
3.4.2 Secondary Data
The information for the literature reviews were collected from the secondary
data which are collected by the authors of the papers. The sources of the

Investment Behaviour among Gen Y
xlvii
information are included the data from the articles, books, journals, magazines
and newspapers. The data collected was used to investigate the reviews of
opinions of others authors in the aspect of investment behavior, saving,
consumption and risk.
3.5 Sampling Design
3.5.1 Target Population
This study aimed the working Generation Y of Malaysia which normally
refers to the people born in 1980s until early 1990s which are result of baby
boom. Hence, the targeted population will be the people that are in the range
of 18 to 34 years old and living in Malaysia.
3.5.2 Sampling Frame and Sampling Location
Questionnaires were designed in this research as an instrument for collecting
data. The questionnaires were distributed to the Generation Y in Kuala
Lumpur, Selangor, Perak, Johor, Kelantan, Terengganu, Pulau Pinang, Pahang,
Melaka, Kedah and Negeri Sembilan by using convenience sampling method.
Convenience sampling method was used since there was no complete name
list of Generation Y in Malaysia. Hence, there is no sampling frame that a
sample can be drawn randomly to make sure that each Generation Y have a
same probability for being chosen.
Investment Behaviour among Gen Y
xlviii
3.5.3 Sampling Technique
Both convenience sampling was used in this research. As mentioned above,
convenience sampling method was used because lacking of the complete
name list of Generation Y in Malaysia. Convenience sampling method is the
sampling method that chooses the people who are easy to reach in the area of
the survey done.
The questionnaire was distributed through the hardcopy form to the targeted
group in certain area which is easy to reach. At the same time, the
questionnaire was also being distributed as the online survey through the
online social media and e-mail.
3.5.4 Sampling Size
There are 482 samples were collected from the survey done. The samples are
included 164 males and 318 females. The respondent are live in Kuala
Lumpur, Selangor, Perak, Johor, Kelantan, Terengganu, Pulau Pinang, Pahang,
Melaka, Kedah and Negeri Sembilan.
3.6 Research Instrument
The research instrument used in this research included the questionnaire and reading.
The type of questionnaire used is a structured questionnaire which is also known as
close ended form where the question asked is short and simple while the answer is
guided by providing a few choices of answer to be chosen. The questions formed in

Investment Behaviour among Gen Y
xlix
this questionnaires are included the dichotomous questions and multiple choice
questions.
This questionnaire included 5 five sections: demographic profile, investment behavior,
saving behavior, spending behavior and risk behavior. For the demographic profile
section, information on the age, gender, marital status, race, education level,
employment status and annual income will be inquired. For the investment behavior
section, the method of investment of the respondents will be asked.
For the saving behavior section, the percentage of the monthly saving, preparation of
the emergency fund and retirement fund will be asked. For the spending behavior
section, the monthly budget and frequency of the out of budget will be asked. While
for the risk behavior section, risk appetite level and cut-loss level will be asked.
Table 3.1: Measuring construct
No. Statement Measuring
Construct
Dependent Variable
No. 26 I will invest in share. Investment Behavior
I will invest in property.
Independent Variable
No. 1 Age
Demographic profile
No. 2 Gender
No. 3 Marital status
No. 4 Race
No. 6 Education level
No. 11 I will save certain percentage of income.
Saving Behavior No. 17 I will save money for emergency.
No. 23 I will save money for retirement.
No. 12 I will spend certain percentage of income. Spending Behavior
No. 15 I will spent out of budget sometimes

Investment Behaviour among Gen Y
l
No. 26 I think invest in stock market is risky
Risk Behavior No. 42 I will invest depend on risk
No. 44 I can accept loss in investment until certain level.
Besides questionnaires, reading is another research instrument used in this research.
The reading is included the public documents and private documents. However, the
reading materials used in this research is mostly public documents which are used in
the Chapter 2 (Literature Reviews) of this research.
3.7 Constructs Measurement (Scale and Operational
Definitions)
3.7.1 Nominal scale
For the nominal scale, the number does not giving any meaning but it is just a
representative of the element of a group that without any ranking or order. The
nominal scale in this research included gender, marital status, race, saved for
retirement, saved for emergency, opinion on the risk of stock market.
3.7.2 Ordinal scale
For the ordinal scale, it is similar to the nominal scale but it has a given order
or ranking. Moreover, the range in between the choice of the ordinal scale
does not giving any meaning. The ordinal scale in this research included the
education level, frequency of out of budget and risk appetite investing.
Investment Behaviour among Gen Y
li
3.7.3 Ratio scale
For the ratio scale, the magnitudes of the input and the intervals have their
meaning. Other than that, the measurement is absolute zero where the zero is
meaningful. The ratio scale in this research included age, percentage of
monthly income spent, percentage of monthly income saved and cut loss level
in investment.
3.8 Data Analysis
Data analysis the procedure that runs after the research data collected. This process is
help to transform the numerical data into the word-form information for the readers.
Its main objective is to investigate the relationship between the dependent variables
and independent variable through the statistical or logical techniques. This procedure
can help to understand the inferential statistics and help to write a more accurate
report on the study or research. However, determine the data analysis procedures that
are suitable for the study is also important before the data is being analyzed. There are
a lot of method can be used in the data analysis procedure, the data analysis
techniques that are used widely included univariate analysis, bivariate analysis,
multivariate analysis which are under the qualitative research.
Investment Behaviour among Gen Y
lii
3.8.1 Descriptive Analysis
Descriptive analysis can be used to describe the main components of the
variables (Sekaran & Bougie, 2010). It also used to summarize the data
tabulated in a meaningful way and sometimes it can help the readers to see the
pattern of the data. However, descriptive data may be a good method to
describe the data but it cannot be used to conclude the analysis of research.
Unprocessed data is hard for interpreting especially when there is large
number of data presented. However, descriptive analysis able to show the data
in a way that is easier to interpret which give a series of numerical number
that is meaningful.
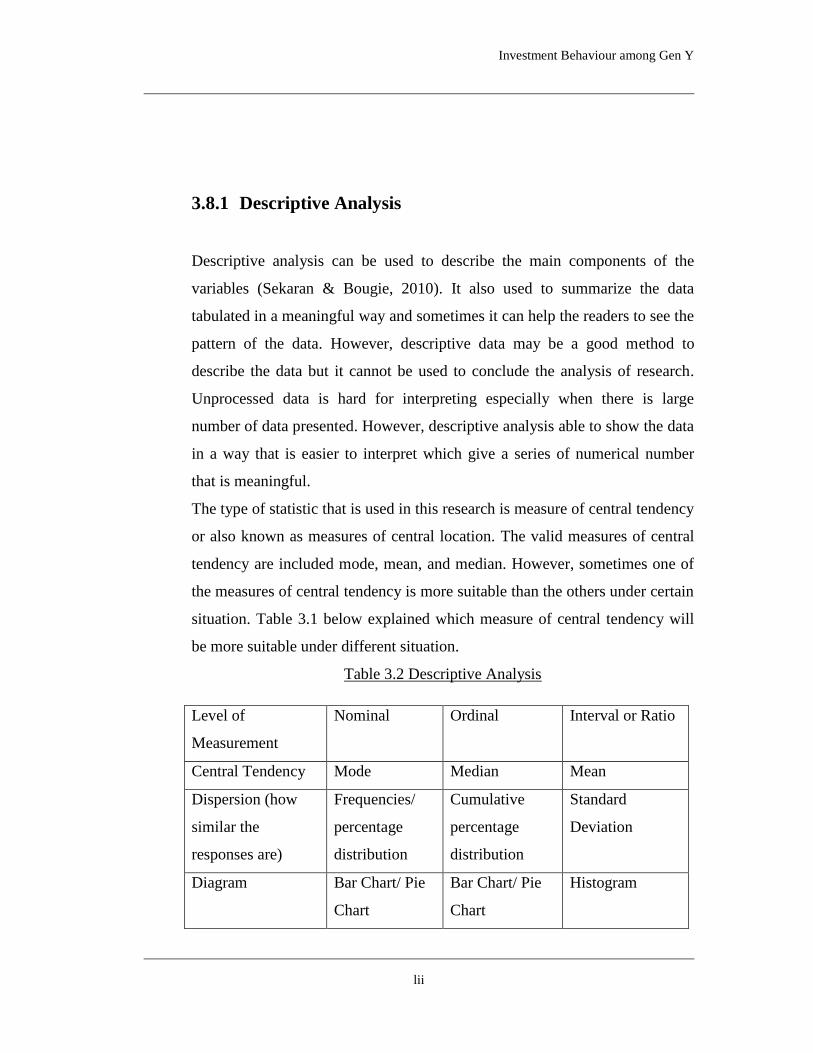
The type of statistic that is used in this research is measure of central tendency
or also known as measures of central location. The valid measures of central
tendency are included mode, mean, and median. However, sometimes one of
the measures of central tendency is more suitable than the others under certain
situation. Table 3.1 below explained which measure of central tendency will
be more suitable under different situation.
Table 3.2 Descriptive Analysis
Level of
Measurement
Nominal Ordinal Interval or Ratio
Central Tendency Mode Median Mean
Dispersion (how
similar the
responses are)
Frequencies/
percentage
distribution
Cumulative
percentage
distribution
Standard
Deviation
Diagram Bar Chart/ Pie
Chart
Bar Chart/ Pie
Chart
Histogram

Investment Behaviour among Gen Y
liii
Source: Burns & Bush (2003) Marketing Research: Online research
Applications (4th
Ed.). New Jersey: Prentice hall.p.445
3.8.1.1 Frequency Analysis
Frequency analysis is used to analyze the frequency of the happening of an
observation (Malhotra, 2007). The measures of central tendency which
included mode, mean and median can be analyzed through this analysis. The
valid cases are determined and the percentage of the frequency will be
calculated. Hence, the percentage of valid cases and the cumulative
percentage of valid cases can be found.
3.8.2 Inferential Analysis
Commonly, inferential analysis used statistical tests to make predictions or
inferences through the pattern of an observation. The result of inferential
analysis usually is used to check the relationship between the intervention and
outcome and also the strength between each other. Inferential analysis usually
used to predict the trend or situation of a population through an estimation of
the sample data collected which will imaged to the condition of the targeted
population. Hence, it can be said that the inferential analysis is used to make a
sample to represent a whole targeted population. The inferential analysis that
is used widely included linear regression analysis, logistic regression analysis,
ANOVA, correlation analysis and others. The inferential analysis used in this
research is logistic regression analysis.
Investment Behaviour among Gen Y
liv
3.8.2.1 Logistic Regression Analysis
Logistic regression is used to analyze the relationship between the
independent categorical variables with at least 2 categories and a binary
dependent variable (Sweet & Grace, 1999).It is similar to the linear regression
but the linear regression analyzes the linear relationship between the
independent variables and dependent variable. Since that logistic regression is
not analyze the linear relationship, then the logarithm of the likelihood ratio is
used. The likelihood ratio test is used to compare the fitness of null model and
alternative model. The statistic is shown in log-likelihood ratio statistic. While
the Omnibus test is used to examine whether there is a large distance between
the explained variance and unexplained variance. Correlation Coefficient, r is
used to determines the strength and direction of the linear relationship
between variables. The r-squared is referred to the fitness of model to the data.
It tells that how well the prediction on dependent variables. Hosmer-
Lemeshow test is similar to the Chi-square test, which describes the fitness of
the model to the data.
3.9 Conclusion
This chapter has discussed about the method that used to examine the main purpose
of this study. The research design, theoretical framework, hypotheses statements, data
collection methods, sampling design, construct measurement and data analyzing have
been included in this chapter. Since the methods have been decided, the test will be
run by using the Statistical Package for the Social Science (SPSS) software in the
next chapter.
Investment Behaviour among Gen Y
lv
CHAPTER 4: DATA ANALYSIS
4.0 Introduction
This chapter presents the results of data analysis revealed the discovery. The
discussion will focus on the goals and assumptions are detailed in Chapter I and II.
Statistical analysis of data using frequency, descriptive and binary logistic regression
analyzes.
4.1 Descriptive Analyses (Respondent Demographic
Profile)
4.1.1 Age profile of respondent
There is a total number of 482 sets of questionnaires have been collected in
this research through the questionnaire survey and online survey in Malaysia.
Table 4.1 shows the distribution of the age of the respondents between 18 and
32. More than two-third (68.8%) of the Generation Y respondents are aged
between 20 and 26.
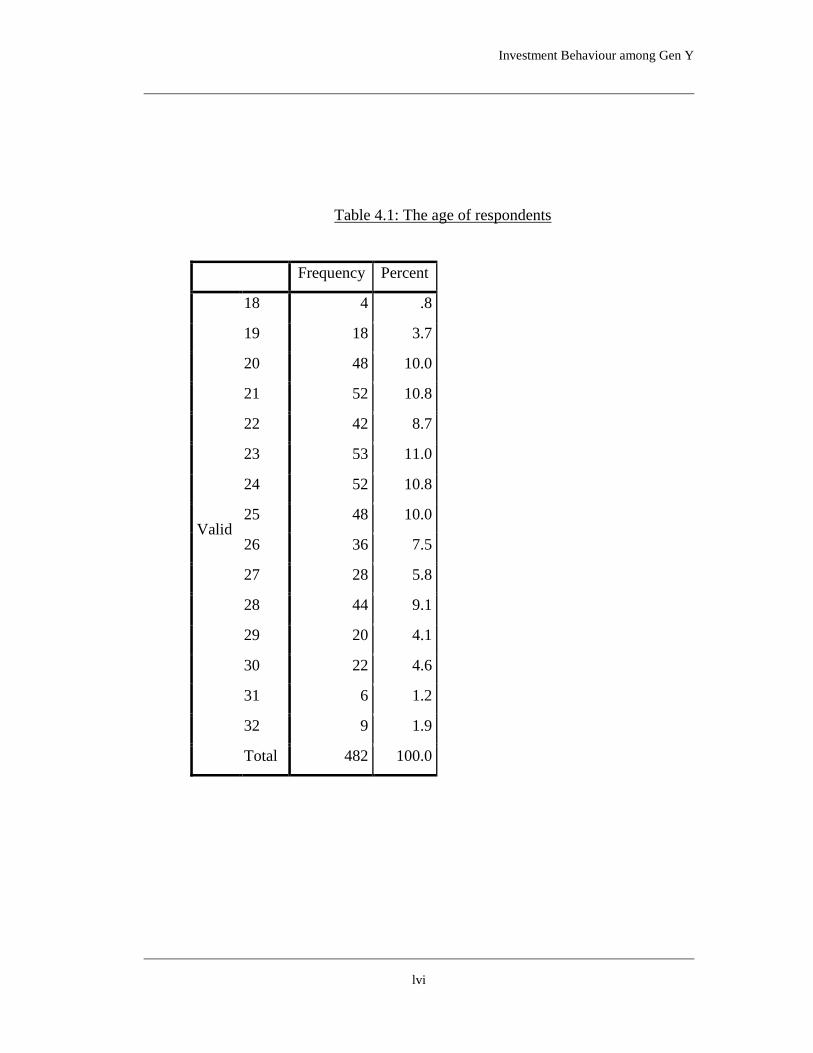
Investment Behaviour among Gen Y
lvi
Table 4.1: The age of respondents
Frequency Percent
Valid
18 4 .8
19 18 3.7
20 48 10.0
21 52 10.8
22 42 8.7
23 53 11.0
24 52 10.8
25 48 10.0
26 36 7.5
27 28 5.8
28 44 9.1
29 20 4.1
30 22 4.6
31 6 1.2
32 9 1.9
Total 482 100.0
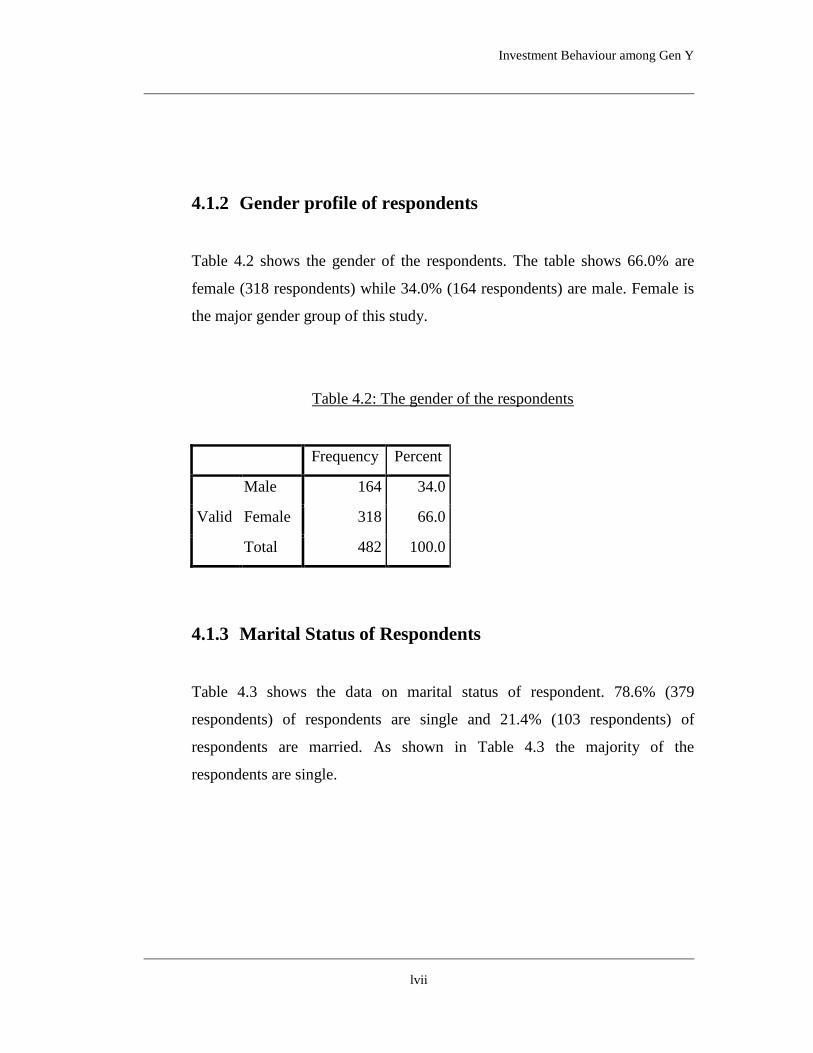
Investment Behaviour among Gen Y
lvii
4.1.2 Gender profile of respondents
Table 4.2 shows the gender of the respondents. The table shows 66.0% are
female (318 respondents) while 34.0% (164 respondents) are male. Female is
the major gender group of this study.
Table 4.2: The gender of the respondents
Frequency Percent
Valid
Male 164 34.0
Female 318 66.0
Total 482 100.0
4.1.3 Marital Status of Respondents
Table 4.3 shows the data on marital status of respondent. 78.6% (379
respondents) of respondents are single and 21.4% (103 respondents) of
respondents are married. As shown in Table 4.3 the majority of the
respondents are single.

Investment Behaviour among Gen Y
lviii
Table 4.3: The marital status of respondents
Frequency Percent
Valid
Single 379 78.6
Married 103 21.4
Total 482 100.0
4.1.4 Race of Respondents
Table 4.4 below shows the race of the respondents. The majority of the
respondents are Malays that is 52.7% (254 respondents) and 36.5% (176
respondents) are Chinese. Indians and others accounted for 10.8% of the
respondents (52 respondents).
Table 4.4: The race of the respondents
Frequency Percent
Valid
Malays 254 52.7
Chinese 176 36.5
Indians and others 52 10.8
Total 482 100.0

Investment Behaviour among Gen Y
lix
4.1.5 Education level of Respondents
Table 4.5 shows the education level of the respondents. 50.8% of the
respondents have an education level of upper secondary and below. STPM or
Pre University and above accounted for the remaining of 49.2%.
Table 4.5: The education level of respondents
Frequency Percent
Valid
Upper secondary and below 245 50.8
STPM/Pre-university and above 237 49.2
Total 482 100.0
4.1.6 Saving behavior of respondents
Table 4.6 shows the percentages of monthly income that being saved by
respondents. The highest percentage of monthly income saved by respondents
is 20.0%. 18.0% of the respondents (87 respondents) will save 20.0% of their
total income. The result shows a missing number of 102 respondents (21.2%)
who do not answer this question.

Investment Behaviour among Gen Y
lx
Table 4.6: The percentage of monthly income saved
Frequency Percent
Valid
1 7 1.5
2 2 .4
3 2 .4
5 15 3.1
6 1 .2
8 1 .2
9 1 .2
10 74 15.4
11 15 3.1
12 2 .4
14 1 .2
15 13 2.7
17 1 .2
20 87 18.0
21 1 .2
25 8 1.7
28 1 .2
30 54 11.2
31 1 .2
33 1 .2
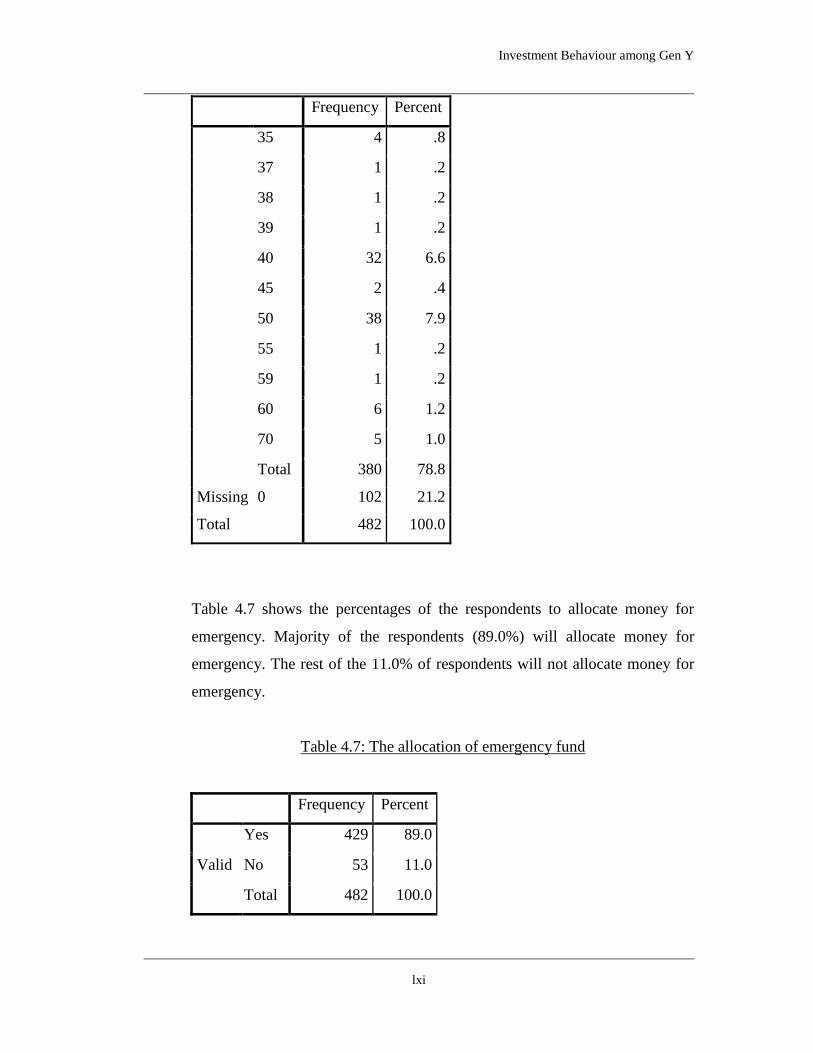
Investment Behaviour among Gen Y
lxi
Frequency Percent
35 4 .8
37 1 .2
38 1 .2
39 1 .2
40 32 6.6
45 2 .4
50 38 7.9
55 1 .2
59 1 .2
60 6 1.2
70 5 1.0
Total 380 78.8
Missing 0 102 21.2
Total 482 100.0
Table 4.7 shows the percentages of the respondents to allocate money for
emergency. Majority of the respondents (89.0%) will allocate money for
emergency. The rest of the 11.0% of respondents will not allocate money for
emergency.
Table 4.7: The allocation of emergency fund
Frequency Percent
Valid
Yes 429 89.0
No 53 11.0
Total 482 100.0
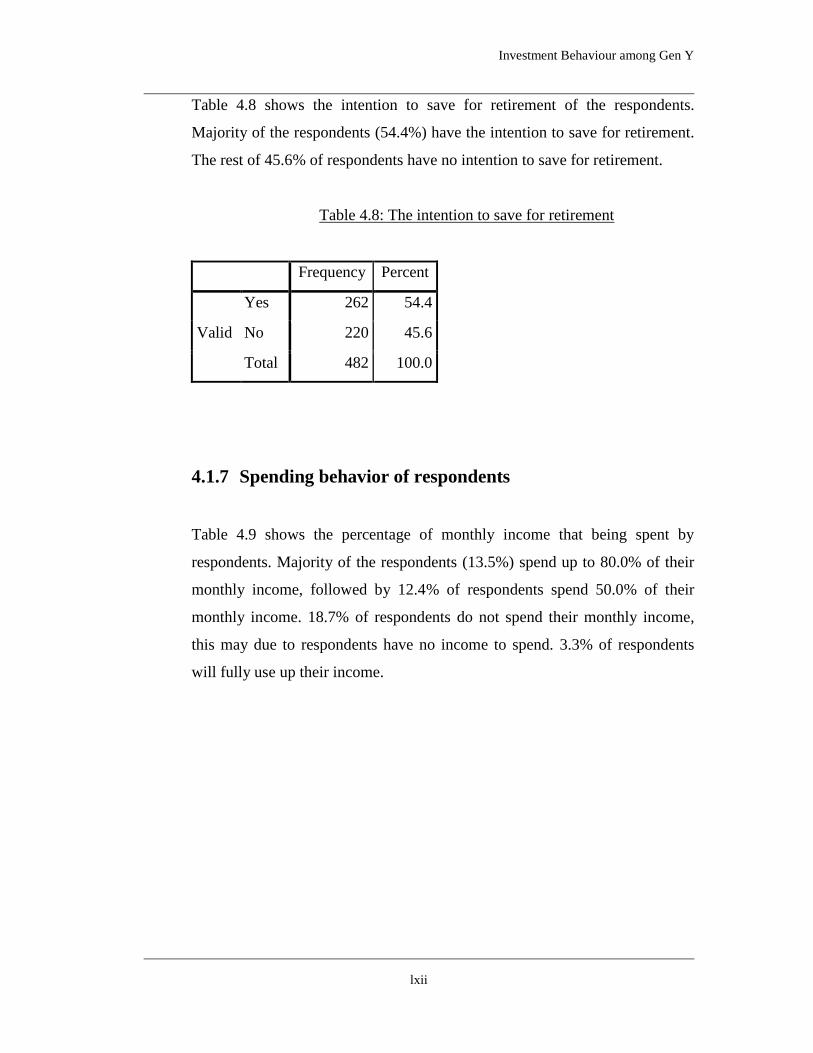
Investment Behaviour among Gen Y
lxii
Table 4.8 shows the intention to save for retirement of the respondents.
Majority of the respondents (54.4%) have the intention to save for retirement.
The rest of 45.6% of respondents have no intention to save for retirement.
Table 4.8: The intention to save for retirement
Frequency Percent
Valid
Yes 262 54.4
No 220 45.6
Total 482 100.0
4.1.7 Spending behavior of respondents
Table 4.9 shows the percentage of monthly income that being spent by
respondents. Majority of the respondents (13.5%) spend up to 80.0% of their
monthly income, followed by 12.4% of respondents spend 50.0% of their
monthly income. 18.7% of respondents do not spend their monthly income,
this may due to respondents have no income to spend. 3.3% of respondents
will fully use up their income.

Investment Behaviour among Gen Y
lxiii
Table 4.9: Percentage of monthly income spent
Frequency Percent
Valid
0 90 18.7
2 1 .2
4 1 .2
5 9 1.9
10 15 3.1
11 1 .2
15 3 .6
20 14 2.9
30 30 6.2
40 19 3.9
45 2 .4
50 60 12.4
60 50 10.4
65 5 1.0
66 1 .2
70 52 10.8
75 4 .8
80 65 13.5
83 1 .2
85 3 .6
86 1 .2
90 27 5.6
94 1 .2
95 6 1.2
99 5 1.0
100 16 3.3
Total 482 100.0
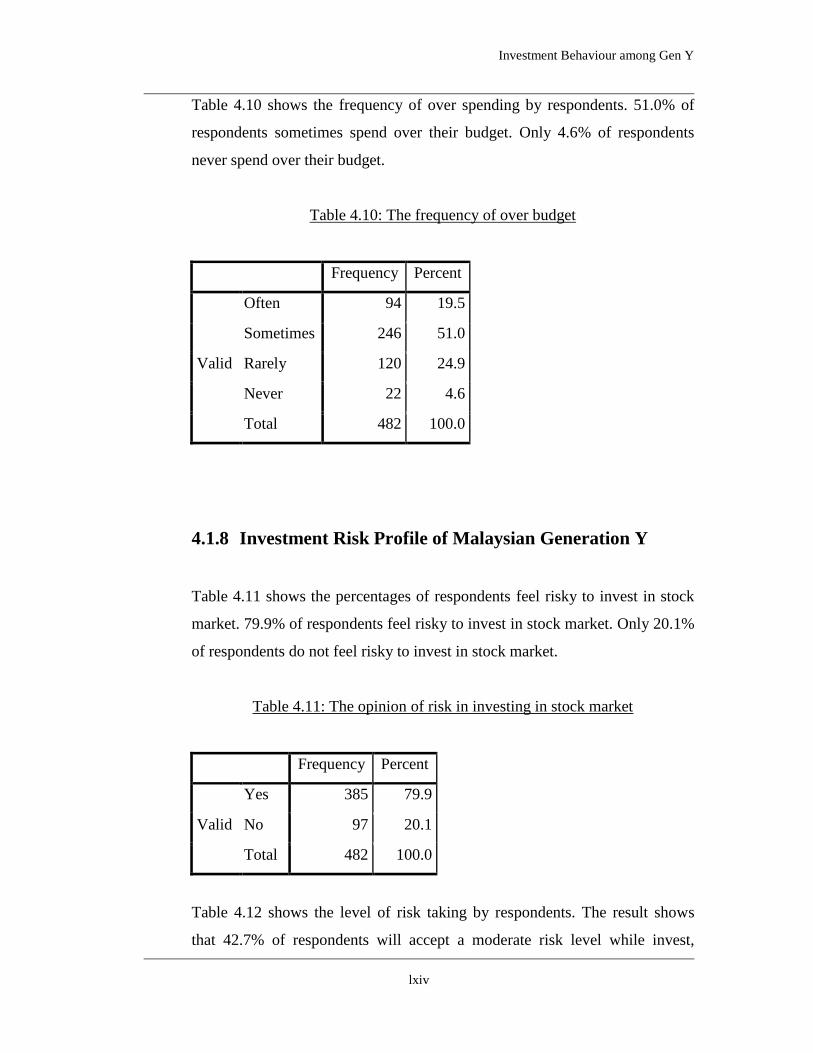
Investment Behaviour among Gen Y
lxiv
Table 4.10 shows the frequency of over spending by respondents. 51.0% of
respondents sometimes spend over their budget. Only 4.6% of respondents
never spend over their budget.
Table 4.10: The frequency of over budget
Frequency Percent
Valid
Often 94 19.5
Sometimes 246 51.0
Rarely 120 24.9
Never 22 4.6
Total 482 100.0
4.1.8 Investment Risk Profile of Malaysian Generation Y
Table 4.11 shows the percentages of respondents feel risky to invest in stock
market. 79.9% of respondents feel risky to invest in stock market. Only 20.1%
of respondents do not feel risky to invest in stock market.
Table 4.11: The opinion of risk in investing in stock market
Frequency Percent
Valid
Yes 385 79.9
No 97 20.1
Total 482 100.0
Table 4.12 shows the level of risk taking by respondents. The result shows
that 42.7% of respondents will accept a moderate risk level while invest,

Investment Behaviour among Gen Y
lxv
followed by 34.9% of respondents accept a low risk level and 15.4% accept a
high risk level. Only 7.1% of respondents can accept a very high risk level
while invest.
Table 4.12: The risk appetite respondents
Frequency Percent
Valid
Low 168 34.9
Moderate 206 42.7
High 74 15.4
Very high 34 7.1
Total 482 100.0
Table 4.13 shows the cut loss level of the respondents. The majority of 43.6%
of respondents have only 10.0% of cut loss level of capital, followed by 18.9%
of respondents with a 20.0% of cut loss level. 18.3% of respondents have a cut
loss level up to 80%.
Table 4.13: The cut loss level of respondents
Frequency Percent
Valid
10 210 43.6
20 91 18.9
30 56 11.6
40 14 2.9
50 23 4.8
80 88 18.3
Total 482 100.0

Investment Behaviour among Gen Y
lxvi
4.2 Central Tendencies Measurement of Constructs
Table 4.14 shows the central tendencies of research which are mean, median and
mode. From the results shown in Table 4.14, respondents have an average age of 24
year old. Number of the female respondents is almost twice of the male respondents.
Most of them are still single. Over half of the total respondents are Malays.
Table 4.14: Central Tendencies
Central Tendencies
Mean Median Mode
Age 24.26 24.00 23
Gender 1.66 2.00 2
Marital status 1.21 1.00 1
Race 1.58 1.00 1
Education .49 .00 0
Saving percent 24.45 20.00 20
Spent 48.61 50.00 0
Out budget 2.15 2.00 2
Emergency 1.11 1.00 1
Retirement 1.46 1.00 1
Stock risk 1.20 1.00 1
Risk appetite 1.95 2.00 2
Cut loss 29.77 20.00 10
Share .18 .00 0
Property .39 .00 0

Investment Behaviour among Gen Y
lxvii
4.3 Inferential Analyses / Statistical Models
4.3.1 Binary Logistic regression
4.3.1.1 Share as dependent variable
Share is dependent variable and saving behavior, spent behavior and
investment risk are independent variable.
Table 4.15 shows the case processing summary. The missing case is 21.2%,
with a number of 102 respondents who do not answer this session of question.
Total case is 482 respondents.
Table 4.15: The case processing summary
Case Processing Summary
Unweighted Casesa N Percent
Selected Cases
Included in
Analysis 380 78.8
Missing Cases 102 21.2
Total 482 100.0
Unselected Cases 0 .0
Total 482 100.0
a. If weight is in effect, see classification table for the
total number of cases.
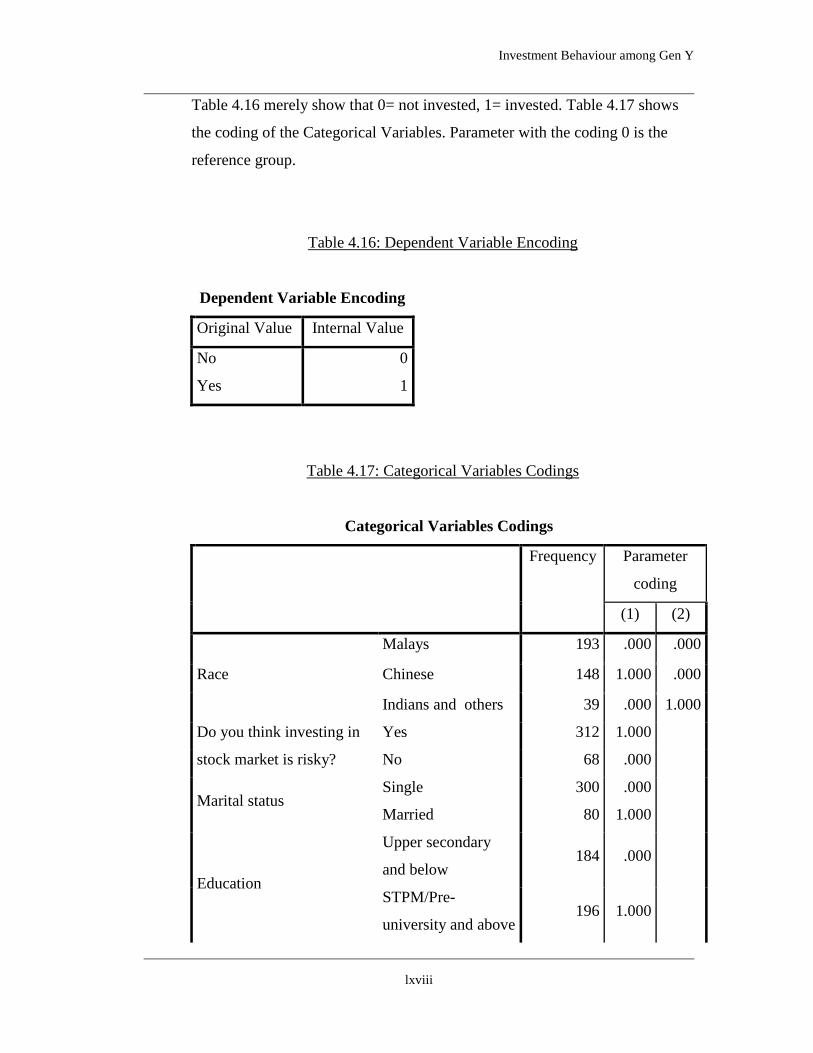
Investment Behaviour among Gen Y
lxviii
Table 4.16 merely show that 0= not invested, 1= invested. Table 4.17 shows
the coding of the Categorical Variables. Parameter with the coding 0 is the
reference group.
Table 4.16: Dependent Variable Encoding
Dependent Variable Encoding
Original Value Internal Value
No 0
Yes 1
Table 4.17: Categorical Variables Codings
Categorical Variables Codings
Frequency Parameter
coding
(1) (2)
Race
Malays 193 .000 .000
Chinese 148 1.000 .000
Indians and others 39 .000 1.000
Do you think investing in
stock market is risky?
Yes 312 1.000
No 68 .000
Marital status Single 300 .000
Married 80 1.000
Education
Upper secondary
and below 184 .000
STPM/Pre-
university and above 196 1.000
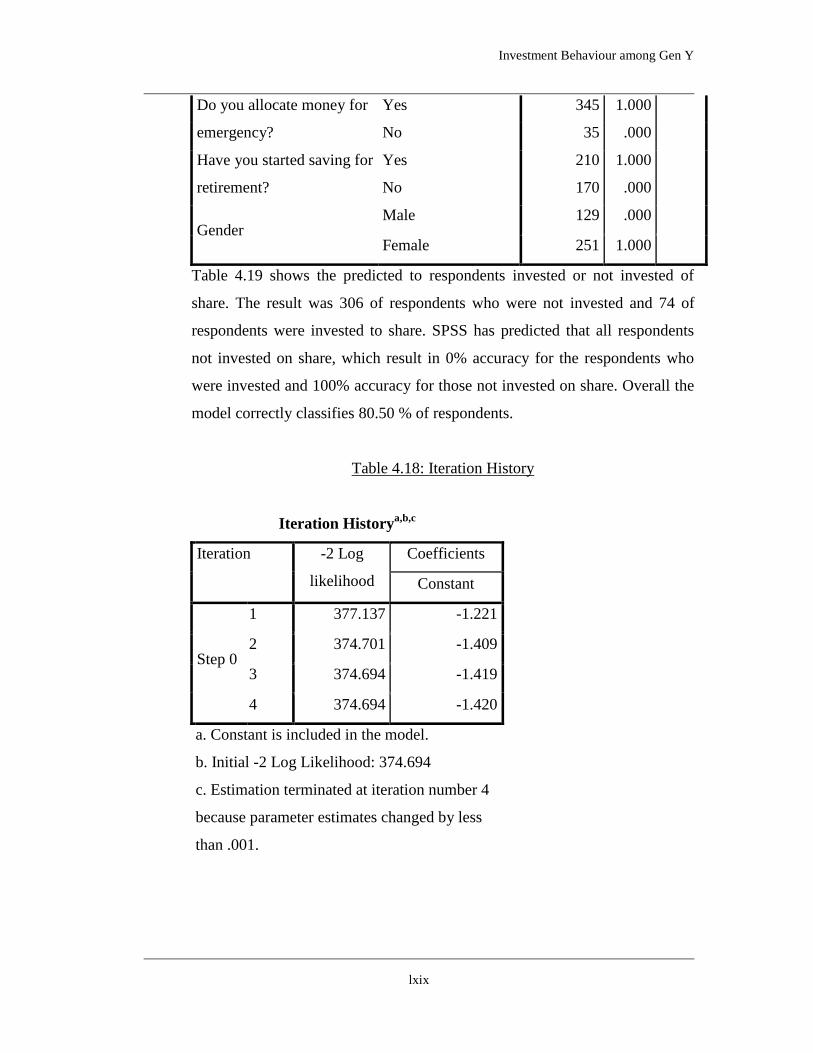
Investment Behaviour among Gen Y
lxix
Do you allocate money for
emergency?
Yes 345 1.000
No 35 .000
Have you started saving for
retirement?
Yes 210 1.000
No 170 .000
Gender Male 129 .000
Female 251 1.000
Table 4.19 shows the predicted to respondents invested or not invested of
share. The result was 306 of respondents who were not invested and 74 of
respondents were invested to share. SPSS has predicted that all respondents
not invested on share, which result in 0% accuracy for the respondents who
were invested and 100% accuracy for those not invested on share. Overall the
model correctly classifies 80.50 % of respondents.
Table 4.18: Iteration History
Iteration Historya,b,c
Iteration -2 Log
likelihood
Coefficients
Constant
Step 0
1 377.137 -1.221
2 374.701 -1.409
3 374.694 -1.419
4 374.694 -1.420
a. Constant is included in the model.
b. Initial -2 Log Likelihood: 374.694
c. Estimation terminated at iteration number 4
because parameter estimates changed by less
than .001.

Investment Behaviour among Gen Y
lxx
Table 4.19: Classification Table
Classification Tablea,b
Observed
Predicted
Do you invest in share? Percentage
Correct No Yes
Step 0
Do you invest in
share?
No 306 0 100.0
Yes 74 0 .0
Overall Percentage 80.5
a. Constant is included in the model.
b. The cut value is .500
Table 4.20 and Table 4.21 show the summary of the model. The value of the
constant (B) is -1.42. Table 4.21 shows the variables not in the equation. The
overall statistic of 45.44 is the residual chi-square statistic. The variable not in
the equation is significant when the p-value is not more than 0.10.
Table 4.20: Variables in the equation
Variables in the Equation
B S.E. Wald df Sig. Exp(B)
Step 0 Constant -1.420 .130 120.075 1 .000 .242
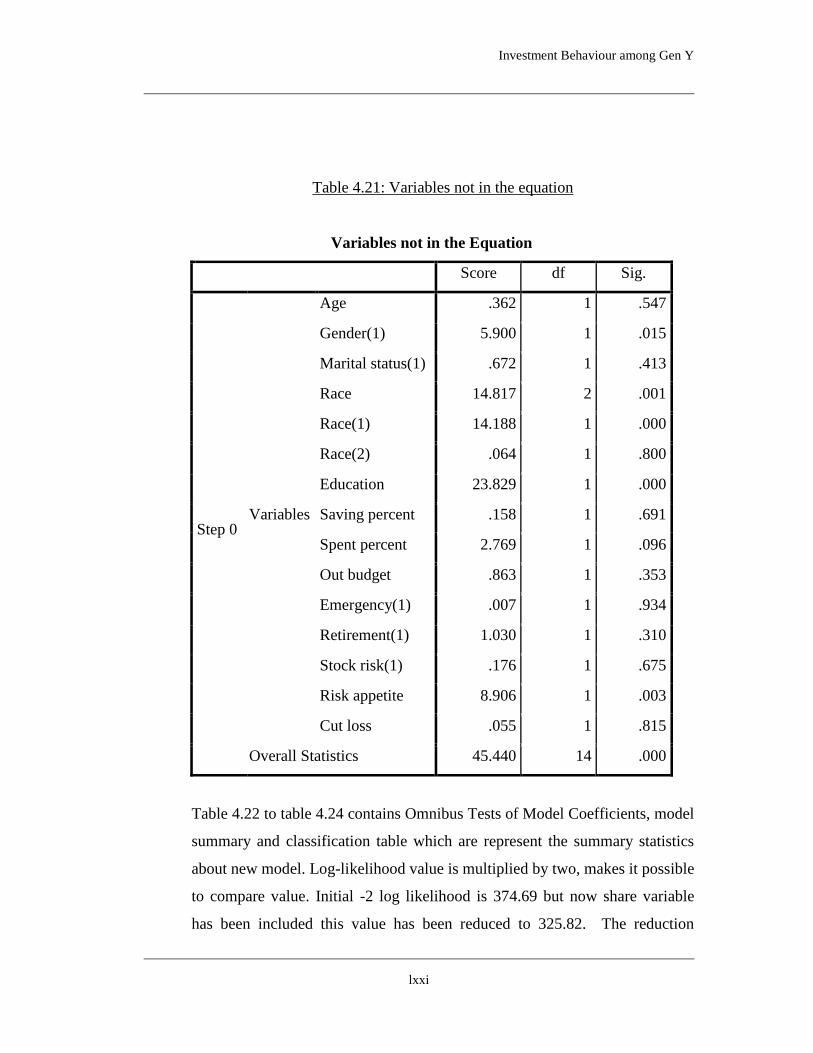
Investment Behaviour among Gen Y
lxxi
Table 4.21: Variables not in the equation
Variables not in the Equation
Score df Sig.
Step 0 Variables
Age .362 1 .547
Gender(1) 5.900 1 .015
Marital status(1) .672 1 .413
Race 14.817 2 .001
Race(1) 14.188 1 .000
Race(2) .064 1 .800
Education 23.829 1 .000
Saving percent .158 1 .691
Spent percent 2.769 1 .096
Out budget .863 1 .353
Emergency(1) .007 1 .934
Retirement(1) 1.030 1 .310
Stock risk(1) .176 1 .675
Risk appetite 8.906 1 .003
Cut loss .055 1 .815
Overall Statistics 45.440 14 .000
Table 4.22 to table 4.24 contains Omnibus Tests of Model Coefficients, model
summary and classification table which are represent the summary statistics
about new model. Log-likelihood value is multiplied by two, makes it possible
to compare value. Initial -2 log likelihood is 374.69 but now share variable
has been included this value has been reduced to 325.82. The reduction

Investment Behaviour among Gen Y
lxxii
shows us that the model is better at predicting. The classification table shows
the new result, 299 of respondents will not invest to share. 7 respondents will
invest to the share but misclassifies 74 others. Chi-square is 48.87 (374.69-
325.82), initial -2 log likelihood minus new -2 log likelihood. The value is
significant at 0.05 levels.
Table 4.22: Omnibus Tests of Model Coefficients
Omnibus Tests of Model Coefficients
Chi-square df Sig.
Step 1
Step 48.870 14 .000
Block 48.870 14 .000
Model 48.870 14 .000
Table 4.23: Model Summary
Model Summary
Step -2 Log likelihood Cox & Snell R Square Nagelkerke R Square
1 325.824a .121 .192
a. Estimation terminated at iteration number 5 because parameter estimates
changed by less than .001.
Table 4.24: Classification Table
Classification Tablea
Observed
Predicted
Do you invest in share? Percentage
Correct No Yes
Step 1
Do you invest in
share?
No 299 7 97.7
Yes 67 7 9.5
Overall Percentage 80.5
a. The cut value is .500

Investment Behaviour among Gen Y
lxxiii
Table 4.25 contains the variables in the equation which show the significance
of the variables. The variable is considered as significant if the p-value is
smaller than 0.10. Hence, there are only 4 variables are significant which are
gender, race, education level and risk appetite in investing.
Table 4.25: Variables in the Equation
Variables in the Equation
B S.E. Wald df Sig. Exp(B)
Step 1a
Age .013 .048 .069 1 .793 1.013
Gender(1) -.667 .301 4.891 1 .027 .513
Marital status(1) -.110 .400 .076 1 .783 .896
Race 8.317 2 .016
Race(1) .932 .331 7.949 1 .005 2.540
Race(2) .258 .512 .255 1 .614 1.295
Education(1) 1.309 .326 16.093 1 .000 3.701
Saving percent .007 .010 .548 1 .459 1.008
Spent -.004 .006 .422 1 .516 .996
Out budget -.166 .201 .681 1 .409 .847
Emergency(1) .268 .499 .290 1 .590 1.308
Retirement(1) -.108 .312 .119 1 .731 .898
Stock risk(1) -.045 .387 .013 1 .908 .956
Risk appetite .465 .170 7.511 1 .006 1.592
Cut loss -.004 .006 .310 1 .578 .996
Constant -3.165 1.460 4.701 1 .030 .042
The Hosmer-Lemeshow tests are to test the model made the prediction of null
hypothesis is fit perfectly with research. This is to predicted probability on
criterion variable. A chi-square statistic is computed comparing the observed

Investment Behaviour among Gen Y
lxxiv
frequencies with those expected under the linear model. A non- significant
chi-square shows that the data fit the model well.
Table 4.26: Hosmer and Lemeshow Test
Hosmer and Lemeshow Test
Step Chi-square df Sig.
1 9.726 8 .285
Table 4.27: Contingency Table for Hosmer and Lemeshow
Contingency Table for Hosmer and Lemeshow Test
Do you invest in share? = No Do you invest in share? = Yes Total
Observed Expected Observed Expected
Step 1
1 36 36.788 2 1.212 38
2 38 36.045 0 1.955 38
3 37 35.131 1 2.869 38
4 32 34.053 6 3.947 38
5 30 32.722 8 5.278 38
6 31 31.163 7 6.837 38
7 33 29.414 5 8.586 38
8 25 27.132 13 10.868 38
9 23 24.235 15 13.765 38
10 21 19.318 17 18.682 38
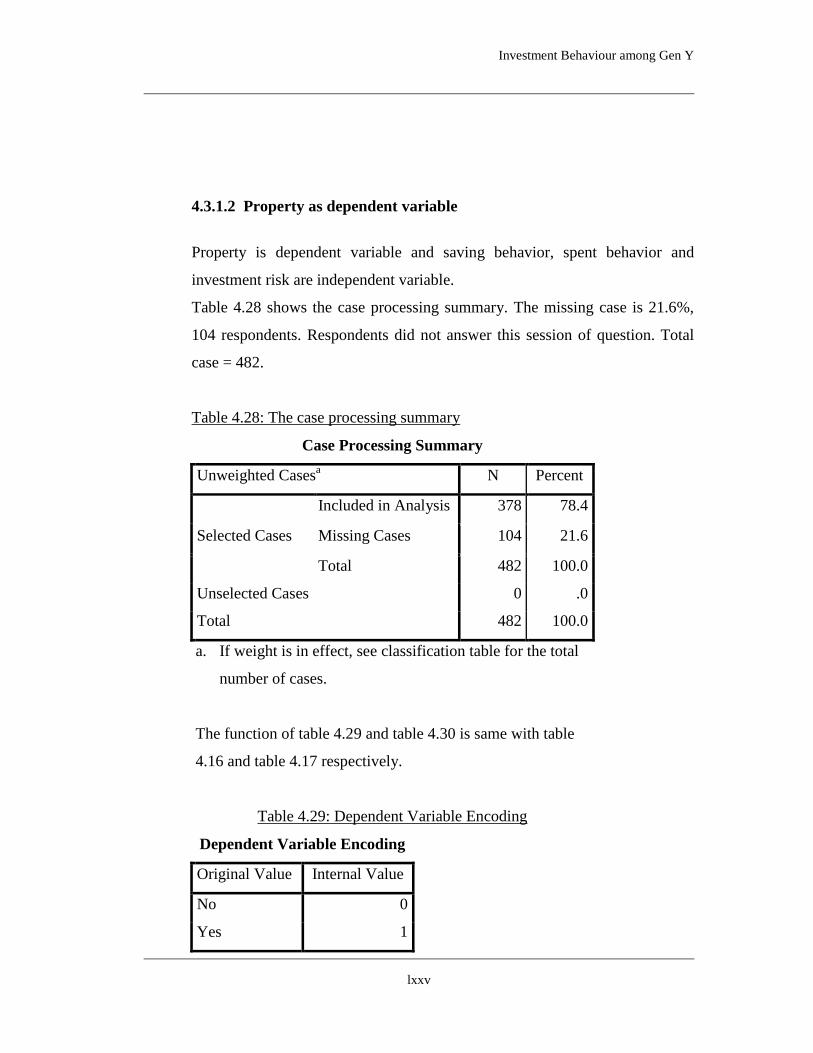
Investment Behaviour among Gen Y
lxxv
4.3.1.2 Property as dependent variable
Property is dependent variable and saving behavior, spent behavior and
investment risk are independent variable.
Table 4.28 shows the case processing summary. The missing case is 21.6%,
104 respondents. Respondents did not answer this session of question. Total
case = 482.
Table 4.28: The case processing summary
Case Processing Summary
Unweighted Casesa N Percent
Selected Cases
Included in Analysis 378 78.4
Missing Cases 104 21.6
Total 482 100.0
Unselected Cases 0 .0
Total 482 100.0
a. If weight is in effect, see classification table for the total
number of cases.
The function of table 4.29 and table 4.30 is same with table
4.16 and table 4.17 respectively.
Table 4.29: Dependent Variable Encoding
Dependent Variable Encoding
Original Value Internal Value
No 0
Yes 1
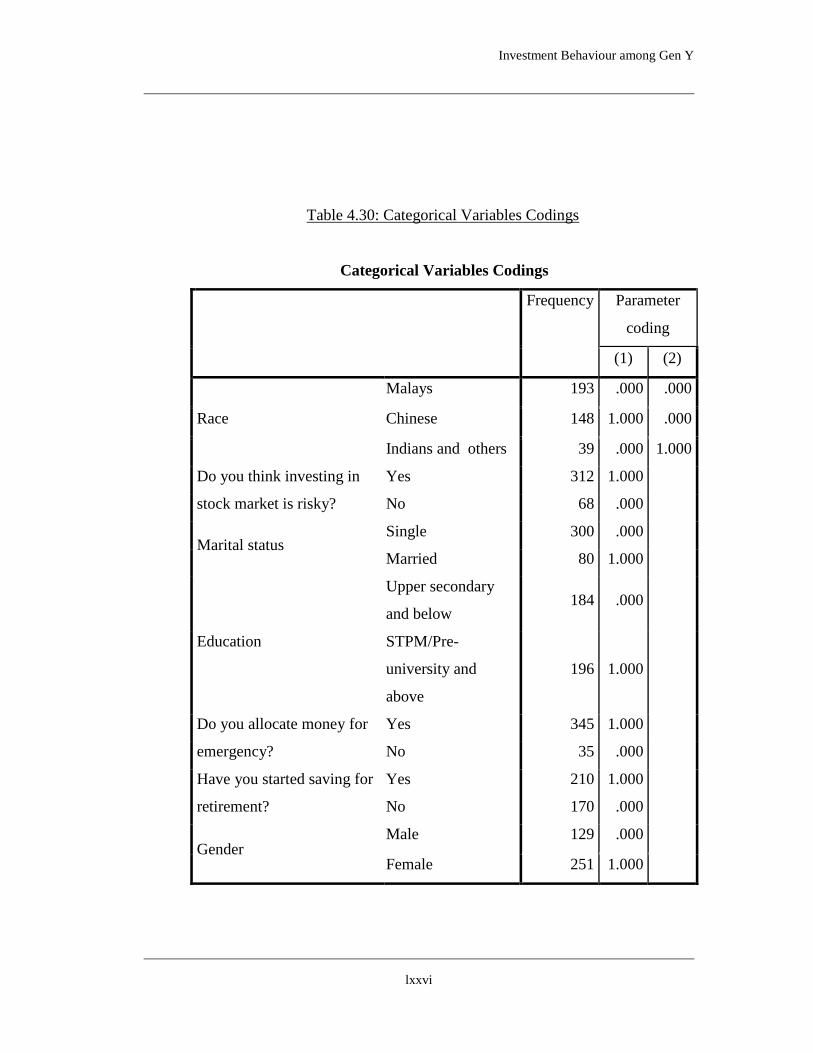
Investment Behaviour among Gen Y
lxxvi
Table 4.30: Categorical Variables Codings
Categorical Variables Codings
Frequency Parameter
coding
(1) (2)
Race
Malays 193 .000 .000
Chinese 148 1.000 .000
Indians and others 39 .000 1.000
Do you think investing in
stock market is risky?
Yes 312 1.000
No 68 .000
Marital status Single 300 .000
Married 80 1.000
Education
Upper secondary
and below 184 .000
STPM/Pre-
university and
above
196 1.000
Do you allocate money for
emergency?
Yes 345 1.000
No 35 .000
Have you started saving for
retirement?
Yes 210 1.000
No 170 .000
Gender Male 129 .000
Female 251 1.000

Investment Behaviour among Gen Y
lxxvii
Table 4.32 shows the predicted to respondents invested or not invested of
property. Initial -2 Log Likelihood is 513.067. The result was 224 of
respondents who were not invested and 154 of respondents were invested to
property. SPSS has predicted that all respondents not invested on property,
which result in 0% accuracy for the respondents who were invested and 100%
accuracy for those not invested on property. Overall the model correctly
classifies 59.5% of respondents.
Table 4.31: Iteration History
Iteration Historya,b,c
Iteration -2 Log likelihood Coefficients
Constant
Step 0
1 513.069 -.379
2 513.067 -.384
3 513.067 -.384
a. Constant is included in the model.
b. Initial -2 Log Likelihood: 513.067
c. Estimation terminated at iteration number 3 because
parameter estimates changed by less than .001.
Table 4.32: Classification Table
Classification Tablea,b
Observed
Predicted
Do you invest in
property?
Percentage
Correct
No Yes
Step 0
Do you invest in
property?
No 226 0 100.0
Yes 154 0 .0
Overall Percentage 59.5
a. Constant is included in the model.
b. The cut value is .500

Investment Behaviour among Gen Y
lxxviii
Table 4.33 and table 4.34 show the summary of the model. The value of the
constant (B) is -0.38. Table 4.21 shows the variables not in the equation. The
overall statistic of 53.37 is the residual chi-square statistic. The variable not in
the equation is significant when the p-value is less than 0.10.
Table 4.33: Variables in the equation
Variables in the Equation
B S.E. Wald df Sig. Exp(B)
Step 0 Constant -.384 .104 13.476 1 .000 .681
Table 4.34: Variables not in the equation
Variables not in the Equation
Score df Sig.
Step 0 Variables
Age 2.403 1 .121
Gender(1) .674 1 .412
Marital status(1) .385 1 .535
Race 34.842 2 .000
Race(1) 24.334 1 .000
Race(2) 3.199 1 .074
Education .288 1 .591
Saving percent 4.136 1 .042
Spent 7.855 1 .005
Out budget 2.313 1 .128
Emergency(1) .430 1 .512
Retirement(1) 14.476 1 .000
Stock risk(1) .180 1 .671
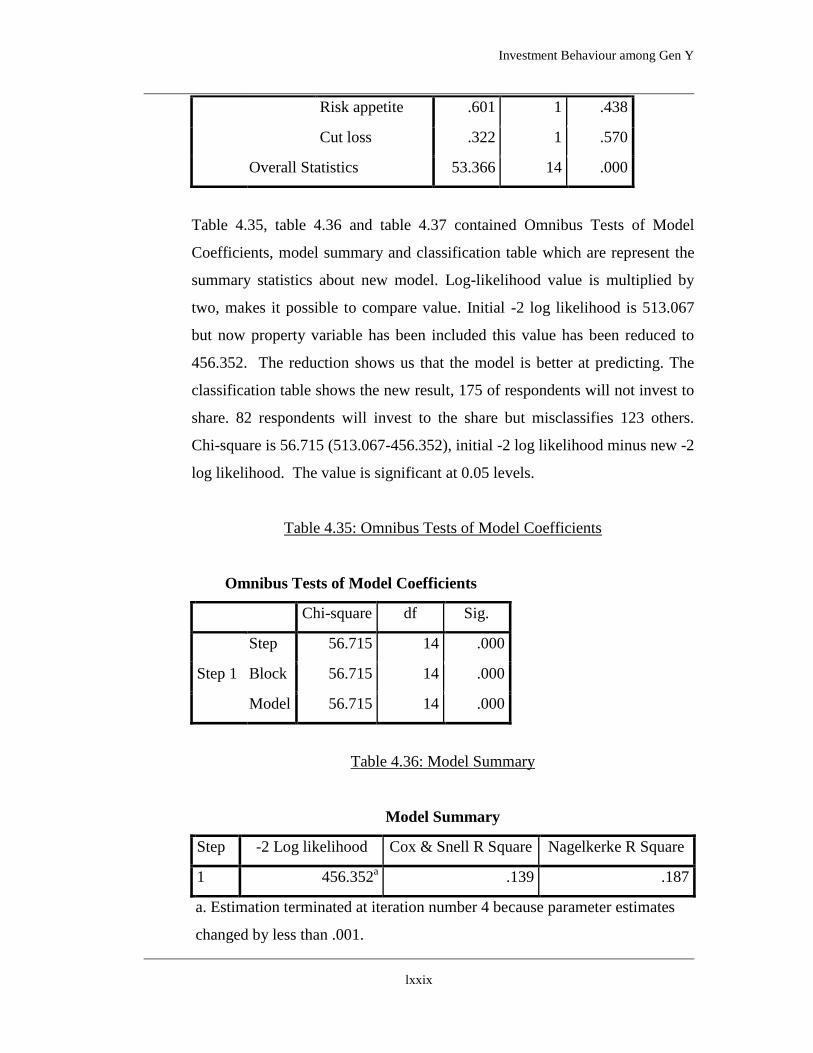
Investment Behaviour among Gen Y
lxxix
Risk appetite .601 1 .438
Cut loss .322 1 .570
Overall Statistics 53.366 14 .000
Table 4.35, table 4.36 and table 4.37 contained Omnibus Tests of Model
Coefficients, model summary and classification table which are represent the
summary statistics about new model. Log-likelihood value is multiplied by
two, makes it possible to compare value. Initial -2 log likelihood is 513.067
but now property variable has been included this value has been reduced to
456.352. The reduction shows us that the model is better at predicting. The
classification table shows the new result, 175 of respondents will not invest to
share. 82 respondents will invest to the share but misclassifies 123 others.
Chi-square is 56.715 (513.067-456.352), initial -2 log likelihood minus new -2
log likelihood. The value is significant at 0.05 levels.
Table 4.35: Omnibus Tests of Model Coefficients
Omnibus Tests of Model Coefficients
Chi-square df Sig.
Step 1
Step 56.715 14 .000
Block 56.715 14 .000
Model 56.715 14 .000
Table 4.36: Model Summary
Model Summary
Step -2 Log likelihood Cox & Snell R Square Nagelkerke R Square
1 456.352a .139 .187
a. Estimation terminated at iteration number 4 because parameter estimates
changed by less than .001.
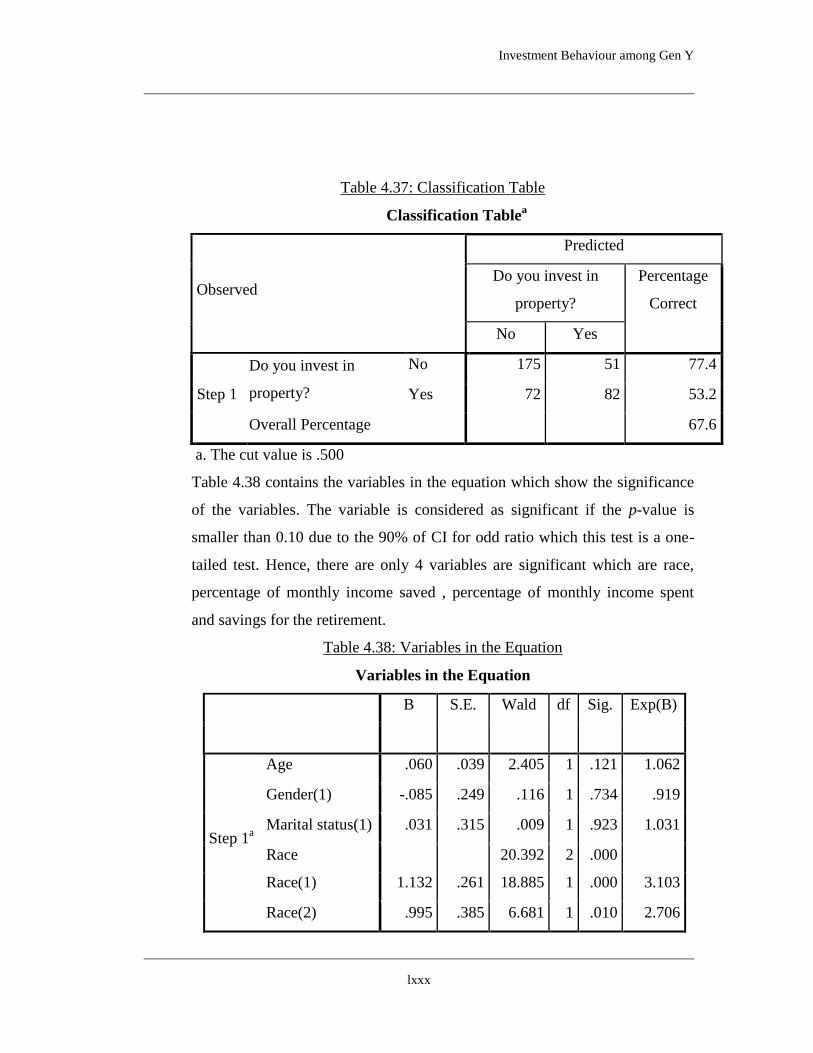
Investment Behaviour among Gen Y
lxxx
Table 4.37: Classification Table
Classification Tablea
Observed
Predicted
Do you invest in
property?
Percentage
Correct
No Yes
Step 1
Do you invest in
property?
No 175 51 77.4
Yes 72 82 53.2
Overall Percentage 67.6
a. The cut value is .500
Table 4.38 contains the variables in the equation which show the significance
of the variables. The variable is considered as significant if the p-value is
smaller than 0.10 due to the 90% of CI for odd ratio which this test is a one-
tailed test. Hence, there are only 4 variables are significant which are race,
percentage of monthly income saved , percentage of monthly income spent
and savings for the retirement.
Table 4.38: Variables in the Equation
Variables in the Equation
B S.E. Wald df Sig. Exp(B)
Step 1a
Age .060 .039 2.405 1 .121 1.062
Gender(1) -.085 .249 .116 1 .734 .919
Marital status(1) .031 .315 .009 1 .923 1.031
Race 20.392 2 .000
Race(1) 1.132 .261 18.885 1 .000 3.103
Race(2) .995 .385 6.681 1 .010 2.706
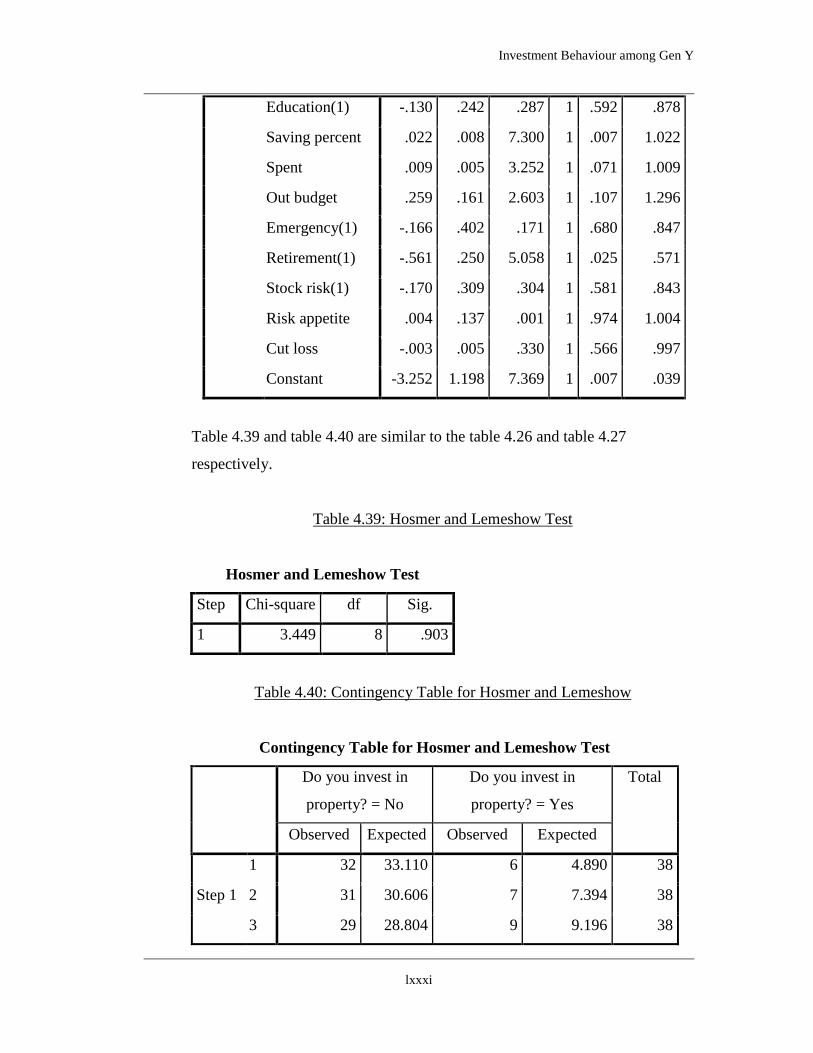
Investment Behaviour among Gen Y
lxxxi
Education(1) -.130 .242 .287 1 .592 .878
Saving percent .022 .008 7.300 1 .007 1.022
Spent .009 .005 3.252 1 .071 1.009
Out budget .259 .161 2.603 1 .107 1.296
Emergency(1) -.166 .402 .171 1 .680 .847
Retirement(1) -.561 .250 5.058 1 .025 .571
Stock risk(1) -.170 .309 .304 1 .581 .843
Risk appetite .004 .137 .001 1 .974 1.004
Cut loss -.003 .005 .330 1 .566 .997
Constant -3.252 1.198 7.369 1 .007 .039
Table 4.39 and table 4.40 are similar to the table 4.26 and table 4.27
respectively.
Table 4.39: Hosmer and Lemeshow Test
Hosmer and Lemeshow Test
Step Chi-square df Sig.
1 3.449 8 .903
Table 4.40: Contingency Table for Hosmer and Lemeshow
Contingency Table for Hosmer and Lemeshow Test
Do you invest in
property? = No
Do you invest in
property? = Yes
Total
Observed Expected Observed Expected
Step 1
1 32 33.110 6 4.890 38
2 31 30.606 7 7.394 38
3 29 28.804 9 9.196 38
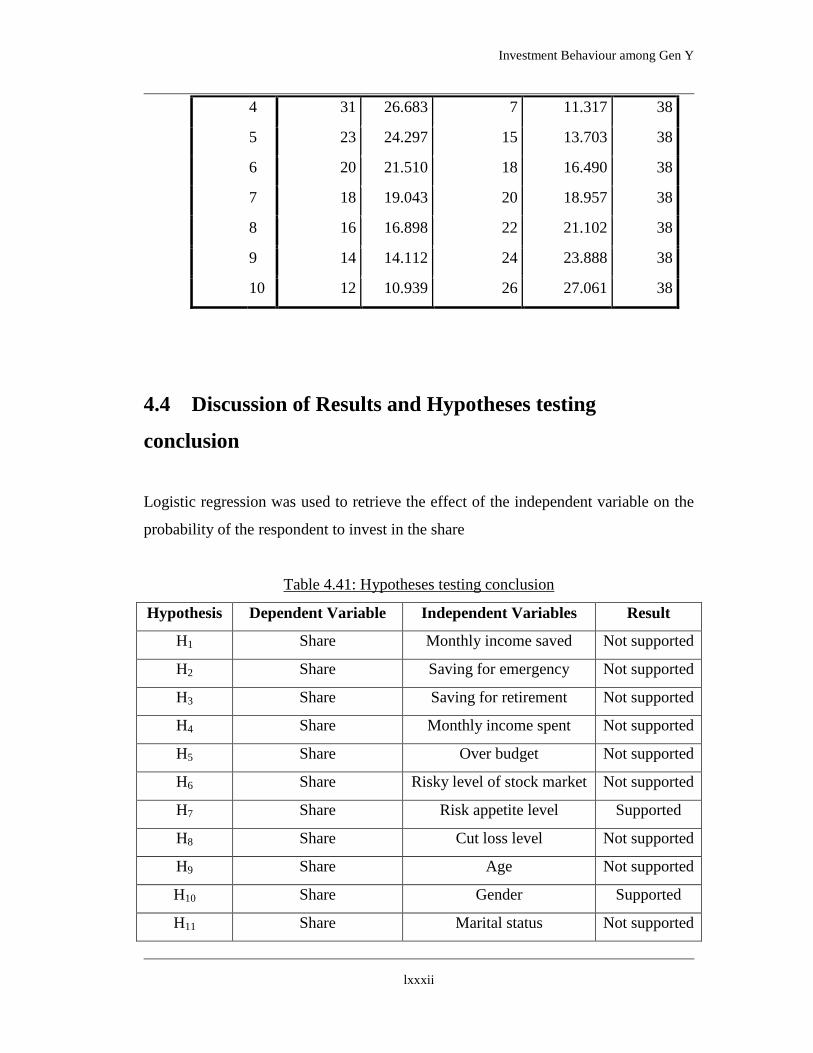
Investment Behaviour among Gen Y
lxxxii
4 31 26.683 7 11.317 38
5 23 24.297 15 13.703 38
6 20 21.510 18 16.490 38
7 18 19.043 20 18.957 38
8 16 16.898 22 21.102 38
9 14 14.112 24 23.888 38
10 12 10.939 26 27.061 38
4.4 Discussion of Results and Hypotheses testing
conclusion
Logistic regression was used to retrieve the effect of the independent variable on the
probability of the respondent to invest in the share
Table 4.41: Hypotheses testing conclusion
Hypothesis Dependent Variable Independent Variables Result
H1 Share Monthly income saved Not supported
H2 Share Saving for emergency Not supported
H3 Share Saving for retirement Not supported
H4 Share Monthly income spent Not supported
H5 Share Over budget Not supported
H6 Share Risky level of stock market Not supported
H7 Share Risk appetite level Supported
H8 Share Cut loss level Not supported
H9 Share Age Not supported
H10 Share Gender Supported
H11 Share Marital status Not supported

Investment Behaviour among Gen Y
lxxxiii
H12 Share Race Supported
H13 Share Education level Supported
H14 Property Monthly income saved Supported
H15 Property Saving for emergency Not supported
H16 Property Saving for retirement Supported
H17 Property Monthly income spent Supported
H18 Property Over budget Not supported
H19 Property Risky level of stock market Not supported
H20 Property Risk appetite level Not supported
H21 Property Cut loss level Not supported
H22 Property Age Not supported
H23 Property Gender Not supported
H24 Property Marital status Not supported
H25 Property Race Supported
H26 Property Education level Not supported
H7: There is a significant relationship between risk appetite level and share.
H10: There is a significant relationship between gender and share.
H11: There is a significant relationship between marital status and share.
H13: There is a significant relationship between education level and share.
H14: There is a significant relationship between monthly income saved and property.
H16: There is a significant relationship between saving for retirement and property.
H17: There is a significant relationship between monthly income spent and property.
H25: There is a significant relationship between race and property.
4.5 Conclusion
For the investment in share, logistic regression was used to retrieve the effect of the
independent variable on the probability of the respondent to invest in share. The

Investment Behaviour among Gen Y
lxxxiv
model consisted of 13 variables which are age, gender, marital status, race, education,
saving percent, spending percent, frequency of out of budget, emergency saving,
retirement saving, risk of stock, risk appetite and cut loss of investment. The full
model consisting of all estimators are significant, (5, n=380) = 48.87, p< 0.001,
stated that the model is able to differentiate the respondent who did invest in share
and did not invest in share. The model described the variance in between 12.1% (Cox
& Snell R-Squared) and 19.2% (Nagelkerke R-Squared) and correctly categorized
80.5% of cases. However, only 4 independent variables are significant to the model
which is gender, race, education level and risk appetite in investing. The strongest
estimator to the model is education which is odd ratio of 3.70 while gender is the
lowest with 0.51.
For the investment in property, logistic regression was also used in order to retrieve
the effect of the independent variable on the probability of the respondent to invest in
property. The model consisted of 13 variables which are age, gender, marital status,
race, education, saving percent, spending percent, frequency of out of budget,
emergency saving, retirement saving, risk of stock, risk appetite and cut loss of
investment. The full model consisting of all estimators are significant, (4, n=378)
= 56.72, p< 0.001, stated that the model is able to differentiate the respondent who
did invest in share and did not invest in share. The model described the variance in
between 13.9% (Cox & Snell R-Squared) and 18.7% (Nagelkerke R-Squared) and
correctly categorized 67.6% of cases. However, only 4 independent variables are
significant to the model which is race, saving percent, spending percent and
retirement saving. The strongest estimator to the model is Chinese with the odd ratio
of 3.10 while retirement saving is the lowest with 0.57.
Investment Behaviour among Gen Y
lxxxv
CHAPTER 5: CONCLUSION AND
RECOMMENDATION
5.0 Introduction
In the previous chapter, the data was analyzed by 3 main types of method of analysis
which are frequency analysis, descriptive analysis and logistic regression analysis. H7,
H10, H12, H13, H14, H16, H17 and H25 are supported by the result of the analysis done.
In this chapter, overall conclusion of the research will be discussed. Moreover,
managerial implication and the limitation of this research will be discussed and based
on the result of the data analysis done in previous chapter. Other than that,
recommendations for the future research are suggested.
5.1 Managerial Implications and Recommendation
In the previous chapter, the data analysis done was concluded that there are 8
hypotheses that are supported by the result of the data analysis. The investment into
share was found that there is a significant relationship with gender, race, education,
and risk appetite respectively while the investment into property was found that there
is a significant relationship with race, percentage of monthly income saved,
percentage of monthly income spent and saving for retirement respectively. Race is
found that there is a relationship with the both investment techniques. Hence, the
managerial implications of these independent variables will be discussed in this

Investment Behaviour among Gen Y
lxxxvi
chapter. Moreover, government and marketers will be given advice based on result of
the analysis done.
5.1.1 Share Investment
5.1.1.1 Gender
Among the demographic characteristics, gender shows a significant
relationship towards the choice of choosing share as an investment method.
This indicates that there is a difference between female and male when comes
to share investment. Male tends to have more than female in choosing share as
an investment method since its show negative coefficient where male as
reference. Government or business marketers may need to take gender factor
into account when promoting share investment especially to male.
5.1.1.2 Race
The result shows that race is statistically significant to the selection of share as
an investment method. This explains that there is a discrepancy among races
in choosing share as an investment. Chinese is the race that most likely to
invest in share since its highest coefficient where Malays is the reference
group. Indians and other races also more likely to invest in share compared
with Malays. Government and marketers should take note on the race factor
when advocating share investment especially to Chinese.
Investment Behaviour among Gen Y
lxxxvii
5.1.1.3 Education
Among the predictor variables, education level shows the most significant
results with a p-value of 0. The result shows that choosing share as an
investment method has positively affected by people‟s education level. Those
people with higher education level tend to invest in share compare with lower
education level. This is because the positive coefficient with the reference
group of lower education level. This will provide an insight for government as
well as finance and business marketers to consider in approaching to people
with higher education level to engage in share market. Finance and business
marketers can target on this group of people by educating them on the
knowledge of share market. While government can consider formulate policy
in ensuring the transparency of the share market in order to attract this bunch
of smart people.
5.1.1.4 Risk Appetite
The outcome of the research shows that risk appetite matters to the choice of
respondents from choosing share investment. It shows that risk appetite is
positively affecting the choice of picking share as an investment method since
the coefficient is positive. The result virtually makes sense as Gen Y considers
share market as a dangerous place to invest. Therefore it requires them to have
a high risk appetite while putting their money into the share market.

Investment Behaviour among Gen Y
lxxxviii
Government should pay attention to this issue and take appropriate action to
ameliorate the bad impression of share market that perceived by Gen Y.
5.1.2 Property Investment
5.1.2.1 Race
The result shows that race is statistically significant to the option of choosing
property investment. This indicates that there is a discrepancy among races in
choosing property as an investment method. The data shows that Chinese is
most likely to invest in property compared with Malays, Indians and others
since Chinese show the highest positive coefficient. Indians and other races
are more likely to invest in property compared with Malays. Hence,
government and marketers should take note on the race factor when
promoting property investment especially to Chinese.
5.1.2.2 Saving Percentage
The output result shows that saving percentage is statistically significant with
a p-value of 0.007. There is a positive relationship between saving percentage
and taking property investment since the coefficient is positive. This
illustrates that Gen Y with higher saving percentage is more likely to invest in
property market. This will give marketer a brief idea in creating suitable
financial product to capture potential Gen Y buyers. Policymakers can also

Investment Behaviour among Gen Y
lxxxix
utilize this information to design better policy. Government can make use of
this information in adjusting fiscal policy.
5.1.2.3 Expenditure Percentage
The output result shows that saving percentage is statistically significant with
a p-value of 0.071. There is a positive relationship between saving percentage
and taking property investment since the coefficient is positive. This
illustrates that Gen Y with higher spending is more likely to invest in property
market. Government may need to take note on this issue; because people with
higher spending and at the same time invest in housing market can suffer from
having too much debt. They could fall behind with their mortgage payment
and facing foreclosure. In order to prevent this from happening, government
should formulate underlying policy to tackle this problem. Finance marketers
should also be prudent screening of borrowers to reduce credit risk.
5.1.2.4 Retirement
Retirement factor has shown a significant relationship towards choosing
property investment. Gen Y who do not preparing for retirement saving is
more likely to make property investment since coefficient is negative where
the reference group is those who do not prepare for retirement saving.
Government is recommended to lower the interest rate to make housing price
more affordable to young people. Moreover, it is essential to strengthen the
underlying policy to prevent certain people from taking advantage by driving
Investment Behaviour among Gen Y
xc
housing prices. Financial marketers are also advised to provide affordable
loan at lower interest and flexi the qualification requirements to young buyers.
5.2 Limitation of Study
There are a few limitation are found is this research. The sample size of 482
respondents in this research is not a large sample size that can illustrate a result which
is more accurate due to constraint of geographic factor that some area in Malaysia is
hard to reach. Insufficient of time and budget are another cause of this limitation.
Moreover, the geographical factor caused the research have to use the convenient
sampling method which distribute the questionnaire to the person who are easier to
reach. The using of this sampling method may cause bias in result. Hence, the result
will be less accuracy.
5.3 Recommendation for Future Research
From the limitation found in the previous, it was found the geographic factor in
Malaysia caused this type of research is difficult to collect data from all population in
Malaysia, a few recommendations were suggested in order to overcome these
limitation in future research.
One of the recommendations is that the researchers are encouraged to use the online
survey to collect the data. Generation Y is the generation that grew up with
technologies and rely more on them in their daily life. Hence, the questionnaires will
be easier to reach to them through the online networking websites such as Facebook,
Twitter, Tumblr and Google+. Moreover, the cost and time spent are less than the
survey through the hardcopy form.
Another recommendation suggested is that the researchers can use multilingual
questionnaires in order to reduce the time taken to interview the respondents who are

Investment Behaviour among Gen Y
xci
preferred to use mother language. Hence, the survey can be done in an efficient way
and then sample size collected will be larger. Other than that, questionnaires can be
designed in a way that the respondents will easier to understand especially for those
who are not highly-educated.
5.4 Conclusion
This research is aimed to investigate the investment behavior among Generation Y.
this research included 2 investment methods as the dependent variables which are
investment to share and investment to property. There are 4 main groups of
independent variables, which are saving behavior, spending behavior, risk behavior
and demographic profile. The saving behavior included percentage of monthly
income saved, saving for emergency and saving for retirement while the spending
behavior included percentage of monthly income spent and frequency of over budget.
The risk behavior included risk of stock market, risk appetite in investment and cut
loss of investment. Hence, there are 13 independent variables and 2 dependent
variables.
After the data was collected through the survey, the data with sample size of 482
respondents was analyzed with descriptive analysis and binary logistic regression
analysis by using the Statistical Package of Social Science (SPSS) software. It was
found that there are 4 independent variables have a significant relationship with share
investment which are gender, race, education, and risk appetite. There are also 4
independent variables have a significant relationship with property investment which
are ace, percentage of monthly income saved, percentage of monthly income spent
and saving for retirement.
Investment Behaviour among Gen Y
xcii
REFERENCES
Armour, S. (2005). Generation Y: They‟ve arrived at work with a new attitude.
USAToday, 6.
Bajtelsmit, V. L., &Bernasek, A. (1996). Why do women invest differently than
men. Financial Counseling and Planning, 7(1), 1-10.
Bakewell, C., & Mitchell, V. W. (2003).Generation Y female consumer decision-
making styles. International Journal of Retail & Distribution
Management, 31(2), 95-106.
Bala, M. Data Analysis Procedures. Online Research Methods Resource. Retrieved
10 October, 2014, from
http://www.celt.mmu.ac.uk/researchmethods/Modules/Data_analysis/
Bearden, W. O., Netemeyer, R. G., & Teel, J. E. (1989).Measurement of consumer
susceptibility to interpersonal influence. Journal of consumer research, 473-
481.
Bohn, H., & Deacon, R. T. (2000).Ownership risk, investment, and the use of natural
resources. American Economic Review, 526-549.
Burns & Bush. (2003). Marketing Research: Online research Applications (4th
Ed.).
New Jersey: Prentice Hall [Electronic version]. 445.
Charles, K. K., Hurst, E., & Roussanov, N. (2007). Conspicuous consumption and
race (No. w13392).National Bureau of Economic Research.
Chen, H., & Volpe, R. P. (2002).Gender differences in personal financial literacy
among college students. Financial Services Review, 11(3), 289-307.

Investment Behaviour among Gen Y
xciii
Collins, S. M. (1991). Saving behavior in ten developing countries. In National
Saving and Economic Performance [Electronic version].(pp. 349-376).
University of Chicago Press.
Croson, R., & Gneezy, U. (2009).Gender differences in preferences. Journal of
Economic literature, 448-474.
Cui, Z. (2000). An Appendix on Savings and Investment. Democracy Realized, 279-
288.
Descriptive and Inferential Statistics. Laerd Statistics. Retrieved 10 October, 2014,
from https://statistics.laerd.com/statistical-guides/descriptive-inferential-
statistics.php
De Vogli, R. (2013). Progress or Collapse: The Crises of Market Greed: The Crises
of Market Greed. Routledge.
DJS Research Ltd. (2005). What is Causal Research?. Market Research World.
Retrieved 10 November, 2014, from
http://www.marketresearchworld.net/index.php?option=com_content&task=vi
ew&id=799&Itemid=64
El-Khattam, W., Hegazy, Y. G., & Salama, M. M. A. (2005).An integrated distributed
generation optimization model for distribution system planning. Power
Systems, IEEE Transactions on, 20(2), 1158-1165.
Embrey, L. C., & Fox, J. J. (1997).Gender differences in the investment decision-
making process. Financial Counseling and Planning, 8(2), 33-40.
Farrell, J. (2011). Demographics of risky investing. Research in Business and
Economics Journal.
Fidelity.com,. (2013). Fidelity Research Finds Gen Y Financial Perspective the
“Most Changed” Following the 2008 Financial Crisis. Retrieved 25
November 2014, from http://www.fidelity.com/inside-fidelity/individual-
investing/fidelity-research-finds-gen-y

Investment Behaviour among Gen Y
xciv
Ganesan, A, S. (2012, May). Consumption, Spending and Investment Behavior of
Malaysia Generation Y. Unpublished master‟s thesis, Universiti Tunku Abdul
Rahman.
Garegnani, P. (1978). Notes on consumption, investment and effective demand:
I. Cambridge Journal of Economics, 335-353.
Getting Ahead: The Financial Challenges for Generations X and Y. (2014,
February).BMO Wealth Institute. Retrieved 10 October, 2014,
fromhttps://www.bmoharris.com/financialadvisors/pdf/ATTBLC69.pdf
Hamm, T. (2014, August 26). The Paradox of Thrift. The Simple Dollar. Retrieved 10
October, 2014, from http://www.thesimpledollar.com/the-paradox-of-thrift-is-
saving-money-bad-for-the-economy/
Harbaugh, R. (2003). China's high savings rates. In Lecture given on the meeting of
The Rise of China Revisited: Perception and Reality. Retrieved 10 October,
2014, fromhttp://www.bus.indiana.edu/riharbau/harbaugh-chuxu.pdf
Hashim, H. (2014). Factors that influence saving habits among Gen Y: Case study on
students of Politeknik Sultan Azlan Shah. Unpublished master‟s thesis,
Universiti Utara Malaysia.
Hatcher, C. B. (2000). Should households establish emergency funds. Financial
Counseling and Planning [Electronic version]. 11(2), 77-83.
Hopkins, W. G. (2008). Quantitative research design. Retrieved 10 November, 2014,
from http://www.sportsci.org/jour/0001/wghdesign.html
Hossain, M. F., & Nasrin, S. (2012). Factors Affecting Selection of Equity Shares:
The Case of Retail Investors in Bangladesh. European Journal of Business
and Management, 4(20), 110-124.
How much do you need to retire? (2014, January 30). Fidelity Viewpoints. Retrieved
10 October, 2014, from https://www.fidelity.com/viewpoints/retirement/8X-
retirement-savings
Investment Behaviour among Gen Y
xcv
Investopedia,. Investment Definition | Investopedia. Retrieved 24 November 2014,
from http://www.investopedia.com/terms/i/investment.asp
Issahaku, H. (2011). Determinants of saving and investment in deprived district
capitals in Ghana: a case study of Nadowli in the Upper West Region of
Ghana. Continental Journal of Social Sciences, 4(1), 1-12.
Jain, D., & Mandot, N. (2012).Impact of demographic factors in Investment Decision
of Investors in Rajasthan. Journal of Arts, Science & Commerce, 3(2), 3.
Johnston, S. (2013). What to Know Before Gifting a Down Payment - US News. US
News & World Report. Retrieved 26 November 2014, from
http://money.usnews.com/money/personal-finance/articles/2013/09/12/what-
to-know-before-gifting-a-down-payment
Jones, L. Y. (1980). Great expectations: America and the baby boom generation.
Kara, A., Kaynak, E., & Kucukemiroglu, O. (1994). Credit card development
strategies for the youth market: the use of conjoint analysis. International
Journal of Bank Marketing, 12(6), 30-36.
Keynes, J. M. (1937). The general theory of employment. The quarterly journal of
economics [Electronic version].209-223.
Kim, D., & Jang, S. (2014). Motivational drivers for status consumption: A study of
Generation Y consumers. International Journal of Hospitality
Management, 38, 39-47.
Kim, H., Knight, D. K., & Crutsinger, C. (2009). Generation Y employees' retail
work experience: The mediating effect of job characteristics. Journal of
Business Research, 62(5), 548-556.
Kotler, P., Burton, S., Deans, K., Brown, L., & Armstrong, G. (2012). Marketing.
Pearson Higher Education AU.
Investment Behaviour among Gen Y
xcvi
Kreinin, M. E. (1959). Factors associated with stock ownership. The Review of
Economics and Statistics, 12-23.
Lau, L. (2014, February 8). Managing Baby Boomers, Gen-X and Gen-Y at Work.
The Star. Retrieved 10 October, 2014, from
http://mystarjob.com/articles/story.aspx?file=/2014/2/8/mystarjob_careerguid
e/14365187&sec=mystarjob_careerguide
Mahalingam, E. (2014). Bridging the generation gap - Business News | The Star
Online.Thestar.com.my. Retrieved 26 November 2014, from
http://www.thestar.com.my/Business/Business-News/2014/08/30/Bridging-
the-generation-gap-Getting-GenY-to-invest-in-the-stock-market/?style=biz
Mair, C. A Cognitive and Social Psychological Perspective on the demand for fashion.
Malhotra, N. K. (2007). Marketing Research 5th ed. Pearson Education International.
Martin, C. A. (2005). From high maintenance to high productivity: What managers
need to know about Generation Y. Industrial and commercial training,37(1),
39-44.
McFerran, B., Dahl, D. W., Fitzsimons, G. J., & Morales, A. C. (2010). I‟ll have what
she‟s having: Effects of social influence and body type on the food choices of
others. Journal of Consumer Research, 36(6), 915-929.
National Association of Realtors®,.(2014). 2014 National Association of Realtors®
Home Buyer and Seller Generational Trends. Retrieved 26 November 2014,
from http://www.realtor.org/sites/default/files/reports/2014/2014-home-buyer-
and-seller-generational-trends-report-full.pdf
Ng, A. (2014). Demographia: Malaysia‟s residential housing market „severely
unaffordable‟ - Business News | The Star Online. Thestar.com.my. Retrieved
26 November 2014, from http://www.thestar.com.my/Business/Business-
News/2014/10/25/A-house-too-far-Demographia-Malaysias-residential-
housing-market-severely-unaffordable/?style=biz

Investment Behaviour among Gen Y
xcvii
O'Curry, S., & Strahilevitz, M. (2001).Probability and mode of acquisition effects on
choices between hedonic and utilitarian options. Marketing Letters,12(1), 37-
49.
Page, C. M. (1992). A history of conspicuous consumption (Master's thesis,
University of Colorado).
Palmer, K. (2014). How the Recession Has Changed Gen Y - US News. US News &
World Report. Retrieved 25 November 2014, from
http://money.usnews.com/money/personal-finance/articles/2014/02/11/how-
the-recession-changed-gen-y
Paul, P. (2001). Getting inside gen Y. American Demographics, 23(9), 42-49.
Population Distribution and Basic Demographic Characteristic Report 2010.(2011).
Department of Statistics Malaysia. Retrieved 10October, 2014, from
http://www.statistics.gov.my/portal/index.php?option=com_content&id=1215
Reilly, P. (2012). Understanding and Teaching Generation Y. In English teaching
forum [Electronic version].Vol. 50, No. 1, pp. 2-11.
Ritzer, G. (1995). Expressing America: A critique of the global credit card society.
Sage Publications.
Roberts, J. A., & Jones, E. (2001).Money attitudes, credit card use, and compulsive
buying among American college students. Journal of Consumer Affairs, 35(2),
213-240.
Roussanov, N., & Savor, P. G. (2012). Status, marriage, and managers' attitudes to
risk (No. w17904). National Bureau of Economic Research
Samuelson, P., & Nordhaus, W. (2010). Economics. New Delhi: Tata McGraw Hill.
Save Now, Play Later: Gen Y‟s retirement Savings Behaviors. (2012, July).Fidelity
Viewspoint. Retrieved 9 November, 2014,
Investment Behaviour among Gen Y
xcviii
fromhttp://workplace.fidelity.com/docs/Gen_Y_Q2_Trends.pdf, Building
Futures (July 2012)
Shiner, C. M.(2013).Making Saving for Retirement a Priority. Sowing the Seeds for
Retirement: Gen X and Gen Y Markets. LIMRA. Retrieved 10 October, 2014,
from https://www.limra.com/research/abstracts/2013/130123-02.aspx
Sibanda, N. (2009, August 18). Quantitative Research - Quantitative Seminar18Aug
09.Victoria University of Wellington. Retrieved 1 October, 2014,
fromhttp://www.victoria.ac.nz/postgradlife/downloads/quantitative%20semina
r18Aug09.pdf
Sullivan, P. (2013). Younger Generations‟ Approach to Investing. Nytimes.com.
Retrieved 25 November 2014, from
http://www.nytimes.com/2013/09/21/your-money/younger-investors-
approach-to-investing.html?pagewanted=all&_r=0
Sunden, A. E., & Surette, B. J. (1998). Gender differences in the allocation of assets
in retirement savings plans. American Economic Review, 207-211.
Sweet, S. A., & Grace-Martin, K. (1999).Data analysis with SPSS. Allyn & Bacon.
Taylor, C. (2012). Generation Yikes: Why young savers are avoiding
stocks. Financial Post. Retrieved 25 November 2014, from
http://business.financialpost.com/2012/01/10/generation-yikes-why-young-
savers-are-avoiding-stocks/
Veblen, T. (2005). The theory of the leisure class; an economic study of institutions.
Aakar Books.
Wealth Generation: The Financial Challenges for Generations X & Y. (2014 Jan).
BMO Wealth Institute. Retrieved 10 October, 2014, from
http://www.bmo.com/pdf/mf/prospectus/en/BMO_WealthInstitute_QR_Q1_2
014_EN_LQ.pdf

Investment Behaviour among Gen Y
xcix
WealthStyle: Gen Y‟s Spending, Saving and Debt Choices (2011). REST Industry
Super. Retrieved 9 November, 2014, from
http://www.rest.com.au/getdoc/7fdc04b9-cf0e-4903-a194-
3f2a7115f037/REST_GenY_Wealth_WhitePaper_FINAL
Weaver, B., & Wuensch, K. L. (2013).SPSS and SAS programs for comparing
Pearson correlations and OLS regression coefficients. Behavior research
methods[Electronic version]. 45(3), 880-895.
Weiler, A. (2014). For 20-something Malaysians, the time to invest is now |
theSundaily.Thesundaily.my. Retrieved 26 November 2014, from
http://www.thesundaily.my/news/1015663
What is Sampling Frame? Also Describe Errors. Master of Business Administration
Official. Retrieved 9 November, 2014, from
http://www.mbaofficial.com/mba-courses/research-methodology/what-is-
sampling-frame-also-describe-errors/
Zhong, L. X., & Xiao, J. J. (1995).Determinants of family bond and stock holdings.

Investment Behaviour among Gen Y
c
APPENDICES

Investment Behaviour among Gen Y
ci
(APPENDIX A)
Dear Sir / Madam,
I would be thankful if you could participate in this survey by filling up this
questionnaire. This questionnaire is conducted as part of a research project of Master
of Business Administration from UTAR.
Please be assured that all information will be treated with the strictest confidentiality
and only the collective data will be analyzed. Thank you for your precious time in
participating in the survey.
SECTION 1 – Demographic Profile (Demografi)
1) Age (Umur) _________
2) Gender (Jantina)
Male (Lelaki) Female (Perempuan)
3) Marital Status (Status Perkahwinan)
Single (Bujang) Married (Berkahwin)
4) Race (Kaum)
1. Malay 2.Chinese 3. Indian 4. Other (Lain-lain)_____
5) Which state are you currently working at?
Di negeri manakah anda sedang bekerja ?
Wilayah Persekutuan KL Sabah
Selangor Sarawak
Perak Johor
Kelantan Terengganu
Perlis Pulau Penang
Pahang Melaka
Kedah Negeri Sembilan
6) What is your highest education attained?
Apakah pendidikan tertinggi yang anda perolehi?

Investment Behaviour among Gen Y
cii
7) What is your employment status?
Apakah status perkerjaan anda?
Employee of Private Sector (Pekerja Swasta)
Government Employee (Kakitangan Kerajaan)
Self-Employed (Bekerja sendiri)
Employer (Majikan)
Housewife (Surirumah)
Others, please specify
____________
Lain lain
_______________________
8) Please indicate your current working position?
Sila nyatakan jawatan perkerjaan semasa anda?
Junior Executive (Eksekutif Junior)
Senior Executive (Eksekutif Senior)
Managerial (Pengurus)
Top Management (Pengurus atasan)
Others, please specify
___________
Lain lain
_______________________
9) Please indicate your Annual Income?
Sila nyatakan pendapadatan tahunan anda?
< RM 12,000
RM 12,001 – RM 24,000
RM 24,001 – RM 36,000
RM 36,001 – RM 48,000
RM48, 000 – RM 60,000
> RM60,000
No Schooling
(Tidak bersekolah)
Primary
(Sek Rendah-UPSR)
Lower Secondary
(Sek Men. PMR)
Secondary
(Sek Men. - SPM)
STPM/Pre-University
(STPM/Pre-U)
Diploma/Vocational/Technical
(Diploma)
Degree
(Ijazah Muda)
Master/PhD
(Pasca graduan)
Other, please specify (Lain-lain, sila nyatakan)
:_____________________

Investment Behaviour among Gen Y
ciii
SECTION 2 – Information Sources (Sumber Informasi)
10) Please select on the following information sources that you prefer to obtain
INFORMATION ON SAVING & INVESTMENT.
Sila pilih pada sumber-sumber maklumat yang berikut yang anda gemar
gunakan untuk mendapatkan maklumat mengenai Penjimatan & Pelaburan.
Please mark your answer with a " ", there can be more than one answer
Relatives & Friends (Saudara mara & rakan-rakan)
Parents & Sibling (Ibubapa & Adik-beradik)
Books & Magazine (Buku & Majalah)
Newspaper (Suratkhabar)
Brochure & Catalogue (Risalah & Katalog)
Blog/Facebook (Blog/Facebook)
Websites/On-line Portal (Laman web)
Radio (Radio)
Television (Televisyen)
Seminar/Talks (Seminar/Ceramah)
SECTION 3 –Spending & Saving Patterns (Corak Perbelanjaan dan Simpanan)
11) Percentage (%) of MONTHLY income that being SAVED (excluding
EPF)? _____________
Berapa peratus (%) daripada pendapatan BULANAN yang sedang disimpan
(tidak termasuk KWSP)? _________________
Your saving channels (Cara Simpanan Anda ) : There can be more than one (Boleh
pilih lebih daripada satu)
Unit Trust (Tabung Amanah)
Saving Accounts (Akaun Simpanan Semasa)
Fixed Deposit (Akaun Simpanan Tetap)
Shares/Security (Saham/Securiti)
Investment linked Insurance
Policy
(Polisi Insuran Pelaburan)

Investment Behaviour among Gen Y
civ
12) Percentage (%) of MONTHLY income that being SPENT?
_____________
Berapakah peratus (%) daripada pendapatan BULANAN yang akan
dibelanjakan? _____________
Your spending (Cara perbelanjaan Anda ) : There can be more than one
(Boleh pilih lebih daripada satu)
Car Loan Installment (Pinjamam Kereta)
Housing Loan Installment (Pinjaman Rumah)
House Rental (Sewa Rumah)
Education Loan or Tuition Fees (Yuran Pendidikan)
Insurance (Ansuran Insuran)
Daily necessities (Barangan Keperluan harian)
Parents Pocket Money (Wang Saku Ibubapa)
Monthly household expenditure
(example utilities bills)
(Perbelanjaan bulanan rumahtangga)-
seperti Bill utility
Transportation (Pengangkutan)
Entertainment & Leisure (Hiburan and Percutian)
13) What are your MAIN PURPOSES of your money saving?
(Please choose not more than 3 answers)
Apakah tujuan UTAMA anda menyimpan wang?
(Pilih tidak melebihi 3 jawapan )
For future Investments (Pelaburan masa depan)
Vacation (Percutian)
Down payment for house (Wang dahuluan untuk pembelian rumah)
Children‟s education (Bayaran pendidikan anak anak)
For my wedding (Simpanan untuk perkahwinan)
Retirement (Persiapan Persaraan)
Emergency & unforeseen
circumstances
(Kecemasan yang tidak djangka)

Investment Behaviour among Gen Y
cv
Start a business (Mulakan perniagaan)
14) Which SAVINGS METHOD do you prefer? (Please choose not more than
3 answers)
Kaedah simpanan manakah anda lebih suka? (Pilih tidak melebihi 3
jawapan)
Saving Account (Akaun Simpanan)
Fixed Deposit (Deposit Tetap)
Shares (Saham)
Unit Trust Fund (Kumpulan Wang Amanah)
Foreign Currency (Mata Wang Asing)
Gold (Emas)
15) How often would you say you spend the money on things that OUT OF
YOUR BUDGET?
Berapa kerap anda akan berkata anda membelanjakan wang ke atas
barangan di luar belanjawan anda?
Often (Selalu) Sometimes (Kadangkala)
Rarely (Jarang) Never (Tidak Pernah)
16) Would you say you are saving and investing AS MUCH MONEY AS
YOU SHOULD?
Adakah anda menyimpan dan melabur wang sebanyak yang anda harus?
As much as I should (Sebanyak mana yang harus)
Should be saving and investing more (Patut menyimpan dan melabur lagi)
I am not sure (Saya tidak pasti)
17) Do you allocate money for emergency?
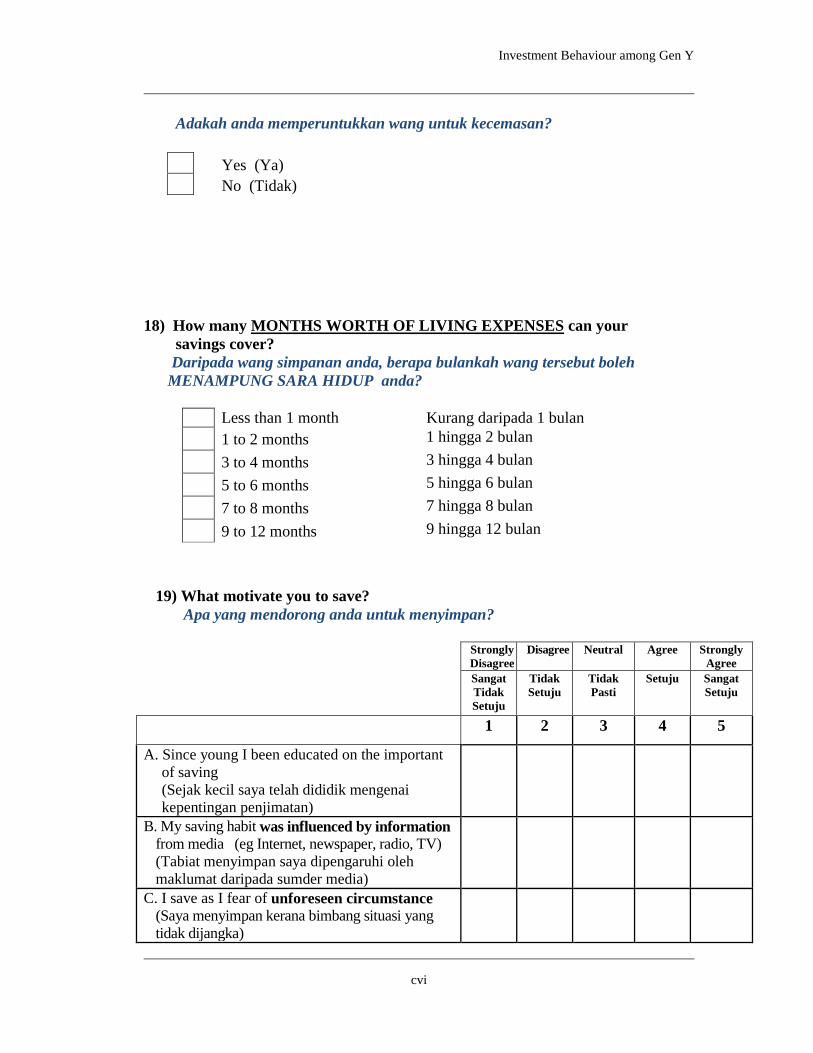
Investment Behaviour among Gen Y
cvi
Adakah anda memperuntukkan wang untuk kecemasan?
Yes (Ya)
No (Tidak)
18) How many MONTHS WORTH OF LIVING EXPENSES can your
savings cover?
Daripada wang simpanan anda, berapa bulankah wang tersebut boleh
MENAMPUNG SARA HIDUP anda?
Less than 1 month Kurang daripada 1 bulan
1 to 2 months 1 hingga 2 bulan
3 to 4 months 3 hingga 4 bulan
5 to 6 months 5 hingga 6 bulan
7 to 8 months 7 hingga 8 bulan
9 to 12 months 9 hingga 12 bulan
19) What motivate you to save?
Apa yang mendorong anda untuk menyimpan?
Strongly
Disagree
Disagree Neutral Agree Strongly
Agree
Sangat
Tidak
Setuju
Tidak
Setuju
Tidak
Pasti
Setuju
Sangat
Setuju
1 2 3 4 5
A. Since young I been educated on the important
of saving
(Sejak kecil saya telah dididik mengenai
kepentingan penjimatan)
B. My saving habit was influenced by information
from media (eg Internet, newspaper, radio, TV)
(Tabiat menyimpan saya dipengaruhi oleh
maklumat daripada sumder media)
C. I save as I fear of unforeseen circumstance
(Saya menyimpan kerana bimbang situasi yang
tidak dijangka)

Investment Behaviour among Gen Y
cvii
D. I save for Medical Emergency
(Saya menyimpan untuk wang kecemasan
perubatan)
E. I save for the benefit of my family financial
future (Saya menyimpan untuk kebaikan masa depan
keluarga)
F. I save to achieve financial freedom
(Saya menyimpan untuk mencapai kebebasan
kewangan)
20) What are the steps to ensure saving is done?
Apakah langkah-langkah untuk memastikan simpanan dilakukan?
Strongly
Disagree
Disagree Neutral Agree Strongly
Agree
1 2 3 4 5
A. I always follow a monthly budget
(Saya sentiasa mematuhi belanjawan bulanan)
B. I prepare a list of required items ahead of time
before shopping
(Saya menyediakan senarai Barangan yang diperlukan
terlebih dahulu sebelum membeli-belah)
C. I assure that I purchased item which are reasonable
price
(Saya memastikan bahawa saya membeli barangan
yang berpatutan harga)
D. I do not spend on item which I do not required
(Saya tidak berbelanja atas barangan yang tidak
diperlukan)
E. I always bring small amount of cash to prevent
impulse
(Saya selalu membawa jumlah wang yang kecil untuk
mengelakkan perbelanjaan spontan)
21) What are the reasons that hinder you from saving money?
Apakah sebab-sebab yang menghalang anda daripada menyimpan wang?

Investment Behaviour among Gen Y
cviii
Low Income (Pendapatan rendah/tidak mencukupi)
Too many fixed expenditures (Terlalu banyak perbelanjaan tetap)
Low interest rate (Kadar faedah yang rendah)
Lack of knowledge on how to save (Kurang pengetahuan tentang bagaimana
untuk menjimatkan)
I would rather spend and enjoy the
best now, and worry about saving
when I‟m much older
(Saya lebih suka membelanja dan
menikmati yang terbaik sekarang dan
berfikir tentang simpanan
kemudiannya)
Others, please specify ____________ Lain lain ______________________
22) Do you worry about DEBT?
Adakah anda bimbang tentang hutang?
Yes (Ya) No (Tidak)
23) Have you STARTED SAVING FOR YOUR RETIREMENT?
Adakah anda mula menyimpan untuk persaraan anda?
Yes (Ya) No (Tidak)
24) Do you worry that you will not have enough money during retirement age?
Adakah anda bimbang bahawa anda tidak akan mempunyai wang yang
mencukupi semasa usia persaraan?
Yes (Ya) No (Tidak)
25) Are you WILLING TO SWITCH TO BANKS which provide free Personal
Financial Management (PFM) advice/services?
Adakah anda bersedia untuk menukar ke bank yang menyediakan
nasihat/perkhidmatan Pengurusan Kewangan Peribadi (PFM)secara
percuma?

Investment Behaviour among Gen Y
cix
Yes (Ya) No (Tidak)
SECTION 4 –Investment Techniques (Teknik Pelaburan)
26) Which investment method do you think is the best ? Please choose not more
than 3 answers
Kaedah pelaburan manakah yang anda fikir merupakan yang terbaik? Sila pilih
tidak melebihi 3 jawapan
Saving and Fixed deposit in bank (Simpanan tetap di bank)
Unit trust (ASM, ASN, Mutual
Fund)
(Unit Amanah Saham)
Shares (Saham)
Investment linked insurance (Polisi Insuran pelaburan)
Buying property (Membeli harta rumah)
Foreign Currency (Matawang asing)
Gold (Emas)
27) Do you have a DIVERSIFY PORTFOLIO in your investment?
Adakah anda mempelbagaikan potfolio pelaburan anda?
Yes (Ya) No (Tidak)
28) When purchasing Share(s) which methods do you prefer?
Apakah cara yang anda pilih untuk pembelian saham?
Online trading (Dagangan secara online)
Go through remisier (Melalui „Wakil Saham‟)
Go through 3rd party (Melalui pihak orang lain)
29) When purchasing Unit Trust, which method do you prefer?
Apakah cara yang anda pilih untuk pembelian unit amanah saham?
Sales agent (Agen Jualan)
Directly from bank (Melalui bank)
Directly from Unit Trust
companies
(Syarikat unit amanah saham)
Online (exp:
Fundsupermart.com)
(Online seperti
Fundsupermart.com)

Investment Behaviour among Gen Y
cx
30) Which type of Unit Trust would you choose? Please choose not more than
3 answers.
Apakah jenis unit amanah yang dipilih oleh anda? Sila pilih tidak melebihi
3 jawapan
Growth Fund (Tabung Pertumbuhan)
Balance Fund (Tabung Seimbang)
Capital Guaranteed Fund (Tabung Jaminan Kapital)
100% bond Fund (Tabuang Bon 100%)
Equity Trust Funds (ETF) (Tabungan Amanah Ekuiti)
31) From whom you will seek for INVESTMENT ADVICES? Please choose
not more than 3 answers
Siapakah yang anda akan mendapatkan nasihan tentang pelaburan ?
Sila pilih tidak melebihi 3 jawapan
Friends (Rakan-rakan)
Family Members (Ahli Keluarga)
Sales agent (Agen Jualan)
Banks (Bank)
Unit trust companies (Syarikat Unit Amanah Saham)
Stock Brokering Firm (Broker saham)
Online resources such as blogs and
forum
(Komuniti Online)
32) What are the factors you will consider before investing? Please choose not
more than 3 answers
Apakah factor-faktor yang anda akan mempertimbangkan sebelum melabur ? Sila
pilih tidak melebihi 3 jawapan
High Interest Returns (Pulangan Faedah yang Tinggi)
Security of investment (Keselamatan pelaburan)
Low Risk (Risiko rendah)
Accredited by agencies (Diiktiraf oleh agensi-agensi)
Recommended by Stock broking
Firm
(Disyorkan oleh Firma broker
Saham)
Recommended by Friends & Family
members
(Disyorkan oleh Kawan & Ahli-ahli
keluarga)
Recommended by Remisier (Disyorkan oleh „Wakil Saham‟)
Others, please specify
_______________
Lain lain
_________________________
33) How do you like to receive information on Investment Schemes/packages

Investment Behaviour among Gen Y
cxi
offer by the banks?
Bagaimana anda ingin menerima maklumat mengenai Skim Pelaburan /
pakej tawaran oleh bank-bank?
SMS (SMS)
Emails (Email)
Newspapers (Surat khabar)
Television (Televisyen)
Telephone (Melalui telefon)
Sales agents (Agent jualan)
Others, please specify
_______________
Lain lain
_________________________
34) Do you think parents should PURCHASE SHARES FOR THEIR
CHILDREN AS A GIFT (such as birthday present)?
Adakah anda fikir ibubapa seharusnya membeli saham untuk anak-anak
mereka sebagai hadiah (seperti hadiah hari jadi)?
Yes (Ya) No (Tidak)
35) Do your PARENTS ENCOURAGE YOU TO INVEST IN STOCK
MARKET?
Adakah ibubapa anda menggalakan anda untuk melabur di pasaran saham?
Yes (Ya) No (Tidak)
36) Do you think investing in stock market is risky?
Adakah anda fikir melabur dalam pasaran saham adalah berisiko?
Yes (Ya) No (Tidak)
37) Do you like investing in shares of Bursa Malaysia?
Adakah anda suka melabur di dalam saham Bursa Malaysia?
Yes (Ya) No (Tidak)
SECTION 5 –Risk Profile (Profil Risiko)
38) Have you ever trade in the futures markets?
Adakah anda pernah melabur in pasaran dagangan hadapan?
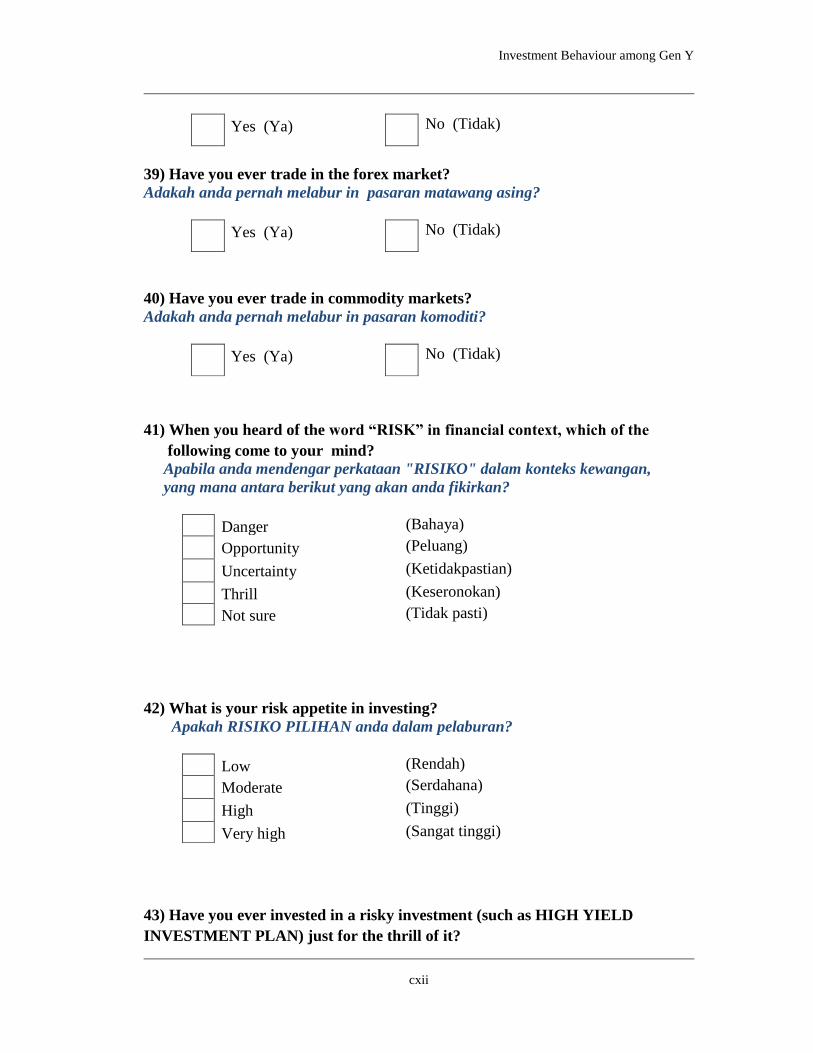
Investment Behaviour among Gen Y
cxii
Yes (Ya) No (Tidak)
39) Have you ever trade in the forex market?
Adakah anda pernah melabur in pasaran matawang asing?
Yes (Ya) No (Tidak)
40) Have you ever trade in commodity markets?
Adakah anda pernah melabur in pasaran komoditi?
Yes (Ya) No (Tidak)
41) When you heard of the word “RISK” in financial context, which of the
following come to your mind?
Apabila anda mendengar perkataan "RISIKO" dalam konteks kewangan,
yang mana antara berikut yang akan anda fikirkan?
Danger (Bahaya)
Opportunity (Peluang)
Uncertainty (Ketidakpastian)
Thrill (Keseronokan)
Not sure (Tidak pasti)
42) What is your risk appetite in investing?
Apakah RISIKO PILIHAN anda dalam pelaburan?
Low (Rendah)
Moderate (Serdahana)
High (Tinggi)
Very high (Sangat tinggi)
43) Have you ever invested in a risky investment (such as HIGH YIELD
INVESTMENT PLAN) just for the thrill of it?

Investment Behaviour among Gen Y
cxiii
Pernahkah anda melabur dalam pelaburan berisiko tinggi (seperti Skim
Perlaburan Pulangan Tinggi) hanya untuk keseronokan?
No (Tidak)
Yes (Sometimes) (Ya -kadangkala)
Yes (Frequently) (Ya -selalu)
44) Investments can go up or down in value. How much is CUT LOSS level
that you practice in your investment?
Nilai pelaburan boleh naik dan turun. Berapa banyak tahap “CUT LOSS”
(tahap sanggupan kerugian) dalam pelaburan anda?
10% of my capital (10% modal)
20% of my capital (20% modal)
30% of my capital (30% modal)
40% of my capital (40% modal)
50% of my capital (50% modal)
No cut loss level (Tiada tahap „cut loss‟)
END OF SURVEY
THANK YOU FOR PARTICIPATING IN THIS SURVEY.
Source: Ganesan, A, S. (2012, May). Consumption, Spending and Investment
Behavior of Malaysia Generation Y. Unpublished master‟s thesis, Universiti Tunku
Abdul Rahman.