investing in new and renewable energy in indonesia · pdf fileinvesting in new and renewable...
TRANSCRIPT

Energy for All Investor Forum Manila, 16 June 2015
INVESTING IN NEW AND RENEWABLE ENERGY IN INDONESIA

THE PARADOX OF INDONESIAN ENERGY - NO LONGER AN OIL EXPORTER
“Proven reserves of petroleum are feared to be exhausted within 10-13 years” -RPJMN 2015-2019, 7 January 2015
1
0
200
400
600
800
1,000
1,200
1,400
1,600
1,800Oil Production
Oil Consumption
Golden age of Indonesian Oil
Thn
Thsd bpd
Source: IEA dan EIA/AS
Import era
Historical changes of Indonesian energy, from Member of OPEC to Oil importer

THE ENERGY SITUATION IN INDONESIA - TARGETING 23% FROM NRE SOURCE
17% increase of new & renewable energy (NRE) in 11 years
Gas 23%
Oil 41%
Coal 30%
NRE 6%
National Energy Mix 2014
Gas 22%
Oil 25%
Coal 30%
NRE 23%
National Energy Mix Target 2025
GasG23%2
E 2014
NR
2
NO NRE RESOURCES INSTALLED CAPACITY (IC) RATIO OF IC/RESOURCES (%)
1 2 3 4 5 = 4/3 1 Hydro 75,000 MW 7,572 MW 10.1 % 2 Geothermal 28,910 MW 1,403.5 MW 4.9 % 3 Biomass 32,654 MW 1,717.9 MW 5.4 % 4 Solar 4.80 kWh/m2/day 48.05 MW - 5 Wind 3 – 6 m/s 1.87 MW - 6 Ocean 49 GW ***) 0.01 MW ****) - 7 Uranium 3,000 MW *) 30 MW **) -
*) Identfied in the Kalan Basin in West Kalimantan **) As a center of research, non-energy
***) Source: National Energy Council ****) BPPT’s Prototype
Indonesia NRE potential could reach more than 200.000 MW. Today, Indonesia has just used 6.8% of the total NRE Potential.

INVESTING ON NRE 2015 – 2025 3
A TOTAL OF 135 BILLION USD INVESTMENT IN
2025
23% NRE
54 Billion USD
39 Billion USD
13 Billion USD
27 Billion USD

Challenges
Access to site condition Availability of logistic facility (ports, road availability) On-site main resources Availability of local construction company and material
Risks Factors
Land/site contractual risk Capital cost over-run: licenses, logistics (transport facilities), construction delay, grid interconnection, etc Technology: life-time and efficiency of module and equipment, grid reliability Financial viability of PLN (long-term PPA) Disasters: flood, fire, earthquake
Tariff
Existing FiT shall be attractive enough for the investor to cover risk and gain expected financial return (ROR > 15%) Technology supply relies on mainly from offshore
Barrier to entry
Capacity and technology transfer: lack of experience of local investor to build and operate utility scale plants needs experience partner Low learning curve, slow market penetration Limited access to most efficient technologies
CHALLENGES FOR INVESTMENTS ON NRE 4
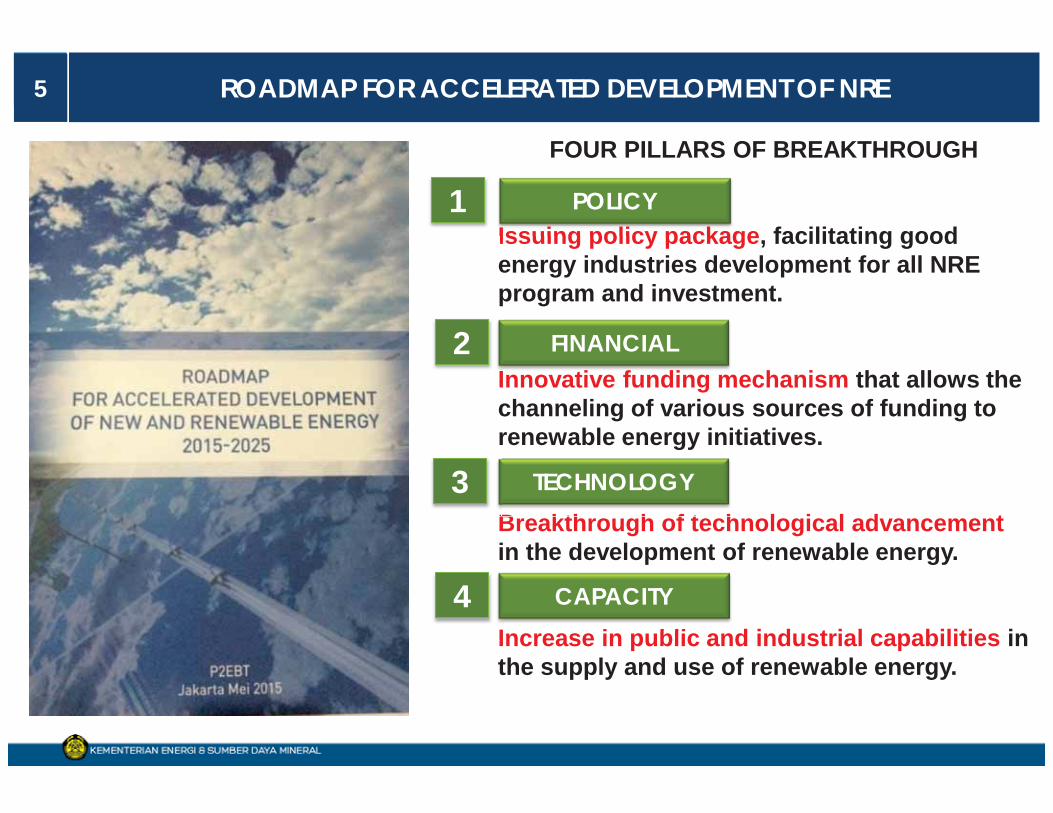
ROADMAP FOR ACCELERATED DEVELOPMENT OF NRE 5
FOUR PILLARS OF BREAKTHROUGH
Issuing policy package, facilitating good energy industries development for all NRE program and investment.
Innovative funding mechanism that allows the channeling of various sources of funding to renewable energy initiatives. Breakthrough of technological advancement in the development of renewable energy. Increase in public and industrial capabilities in the supply and use of renewable energy.
Issuing policy packagPOLICY
nnovative funding mFINANCIAL
B kth h f t hTECHNOLOGY
i bliCAPACITY
1
II2
BB3
II4

6 SETTING UP INVESTMENT CLIMATE FOR NRE DEVELOPMENT
RENEWABLE ENERGY FUND
•One Step Service (OSS) for license application.
•Interlink with sectoral Ministries.
INVESTMENT COORDINATING BOARD
• Fiscal Incentives • Import Duty Facilities • Tax Holiday • Tax Allowance • PPP facilities for NRE
projects: i) PDF; ii) VGF; iii) Guarantee; iv) Infrastructure Fund
MINISTRY OF FINANCE
• Data and Information Update
• Capacity building to stakeholders
• Subsidies and infrastructure support to poor and remote communities
• Policy on Tariff • Facilitation-based planning
and budgeting
MINISTRY OF ENERGY AND MINERAL RESOURCES
Y

7 RENEWABLE ENERGY FUND TO ACCELERATE NRE DEVELOPMENT
Sources of funds (grants, loans, investment)
Intermediary institution RE Projects
funds
funds
funds
funds funds
funds
funds funds
funds
Hydro power plant
Solar power plant
Wind power plant
Others
Solaa
Biomass/ Biogas Fund Management Project Assesment & Monitoring Project Development
REN
EWA
BLE
ENER
GY
FUN
D
Supported by: PT SMI, as SOE in financing PPP infrastructure development Indonesian Infrastructure Guarantee Fund (IIGF), as SOE providing guarantee facility for
infrastructure development

SOME CASES OF INVESTMENT OPPORTUNITIES: 1. BIOENERGY INDUSTRY 2. SOLAR PV INDUSTRY 3. BALI AS CLEAN ENERGY ISLAND

BIOFUEL SUPPLY SCENARIO 2015-2025 8
-
2.0
4.0
6.0
8.0
10.0
12.0
14.0
16.0
18.0
20.0
2015 2019 2025
juta
kilo
liter
TOTAL KEWAJIBAN BIOSOLAR
KAPASITAS PRODUKSI BIOSOLAR
TOTAL KEWAJIBAN BIOETANOL
KAPASITAS PRODUKSI BIOETANOL
4.7
0.9 0.6
7.6 7.6
2.9 2.9
13.9
18.1
8.5
11.0
5.6
till 2019 till 2025
Target of biodiesel production capacity increase 2.0 millions kiloliter (covered from existing production of CPO)
10.5 millions kiloliter (covered from the ratio between CPO and sustainable plants = 50:50)
Total land needed
- 3.3 millions Ha
Target of bioethanol production capacity increase 2.3 millions kiloliter 8.7 millions kiloliter
Total land needed
1.0 millions Ha 3.8 millions Ha
Eksport target: 30%
Total land nee
NYAMPLUNG KEMIRI SUNAN JARAK
Total land needed till 2025:
8.1 mio Ha
dedota a d eedd
SUGARCANE SWITCHGRASS CASSAVA
TOTAL MANDATORY OF BIODIESEL
CURRENT PRODUCTION CAPACITY OF BIODIESEL
TOTAL MANDATORY OF BIOETHANOL
CURRENT PRODUCTION CAPACITY OF BIOETHANOL
Milli
on k
ilo lit
re

STRENGTHENING BIOENERGY VALUE CHAIN AND INDUSTRY 9
FEEDSTOCK PRODUCTION
FEEDSTOCK LOGISTICS
BIOENERGY PRODUCTION
BIOENERGY DISTRIBUTION
BIOENERGY CONSUMPTION
• Planting on degraded lands.
• Diversification of feedstock type based on soil characteristics and localities.
• Collaboration with local people & local government.
• Monitoring of biofuel blend policy application.
• End user target: mining industry, power plant & transportation.
• Ensure OEM (Original Equipment Manufacturer) to support biofuel utilization.
• Encourage automotive industries to support biofuel utilization.
• Encourage proper transport modes with policy and incentives.
• Maintain feedstock price with incentive/subsidy.
• Maintain feedstock supply with Domestic Market Obligation policy.
• Encourage new establishment of bioenergy factories or production capacity increase with incentives.
• Support blending plant technology.
• Develop intermodal network & connectivity.
• Encourage proper bioenergy distribution modes with policy and incentives.
• Increase network capacity.
• Maintain supply with Domestic Market Obligation policy.
APPROACH ON STRENGTHENING BIOENERGY SUPPLY CHAIN AND INDUSTRY Assertiveness of Government policies presents on every stage of bioenergy supply chain
CONNECTIVITY AND FEEDSTOCK PRICE
DEGRADED LAND AND LOCAL COMMUNITY
DISTRIBUTION CAPACITY AND SUPPLY
INDUSTRY AND MARKET
PRODUCTION INCREASE

UTILIZATION OF DEGRADED LAND FOR BIOENERGY DEVELOPMENT 10
12
1.6
3.2
1.4
5.1
1.9
1.2
2.1
1.2
0.9
Millions of ha
0.3 0.0
1.4
0.7
0.1
2.1
0.2 0.6
2.7
3.6
8.6
2.0
7.8
2.3
0.9
0.7 1.4
0.7
2.2
2.6 2.4 1.8
1.6
4.2
Source: Directorate PEPDAS, DG BPDASPS Ministry of Forestry, 2013
0.6
70.181.759
Category Area (ha) %
Slightly Critical 45.878.466
Critical 19.564.909
Very Critical 4.738.384
65,4
27,9
6,8
Total
Definition of Degraded Land: land that is critically assessed based on several parameter conditions including vegetation cover, slope, erosion, and land management conditions. (Dirjen Decrees No. 041 / Kpts / V / 1998)
0 92.6 2.4
1.1111 8
1 6

KATINGAN PULANG PISAU
Target: 50.000 Ha Target: 50.000 Ha
TARGET OF BIOENERGY DEVELOPMENT IN KATINGAN & PULANG PISAU DISTRICT, CENTRAL KALIMANTAN PROVINCE 11
A glance of degraded land in Central Kalimantan

12 INVITING INVESTMENT ON SOLAR PV INDUSTRY
Feed in tariff: USD 25 cent/kwh
Quota: 1 GW per year
Transfer technology policies
Rooftop PV policy program
Regional-based feed in tariff

13 BALI AS CLEAN ENERGY ISLAND
CoE
Bali Hosts Centre of Excellence
Biofuel Utilization
Building Technologies
Hydro Power
Solar PV Bioenergy
Geothermal

14 DEVELOPMENT OF CENTER OF EXCELLENCE highly insulated roof (U=0.50)
solar panels sun pipes photovoltaic panels
air tight envelope
highly insulated timber framed walls (U=0.15)
secure cycle store
waste recycling composting rainwater harvesting
highly insulated floor slab (U=0.15)
triple-glazed windows and doors (U=0.80)
Eco-logic roof tiles
porous paviors
LANDSCAPE ANALYSIS
PROJECT FACILITATION
MONITORING AND EVALUATION
MANUFACTURING AND PROCESSING
SCIENTIFIC
TECHNICAL
TRAINING
TECHNICAL INFORMATION
BASIC SCIENCE
TECHNOLOGY INNOVATION
BUSINESS BUILDING TECHNOLOGIES
INDUSTRIAL TECHNOLOGIES
PARTNERSHIP PROGRAMS
FUELS UTILISATION
CONSERVATION PROGRAMS
SOLAR
WIND
BIOFUEL
HYDRO
GEOTHERMAL
Knowledge Support
• Technical Information
• Landscape Analysis
• Project Facilitation
• Basic Knowledge
Implementation Support
• Partnership Program
• Monitoring and Evaluation
• Manufacture and Processing
• Technology Innovation
Support Team
• Technical
• Training
• Business
• Knowledge
• Coordination center for the development of NRE technology;
• Facilitation of technology implementation at local and industrial level;
• Enhancing energy efficiency and conservation; and
• Boost knowledge on NRE research and development

BUKU STATISTIK THANK YOU