investing for the long run - annualreports.com · properties owned by wpc properties owned by cpa...
TRANSCRIPT

W. P. Carey & Co. LLC Annual Report 2000
Investing for the Long Run

Financial Highlights
I N T H O U S A N D S E X C E P T P E R S H A R E A N D
S T O C K D A T A F O R T H E Y E A R E N D E D D E C E M B E R 3 1 2 0 0 0
Operations
Total Revenues $ 120,251
Net Income $ (9,278)
Funds From Operations (FFO) $ 68,044
Per Share
Funds From Operations (FFO) $ 2.28
Dividend $ 1.69
Pay-Out Ratio 74.1%
Weighted Average Listed Shares Outstanding (Diluted) 29,652,698
A S O F D E C E M B E R 3 1 2 0 0 0
Balance Sheet
Total Assets $ 904,242
Shareholders’ Equity $ 562,073
Stock Data
Price Range (January 1, 2000 thru December 31, 2000) $15.88 - $18.31
Dividend Yield Range 9.23% - 10.64%
Average Daily Trading Volume (January 1, 2000 thru December 31, 2000) 20,778
Number of Shareholders 20,385

W . P . C A R E Y & C O . L L C ( N Y S E : W P C ) I S A
fully integrated investment company and the nation’s dominant net lease firm,
specializing in the triple net leasing of single tenant commercial and industrial
properties throughout the United States. In addition to our extensive real
estate holdings, we manage properties held by a group of companies, includ-
ing the Corporate Property Associates (CPA®) series of private REITs, and
Carey Institutional Properties. Through direct ownership or management, our
portfolio consists of 409 properties in 41 states, the United Kingdom and
France. Assets under ownership and management total over 45,000,000 square
feet and exceed $2.6 billion.
W. P. Carey & Co. shareholders benefit from the steady revenues gener-
ated by our net lease operations and growth from our asset management
business.
Our mission is to provide investors with stable income and consistent
investment performance and to assist our tenant companies in achieving their
business goals.
INV
EST
ING
FOR
TH
E LO
NG
RU
N
Properties owned by WPC
Properties owned by CPA®REITs

2
LLC (WPC). We have successfully com-
bined the advisory business of W. P.
Carey & Co., Inc. with the investment
portfolio of Carey Diversified LLC to
create an entirely new enterprise that
takes diversification to a new level.
& The investment portfolio of net-
leased commercial properties. It con-
tinuously generates stable, gradually rising
rents, with returns moderately leveraged
with non-recourse mortgages and built-
in credit and inflation protections.
& The advisory business. It has been
historically faster growing, generating fees
for providing acquisition and manage-
ment services for four Carey-sponsored
real estate investment trusts (REITs).
Three of these REITs are in the Corpor-
ate Property Associates series, intended
primarily for individual investors (CPA®:10, CPA®:12
and CPA®:14). The fourth, Carey Institutional Proper-
ties (CIP®), is attractive to institutional investors as well.
The new WPC is clearly a winning combination
for our shareholders. It generated an immediate, and
I N L A S T Y E A R ’ S
report we cautioned that prudent asset
allocation required investors to diversify,
putting some of the gains from high-risk
investments into undervalued, income-
oriented investments — the “stay rich”
portion of their portfolios. Those who
heeded our warning were rewarded. The
solid performance of our business during
a year of extreme market volatility bene-
fited our long-term thinking investors.
In addition, last year’s combination of
the growing asset management business
of W. P. Carey & Co., Inc. with the stable
income from Carey Diversified LLC’s
highly diversified portfolio of net leased
properties enhanced our performance.
Today, we are on target with our goal of
creating sustainable long-term value for
our investors and recent market volatility has only
reinforced our core belief in making sound invest-
ments and in the importance of diversification.
That long-term investment philosophy continues
to guide us as the newly formed W. P. Carey & Co.
Dear fellow shareholders
Wm. Polk CareyCHAIRMAN
Gordon F. DuGanPRESIDENT
Francis J. CareyVICE CHAIRMAN

3
continuing, boost in revenue and
cash flow and provided significant
additional diversification. It aligned
the interests of property ownership
and the advisory function within a
single entity. And its increased size,
financial strength and marketplace
presence will make it easier to pur-
sue and finance attractive invest-
ment opportunities that may arise.
Strong Gain in FundsFrom Operations
For the year 2000, the company turned in a solid
earnings performance. While Generally Accepted
Accounting Principles (GAAP) require depreciation
of assets as a non-cash charge against earnings, that
is more appropriate for production equipment and
factories that gradually wear out or become obso-
lete than for commercial real estate, which tends
to become more valuable over time. Funds From
Operations (FFO), a widely used measure of real
estate investment performance, adds depreciation
charges back into earnings. FFO increased 10% to
$2.28 per share in 2000, from
$2.07 per share in 1999. Addition-
ally, the approximate six months
of combined operations showed a
boost in book revenues and FFO.
We prefer, however, in keeping
with our “long-run” investment phi-
losophy, not to measure our per-
formance on a quarter-to-quarter
or even on a year- to-year basis, but rather to view
our results with a longer-term perspective. As a com-
pany that makes long-term investments through real
estate in businesses with solid prospects for future
growth, we seek to create sustainable long-term
shareholder value.
In keeping with our long-standing objective of
providing shareholders with consistent, gradually
rising income, our board of directors increased the
dividend to an annualized rate of $1.69 per share in
2000. As expected, our earnings amply covered dis-
tributions.
Assets at year-end totaled $904,242,000, com-
pared with $856,259,000 a year earlier. Shareholders’
equity rose from $512,600,000 to $562,073,000.
THE NEW WPC IS CLEARLY A
WINNING COMBINATION FOR OUR
SHAREHOLDERS. IT GENERATED
AN IMMEDIATE, AND
CONTINUING, BOOST IN REVENUE
AND CASH FLOW AND PROVIDED
SIGNIFICANT ADDITIONAL
DIVERSIFICATION.

4
Results on GAAP Basis
Due to structural, non-recurring
changes, WPC recorded a net
loss for the year of $9,278,000,
or $.31 per share, on revenues
of $120,251,000. In 1999, net
earnings were $34,039,000, or
$1.33 per share on revenues of
$88,506,000.
This book loss resulted from
several non-cash charges to earn-
ings, of which the largest was a
non-recurring $38 million charge
for the terminated management
contract between Carey Diversi-
fied LLC and W. P. Carey &
Co., Inc. The management contract was terminated
to reflect the new structure of the company as an
internally managed entity after the merger. Other
non-cash charges included nearly $6 million from
the amortization of goodwill and intangible assets
acquired in connection with the merger and just over
$11 million in write-downs of properties and securi-
ties to fair value. Of course,
these book write-downs will
help future earnings growth.
It is noteworthy that with-
out the $11 million write-down,
operating income derived from
real estate operations would
have increased by 5%, reflecting
the strong performance of our
portfolio. After the write-down,
income from real estate opera-
tions was $23,113,000, com-
pared with $32,522,000 in 1999.
The advisory business, exclud-
ing the charges for goodwill,
intangibles and the management
contract termination, contributed
$13,081,000 to operating income in the second half
of the year.
An All-Weather StrategyAs we have noted, we have focused on creating a
business that performs well in good times as well as
bad. During the dot.com boom, our stock suffered.
4.9%
4.5%
4.3%
3.6%
3.2%
3.0%
2.9%
2.9%
2.8%
2.7%
2.5%
2.5%
2.5%
42.3%
$ 4,318,931
3,957,524
3,720,000
3,108,797
2,827,023
2,655,320
2,538,805
2,525,163
2,414,800
2,401,350
2,216,594
2,205,385
2,163,816
$ 37,053,508
Dr Pepper / Seven Up Bottling Group
Detroit Diesel Corp.
American Greetings Corporation
Livho Inc.
Federal Express Corp.
Orbital Sciences Corp.
America West Holdings Corporation
Thermadyne Industries, Inc.
Furon Company
Quebecor Printing USA
AutoZone, Inc.
The Gap, Inc.
Sybron InternationalCorporation
TOTAL
A N N U A L R E N T
% OF TOTALRENT
L E S S E E / L E A S E G U A R A N T O R
Portfolio Diversification byPercentage Rent Contributor
T O P T E N A N T SB A S E D O N O N G O I N G R E N TA L I N C O M E

5
During last year’s record house-
hold net worth decline, our stock
went up 20%. Our funds’ out-
standing performance in all
phases of the business cycle has
demonstrated the effectiveness
of W. P. Carey’s disciplined,
carefully structured “long-run”
approach to investing in net
leased commercial real estate.
We focus on sale-leaseback or
build-to-suit acquisitions involving a long-term net
lease with a single corporate tenant. We are careful to
diversify our holdings geographically and by indus-
try and type of property. We prefer properties that
are both intrinsically attractive and central to the ten-
ant company’s operations. We structure the lease as an
obligation of the parent corporation, and include rent
escalation provisions to help offset inflation and pro-
vide gradually rising returns. Exhaustive analysis by
our independent investment committee often enables
us to discern an improving credit early, thereby
increasing the value of the resulting lease when the
markets recognize the tenant’s financial soundness.
We leverage our properties mod-
erately with property-specific,
non-recourse debt to enhance
our returns.
That approach, applied
through partnerships, REITs
and a limited liability company,
has benefited investors and ten-
ants alike since W. P. Carey
& Co. was founded in 1973.
Tenant companies have used the
sale-leaseback or build-to-suit approach to unlock
the full value of company-owned real estate, to fund
growth or acquisitions, or to reduce debt and clean
up their balance sheets.
WPC, and its predecessor CDC, adopted the
form of a limited liability company primarily because
of the added flexibility it provides in terms of invest-
ments, operations and payouts. Unlike a REIT, which
must distribute 90% of its taxable earnings, an LLC
can retain a larger percentage of its earnings to fund
future growth and build financial strength.
In 2000, WPC readily covered its distributions
with a payout ratio of 74.1%, down from 80.7% in
38.5%
32.1%
15.7%
9.4%
4.4%
Industrial / Manufacturing
Office / Research
Distribution / Warehouse
Retail / Services
Hotel
Portfolio DiversificationB Y P R O P E R T Y T Y P E
B A S E D O N A N N U A L R E N T S

6
the prior year and 83.3% in
1998. This ratio, which we expect
to maintain in the 70% range,
provides an excellent cushion for
our dividend.
Four Macro TrendsMeanwhile, the more difficult
economic and business climate is
affecting WPC’s business in sev-
eral ways. We note four relevant
macro trends.
& A lower interest rate environ-
ment. This is helpful for WPC.
Lower market rates of interest
increase the value of our lease
stream, expand our opportuni-
ties to refinance advantageously,
and reduce our interest expense.
Lower interest rates improve our returns, making our
holdings more valuable over time.
& Falling corporate earnings. Declining profits
eventually lead to layoffs and then a reduction in the
amount of space a company needs. That possibility
has led us to focus heavily on re-
leasing properties early and sell-
ing off some properties where
leases are short in order to
increase average lease duration
and protect our earnings.
& A tighter credit environment.
This benefits WPC directly in
that our tenants cannot readily
find as attractive alternative
financing. Our advisory business
benefits even more because a
tight credit market increases
the demand for sale-leaseback
financing, increasing the flow of
potential investments for our
REITs. The financial strength of
the merged company, coupled
with our favorable track record
among investors, provides us with ready access to
debt or equity capital, conferring a relative advantage
in pursuing attractive acquisitions. While tight credit
markets and shrinking profits could result in defaults,
we are monitoring our WPC and REIT portfolios
R E N TA L I N C O M E
13.3%
10.1%
9.7%
8.5%
7.7%
7.4%
6.9%
6.0%
5.1%
4.8%
4.4%
4.4%
3.1%
2.8%
2.1%
1.3%
1.2%
0.9%
0.1%
$ 11,523,354
8,767,708
8,371,701
7,379,234
6,703,837
6,424,800
5,994,798
5,173,072
4,430,487
4,193,448
3,830,005
3,804,545
2,671,044
2,420,302
1,837,806
1,144,716
1,068,166
769,615
56,520
$ 86,565,158
Machinery / Equipment
Specialty Services
Retail
Electronics
Telecommunications
Consumer Products
Automotive
Paper / Printing
Food / BeverageProcessing
Airfreight / ParcelServices
Medical / Biotech /Pharmaceutical
Hotel
Airline
Technology
Warehousing
Construction
Manufacturing
Supermarkets
Education
Industry DiversificationB A S E D O N A N N U A L R E N T S

7
closely to minimize credit losses.
& A drought in public offer-
ings. In healthier times, the pub-
lic market made tremendous
amounts of money available.
This is no longer the case, creat-
ing opportunity for alternative
providers of capital such as
W. P. Carey.
A Positive OutlookDespite continuing uncertainty over the extent and
duration of the slowdown in the U.S. economy, our
outlook is distinctly positive. We are well positioned
to weather a downturn and to take advantage of
emerging opportunities. We are diversified more than
ever — in property ownership,
revenues and sources of capital.
We have a “long-run” invest-
ment strategy that has proven
itself effective in all parts of the
business cycle, a skilled and dis-
ciplined staff to carry it out, and
a proud legacy of integrity and
success. At the same time, we
are a new company, with a sharp
focus on a bright future of growth, profitability and
rising shareholder value.
We are grateful for, and count upon, the dedi-
cation of our talented staff, the goodwill of our clients
and the strong support of our fellow investors as we
face the challenges of the year ahead.
Three Year Reinvested Return
60
80
100
120
0099989812.3112.3112.311.1
WPC
Peer Group —WPC, NNN, LXP and O
Morgan Stanley REIT Index
NAREIT Index
W M . P O L K C A R E YChairman
F R A N C I S J . C A R E YVice Chairman
G O R D O N F. D U G A NPresident

8
I N R E A L E S T A T E I N V E S T M E N T , A C C E S S T O
capital is critical to success. In today’s challenging economic climate, W. P. Carey & Co.
is positioned to assure that the debt and equity capital needed to invest advantageously
is readily available.
Diversification in its property acquisitions — geographically, by industry and by type
of property — has always been an article of faith at W. P. Carey & Co. Now we have
extended that approach by diversifying our sources of capital as well.
The U.S. economic slowdown, accompanied by tightening of the credit markets, has
generated expanded opportunities to acquire attractive properties at reasonable prices,
while making it harder for many potential buyers to obtain the capital necessary to do so.
By contrast, we can tap a variety of sources for both debt and equity capital.
Equity CapitalWPC has three sources of equity capital. In creating the Corporate Property Associates
(CPA®) series of limited partnerships and real estate investment trusts over the years, for
example, we have raised capital by obtaining private equity investments from individuals.
Such investors remain an important source of the private equity that fuels those REITs’
growth, and in turn, the growth of WPC. Carey Institutional Properties, another REIT, has
received private equity investments from institutions, such as foundations, pension plans
and banks, as well as from individuals. The third source is the public equity markets. WPC,
whose shares are traded on the New York Stock Exchange, can issue stock to raise funds.
The size, financial strength, superior track record and growing public recognition of WPC
facilitates investor acceptance of such issues.
Investment Capital: Diversity = Availability

9
INV
EST
ING
FOR
TH
E LO
NG
RU
N
Debt CapitalWe use two sources of debt capital to fund property acquisitions for WPC and the REITs
that we manage: mortgages and corporate credit facilities.
As every homeowner knows, a mortgage typically provides the bulk of the funds nec-
essary to acquire a property. In net leased commercial real estate, leverage provided by a
mortgage is critical to improving returns and stretching invested equity. We use only non-
recourse mortgages — that is, in case of default, the lender would have recourse only to
the value of the specific property, not to other assets of WPC. To maximize our current
returns while still building some equity in a given property, we typically obtain a
10- to 20-year mortgage that amortizes on a 25-year schedule. The lease payment, or rent,
is structured to provide for periodic rent increases.
Credit lines at the corporate level comprise our other source of debt capital. WPC
recently renewed its credit facility with various lenders of $185 million adding such promi-
nent banks as Wells Fargo, Citizens and National Australia Bank. Our current outstanding
balance on our credit facilities is $110 million. Growing cash flow, infusions of equity and
occasional asset sales enable us to pay down this essentially short-term credit line debt.
Capital Driving GrowthCapital from these sources will enable WPC to invest as much as $400 million in acquir-
ing properties for its own account and for its REITs during the remainder of 2001. WPC
will also take advantage of the current low interest rate environment to refinance some
properties, thereby improving returns and freeing up capital.
WPC’s capital strength, careful attention to underwriting and lease-structuring, and
conservative approach to borrowing result in a stock that is underleveraged and gener-
ates more than enough cash to cover its distributions. The price stability and consistent
returns that this approach affords make WPC stock a particularly attractive long-term
investment in a time of economic uncertainty.
CAPITAL FROM THESE
SOURCES WILL ENABLE WPC
TO INVEST AS MUCH AS
$400 MILLION IN ACQUIRING
PROPERTIES FOR ITS
OWN ACCOUNT AND FOR ITS
REITS DURING THE
REMAINDER OF 2001.
10
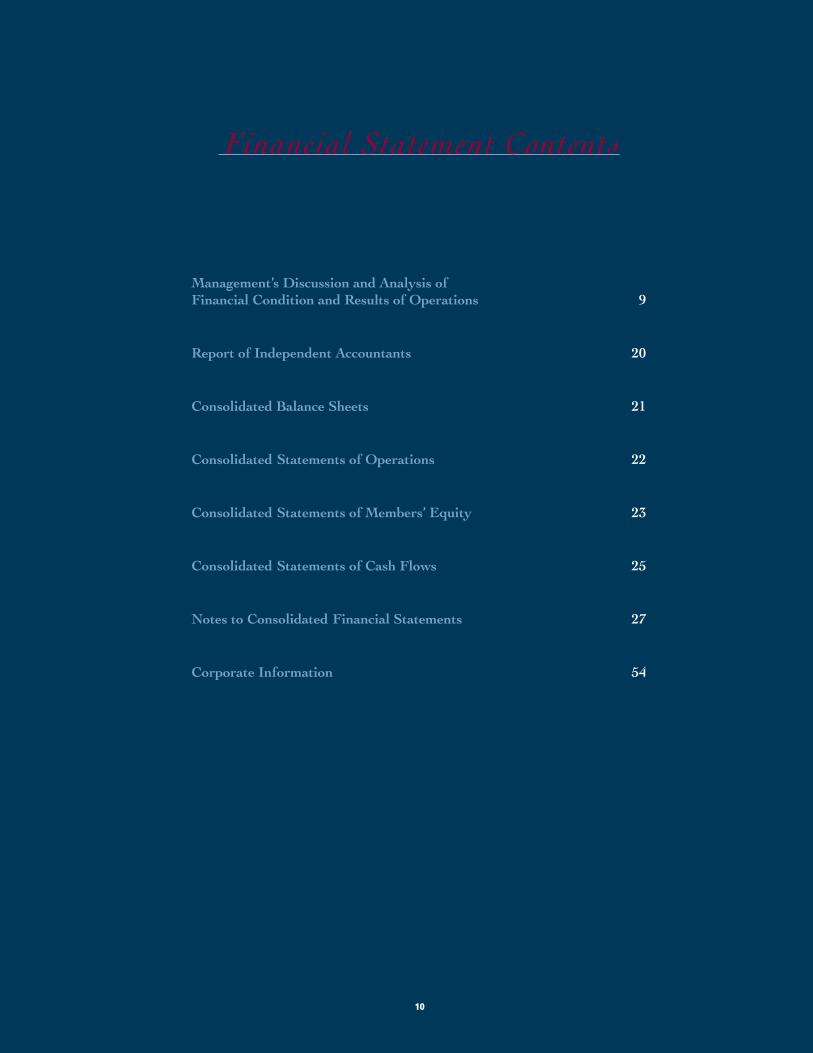
Management’s Discussion and Analysis of Financial Condition and Results of Operations 9
Report of Independent Accountants 20
Consolidated Balance Sheets 21
Consolidated Statements of Operations 22
Consolidated Statements of Members’ Equity 23
Consolidated Statements of Cash Flows 25
Notes to Consolidated Financial Statements 27
Corporate Information 54
Financial Statement Contents
Management’s Discussion and Analysis ofFinancial Condition and Results of Operations
Dollar amounts in thousands
Overview
The following discussion and analysis of financial condition and results of operations of W. P. Carey & Co. LLC
(“WPC”) (formerly Carey Diversified, LLC) should be read in conjunction with the consolidated financial state-
ments and notes thereto for the year ended December 31, 2000. The following discussion includes forward look-
ing statements. Forward looking statements, which are based on certain assumptions, describe future plans, strategies
and expectations of WPC. Such statements involve known and unknown risks, uncertainties and other factors that
may cause the actual results, performance or achievement of WPC to be materially different from the results of
operations or plan expressed or implied by such forward looking statements. Accordingly, such information should
not be regarded as representations by WPC that the results or conditions described in such statements or objec-
tives and plans of WPC will be achieved.
Effective June 29, 2000, Carey Diversified LLC acquired the net lease real estate management operations of
Carey Management LLC by issuing 8,000,000 shares, and changed its name to W. P. Carey & Co. LLC. As a result
of acquiring the operations of Carey Management, WPC acquired its workforce of approximately 95 employees,
assumed the advisory contracts with four affiliated real estate investment trusts (“REITs”) and terminated the man-
agement contract between Carey Diversified LLC and Carey Management LLC. Management believes that the
acquisition will provide WPC with several potential advantages including, but not limited to, increased diversifi-
cation of revenue sources, reduced operating expenses through the elimination of management fees formerly paid
to Carey Management, potentially increased earnings growth rate, the ability to offer a full range of financial options
to corporate property owners and lessees, a strengthened credit profile and improved access to capital markets.
WPC has substantially increased its asset base without increasing its long-term debt, and the acquisition may pro-
vide WPC the ability to increase its debt capacity, if necessary. The net income of the management business of
Carey Management has historically grown at a faster rate than the net income of WPC’s real estate operations, and
Management believes that the prospects for an increase in the growth rate of earnings will be improved. Because
the capital markets have indicated a strong preference for internally managed real estate companies, the ability of
WPC to raise additional equity capital in the public markets should be enhanced.
11

Overview (continued)
Public business enterprises are required to report financial and descriptive information about their reportable
operating segments. WPC’s management evaluates the performance of its portfolio as a whole, but allocates its
resources between two operating segments: real estate operations with domestic and international investments and
management services.
Results of Operations
Year Ended December 31, 2000 Compared to Year Ended December 31, 1999
WPC reported a net loss of $9,278 and net income of $34,039 for the years ended December 31, 2000 and 1999,
respectively. The results for 2000 and 1999 are not fully comparable, primarily due to the acquisition of the oper-
ations of Carey Management. WPC incurred a charge of $38,000 on the termination of its management contract
with Carey Management. Management believes that the termination of the management contract will provide sub-
stantial benefit to WPC.
In addition to the $38,000 fair value attributed to the terminated management contract, a substantial portion
of the other net assets acquired consists of intangible assets including goodwill. Intangible assets and goodwill are
amortized over their estimated useful lives, and such amortization, a non-cash charge, was $5,958 in the current
year. Results for 2000 include approximately six months of operations for the management services business. Prior
to the acquisition, real estate operations contributed substantially all of WPC’s income. Excluding the charges
for amortization and the writeoff of the management contract, the management business segment contributed
income of $13,081.
Income from real estate operations provided operating income (income before gains and losses on sales and
extraordinary items) of $23,113 in 2000 as compared with $32,522 in 1999. The results for 2000 and 1999 include
charges of $11,047 and $5,988, respectively, for writedowns of assets to estimated fair value. Excluding the effect
of the writedowns, operating income from real estate operations for 2000 would have reflected a decrease of $4,350.
The decrease in real estate operating income was primarily due to increases in interest expense and depreciation
offset by increases in lease revenues (rental income and interest income from direct financing leases) and other income.
The increase in interest expense of $7,731 was primarily due to mortgage financing obtained in 1999 and a
change in the use of amounts drawn from the credit line. Limited recourse financings included a new loan on the
America West property, refinancings of the Gap, Inc. and Orbital Sciences Corporation properties and obtaining
mortgage debt in connection with the December 1999 purchase of the Bell South property. Interest expense from
the line of credit increased because a substantial portion of the interest incurred in 1999 was on borrowings used
12

Results of Operations (continued)
to fund construction of the America West and Federal Express projects, and was capitalized rather than expensed
in accordance with generally accepted accounting principles. Subsequent to the completion of the projects, inter-
est costs were expensed. The credit facility is a variable rate obligation and also was affected by increases in inter-
est rates during 2000.
The increase in depreciation of $3,051 was due to the completion of build-to-suit projects on properties leased to
America West Airlines and Federal Express, the acquisition of the Bell South property, the expansion of the Orbital
Sciences property and the renovation of a property in Moorestown, New Jersey in 1999 now leased to Cendant.
The increase in lease revenues was primarily due to the completion of build-to-suit projects with Federal Express
Corporation in February 2000 and America West Holdings Corp. in May 1999, new leases with Cendant Operations,
Inc. and Bell South Telecommunications, Inc. in May and December 1999, respectively, and rent increases on var-
ious leases in 2000 and 1999. Lease revenue increases were partially offset by the sale of fourteen properties in 2000,
the sales of the KSG, Inc. and Hotel Corporation of America properties in 1999 pursuant to the exercise of purchase
options by the lessees, and the termination of the Copeland Beverage Group, Inc. lease in December 1999. As a
result of financial difficulties, Copeland was placed in receivership and subsequently liquidated. Annual rent from
the Copeland lease was $1,800. WPC drew $1,800 from a letter of credit that had been provided by Copeland which
was used to cover property expenses for the period subsequent to the lease termination.
Other income in the accompanying consolidated statements consists of income from real estate operations
other than lease revenues. Other income increased by $1,418 in 2000. These items include, but are not limited to,
bankruptcy distributions on claims against former tenants and termination agreements. The increase in other income
in 2000 included bankruptcy distributions received from a former lessee and termination consideration. Hotel oper-
ating income (hotel revenues less hotel expenses) increased from $1,113 to $1,324 primarily due to increases in
occupancy and average room rates of 4%.
Income from equity investments increased by $996 due to the improved performance of the operating part-
nership of Meristar Hospitality Corporation, a publicly traded real estate investment trust, and an increase in income
from the investment in a net lease with Checkfree Holdings Corp., which is owned with an affiliate. The increase
in income from the Checkfree investment was due to recognition of a full year’s revenues on the property leased to
Checkfree which was purchased in June 1999. Rent on the Checkfree lease also increased in connection with the
completion of an expansion in 2000.
General and administrative expenses increased due to the acquisition of the management operations, includ-
ing the personnel and office facilities necessary to render advisory and administrative services to the REITs. The
13
Results of Operations (continued)
general and administrative expense of the real estate operations segment reflected a decrease. Management and
performance fee expenses for periods subsequent to the merger have been terminated effective June 29, 2000,
resulting in a decrease in property expenses for the year ended December 31, 2000. The provision for income taxes
increased as a result of forming a wholly-owned subsidiary that is responsible for management operations and
all administrative functions. Formation of the taxable subsidiary allows the Company to maintain its status as a
publicly-traded partnership.
Management monitors its real estate assets and securities on an on-going basis. In the event of certain cir-
cumstances, including, but not limited to, lease terminations, vacating of a property by a lessee or nonpayment of
rent or interest, Management evaluates whether the fair value of an asset is less than its carrying value. In these
instances, when the estimate of fair value is less than the carrying value, a writedown is recorded for the difference.
In 2000 and 1999, WPC recognized writedowns of $11,047 and $5,988, respectively.
Earnings from the management business segment include transaction-based revenues that are directly related
to the acquisition activity of the CPA® REITs. The ability of a CPA® REIT to acquire interests in real estate depends
on its ability to raise capital and to leverage its properties with limited recourse mortgage debt. Accordingly, the
growth of the management business segment will be affected by the amount of equity capital raised by CPA® REIT
acquisition activity in 2001. Management expects the level of acquisition activity on behalf of the CPA® REITs
for 2001 to approximate the annualized rate for 2000. WPC is in the process of preparing a “best efforts” public
offering for a new CPA® REIT which is expected to commence before the end of 2001. An on-going “best efforts”
offering of Corporate Property Associates 14 Incorporated is scheduled to conclude in the third quarter of 2001.
Year Ended December 31, 1999 Compared to Year Ended December 31, 1998
Income before the effects of non-recurring items consisting of the noncash writedown of investments, gains from
sales and extraordinary items increased by $437 or 1% in 1999 as compared to 1998. This increase is primarily due
to the growth of lease revenues, which was partially offset by increases in depreciation, interest and general and
administrative expenses. Net income for the twelve months ended December 31, 1999 decreased by $4,425 as com-
pared to 1998 primarily due to a noncash writedown to fair value of $4,830 of WPC’s investment in Meristar
Hospitality. The noncash writedown was recognized because of continued weakness in the public market’s valua-
tion of equity securities of real estate investment companies, including Meristar. The carrying value of the equity
investment in Meristar subsequent to the writedown approximates WPC’s pro rata share of Meristar at Meristar’s
reported net asset value.
14
Results of Operations (continued)
Lease revenues, including rental income from operating leases and interest income from financing leases,
increased by approximately $3,300 for the year ended December 31, 1999 as compared to 1998. This increase rep-
resents the excess of additional lease revenues of approximately $6,000 from completed build-to-suit construction
projects and the effect of property acquisitions, over revenue decreases as compared with 1998 of approximately
$2,700 due to sales of properties and lease terminations. During 1999, WPC completed construction of a new
$37,000 office building for America West in which WPC owns an approximate 75% interest, a $3,000 renovation
for property leased to Cendant and a $1,800 expansion on the Orbital Sciences property. Annual rent on the America
West and Cendant properties is $2,539 and $1,000, respectively. Additional annual rent from the Orbital Science
expansion is $234. Approximately $2,500 of the increase in lease revenues was realized as a result of recognizing
a full year’s rent in 1999 on properties acquired in 1998, including a property leased to Eagle Hardware and Garden
Inc., a portfolio of seven properties acquired from J.A. Billipp Development Corporation and three properties
located in France.
Decreases in lease revenues in 1999 of approximately $2,700 resulted from the scheduled expiration of a lease
with Hughes Markets in April 1998 and the sale of properties. Approximately $1,300 of the decrease in lease rev-
enues was due to the termination of the lease with Hughes Markets for a dairy processing plant in Los Angeles,
California. On April 30, 1998, WPC’s two-year extension term with Hughes Markets at above-market rental rates
ended, and the new lease for the property with Copeland became effective. Annual rent of $1,800 from the lease
with Copeland approximated the rent in effect before commencement of Hughes’ two-year extension term. In April
1998, WPC received a final rent payment of $3,500 from Hughes. Loss of revenues from the sale of properties in
1999 and 1998 account for approximately $1,400 of the decrease in lease revenues. These properties were sold as
a result of the exercise of purchase options by the lessees of the properties.
Hotel operating income (hotel revenues less hotel expenses) decreased from $1,333 to $1,113 primarily due to
a transfer of hotel operations in 1998. Income from hotels in 1998 included one month of operating income from a
hotel in Livonia, Michigan, whose operations were transferred to an affiliated entity on February 1, 1998. Operating
income from the hotels located in Alpena and Petoskey, Michigan was substantially unchanged.
Other income increased by $250, primarily due to the receipt of payments in connection with the settlement
of a dispute with the former tenant of a property in Broomfield, Colorado. Pursuant to the settlement, WPC received
$700 of unpaid rents, interest and penalties due from the former tenant. WPC also received proceeds of $265 from
the settlement of a bankruptcy by a former tenant. Income from equity investments increased by 3% in 1999 as
compared to 1998.
15

Results of Operations (continued)
Interest expense increased primarily due to an increase in debt balances for the acquisition of additional prop-
erties. Total debt, consisting of limited recourse mortgage debt and advances on the revolving line of credit, increased
from approximately $271,000 in 1998 to $317,000 in 1999. The increase in interest expense from additional bor-
rowings was substantially offset by the decrease in expense from lower principal balances on amortizing mortgage
loans. WPC used draws on its $185,000 revolving line of credit to fund construction costs and acquisitions and to
refinance high rate debt on a transitional basis. Advances made on the revolving line of credit during 1999 were
repaid from the proceeds of limited recourse mortgage loans and property sales.
Depreciation and amortization expense increased by $2,786 in 1999 as compared to 1998 primarily due to the
acquisition of properties in 1998 and the completion of construction on properties leased to America West and
Cendant in 1999.
General and administrative expenses increased by approximately $1,051 in 1999 as compared to 1998 pri-
marily due to increases in professional fees. Professional fees increased due to the implementation of a new inte-
grated accounting and asset management system and costs related to the evaluation and remediation of Year 2000
issues. A portion of the increase in professional fees was due to efforts to improve WPC’s tax reporting capabili-
ties to shareholders. WPC revised its systems and procedures to provide accelerated reporting of tax information
to shareholders and engaged an external processing agent to provide shareholders with internet access to their tax
information. State and local income taxes have increased due to the growth of WPC’s portfolio of properties.
Because of the long-term nature of WPC’s net leases, inflation and changing prices should not unfavorably
affect revenues and net income or have an impact on the continuing operations of WPC’s properties. WPC’s leases
usually have rent increases based on the consumer price index and other similar indexes and may have caps on
such increases, or sales overrides, which should increase operating revenues in the future. The moderate increases
in the consumer price index over the past several years will affect the rate of such future rent increases. Management
believes that hotel operations will not be significantly impacted by changing prices.
Financial Condition
WPC’s primary sources of capital to meet its short-term and long-term needs are cash generated from operations,
limited recourse mortgage loans, unsecured indebtedness and the issuance of additional equity securities. During
2000, WPC issued 8,000,000 shares in connection with acquiring the business operations of Carey Management.
WPC assesses its ability to obtain debt financing on an ongoing basis.
16

Financial Condition (continued)
Cash flows from operations and distributions from equity investments for the year ended December 31, 2000
of $60,000 were sufficient to fund dividends to shareholders of $49,957 and distributions to minority interests of
$1,321. Cash flow from operations for 2000 is not fully representative of future cash flows. Cash flows for 2000
only reflect six months of operations for the management business. A full year’s cash flow from the management
segment is expected to substantially benefit cash flow from operations. In connection with the acquisition, WPC
also acquired Carey Management’s minority partner interest in the CPA® Partnerships. Annual distributions relat-
ing to Carey Management’s minority partner interest had been approximately $2,045. Cash flows from operations
are expected to increase as a result of the expected growth of the management business segment. Cash flow from
operations should continue to fully fund distributions.
Cash flow from real estate operations will benefit from the completion of the build-to-suit project in October
2000 for a property leased to Bouygues Télécom, S.A. in France which will provide annual cash flow of $445.
Expansions of properties leased to Sprint and AT&T Corporation being funded by WPC in consideration for
increases in rent and extensions of remaining lease terms are expected to be completed in April 2001 and July 2001,
respectively, and will provide additional annual cash flow of approximately $600. In connection with the sale of its
60% interest in the Federal Express properties in Colliersville, Tennessee to an affiliate and the concurrent place-
ment of limited recourse mortgage debt on the properties, annual cash flow will decrease by $5,091. Solely as a
result of using $60,000 from the proceeds from the sale and the concurrent placement of debt on the Federal Express
properties, annual interest on the line of credit will decrease by up to $4,500. Additionally, the sale of the Federal
Express properties has reduced the concentration of risk in a single lessee. Prior to the sale of this interest, Federal
Express represented more than 7% of lease revenues and total assets.
WPC’s investing activities in 2000 primarily consisted of funding construction costs in connection with the
completion of build-to-suit projects for the Federal Express and Bouygues Télécom properties of $18,417, the pur-
chase of 11 acres of land adjacent to an existing WPC property in Broomfield, Colorado for $922 in cash and $778
in stock, and capital improvements to existing properties of $2,078. WPC also completed a buyout of the joint ven-
ture partner in the Cendant property for $527. WPC is seeking approvals which will allow WPC the ability to rede-
velop the existing property and adjacent land in Broomfield. WPC also has commenced a commercial redevelopment
of its property in Los Angeles formerly leased to Copeland. Estimated costs for the Broomfield and Copeland pro-
jects are $115,000. Management is still evaluating its financing alternatives for these construction costs but a signi-
ficant portion could be drawn from its line of credit to fund such costs, if necessary.
17

Financial Condition (continued)
During 2000, WPC sold (a) its interest in Federal Express for $42,287, (b) fourteen small properties for $3,007
and (c) 18,540 shares of common stock of Titan Corporation for $324. WPC had previously converted warrants it
received in 1991 in connection with structuring its net lease with Titan Corporation to Titan common stock. WPC
continues to assess its real estate portfolio, and will continue to sell smaller properties when Management believes
sufficient value can be received.
In addition to meeting its commitment to pay dividends to shareholders, WPC’s financing activities in 2000
included paying down the line of credit by $35,000, using $13,944 to purchase back WPC stock on the open mar-
ket at share prices ranging from $15.75 to $18.00 and making distributions to minority interests of $1,321. WPC
obtained limited recourse mortgage financing on the Cendant property and the Bouygues Télécom property of
$6,000 and $10,397, respectively. WPC uses limited recourse mortgage notes for a substantial portion of its long-
term financing strategy because the cost of this financing is attractive and the exposure of its assets is limited to the
collateral designated for each loan.
WPC maintains a revolving line of credit that provides for borrowings of up to $185,000. Advances from the
line of credit bear interest at an annual rate indexed to the LIBOR Rate. The revolving credit agreement has finan-
cial covenants that require the Company to (i) maintain minimum equity value of $400,000 plus 85% of amounts
received by the Company as proceeds from the issuance of equity interests and (ii) meet or exceed certain operat-
ing and coverage ratios. Such operating and coverage ratios include, but are not limited to, (a) ratios of earnings
before interest, taxes, depreciation and amortization to fixed charges for interest and (b) ratios of net operating
income, as defined, to interest expense. The Company is in compliance with these covenants. The current revolv-
ing line of credit had initially been scheduled to mature in March 2001 and has been extended to March 2004.
In the case of limited recourse mortgage financing that does not fully amortize over its term or is currently due,
WPC is responsible for the balloon payment only to the extent of its interest in the encumbered property because
the holder has recourse only to the collateral. In the event that balloon payments come due, WPC may seek to refi-
nance the loans, restructure the debt with the existing lenders or evaluate its ability to satisfy the obligation from
its existing resources including its revolving line of credit, to satisfy the mortgage debt. To the extent the remain-
ing initial lease term on any property remains in place for a number of years beyond the balloon payment date,
WPC believes that the ability to refinance balloon payment obligations is enhanced. WPC also evaluates all its out-
standing loans for opportunities to refinance debt at lower interest rates that may occur as a result of decreasing
interest rates or improvements in the credit rating of tenants. Scheduled balloon payments on limited recourse mort-
gage notes approximate $12,981 in 2001 and $2,333 in 2002.
18

Financial Condition (continued)
WPC expects to meet its capital requirements to fund future property acquisitions, construction costs on build-
to-suit transactions, capital expenditures on existing properties and scheduled debt maturities through long-term
secured and unsecured indebtedness and the possible issuance of additional equity securities. WPC’s remaining
commitments on the expansions of the Sprint and AT&T properties total $4,931. Commitments for capital expen-
ditures on the Livonia, Alpena and Petoskey, Michigan hotels are currently estimated to be approximately $801.
In connection with the purchase of many of its properties, WPC required the sellers to perform environmental
reviews. Management believes, based on the results of such reviews, that WPC’s properties were in substantial com-
pliance with Federal and state environmental statutes at the time the properties were acquired. However, portions
of certain properties have been subject to some degree of contamination, principally in connection with leakage from
underground storage tanks, surface spills or historical on-site activities. In most instances where contamination has
been identified, tenants are actively engaged in the remediation process and addressing identified conditions. Tenants
are generally subject to environmental statutes and regulations regarding the discharge of hazardous materials and
any related remediation obligations. In addition, WPC’s leases generally require tenants to indemnify WPC from all
liabilities and losses related to the leased properties with provisions of such indemnification specifically addressing
environmental matters. The leases generally include provisions that allow for periodic environmental assessments,
paid for by the tenant, and allow WPC to extend leases until such time as a tenant has satisfied its environmental
obligations. Certain of the leases allow WPC to require financial assurances from tenants such as performance bonds
or letters of credit if the costs of remediating environmental conditions are, in the estimation of WPC, in excess of
specified amounts. Accordingly, Management believes that the ultimate resolution of environmental matters will not
have a material adverse effect on WPC’s financial condition, liquidity or results of operations.
19
20
Report of Independent Accountants
To the Board of Directors and Shareholders of
W. P. Carey & Co. LLC and Subsidiaries:
In our opinion, the accompanying consolidated balance sheets and the related consolidated statements of opera-
tions, members’ equity and cash flows present fairly, in all material respects, the financial position of W. P. Carey &
Co. LLC and its Subsidiaries at December 31, 2000 and 1999, and the results of their operations and their cash
flows for each of the three years in the period ended December 31, 2000 in conformity with accounting principles
generally accepted in the United States of America. These financial statements are the responsibility of the
Company’s management; our responsibility is to express an opinion on these financial statements based on our
audits. We conducted our audits of these statements in accordance with auditing standards generally accepted in
the United States of America, which require that we plan and perform the audit to obtain reasonable assurance
about whether the financial statements are free of material misstatement. An audit includes examining, on a test
basis, evidence supporting the amounts and disclosures in the financial statements, assessing the accounting prin-
ciples used and significant estimates made by management, and evaluating the overall financial statement presen-
tation. We believe that our audits provide a reasonable basis for our opinion.
New York, New York
February 22, 2001

21
W. P. Carey & Co. LLC
Consolidated Balance SheetsIn thousands except share amounts
D E C E M B E R 3 1
2000 1999
AssetsReal estate leased to others:
Accounted for under the operating method, net of accumulated depreciation of $24,159 and $16,455 at December 31, 2000 and 1999 $414,006 $425,421
Net investment in direct financing leases 287,876 295,556
Real estate leased to others 701,882 720,977Operating real estate, net of accumulated depreciation of $1,442 and
$832 at December 31, 2000 and 1999 6,502 6,753Real estate under construction and redevelopment 13,359 69,176Equity investments 47,224 32,167Assets held for sale 2,573 3,091Cash and cash equivalents 10,165 2,297Due from affiliates 7,945 —Intangible assets, net of accumulated amortization of $5,958 at
December 31, 2000 94,183 —Other assets, net of accumulated amortization of $1,971 and $1,125
at December 31, 2000 and 1999 and reserve for uncollected rent of $2,207 and $1,839 at December 31, 2000 and 1999 20,409 21,798
Total assets $904,242 $856,259
Liabilities, Minority Interest and Members’ EquityLiabilities:Mortgage notes payable $196,094 $188,248Notes payable 94,066 129,103Accrued interest 2,655 874Dividends payable 14,182 10,718Due to affiliates 15,308 7,227Accrued taxes 2,688 1,205Other liabilities 16,374 9,420
Total liabilities 341,367 346,795
Minority interest 802 (3,136)Commitments and contingenciesMembers’ Equity:Listed shares, no par value, 33,604,716 and 25,833,603
shares issued and outstanding at December 31, 2000 and 1999 644,749 526,130Distributions in excess of accumulated earnings (74,260) (11,560)Unearned compensation (5,291) —Accumulated other comprehensive loss (3,125) (910)
562,073 513,660Less, shares in treasury at cost, 62,300 shares at December 31, 1999 — (1,060)
Total members’ equity 562,073 512,600
Total liabilities, minority interest and members’ equity $904,242 $856,259
The accompanying notes are an integral part of the consolidated financial statements.
22
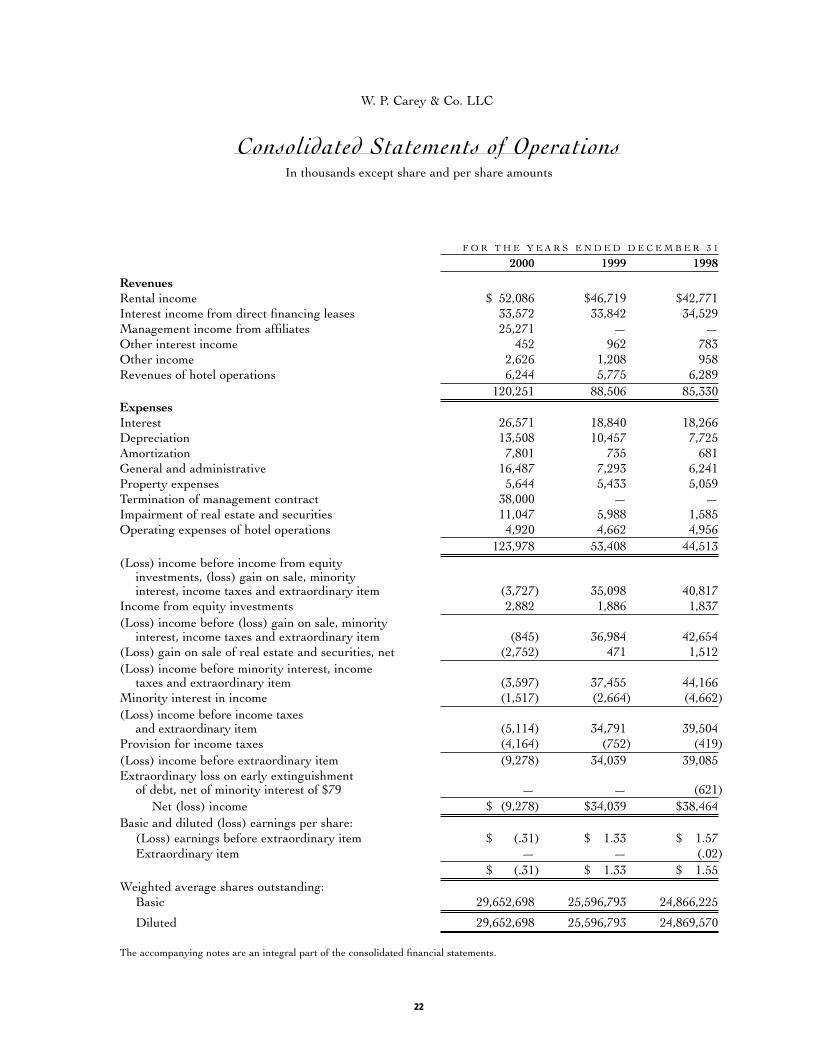
W. P. Carey & Co. LLC
Consolidated Statements of Operations In thousands except share and per share amounts
F O R T H E Y E A R S E N D E D D E C E M B E R 3 1
2000 1999 1998
RevenuesRental income $ 52,086 $46,719 $42,771Interest income from direct financing leases 33,572 33,842 34,529Management income from affiliates 25,271 — —Other interest income 452 962 783Other income 2,626 1,208 958Revenues of hotel operations 6,244 5,775 6,289
120,251 88,506 85,330ExpensesInterest 26,571 18,840 18,266Depreciation 13,508 10,457 7,725Amortization 7,801 735 681General and administrative 16,487 7,293 6,241Property expenses 5,644 5,433 5,059Termination of management contract 38,000 — —Impairment of real estate and securities 11,047 5,988 1,585Operating expenses of hotel operations 4,920 4,662 4,956
123,978 53,408 44,513(Loss) income before income from equity
investments, (loss) gain on sale, minority interest, income taxes and extraordinary item (3,727) 35,098 40,817
Income from equity investments 2,882 1,886 1,837(Loss) income before (loss) gain on sale, minority
interest, income taxes and extraordinary item (845) 36,984 42,654(Loss) gain on sale of real estate and securities, net (2,752) 471 1,512(Loss) income before minority interest, income
taxes and extraordinary item (3,597) 37,455 44,166Minority interest in income (1,517) (2,664) (4,662)(Loss) income before income taxes
and extraordinary item (5,114) 34,791 39,504Provision for income taxes (4,164) (752) (419)(Loss) income before extraordinary item (9,278) 34,039 39,085Extraordinary loss on early extinguishment
of debt, net of minority interest of $79 — — (621)Net (loss) income $ (9,278) $34,039 $38,464
Basic and diluted (loss) earnings per share:(Loss) earnings before extraordinary item $ (.31) $ 1.33 $ 1.57Extraordinary item — — (.02)
$ (.31) $ 1.33 $ 1.55Weighted average shares outstanding:
Basic 29,652,698 25,596,793 24,866,225
Diluted 29,652,698 25,596,793 24,869,570
The accompanying notes are an integral part of the consolidated financial statements.

23
W. P. Carey & Co. LLC
Consolidated Statements of Members’ Equity For the years ended December 31, 2000, 1999 and 1998
In thousands except share amounts
AccumulatedDividends Other
in Excess of Unearned Comprehen- Comprehen-Paid-in Accumulated Compen- sive Income sive Income Treasury
Shares Capital Earnings sation (Loss) (Loss) Shares Total
Balance at January 1, 1998 23,959,101 $490,820 $490,820
Cash proceeds onissuance of shares, net 384,708 6,191 6,191
Shares issued in connection with services rendered and properties acquired 999,593 20,744 20,744
Dividends declared $(41,267) (41,267)
Comprehensive income:
Net income 38,464 $38,464 38,464
Other comprehensive income:
Change in unrealized appreciation (depreciation) of marketable securities (233)
Foreign currency translation adjustment (486)
(719) $(719) (719)
$37,745
Balance at December 31, 1998 25,343,402 517,755 (2,803) (719) 514,233
Cash proceeds on issuance of shares, net 34,272 652 652
Shares issued in connection with services rendered and properties acquired 455,929 7,723 7,723
Dividends declared (42,796) (42,796)
Repurchase of shares (62,300) $(1,060) (1,060)
Comprehensive income:
Net income 34,039 $34,039 34,039
Other comprehensive income:
Change in unrealized appreciation (depreciation) of marketable securities 497
Foreign currency translation adjustment (688)
(191) (191) (191)
$33,848
Balance at December 31, 1999 25,771,303 $526,130 $(11,560) $(910) $(1,060) $512,600

24
W. P. Carey & Co. LLC
Consolidated Statements of Members’ Equity (continued)For the years ended December 31, 2000, 1999 and 1998
In thousands except share amounts
AccumulatedDividends Other
in Excess of Unearned Comprehen- Comprehen-Paid-in Accumulated Compen- sive Income sive Income Treasury
Shares Capital Earnings sation (Loss) (Loss) Shares Total
Balance at December 31, 1999 25,771,303 526,130 (11,560) (910) (1,060) 512,600
Shares issued in connection with services rendered and properties acquired 226,290 3,169 3,169
Shares issued in connectionwith acquisition 8,104,673 124,630 124,630
Shares and optionsissued under share incentive plans 347,100 6,311 $(6,311) —
Forfeitures (8,050) (160) 160 —
Dividends declared (53,422) (53,422)
Amortization of unearned compensation 860 860
Repurchase of shares (836,600) (14,271) (14,271)
Cancellation of treasury shares (15,331) 15,331 —
Comprehensive loss:
Net loss (9,278) $ (9,278) (9,278)
Other comprehensive income:
Change in unrealized depreciation of marketable securities (1,155)
Foreign currency translation adjustment (1,060)
(2,215) (2,215) (2,215)
$(11,493)
Balance at December 31, 2000 33,604,716 $644,749 $(74,260) $(5,291) $(3,125) — $562,073
The accompanying notes are an integral part of the consolidated financial statements.

25
W. P. Carey & Co. LLC
Consolidated Statements of Cash Flows In thousands
F O R T H E Y E A R S E N D E D D E C E M B E R 3 1
2000 1999 1998Cash flows from operating activities:
Net (loss) income $ (9,278) $ 34,039 $ 38,464Adjustments to reconcile net (loss) income to
net cash provided by operating activities:Depreciation and amortization 21,309 11,192 8,406Amortization of deferred income (566) (1,397) (964)Extraordinary loss — — 621Loss (gain) on sales of real estate and securities, net 2,752 (471) (1,512)Minority interest in income 1,517 2,664 4,662Straight-line rent adjustments and other noncash
rent adjustments (1,831) (1,646) (2,642)Management income received in shares of affiliates (2,747) — —Writedown of real estate and securities to
estimated fair value 11,047 5,988 1,585Structuring fees receivable (6,351) — —Provision for uncollected rents 743 328 682Costs paid by issuance of shares 1,482 1,647 881Amortization of unearned compensation 860 — —Termination of management contract 38,000 — —Net changes in operating assets and liabilities,
net of assets and liabilities acquired on acquisition 1,511 (4,142) 1,761Net cash provided by operating activities 58,448 48,202 51,944
Cash flows from investing activities:Purchases of real estate (21,497) (60,804) (89,650)Additional capital expenditures (2,078) (3,784) (5,156)Payment of deferred acquisition fees (392) — —Proceeds from sales of real estate and securities 45,617 9,631 21,567Accrued disposition fees payable — (1,007) 1,007Purchases of mortgage receivable and marketable securities — (3,676) (56)Sale of mortgage receivable — 3,676 —Distributions received from equity investments
in excess of equity income 1,552 775 763Capital distribution from equity investment 17,544 — —Cash acquired on acquisition of business operations 212 — —Net cash provided by (used in) investing activities 40,958 (55,189) (71,525)
Cash flows from financing activities:Dividends paid (49,957) (42,525) (30,820)Payment of accrued preferred distributions — — (4,422)Distributions paid to minority interest (1,321) (2,344) (2,499)Redemption of subsidiary partnership unitholders — — (8,789)Payments of mortgage principal (7,590) (6,393) (6,627)Proceeds from mortgages and notes payable 64,397 74,251 157,823Prepayments of mortgages and notes payable (83,037) (17,803) (101,555)Prepayment charges paid — — (700)Deferred financing costs — (1,744) (1,963)Proceeds from issuance of shares — 652 7,304Repurchase of shares (13,944) (627) —Other (46) (75) (1,084)
Net cash (used in) provided by financing activities (91,498) 3,392 6,668Effect of exchange rate changes on cash (40) 219 —
Net increase (decrease) in cash and cash equivalents 7,868 (3,376) (12,913)Cash and cash equivalents, beginning of year 2,297 5,673 18,586
Cash and cash equivalents, end of year $ 10,165 $ 2,297 $ 5,673
The accompanying notes are an integral part of the consolidated financial statements.

26
W. P. Carey & Co. LLC
Consolidated Statements of Cash Flows (continued)
Noncash operating, investing and financing activities:
A. The purchase of Carey Management consisted of the acquisition of certain assets and liabilities at fair valuein exchange for the issuance of listed shares as follows:
Intangible assets:
Management contracts $97,135
Trade name 4,700
Workforce 4,900
Goodwill 31,406
138,141
Liability for 500,000 shares to be issued, net (9,050)
Other assets and liabilities, net (4,673)
Listed shares issued (124,630)
Net cash acquired $ 212
B. The Company issued 181,644, 203,166 and 215,424 restricted shares valued at $2,424, $3,311 and $4,367 in2000, 1999 and 1998, respectively, to certain directors, officers and affiliates in consideration of services ren-dered. In connection with the acquisition of Carey Management in 2000, restricted shares and stock optionsvalued at $6,295 have been recorded as unearned compensation, of which $160 has subsequently been for-feited and $860 has been included in compensation expense.
C. In connection with the acquisition of real estate interests in 2000, 1999 and 1998, the Company issued sharesvalued at $778, $4,412 and $16,377, respectively. The Company also assumed mortgage obligations of $6,098and $13,593 in 1999 and 1998, respectively.
D. In connection with the disposition of a property in Topeka, Kansas in 1999, the property was transferred tothe purchaser in exchange for assumption of the mortgage obligation on the property and certain other assetsand liabilities. The gain on sale was as follows:
Land, buildings and personal property, net of accumulated depreciation $ (7,654)Mortgage note payable 8,107
Other (373)
Gain on sale $ 80
E. Deferred acquisition fees payable to an affiliate at December 31, 2000, 1999 and 1998 are $4,330, $3,945 and$3,137, respectively.
Supplemental Cash Flow Information:2000 1999 1998
Cash paid for interest, net of amounts capitalized $24,790 $20,055 $17,936
Income taxes paid $ 1,437 $ 659 $ 353
The accompanying notes are an integral part of the consolidated financial statements.

27
W. P. Carey & Co. LLC
Notes to Consolidated Financial StatementsAll amounts in thousands except share and per share amounts
1. Organization
W. P. Carey & Co. LLC (the “Company”) (formerly known as Carey Diversified LLC) commenced operations on
January 1, 1998, pursuant to a consolidation transaction, when the Company acquired the majority ownership
interests in the nine Corporate Property Associates (CPA®) Partnerships. The former General Partner interests in
the CPA® Partnerships were retained by two special limited partners, William Polk Carey, formerly the Individual
General Partner of the nine CPA® Partnerships, and Carey Management LLC (“Carey Management”). Limited
partners in the CPA® Partnerships who did not elect to receive shares in the Company retained direct ownership
interests in the applicable CPA® Partnerships as subsidiary partnership unitholders. In July 1998, the Company
redeemed all subsidiary partnership units for $8,377.
The exchange of CPA® Partnership limited partner interests for interests in Carey Diversified was accounted
for as a purchase with the limited partner interests recorded at the fair value of the shares exchanged. The excess
of fair value over the related historical cost basis of $189,932 was allocated principally to real estate leased to
others under operating leases, net investment in direct financing leases and equity investments. The exchange of
the former General Partners’ interests for shares was accounted for at their historical cost basis.
On June 28, 2000 the Company acquired the net lease real estate management operations of Carey Management
subsequent to receiving shareholder approval. The assets acquired include the Advisory Agreements with four affi-
liated publicly owned real estate investment trusts (the “CPA® REITs”), the Company’s Management Agreement,
the stock of an affiliated broker-dealer, investments in the common stock of the CPA® REITs, and certain office fur-
niture, fixtures, equipment and employees required to carry on the business operations of Carey Management. The
purchase price consisted of the initial issuance of 8,000,000 Listed Shares (“shares”) with an additional 2,000,000
shares issuable over four years if specified performance criteria are achieved (of which 500,000 shares will be issued
based on meeting performance criteria as of December 31, 2000 and valued at $9,050, based on the quoted price of
the Company’s shares at December 31, 2000). The initial 8,000,000 shares issued are restricted from resale for a
period of up to three years. The total initial purchase price was approximately $131,300 including the issuance of
8,000,000 shares, transaction costs of $2,605, the acquisition of Carey Management’s special limited partnership
minority interests in the CPA® Partnerships and the value of restricted shares and options issued in respect of the
28
1. Organization (continued)
interests of certain officers in a non-qualified deferred compensation plan of Carey Management. The Company has
guaranteed loans of $7,995 to these officers in connection with their acquisition of equity interests in the Company.
The acquisition of interests in Carey Management was accounted for as a purchase and is recorded at the fair
value of the initial 8,000,000 shares issued and an additional 500,000 shares issuable based on meeting certain per-
formance criteria as of December 31, 2000. For financial reporting purposes, the value of the 500,000 shares is
recorded as additional purchase price. The fair value of the initial shares was based upon the average market price
for a reasonable period before and after the date the terms of the acquisition were announced, including a discount
to reflect the restrictions on their disposition. Any subsequent issuances based on performance criteria are valued
based on the market price of the shares on the date when the performance criteria are achieved. The purchase price
has been allocated to the assets and liabilities acquired based upon their fair market values. Intangible assets
acquired, including the Advisory Agreements with the CPA® REITs, the Company’s Management Agreement, the
trade name, and workforce, were determined pursuant to an independent valuation. The value of the Advisory
Agreements and the Management Agreement have been computed based on a discounted cash flow analysis of the
projected fees. The excess of the purchase price over the fair values of the identified tangible and intangible assets,
has been recorded as goodwill. The acquisition of the Company’s Management Agreement has been accounted for
as a contract termination and the fair value of the Agreement of $38,000 was expensed as of the date of the merger.
Effective January 1, 2001, the Company has acquired all remaining minority interests in the CPA® Partnerships.
An independent valuation is being completed which will determine the shares to be issued for the acquisition of
the remaining minority interests. Concurrent with the purchase of the remaining interests in the CPA® Partnerships,
certain CPA® Partnerships were merged so that as of January 1, 2001, the four remaining CPA® Partnerships will
be wholly-owned subsidiaries. With the reduction in the number of Partnerships and the elimination of the minor-
ity interest owners in such Partnerships, the Company expects to achieve certain operating efficiencies.
2. Summary of Significant Accounting Policies
Basis of Consolidation
The consolidated financial statements include the Company and its wholly-owned and majority-owned subsidiaries
including the CPA® Partnerships. All material inter-entity transactions have been eliminated.
29
2. Summary of Significant Accounting Policies (continued)
Use of Estimates
The preparation of financial statements in conformity with accounting principles generally accepted in the United
States of America requires management to make estimates and assumptions that affect the reported amounts of
assets and liabilities and disclosure of contingent assets and liabilities at the date of the financial statements and the
reported amounts of revenues and expenses during the reporting period. The most significant estimates relate to
the assessment of recoverability of real estate and intangible assets and goodwill. Actual results could differ from
those estimates.
Real Estate Leased to Others
Real estate is leased to others on a net lease basis, whereby the tenant is generally responsible for all operating expenses
relating to the property, including property taxes, insurance, maintenance, repairs, renewals and improvements.
The Company diversifies its real estate investments among various corporate tenants engaged in different
industries and by property type. No lessee currently represents 10% or more of total leasing revenues. The leases
are accounted for under either the direct financing or operating methods. Such methods are described below
(also see Notes 4 and 5):
Direct financing method — Leases accounted for under the direct financing method are recorded at their net invest-
ment (Note 5). Unearned income is deferred and amortized to income over the lease terms so as to produce a con-
stant periodic rate of return on the Company’s net investment in the lease.
Operating method — Real estate is recorded at cost less accumulated depreciation, minimum rental revenue is
recognized on a straight-line basis over the term of the related leases and expenses (including depreciation) are
charged to operations as incurred.
Substantially all of the Company’s leases provide for either scheduled rent increases, periodic rent increases
based on formulas indexed to increases in the Consumer Price Index or sales overrides.
Certain of the Company’s leases provide for additional rental revenue by way of percentage rents to be paid
based upon the level of sales to be achieved by the lessee. These percentage rents are recorded once the required
sales level is achieved and are included in the accompanying consolidated financial statements in rental income and
interest income from direct financing leases.
30
2. Summary of Significant Accounting Policies (continued)
Operating Real Estate
Land and buildings and personal property are carried at cost less accumulated depreciation. Renewals and improve-
ments are capitalized, while replacements, maintenance and repairs that do not improve or extend the lives of the
respective assets are expensed currently.
Real Estate Under Construction and Redevelopment
For properties under construction, interest charges are capitalized rather than expensed and rentals received are
recorded as a reduction of capitalized project (i.e., construction) costs.
The amount of interest capitalized is determined by applying the interest rate applicable to outstanding bor-
rowings on the line of credit to the average amount of accumulated expenditures for properties under construction
during the period.
Equity Investments
The Company’s interests in entities in which the Company’s ownership is 50% or less and the Company exerts sig-
nificant influence are accounted for under the equity method, i.e. at cost, increased or decreased by the Company’s
pro rata share of earnings or losses, less distributions.
Assets Held for Sale
Assets held for sale are accounted for at the lower of carrying value or fair value, less costs to dispose.
The Company recognizes gains and losses on the sale of properties when among other criteria, the parties are
bound by the terms of the contract, all consideration has been exchanged and all conditions precedent to closing
have been performed. At the time the sale is consummated, a gain or loss is recognized as the difference between
the sale price less any closing costs and the carrying value of the property.
Intangible Assets
Goodwill represents the excess of the purchase price of the net lease real estate management operations over the
fair value of net assets acquired. Other intangible assets represent cost allocated to trade names, advisory contracts
with the CPA® REITs and the acquired workforce. Intangible assets are being amortized over their estimated use-
ful lives which range from 21/2 to 16 1/2 years.

31
2. Summary of Significant Accounting Policies (continued)
Intangible assets as of December 31, 2000 are as follows:
Management contracts $ 59,135
Workforce 4,900
Trade name 4,700
Goodwill 31,406
100,141
Less accumulated amortization 5,958
$ 94,183
Long-Lived Assets
When events or changes in circumstances indicate that the carrying amount may not be recoverable, the Company
assesses the recoverability of its long-lived assets, including residual interests of real estate assets and investments,
based on projections of undiscounted cash flows, without interest charges, over the life of such assets. In the event
that such cash flows are insufficient, the assets are adjusted to their estimated fair value.
Depreciation
Depreciation is computed using the straight-line method over the estimated useful lives of the properties (gener-
ally forty years) and for furniture, fixtures and equipment (generally up to seven years).
Foreign Currency Translation
The Company consolidates its real estate investments in France. The functional currency for these investments is
the French Franc. The translation from the French Franc to U. S. dollars is performed for assets and liabilities
using current exchange rates in effect at the balance sheet date and for revenue and expense accounts using a
weighted average exchange rate during the period. The gains and losses resulting from such translation are reported
as a component of other comprehensive income as part of members’ equity.
Cash Equivalents
The Company considers all short-term, highly liquid investments that are both readily convertible to cash and have
a maturity of generally three months or less at the time of purchase to be cash equivalents. Items classified as cash
equivalents include commercial paper and money market funds. Substantially all of the Company’s cash and
cash equivalents at December 31, 2000 and 1999 were held in the custody of four financial institutions and which

32
2. Summary of Significant Accounting Policies (continued)
balances, at times, exceed federally insurable limits. The Company mitigates this risk by depositing funds with
major financial institutions.
Other Assets and Liabilities
Included in other assets are accrued rents and interest receivable, deferred rent receivable, deferred charges and
marketable securities. Included in other liabilities are accrued interest, accounts payable and accrued expenses and
deferred income taxes. Deferred charges include costs incurred in connection with debt financing and refinancing
and are amortized over the terms of the related debt obligations. Deferred rent receivable is the aggregate differ-
ence for operating method leases between scheduled rents which vary during the lease term and rent recognized
on a straight-line basis. Also included in deferred rent receivable are lease restructuring fees received which are
recognized over the remainder of the initial lease terms.
Marketable securities are classified as available-for-sale securities and reported at fair value with the Company’s
interest in unrealized gains and losses on these securities reported as a component of other comprehensive income
until realized. Such marketable securities had a cost basis of $1,362 and $2,065 and reflected a fair value of $470
and $2,329 at December 31, 2000 and 1999, respectively.
Due to Affiliates
Included in due to affiliates are deferred acquisition fees which are payable for services provided by Carey
Management prior to the termination of the Management Contract, relating to the identification, evaluation,
negotiation, financing and purchase of properties and additional shares for meeting performance criteria related to
the acquisition of the net lease real estate management operations. The fees are payable in eight annual installments
each January 1 following the first anniversary of the date a property was purchased, with each installment equal
to .25% of the purchase price of the property.
Revenue Recognition
In connection with the acquisition of Carey Management described in Note 1, the Company earns transaction and
asset-based fees. Structuring and financing fees are earned for investment banking services provided in connec-
tion with the analysis, negotiation and structuring of transactions, including acquisitions and the placement of mort-
gage financing obtained by the CPA® REITs. Asset-based fees consist of property management, leasing and advisory
fees and reimbursement of certain expenses in accordance with the separate management agreements with each
33
2. Summary of Significant Accounting Policies (continued)
CPA® REIT for administrative services provided for operation of such CPA® REIT. Receipt of the incentive fee
portion of the management fee, however, is subordinated to the achievement of specified cumulative return require-
ments by the shareholders of the CPA® REITs. The incentive portion of management fees may be collected in cash
or shares of the CPA® REIT at the option of the Company. During 2000, the Company elected to receive its earned
incentive fees in CPA® REIT shares.
All fees are recognized as earned. Transaction fees are earned upon the consummation of a transaction and
management fees are earned when services are performed. Fees subject to subordination are recognized only when
the contingencies affecting the payment of such fees are resolved, that is, when the performance criterion or crite-
ria of the CPA® REIT is achieved. The Company also receives reimbursement of certain marketing costs in con-
nection with the sponsorship of a CPA® REIT that is conducting a “best efforts” public offering. Reimbursement
income is recorded as the expenses are incurred (see Note 3).
Income Taxes
The Company is a limited liability company and has elected partnership status for federal income tax purposes.
The Company is not liable for Federal income taxes as each member recognizes his or her proportionate share of
income or loss in his or her tax return. Certain wholly-owned subsidiaries are not eligible for partnership status
and, accordingly, all tax liabilities incurred by these subsidiaries do not pass through to the members. Accordingly,
the provision for Federal income taxes is based on the results of those consolidated subsidiaries that do not pass
through any share of income or loss to members. The Company is subject to certain state and local taxes.
Deferred income taxes are provided for based on earnings reported. The provision for income taxes differs
from the amounts currently payable because of temporary differences in the recognition of certain income and
expense items for financial reporting and tax reporting purposes.
Income taxes are computed under the asset and liability method. The asset and liability method requires the
recognition of deferred tax liabilities and assets for the expected future tax consequences of temporary differences
between tax bases and financial bases of assets and liabilities (see Note 17).
Earnings Per Share
The Company presents both basic and diluted earnings per share (“EPS”). Basic EPS excludes dilution and is com-
puted by dividing net income available to shareholders by the weighted average number of shares outstanding for
the period. Diluted EPS reflects the potential dilution that could occur if securities or other contracts to issue
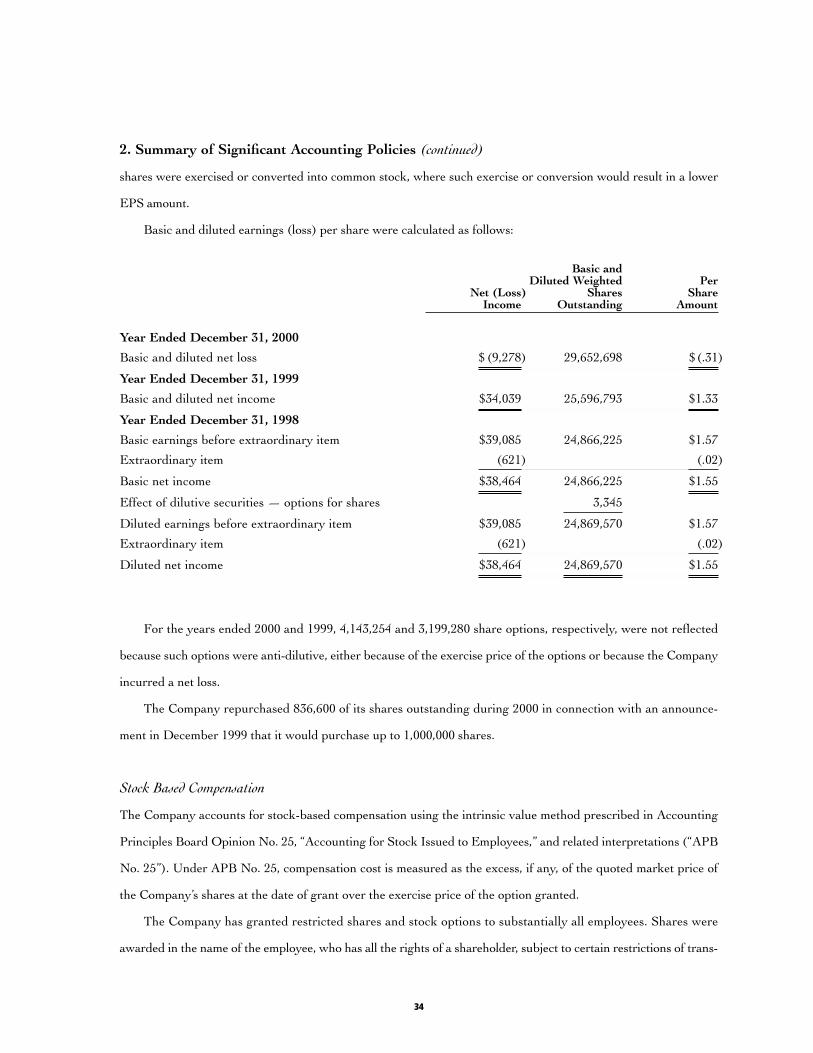
34
2. Summary of Significant Accounting Policies (continued)
shares were exercised or converted into common stock, where such exercise or conversion would result in a lower
EPS amount.
Basic and diluted earnings (loss) per share were calculated as follows:
Basic andDiluted Weighted Per
Net (Loss) Shares ShareIncome Outstanding Amount
Year Ended December 31, 2000
Basic and diluted net loss $ (9,278) 29,652,698 $(.31)
Year Ended December 31, 1999
Basic and diluted net income $34,039 25,596,793 $1.33
Year Ended December 31, 1998
Basic earnings before extraordinary item $39,085 24,866,225 $1.57
Extraordinary item (621) (.02)
Basic net income $38,464 24,866,225 $1.55
Effect of dilutive securities — options for shares 3,345
Diluted earnings before extraordinary item $39,085 24,869,570 $1.57
Extraordinary item (621) (.02)
Diluted net income $38,464 24,869,570 $1.55
For the years ended 2000 and 1999, 4,143,254 and 3,199,280 share options, respectively, were not reflected
because such options were anti-dilutive, either because of the exercise price of the options or because the Company
incurred a net loss.
The Company repurchased 836,600 of its shares outstanding during 2000 in connection with an announce-
ment in December 1999 that it would purchase up to 1,000,000 shares.
Stock Based Compensation
The Company accounts for stock-based compensation using the intrinsic value method prescribed in Accounting
Principles Board Opinion No. 25, “Accounting for Stock Issued to Employees,” and related interpretations (“APB
No. 25”). Under APB No. 25, compensation cost is measured as the excess, if any, of the quoted market price of
the Company’s shares at the date of grant over the exercise price of the option granted.
The Company has granted restricted shares and stock options to substantially all employees. Shares were
awarded in the name of the employee, who has all the rights of a shareholder, subject to certain restrictions of trans-

35
2. Summary of Significant Accounting Policies (continued)
ferability and a risk of forfeiture. The forfeiture provisions on the awards expire annually, over periods of four and
three years for the shares and stock options, respectively. Shares and stock options subject to forfeiture provisions
have been recorded as unearned compensation and are presented as a separate component of members’ equity.
Compensation cost for stock options and restricted stock, if any, is recognized ratably over the vesting period of
three and four years, respectively. Compensation cost for share plans was $860 in 2000. No compensation cost was
recognized in 1999 and 1998 in connection with the Company’s share plans. The Company provides additional pro
forma disclosures as required (see Note 15).
All transactions with non-employees in which the Company issues stock as consideration for services received are
accounted for based on the fair value of the stock issued or services received, whichever is more reliably determinable.
Reclassification
Certain prior year amounts have been reclassified to conform to the current year financial statement presentation.
3. Transactions with Related Parties
For the years ended 2000, 1999 and 1998, the Company incurred combined management and performance fees of
$1,924, $3,025 and $2,201, respectively, and general and administrative costs of $861, $1,457, and $1,540, respectively.
As described in Note 1, the Company’s Management Agreement with Carey Management was cancelled effec-
tive with the acquisition of the business operations of Carey Management. The Company is now internally man-
aged and, as a result of the cancellation of the Management Agreement and acquisition of Carey Management’s
workforce as of the date of the acquisition, no longer incurs management and performance fees nor reimburses a
manager for general and administrative reimbursements, primarily consisting of the manager’s cost of providing
administration to the operation of the Company.
As a result of acquiring the Advisory Agreements with the CPA® REITs, the Company has engaged in a new
business segment, advisory operations, and earns fees as the Advisor to the four affiliated CPA® REITs as described
in Note 2.
Under the Advisory Agreements with the CPA® REITs, the Company performs various services, including
but not limited to the day-to-day management of the CPA® REITs and transaction-related services. In addition,
the Company’s broker-dealer subsidiary earns fees in connection with the on-going “best efforts” public offering
of CPA®:14. The Company earns an asset management fee of 1/2 of 1% per annum of Average Invested Assets, as
defined in the Agreements, for each CPA® REIT and, based upon certain performance criteria for each REIT, may

36
3. Transactions with Related Parties (continued)
be entitled to receive performance fees, calculated on the same basis as the asset management fee, and is reimbursed
for certain costs, primarily the cost of personnel. For the year ended December 31, 2000, asset-based fees and reim-
bursements earned were $10,377.
In connection with structuring and negotiating acquisitions and related mortgage financing for the CPA® REITs,
the Advisory Agreements provide for transaction fees based on the cost of the properties acquired. A portion of the
fees are payable in equal annual installments over no less than eight years, subject to certain limitations. Such unpaid
amounts bear interest at annual rates ranging from 6% to 7%. The Company may also earn fees related to the dis-
position of properties, subject to subordination provisions and will only be recognized as such subordination provi-
sions are achieved. For the year ended December 31, 2000, the Company earned transaction fees of $14,894.
In connection with the acquisition of the CPA® Partnerships described in Note 1, the former Corporate General
Partners of eight of the CPA® Partnerships satisfied provisions for receiving a subordinated preferred return from
the Partnerships totaling $4,422 based upon the cumulative proceeds from the sale of the assets of each Partnership
from inception through the date of the consolidation. Payment was based on achieving a specified cumulative return
to limited partners. For the partnership that has not yet achieved the specified cumulative return, its subordinated
preferred return of $1,423 is included in due to affiliates, and will be paid if the Company achieves a closing price
equal to or in excess of $23.11 for five consecutive trading days.
Prior to the termination of the Management Agreement, Carey Management performed certain services for
the Company and earned transaction fees in connection with the purchase and disposition of properties. Transaction
fees paid to Carey Management and affiliates were $1,832 and $4,510 in 1999 and 1998, respectively. The Company
is also obligated to pay deferred acquisition fees in equal annual installments over a period of no less than eight
years. As of December 31, 2000 and 1999, unpaid deferred acquisition fees were $3,802 and $3,945, respectively,
and bear interest at an annual rate of 6%. An installment of $392 was paid in January 2000.
The Company is a participant in an agreement with certain affiliates for the purpose of leasing office space
used for the administration of the Company and other affiliated real estate entities and sharing the associated costs.
Pursuant to the terms of the agreement, the Company’s share of rental, occupancy and leasehold improvement costs
is based on gross revenues. Expenses incurred were $348, $545, and $558 in 2000, 1999 and 1998, respectively.
An independent director of the Company has an ownership interest in companies that own the minority inter-
est in the Company’s French majority-owned subsidiaries. The director’s ownership interest is subject to the same
terms as all other ownership interests in the subsidiary companies. An officer of the Company is the sole share-
holder of Livho, Inc., a lessee of the Company (see Note 8).
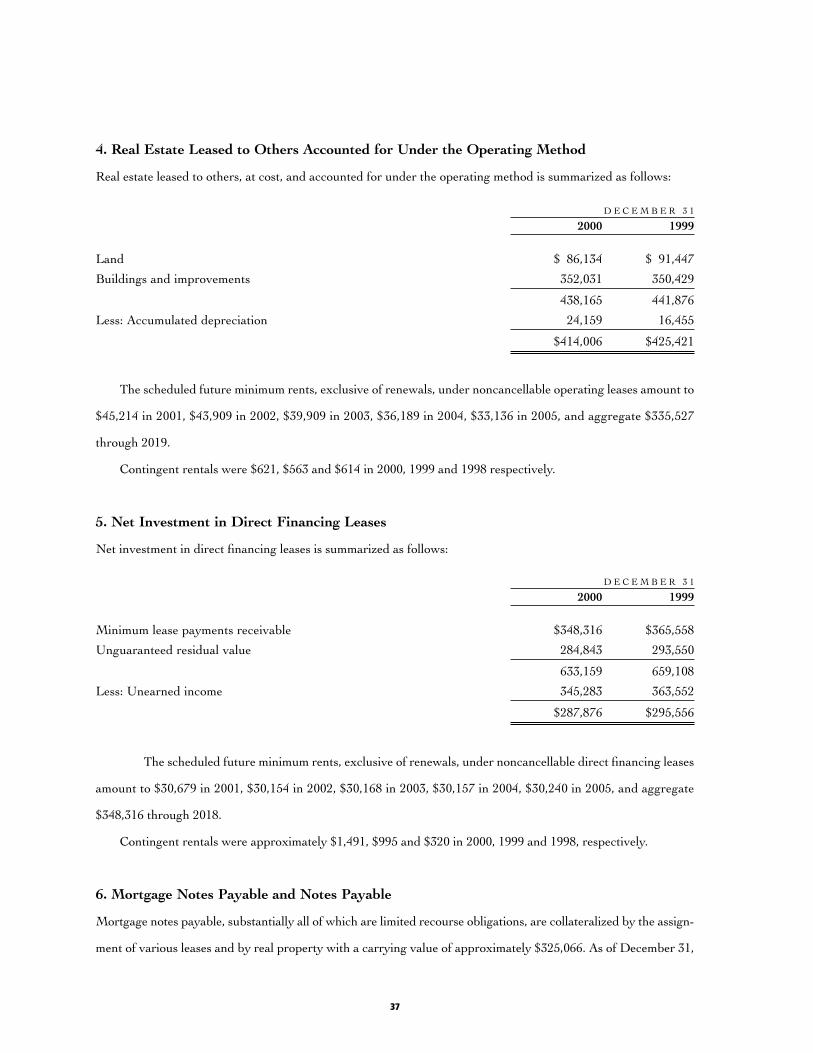
37
4. Real Estate Leased to Others Accounted for Under the Operating Method
Real estate leased to others, at cost, and accounted for under the operating method is summarized as follows:
D E C E M B E R 3 1
2000 1999
Land $ 86,134 $ 91,447
Buildings and improvements 352,031 350,429
438,165 441,876
Less: Accumulated depreciation 24,159 16,455
$414,006 $425,421
The scheduled future minimum rents, exclusive of renewals, under noncancellable operating leases amount to
$45,214 in 2001, $43,909 in 2002, $39,909 in 2003, $36,189 in 2004, $33,136 in 2005, and aggregate $335,527
through 2019.
Contingent rentals were $621, $563 and $614 in 2000, 1999 and 1998 respectively.
5. Net Investment in Direct Financing Leases
Net investment in direct financing leases is summarized as follows:
D E C E M B E R 3 1
2000 1999
Minimum lease payments receivable $348,316 $365,558
Unguaranteed residual value 284,843 293,550
633,159 659,108
Less: Unearned income 345,283 363,552
$287,876 $295,556
The scheduled future minimum rents, exclusive of renewals, under noncancellable direct financing leases
amount to $30,679 in 2001, $30,154 in 2002, $30,168 in 2003, $30,157 in 2004, $30,240 in 2005, and aggregate
$348,316 through 2018.
Contingent rentals were approximately $1,491, $995 and $320 in 2000, 1999 and 1998, respectively.
6. Mortgage Notes Payable and Notes Payable
Mortgage notes payable, substantially all of which are limited recourse obligations, are collateralized by the assign-
ment of various leases and by real property with a carrying value of approximately $325,066. As of December 31,

38
2000, mortgage notes payable have interest rates varying from 4.56% to 9.82% per annum and mature from 2001
to 2015. Certain of the mortgage notes payable are prepayable, subject to prepayment charges.
Scheduled principal payments for the mortgage notes during each of the next five years following December
31, 2000 and thereafter are as follows:
Y E A R E N D I N G D E C E M B E R 3 1 ,
2001 $ 22,719
2002 12,345
2003 10,708
2004 27,659
2005 8,627
Thereafter 114,036
Total $196,094
The Company has a line of credit of $185,000 pursuant to a revolving credit agreement with The Chase
Manhattan Bank in which nine lenders participate. The revolving credit agreement had an initial term of three
years through March 20, 2001 and has been extended for an additional three years through March 2004. As of
December 31, 2000, the Company had $94,000 drawn from the line of credit. Additional advances of $16,000 have
been drawn from the line of credit since December 31, 2000.
Advances, which are prepayable at any time, bear interest at an annual rate of either (i) the one, two, three or
six-month LIBOR, as defined, plus a spread which ranges from 0.6% to 1.45% depending on leverage or corpo-
rate credit rating or (ii) the greater of the bank’s Prime Rate and the Federal Funds Effective Rate, plus .50%, plus
a spread of up to .125% depending upon the Company’s leverage. At December 31, 2000 and 1999, the average
interest rate on advances on the line of credit was 7.86% and 7.8%, respectively. In addition, the Company will pay
a fee (a) ranging between 0.15% and 0.20% per annum of the unused portion of the credit facility, depending on
the Company’s leverage, if no minimum credit rating for the Company is in effect or (b) equal to .15% of the total
commitment amount, if the Company has obtained a certain minimum credit rating.

39
6. Mortgage Notes Payable and Notes Payable (continued)
The revolving credit agreement has financial covenants that require the Company to (i) maintain minimum
equity value of $400,000 plus 85% of amounts received by the Company as proceeds from the issuance of equity
interests and (ii) meet or exceed certain operating and coverage ratios. Such operating and coverage ratios include,
but are not limited to, (a) ratios of earnings before interest, taxes, depreciation and amortization to fixed charges
for interest and (b) ratios of net operating income, as defined, to interest expense. The Company has always been
in compliance with the financial covenants.
7. Dividends Payable
The Company declared a quarterly dividend of $.4225 per share on December 22, 2000 payable to shareholders
of record as of December 29, 2000. The dividend was paid in January 2001.
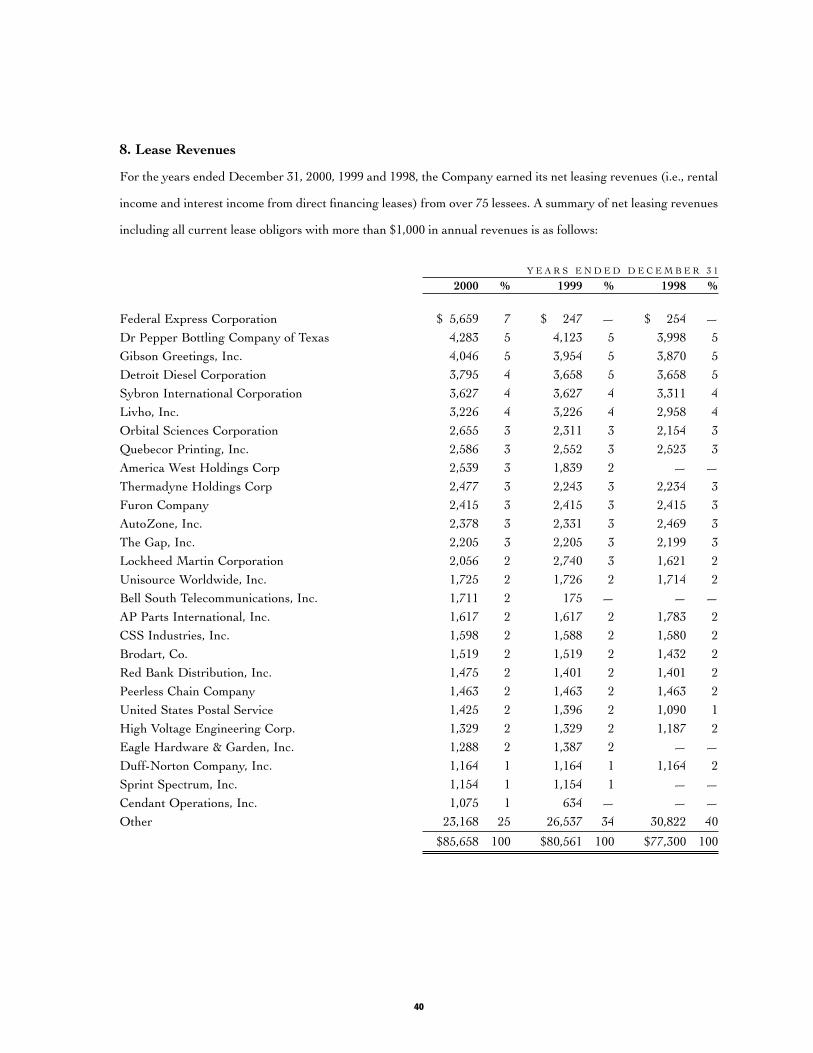
40
8. Lease Revenues
For the years ended December 31, 2000, 1999 and 1998, the Company earned its net leasing revenues (i.e., rental
income and interest income from direct financing leases) from over 75 lessees. A summary of net leasing revenues
including all current lease obligors with more than $1,000 in annual revenues is as follows:
Y E A R S E N D E D D E C E M B E R 3 1
2000 % 1999 % 1998 %
Federal Express Corporation $ 5,659 7 $ 247 — $ 254 —
Dr Pepper Bottling Company of Texas 4,283 5 4,123 5 3,998 5
Gibson Greetings, Inc. 4,046 5 3,954 5 3,870 5
Detroit Diesel Corporation 3,795 4 3,658 5 3,658 5
Sybron International Corporation 3,627 4 3,627 4 3,311 4
Livho, Inc. 3,226 4 3,226 4 2,958 4
Orbital Sciences Corporation 2,655 3 2,311 3 2,154 3
Quebecor Printing, Inc. 2,586 3 2,552 3 2,523 3
America West Holdings Corp 2,539 3 1,839 2 — —
Thermadyne Holdings Corp 2,477 3 2,243 3 2,234 3
Furon Company 2,415 3 2,415 3 2,415 3
AutoZone, Inc. 2,378 3 2,331 3 2,469 3
The Gap, Inc. 2,205 3 2,205 3 2,199 3
Lockheed Martin Corporation 2,056 2 2,740 3 1,621 2
Unisource Worldwide, Inc. 1,725 2 1,726 2 1,714 2
Bell South Telecommunications, Inc. 1,711 2 175 — — —
AP Parts International, Inc. 1,617 2 1,617 2 1,783 2
CSS Industries, Inc. 1,598 2 1,588 2 1,580 2
Brodart, Co. 1,519 2 1,519 2 1,432 2
Red Bank Distribution, Inc. 1,475 2 1,401 2 1,401 2
Peerless Chain Company 1,463 2 1,463 2 1,463 2
United States Postal Service 1,425 2 1,396 2 1,090 1
High Voltage Engineering Corp. 1,329 2 1,329 2 1,187 2
Eagle Hardware & Garden, Inc. 1,288 2 1,387 2 — —
Duff-Norton Company, Inc. 1,164 1 1,164 1 1,164 2
Sprint Spectrum, Inc. 1,154 1 1,154 1 — —
Cendant Operations, Inc. 1,075 1 634 — — —
Other 23,168 25 26,537 34 30,822 40
$85,658 100 $80,561 100 $77,300 100

41
9. Gains and Losses on Sale of Real Estate and Securities
Significant sales of properties are summarized as follows:
2000
In 1998, the Company acquired land in Colliersville, Tennessee and entered into a build-to-suit commitment to con-
struct four office buildings to be occupied by Federal Express Corporation (“Federal Express”) at a cost of up to
$77,000. In February 2000, a net lease with Federal Express with an initial lease term of 20 years commenced at
an annual rent of $6,360. In order to mitigate the concentration of risk in a single lease, the Company agreed to sell
a 60% majority interest in the subsidiary that owns the Federal Express property to an affiliate, Corporate Property
Associates 14 Incorporated (“CPA®:14”), at a purchase price based on an independent appraisal. Based on such
independent appraisal, the Company received $42,287 and recognized a loss of $2,262 in connection with the sale.
During 2000, the Company sold ten properties formerly leased to The Kobacker Stores, Inc. and a property
formerly leased to AutoZone, Inc. located in Pensacola, Florida. In connection with the sales, the Company received
$2,672, net of costs, and incurred combined losses on the sales of $755. The Company also sold two properties,
located in Silver City, New Mexico and Carthage, New York, for $700, and recognized a net loss of $20.
The Company recognized a gain of $257 on the sale of its 18,540 shares of common stock of Titan Corporation.
The Company had previously exercised warrants that were granted in connection with structuring its net lease
with Titan Corporation in 1991.
1999
On September 30, 1999, the Company sold its property in Topeka, Kansas, leased to Hotel Corporation of America
(“Hotel Corp.”) for $8,107 pursuant to Hotel Corp.’s exercise of its purchase option. In connection with the sale,
the Company realized an $80 gain.
In December 1996, KSG, Inc. (“KSG”) notified the Company that it was exercising its option to purchase the
property it leased in Hazelwood, Missouri. In January 1999, the Company and KSG entered into an agreement
to establish a minimum and maximum exercise price of $9,000 and $11,500 and agreed to defer the exercise price
determination until a dispute regarding an interpretation of the purchase option provisions of the lease was resolved.
The court ruled in favor of the Company in 1999, and the Company sold the property to KSG for $11,000 plus an
allowance of $100 for legal costs. In connection with the sale, the Company realized a $391 gain.

42
9. Gains and Losses on Sale of Real Estate and Securities (continued)
1998
In April 1998 Simplicity Manufacturing, Inc. purchased its leased property in Port Washington, Wisconsin for
$9,684 pursuant to the exercise of its purchase option. A loss of $291 was recognized on the sale.
In December 1998, NVR, Inc. purchased its leased property in Pittsburgh, Pennsylvania for $12,193 pursuant
to a purchase option exercised in 1998. A gain of $1,754 was recognized on the sale.
10. Extraordinary Gains and Losses on Extinguishment of Debt
In connection with the prepayment of high interest loans collateralized by properties leased to Dr Pepper Bottling
Company of Texas, Orbital Sciences Corporation and Simplicity Manufacturing, Inc., the Company incurred $700
in prepayment charges resulting in an extraordinary loss on the extinguishment of debt of $621, net of $79 attrib-
utable to minority interests in 1998.
11. Impairment of Real Estate and Securities
Significant writedowns of properties and securities to estimated fair value based on assessment of recoverability
are summarized as follows:
2000
The Company incurred impairment losses of $11,047 in 2000 in connection with the writedown of real estate inter-
ests and other long-lived assets to estimated fair value based on the following circumstances:
The Company owns a property in Garland, Texas leased to Varo, Inc. (“Varo”). Although the lease ends in
October 2002 and Varo continues to meet its lease obligations, the property is vacant. As a result, the Company is
actively remarketing the property. The property has been written down to its estimated fair value and a writedown
of $2,238 has been recognized.
The Company owns a property in Traveler’s Rest, South Carolina formerly leased to Swiss-M-Tex L.P. (“M-Tex”).
Based on M-Tex’s weak financial condition and its inability to meet its lease obligations, the lease was terminated in
2000. The property has been written down to its estimated fair value and a writedown of $2,657 has been recognized.
DeVlieg Bullard, Inc., the former lessee of properties in Frankenmuth, Michigan and McMinnville, Tennessee
disaffirmed its master lease for the two properties in connection with its petition of voluntary bankruptcy. The two
properties are currently occupied under short-term license agreements and the Company expects to enter into leases

43
11. Impairment of Real Estate and Securities (continued)
with the current occupants. The McMinnville property has been written down to its estimated fair value and a
writedown of $2,677 has been recognized.
The Company owns a property in Burnsville, Minnesota leased to General Cinema Corporation (“General
Cinema”). During 2000, General Cinema filed a petition of voluntary bankruptcy. Because General Cinema had
vacated the property prior to the filing of its petition, the Company anticipates that the lease will be disaffirmed.
Accordingly, the property has been written down to its estimated fair value and a writedown of $1,500 has been
recognized. The lease obligations of General Cinema are guaranteed by Harcourt General, Inc.
The Company also recognized writedowns of $1,514 on its assessments of the recoverability of a redeemable
preferred limited partnership interest that was acquired in connection with the sale of a property in 1995 and deben-
tures received in connection with a bankruptcy settlement with a former lessee and $461 in connection with other
properties held for sale.
1999
The Company owned a property in Carthage, New York which was leased to Sunds Defibrator, Inc. (“Sunds”).
During 1999, the Company accepted offers to sell the property for $300 and to receive a lease termination payment
of $500, payable at the time of sale. In connection with the proposed sale, the Company recognized a noncash charge
of $1,000 on the writedown of the property to the anticipated sales price. Annual rent for the property was $144.
The initial term of the Sunds lease was scheduled to expire in 2005. The property was subsequently sold in 2000.
As described in Note 12, the Company recognized a noncash charge of $4,830 on the writedown of the
Company’s equity interest in Meristar Hospitality Corporation.
1998
The Company owns a property in Urbana, Illinois leased to Motorola, Inc. (“Motorola”). During 1998, Motorola
notified the Company of its intention to exercise its option to purchase the property. Based on the appraisal pre-
pared for the Company and the expectation that the appraisal would be the basis for the exercise price, the Company
recognized a writedown of $1,575 to an amount representing the fair value of the property, less costs to sell. An
additional writedown of $158 was recognized in 1999. The purchase option was not exercised.

44
12. Equity Investments
The Company owns 780,269 units of the operating partnership of Meristar Hospitality Corporation (“Meristar”),
a publicly traded real estate investment trust which primarily owns hotels. The Company has the right to convert
its units in the operating partnership to shares of common stock in Meristar at any time on a one-for-one basis. The
exchange of units for common stock would be a taxable transaction in the year of exchange. The Company’s inter-
est in the Meristar operating partnership is being accounted for under the equity method.
The carrying value of the equity interest in the Meristar operating partnership was $18,889 and $18,725 as of
December 31, 2000 and 1999, respectively. Because of a continued weakness in the public market’s valuation of
equity securities of real estate investment companies including Meristar, Management concluded that the under-
lying value of its investment in operating partnership units was impaired. Accordingly, the Company wrote down
its equity investment by $4,830 in 1999. The carrying value of the investment in Meristar subsequent to the write-
down approximated the Company’s pro rata ownership of Meristar at Meristar’s reported net asset value. As of
December 31, 2000, Meristar’s quoted per share market value was $19.69 resulting in an aggregate value of approx-
imately $15,364 if converted.
The audited consolidated financial statements of Meristar filed with the United States Securities and Exchange
Commission (“SEC”) reported total assets of $3,013,008 and $3,094,201 and shareholders’ equity of $1,134,555 and
$1,183,896 as of December 31, 2000 and 1999, respectively, and revenues of $400,778, $374,904 and $525,297 and
net income of $105,861, $98,964 and $43,707 for the years ended December 31, 2000, 1999 and 1998, respectively.
The Company owns equity interests as a limited partner in two limited partnerships that each own real estate
net leased to a single tenant. Corporate Property Associates 10 Incorporated owns the remaining controlling inter-
ests as a general partner in each partnership. The Company also owns equity interests in two limited liability com-
panies that each own real estate net leased to a single tenant with CPA®:14. Effective as of June 29, 2000, the
Company acquired 20,000 shares of common stock in the four CPA® REITs with which it has advisory agreements.
Since June 29, 2000, the Company has acquired an additional 105,691 and 132,066 shares, respectively, of Carey
Institutional Properties Incorporated and Corporate Property Associates 12 Incorporated, both CPA® REITs,
in connection with earning incentive fees (see Note 3). The interests in the CPA® REITs are accounted for under
the equity method due to the Company’s ability to exercise significant influence as the Advisor to the REITs. The
Company’s ownership interests in each of the CPA® REITs represent less than 1% of the outstanding shares of

45
12. Equity Investments (continued)
each CPA® REIT. The audited consolidated financial statements of the CPA® REITs are filed with the SEC. Com-
bined financial information of the affiliated equity investees is summarized as follows:
D E C E M B E R 3 1
2000 1999
Assets $1,745,901 $81,054
Liabilities 789,984 51,211
Capital $ 955,917 $29,843
Y E A R E N D E D D E C E M B E R 3 1
2000 1999 1998
Revenue(1) $173,006 $8,465 $6,990
Expenses 100,006 5,603 4,536
Net income $ 73,000 $2,862 $2,454
(1) Includes the net effect of minority interests in income, income from equity investments and gains (losses) on the sale of real estate
and securities.
13. Disclosures About Fair Value of Financial Instruments
The carrying amounts of cash, accounts receivable, accounts payable and accrued expenses approximate fair value
because of the short maturity of these items.
The Company estimates that the fair value of mortgage notes payable and other notes payable was $294,278
and $313,747 at December 31, 2000 and 1999, respectively (see Note 6). The fair value of fixed rate debt instru-
ments was evaluated using a discounted cash flow model with discount rates that take into account the credit of
the tenants and interest rate risk. The fair value of the note payable from the line of credit approximates the car-
rying value as it is a variable rate obligation with an interest rate that resets to market rates.

46
14. Selected Quarterly Financial Data (unaudited)
T H R E E M O N T H S E N D E D
March 31, June 30, September 30, December 31, 2000 2000 2000 2000
Revenues $23,276 $ 26,611 $33,929 $36,435
Expenses 13,659 54,744 22,114 33,461
Net income (loss) 9,625 (30,041) 11,375 (237)
Net income (loss) per share — basic and diluted .38 (1.18) .34 (.01)
Dividends declared per share .4225 .4225 .4225 .4225
T H R E E M O N T H S E N D E D
March 31, June 30, September 30, December 31, 1999 1999 1999 1999
Revenues $21,114 $21,877 $23,731 $21,784
Expenses 11,084 11,687 13,872 17,478
Income before extraordinary items 9,866 9,620 9,470 5,122
Net income 9,827 9,620 9,470 5,122
Net income per share — basic and diluted .39 .38 .37 .20
Dividends declared per share .4175 .4175 .4175 .4175
15. Stock Options and Warrants
In January 1998, an affiliate was granted warrants to purchase 2,284,800 shares exercisable at $21 per share and
725,930 shares exercisable at $23 per share as compensation for investment banking services in connection with
structuring the consolidation on the CPA® Partnerships. The warrants are exercisable until January 2009.
The Company maintains stock option incentive plans pursuant to which share options may be issued. The 1997
Share Incentive Plan (the “Incentive Plan”), as amended, authorizes the issuance of up to 2,600,000 shares. The
Company Non-Employee Directors’ Plan (the “Directors’ Plan”) authorizes the issuance of up to 300,000 shares.
The Incentive Plan provides for the grant of (i) share options which may or may not qualify as incentive stock
options, (ii) performance shares, (iii) dividend equivalent rights and (iv) restricted shares. In 2000, 922,152 share
options were granted at exercise prices ranging from $7.69 to $16.50 per share. In 1999, share options for 38,500
shares were granted at an exercise price of $19.69 per share. In 1998, share options for 113,500 shares were granted
at an exercise price of $20 per share. The options granted under the Incentive Plan have a 10-year term and are
exercisable for one-third of the granted options on the first, second and third anniversaries of the date of grant.

47
15. Stock Options and Warrants (continued)
The vesting of grants, however, may be accelerated upon a change in control of the Company and under certain
other conditions.
The Directors’ Plan provides for the same terms as the Incentive Plan. Share options for 21,822, 12,704 and 23,846
shares were granted at exercise prices ranging from $16.38 to $20 per share in 2000, 1999 and 1998, respectively.
Share option and warrant activity is as follows:Weighted Average
Exercise PriceNumber of Shares Per Share
Balance at January 1, 1998 — —
Granted 3,148,076 $21.42
Exercised — —
Forfeited — —
Balance at December 31, 1998 3,148,076 $21.42
Granted 51,204 $19.31
Exercised — —
Forfeited —
Balance at December 31, 1999 3,199,280 $21.38
Granted 943,974 $13.24
Exercised — —
Forfeited (29,000) $16.25
Balance at December 31, 2000 4,114,254 $19.57
At December 31, 2000, 1999 and 1998, the range of exercise prices and weighted-average remaining contrac-
tual life of outstanding share options and warrants was $7.69 to $23 and 8.32 years, $17.25 to $23.00 and nine years,
and $20 to $23 and ten years, respectively.
The per share weighted average fair value of share options and warrants issued during 2000 was estimated to
be $3.80 using a Black-Scholes option pricing formula. The more significant assumptions underlying the determi-
nation of the weighted average fair value include a risk-free interest rate of 6.8%, a volatility factor of 22.53%, a
dividend yield of 8.44% and an expected life of ten years.
The per share weighted average fair value of share options issued during 1999 was estimated to be $1.48, using
a binomial option pricing formula. The more significant assumptions underlying the determination of the weighted
average fair value include a risk-free interest rate of 5.54%, a volatility factor of 18.35%, a dividend yield of 7.64%
and an expected life of ten years.

48
15. Stock Options and Warrants (continued)
The per share weighted average fair value of share options and warrants issued during 1998 was estimated
to be $1.45 using a binomial option pricing formula. The more significant assumptions underlying the determina-
tion of the weighted average fair value include a risk-free interest rate of 5.36%, a volatility factor of 18.16%, a div-
idend yield of 7.33% and an expected life of ten years.
The Company has elected to adopt the disclosure only provisions of SFAS No. 123. If stock based compen-
sation cost had been recognized based upon fair value at the date of grant for options awarded under the two plans
in accordance with the provisions of SFAS No. 123, pro forma net (loss) income for 2000, 1999 and 1998 would
have been $(12,770), $33,964 and $38,299, respectively, and pro forma basic and diluted earnings (loss) per share
would have been $(.45) for 2000, unchanged for 1999 and $1.54 for 1998.

49
16. Segment Reporting
The Company has determined that it operates in two business segments, management services and real estate oper-
ations with domestic and international investments. The two segments are summarized as follows:
Management Real Estate Other(3) Total Company
Revenues:
2000 $25,271 $88,736 $6,244 $120,251
1999 — 82,731 5,775 88,506
1998 — 79,041 6,289 85,330
Operating, interest and tax expenses(1,2) (excluding depreciation and amortization):
2000 12,259 51,568 5,006 68,833
1999 — 38,306 4,662 42,968
1998 — 31,570 4,956 36,526
Income from equity investments:
2000 69 2,813 — 2,882
1999 — 1,886 — 1,886
1998 — 1,837 — 1,837
Net operating income(4):
2000 7,123 23,113 1,238 31,474
1999 — 32,522 1,046 33,568
1998 — 36,320 1,253 37,573
Total assets:
2000 111,375 784,628 8,239 904,242
1999 — 848,526 7,733 856,259
Total long-lived assets:
2000 105,504 761,028 7,136 873,668
1999 — 825,411 6,753 832,164
(1) Excludes the writeoff of an acquired management contract of $38,000 in 2000.
(2) Excludes amortization of intangibles and goodwill of $5,958 in 2000.
(3) Primarily consists of the Company’s hotel operations.
(4) Net operating income excludes gains and losses on sales, extraordinary items and the writeoff of an acquired management contract.

50
16. Segment Reporting (continued)
The Company acquired its first international real estate investment in 1998. For 2000, geographic information
for the real estate operations segment is as follows:
Total RealDomestic International Estate
Revenues $ 86,312 $ 2,424 $ 88,736
Operating, interest and tax expenses(1,2,3) 48,670 2,898 51,568
Income from equity investments 2,813 — 2,813
Net operating income(4) 23,587 (474) 23,113
Total assets 752,126 32,502 784,628
Total long-lived assets 731,225 29,803 761,028
For 1999, geographic information is as follows:
Total RealDomestic International Estate
Revenues $ 80,683 $ 2,048 $ 82,731
Operating, interest and tax expenses(1,2,3) 37,227 1,079 38,306
Income from equity investments 1,886 — 1,886
Net operating income(4) 31,667 855 32,522
Total assets 826,312 22,214 848,526
Total long-lived assets 803,649 21,762 825,411
For 1998, geographic information is as follows:
Total RealDomestic International Estate
Revenues $78,214 $827 $79,041
Operating, interest and tax expenses(1,2,3) 31,026 544 31,570
Income from equity investments 1,837 — 1,837
Net operating income(4) 36,224 96 36,320
(1) Excludes the writeoff of an acquired management contract of $38,000 in 2000.
(2) Excludes amortization of intangibles and goodwill of $5,958 in 2000.
(3) Excludes depreciation and amortization.
(4) Net (loss) income excluding gains and loss, extraordinary items and the writeoff of an acquired management contract.
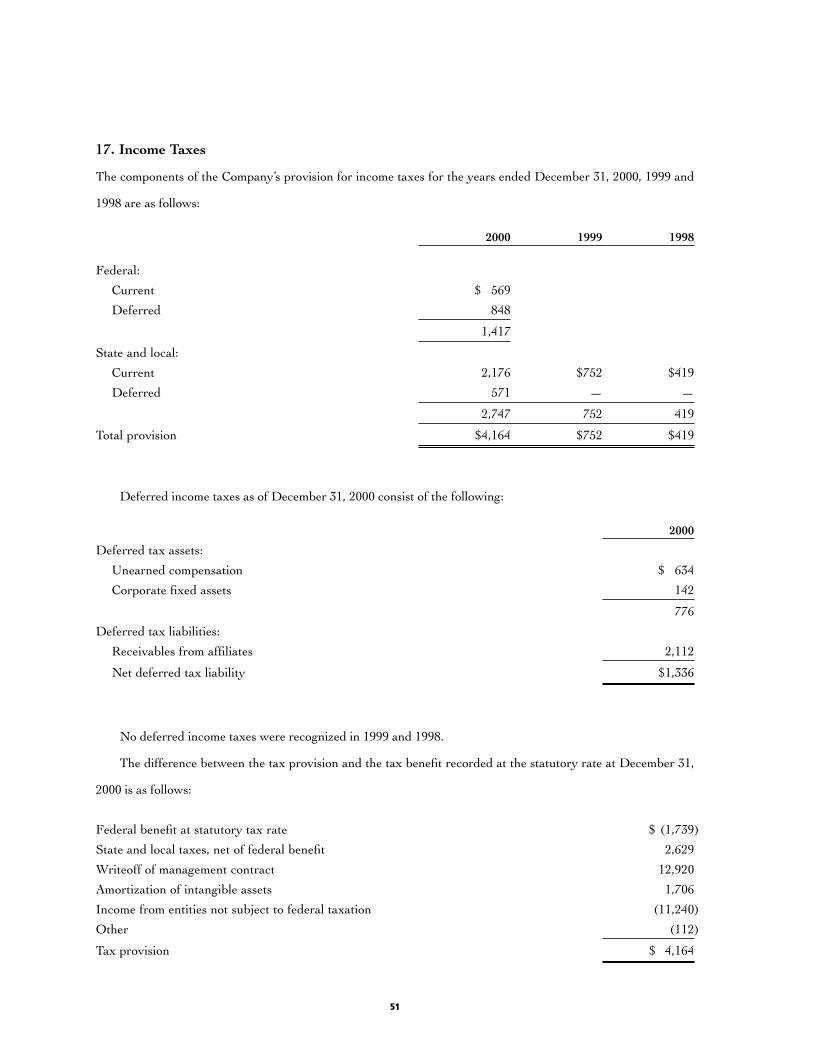
51
17. Income Taxes
The components of the Company’s provision for income taxes for the years ended December 31, 2000, 1999 and
1998 are as follows:
2000 1999 1998
Federal:
Current $ 569
Deferred 848
1,417
State and local:
Current 2,176 $752 $419
Deferred 571 — —
2,747 752 419
Total provision $4,164 $752 $419
Deferred income taxes as of December 31, 2000 consist of the following:
2000
Deferred tax assets:
Unearned compensation $ 634
Corporate fixed assets 142
776
Deferred tax liabilities:
Receivables from affiliates 2,112
Net deferred tax liability $1,336
No deferred income taxes were recognized in 1999 and 1998.
The difference between the tax provision and the tax benefit recorded at the statutory rate at December 31,
2000 is as follows:
Federal benefit at statutory tax rate $ (1,739)
State and local taxes, net of federal benefit 2,629
Writeoff of management contract 12,920
Amortization of intangible assets 1,706
Income from entities not subject to federal taxation (11,240)
Other (112)
Tax provision $ 4,164
52
18. Employee Benefit Plans
The Company sponsors a qualified profit-sharing plan and trust covering substantially all of its full-time employees
who have attained age twenty-one, worked a minimum of 1,000 hours and completed one year of service. The
Company is under no obligation to contribute to the plan and the amount of any contribution is determined by and
at the discretion of the Board of Directors. The Board of Directors can authorize contributions to a maximum of
15% of an eligible participant’s total compensation, limited to $25.5 annually per participant. For the year ended
December 31, 2000, amounts expensed by the Company for contributions to the trust were $627. Annual contribu-
tions represent an amount equivalent to 15% of each eligible participant’s total eligible compensation for that period.
19. Pro Forma Financial Information (unaudited)
The following consolidated pro forma financial information has been presented as if the merger of Carey Management
into the Company had occurred on January 1, 1999 for the years ended December 31, 2000 and 1999. In Manage-
ment’s opinion, all adjustments necessary to reflect the merger and the related issuance of common stock of the
Company have been made. The pro forma financial information is not necessarily indicative of what the actual results
would have been, nor does it purport to represent the results of operations for future periods.
Y E A R S E N D E D D E C E M B E R 3 1
2000 1999
Pro forma total revenues $133,666 $129,255
Pro forma net income 29,215 48,781
Pro forma basic and diluted earnings per share $ 0.86 $ 1.43
The pro forma net income and earnings per share figures presented above exclude a non-recurring noncash
writeoff of $38,000 related to the termination of the Management Agreement between the Company and Carey
Management upon completion of the merger. The pro forma (loss) income, including the $38,000 writeoff, for the
years ended December 31, 2000 and 1999 is $(8,785) and $10,781, respectively. Pro forma basic and diluted (loss)
income per share, including the $38,000 writeoff, for the years ended December 31, 2000 and 1999 is $(0.26) and
$0.32, respectively.

53
20. Accounting Pronouncements
In June 1998, the Financial Accounting Standards Board issued Statement of Financial Accounting Standards
(“SFAS”) No. 133, “Accounting for Derivative Instruments and Hedging Activities”, effective January 1, 2001,
which establishes accounting and reporting standards for derivative instruments. The Company believes that upon
adoption SFAS No. 133 will not have a material impact on the consolidated financial statements.
In December 1999, the Securities and Exchange Commission issued Staff Accounting Bulletin No. 101 (“SAB
101”) which provides guidance on several revenue recognition issues including recognition of fees earned from
services performed and rents based upon lessees’ sales. Certain of the Company’s leases provide for additional
rents to be paid based upon the level of sales achieved by the lessee. These percentage rents are recorded once the
required sales level is achieved and included in the consolidated statements of income in the rental revenue and
interest income from direct financing leases. The adoption of SAB 101 did not have any impact on the consolidated
financial statements.

54
George E. StoddardChairman of the InvestmentCommittee; Former Head of theDirect Placement Department,The Equitable Life AssuranceSociety of the United States
Frank J. HoenemeyerVice Chairman of the InvestmentCommittee Former ViceChairman and Chief InvestmentOfficer, The Prudential InsuranceCompany of America
Nathaniel S. CoolidgeMember; Former Head of Bondand Corporate FinanceDepartment, John HancockMutual Life Insurance Company
Dr. Lawrence R. KleinMember
Investment Committee
Wm. Polk CareyChairman
Francis J. CareyVice Chairman
Gordon F. DuGanPresident and Chief Acquisitions Officer
Donald E. NickelsonChairman of the AuditCommittee; Former President,PaineWebber, Inc.
Eberhard Faber, IVFormer Director of the FederalReserve Bank of Philadelphia
Dr. Lawrence R. KleinNobel Laureate in Economics;Benjamin Franklin Professor ofEconomics (Emeritus),University of Pennsylvania
Charles C. Townsend, Jr.Former Head of CorporateFinance, Morgan Stanley & Co.
Reginald WinssingerChairman of Horizon NewAmerica National Portfolio Inc.
Directors
Wm. Polk CareyChairman and Director
Francis J. CareyVice Chairman and Director
Gordon F. DuGanPresident, Chief Acquisitions Officer and Director
John J. ParkExecutive Vice President, ChiefFinancial Officer and Treasurer
H. Augustus CareyManaging Director
Claude FernandezManaging Director
Stephen H. Hamrick Managing Director
Anne R. CoolidgeExecutive Director
Edward V. LaPumaExecutive Director
W. Sean SovakExecutive Director
Gordon J. WhitingExecutive Director
Debra E. BiglerSenior Vice President—Regional Director
Susan C. HydeSenior Vice President—Investor Relations
Ted G. LagreidSenior Vice President—Regional Director
David W. MarvinSenior Vice President—Regional Director
Anthony S. MohlSenior Director— Paris
Michael D. RobertsSenior Vice President and Controller
James LongdenDirector— London
Brent CarrierFirst Vice President—Development
Robert C. KehoeFirst Vice President— Finance
Donna M. NeileyFirst Vice President—Asset Management
David G. Termine First Vice President— Accounting
Jeffrey R. DamecVice President—Regional Director
Kimberly J. DussolVice President—Asset Management
Yasmin GuerreroVice President— Accounting
Benjamin P. HarrisVice President— Acquistions
Nichole B. LeFortVice President— Regional Director
Louisa H. QuartoVice President— Marketing
C. Curtis RitterVice President— Communications
Gagan SinghVice President— Finance
Officers
AuditorsPricewaterhouseCoopers LLP
CounselReed Smith LLP
Executive OfficesW. P. Carey & Co. LLC50 Rockefeller PlazaNew York, NY 10020212-492-1100
Transfer AgentMellon Investor Services L.L.C.85 Challenger RoadRidgefield Park, NJ 07660888-200-8690
Annual MeetingJune 7, 2001, 10:30 a.m. at theWaldorf=Astoria Hotel
Dividend InformationThe following table sets forth for theperiod indicated, the per share dividendspaid to shareholders of record sinceinception:
Record DateMarch 31, 1998 $.4125June 30, 1998 $.4125September 30, 1998 $.4125December 31, 1998 $.4125
March 31, 1999 $.4175June 30, 1999 $.4175September 30, 1999 $.4175December 31, 1999 $.4175
March 31, 2000 $.4225June 30, 2000 $.4225September 30, 2000 $.4225December 31, 2000 $.4225
March 30, 2001 $.4225
Form 10-KA copy of the Company’s AnnualReport on Form 10-K as filed with theSecurities and Exchange Commissionmay be obtained without charge bywriting the Executive Offices at theabove address.
Websitewww.wpcarey.com
Trading InformationShares of Carey Diversified LLC begantrading on January 21, 1998 on theNew York Stock Exchange (“NYSE”).On June 29, 2000, Carey Diversifiedmerged with its manager to form W. P.Carey & Co. LLC and began tradingunder the symbol “WPC.”
Corporate Information


W. P. Carey & Co. LLC50 Rockefeller Plaza & New York, NY 10020 & 212-492-1100 & NYSE: WPC & www.wpcarey.com