investing as a business - worcester polytechnic institute common forex terms ... 4.2.2 pivot...
TRANSCRIPT

Investing as a Business
An Interactive Qualifying Project Report
Submitted to the Faculty
of
WORCESTER POLYTECHNIC INSTITUTE
In partial fulfillment of the requirements for the
Degree of Bachelor of Science
By
________________________ Gabriel McCormick
________________________
Devin Kehler
Date: March 11, 2012
Approved:
___________________________ Hossein Hakim, Advisor

[ii]
Table of Contents List of Figures ................................................................................................................................ vi
List of Tables ................................................................................................................................ vii
1. Introduction ................................................................................................................................. 1
1.1 Project Description ................................................................................................................ 2
2. Background ................................................................................................................................. 3
2.1 Common Forex Terms .......................................................................................................... 7
2.1.1 Pip ................................................................................................................................... 7
2.1.2 Leverage ......................................................................................................................... 7
2.1.3 Lot Size ........................................................................................................................... 8
2.1.4 Bid Price ......................................................................................................................... 9
2.1.5 Ask Price......................................................................................................................... 9
2.1.6 Spread ............................................................................................................................. 9
2.1.7 Short/Long .................................................................................................................... 10
2.1.8 Currency Pair ................................................................................................................ 10
2.1.9 Margin Call ................................................................................................................... 11
2.1.10 Stop Loss .................................................................................................................... 11
2.1.11 Take Profit .................................................................................................................. 11
2.1.12 Currency pairs............................................................................................................. 12
3. Methodology ............................................................................................................................. 13

[iii]
4. Execution .................................................................................................................................. 14
4.1 Choosing a Broker ............................................................................................................... 14
4.2 Technical Indicators ............................................................................................................ 18
4.2.1 Trend Lines ................................................................................................................... 19
4.2.2 Pivot Points/Camarilla Pivots ....................................................................................... 20
4.2.3 Moving Average Convergence/Divergence ................................................................. 23
4.2.4 Bollinger Bands ............................................................................................................ 24
4.2.5 Moving Averages ......................................................................................................... 25
4.2.6 Parabolic SAR .............................................................................................................. 26
4.2.7 Stochastic ...................................................................................................................... 27
4.2.8 Fibonacci Indicators ..................................................................................................... 28
4.2.9 Relative Strength Index ................................................................................................ 29
4.2.10 Commodity Channel Index ......................................................................................... 31
4.2.11 Ichimoku Kinko Hyo .................................................................................................. 31
4.2.12 Relative Vigor Index .................................................................................................. 33
4.2.13 True Strength index .................................................................................................... 33
4.2.14 Average true Range .................................................................................................... 34
4.2.15 Camarilla Equation ..................................................................................................... 35
4.2.16 Average Directional Index .......................................................................................... 36
4.3 Fundamental Analysis ......................................................................................................... 37

[iv]
4.3.1 Gross Domestic Product ............................................................................................... 38
4.3.2 Inflation/Deflation ........................................................................................................ 39
4.3.3 Consumer Price Index .................................................................................................. 40
4.3.4 Interest Rates ................................................................................................................ 41
4.3.5 Retail Sales ................................................................................................................... 42
4.3.6 Unemployment Rates ................................................................................................... 44
4.3.7 Industrial Production .................................................................................................... 45
4.3.8 Consumer Confidence Index ........................................................................................ 47
4.3.9 ISM Manufacturing Index ............................................................................................ 48
4.3.10 Interpreting Macroeconomic Issues ............................................................................ 50
4.4 Programming and Robot-Based Trading............................................................................. 54
4.5 Important Resources ............................................................................................................ 60
4.6 Starting an Investment Company ........................................................................................ 61
4.6.1 Location ........................................................................................................................ 61
4.6.2 Legal Structure ............................................................................................................. 63
4.6.3 Important Regulatory Authorities ................................................................................. 64
4.6.4 Licensing ...................................................................................................................... 66
4.6.5 Performance Indicators ................................................................................................. 66
5. Results ....................................................................................................................................... 68
5.1 Trading Strategy .................................................................................................................. 68

[v]
5.1.1 Devin Kehler................................................................................................................. 68
5.1.2 Gabriel McCormick ...................................................................................................... 71
5.2 Company Parameters........................................................................................................... 73
6. Conclusion and Recommendations ........................................................................................... 76
7. Bibliography ............................................................................................................................. 79
Appendix A: Trading Journal ....................................................................................................... 88
A.1 Gabriel McCormick ............................................................................................................ 88
A.2 Devin Kehler .................................................................................................................... 107
Appendix B: Programming Projects ........................................................................................... 120
B.1 Group project .................................................................................................................... 120
B.2 Gabriel McCormick’s Robot ............................................................................................ 122
B.3 Devin Kehler’s Robot ....................................................................................................... 124

[vi]
List of Figures
Figure 1: Trend line defined by three points, and broken by a fourth .......................................... 19
Figure 2: Camarilla pivots expressed as high and low pivot points ............................................. 22
Figure 3: Negative divergence is the setup; the trend line break triggers the trade ...................... 68
Figure 4: Illustration of how CCI and stochastic peaks mimic price peaks .................................. 70
Figure 5: GM 11/15/11Trade 1 ..................................................................................................... 92
Figure 6: GM 11/16/11 Trade 1 .................................................................................................... 94
Figure 7: GM 11-18-11 Trade 1.................................................................................................... 97
Figure 8: GM 11-21-11 Trade 1.................................................................................................... 98
Figure 9: GM 11-21-11 Trade 2.................................................................................................... 99
Figure 10: GM 11-23-11Trade 1................................................................................................. 101
Figure 11: GM 11-25-11 Trade 1................................................................................................ 102
Figure 12: GM 12-2-11 Trade 1.................................................................................................. 104
Figure 13: GM 12-7-11 Trade 1.................................................................................................. 106
Figure 14: November 10, 2011 9:35 AM, 1 lot EURUSD ......................................................... 112
Figure 15: November 16 2011, 10:03 AM, 1 lot EURUSD ....................................................... 115
Figure 16: December 7, 2011, 10:41 AM, 1 lot EURUSD ......................................................... 119
Figure 17: Group Programming Project ..................................................................................... 121
Figure 18: Back testing results for one year ............................................................................... 123

[vii]
List of Tables
Table 1: Gabriel McCormick’s Trades ......................................................................................... 88
Table 2: Trades made on $100K account from 11/02/11 to 12/07/11 ........................................ 107

1. Introduction
In the successful civilizations in human history, methods for investing have always
emerged, as a response to certain needs. Initially, commodities markets appear, in response to
farmers looking to remove themselves from much of the risk associated with the daily market
movements in prices. Stock markets require a more advanced society as a whole, as companies
must be successful, as well as willing to publicly trade their companies (trading ownership in the
company in order to raise capital). Finally, foreign exchange market, as we know it today, only
emerges when there is a need for large and quick global currency transactions, at little risk. In
addition, the foreign exchange market is dependent on moving away from currencies that are
dependent on the gold standard. Investment markets exist to fill their respective needs, and
historically, these markets have always appeared when the need arises.
An investor in the foreign exchange market provides the liquidity for companies that are
looking to exchange currencies. Traders provide this service, and in return, there is the potential
of making profit off of these trades. However, this profit is by no means guaranteed. In addition,
even if a trader is successful, the price of currencies only moves in small fractions of a unit of
currency. Large movements are extremely rare. Thus, profiting off of a trade without much
capital would be extremely difficult, were it not for leverage. Leverage allows investors to
multiply gains and losses, at the expense of exposure to greater risk. Most investing principles
have application in the Forex market, except that for analyzing the market fundamentally
requires a greater understanding of world economics, as well as macroeconomic issues that have
potential to affect currency values. This is the market that our group chose to invest in.

[2]
1.1 Project Description
The ultimate goal of this project is to design and launch an investment company. In this
investment company, the trading strategies will revolve around personal trading strategies of the
group members, which have been translated into investment robots, using the MQL4 language.
The company will have parameters that will be agreed upon by all group members, parameters
that will be thoroughly researched. Design parameters that need to be taken into account are as
follows: location of the company, legal structure, licensing and marketing. The money
management (and risk management) of the company will also be a collective decision, but it
relies heavily both on client needs, as well as different trading strategies.

[3]
2. Background
Investment is a reoccurring event during the many dominant and advanced civilizations
through history, but the reasons for having investments are actually quite similar. However, none
of these historic “markets” have reached the level that investment plays in modern society
however, and the Foreign Exchange market is actually very new in comparison to other markets.
Futures markets were likely the first investment markets to appear in society. Farmers needed to
have a method of selling their crop and livestock at a stable price, rather than according to supply
and demand. “In the ancient history of futures trading, their motivation for doing so was
probably much the same as ours today...to make trading for goods they needed, whether
immediately or later on in the future, easier and more predictable.” (History of Futures Trading)
One of the earliest examples of this is in Babylon, an ancient Sumerian city. Archaeologists have
uncovered clay tokens that are either in the shape of livestock, or have images of livestock on
them(History of Futures Trading). It is believed that set quantities were traded, then sealed in
clay containers that had the number of tokens contained inside marked on the outside(History of
Futures Trading). The belief is that this is how traders promised to deliver a set amount of
livestock, at a set time(History of Futures Trading). It remained important for Farmers to protect
the price of their crop and livestock, so as not to expose themselves to the risks of the market,
which is why the commodities market persisted throughout history. In addition, the ancient
civilizations that protected and encouraged trade prospered, and the most powerful of which
acted as arbitrators, overseeing and regulating trade(History of Futures Trading). It is of no
surprise then that these markets have advanced and persisted into the modern time period.
Stock markets were a little longer in coming around, as they are of a more complex nature.
Investment banks started to appear in both the Roman and Greek civilizations (History of

[4]
Investment Banking in the US and Britain - An Overview). It mostly consisted of providing long
term loans to certain industries (History of Investment Banking in the US and Britain - An
Overview). In the Middle Ages, it is known that the Knights of the Templar involved themselves
in investment banking, as well as commodity trading, on their return from the Crusades(History
of Investment Banking in the US and Britain - An Overview). The first brokers also appeared at
about the same time. “In 12th century France the courratiers de change were concerned with
managing and regulating the debts of agricultural communities on behalf of the banks. Because
these men also traded with debts, they could be called the first brokers”(Stock Market). In the
thirteenth century, merchant families set up trading centers in trading cities (Stock Market). In
addition, Venetian bankers started to trade government securities around this time (Stock
Market). The market was influential enough that in 1351, the Venetian government outlawed the
spreading of rumors in order to impact the value of government funds (Stock Market). It was in
the fourteenth century that other trading metropolis’ followed suit, cities like Pisa, Verona,
Genoa, and Florence; these Italian city-states also saw the first issuing of shares by a company
(Stock Market). These locations fostered this growth because they were not ruled by a Duke, and
were instead an independent city-state that was governed by a council of (usually wealthy)
citizens (Stock Market). Once the basis was laid for both companies issuing stocks, and
investment in government bonds, other countries followed suit. The next major advance saw the
Dutch East India Company, a joint stock company, have a fixed capital stock, which enabled
investors to continuously trade in company stock on the Amsterdam Exchange (Stock Market).
From here, more companies used stock markets to raise money, and more markets were created
around the world. Fast forwarding to today, there are stock markets in every developed economy,

[5]
and access to these markets has been greatly enhanced by using computers and the internet
(Stock Market).
The foreign exchange market is a very new market, probably because of its nature, which is
heavily reliant on globalization. The foreign exchange market is it exists today only began
forming in the 1970’s, after “three decades of government restrictions on foreign exchange
transactions (the Bretton Woods system of monetary management established the rules for
commercial and financial relations among the world's major industrial states after World War
II)” (Foreign Exchange Market). It was around this time that countries started to adopt floating
exchange rates, ending the previous fixed “exchange rate regime” (Foreign Exchange Market).
Previous to the twentieth century, mostly fixed exchange rate systems were used, or currencies
were not exchanged at all. In the past most currencies also held the value that they represented
(for example, gold coins). Thus, since most countries values the precious metals that were used
to create currencies, there was no real need for an exchange rate. Even after the adopting of
currency systems that did not physically represent a value, countries held their currencies to the
gold standard. This meant that a unit of currency represented a specific amount of gold. The idea
was that if currency was not physically valuable, it needed to represent something that was
valuable in order to be accepted. After World War II, under the Bretton Woods agreement, many
countries agreed to adopt a “gold exchange standard”, in which all currencies were fixed to the
value of the dollar, which still was on the gold standard, and the value of gold was set to thirty
five US dollars an ounce(Foreign Exchange Market). This effectively fixed most currencies to a
value in gold as well. However, after a decline in the economic influence of the US dollar
globally, as well as fiscal strain resulting from the Vietnam War, the United States officially
ended reliance on the gold standard, enabling a floating point exchange rate(Foreign Exchange

[6]
Market). Since all global currencies were valued based on each other, this opened up new
possibilities for globally exchanging currencies. Although the foreign exchange market is not
one single exchange, it is considered in such a manner because currency quotes are all very
similar, and base on quotes in London, as it is the unofficial foreign exchange center(Foreign
Exchange Market). The market provides companies with the unique opportunity to exchange
currencies nearly at will, and in large volumes, due to the high liquidity.
Individual traders help provide this huge liquidity, allowing companies to trade large amounts of
currencies almost immediately, and at relatively stable pricing. The average daily turnover in the
global foreign exchange market is estimated at $3.98 trillion dollars, which is nearly unparalleled
by other markets(Foreign Exchange Market). The low return on investments is counterbalanced
with the use of leverage. This enables individual traders to make acceptable profits on very small
price movements (at the cost of higher risk).
Investment has always surfaced in advanced civilizations, as the same needs have always come
to light. However, in the modern world, these needs have been addressed by the modern markets,
which meld new technology with old investing ideas. The commodities markets have existed in
some shape or form as soon as farmers sought a method to remove themselves from the risk
associated with trading in a volatile market dominated by supply and demand. Stock markets
surfaced as soon as companies saw the value in publicly trading stock continuously as a method
of raising capital. Finally, with globalized economies, and global companies, there arose a need
to trade currencies at little risk and in large volume. This has been addressed by the decentralized
Foreign Exchange market.

[7]
2.1 Common Forex Terms
There are a number of terms that are used by traders that have little to no meaning outside
of investment. These terms are important to grasp, as many investment programs and investors
will make reference to them without an afterthought. All of these terms will be encountered often
when trading, and when doing trading research.
2.1.1 Pip
The smallest price change that a security can process (Pip). This changes from currency
to currency, as it depends heavily on the value of one unit or a currency. For instance, in the
Japanese yen US Dollar cross, one pip is one hundredth of a yen. However, in the Euro US
Dollar cross, one pip is one ten thousandth of a euro. This can also be called a basis point. When
looking at currency charts, it is important to keep the pip value in mind, as often measure a
currency to a value smaller than one pip. The profit or loss garnered from a trade depends mainly
on the amount of pips the currency has moved from when the trade was opened to the close, and
on the lot size of the trade. Because profit or loss depends on lot size as well as the pips made or
lost, often the pips made on a trade is used as an indicator of performance. Often, the amount of
pips made by a trader is more indicative that their profit. For instance, take two profitable
traders, one with one hundred thousand dollars in capital, and the other with two thousand
dollars in capital. The traders are going to have very different profits. However, the amount of
pips made is a much more comparable stat, as it doesn’t rely on capital.
2.1.2 Leverage
Leverage is the act of multiplying gains and losses by using a larger amount of capital in
your investment (Leverage Definition). In the Forex market, Leverage allows a trader to buy

[8]
much more money than the trader actually has. This is because the change in price in a currency
is small enough that a lot of money is needed of a currency to make a significant impact. Traders
are allowed to use leverage on the idea that they will not lose any more than their initial
investment. However, with increased leverage comes increased risk. Leveraging and entire
account each trade is highly advised against, as there is a large amount of risk that the account
will be wiped in a single trade. Most investors will only recommend leveraging against two to
five percent of an account at any given time, in order to minimize risk. Countries have different
laws on the maximum leverage that investors are allowed to use. In the United States, recent
legislation has mandated that the maximum leverage used is fifty to one. Other countries have
much higher leverages, at four hundred or five hundred to one. However, a resident in the United
States will have a lot of difficulty setting up accounts in another country, as the IRS is cracking
down on these instances. Generally, a leverage of fifty to one should be sufficient for most
trading strategies.
2.1.3 Lot Size
The lot size is a measure of the amount of units of a currency being purchased in a trade.
One standard lot is one hundred thousand units of the base currency of the currency pair being
traded (Forex Lot Sizes and Risks). Other sizes available are mini lots, which are ten thousand
units of the base currency, and micro lots, which are one thousand units of a base currency. Note
that if the base currency is different than the currency that a trader’s account, the amount of
money in the trade will be the amount of units being traded of the account currency, multiplied
by the currency conversion to the base currency of the trade. The lot size directly affects the
profit or loss garnered from a trade. For instance, if the base currency is USD, then the profit
from one pip would be ten dollars for one standard lot, one dollar for one micro lot, and ten cents

[9]
for one mini lot. Thus, trading in smaller lots sizes will minimize risk, loss and profit, while
trading with higher lot sizes will increase risk, profits, and losses. If an account has a maximum
leverage of 50:1, two thousand dollars is required to purchase one standard lot of a base
currency, provided that the base currency is either worth less than the account currency, or the
base currency is the account currency. As covered in leverage, a trader usually does not want to
be using the maximum leverage allowed for the size of account, as this will maximize the risk
associated with trading, and will likely result in wiping the account.
2.1.4 Bid Price
The bid price for a security is the price that the market or a buyer is willing to buy. In
Forex, this is the price that the base currency is being bought at, and the price that a trader will
likely have to pay to buy the base currency (Bates). When closing a short trade, this is the price
that the order will be closed at, and this will be the price that will be initially be filled if a trader
goes long.
2.1.5 Ask Price
The ask price for a security is the price that the market or buyer is willing to sell. In
Forex, this is the price that the base currency is being sold at (Bates). When closing a long
position, this is the price that the order will be closed at, and when opening a short position, this
is the price that the order will be filled at.
2.1.6 Spread
The difference between the bid and the ask price (Bates). This amount varies depending
on the broker being used, as well as the time of day and the currency pair being traded.
Typically, the lowest spreads for a broker will be for the major pairs, while less traded currency

[10]
pairs will have higher spreads. The lowest spreads for a broker are typically seen during the
times of the highest activity, which is usually during the London session into the New York
session. Finally, the spread has a large impact on selecting a broker, but this will be covered later
in the section Choosing a Broker. When entering a trade, a trader must first make enough pips to
surpass the spread when the order was filled in order to make profit on a trade. Normally, the
spread will be no more than three pips for a major currency pair, and will probably be between
one and two pips, for a decent broker. Low spreads are due to the liquidity that is available to
traders of the Forex Market.
2.1.7 Short/Long
Taking a long position on a currency pair means that a trader is buying the base currency,
with the intention that the value of the base currency will increase and/or the value of the quote
currency will decrease (Long (or Long Position) Definition). Taking a short position on a
currency pair is synonymous with selling the base currency. This is done with the intention that
the value of the base currency will decrease, and/or the value of the quote currency will increase
(Short (or Short Position) Definition).
2.1.8 Currency Pair
A currency pair is a measure of the relative value of one unit of currency against one unit
of a different currency. The currency being quoted is called the base currency, while the currency
being referenced is the quote currency, or the counter currency. All of Forex trades are made
within a currency pair, as currencies must be compared in order to have value. The currency
pairs that are traded the most globally are called the Majors, and contain the euro, US dollar,
Australians Dollar, Japanese Yen, Swiss Franc, Canadian dollar and Great Britain’s pound
sterling. There is a priority ranking as to which currency takes the base position in the currency

[11]
pair, although there is no actual standard for this. Any other currency is considered a Minor, and
is generally only traded in a pair with a Major. The Major pairs are EUR/USD, USD/JPY,
GBP/USD, AUD/USD, USD/CHF, and USD/CAD.
2.1.9 Margin Call
Issued when the capital in the margin account in less than the minimum margin
requirement set by the broker, a margin call is a demand to either increase the capital in the
margin account, or close out the current position (Hassam). Generally, this only happens when
an account gets wiped as the result of either snowballing bad decisions by a trader (like adding to
a losing trade), or market conditions that cause rapid loss. Margin calls are never good news, and
as a trader, it is important to use discipline and take steps to minimize risk, which in turn will
minimize the risk of receiving a margin call.
2.1.10 Stop Loss
A stop loss is an order that is placed in advance, which then executes a sell (or close)
when the security’s value reaches a certain point (Stop-Loss Order). Stop losses are usually an
important factor to consider in risk management, as they are the best way to avoid damages
resulting from huge swings in the market. It is recommended, especially to beginning traders, to
have a stop loss on every trade executed.
2.1.11 Take Profit
Similar to a Stop Loss, a take profit order is placed in advance, and executes a close order
when the price reaches a certain point, or the price is a certain number of pips above the filled
price (Take-Profit order - T/P). As the name implies, the take profit is used to secure profits once
the price reaches a trader-determined point. A take-profit is only really necessary if the trader is

[12]
not actively involved in the trade. Otherwise, the take profit can be used as a risk management
tool in order to lock in profits.
2.1.12 Currency pairs
EUR: The euro, the currency of the European Monetary Union.
USD: The United States dollar.
GBP: Great Britain’s pound sterling.
AUD: The Australian dollar.
NZD: New Zealand dollar
CHF: Swiss franc
JPY: Japanese yen
CAD: Canadian dollar

[13]
3. Methodology
The end result of this project is to set up and manage an investment company that will trade
in the Forex market, using programmed robots. In order to complete this goal,we conducted
many weeks of research in order gain a better understand of investing, as well as learning the
MQL4 language, so we could better program the robots that will eventually make trades for the
company. Our process can be broken into three steps:
• Research – From the history of investing to the common terms and what they mean, there
was a lot to understand before we were ready to trade in the Forex market.
• Trading – in order to make successful trading robots, we first needed to formulate and
mature our own trading strategies. This part of the research was focused on different
indicators, what each one can tell us, and how reliable or useful that information can be.
• Understanding the company – once we had a good grasp on the Forex market and how to
trade in it, the only thing left was to learn how to form a money management company.
We researched the tax laws, trading regulations, and other legislature surrounding the
Forex market, so that we could make informed decisions about how to run our company.

[14]
4. Execution
4.1 Choosing a Broker
When choosing a broker for trading the Forex Market, it is important to consider that
these are companies that are trying to make money off of your business. Perhaps one of the most
important considerations is whether this is a large broker, and whether other traders use this
broker. A broker’s quality of service and reputation is as, if not more important than the spreads
and amenities that the broker offers. This not to say that these factors should not be considered,
but rather that it is important to select a broker that is not constantly trying it’s best to rip off the
traders that it services. Larger brokers have better reputations, and thus are much less willing to
threaten that reputation with unethical business practices.
Forex brokers come in three main types; dealing desk brokers (DD), Straight Through
Processing broker (STP), and Electronic Communications Network brokers (ECN) (Greenburg,
Finally the Brokers Guide explaining what Marker Maker, STP and ECN broers really are: Part
1/2). Dealing desk brokers (sometimes also called market makers) don’t forward trades to the
market, because the broker is the client’s market. They take the opposite side of an order placed
with the broker. In other words, a DD broker will both buy and sell with its clients, and hope to
make a profit on the bid-ask spread and/or turn. They provide a market for their clients to trade
on by supplying the liquidity. Interestingly, because orders are never routed to the market, a
trader will very rarely see a re-quote an order placed. Instead, the broker chooses whether to
accept the trade or not (Greenburg, Finally the Brokers Guide explaining what Marker Maker,
STP and ECN broers really are: Part 1/2). This usually only happens in periods on high volatility
in the market, like when breaking news is occurring, in which the broker does not want to
overexpose itself to risk. Dealing desk Forex brokers have received a lot of criticism in the past

[15]
few years because of the idea that they are invested in having its clients fail. Although it is true
that dealing desk brokers profit from traders losing money, this does not mean that the broker is
unethical, as all the large brokers are regulated, and would not last very long as a business if they
were ripping off their customers. However, smaller, unregulated businesses will sometimes ride
the edge of unethical business practices in order to garner more profit, which is one reason why it
is important to select a Forex broker that has many clients, and is regulated.
Electronic Communication Network (ECN) brokers, on the other hand, provide their
clientele with direct access to the market, acting as a true broker, providing a medium to connect
buyer and seller. The broker applies a markup to the actual bid-ask spread, and pockets that
markup (Greenburg, Finally the Grokers Guide explaining what Market Maker, STP and ECN
brokers really are: Part 2/2). This provides for the broker’s main source of income, typically.
However, true ECN brokers are not commonly available to individual traders, as they usually
require a large account size, and minimum lot sizes on trades, in order to facilitate profits
(Greenburg, Finally the Grokers Guide explaining what Market Maker, STP and ECN brokers
really are: Part 2/2). If a trader had access to these kinds of resources, an ECN broker would
probably be a good choice. However, for most traders, ECN brokers are not a possibility.
Most brokers fall under the category of Straight through Processing (STP) brokers. These
are brokers that provide quotes that have correlation to the market’s quotes (Greenburg, Finally
the Grokers Guide explaining what Market Maker, STP and ECN brokers really are: Part 2/2).
However, many brokers that claim a STP brokerage method use a combination of Dealing Desk
(DD) and STP practices. Successful or larger clients will be routed directly to the market.
However, smaller or losing traders will have their orders filled by the broker (Greenburg, Finally
the Grokers Guide explaining what Market Maker, STP and ECN brokers really are: Part 2/2).

[16]
This combination allows brokers to maximize profits and clients, and all the while they can claim
to be a non-dealing desk broker. Although it can be very hard to tell the difference between a DD
and a STP broker, it should be noted that most large companies are not specifically out to get
their clients, and force them into loosing situations. This is due to transparency and regulations.
In addition, when a company has unethical business practices, they usually quickly earn a
reputation for it, and lose clients. It just isn’t profitable (at least for very long) to rip off clients as
a big broker.
Other than a broker’s practices, it is important to select a broker based on specific trader
needs. Most brokers offer similar amenities, like mobile trading platforms, and twenty four
hours, seven days a week customer service. In addition, many brokers will provide recourses for
beginning traders. These resources might include, but are not limited to, custom technical
indicators and tools, live news feeds, predefined trading strategies, and real-time analytics.
However, each trader should decide how important these are when selecting a broker themselves.
More importantly, most major brokers offer a Meta Trader 4 client (which is both free and the
minimum standard for the industry). Some brokers also offer their own proprietary trading client
that usually has more user friendly options and indicators. Again, the trading platform is
completely up to the trader, as Meta Trader 4 is and extremely competent and powerful client,
that also includes a programming client for creating indicators and trading robots, as well as
custom scripts. All trading clients will require a bit of a learning curve, as they are complex by
nature, but most proprietary clients are generally easier to use.
The minimum spreads offered are the most bragged about statistic by brokers, and very
important to consider, as every trade made will be affected by the spread. The bid-ask spread is
the reason why every trade starts in the red; to be profitable the price of the currency pair must

[17]
rise above the filled price plus the bid-ask spread. Lower spreads are sought after because they
allow a trade to become profitable, faster. The dependency on spreads depends on a trader’s
trading strategy. Traders looking to trade over very long periods of time would likely care less
about spreads, as they are looking to make many pips on a single trade. One to three pips is
going to have a minimal impact on a trade of larger than one hundred or more pips. However, for
short term traders, the spread has much more of an impact, as each trade must overcome that one
to three pips initially to become profitable, when most trades are under ten or twenty pips. These
traders generally make more trades as well, so the spread adds up. Lower spreads are always
better, but it is important to weigh the importance of low spreads in a trading strategy when
settling on a broker. In addition, it is not worth it to switch to a much smaller broker due to very
low spreads. Stay with a broker with an established reputation, and endure slightly higher
spreads in order to have peace of mind that your money is safe. Typically, the lowest spreads for
major brokers will be around one to two pips, while higher spreads for major brokers are two to
three pips. This is for the major currency pairs at peak times, and does not apply to minor
currency pairs, or off-peak hours for trading.
The minimum account size for a Forex broker is another factor that varies in importance
depending on the amount of capital available to the trader. Some brokers offer a minimum of
only fifty dollars to open an account. Others require that you open an account of one thousand
dollars or more. Some traders won’t need to consider these limitations, but others might need to
select a certain broker because they are the only broker to offer the optimal account size. This
also will vary on the experience of the trader in question, as a more experienced trader is likely
to want to open a larger account. However, if a trader is just starting out, they might only want to
invest fifty or one hundred dollars initially, or whatever amount they feel comfortable, knowing

[18]
that they could lose it all (and likely will!). In addition, although some brokers offer small
account sizes, their customer service for smaller accounts is lacking. This will come out while
researching brokers.
Selecting a broker involves a lot of research, and should not be a decision that is made
lightly. Your choice is likely to have a large impact on your trading, so it is important to select a
broker that both has a good reputation first, and secondly provides the optimal amenities and
trading climate for your trading strategy. These factors include the minimum spreads, minimum
account sizes, customer service, and proprietary trading software. The importance of these
factors varies wildly from trader to trader, but in general, all should be accounted for when
choosing a broker to trade on the Forex Market.
4.2 Technical Indicators
Technical analysis is the use of past market data in order to more accurately predict
future market movements. Generally, this involves the identification of price patterns in the
actual market price, or indicators that are designed using market price and volume, as well as
other variables. It is important to understand the limitations of technical indicators; all indicators
are simply representative of past data. Technical indicators cannot provide the user with new
information; they can simply represent it in a different manner, one that hopefully allows the
reader to more easily identify market patterns. In addition, it is unwise to rely wholly on one
method or indicator. Instead, it is wise to have multiple indicators that present different data. In
this way, a trader can have a system of checks before getting into a trade. This minimizes the
risk.
There are a number of principles that technical analysis employs. The first is that the
market discounts everything. Technical analysts assume that the current price is an accurate

[19]
representation of the security. In other words, at any point in time, everything that can be
reflected in a securities price, is. The second principle is that price moves in trends. It is up to the
technical analyst to identify these trends, and act upon them. Technical indicators are designed to
help traders better identify these trends, often filtering out unnecessary data, in order to represent
a specific aspect. Finally, a technical analyst believes that history repeats itself. Knowledge about
the past provides important knowledge of the future. This is based on the idea that investor
behavior is repetitive, as well as investor sentiment. Knowing how the markets have reacted in
the past can lead to understanding how they will act in the future.
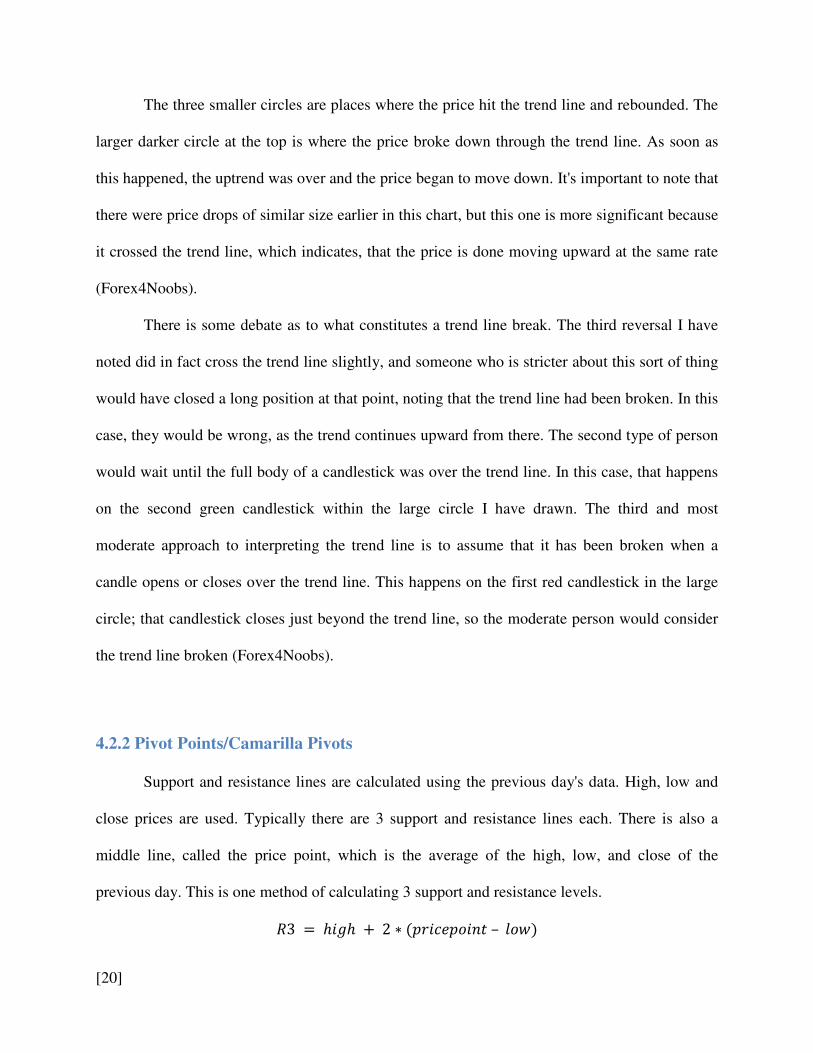
4.2.1 Trend Lines
Probably the most important tool in identifying patterns in price movement is the trend
line. Trend lines are very simple to understand; if the price breaks through a trend line, up or
down, the trend is over. If not, the trend continues and the trend line is used as a
support/resistance line depending on the trend. Below is a chart of USD/JPY on a 5 minute
period, with an upward trend line drawn in.
Figure 1: Trend line defined by three points, and broken by a fourth
[20]
The three smaller circles are places where the price hit the trend line and rebounded. The
larger darker circle at the top is where the price broke down through the trend line. As soon as
this happened, the uptrend was over and the price began to move down. It's important to note that
there were price drops of similar size earlier in this chart, but this one is more significant because
it crossed the trend line, which indicates, that the price is done moving upward at the same rate
(Forex4Noobs).
There is some debate as to what constitutes a trend line break. The third reversal I have
noted did in fact cross the trend line slightly, and someone who is stricter about this sort of thing
would have closed a long position at that point, noting that the trend line had been broken. In this
case, they would be wrong, as the trend continues upward from there. The second type of person
would wait until the full body of a candlestick was over the trend line. In this case, that happens
on the second green candlestick within the large circle I have drawn. The third and most
moderate approach to interpreting the trend line is to assume that it has been broken when a
candle opens or closes over the trend line. This happens on the first red candlestick in the large
circle; that candlestick closes just beyond the trend line, so the moderate person would consider
the trend line broken (Forex4Noobs).
4.2.2 Pivot Points/Camarilla Pivots
Support and resistance lines are calculated using the previous day's data. High, low and
close prices are used. Typically there are 3 support and resistance lines each. There is also a
middle line, called the price point, which is the average of the high, low, and close of the
previous day. This is one method of calculating 3 support and resistance levels.
�3 = ℎ��ℎ + 2 ∗ (� ��������– ���)

[21]
�2 = � �������� + (ℎ��ℎ– ���) = � �������� + (�1– �1)�1 = (� �������� ∗ 2)– ����1 = (� �������� ∗ 2)– ℎ��ℎ
�2 = � ��������–(ℎ��ℎ– ���) = � ��������–(�1– �1)�3 = ���– 2 ∗ (ℎ��ℎ– � ��������)
The higher the support or resistance, the more powerful it is; the price is less likely to
break through R2 than R1, and even less likely to break through R3. If the price fails to break
through, that line will rebound the price, so these lines indicate fairly strong movement one way
or the other, it's just a matter of knowing which way the market will move(Lee, Forex Pivot
Point Trading Tutorial).
A slight variation on normal pivot points, Camarilla pivots, developed by Nick Scott,
offer more resolution in support and resistance levels. The main difference is that there are more
Camarilla pivots than normal pivots. Sometimes the Camarilla pivots are better indicators than
standard pivot points as they offer more resolution. The Camarilla pivot points also have a center
line called a pivot point, which follows what the “typical” price would be.
�4 = � + ����� ∗ 1.1/2�3 = � + ����� ∗ 1.1/4�2 = � + ����� ∗ 1.1/6�1 = � + ����� ∗ 1.1/12�� = (ℎ��ℎ– ���– ��� �)/3
�1 = �– ����� ∗ 1.1/1
�2 = �– ����� ∗ 1.1/6�3 = �– ����� ∗ 1.1/4

[22]
�4 = �– ����� ∗ 1.1/2
These pivots are used the same way as other pivot points. It's not a good idea to use these
in conjunction with other pivots points as the chart will become cluttered, and the two sets of
pivot points aren't necessary or helpful, and they may convey information in contradicting ways.
Above is the chart of USDJPY on a five minute period with four support lines and four
resistance lines. The chart demonstrates how the higher pivot points give more
support/resistance. At the far left, the price hits the H2 line twice and reverses both times. On the
third attempt, the price breaks through H2, then H3, but the bodies of the candlesticks never
reach the H4 line. The same happens on the lower side; when the price approaches L2, L3 and
even L4, it breaks through, but L5 is never reached as it provides much stronger resistance.
The center pivot line can also act as support or resistance. When the price first starts to
move down in this chart, it finds brief support at the center pivot. The same happens when the
center line is tested from the other side. The center pivot is “weaker” than any of the other
Figure 2: Camarilla pivots expressed as high and low pivot points

[23]
support or resistance lines, but if the has little momentum, it can and will bounce from there
(Camarilla Pivot Points).
4.2.3 Moving Average Convergence/Divergence
The Moving Average Convergence/Divergence (MACD), developed by George Appel, is
a lagging indicator that consists of two exponential moving averages (EMA), and a histogram.
The MACD line is a slower moving average of closing prices ranging from twenty-six days to
twelve days, with the twelve day moving average being a reactive setting, and a twenty-six day
moving average being a resistive setting. The other, the trigger line, is a faster EMA, typically 9
days. The histogram is the difference between the MACD line and the trigger (Lee, Forex
MACD Indicator Explained). The MACD indicates trend in a basic manner. If the moving
averages are above the zero line, the trend is positive, and if the moving averages are below the
zero line, the trend is negative. The result of combining moving averages with a momentum
calculation is that it can indicate market trends and market momentum. Important indicators that
are produced by the MACD are crossover points and areas of divergence. A bullish crossover
occurs when the MACD line crosses the trigger line, heading upwards. On the other hand, a
bearish crossover occurs when the MACD line crosses the trigger headed downwards (Lee,
Forex MACD Indicator Explained). It is recommended that when trading crossovers, a leading
indicator, like the Stochastic Oscillator is used to determine the condition of the commodity.
Then place an order if there is a crossover and the commodity is oversold/overbought (Lee, The
MACD Crossover Trading Techniques). If both indicators are not indicating a reversal, a trader
would put a lot of risk into placing a trade. In addition, if a strong trend is not established after
the crossover, it is very likely that the market is more volatile, and risky to trade in. Divergence
means that the price is showing a trend opposite that of the MACD. For instance, if the price is
[24]
reaching new highs, but the MACD is failing to surpass its previous highs, the MACD is
exhibiting divergence. Trading divergence can be a bit trickier, as it requires a distinct trend in
place. Once there is divergence, then it is important to either wait for either reversal patterns in
the candlestick graph, or for a break in the trend line. Crossovers can also be used to provide an
exit to a trade, as it could be a signal for an impending reversal (Lee, The MACD Crossover
Trading Techniques).
4.2.4 Bollinger Bands
Bollinger Bands is an indicator that determines the volatility of the current market,
originally calculated by John Bollinger. It is composed of two “bands,” which are simple moving
averages, one which adds and one which subtracts twice the standard deviation (Lee, Forex
Bollinger Bands Explained). Sometimes, the simple moving average is plotted in between,
typically at a value of twenty periods. The wider apart the two bands are, the more volatile the
market is, while if the bands are close together, the marker is in a period of consolidation. In
addition, the Bollinger Bands often act as a resistance and support level for the price (Lee, Forex
Bollinger Bands Explained). Often, you can use this to your advantage, and trade the reversal
when the price approaches the bands, as it tends to bounce off the bands. In addition, the
Bollinger Bands indicate a breakout, when the bands diverge from each other after a period of
consolidation (Lee, How To Use Bollinger Bands). Again, these techniques should be supported
by other indicators. “According to Bollinger, the bands should contain 88-89% of price action,
which makes a move outside the bands significant” (Bollinger Bands). Bollinger highlights an
important fact, but these movements outside of the Bands are not signals, they are just areas of
note, and could indicate a movement in the future. Two signals can be generated through
Bollinger Bands; the W-bottom, and the M-top. The W-bottom occurs when the price has two

[25]
bottoms, and indicates a buy signal. The second bottom is lower than the first, but fails to cross
or intersect with the lower Bollinger Band. An M-top occurs when there is a double peak, a head
and shoulders, or a diamond pattern, and generates a sell signal (Bollinger Bands). Lastly,
Bollinger Bands can be used for range trading by trading the long when the price approaches the
bottom Bollinger Band, and shorting when it approaches the top Bollinger Band (Lee, How To
Use Bollinger Bands). This should be done only in a period of consolidation.
4.2.5 Moving Averages
A very simple indicator, a Moving Average can be used to trade in a variety of ways. The
simplest, and possibly the most useful, is as trend indicator. There are two types of moving
averages, exponential and simple (Lee, Forex Moving Average Explained). A simple moving
average weights every value the same, and is more resistant to sudden moves in the market.
Exponential moving averages (EMA) weight recent prices more heavily, resulting in a moving
average that is more reactive (Lee, Forex Moving Average Explained). When using moving
averages in trading, a two hundred EMA can act as a long term trend line, and adding multiple
moving averages with different time settings can allow the trader to better understand the current
trend (Lee, How To Trade Using Moving Average). This can also be an indicator of the strength
of the current trend. When the moving averages are bunched together, the trend is not very
strong. However, when they spread out at a consistent angle, the trend is very strong. Finally,
moving averages can be used as an entry or an exit signal, using a double or triple moving
average crossover. When the fast moving average crosses the slow one (or both the slower ones)
it is an indication of a reversal (Lee, How To Trade Using Moving Average). However, because
of the lagging nature of moving averages, it is not very dependable, and can often produce a false
signal, or only produce a signal after it would be ideal to get into a trade (Lee, How To Trade

[26]
Using Moving Average). Simple moving averages act as better support and resistance levels than
EMA, mostly because of their resistance to movement. It is also important to note that because
the MACD is calculated using EMA, it will not match up with a simple moving average, but will
with EMAs (Simple and Exponential - Moving Averages). When a large trend is in place, price
crossovers can be used to indicate a support or resistance level. A shorter moving average could
provide support/resistance, while a longer moving average would provide the overall trend.
When the price crosses the shorter moving average, if the trend is strong, buy if it drops below,
and sell if it rises above, as this indicates a correction, but not a change in trend (Simple and
Exponential - Moving Averages). However, this can be risky, as the moving averages are not
always great support/resistance levels, and often the market moves too quickly for the price to
drop or rise over a longer moving average.
4.2.6 Parabolic SAR
The Parabolic SAR is a leading indicator that is used to identify the end of a trend, or to
identify entry or exit points. Originally calculated by Welles Wilder, it is a simple indicator, with
the points plotted below the candlesticks if the trend is upwards, and the points plotted above the
candlesticks if the trend is downward (Lee, Forex Parabolic SAR Indicator Explained). However,
the calculation of it is complicated. The Parabolic SAR makes use of a number of variables, such
as the prior SAR (the previous plotted SAR point), the Extreme Point (EP), which is the highest
high or lowest low of the current trend, and the acceleration factor (AF) (Parabolic SAR). The
AF is a value that starts at .02, and increases by .02 every time there is a new high in an uptrend,
or a new low in a downtrend. The AF can reach a maximum value of 20 (Parabolic SAR). The
rising Parabolic SAR is calculated by:
�! ����"�( � ���) = � �� �"� − � �� "$(� �� %� − � �� �"�)

[27]
It is important to note that the current SAR (rising) cannot be above the previous periods
low or above the current low. If this is the case, the lower of the two is used (Parabolic SAR).
The falling SAR is calculated by:
�! ����"�(&������) = � �� �"� − � �� "$(� �� �"� − � �� %�) The current SAR (falling) cannot be below the previous periods high or the current high.
If either is the case, the higher of the two is used (Parabolic SAR). From these equations, the
parabolic SAR’s tendency to lag behind the current market values can be seen; this is because it
uses the previous point’s data in the calculation. From experience, it is necessary to use other
indicators with the Parabolic SAR, as it produces a lot of false signals, often in a short period of
time. Wilder himself notes that it is only useful in times of strong trend, which is about thirty
percent of the time (Parabolic SAR). For the other seventy percent, it is prone to false signals. If
the dots are steep and wide, the market is probably in a period of breakout (Lee, Forex Parabolic
SAR Indicator Explained). Knowing the established trend before using Parabolic SAR is
important, as trading against the trend using Parabolic SAR will likely cause repeated losses.
4.2.7 Stochastic
Another leading indicator, the Stochastic Oscillator, is an accurate indicator or oversold
or overbought market conditions. Originally calculated by George Lane, it is comprised of two
lines, the %K and the %D, the sensitivity of which can be altered to suit each trader’s needs, with
sensitivities usually falling within the categories of full, fast or slow, with either fast or slow
being the most popular (Lee, Forex Stochastic Indicator Explained). The stochastic occurs
between a fixed range of zero to one hundred, with levels of note being twenty and eighty. To
calculate the fast %K of the Stochastic Oscillator:

[28]
%( = �! ������ � − ���� ����ℎ��ℎ� �ℎ��ℎ − ���� ���� ∗ 100
The %D is the three day SMA of %K (Stochastic Oscillator). The slow stochastic uses
the fast %K smoothed with a three period SMA, while the full Stochastic uses the fast %K
smoothed with the period inputted (Stochastic Oscillator). When the Stochastic is above eighty,
the market is overbought, while the market is oversold when the Stochastic is below twenty.
When the Stochastic remains near or above eighty, the market is trending upwards, and when it
is remaining at or below twenty, the market is in a downtrend (Lee, Forex Stochastic Indicator
Explained). The crossover of the %K and %D lines is important when in overbought or oversold
conditions, as this could indicate an impending reversal (Lee, Forex Stochastic Indicator
Explained). When trading using the Stochastic, the idea is to buy or sell when the %K and %D
cross, and the Stochastic moves out of oversold or overbought conditions. It can also provide an
exit signal, much in the same way (Lee, Forex Stochastic Indicator Explained). Once the market
enters the opposite condition that the trade was executed after, and the %K and %D cross, it is
time to exit the trade (Lee, Forex Stochastic Indicator Explained). Stochastic divergence from the
price trend can also be used to indicate an impending reversal.
4.2.8 Fibonacci Indicators
Fibonacci Indicators provide information about supports and resistances in the market.
Although the Fibonacci sequence is a sequence of numbers, it is the ratio of these numbers that is
used in trading. To use the indicator, a low area and a high area of a particular trend have to be
defined. Once defined, the ratio lines will be drawn. The retracement levels, the most important
of which are the ratios of 0.382, 0.500, and 0.618, provide strong support and resistance to the
market price (Lee, Forex Fibonacci Indicator Explained). The Fibonacci extension levels of
[29]
0.618, 1.000 and 1.618 are the strongest levels of support and resistance for the extension levels
(Lee, Forex Fibonacci Indicator Explained). Generally, if the market is on an uptrend, the lowest
point is selected in the trend, and then the highest point is selected using the Fibonacci tool on
the trading platform. This will draw the various Fibonacci ratios. To trade using these ratios, wait
for the price to fall to the 0.382, 0.500, or 0.618 levels (Fibonacci Method in Forex). This should
be the entry point, where the trader buys in an uptrend. Ideally, the price then rises to one of the
extension levels, 0.618, 1.000, or 1.618 (Fibonacci Method in Forex). At this point the price is
likely to stall, so one of these levels (depending on market momentum) would be the exit point.
However, if the trader were a countertrend trader, a low risk trade would to trade opposite the
current trend when the market price reaches one of these extension levels. The same steps apply
to a downtrend in the market, except when setting the Fibonacci ratios, the high of the current
trend is selected first (Fibonacci Method in Forex). The Fibonacci Fan is an indicator that uses
Fibonacci ratios in conjunction with price to create future support and resistance levels
(Fibonacci Fans). Often the price will continue to remain within the confines of the ratios created
by the fan. However, breakouts are always possible, so a tight stop loss is advised, either just
above the previous peak, or just below the previous low, depending on the trade being entered.
False signals are always possible, so make sure to check with other indicators to minimize risk.
4.2.9 Relative Strength Index
The Relative Strength Indicator (RSI), developed by Welles Wilder, is used to indicate
overbought and oversold markets, but it actually measures market momentum. The RSI has a set
range from zero to one hundred (zero and one hundred being the absolute maximum values). The
typical indication levels are thirty and seventy, where anything under thirty indicates an oversold
market, and anything above seventy indicates the opposite (Lee, Forex Relative Strength Index

[30]
Indicator Explained). To calculate the RSI, divide the average gain by the average loss (Relative
Strength Index (RSI)). The average gain and average loss are calculated by:
"*� ���+��� = ,(� �*��! "*� ���+���) ∗ 13 + �! �������-14
"*� ���.� = ,(� �*��! "*� ���.� ) ∗ 13 + �! ���.� -14
Since the equations use the past average gains and losses, the first average gain and
average loss are calculated as the sums of the respective average over fourteen periods, divided
by fourteen (Relative Strength Index (RSI)). In trading, the RSI can be used to buy during a dip
(when the price is trending upward, but the market corrects itself, bringing the price down for a
short bit, before returning back upwards), or selling during a rally (Lee, Forex Relative Strength
Index Indicator Explained). RSI can also be used for range trading, but it is important only to
trade when the price is nearing a support or resistance level, and the RSI is indicating oversold or
overbought. In addition to its uses as a buy/sell signal, the RSI indicates trends (Lee, Forex
Relative Strength Index Indicator Explained). When the RSI is over 50, there is an uptrend.
When it is below 50, there is a downtrend. However, this is more short term than most trend
indicators, and is great for avoiding fake outs (when a price is dropped for the purpose of
activating sell signals, only to be brought up rapidly, or the opposite). Finally, RSI divergence
from the price can provide a warning as to when the market will reverse itself. When the price is
setting highs higher than the previous highs, but the RSI fails to beat its own previous highs,
there is negative divergence, with the opposite being true for positive divergence (Lee, Forex
Relative Strength Index Indicator Explained). These often indicate that there is an impending
reversal. However, it is risky to actually use this as anything more than an exit signal, as it could
be a while of the market consolidating before the reversal occurs.
[31]
4.2.10 Commodity Channel Index
The Commodity Channel Index (CCI) has four levels of note, with each one indicating
the strength of a trend. If the CCI is above positive one hundred, the trend is upwards, and if the
CCI is above positive two hudnred, there is a very strong uptrend (Lee, Forex CCI Indicator
Explained). On the other hand, if the CCI is below negative one hundred, the trend is down, and
is very strongly so if it is below negative two hundred (Lee, Forex CCI Indicator Explained). The
CCI calculation is:
��/ = (�0������ ��� − 20�� ��1�2"�&�0������ ���)(0.015 ∗ 2���1�*������)
40������ ��� = ℎ��ℎ + ��� + ��� �3
Generally, when using the CCI during trading, a long position can be held if the CCI is
above on hundred, and can be held until it returns back to that level, at which point the trade
should be exited. The opposite is true for shorting a trade. The CCI can also be used to indicate a
reversal. If a trend line is broken, the CCI can reliably report the direction the market is heading,
and if it is heading towards a breakout (Lee, Forex CCI Indicator Explained). When the CCI
diverges in trend from the price, it is a good indication of an impending reversal (Lee, Forex CCI
Indicator Explained). Again, this should not be used to trade the reversal, but more as an
indicator for exiting a trade. This indicator also reports overbought and oversold conditions well,
as any market over either two hundred level is, if negative, oversold, and overbought if positive.
4.2.11 Ichimoku Kinko Hyo
Ichimoku Kinko Hyo is an equilibrium chart that is designed to provide quick
information about an assets equilibrium behavior. The graph itself is composed of five lines:
Tenkan-sen, Kijun-sen, Chikou Span, Senkou Span A, and Senkou Span B(Ichimoku Kinko

[32]
Hyo). The Tenkan-sen averages the high and the low over a period of seven to nine, and Kijun-
sen uses the same formula, except it is calculated over twenty two periods(Ichimoku Kinko
Hyo). Chikou Span plots the most recent closing, twenty two periods behind(Ichimoku Kinko
Hyo). Senkou Span A averages Tenkan-sen and Kijun-sen, and is plotted twenty six periods
ahead(Ichimoku Kinko Hyo). Senkan Span B averages the high and low over the last forty four
periods, and is plotted twenty two periods ahead(Ichimoku Kinko Hyo). The difference between
the Senkan Span A and B is the Kumo, or cloud(Ichimoku Kinko Hyo). Although this is known
as a powerful tool in technical analysis, it can be a little tricky to use it in Forex trading because
the markets do not close. A common solution is to use the NYSE’s close time for the value of the
close, as there is relatively little trading on the market that the time(Ichimoku Kinko Hyo). There
are many ways to trade using this indicator. The Kijun-sen line can be used to indicate
momentum, as if the price is above the Kijun-sen, the prices are likely to continue to
increase(Ichimoku Kinko Hyo). In addition, when the Tenkan-sen crosses the Kijun-sen from
below, it is an indication of a bullish market. The opposite is also true(Ichimoku Trading
Strategies). If the Kijun-sen is above the price it is likely that the price will continue to move
downwards and the market is bearish if the Tenkan-sen crosses the Kijun-sen from above.
However, these indicators are only strong if they are generated above the Kumo(Ichimoku
Trading Strategies). If they are generated within the Kumo, it is a normal indication, and if they
are below the Kumo, they are weak(Ichimoku Trading Strategies). Tenkan-sen can be used to
indicate trend. The direction of the Tenkan-sen indicates the direction of the price, while a flat
Tenkan-sen means the market is in a consolidation period(Ichimoku Trading Strategies). Lastly,
the Kumo acts as a support and resistance level, depending on whether it is above or below the
current market price.

[33]
4.2.12 Relative Vigor Index
The Relative Vigor Index (RVI) is a volatility indicator, based on the assumption that in a
bullish market, the tendency is for the closing price to be higher than the opening, and in a
bearish market, the closing price is usually lower than the opening price (Relative Vigor Index
(RVI)). To calculate the RVI:
�5/ = ��� � − ����ℎ��ℎ − ���
The RVI is very similar to the Stochastic Oscillator, except it compares the close to the
open, rather than the low(Relative Vigor Index (RVI)). Essentially, the RVI calculates an
indicator for the volume of trades. It is not an indicator of when to trade, but it can be used to
determine how fast the market is moving before and during a trade (Relative Vigor Index (RVI)).
In addition, it can be used by the trader to predict how the market will react in the future. If a
short moving average is added to the RVI, it can be used as a trigger to produce a buy or sell
signal.
4.2.13 True Strength index
The True Strength Index (TSI) is a momentum indicator that is similar in many respects
to the Relative Strength Index, and indicates oversold or overbought assets. It is calculated by
taking the difference between the current asset price and a lagging asset price, and then a twenty
five day EMA is applied to the difference, with a thirteen day EMA applied to that (True
Strength Index (TSI) Definition). Finally, it is placed within a positive one hundred to negative
one hundred range. A signal line is also plotted, typically as a seven day EMA (True Strength
Index (TSI) Definition). This signal line is used to identify reversals in the market. When the TSI
is above twenty five or below negative twenty five, the market is overbought and oversold,

[34]
respectively, and when the signal line crosses the TSI moving the opposite direction, it is a good
time to sell and buy, respectively (True Strength Index). If a market is consistently remaining
above twenty five or below negative twenty five, the market is likely in a breakout (True
Strength Index). There is a possibility for the signals generated to be false, so it is best to
combine the TSI with at least one other indicator.
4.2.14 Average true Range
Average True Range (ATR) is a volatility indicator, developed by Welles Wilder, which
indicates both trends and valid breakouts, but provides no information about price movement. To
calculate the ATR, the True Range (TR) needs to be found first, and it is defined as the greatest
of the following:
4� = �! ���ℎ��ℎ − �! ������
4� = |�! ���ℎ��ℎ − � �*��! ��� �| 4� = |�! ������ − � �*��! ��� �|
The absolute values are to ensure that the TR is a positive number, as it is a measure of distance,
not direction (Average True Range (ATR)). The ATR is based on fourteen periods, and can be
calculated from many times a day to a monthly basis. To calculate the ATR:
"4� = ,(� �*��! "4� ∗ 13) + �! ���4�-14
It is important to note that since the TR and the ATR are based on absolute price changes,
the ATR “reflects volatility at an absolute value” (Average True Range (ATR)). This means that
the ATR is not on a scale, and ATR from different commodities are not comparable. A large
ATR value indicates that the market is trending strongly, in either direction, or that you are in a
valid breakout (Lee, Average True Range (ATR) Indicator Explained). The ATR only shows

[35]
market volatility, not direction. The safest way to use the ATR in trading is to only trade when
both a trend line has been broken, and the ATR is showing a breakout.
4.2.15 Camarilla Equation
The Camarilla Equation is based on the idea that a market over time tends to revert to a
mean. It calculates eight price levels that act as support and resistance, which are derived from
the previous day’s market opening, closing, and the high and low on the day. The lowest four
generated levels are support levels, marked L1 through L4 (Camarilla Equation). The highest
four are resistance levels, marked H1 through H4. The two strongest levels are H3 and L3
(Camarilla Equation). L3 provides strong support, and as the market approaches the L3 level,
there is a likely hood that the market will reverse and turn upwards (Camarilla Equation). The
H3 provides strong resistance, and suggest s that the market will reverse soon to lower prices
(Camarilla Equation). The other levels of note are the L4 and H4 levels. If the market price
exceeds either of these levels, the market is in a breakout, and the trend is likely to continue
(Camarilla Equation). To calculate each level:
74 = 81.1 ∗ ℎ��ℎ&� �ℎ�1�0 − ���&� �ℎ�1�02 9 + ��� �&� �ℎ�1�0
73 = 81.1 ∗ ℎ��ℎ&� �ℎ�1�0 − ���&� �ℎ�1�04 9 + ��� �&� �ℎ�1�0
72 = 81.1 ∗ ℎ��ℎ&� �ℎ�1�0 − ���&� �ℎ�1�06 9 + ��� �&� �ℎ�1�0
71 = 81.1 ∗ ℎ��ℎ&� �ℎ�1�0 − ���&� �ℎ�1�012 9 + ��� �&� �ℎ�1�0
.1 = ��� �&� �ℎ�1�0 − 81.1 ∗ ℎ��ℎ&� �ℎ�1�0 − ���&� �ℎ�1�012 9
.2 = ��� �&� �ℎ�1�0 − 81.1 ∗ ℎ��ℎ&� �ℎ�1�0 − ���&� �ℎ�1�06 9

[36]
.3 = ��� �&� �ℎ�1�0 − 81.1 ∗ ℎ��ℎ&� �ℎ�1�0 − ���&� �ℎ�1�04 9
.4 = ��� �&� �ℎ�1�0 − 81.1 ∗ ℎ��ℎ&� �ℎ�1�0 − ���&� �ℎ�1�02 9
Trading accordingly using the support and resistance levels at H3 and L3, but it is
important to wait for the reversal to happen before committing to a trade, as well as making sure
other indicators are indicating a reversal (Camarilla Equation). In addition, you can trade
breakouts with the Camarilla levels, as anything that moves beyond either H4 or L4 Is likely to
continue moving in such a manner.
4.2.16 Average Directional Index
The Average Directional Index (ADX) is a strength indicator that uses two directional
indicators, DI+ and DI-, which are derived from the directional movement index. This indicator
was developed by Welles Wilder. The ADX has a complex calculation that requires the TR, +
DM and –DM to be calculated first. These values are then smoothed, using Wilder’s smoothing
methods. The +DI14 and –DI14 that are plotted along with the ADX are calculated by:
+:/14 = ;���ℎ�1 + :2 ;���ℎ�14� ∗ 100
−:/14 = ;���ℎ�1 − :2 ;���ℎ�14� ∗ 100
The ADX can then be calculated by:
:< = =(+:/14 − −:/14)+:/14 + −:/14 =
":< = ,(� �*��! ":< ∗ 13) + :<-14
The ADX is a moving average of the directional index, usually over a fourteen day
period, although this number can be specified by the trader (Average Directional Index (ADX)).

[37]
The result is a line plotted across a range of zero to one hundred, although any value over forty is
considered an indication that the market is very likely to keep moving in its current direction
(Average Directional Index (ADX)). A value of zero would indicate that the market is equally
likely to move in a positive direction as it is to move in a negative direction (Average Directional
Index (ADX)). ADX is not an indicator that is used to make a trade, but it can be used to get in
and out of a trade. When the ADX is above forty, it is safe to trade, because the ADX indicates
strength in the current trend. When the ADX drops below forty, it would be a good time to exit a
trade.
4.3 Fundamental Analysis
Fundamental analysis, at its heart, is about examining the “intrinsic value of an
investment” (Kuepper). Applying fundamental analysis to Forex involves inspecting economic
conditions and events and their effects on the values of various nation’s currencies. The most
apparent application of fundamental analysis available to Forex traders is the economic
indicators released every month by governments or private organizations. Examining these
reports can help investors get a better idea on whether the economy of a specific nation is
advancing or declining (Kuepper). Most of these reports receive decent coverage from investing
news sites, and many news releases can cause large movements in the markets around the time of
release. Some of the important economic indicators are covered in this section. These economic
indicators are not the only factors that are used in the fundamental analysis of a nation’s
currency, however. Macroeconomic issues, as well as inter-nation relations, can have a large
impact on the markets. Often with fundamental analysis, the challenge is not finding the
information; it is interpreting it in the correct manner.

[38]
4.3.1 Gross Domestic Product
The Gross Domestic Product (GDP) of a nation is considered one of the most far-
reaching economic indicators, and is probably the most used economic indicator. The GDP of a
country is the total value of all the goods and services produced within that country over a
certain time period (typically one year), and is usually presented quarterly, as a real value, net of
inflation(Gross Domestic Product (GDP) Definition). The total value of all the goods and
services includes consumer spending, government spending, business’s spending, and the net
exports, which is the country’s exports, less the country’s imports(Gross Domestic Product
(GDP) Definition). Thus, if the GDP of a country is rising, it has a strong economy, but if the
GDP is falling, the nation might be in trouble, economically. In addition, the GDP is typically a
good indicator of a country’s standard of living. Economists agree that 2.5 to 3.5 percent growth
of real GDP is the range of greatest benefit. This range maximizes corporate profit and growth,
while minimizing inflation (Barnes, Economic Indicators: Gross Domestic Product (GDP)).
However, there are a number of critics of using the GDP as an economic indicator. Some critics
think that there are a number of transactions that go unreported due to their underground nature
(Gross Domestic Product (GDP) Definition). Others think that the GDP is a measure of
productivity, which is unrelated to the overall economic health of the nation in question. There is
also an economic indicator called the GPI, which is based on the same consumption information
as the GDP, but takes into account factors such as income distribution, education, durable goods,
infrastructure, education, crime, resource depletion, pollution and environmental damage, living
quality, defense expenditures, and dependence on foreign assets(Smith). The idea of the GPI is to
evaluate a country’s consumption and expenditures on whether they are beneficial to the
economy and nation. For instance, pollution is viewed as a positive in GDP, as money has to be

[39]
spent in order to clean it up. However, in the GPI, pollution is viewed negatively. The education
of a nation is not taken into account in the GDP, but it is in the GPI. There are a number of
variables that limit the GDP’s usefulness as an economic indicator for a nation. However, as long
as the GDP is evaluated for what it is, the GDP can be a solid, but limited economic indicator of
a country. In relation to the Forex market, the GDP has a direct impact, as is it is representative
of money spent and earned. If a nation has a higher GDP, it is likely to push the currency’s worth
higher, as the country is sound economically. But if the GDP was falling, the country is not
doing well economically, and the currency will trade lower. It is also important to note that if a
nation has two successive quarters of GDP decline, the country is considered to be in a recession
(which is probably the most important aspect of GDP). In addition, the GDP is released two
months behind, so it is a lagging economic indicator.
4.3.2 Inflation/Deflation
The Forex market is also heavily reliant on a country’s inflation to defining that country’s
currency’s value. Inflation is the rate at which prices in an economy are rising (Forex
Fundamentals: Inflation). Deflation, on the other hand, is the rate at which price in an economy
are falling. Inflation can be cause by a variety of factors. Inflation occurs in good economic
times, as people and businesses are taking their money out of banks and purchasing items (Forex
Fundamentals: Inflation). Thus more money is required must be printed and circulated through
the economy. In addition, because consumers now have more money and are willing to spend it,
demand increases, and businesses are likely to raise prices. If unchecked, this can actually negate
any economic growth, as people have more money, but it is worth less and can buy less than
before (Forex Fundamentals: Inflation). Inflation can also be caused by prices of crucial items
being volatile (Forex Fundamentals: Inflation). For example, if the price of oil were to increase

[40]
rapidly, most products prices would have to be raised, as oil is crucial in the production of
plastics and transportation, which are widely used and very important to most businesses. In
addition, consumers and businesses need to spend more on transportation, which decreases
purchasing power. As will be discussed in the section devoted to interest rates, a country’s main
weapon against high inflation is raising interest rates, which are kept high when inflation needs
to be minimized. Inflation is one of the largest factors to take into account when trading a
currency, since it is the rate at which that currency is devaluing. Nobody wants to have capital in
a currency that is devaluing, as, due to supply and demand, the currency will be worth less in
comparison to other currencies.
4.3.3 Consumer Price Index
The Consumer Price Index (CPI) provides a benchmark for inflation in the US economy,
drawing prices from a wide variety of goods that are commonly consumed or used by consumers
(Barnes, Economic Indicators: Consumer Price Index (CPI)). The CPI provides information on
increases in pricing of products in an economy, basically inflation. However, there are a number
of variations in the CPI that alter its usefulness to investors. The CPI that most investors pay
most attention to is the Core CPI, which is the CPI with food and energy prices removed (due to
the high volatility in these areas), and it is presented with a seasonal adjustment, since markets
and consumer spending can be volatile over time (Barnes, Economic Indicators: Consumer Price
Index (CPI)). The Core CPI’s base year is currently 1982, that is, the seasonal adjustments are
based on 1982. The results of the Core CPI are presented as a percent change over the last CPI
release, but they also are presented as a run rate, so as to give investors an idea of future inflation
levels (Barnes, Economic Indicators: Consumer Price Index (CPI)). This run-rate can be very
useful for investors who are looking to predict future interest rate changes, as the level of

[41]
inflation dictates whether or not the Federal Reserve needs to adjust inflation rates. This will be
extrapolated further in the next paragraph. The seasonal adjustment is currently based upon The
Chain-Weighted CPI, which is gaining popularity with investors, takes Consumer choice into
account when reporting the CPI. Instead of simply recording a price increase, the Chain-
Weighted CPI shows consumer patterns, unlike the Core CPI, by taking into account purchasing
figures when a product receives a price hike (Barnes, Economic Indicators: Consumer Price
Index (CPI)). If consumers stop buying, or buy a product less because of a price hike, that alters
the Chain-Weighted CPI, which the Core-CPI would simply show a price hike. The CPI typically
allows Forex traders to gain an idea of current inflation levels, which are useful in themselves to
predict possible interest rate movements by the Federal Reserve. This is probably the second
most influential indicator behind GDP in the United States, as it often impacts other indicators,
and could possibly change the movement of the markets in the future. In addition, the CPI is
often used by the government to make adjustments to common economic-dependent mechanisms
like Medicare, cost of living adjustments, and insurance policies (Barnes, Economic Indicators:
Consumer Price Index (CPI)). The CPI remains vital to predicting interest rate movements in the
future, due to its accuracy in both reporting and predicting inflation.
4.3.4 Interest Rates
Interest rates of a nation also have a direct effect on the value of a nation’s currency. This
is due to interest rates being related to inflation. Interest rates are the rate at which borrowing
money costs over a period of time (Interest Rates 101). For instance, if money is put into a bank
account, the bank is essentially borrowing that money, and they pay interest on that money. In
the same manner, if a business needs to borrow money to finance a product, new equipment, or a
new building, they borrow money, and pay interest on that money at a rate agreed upon when

[42]
they borrowed the money, until they pay back the money, plus the interest. In economically
prosperous times, it is accepted that inflation is higher, as a direct byproduct (Interest Rates 101).
In economically prosperous times, the interest rates will be raised so as the prevent inflation, as
the higher interest rates will encourage people and businesses to save more and borrow less.
However, when a country is stumbling economically, interest rates will be lowered in order to
promote spending, which should reinvigorate the economy. The impact on the Forex market is
that countries with higher interest rates typically have higher valued currencies, mainly due to
the potential for inflation being much less (Interest Rates 101). In addition, a currencies worth is
not likely to rise the entire time the country has high interest rates, due to the interest rates being
high, but rather the market quickly adjusts when the change in interest rates happens (Interest
Rates 101). This means that the current interest rates are not as important as future interest rates.
When considering Interest rates in trading, the popular method is to use interest rate differentials.
The idea is to compare a pair of currencies by taking the difference of their interest rates, and the
country with the higher interest rate is likely to have the stronger currency (Interest Rates 101).
Obviously, this is not used in day to day trading, as the market is likely to have already
accounted for the interest rate differential, but when interest rates are changing, the interest rate
differentials are important, especially if the two countries interest rates are moving in the
opposite direction, which often produces huge swings in value. In Forex, the interest rate of
focus is that of which the central bank sets, as it is the rate at which banks can borrow from the
treasury of that nation. These interest rates help define a currencies value.
4.3.5 Retail Sales
Retail sales is a coincident economic indicator (“changes in the levels of these indicators
usually reflect similar changes in overall economic activity”) in that it reflects the general state

[43]
of retail sales for the past month (Barnes, Economic Indicators: Industrial Production). It uses a
sample size of various retail companies, small and large, and those that have stores and those that
do not, in order to “track the dollar value of merchandise sold” (Barnes, Economic Indicators:
Retail Sales Report). Consumer spending occupies a large amount of the GDP (about two-thirds
of the US GDP), and provides a great indication of the health of the retail industry, as well as the
economy as a whole, which makes it very useful to traders (Barnes, Economic Indicators: Retail
Sales Report). The retail sales report typically contains two numbers, the total sales figure, and
the figure “ex-autos,” whose large price and seasonal movements can throw off the report
(Barnes, Economic Indicators: Retail Sales Report). For traders, interpreting the retail sales
report is important, because the release often cause high volatility in the market. If the report is
abnormally high, then the possibility of an interest rate hike increases, which in turn would drive
down a currency’s value. However, if the news is better than expected in tough times, it is likely
that the currency in question would rise in value upon the news release. If the retail sales
numbers are weak, this could be a possible sign of a recession, and the currency in question is
likely to weaken if the news is consistently poor, as consumption plays a large part in most
economies (Barnes, Economic Indicators: Retail Sales Report). It should be noted that in a
country that consumes little, but exports much to other countries, these reports are likely to have
less of an impact. The most important figure of a retail sales report might even be the number
that is the consensus among traders (Barnes, Economic Indicators: Retail Sales Report). If the
report is above this number, than the value of the currency is likely to increase, but if it is below
it the currency is more likely to decrease in value, even if the news is still positive. Even though
the report covers the previous month, and is typically released two weeks after the month that
was covered, the report is subject to revisions the following months, and these revisions can be

[44]
quite large (Barnes, Economic Indicators: Retail Sales Report). This can make trading on news
of the retail sales report difficult. However, the retail sales report can be a fantastic short term
indicator of the economy in question.
4.3.6 Unemployment Rates
Unemployment rates are an important indication of the strength of a nation’s workforce,
and by extension, the strength of the economy as a whole. However, unemployment rates have a
tendency to be resistant to change, so it is not the best leading indicator. The rate includes both
businesses and households, in order to be as accurate as possible (Employment Indicators - Forex
Fundamental Analysis). The unemployment rate also consists of data such as hours worked,
hourly pay, payroll, and total hours worked. This allows the indicator to show not only how large
the current workforce is, but how well paid they are, which is an indication of the quality of life
by the workers in the economy. Unemployment is relatively simple indicator. If the rate is
falling, it is an indication of stronger economic times ahead (Employment Indicators - Forex
Fundamental Analysis). If the rate is rising, it is likely that the economy is about to go through a
period of contraction (Employment Indicators - Forex Fundamental Analysis). If the rate is
holding steady, there is a good chance the economy is currently in a peak or trough (indicated by
whether the rate is low of high) (Employment Indicators - Forex Fundamental Analysis). Related
to the unemployment rate, nonfarm payrolls also do a good job of reporting the state of the
workforce in the economy, and because it is measured in the number of jobs created or lost on
the past month, it is usually an easier number to gauge the health of the economy with
(Employment Indicators - Forex Fundamental Analysis). Often this report results in as much
volatility in the Forex market as the unemployment rate report. There are other related reports,
such as the weekly unemployment insurance claims, and average weekly hours (Employment

[45]
Indicators - Forex Fundamental Analysis). The unemployment insurance claims report is an
economic indicator that works the same as the unemployment rate, but it is considered to be
more sensitive, and is often looked to first when economic conditions worsen (Employment
Indicators - Forex Fundamental Analysis). However, it can also be misleading over long periods
of weak economic conditions, as one can only stay on unemployment insurance for a certain
period of time. Average weekly hours is a combination of several other employment indicators,
and reports the average weekly hours sent to payroll by manufacturers (Employment Indicators -
Forex Fundamental Analysis). This is one of the more sensitive employment indicators, as
employers have a tendency to reduce workforce hours before laying workers off. When
considering these indicators in trading, the lower the unemployment rate, the more that currency
should be worth(Employment Indicators - Forex Fundamental Analysis). However, since most of
the time these rates are already factored into the market price, a change or an unexpected change
in either direction typically is the most important news that causes the markets to move. These
reports are subject to revision though, so, like most economic indicators, the data should be taken
with a grain of salt.
4.3.7 Industrial Production
Industrial Production measures the change in output in the industrial sector of an
economy (which contains factories, mines, and utilities, in addition to the businesses of
newspaper, periodical, and book publishing), and, because the industrial sector typically has a
large impact on a country’s GDP, is very useful in predicting changes in GDP (Barnes,
Economic Indicators: Industrial Production) (Fundamental Major Currencies: Industrial
Production (Euro Zone)). This makes it a useful coincident indicator. Often the industrial
production of an economy is seen as a representation of the expansion and contraction that will

[46]
be reported in the GDP, in the future. In addition, the industrial production often provides a
preview to inflation levels, as it is understood by investors that inflation manifests first at the
industrial level (Barnes, Economic Indicators: Industrial Production). This is because of the rise
in costs occurring first at the raw goods level, which eventually gets passed on until the
consumer is purchasing higher cost products. The industrial sector of the economy historically
sees the most volatility from economic peak to economic trough (Barnes, Economic Indicators:
Industrial Production). Large changes in industrial production usually are a good indicator of a
strengthening or weakening economy because of this. A positive change from month to month or
year to year typically means that the economy is strengthening, which would result in the
currency strengthening. A negative change would mean that the economy is weakening, and
would probably result in the currency losing value in relation to other currencies. This usually
has an effect on the volatility of the Forex market in the short-term, after the report is released,
and the change in the market is usually more dependent on whether the report met, exceeded or
failed to reach expectations (Barnes, Economic Indicators: Industrial Production). However, the
industrial production reports can also be used as a gauge as to how healthy an economy is, in the
long-term. It is also important to note how dependent on industry the economy in question is, as
this will determine how much of an effect industrial production has in indicating the health of the
economy. For instance, industrial production is a weaker indicator of economic health for the
United States than it has in the past, because industry plays as smaller role in the US economy,
which relies heavier on consumption now. However, its timely release and historical relation to a
nation’s GDP, as well as its early glimpse of inflation make it a very useful indicator to predict
economic health.

[47]
4.3.8 Consumer Confidence Index
The Consumer Confidence Index (CCI) is a private, monthly release from the Conference
Board, which is well regarded by both investors and the government. The CCI itself is comprised
of survey results from a sample size of more than five thousand households across the United
States (Barnes, Economic Indicators: Consumer Confidence Index (CCI)). There are three parts
to the CCI: Index of Consumer Sentiment, Current Economic Conditions, and Index of
Consumer Expectations (Barnes, Economic Indicators: Consumer Confidence Index (CCI)). The
Index of Consumer Sentiment is a gauge for how the average consumer feels. Current Economic
Conditions reports how the average consumer feels about the current state of the economy, while
the Index of Consumer Expectations is how they see the economy and themselves in half a year.
When the CCI is strong, it typically means the consumers are happier. The CCI has a privately
released counterpart, the Michigan Consumer Sentiment Index, provided by the University of
Michigan. However, they are very similar in their methods, and some investors choose to
average the two in order to get a stronger result (Barnes, Economic Indicators: Consumer
Confidence Index (CCI)). This generally means that standards of living are improving, and thus
they are willing to purchase more goods, and usually those purchases are larger (Barnes,
Economic Indicators: Consumer Confidence Index (CCI)). This typically points to a stronger
economy, which in turn increases the value of the US Dollar when compared to other currencies,
as a USD with a strong economy behind it is worth more than a USD with a weakening and
stagnant economy. On the same note, consumer spending, which has a tendency to trend with
consumer confidence, comprises two thirds of the United States’ GDP, which makes the CCI an
important indicator in forecasting future GDP (Barnes, Economic Indicators: Consumer
Confidence Index (CCI)). However, due to the subjective nature of surveys, and the complete

[48]
lack of hard data, the results can be skewed. In addition, the public often is not fully informed as
to the current state of the economy, and therefore larger news headlines can create bias that
paints a picture of a different economic situation. “There are no real data sets here, and people
are not economists, so they cannot be counted on to realize that, for example, because gas prices
may only represent 5% of their expenses, they should not sour their entire economic outlook”
(Barnes, Economic Indicators: Consumer Confidence Index (CCI)). Often, moving averages over
longer periods of time act to smooth the data, and provide a more reliable outlook that can be
used in predicting future economic movement (Barnes, Economic Indicators: Consumer
Confidence Index (CCI)). Generally, consumer confidence rises and falls with retail sales, and
consumer spending patterns, which means the CCI remains a strong economic indicator of GDP
and economic strength, despite its faults.
4.3.9 ISM Manufacturing Index
The Institute for Supply Management (ISM), a private research group, maintains the ISM
Manufacturing Index (formally known as the Purchasing Managers Index), which reports
changes in conditions for the supply and manufacturing sectors of businesses. A set of five
weighted sub-indicators comprise the ISM Index, and it is collected by surveying more than
four-hundred purchasing managers around the nation (Barnes, Economic Indicators: Purchasing
Managers Index (PMI)). The questions in the survey are all answered with either “better”.
“same”, or “worse”, and the calculation of the Index is the percentage of the purchasing
managers that answered “better”, plus half of the percentage of those who answered “same”.
(Barnes, Economic Indicators: Purchasing Managers Index (PMI)) The ISM Index is reported as
a number between zero and one hundred, with fifty being an equal number of “better” and
“worse” reports. This is a sentiment indicator that provides a glimpse into the manufacturing

[49]
sector of the US economy. Although manufacturing is no longer a large part of the US GDP, it
remains an important indicator, simply because the manufacturing sector has a history of being
one of the first areas of the economy to feel either recessions or expansion in the economy
(Barnes, Economic Indicators: Purchasing Managers Index (PMI)). Typically, if manufacturing
is expanding the economy is also expanding, which means the ISM Index is a good indicator of
future GDP movement (Barnes, Economic Indicators: Purchasing Managers Index (PMI)). When
interpreting the ISM Index, a value of fifty typically is the tipping point. Anything above
indicates expansion in the industry, while anything below would indicate contraction. However,
when using it to evaluate future GDP, any value over forty-two is considered GDP expansion.
ISM Index levels lower than forty two can indicate recession if they remain below for a long
enough period of time (Barnes, Economic Indicators: Purchasing Managers Index (PMI))
However, when using the ISM Index to trade in Forex, it is important to keep in mind the rate of
change. If the ISM index is over fifty, but the rate of change is negative, there is a good change
that the USD will weaken in comparison to other currencies when the report breaks. The market
consensus is also important in determining whether the USD will strengthen or weaken over the
release of the report, as well. However, the ISM Index has its faults, as well. Due to the nature of
the survey, the results are subjective (Barnes, Economic Indicators: Purchasing Managers Index
(PMI)). In addition, the report covers only the manufacturing sector of the economy, and
therefore might not be indicative of the economy as a whole. The ISM Manufacturing Index is an
indicator that has had a lot of value in the past, but has lost some value of late. However, because
of the manifesting industry’s importance to the economy, it remains a powerful indicator that can
provide volatility to the markets upon its release, and can be used to great effect to predict future
GDP movement when combined with other economic indicators.

[50]
4.3.10 Interpreting Macroeconomic Issues
“Macroeconomics is the study of the behavior of the economy as a whole” (Heakal).
Much of macroeconomics is tied with the economic indicators discussed before this, but often
these issues can provide a quicker analysis than the monthly or annual indicators releases. In
addition, relations between nations can strengthen or deteriorate, which can have a strong effect
on a nation’s currencies. However, it can often be challenging to interpret the macroeconomic
issues correctly, and the market does not always react in a manner consistent with analysis. As an
investor, it is important to pay attention to the macroeconomic issues in order to better protect
investments, and to better understand the markets as a whole.
Lately, there has been a lot of news about countries, and their respective debts. But what
does this mean to the value of a countries currency? There is no easy answer to this, as debt is a
very complex issue. However, it is almost universally agreed on that some government debt is a
good thing (Johnson and Kwak). It is expected that the government will go further into debt
during a recession, when it should be lowering taxes and increasing spending, in order to jump
start the economy (Johnson and Kwak). However, many would say that it is also the
government’s obligation to balance the budget again during good times (Johnson and Kwak).
However, this obviously does not happen, or the United States would have had a balanced
budget by the end of the boom in the 90’s. The reason that the budget doesn’t actually get
balanced during these times is because that would be incredibly difficult to do. Even if a large
government completely froze spending, it would be a number of years before tax revenue would
pay off the national debt. Instead, during good times, the government aims to reduce the debt to
GDP ratio, by reducing spending enough so that the national GDP grows faster than the national
debt (Johnson and Kwak). As long as the GDP is growing faster than the national deficit, there

[51]
will be a sustainable level of debt (this is due to the GDP being representative of the tax base)
(Johnson and Kwak). Now debt has a definition, and understand why some debt is acceptable,
and sometimes encouraged, the impact of debt on the value of currencies can be explored.
Generally, debt is not a statistic that garners a lot of attention in the Forex markets. However, the
markets pay full attention when there is either an upgrade or a downgrade in a countries credit
rating. The credit rating of a country represents the “credit worthiness” of a government (Credit
Rating). This is evaluated by three main credit rating agencies, Standard & Poor’s, Fitch, and
Moody’s. These rating agencies issue a sovereign credit rating, as well as an outlook for the
future. Typically, a AAA rating is the best possible (for Moody’s a Aaa rating is the best) (List of
Countries by Credit Rating). Notable levels of ratings are BB+ for Standard & Poor’s and Fitch,
and Ba1 for Moody’s (List of Countries by Credit Rating). Any rating below these levels is
considered a speculative grade bond (commonly referred to as “junk” bonds) (List of Countries
by Credit Rating). Stable outlooks indicate no impending change to the credit rating, while a
negative outlook indicates that it is likely that the rating will be downgraded in the future (List of
Countries by Credit Rating). A positive outlook indicates that the rating is likely to be upgraded
in the future (List of Countries by Credit Rating). Both a rating change and an outlook change
can have an impact on the Forex markets, although it is likely that a change in rating will have a
greater impact on the markets than a change in outlook. Upgrades and positive outlooks are very
likely to cause an increase in value for the corresponding currency of the nation with the change
in rating/outlook. On the other hand, downgrades and negative outlooks are likely to cause a
decrease in value for the currency corresponding to the nation with the change in rating/outlook.
Outside of a ratings or outlook change by one or more of the rating agencies, debt is a statistic
that is largely ignored, as the ratings agencies are known to provide reliable reports.
[52]
Political events can also have a large impact on the Forex markets (How Global Events
Affect the Forex Market). One of the most common, and periodic political events is elections,
which occur in most countries. Depending on the election, it is possible that investors will see the
elections as time of instability in the government (How Global Events Affect the Forex Market).
Generally, this means that the nation’s currency will reflect this psychology by being more
volatile as well (How Global Events Affect the Forex Market). However, with modern media,
the outcome of elections is typically not all that surprising. Not that there are not close races, but
rather it is rare to see a true dark horse candidate anymore, one that nobody expects to win.
However, the markets can also react to a change in government, especially when there is a
significant change in policy (How Global Events Affect the Forex Market). The most impactful
of the policy changes if the fiscal policy. If the markets see the incumbent’s policy as better for
the economy, the value of the currency is likely to increase, but if the markets think that the
incumbent’s policy will be detrimental to the economic health of the nation, the nation’s
currency is likely to devalue. In addition, civil unrest, or unexpected elections can also cause
sharp responses in the value in a nation’s currency. It is very rare that the instability of civil
unrest or the removal of a political figure from power would increase the value of a currency
(How Global Events Affect the Forex Market). Until there is stability in the government, the
currency is likely to devalue.
Natural Disasters can have a huge impact on the economic state of a country, causing
damage to infrastructure and morale, as well as loss of life. It is the infrastructure that is focused
on most by the markets, because damage in this area can severely limit or handicap the economic
output of a nation (How Global Events Affect the Forex Market). In addition, the government
needs to appropriate extra funding to cleanup efforts and rebuilding (How Global Events Affect
[53]
the Forex Market). It is quite common that the morale impact that a natural disaster has on a
nation will lower consumer confidence, thus reducing consumer spending (How Global Events
Affect the Forex Market). The combination of these factors shows how significant of an impact
natural disasters can have on the economic condition of a country. It is almost impossible to have
a natural disaster and have a nation be economically stronger because of it. The economic
damage caused by natural disasters is likely to devalue a nation’s currency.
Military conflicts between countries often have a similar impact on the currencies of the
nation’s involved. Probable infrastructure damage will hurt the economic output of any country,
and the nation usually will have to borrow money in order to make up for the loss in “economic
viability”, as well as for the immense cost of being in the war itself (How Global Events Affect
the Forex Market). In addition, the uncertainty of future expectations involved with being in a
war, and the drop in consumer confidence creates a very volatile environment in the currency
market (How Global Events Affect the Forex Market). The rebuilding effort after a war is likely
to be financed by “cheap capital”, which results from lowering interest rates, causing inflation
(How Global Events Affect the Forex Market). Obviously there is a large economic downside to
being involved in a military conflict with another nation. However, there is some economic
upside to war. Often times, the increase in manufacturing will create an economic boom. A great
example of this is the United States’ involvement in World War II. After entry into the war
following the bombing of Pearl Harbor, the nation was pulled out of the Great Depression (How
Global Events Affect the Forex Market). However, I would also like to note that the United
States joined World War II, and, after Pearl Harbor, had no further loss to infrastructure within
the fifty states, as all of the fighting took place in either islands in the Pacific, or in Europe.

[54]
Obviously, war should never be used as a tool for bringing a country out of economic recession,
but there is some economic upside to war, especially if it is not being fought on home soil.
These are only a couple general examples of macroeconomic issues, and each situation is
unique enough that it can be difficult to make predations solely based on the macroeconomic
issue at hand. However, it is very important to pay attention to macroeconomic issues as an
investor, as they can have a significant impact on the markets. They are important even in
technical analysis, as the markets can be extremely volatile during news periods, or when news
breaks. When news breaks and the impact on the currencies involved is unknown, or not
immediately apparent, it is probably best to stay out of the market until the period of volatility
passes. Generally, this is the safest tactic when trading around news times.
4.4 Programming and Robot-Based Trading
Programming what are called “robots”, which are essentially automatically trading
programs, is a large sector of trading in the Forex market (and investing as a whole). With the
rapid emergence of computers in the last twenty years, and with personal computers becoming
quite powerful machines with relatively low investment, this sector has opened up to more
people than ever before. There are quite a few differences between discretional trading and robot
based trading. The most important is the complete lack of a human element. This can be a really
good thing, or it can be detrimental. For instance, a robot will not go into a trade just because it
looks really good. It will only get into a trade if specific programmed conditions are met, and
only then. However, it is also is never able to read a market and understand that it is not a good
day for trading, or make instinctual trades. Generally this means that the most successful robots
are less successful than their human counterparts. However, robots have the advantage of
consistency, as well as the ability to be optimized towards the user’s preferences. There are also

[55]
other options when programming as an investor, like creating a custom indicator to let you know
when conditions have been met. The options when it comes to creating custom indicators are
vast, and the usefulness of certain options depends on trading strategies.
Generally when programming, the program will revolve around the entry point. This is
the set of conditions that will cause your program to enter a trade. Generally, it is best if a robot
has at least two or three conditions that must be met in order to enter into a trade. If too few
conditions are set, than the robot is likely to trigger at an undesirable time. By using multiple
conditions, the risk is limited, and as long as the conditions work from a profitability standpoint,
the robot will make more winning trades than losing trades. Obviously, every programmer is
going to have different ideas regarding entry conditions, but some conditions to consider are the
crossing of different MACDs, support and resistance levels, and momentum indicators. It is
important not to use the same type of indicator for each entry condition, as they could all show a
false entry point. Instead, try to use indictors that won’t necessarily trigger all at the same time.
The exit point of the program is also very important, although some programs won’t use
an exit point at all. The other option is using only combination of stop losses (trailing, or not),
and take profits. When using exit conditions, it is most likely they will reflect your initial
conditions no longer holding, indicating that the pattern that had the program get into a trade has
disappeared. However, exit conditions could be completely unrelated to your entry conditions.
The programmer needs to settle on a couple promising exit conditions, and work out the best
condition in the optimization process. It is unlikely that the best exit condition for the program
will be found without testing and optimizing thoroughly. Finally, a stop loss or a take profit
could be added to the program in order to keep losses or profits in greater control. Losses could
be limited greater by a trailing stop loss. It is also possible to not use any exit conditions, and use

[56]
only trailing stop losses and take profits, instead. The robot will be more sensitive to movements
will smaller levels of take profits and stop losses, but is also more likely to keep a profit once a
trade is profitable. Generally, the robot will be better off using exit conditions, as it is a more
mature method of exiting a trade, and will show that the program follows an actual market
pattern if it works correctly. It is also possible to use simple stop losses and take profits in order
to test and optimize the entry conditions, as they are a good base exit position that is not variable.
When designing a robot, it is important that it is designed around the needs and desires of either
the client, or the trader. The amount of time being allotted to running the program, the available
capital, and the risk tolerance are all very important considerations when designing a robot
(Michael J. Radzicki).
It is also possible to maximize profit and minimize losses through a leveled entry and
exit. For example, if a robot enters a trade with one standard lot, and it remains profitable for ten
pips, the robot could add another standard lot. This is a rather large step, and many smaller steps
will prove to be less risky. The same could be done with exiting a trade. Once a certain level is
reached, or some unfavorable condition trips, the robot could pull out fifty percent of a trade,
securing profits. It could then let the trade continue to run until another condition or profit level
trips, in which another twenty five percent trips. The robot could then let the rest of the trade run
until it hits a stop loss or a take profit. This method of levels of entry and exit should minimize
risk, as it helps to secure profits. It is recommended that this is developed and optimized after
entry and exit levels have been developed and optimized due to the heavy reliance on them by
the entry and exit levels.
When optimizing certain parts of the robot, it is important to only alter a single factor of
the robot per test. This allows the monitoring of the quality of the robot on a per-factor basis. If

[57]
more than one factor is changed per test, the optimizer will not know what factor is causing the
robot to be more profitable of not. Going into optimization, realistic expectations should be set.
Before optimization, it should be known how quickly the robot should be trading, and for how
long trades should be running, the desired win/loss ratio, and what level of risk the robot should
be running at. If being used for a single trader, these should be set to personal preferences.
However, when trading for a client, the risk management should be tailored to their needs. Note
that it should not be tailored specifically to what they request. As the trader, it is up to you to
understand what your clients actually need in risk management. Most clients want you to be
more risky with their money, but immediately question large losses. Most clients will be
uncomfortable with the probable losses associated with risking a larger amount of their capital.
Obviously, this should not mean that the clients are left out in the cold, but are helped through to
the correct decision.
Optimization is typically done using past market data, as it is accessible, and requires
little time to use. Testing a robot on previous market data is called back testing, and is important
when optimizing the robot. Optimizers are simply algorithms that are used in order to find the
best solution to a specific problem. There are two common types of optimizations; exhaustive,
and probabilistic (Michael J. Radzicki). An exhaustive optimization will run the data on every
possible value for a factor, which is a method of using brute processing force (Michael J.
Radzicki). This will result in what is likely to be a series of results that provide the highest profit
or win/loss ratio for the robot. However, using an exhaustive search is only recommended for a
factor with few possible values. If exhaustive optimization is used on a factor with many possible
values, the optimization will take a very long time to complete. This is where probabilistic
optimizations come in; they provide good results while limiting the amount of time that the

[58]
optimization will run. There are three types of probabilistic optimizations: genetic, swarm, and
neural (Michael J. Radzicki). A genetic optimization is based on algorithms that mimic
evolution. “The evolution usually starts from a population of randomly generated individuals and
happens in generations. In each generation, the fitness of every individual in the population is
evaluated, multiple individuals are stochastically selected from the current population (based on
their fitness), and modified (recombined and possibly randomly mutated) to form a new
population. The new population is then used in the next iteration of the algorithm. Commonly,
the algorithm terminates when either a maximum number of generations has been produced, or a
satisfactory fitness level has been reached for the population.” (Genetic Algorithm) Swarm
optimization is different, in that the best known value of each factor (or particle in swarm
optimization) directly effects the optimization as a whole. With each iteration of the algorithm,
the particles are altered based not only on the particle’s best known position, but also by the
swarm’s (all the other particles) best known position (Particle Swarm Optimization). Both of
these types of optimization are readily available to use, and do not require extra or more
powerful hardware. However, Neural optimization, called a neural network, usually would
require a very powerful computer, or much more likely, access to a supercomputer. Thus this
type of optimization is just not available to most people. As a general overview, it is designed
after biological neural networks (like the human brain), and uses artificial neurons to adaptively
find the optimized result, or the possible results (Artificial Neural Network). These optimizations
should be used if the number of possible values for a factor causes the exhaustive optimization to
exceed the expected amount of time to produce a response. All of these optimizations will
produce multiple possible results that will reach a different maximum. Generally, when
reviewing the results, one wants to avoid data that is over-fitted to the back testing period. This is

[59]
when a robot provides unrealistic and over optimistic results of its performance over the back
testing period. This means that the robot is being fitted to the noise, rather than the fundamental
behavior (Michael J. Radzicki). In addition, a robot should be tested in a number of different
market conditions, so it does not get optimized to one specific market (Michael J. Radzicki). This
reduces its usefulness when the markets do not match the condition optimized in. Finally, the
optimizations will sometimes return what are called “telephone poles”; one specific value that
performs well, but nearby values do not perform nearly as well (Michael J. Radzicki). These are
values that are unlikely to perform well when the robot is actually used in trading.
As an investor that uses programming to trade, it is important to have multiple working
robots, or systems, available for use. This creates a “system of systems”, which is designed to be
used in order to maximize success (Michael J. Radzicki). No single robot will work consistently
well in every market. This means that certain robots will perform better than other, depending on
the market condition. It is important to use the best-performing systems on any given trading
day, and to keep the systems that are not currently working well from trading. All systems should
be monitored, and even the systems that are not performing well should be monitored by having
them trade on simulation (Michael J. Radzicki). When a system that was not performing well out
performs a robot that is actually trading for a certain period of time, it is probably time switch in
the performing system, and switch out the poorly performing system.
Programming robots, as well as custom indicators, can be very useful for investing in all
markets, as well as the Forex market. When programming a robot, it is important to keep the
desired risk management, win/loss ratio, and the amount of capital being traded in mind. The
entry and exit conditions are the part of the robot that are typically the most important, and that
will require the most optimization. Once developed, the optimization process will produce results

[60]
of the better performing values for the variable being maximized/minimized. Finally, if using
robots, or systems, to trade, it is better to use a “system of systems” in order to have the best
performing robots trading each day.
4.5 Important Resources
There are a large amount of resources available to investors, and wading through these
resources trying to find the most useful can be a daunting task. Here, some common and helpful
resources will be highlighted, and how they should be used. This is by no means a
comprehensive guide, and investors should not stick this short list exclusively. This is simply a
personal list of resources that the authors find the most useful when investing. Each investor is
encourages to seek out their own personal resources, as every investor is different.
The Gartman Letter is a daily letter written by a notable investor and his staff, Mr. Dennis
Gartman. It is a comprehensive investing resource with extremely up to date news and
recommendations. The Gartman Letter is an extremely reputable source, which justifies the
investment to subscribe. Mr. Gartman is located on the east coast of the United States, and sends
the letter out at five or six in the morning, Eastern Standard Time. Although this is a newsletter
that is not specifically tailored to investing in the Forex markets, they are covered in the
newsletter, and the newsletter covers very important macroeconomic issues that usually have an
impact on the Forex market, and tend to be important when trading on the Forex markets. It is
important to note that Mr. Gartman usually has a long term view on investing, and therefore his
recommendations are not always wise in the short term. As with all resources however, it is
recommended that investors use their own judgment when researching investments. Mr.
Gartmanhimself is quick to admit his mistakes, knowing that all investors are wrong at one point

[61]
or another. However, all in all, Mr.Gartman provides a solid summary of the conditions of most
investment markets each morning, and an invaluable resource for investors.
One of the best resources for breaking news and its effects on the Forex markets is Forex
Factory. This is a website that provides a comprehensive schedule of news releases, and the
impact that they are likely to have on the Forex markets. In addition, they provide information
such as the previous report, the forecast, and after news is released, the actual numbers. In
addition, the forums can be very useful for both new and seasoned investors. However, as the
forums are set up in a typical internet fashion and some advice can be dodgy, especially when
originating from members without reputations. That being said, Forex Factory provides a great
educational environment for investors to discuss current issues and trends, and provides a top-
notch news schedule that is an extremely useful reference for Forex traders.
These two resources are invaluable to Forex investors, and they come highly
recommended as resources. However, there are many more reputable resources out there. Take
the time to explore and find the most valuable resources, as there will be resources that some
investors find more useful, due to the many different trading strategies out there. This is just a
starting resource list for the Forex investor.
4.6 Starting an Investment Company
4.6.1 Location
When starting a money management company, the first thing to consider is location. In general,
there are two choices, US-based and off-shore. Despite the fact that there are many countries one
could base a company in, the US sticks out the most because of differences in regulation and tax
laws. So what are the pros and cons of a US-based company vs. an off-shore one?
[62]
The US enforces more strict tax laws than most countries, which means both the
company and the clients end up having to pay more per trade than they would if the company
was in a different country. The flipside of this is that foreign based companies have trouble
attracting US customers due to the non-resident alien tax(Internal Revenue Service). The internal
revenue service taxes any company or person engaged in trade in the US, so if an off-shore
company wants to have us customers, they must pay additional taxes for each of these customers,
making it hard to justify. The US company can have US customers with no extra taxes, so
despite the higher base tax, it’s better for US customers to work with US companies. The reason
this is so important is that the US has a large portion of the world’s traders, and by starting an
off-shore company, one essentially cuts out those traders from the start.
So why would an off-shore company be better. If you’re in the US, it makes sense to start
a US-based company, because you will have to pay the taxes no matter what as a US citizen.
However, if you’re not in the US, it makes no sense to start a US based company, because of the
higher taxes, and this company would still need to file for non-resident alien taxes. Another
possible advantage of an off-shore company is the lack of regulation. This can be a good or bad
thing depending on how honest the company is. The US has many regulatory agencies for Forex
trading (SEC,CFTC,FINRA), but in other countries, Forex trading is much more hands-off.
So where to start a company? The country of origin is almost always the logical choice; if
the founders of the company are in the US, start the company in the US, as the taxes will be more
favorable. For the same reason, if the founders live outside the US, it makes little sense for them
to start a company in the US. This is a broad generalization of the issue and there are more fine
points that complicate the matter somewhat, but for a brief overview, this covers the main
important points.

[63]
4.6.2 Legal Structure
When structuring a company, one of the biggest questions is, who is liable in the event that
something (or everything) goes wrong? The three main categories are sole proprietorship,
partnership, and corporation. The main difference between these three is liability, though there
are other differences that are equally important.
A sole proprietorship is run by one person, who assumes all liability. There may be more
than one person helping to manage the company, but the owner assumes all responsibility for
debt and losses as well as profits. The obvious disadvantage to this approach is that if anything
goes wrong in the company, all blame rests on the sole proprietor. There is no legal difference
between the individual and the company. This has its advantages too though. As the only
responsible entity in the company, the owner can make all the decisions without consulting
anyone else(Sole Proprietorship).
A partnership can be divided into three sub-categories. A general partnership is one step
away from a sole proprietorship. Instead of one person assuming all responsibility, two or more
people evenly split the liability and the profits. All decisions in the company are voted and
agreed upon by a majority. Other than the shared responsibility, there is little difference between
a general partnership and a sole-proprietorship(General Partnership).
A limited partnership takes this one step further and adds a new member, the limited
partner. Unlike a general partner, the limited partner is not responsible for all the company’s
debt, only as much as the capital they have in the company. The limited partner has no voice as a
shareholder of the company; all decisions are made by the general partner(s). Also, there need
only be one general partner, unlike the general partnership. Effectively a limited partnership can

[64]
function like a sole proprietorship where the investors are limited partners. The only practical
difference between those two would be less liability on the owner(Limited Partnership).
The third type of partnership is limited liability. Limited partners assume responsibility
for their own liability much like in a limited partnership. Also like a limited partnership, the LLP
needs at least one general partner to assume responsibility for the company’s liabilities. In the
US, a LLP is usually seen in the form of a limited liability company which is a hybrid between a
LLP and a corporation(Limited Liability Partnership).
A corporation is the only legal entity whose liability is entirely separate from that of its
members (i.e. there is no general partner). There is no person or persons who must assume
responsibilities. In order to earn this full limited liability, the corporation must be registered with
the state and/or federal governments and thus it is subject to more strict regulation than a
partnership or sole-proprietorship. An important distinction with a corporation is that the
company is legally required to add something to their title that informs the public of their legal
status (e.g. Ltd., LLC, Inc.)(Corporation).
As for which legal entity is right for an emerging company, the first issue to consider is
size. If the company is only one person, the only option that makes sense is a sole proprietorship.
For two or more individuals who are still a small group, a partnership is the most sensible option;
the liability can be shared equally among all members, and it necessary, the company can be
expanded to include limited partners. Generally a corporation is not the best idea unless the
company is much larger, as it imposes much more regulation on the company.
4.6.3 Important Regulatory Authorities
There are a few important regulatory entities which deal with trading in the US, and all
companies, regardless of size, are required to comply with them. The Securities Exchange

[65]
Commission (SEC) and the Commodity Futures Trading Commission (CFTC) are the major
government bodies in charge of these regulations. The Financial Industry Regulatory Authority
(FINRA) is another, which is independently run.
Created in 1934, The SEC was originally designed to regulate corruption in the stock
market following the collapse in 1929. The SEC requires all companies to submit quarterly
reports so that they may take steps to prevent fraud and other financial infractions. While the
SEC is responsible for upholding the legal structure of a company, they do very little to regulate
the actual currency trading(U.S. Securities and Exchange Commission).
This is handled by the CFTC. “Congress created the Commodity Futures Trading
Commission (CFTC) in 1974 as an independent agency with the mandate to regulate commodity
futures and option markets in the United States.” (CFTC website) Basically all trading in the US
(excluding the stock market) is regulated by the CFTC. They seek to make markets run
smoothly, competitively, and with minimal fraudulent activity(Commodity Futures Trading
Commission).
FINRA is non-government agency that operates in a similar manner to the CFTC. FINRA
also oversees companies involved in securities trading to ensure that they are operating with their
clients’ best interest in mind. FINRA evolved from the National Association of Securities
Dealers, Inc. (NASD), which was intended to watch over and regulate securities trading under
the supervision of the SEC. after NASDAQ (National Association of Securities Dealers
Automated Quotations) disbanded from NASD, NASD was reformed into FINRA as an
independent regulatory authority(Financial Industry Regulatory Authority).

[66]
4.6.4 Licensing
There are a number of licenses granted by the FINRA for trading purposes. Concerning
Forex trading, there are a few to look out for, the series 7, series 34, and possibly the series 3. All
or none of these may be necessary depending on how a company operates.
The series 7 is a general license for any kind of securities trading. The only thing one can’t do
with a series 7 license is trade commodities; there is a separate license for that. While a series 7
license may not be strictly necessary for your company, it is probably a good idea anyway. At
the very least it will increase the company’s credibility. “[The series 7 exam] focuses on
investment risk, taxation, equity and debt instruments, packaged securities, options, retirement
plans, and interactions with clients such as account management.” (Investopedia).
The series 34 license and exam focus more heavily on Forex, but require either a series 3
or 32 first. Topics covered on the series 34 exam include “Forex terminology, forex concepts,
Forex regulations, Forex trading computations and the risks of Forex trading.” (investopedia,
series 34). Proficiency in series 34 material implies a much greater understanding of the Forex
market than the series 7(Investopedia).
A series 3 license is not required for Forex trading or directly relevant to the market. Its
primary function is to allow the holder to trade commodities, as mentioned previously. However,
it can be a prerequisite for the series 34 license. If one wishes to obtain a series 34 license, a
series 3 may be a good one to pursue as well(Investopedia).
4.6.5 Performance Indicators
Now for the most important question, how do you tell if a company is doing well? A
company could post annual returns of over 20%, but only be able to claim a 55% success rate. A
different company could have annual return well under 10%, but a success rate of 95% (please

[67]
note that these are exaggerated cases). If this is the case, it’s only a matter of how much risk the
client can handle, but what if these two cases above are two accounts of the same company. This
makes the issue a little more complicated. Luckily there are performance indicators which can
quantitatively tell how well a company is doing.
The Sharpe ratio is one of the most commonly used Forex performance indicators. The
ratio calculates the difference between the actual and a theoretical return with no risk. This
expectation is measured against the standard deviation. The formula is as follows:
� = %,� − �>-?*� ,� − �>-
The Sharpe ratio is one of the most important performance indicators because it can
measure whether or not a client is being adequately rewarded for the risk they are taking(Sharpe
ratio).
Other than the Sharpe ratio, there aren’t very many universally used performance
indicators. Like any company, a Forex based company will have key performance indicators to
measure their particular goal of success. If a company’s main goal is growth, one of their KPIs
will be a ratio of annual returns or number of customers from year to year(Investopedia).

[68]
5. Results
5.1 Trading Strategy
5.1.1 Devin Kehler
My trading strategy has undergone many changes since its inception in early November
2011. I started out using a combination of trend lines and MACD divergence to predict and trace
reversals. The moving average convergence divergence indicator is a pair of exponential moving
averages (14 day and 26 day). When watching for divergence the most important points in the
MACD are the peaks and valleys. If the peaks or valleys of the MACD are moving one way and
the peaks and valleys of the price are moving the opposite direction, this is known as divergence.
The image shown below has an example of negative divergence.
Figure 3: Negative divergence is the setup; the trend line break triggers the trade

[69]
The peaks of the MACD get smaller while the price peaks simultaneously get larger.
Shortly after, the price reverses from an uptrend and begins to decline. The MACD is only a
setup indicator in this case; I need a trigger to tell me when to enter the trade, which is what the
trend line is for. In the chart above, I have drawn a trend line to monitor where the price is
moving. In this case, I’ve done a pretty good job of drawing an accurate trend line; the price hits
it a number of times and bounces off before finally crossing.
This was a fine strategy on paper, but what I soon realized was that my whole plan
hinged on whether or not I drew a reliable trend line. In the above example, the trend line is very
accurate and therefore very useful, but in a market with little to no trend, trend lines are of no
use. If that’s the case, I need a different strategy.
After a few weeks of playing around with MACD divergence and trend lines, I noticed an
interesting pattern in some of the other indicators I had open, in particular the CCI and
stochastic. It seems that reversals can also be traced by watching the oversold and overbought
indications presented by the CCI and stochastic. In the chart below, we can see two points where
both the CCI and stochastic are showing that the currency pair is overbought, and almost
immediately following this is a swift drop in price.

[70]
Figure 4: Illustration of how CCI and stochastic peaks mimic price peaks
In both those cases, the price continues to move with the trend, which is expected most of
the time given a strong enough trend. The more interesting point on this chart is near the end
when both stochastic and CCI indicate that the currency is oversold, and in this case, the price
breaks the trend line and moves upward.
This is still essentially the same strategy as before, except that now I have more options
to look at if the MACD isn’t showing me the right signals. The problem still persists that if there
is no trend, or if I misread the trend, then both of these strategies are useless. The advantage of
the CCI/stochastic method is that it doesn’t necessarily require an actual trend line, so it’s easier
to program into a robot.

[71]
5.1.2 Gabriel McCormick
I have used a number of different trading strategies, since the project started. Initially, I
was using the stochastic to trade reversals. This involved watching the stochastic indicator and
the Commodity Channel Index (CCI) until one or both were in the overbought or oversold
region. This was done on the one minute time interval. I chose this just because it was the fastest
moving, and I thought I could glean the most information from it. Once I saw a condition I liked,
and the market showed small signs of reversal (maybe a couple solid bars of the reversed trend),
I would enter into a trade. At this point I would just watch the market until I no longer thought it
was safe to be in a trade, and then get out, hopefully with a profit. I say hopefully because this
trading strategy never really worked for me. I found that it was too variable to be an effective
trading strategy, probably because I was trading against the trend, which I have come to realize is
just not a good approach.
Following this, I started using the MACD to trade, but more often than not I found myself
just watching trends and trading based off those. Yes, it was blind trading, but it was going better
than my previous strategy, so I kept at it. It soon dropped the MACD all together, and just kept a
couple moving averages on the chart to show me the current trend. I continued to trade on the
one minute timeframe as well. Eventually I realized that trading blind, although it was working,
was not ideal, and that I should develop a trading strategy with more discipline. I started to look
for an indicator that would fit with my current trading strategy.
I ended up finding Fibonacci’s, which worked very well with my current strategy, as they
served to enhance my ability to read the current trend, and when the trend might fall back to
before continuing. This was about the time that I switched over to the five minute timeframe, as
the one minute timeframe is too noisy to discern the trend. The noise on the one minute
[72]
timeframe is too much, and it can be very difficult to extract the real market movement from the
noise. My method of using Fibonacci’s is relatively simple. Each period of trading, I look at all
the charts, and identify the trends that I see with Fibonacci indicators. This gives me support and
resistances levels that I am able to trade around. In addition, I add my own support and resistance
levels that are important values, values I have seen the price bounce off of multiple times before.
These are much higher levels of support and resistance. I wait until I see a price retracement that
has hit one of the levels I have set, and then has moved with the trend for at least three or four
solid bars. This is an indication to me that the trend is reestablishing itself, and it’s likely that this
will be a movement with the trend. Now, this doesn’t work all the time, and it takes a little
experience to understand when the market will and will not continue moving with the trend, and
it is important to identify important patterns in the price movement, like railroad tracks, and
double peaks/valleys. Once I am into a trade, if I am losing, then I get out of the trade only if I
know that the resistance line I have been trading is broken. There is a fine line between waiting a
trade out, and closing a trade because there is no profit to be made.
Generally, I always open a trade with a ten pip stop loss, and a twenty pip take-profit. I
can’t decide whether I should raise this stop-loss, or keep it conservative. On one hand, I think
that the conservative stop-loss gets me out of bad trades early. However, I also think that a larger
stop loss would give me greater flexibility in my trades, as long as I am able to make good
decisions in getting out of the correct trades. However, I have stuck with the ten pip stop loss,
and I don’t really plan on changing it. I rarely every open a trade with more than one standard
lot, at a leverage of fifty, unless the trade looks exceptional. This uses two and a half percent of
my one hundred thousand dollar account, approximately.

[73]
As a general trading strategy, I always make sure to identify the current market trend, and
then trade with it. I will never open a trade that is against my defined trend. This is just
insurance; it makes me trade when I have more information about the market. My other main
rule is to remind myself that I never have to trade, and should never feel compelled to get in a
trade, by anything else other than my indicators and market patterns. If the market is not moving,
I just don’t trade. Never should a trader feel like they need to trade, for forced trades usually do
not end well.
5.2 Company Parameters
Our company is a US-based Forex company. As mentioned previously, as US citizens,
we don’t need to pay any extra taxes to work with US citizens, and we would receive little to no
tax breaks for having an offshore company. In addition, while we might dodge regulations by
moving offshore, we would lose most of the US customer base, because of the Non-resident
alien tax. Our company is structured as a Limited Liability company. This is a hybrid of a limited
liability partnership and a corporation. This allows us the freedom of a limited liability
partnership coupled with the limited liability for all partners that is granted to
corporations(Limited Liability Company).
The focus of the company is robot based trading. All our trades are executed by a Forex
bot. This makes them more consistent, and much faster than most human traders. We have a
variety of trading styles to suit the amount of risk a client wishes to take on, from conservative to
very aggressive. Generally, a more conservative investment plan will have a robot that trades
with less risk, and will try to have many small profits, as well as fewer small losses. A more
aggressive plan will have larger profits at the expense of larger drawdowns (drawdown is the
maximum loss on the account over a specified investment period). No client will be allowed to

[74]
start at an investment level that is above moderate. Once the client is with us for more than six
months, we will consider moving them up a risk level if they desire to. This will allow us to
greater judge the client’s needs.
For the conservative plan, we will aim for five percent annual gain on the account. There
will be a maximum drawdown per trade of two and a half percent, and a maximum drawdown on
the account of five percent. In order to keep the risk level low, a maximum leverage of ten will
be used, which means that an account of one hundred thousand dollars will have a maximum
purchasing power of one million dollars. This does not mean that a leverage of ten will be used
all the time, as it is likely that a leverage of ten will only be used in optimal market conditions. If
the account reaches the maximum drawdown, all currently open trades would be closed, and the
account would be closed. All other clients on the same trading plan would be notified, and the
trading plan would be suspended until the conservative strategy has been re-optimized, at which
point trading will resume, and clients will be once again notified. If a trade reached the
maximum drawdown per trade, than the client will be contacted, and the position will
automatically be closed.
The moderate plan will aim for an annual gain of ten percent on the account, with a
maximum of ten percent drawdown on the account. The maximum drawdown per trade will be
five percent. The same rules for reaching the drawdowns will apply. In order to reach this gain,
the account will use a maximum leverage of twenty, which means that an account of one
hundred thousand dollars will have a maximum purchasing power of two million dollars. Again,
it is unlikely that robot will trade at that leverage at all times, that is just the maximum leverage
allowed.

[75]
The aggressive plan will aim for an annual gain of fifteen percent, with a maximum
drawdown of fifteen percent on the account. There is a maximum drawdown of seven percent on
each trade on the account. The same rules for reaching the drawdowns apply. This plan will use a
leverage of forty, giving a maximum purchasing power of four million dollars on a one hundred
thousand dollar account.
The very aggressive plan will aim for a gain of twenty percent, with a maximum
drawdown of twenty percent. The maximum drawdown on a single trade is ten percent. The
same rules for drawdowns apply. This account will use a leverage of fifty, giving an account of
one hundred thousand dollars purchasing power of five million dollars.
As a company initially, it would be counterproductive to do any public marketing. Not
only are the rules of marketing an investment company rather complex (there will be lawyer later
on to handle that), but it is hard to advertise an investment company with absolutely no
established reputation. This means that we will need to establish credibility with family and
friends initially, and then provide service that earns us recommendations. We might even be able
to incentivize this by providing a drop or removal of performance fees.

[76]
6. Conclusion and Recommendations
Upon completion of this project, our group has laid the foundation of knowledge for
starting an investment company. We have explored potential locations, and the advantages and
disadvantages of each, as well as various governmental regulations associated with each location.
In the end, we elected to locate our company within the United States, as it seemed to be the best
fit with the company’s needs. The company itself will be structured as a Limited Liability
company (LLC), which removes the individual traders from liability, but still has enough
accountability so that the clients are not left out in the cold. As for trading strategies, our group
will use our robots to created tiered risk levels, with the lower levels offering consistent, but less
profits. The higher levels will offer more profit, but at greater risk, and higher drawdowns. Each
trader will develop and maintain a couple levels of risk. In addition, clients will be unable to start
above a moderate risk level, and will only be able to move above this moderate risk level after
six months, when we will be able to greater understand the client’s needs.
Our trading strategies have also evolved heavily over the course of this project. We
started out using too many indicators, and we did not fully understand any of them. Each week,
we evaluated our trading strategies, and eventually we found that we focused on a couple of
choice indicators that stood out as being useful and reliable to trade with. In addition, we found
that each trader was improving as a trader, having more experience with the market and common
movements. Sometimes, we would try out a completely new strategy, and there would be an
adjustment period before we would decide whether this new strategy worked better than the
previous. Although we each had our own strategy by the end, our trading strategies will continue
to evolve, reflecting the importance of experience in the market.

[77]
Our project had an increased focus on programming, as the group saw more potential in
programming robots based on our trading strategies than actively trading. Each group member
designed a single robot to start, individually, that reflected their own trading strategy. These will
be back tested and optimized before being used to trade for the investment company. In addition,
our group used the programming experience to develop an indicator that measures relative
currency strength, which is calculated as the percent change of the currency on the day,
multiplied by the volume. When the indicator is used on a graph in MT4, it displays all the
currencies and their respective strength, on a scale of negative ten to ten. This works on all time
frames, although it was designed for the hour four timeframe. We plan on continuing the
development of this indicator, adding external variables that can be changed, as well as a scale
for the currencies involved.
One challenge that we were met with during the project was the exiting of a group
member. We definitely noticed that losing a group member meant that individually, we would be
doing more work. In addition, we lost a third perspective on trading and the strategies involved.
However, in the end, I don’t think this affected the final outcome of the project in a significant
manner.
As for recommendation on future Investment and Trading IQP’s, I think it will be
important to have a more static project description throughout the project. Our group found that
each term, the focus would change, and it became a little distracting, as we were never quite sure
what the final project would represent. If we were provided initially with what we would be
expected to present as our final project at the beginning of the IQP, we would have had an easier
time with certain aspects. In addition, we do not think that the term papers that were assigned
over a- and then b-term breaks were detrimental to the project. I think a better method would be

[78]
to replace the weekly papers with assigning certain parts of the paper to be due each week. Then
the large paper could be compiled and presented at the end of each term. Our group found that
the time commitments over breaks were excessive, and as a result our writing suffered. Our
group hopes that these recommendations are taken into consideration for future IQP’s.

[79]
7. Bibliography
Artificial Neural Network. 15 February 2012. Wikimedia Foundation Inc. 21 February 2012.
<http://en.wikipedia.org/wiki/Artificial_neural_network>.
Average Directional Index (ADX). n.d. StockCharts.com. 6 October 2011.
<http://stockcharts.com/school/doku.php?id=chart_school:technical_indicators:average_d
irectional_index_adx>.
Average True Range (ATR). n.d. StockCharts.com. 18 October 2011.
<http://stockcharts.com/school/doku.php?id=chart_school:technical_indicators:average_t
rue_range_atr>.
Barnes, Ryan. Economic Indicators: Consumer Confidence Index (CCI). n.d. Investopedia ULC.
22 October 2011.
<http://www.investopedia.com/university/releases/consumerconfidence.asp>.
—. Economic Indicators: Consumer Price Index (CPI). n.d. Investopedia ULC. 21 October
2011. <http://www.investopedia.com/university/releases/cpi.asp>.
—. Economic Indicators: Gross Domestic Product (GDP). n.d. Investopedia ULC. 21 October
2011. <http://www.investopedia.com/university/releases/gdp.asp>.
—. Economic Indicators: Industrial Production. n.d. Investopedia ULC. 20 October 2011.
<http://www.investopedia.com/university/releases/productioncapacity.asp>.
—. Economic Indicators: Purchasing Managers Index (PMI). n.d. Investopedia ULC.
Document. 21 October 2011.
<http://www.investopedia.com/university/releases/napm.asp#axzz1bGBhQLUI>.

[80]
—. Economic Indicators: Retail Sales Report. n.d. Investopedia ULC. Document. 21 October
2011.
<http://www.investopedia.com/university/releases/retailsales.asp#axzz1bGBhQLUI>.
Bates, Trudy. Online Forex Trading Bid and Ask Price and the Bid Ask Spread. n.d. 16 February
2012. <http://www.fxinfo.com/bid-ask-price.html>.
Bollinger Bands. n.d. StockCharts.com. 18 October 2011.
<http://stockcharts.com/school/doku.php?id=chart_school:technical_indicators:bollinger_
bands>.
Camarilla Equation. n.d. BabyPips.com. 6 October 2011.
<http://www.babypips.com/forexpedia/Camarilla_Equation>.
Camarilla Pivot Points. 2011. Web site. 29 02 2012.
Commodity Futures Trading Commission. 04 02 2012. Web Page. 23 02 2012.
Commodity Futures Trading Commission. Mission and Responsibilites. 2012. Web Page. 23 02
2012.
Corporation. 20 02 2012. Web Page. 23 02 2012.
Credit Rating. 21 February 2012. Wikimedia Foundation Inc. 21 February 2012.
<http://en.wikipedia.org/wiki/Credit_rating>.
Employment Indicators - Forex Fundamental Analysis. n.d. Capital Market Services, LLC. 20
October 2011. <http://www.cmsfx.com/en/forex-education/online-forex-course/chapter-
2-fundamental-factors/fundamental-analysis/employment-indicators/>.
Fibonacci Fans. n.d. Forexfibonacci.com. 18 October 2011.
<http://www.forexfibonacci.com/fibonacci_fan/02/>.

[81]
Fibonacci Method in Forex. n.d. Forexfibonacci.com. 18 October 2011.
<http://www.forexfibonacci.com/>.
Financial Industry Regulatory Authority. 04 02 2012. Web Page. 23 02 2012.
Foreign Exchange Market. 23 February 2012. Wikimedia Foundation Inc. 23 February 2012.
<http://en.wikipedia.org/wiki/Foreign_exchange_market>.
Forex Fundamentals: Inflation. n.d. Capital Market Services, LLC. 19 October 2011.
<http://www.cmsfx.com/en/forex-education/online-forex-course/chapter-2-fundamental-
factors/fundamental-analysis/inflation-indicators/>.
Forex Lot Sizes and Risks. n.d. 16 February 2012. <http://forexbeginners.net/lot-sizes-and-
risks>.
Forex4Noobs. Using Trend Lines. 2012. Web site. 29 02 2012.
—. What are Trend Lines? 2012. Web site. 29 02 2012.
Fundamental Major Currencies: Industrial Production (Euro Zone). n.d. GoLearnForex.com. 20
October 2011. <http://www.golearnforex.net/fundamental-analysis/2266-fundamental-
major-currencies-industrial-production-euro-zone.html>.
General Partnership. 15 02 2012. Web Page. 15 02 2012.
Genetic Algorithm. 14 February 2012. Wikimedia Foundation Inc. 21 February 2012.
<http://en.wikipedia.org/wiki/Genetic_algorithm>.
Greenburg, Michael. Finally the Brokers Guide explaining what Marker Maker, STP and ECN
broers really are: Part 1/2. 23 June 2009. Forex Magnates Inc. 17 February 2012.
<http://forexmagnates.com/finally-the-brokers-guide-explaining-what-market-maker-stp-
and-ecn-brokers-really-are-part-12/>.

[82]
—. Finally the Grokers Guide explaining what Market Maker, STP and ECN brokers really are:
Part 2/2. 24 June 2009. Forex Magnates Inc. 17 February 2012.
<http://forexmagnates.com/finally-the-brokers-guide-explaining-what-market-maker-stp-
and-ecn-brokers-really-are-part-22/>.
Gross Domestic Product (GDP) Definition. n.d. Investopedia ULC. 19 October 2011.
<http://www.investopedia.com/terms/g/gdp.asp>.
Hassam, Ahmad. What is Forex Margin Call? n.d. 16 February 2012.
<http://www.forexpros.com/education/beginners/what-is-forex-margin-call%2520-
37374>.
Heakal, Reem. Explaining The World Through MacroEconomic Analysis. 7 January 2011.
Investopedia, ULC. 18 February 2012.
<http://www.investopedia.com/articles/02/120402.asp#axzz1mlgdSk2x>.
History of Futures Trading. n.d. 23 February 2012. <http://www.futures-trading-
mentor.com/history-of-futures-trading.html>.
History of Investment Banking in the US and Britain - An Overview. n.d. 23 February 2012.
<http://shrewd-investment.com/history-of-investment-banking-in-the-us-and-britain-an-
overview/>.
How Global Events Affect the Forex Market. 13 June 2011. Investopedia, ULC. 22 February
2012. <http://www.investopedia.com/articles/forex/11/international-events-affect-
forex.asp#axzz1nA2jqXkN>.
Ichimoku Kinko Hyo. n.d. BabyPips.com. 6 October 2011.
<http://www.babypips.com/forexpedia/Ichimoku_Kinko_Hyo>.

[83]
Ichimoku Trading Strategies. n.d. IchiWiki. 6 October 2011.
<http://www.kumotrader.com/ichimoku_wiki/index.php?title=Ichimoku_trading_strategi
es>.
Interest Rates 101. n.d. BabyPips.com. 19 October 2011.
<http://www.babypips.com/school/interest-rates-101.html>.
Internal Revenue Service. Taxation of Nonresident Aliens. 05 12 2011. Web Page. 23 02 2012.
Investopedia. Key Performance Indicators. 2012. Web Page. 23 02 2012.
—. Series 3. 2012. Web Page. 23 02 2012.
—. Series 34. 2012. Web Page. 23 02 2012.
—. Series 7. 2012. Web Page. 23 02 2012.
Johnson, Simon and James Kwak. National Debt fro Beginners. 4 February 2009. NPR. 21
February 2012. <http://www.npr.org/templates/story/story.php?storyId=99927343>.
Kuepper, Justin. The Fundamentals of Forex Fundamentals. 17 March 2010. Investopedia ULC.
18 Fwbruary 2012.
<http://www.investopedia.com/articles/trading/04/031704.asp#axzz1mlgdSk2x>.
Lee, Kelvin. Average True Range (ATR) Indicator Explained. 13 August 2010. Best Forex
Indicator. 29 September 2011. <http://www.forexindicator.org/average-true-range-atr-
indicator-explained.html>.
—. Forex Bollinger Bands Explained. 7 January 2010. Best Forex Indicator. 29 September 2011.
<http://www.forexindicator.org/forex-macd-indicator-explained.html>.
—. Forex CCI Indicator Explained. 16 May 2010. Best Forex Indicator. 29 September 2011.
<http://www.forexindicator.org/forex-cci-indicator-explained.html>.

[84]
—. Forex Fibonacci Indicator Explained. 17 March 2010. Best Forex Indicator. 29 September
2011. <http://www.forexindicator.org/forex-fibonacci-indicator-explained.html>.
—. Forex MACD Indicator Explained. 13 December 2009. Best Forex Indicator. 29 September
2011. <http://www.forexindicator.org/forex-macd-indicator-explained.html>.
—. Forex Moving Average Explained. 10 February 2010. Best Forex Indicator. 29 September
2011. <http://www.forexindicator.org/forex-moving-average-explained.html>.
—. Forex Parabolic SAR Indicator Explained. 11 March 2010. Best Forex Indicator. 29
September 2011. <http://www.forexindicator.org/forex-parabolic-sar-indicator-
explained.html>>.
—. Forex Pivot Point Trading Tutorial. 24 05 2010. Web Site. 29 02 2012.
—. Forex Relative Strength Index Indicator Explained. 18 April 2010. Best Forex Indicator. 29
September 2011. <http://www.forexindicator.org/forex-relative-strength-index-indicator-
explained.html>.
—. Forex Stochastic Indicator Explained. 2 June 2010. Best Forex Indicator. 29 September
2011. <http://www.forexindicator.org/forex-stochastic-indicator-explained.html>.
—. How To Trade Using Moving Average. 29 September 2010. Best Forex Indicator. 29
September 2011. <http://www.forexindicator.org/how-to-trade-using-moving-
average.html>.
—. How To Use Bollinger Bands. 8 February 2010. Best Forex Indicator. 29 September 2011.
<http://www.forexindicator.org/how-to-use-bollinger-bands.html>.
—. The MACD Crossover Trading Techniques. 13 December 2009. Best Forex Indicator. 29
September 2011. <http://www.forexindicator.org/the-macd-crossover-trading-
techniques.html>.

[85]
Leverage Definition. n.d. 29 August 2011. <http://www.investopedia.com/terms/l/leverage.asp>.
Limited Liability Company. 23 02 2012. Web Page. 23 02 2012.
Limited Liability Partnership. 22 02 2012. Web Page. 23 02 2012.
Limited Partnership. 17 01 2012. Web Page. 23 02 2012.
List of Countries by Credit Rating. 20 February 2012. Wikimedia Foundation Inc. 21 February
2012. <http://en.wikipedia.org/wiki/List_of_countries_by_credit_rating>.
Long (or Long Position) Definition. n.d. 29 Aug 2011.
<http://www.investopedia.com/terms/l/long.asp>.
Michael J. Radzicki, Ph.D. "Creating a Personal Robotic Trading System." Worcester, 12
January 2012.
Parabolic SAR. n.d. StockCharts.com. 18 October 2011.
<http://stockcharts.com/school/doku.php?id=chart_school:technical_indicators:parabolic
_sar>.
Particle Swarm Optimization. 16 January 2012. Wikimedia Foundation Inc. 21 February 2012.
<http://en.wikipedia.org/wiki/Particle_swarm_optimization>.
Pip. n.d. 16 February 2012. <http://www.investopedia.com/terms/p/pip.asp#axzz1mbgsP0jK>.
Relative Strength Index (RSI). n.d. StockCharts.com. 18 October 2011.
<http://stockcharts.com/school/doku.php?id=chart_school:technical_indicators:relative_s
trength_index_rsi>.
Relative Vigor Index (RVI). n.d. BabyPips.com. 6 October 2011.
<http://www.babypips.com/forexpedia/Relative_Vigor_Index>.
Relative Vigor Index (RVI). n.d. MetaQuotes Software Corp. 6 October 2011.
<http://ta.mql4.com/indicators/oscillators/relative_vigor_index>.
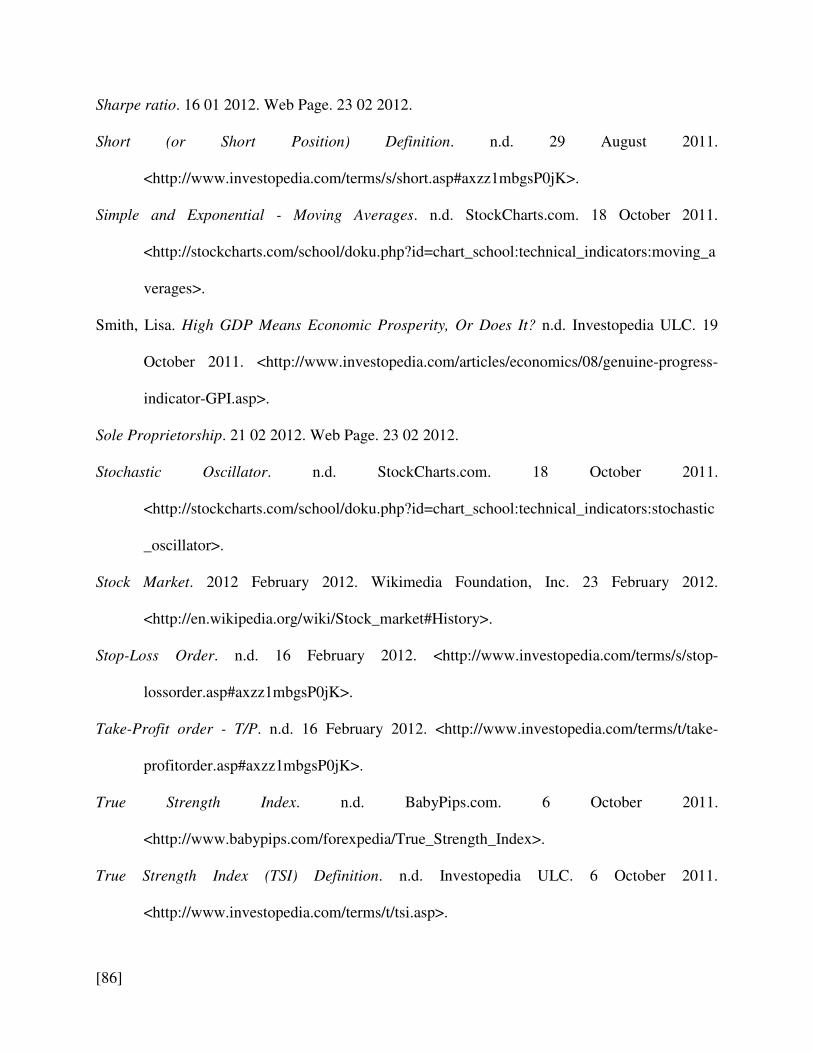
[86]
Sharpe ratio. 16 01 2012. Web Page. 23 02 2012.
Short (or Short Position) Definition. n.d. 29 August 2011.
<http://www.investopedia.com/terms/s/short.asp#axzz1mbgsP0jK>.
Simple and Exponential - Moving Averages. n.d. StockCharts.com. 18 October 2011.
<http://stockcharts.com/school/doku.php?id=chart_school:technical_indicators:moving_a
verages>.
Smith, Lisa. High GDP Means Economic Prosperity, Or Does It? n.d. Investopedia ULC. 19
October 2011. <http://www.investopedia.com/articles/economics/08/genuine-progress-
indicator-GPI.asp>.
Sole Proprietorship. 21 02 2012. Web Page. 23 02 2012.
Stochastic Oscillator. n.d. StockCharts.com. 18 October 2011.
<http://stockcharts.com/school/doku.php?id=chart_school:technical_indicators:stochastic
_oscillator>.
Stock Market. 2012 February 2012. Wikimedia Foundation, Inc. 23 February 2012.
<http://en.wikipedia.org/wiki/Stock_market#History>.
Stop-Loss Order. n.d. 16 February 2012. <http://www.investopedia.com/terms/s/stop-
lossorder.asp#axzz1mbgsP0jK>.
Take-Profit order - T/P. n.d. 16 February 2012. <http://www.investopedia.com/terms/t/take-
profitorder.asp#axzz1mbgsP0jK>.
True Strength Index. n.d. BabyPips.com. 6 October 2011.
<http://www.babypips.com/forexpedia/True_Strength_Index>.
True Strength Index (TSI) Definition. n.d. Investopedia ULC. 6 October 2011.
<http://www.investopedia.com/terms/t/tsi.asp>.

[87]
U.S. Securities and Exchange Commission. 17 02 2012. Web Page. 23 02 2012.
U.S. Securities and Exchange Commission. Investment Company Registration and Regulation
Package. 02 04 2009. Web Page. 23 02 2012.
Using Trend Kines. n.d.

[88]
Appendix A: Trading Journal
A.1 Gabriel McCormick
Date Time Type Size Currency Pips profit
11/07 9:36 AM long 1 lot AUDUSD 9.7 $97
11/09 9:45 AM short 1 lot AUDUSD 10.2 $102
11/09 10:26 AM long 1 lot USDCAD -7.2 -$70.50
11/10 9:16 AM long 1 lot AUDUSD -12.8 -$128
11/10 9:37 AM short 1 lot EURUSD 0.7 $6
11/10 9:51 AM short 1 lot EURUSD 20.3 $210
11/15 9:43 AM long 1 lot AUDUSD 3.7 $36
11/16 9:42 AM long 1 lot EURUSD 11.8 $118
11/17 9:09 AM long 1 lot EURUSD -11.7 -$117
11/17 9:16 AM long 1 lot EURUSD -12.9 -$129
11/18 9:45 AM short 1 lot EURUSD 8.2 $82
11/21 10:39 AM long 1 lot USDCAD 18.5 $177
11/23 11:06 AM long 1 lot USDCAD 2.1 $20.03
11/29 9:05 AM short 1 lot EURUSD -12.2 -$122
12/02 11:03 AM short 1 lot EURUSD -7.6 -$76
12/07 8:45 AM short 1 lot EURGBP 6.8 $106
12/08 9:47 AM long 1 lot USDCAD -11.6 -$111
12/09 9:51 AM long 1 lot EURUSD -13.2 -$132
12/09 10:40 AM long 1 lot USDCAD -11.4 -$109
Totals -8.6 $59.5 Table 1: Gabriel McCormick’s Trades
11/07/11: AUD/USD
BUY: 1.03774
CLOSE: 1.03871
PROFIT:$97, 9.7 pips
This was my first trade using trade station, so I was still trying to figure out how trading worked
on the platform. I actually opened the trade, and the price dropped a little, and I went to go and
get out of the trade before realizing that I didn’t know how to close the trade. However, by the
time I had called on of my partners to find out how to close a trade, I had made a good amount of
profit, and I noticed that the price had neared my ten pip limit, but hadn’t quite hit it, and was

[89]
now retracing, so I got out. I did not use any indicators for this trade, except for my ever-present
two long term EMA’s that serve as trend lines, the rest was just market analysis on the fly. From
this trade, I learned that if you decide to enter a trade, it can often be profitable to wait a little to
let the market react in the way that you hope. Had I known how to close a trade upon entering
this trade, I probably would have exited much earlier, with a loss.
11/09/11: AUD/USD
SELL: 1.01941
CLOSE: 1.01839
PROFIT: $102, 10.2 pips
I entered this trade by evaluating the market, and using my two trend-indicating long term
EMA’s. I traded because the USD was strong on the day, and that was pushing down on
EURUSD and AUDUSD, among others. I ended up being knocked out by my limit, but I was
happy to have the profit upon close. The market soon turned around, so had I stayed in, there is a
possibility that I could have lost some of that profit. In hindsight, if I had traded EURUSD
instead of AUDUSD, I would have made more f4rom this trade, as EURUSD has more liquidity.
However, I am not disappointed, as this was a good trade, and I followed my guidelines, and the
current trend.
11/09/11: USD/CAD
BUY: 1.03197
CLOSE: 1.02125
LOSS: $70.50, 7.2 pips

[90]
I entered this trade because the price had recently bounced off the Fibonacci retracement
lines I was using, and there were a number of strong bars, indicating that the price was likely to
continue upward when I entered. However, there appeared to be a lot of downward pressure, and
the price came down to within a tenth of my stop. When the price went up a little more than two
pips, I exited, thinking that it was a good idea to lose as little money as possible. However, a bar
after I exited, the price went up another 15 pips or so, which was disappointing, but I know that
were I in the same position, again, I would have made the same decision. I don’t think I did
anything wrong, and was pretty happy that I managed to get out with as little loss as possible. I
think the best lesson to be learned from this trade is to cut your losses when you are not
confident in the trade, do not go in, for it is very likely that you will be disappointed.
11/10/11: AUD/USD
BUY: 1.01910
CLOSE: 1.01782
LOSS: $128, 12.8 pips
I was taken out by my stop loss on this trade, which was the largest loss on this account
so far. I entered this trade because the trend was strongly upward, with little indication that it was
going to retrace. However, the price did exactly that, and took out my stop/loss pretty quick. This
was not a smart trade, as I never waited for an indication that the price was going to continue
upward, I just assumed that the price would continue on the current trend. Had I waited, I would
have seen that the price was in a reversal. Obviously, I should not have entered the trade before
waiting to see three or four strong green bars. What I need to learn from this trade is not to just

[91]
jump into a trade because it looks good. Instead, I need to wait for the trade to have the correct
criteria, in order to become a disciplined trader.
11/10/11: EUR/USD
SELL: 1.36053
CLOSE: 1.36046
PROFIT: $6, 0.7 pips
I got into this trade because I notice that the market was in full reversal, and I wanted to
catch a couple pips on the retracement. However, as I entered, the market went into a small
period of consolidation. Getting worried, I exited the trade shortly after, knowing I had to get
ready for class. In hindsight, I should have trusted my trading instinct, as well as my stop/loss
and my take profit. However, I can’t say that I did anything totally wrong, as I exited without
losing anything. Although I can’t fault myself for getting out, because a small profit is much
better than losing anything, I need to be more disciplined and wait my trade out, letting it evolve.
Otherwise, I won’t make any money at all.
11/10/11: EUR/USD
SELL: 1.35895
CLOSE: 1.35692
PROFIT: $210, 20.3 pips
The last trade of the morning, and the sixth of the week, I noticed the price of EURUSD
continued to fall, and I shorted at 1.35895, and got taken out of the market by my take profit at
1.35692. I made 210 dollars on this trade. I was very happy with this 6trade, since it was the first
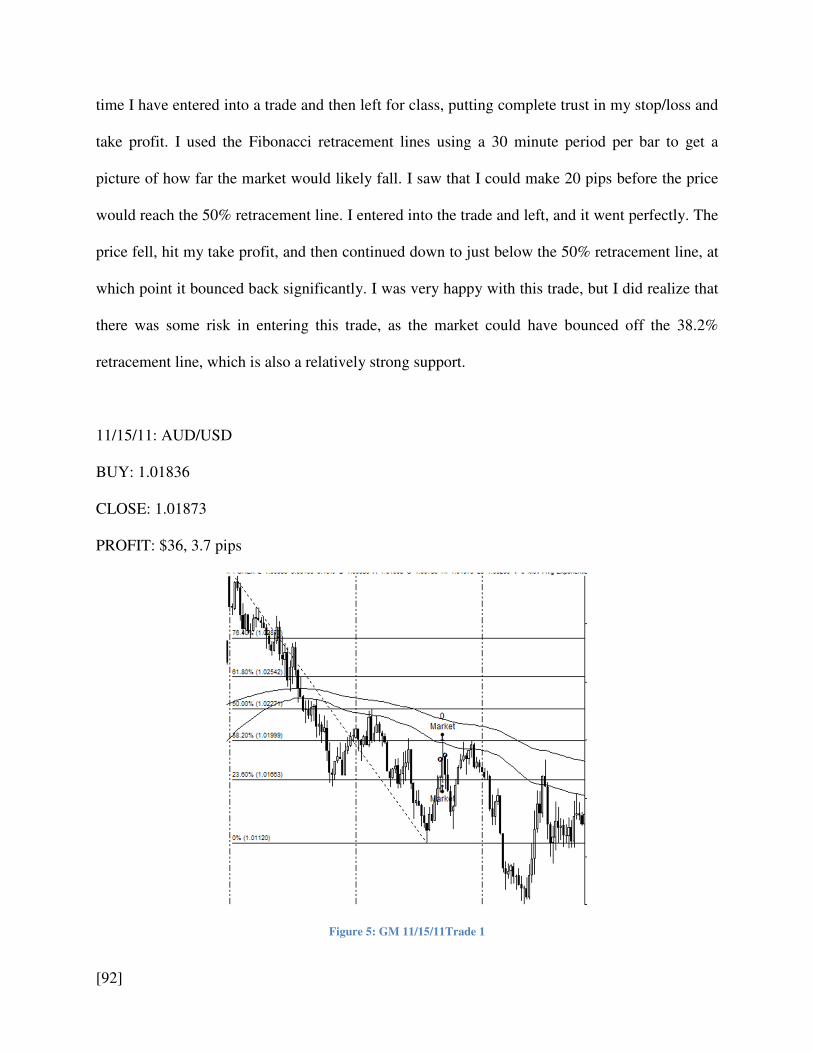
[92]
time I have entered into a trade and then left for class, putting complete trust in my stop/loss and
take profit. I used the Fibonacci retracement lines using a 30 minute period per bar to get a
picture of how far the market would likely fall. I saw that I could make 20 pips before the price
would reach the 50% retracement line. I entered into the trade and left, and it went perfectly. The
price fell, hit my take profit, and then continued down to just below the 50% retracement line, at
which point it bounced back significantly. I was very happy with this trade, but I did realize that
there was some risk in entering this trade, as the market could have bounced off the 38.2%
retracement line, which is also a relatively strong support.
11/15/11: AUD/USD
BUY: 1.01836
CLOSE: 1.01873
PROFIT: $36, 3.7 pips
Figure 5: GM 11/15/11Trade 1

[93]
When I entered this trade, I saw that the market was in retracement, and I saw a trend that was
strong enough for me to trade comfortably. I was about to leave the trade and go to class,
thinking that I would hit my take profit and make out with about twenty pips, as the price had
already gone up about 14 pips since I entered the trade. Me being very cautious, I checked my
Fibonacci’s and saw that the price was nearing the thirty six percent retracement line of the
strong downward trend that was being retraced. The price came back almost immediately, and I
exited with whatever profit I had at the time, knowing the price would continue to drop. When I
came back from class, I checked to see if I had made the right decision, and I had. The price fell
a good twenty or thirty pips after I exited. I was happy with this trade, but I should have added
the Fibonacci’s before entering the trade and I could have made out with 14 pips, instead of 3.7
pips. The Fibonacci’s I drew were not showing up on the one minute timescale for some reason,
so I have included the thirty minute timescale of the same trade.
11/16/11: EUR/USD
BUY: 1.35036
CLOSE: 1.35154
PROFIT: $118, 11.8 pips
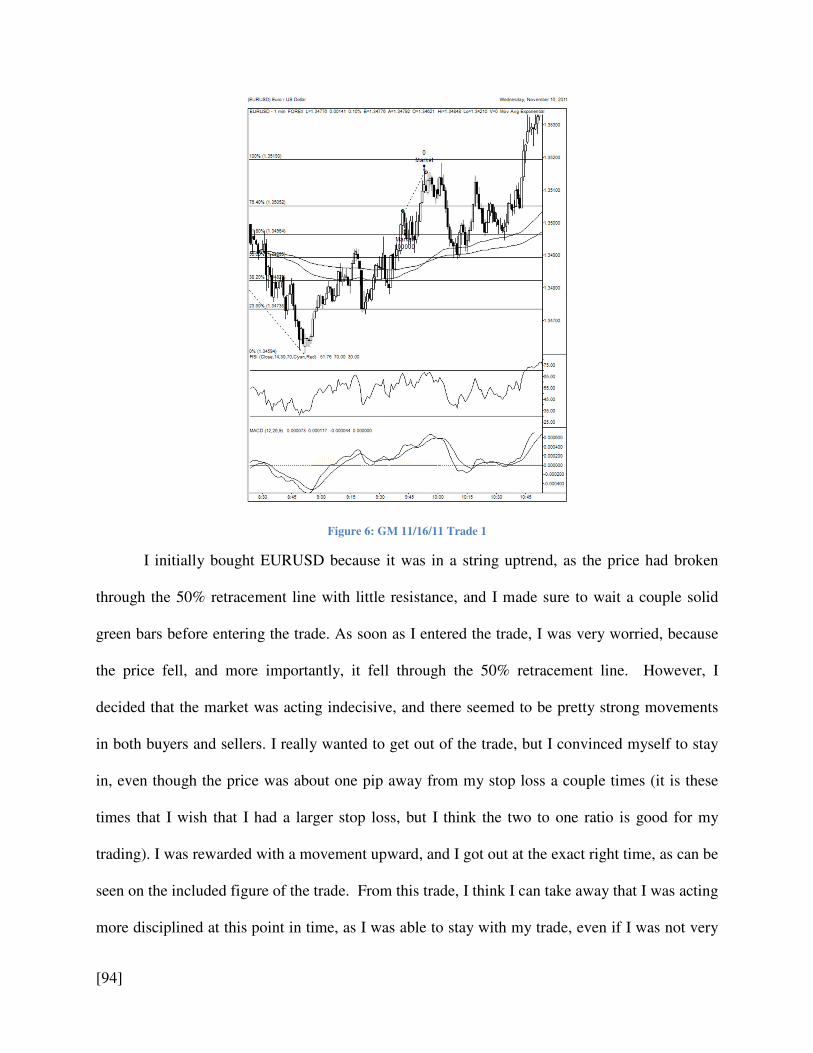
[94]
Figure 6: GM 11/16/11 Trade 1
I initially bought EURUSD because it was in a string uptrend, as the price had broken
through the 50% retracement line with little resistance, and I made sure to wait a couple solid
green bars before entering the trade. As soon as I entered the trade, I was very worried, because
the price fell, and more importantly, it fell through the 50% retracement line. However, I
decided that the market was acting indecisive, and there seemed to be pretty strong movements
in both buyers and sellers. I really wanted to get out of the trade, but I convinced myself to stay
in, even though the price was about one pip away from my stop loss a couple times (it is these
times that I wish that I had a larger stop loss, but I think the two to one ratio is good for my
trading). I was rewarded with a movement upward, and I got out at the exact right time, as can be
seen on the included figure of the trade. From this trade, I think I can take away that I was acting
more disciplined at this point in time, as I was able to stay with my trade, even if I was not very

[95]
comfortable with how the outcome was looking. From this trade, I should definitely wait for a
more reliable signal for the price moving upward, as it was obvious that the market wasn’t going
to move upward after I got in.
11/17/11: EUR/USD
BUY: 1.35351
CLOSE: 1.35234
LOSS: $117, 11.7 pips
I was trading with a strong uptrend. I got in hurriedly, and without waiting to see how the market
would react. Before I made the trade, I was watching the market because I noticed it was nearing
a strong resistance. However, the price shot through the resistance, and I bought at 1.35351. The
price hit my stop loss at 1.35234 for a loss of 11.7 pips and 117 dollars. As soon as I bought, the
price fell, and knocked me out very soon after. I should have waited for a couple more bars to
see if the trend would hold after breaking the strong resistance. Obviously, it did not. I was not
happy with this trade, and it is possible that that emotion might have carried over to the next
trade, when I bought EURUSD very soon after. This was the first of two trades I made this day
that knocked me out for the day because I reached my maximum loss per day.
11/17/11: EUR/USD
SELL: 1.35278
CLOSE: 1.35149
LOSS: $129, 12.9 pips

[96]
This time, I waited for three strong green bars before getting into the trade. I bought at 1.35278
and was knocked out by my stop loss at 1.35149, for a loss of 13.9 pips and about 129 dollars. I
made a big mistake with this trade. I did not realized that the resistance had not been broken, and
the price was about to reverse. Because I am on the one minute scale, I didn’t realize how small
the movement over the resistance actually was. The price actually was reversing, and I got into a
trade against that reversal. The price fell, and took out my stop loss. I should’ve realized that the
trend was not going to continue, especially since I was watching the area of resistance so closely.
Hopefully, I will be smart enough not to repeat this mistake. In addition, it was at this point in
time I realized the value of trading on the 5 minute timescale, as opposed to the one minute
timescale, and adjusted my trading strategy accordingly.
11/18/11: EURUSD
SELL: 1.35422
CLOSE: 1.35504
LOSS: 8.2 pips, $82

[97]
Figure 7: GM 11-18-11 Trade 1
This was a very disappointing trade for me, as it was a very good trade. I got in when I
noticed a strong downtrend, and the price had clearly broken the 50% retracement line from the
previous uptrend. After I got it, the price fell 19 pips (my take profit was at 20), and I figured
that I would just wait for my take profit to take me out of the trade, as the trend was strong
enough that I did not see a retracement taking out my stop loss. I was comfortable enough with
my trade that I began messing around with trailing stop losses in TradeStation. I couldn’t figure
out how to move the stop loss all the way up to my break-even point, but I did manage to move it
up a pip or two. However, there was a retracement, and I watched as the price moved all the way
up to the exact pip of my stop loss, taking me out of the trade in the process, before plunging 30
pips. Last week I promised I would not trade too quickly after trading, so I sat tight while I
watched the trend move strongly down to the support I had drawn. Obviously, I was in the
position to profit greatly from this trade, but my low stop loss took me out of the trade

[98]
prematurely. I don’t think I have much to learn from this trade, other than good decisions
sometimes turn into bad trade because of how unpredictable the market is.
11/21/11: USD/CAD
BUY: 1.03818
CLOSE: 1.04003
PROFIT: 18.5 pips, $177
Figure 8: GM 11-21-11 Trade 1
This was my first profitable trade in three trades, so it was a relief to finally get a good
trade under my belt. I traded in a strong uptrend, and got into the trade as soon as I noticed three
strong green bars in a row. I then rode the price up until my take profit took me out of the trade.

[99]
This was fine, as there were only about five more pips to be made before the price retraced. I
was very satisfied with this trade, as it was a good decision to get in, and I made it out with the
maximum profit possible with my 20 pip take profit.
11/21/11: USDJPY
BUY: ~77.210
CLOSE: ~77.310
PROFIT: ~ 10 pips, ~$109
Figure 9: GM 11-21-11 Trade 2

[100]
Although I made a decent profit off of this trade, I do not consider it to be a good trade. I was on
my computer, and glanced over to see that USDJPY was moving very strongly, with the current
trend. After two strong green bars, the third was moving upward rapidly, so I decided to take my
chances and get in while the price was still moving. I followed the price up another ten pips or so
before I got nervous enough to take myself out of the trade. I exited near the peak of the price
movement, so it was a good decision to get out when I did. However, I think this was a much
more risky trade than what I usually will trade on, and I’m not sure the risk was worth it. It was a
quick decision, and I went in rather blind. In the future, I think I would like to stick to the
sidelines when I see a movement like this. The reason why the data at the top is all estimations is
because TradeStation has no record of me making this trade. It’s very odd, but the only
indication that I have on my account that I made this trade is an unaccounted for 109 dollars in
my account this week. I’m not sure why this is.
11/23/11: USD/CAD
BUY: 1.04841
CLOSE: 1.04862
PROFIT: 2.1 pips, $20.03

[101]
Figure 10: GM 11-23-11Trade 1
I got into this trade very hesitantly, and got out very quickly because I decided I just
wasn’t okay with trading in a market that was unpredictable. I had been watching USDCAD all
morning, but it wasn’t moving very much. The price then moved up almost twenty pips, but I
wasn’t comfortable getting into a trade when I noticed the movement, most because I was
worried that I would get into a trade and the price would retrace, taking out my low stop loss. It
then made another twenty pip movement that I was reluctant to get into again. The price then
retraced 50 percent, and shot up. I watched two strong ten to fifteen pip green bars (I trade on the
5 minute timescale), just wishing I had gotten in on the retracement. However, I couldn’t bring
myself into the trade, as I kept thinking to myself that the price was bound to retrace soon.
However, each time, it did not. Finally, I got fed up and decided to enter the trade. Once in the
trade, I regretted the move immediately, as it was obvious the price was not moving as strongly

[102]
as before. Because I was not comfortable, I got out, and the price raised another three pips before
retracing. I think I should have had the sense just to stay out of the trade, especially if I was
uncomfortable with it. In addition, I think I should have been able to recognize that there was a
great trade opportunity, as the benefits obviously outweighed the risks, as the market was in a
very strong uptrend.
11/25/11: EURUSD (group account)
SELL: 1.33015
CLOSE: 1.33137
LOSS: 12.2 pips, $539
Figure 11: GM 11-25-11 Trade 1
This was a large loss because I was trading with four standard lots. This was a trade I
made simultaneously on the group account and my personal account. I made this trade because

[103]
the Euro was moving very strongly downward, quickly, and I waited until there was a definite
movement after a small retracement. In addition, I did not see any large supports within twenty
pips, so I figured this would be a good trade. However, it obviously was not. A little after I got
into the trade with both accounts, the price started to reverse. I had prepared myself that with my
strategy of waiting for a movement until I get into the trade, there was a possibility of a
retracement before the price continued to fall. Unfortunately, this was not a retracement, it was a
reversal. Not too long after I got into the trade, my stop/loss took me out, and the price continued
upward from there. I think this trade was a loss because I waited too long to recognize the
movement and get into the trade. I was kicking myself over this trade because it was such a huge
loss because of the group account, and also because the trend had been apparent for a while, it
just seemed like there was never a good time to get into a trade. In the future, I will avoid trading
these quick movements, because they have proved to be unhealthy for my account.
12/2/11: EURUSD
SELL: 1.33897
CLOSE: 1.33973
LOSS: 7.6 pips, $76
[104]
Figure 12: GM 12-2-11 Trade 1
For this trade, I was experimenting with using support and resistance lines to create
future trades. I found a heavy support level, and set a stop limit at approximately 30 pips below
the level (it was a big move). Not too long after, I noticed the price was moving quickly, and
sure enough, it broke through the support. I look special interest in watching the price, because I
did not know how to set stop losses when using a stop limit trade. This is something I have to
figure out if I am going to continue to trade this way. However, I watching when my stop limit
got me into a trade. However, I noticed that since the price was moving so quick, there was a lot
of movement each way. Soon after placing my stop loss and my take profit, I realized that my 10

[105]
pip stop loss was likely to take me out of the trade. This is exactly what happened, and the price
continued to fall for a bit even after I got out. Interestingly enough, I think I placed my stop limit
too far away from the support as well, as the movement didn’t continue too long after I was out
of the trade. I probably should have a maximum distance of about 25 pips. In addition, when
trading this way, I should alter my stop loss to respect the quick movements that are possible
when trading in this manner. In addition, the RSI was indicating oversold when I got into the
trade. I should pay for attention to this, as even with big movements, this typically indicates an
impending reversal.
12/7/11: EURGBP:
SELL: 0.85510
CLOSE: 0.85442
PROFIT: 6.8 pips, $106.31

[106]
Figure 13: GM 12-7-11 Trade 1
This trade was a good trade. I got into it because I noticed a strong downward trend, and
RSI that was not yet indicating oversold. In addition, the price was not too near any support
levels I had for this currency pair. One thing I noticed when I got into the trade was that there
was not a lot of liquidity in the market, and the price was not moving as fast as I expected,
coming from high liquidity currency pairs such as EURUSD or USDCAD. I stuck with it
anyway, and I decided that I was satisfied with my profit when I got out of the trade. I got out
because the price was approaching overbought levels in my RSI. In addition, I had to leave for
class soon, and I was not sure that the trend would continue without a reversal. I was happy I got
out because the price started to go up after I exited. Upon looking back at the end of the day, I

[107]
see that there were more pips to be made from the trade. Nevertheless, I am happy that I was able
to get out with a profit, and when I was ready to get out of the trade.
A.2 Devin Kehler
Below is a chart of all the trades made between 11/02/11 and 12/07/11. Trades made
before this point are insignificant, and there were no trades made afterwards. Detailed analysis
for the first 3 trades has been omitted, as those trades were never properly documented.
Date Time Type Size Currency Pips profit
11/02 8:41 PM long 1 lot EURUSD 1.5 $15
11/02 8:50 PM long 1 lot AUDUSD -8 -$80
11/06 7:37 PM short 1 lot AUDUSD -10 -$100
11/06 7:54 PM short 1 lot EURUSD -12.8 -$128
11/07 9:10 AM long 1 lot EURUSD 7.9 $79
11/07 9:11 AM long 1 lot EURUSD 1.8 $18
11/07 9:17 AM long 2 lots EURUSD 1.2 $24
11/07 10:07 AM short 1 lot EURUSD -10.7 -$107
11/07 10:25 AM short 1 lot EURUSD 0.6 $6
11/07 10:25 AM short 1 lot EURUSD 0.1 $1
11/07 10:26 AM short 1 lot EURUSD 4.5 $45
11/08 10:46 AM long 1 lot EURUSD -20.2 -$202
11/10 9:35 AM short 1 lot EURUSD 5.2 $52
11/11 10:11 AM long 1 lot USDJPY 0.4 $5.19
11/11 10:45 AM short 1 lot USDJPY -6.5 -$8.42
11/15 10:12 AM short 1 lot AUDUSD 1.1 $11
11/16 10:03 AM short 1 lot EURUSD 11.4 $114
11/17 9:20 AM short 1 lot EURUSD 5.1 $51
11/18 9:56 AM long 1 lot AUDUSD 10.8 $108
11/21 10:03 AM long 1 lot AUDUSD -10.1 -$101
11/21 11:25 AM short 1 lot EURUSD 0.1 $1
11/22 11:08 AM long 1 lot EURUSD -12.9 -$129
11/29 10:05 AM short 1 lot AUDUSD -9.8 -$98
12/01 10:10 AM short 1 lot AUDUSD 9.7 $97
12/02 9:50 AM long 1 lot EURUSD -8.8 -$88
12/07 10:14 AM short 1 lot EURUSD -8.5 -$85
Totals -56.9 -$494.39 Table 2: Trades made on $100K account from 11/02/11 to 12/07/11
11/06 7:54 PM
Short EURUSD, 1 lot
Open 1.37787

[108]
Close 1.37915
Profit -$128
At this point, I was fairly new to the trading game. My biggest mistake here was in my trading
strategy. The nature of my trading strategy was quite risky; it involved trading against a trend
and trying to catch reversals. My first few trades were big losses because I had trouble spotting
real reversals. At this point I was using the MACD divergence and my own trend lines to help
predict where a trend would reverse.
11/07 9:10 AM
Long EURUSD, 1 lot
Open 1.37737
Close 1.37816
Profit $79
The following day I started trading in the mornings instead of the evenings. I figured the increase
in market movement, especially in EURUSD, would help me find the trends and use them to my
advantage. Though this one, and my next few trades were more profitable than the previous
week had been, in the long run trading in the morning versus the evening made little, if any,
difference. The problem I was having was in my trading strategy.
11/07 9:11 AM
Long EURUSD, 1 lot
Open 1.37774
Close 1.37792
Profit $18

[109]
Fueled by my temporary success, I made another trade immediately. This was probably a
mistake, but it turned out alright in my favor. After two successful trades in a row, I truly
believed that switching to the morning trading session had made a significant difference, so I
kept trading.
11/07 9:17 AM
Long EURUSD, 2 lots
Open 1.37674
Close 1.37686
Profit $24
This trade was mostly unintentional. I was experimenting with limit orders and accidentally two
lots instead of one. I panicked and closed the order as soon as I could. The good news was that I
managed to close with some profit, so I hadn’t lost anything to this experiment, but I probably
should have stopped trading for the day after that.
11/07 10:07 AM
Short EURUSD, 1 lot
Open 1.37949
Close 1.38056
Profit -$107
As mentioned previously, I probably should have stopped before this trade and been happy with
my daily winnings. Unfortunately, I was greedy. Also I wanted to understand this pattern I’d
stumbled across. In my quest for “understanding” I lost about $100, but the day didn’t end there.
11/07 10:25 AM
Short EURUSD, 1 lot

[110]
Open 1.37758
Close 1.37752
Profit $6
This trade, as well as the next few, was an attempt to get back what I’d lost that day, even
though at this point I was still up $21 for the day. Another thing to note is how quickly each of
these trades were opened and closed. I lacked patience at this point in the game.
11/07 10:25 AM
Short EURUSD, 1 lot
Open 1.37736
Close 1.37735
Profit $1
I doubted each trade I mad at this point, closing them as soon as they made any profit at
all. I should have realized that this trading pattern was a recipe for disaster. At the very least, I
should have quit when I saw that I was making little to no profit on these trades.
11/07 10:26 AM
Short EURUSD, 1 lot
Open 1.37733
Close 1.37688
Profit $45
Finally, after 7 trades, I was done for the day, and thankfully, I had made $66, which met
my daily goal. Still, this didn’t reflect well on my control when trading. I should have realized
that I needed to take a break. Unfortunately, I was back the next day, with a whole new batch of
bad ideas.

[111]
11/08 10:46 AM
Long EURUSD, 1 lot
Open 1.38071
Close 1.37869
Profit -$202
Normally, this kind of trade would never happen. This day was different however. My
typical stop-loss is 10 pips, and it’s mainly because of trades like this that I stick to it so strictly
now. As the price approached my stop loss, I became convinced that the trend would reverse just
outside of the 10 pip stop loss, so I moved it to 20. This was a huge mistake, and the result was
an additional $100 loss.
11/10 9:35 AM
Short EURUSD, 1 lot
Open 1.36089
Close 1.36037
Profit $52
I took a break for a day after my devastating loss. I returned refreshed and ready to try
again. This trade was one of the only times I successfully charted a reversal and profited from it.
Below is a chart with the trend line I drew. As one can see, the price was respecting this line, so I
knew that I had to wait for a strong break before I entered.

[112]
Figure 14: November 10, 2011 9:35 AM, 1 lot EURUSD
The peaks of the MACD declined while the peaks of the price increased. In a strong trend this
negative divergence can be a very good sign of a reversal. This reversal starts as soon as the
price breaks the trend line. I waited until a few red candles had formed beyond the trend line to
open my position. As soon as I opened the position I set a 10 pip stop loss and 10 take profit.
Neither were used, as I closed the trade myself after I reached my target of 4 pips.
11/11 10:11 AM
Long USDJPY, 1 lot
Open 77.229
Close 77.233

[113]
Profit $5.19
The next day I decided to try something completely different, and not very logical. I
opened a couple positions (this trade and the next) in USDJPY for a change, despite what should
have an apparent lack of movement for that currency. USDJPY moves very little even in the
Asian session in the evening. I should have known that this wouldn’t end well.
11/11 10:45 AM
Short USDJPY, 1 lot
Open 77.065
Close 77.130
Profit -$84.20
My first trade with USDJPY probably gave me false hope that I could gain small
amounts of profit per trade. This loss of almost $85 showed me that I was sorely mistaken in that
respect.
11/15 10:12 AM
Short AUDUSD, 1 lot
Open 1.01656
Close 1.01645
Profit $11
After my troubles with USDJPY, I decided to stick with more volatile currencies. I have
since only traded AUDUSD and EURUSD. This week, I was very lucky and all 4 of the trades I
made turned a profit. I was still using trend lines and MACD divergence to chart reversals, as it
hadn’t occurred to me yet that this might not be the best strategy.
11/16 10:03 AM

[114]
Short EURUSD, 1 lot
Open 1.35045
Close 1.34931
Profit $114
On this Wednesday, I noticed something that could change my trading strategy.
Whenever both the stochastic oscillator and the commodity channel index peaked, it marked a
peak in the price movement. This can be used to chart reversals as well verify ahead of time that
the price will respect a trend line. In the chart below, I circled a few key points where the
absolute value of the CCI is over 200 and the stochastic oscillator is outside the 20-80 range. The
third point I’ve circle is the reversal that I opened a trade on.

[115]
Figure 15: November 16 2011, 10:03 AM, 1 lot EURUSD
11/17 9:20 AM
Short EURUSD, 1 lot
Open 1.35155
Close 1.35104
Profit $51
For The next few days, I tried out my new trading method, and it seemed to work quite
well. I would watch the CCI to see when it peaked, and if that peak was outside +/-200, then the

[116]
stochastic oscillator would be the trigger to open a trade. As soon as the stochastic peaked and
reversed, I would open a trade. Below 20 means oversold, so I would buy; over 80 means
overbought, so I would sell.
11/18 9:56 AM
Long AUDUSD, 1 lot
Open 1.00397
Close 1.00505
Profit $108
This was another good trade. It seemed that this new method was working quite well. I
was still sticking to only trading with EURUSD and AUDUSD. It’s easy to follow just those two
as they seem to share many of the same trends.
11/21 10:03
Long AUDUSD, 1 lot
Open 0.98515
Close 0.98414
Profit -$101
Of course even with my new seemingly bullet-proof strategy, some days I just can’t win.
This week was shorter because of the Thanksgiving holiday, but I still incurred some big losses.
11/21 11:25 AM
Short EURUSD, 1 lot
Open 1.35069
Close 1.35068
Profit $1

[117]
A lesson I still hadn’t learned at this point was that I shouldn’t trade to make back what I
had lost. I only made back $1 of the 101 I lost an hour ago, and thankfully I think this convinced
me not to try again that day.
11/22 11:08 AM
Long EURUSD, 1 lot
Open 1.35094
Close 1.34965
Profit -$129
This trade was no better than the one’s I’d made the previous day, and I began to question
just how good my new trading strategy was. With two days of pretty heavy losses, I left for the
Thanksgiving break with mixed feelings about this new strategy.
11/29 10:05 AM
Short AUDUSD, 1 lot
Open 1.00092
Close 1.00190
Profit -$98
It had been a week since I’d last traded, but not much had changed. I was definitely on a
losing streak, but I wasn’t convinced that it was time to quit yet on this my new trading strategy.
Still, with more heavy losses piling up, I began to be discouraged and I traded less as a result.
12/01 10:10 AM
Short AUDUSD, 1 lot
Open 1.02531
Close 1.02434

[118]
Profit $97
A couple days later, I traded again and had a good win. This gave me confidence that my
combination CCI and stochastic method may have some merit to it after all. The only
reservations I had at this point were whether or not I was actually using these indicators to trade
against a trend properly. If the price movement had no trend, my method would be quite useless.
I began work on a robot to test the effectiveness of this strategy over a broader period of time.
12/02 9:50 AM
Long EURUSD, 1 lot
Open 1.34740
Close 1.34652
Profit -$88
The week came to a close with a net loss of almost $100. I decided I needed to trade less
until I got my robot working and could test my trading method. The next week I only traded
once, and since then I haven’t traded at all.
12/07 10:41 AM
Short EURUSD
Open 1.33704
Close 1.33789
Profit -$85
Over the course of my final few trades, I noticed a disturbing pattern. I was trading
according to the signals I was interpreting from the CCI and stochastic, but with no indication of
which way the trend was moving. I previously suspected that this strategy might not work on a
chart with no trend, but I now suspected that it also might not work very well as a stand-alone

[119]
way to predict reversals. I looked at some of my previous trades and concluded that most of the
money I’d made had not been trading on reversals, but trading with the trend. When I trade
counter-trend, as in this trade pictured below, most of the time I lost money.
Figure 16: December 7, 2011, 10:41 AM, 1 lot EURUSD
It’s clear at this point that if my strategy is ever going to work consistently, I need some way of
determining which way the market is moving.

[120]
Appendix B: Programming Projects
B.1 Group project
For our group project, we have decided to create an indicator that measures the strength
of a currency. The main concept behind this indicator will be the volume of the market and the
percentage change based on precious closes. However, the indicator will not be an evaluation of
the current currency pair, but rather of a specified currency. The indicator will then evaluate the
percentage closed against various currency pairs. These currency pairs will be selected simply by
how important they are in the Forex market. We imagine the currencies we have for this
indicator for would be USD, AUD, EUR, CAD, NZD, JPY, GBP, and CHF. It shouldn’t be too
hard to add currencies in the future either, but those are the currencies we plan on starting out
with. In addition, it is important that we weight the currencies that are associated with each other.
For instance, the AUD and NZD are very closely related, so we will probably give them an 80/20
split in favor of the AUD, just because it is a more traded currency. We will have to do a
significant amount of research into how associated certain currencies are with each other. Long
term data will really help here, because we are not planning on altering these as data is
processed. However, it might be beneficial to use the association of currencies as a coefficient of
one currency and then subtract that association from one and use that as the coefficient of the
other related currency. The volume will be calculated as the number of ticks in the chart over a
certain time period. It is possible that we will use a moving average of the volume in order to get
a smoothed out result. Initially, we had the indicator figure out the current currency pair, and
then display the two currencies involved, and their strengths. However, we decided that it would
be more informative to the user to have all the currencies and their strengths displayed. Farther
into the future, we might want to add an indicator or two in order to increase the usefulness of

[121]
trading with this indicator. A possibility I have considered is adding all of the momentum
indicators, and having the number or line change colors when one, two or three of the
momentum indicators go into an overbought or oversold region.
Currently, as written, the indicator is able to compute the strengths for all currency pairs
of the seven currencies listed in the previous paragraph. When the indicator is used on the chart,
it displays all of the currencies and their respective strengths. The strength values are calculated
by multiplying each percentage change of each currency pair of that currency by the volume of
each currency pair. Then, the strength values are set to a scale that ranges from -10 to 10. This
scale is based off of the hour four time period, and is calculated via the equation:
log(CDE(FGHIIJKLEG∗DMNOPG)QR.RSTTTU )
log(1.727958) = ������&��! ���0
Next, we also would like to weight associated currencies so that using percentage
changes from all major currencies will not hurt the legitimacy of the strength indicator.
Figure 17: Group Programming Project

[122]
B.2 Gabriel McCormick’s Robot
After much deliberation, I decided I will create a robot based on my current trading
strategy. I think this would be best for both my trading and for the robot. My trading will benefit
because (hopefully) I will develop my strategy further, and will likely come out with a much
more systematic approach. As of right now, my trading strategy consists of mainly using support
and resistance lines, most notably the lines created by Fibonacci retracement lines. In addition, I
make heavy use of moving averages, mainly as an indication of the current (and past) market
trends. I make it a point to not trade against the trend, as I find that it incurs more risk than
necessary. In order to convert this trading strategy to a robot, I need to define exactly when the
robot will go into and get out of a trade, among other important aspects. First, there will be an if-
statement over the entire buying/selling code that ensures if the robot is going to trade, it is
trading with the current trend. If it is not or if the trend is not strong then the robot should not
trade. Because this is one of my most important evaluations of a trade, I think it needs to be
prominent in my code as well. In addition, if there is not an established trend, the robot should
not trade. This is the most important risk analysis that the robot will be doing. To define when
the trend is not strong enough, I will need to define some condition, whether it be a slope of a
specific moving average, or maybe even when the slopes of two moving averages, one slower
and one faster, Obviously this is the type of thing that will need to be back tested (and forward
tested), but it is important to have a couple of options in place. As for actually getting into a
trade, I think I will have the robot operate on the 15 minute timeframe. Then, the robot will
identify the high and low points of the market. If the low (or high) point in the market is within a
set number of bars, the robot should ignore it. But once the high point (or low) moves outside
this set area, there is probably a period of retracement occurring. The robot should then

[123]
concentrate on two important values, the 61.8% and the 50.0% retracement area. The stronger
level is obviously the 50% retracement line, but in strong trends, the price often will not retrace
to these levels, which is why both should be monitored by the robot. Once these areas are neared,
the robot should start monitoring for a reversal. I think the best bet would be to look for a certain
number of strong bars (small wicks) in a row. This is another point where I’m not sure what will
work best. It is possible that I could use a couple of short term moving averages to provide the
best indication. It’s possible that adding a couple more indicators will come in the future as I
refine the robot itself. One problem I foresee is that huge market movements could probably
throw the robot off, as it will see a strong trend coupled with a large retracement. However, the
market is not very likely to move upward after huge movements.
Figure 18: Back testing results for one year
Currently, after back testing, my robot is making profitable trade one hundred percent of
the time. However, I back tested the robot over the course of a year, and the robot only made 8
trades, which is obviously not ideal. Unfortunately, I think I am running into an issue with my
history, as when I test I get errors in the month of March (notice the mismatched chart errors in
the previous figure. I think these errors are causing the back test to quit, which would explain the

[124]
low volume of trades. The robot made a total of 124.82 dollars, using a trailing stop loss of 10
pips, and a take profit of 20 pips. Out of the eight trades that the robot made, two of them hit the
trailing stop loss, one mak8ing a small profit, and the other breaking even. The other six trades
all hit my take profit and earned twenty dollars.
My robot, in its current state, is very similar to how it is describing in the preceding
paragraph. However, there are still a number of features that I have yet to add. Currently, there is
no exit strategy to a trade except for a twenty pip take profit and a stop loss. I would really like to
increase the take profit, and then add an exit strategy that will detect a variance from the current
movement. This should allow me to earn much more than what I was previously earning. Farther
into the future, in order to maximize my profit, I would also like to add in a weight to each trade
and have the robot adjust the lot sizes that it enters into the trade with accordingly. The robot
right now is completely dependent on the 50% retracement lines, and I would also like to add in
some code that would allow the robot to trade on the 61.8% retracement lines as well. I would
probably have to add strength criteria to the current market that would evaluate whether the
61.8% retracement lines should be traded, or if the robot should wait until the price falls to the
50% retracement line.
B.3 Devin Kehler’s Robot
I designed my robot around a trading strategy I developed a few months ago. The CCI
and stochastic oscillators both show indications of a currency pair being overbought or oversold.
Originally, I used this to trade against the trend and try to catch a reversal. What I realize now is
that, despite the fact that successfully catching a reversal would give me quite a bit of profit, the
chances of doing so are hardly worth it. The better strategy is to use the CCI and stochastic

[125]
indicators to predict retracement. If the trend is strong enough, the price is more likely to respect
a trend line and continue in the same direction, than reverse direction.
This of course begs the question, what is strong enough, and how do we measure that?
When I first conceived of this idea with CCI and stochastic, I was drawing trend lines to help
anticipate the price movement. Unfortunately, the task of getting a robot to reliably draw those
same trend lines is something I haven’t figure out yet. An alternative is to use 3 moving averages
(I chose 20day, 50day and 100day EMA); the closer the lines are to parallel, the stronger the
trend, and this is something that’s much easier for a robot to measure that where to draw a trend
line.
Since I realized that this would inevitably be a very complicated robot, I broke it into
stages. The first stage is a simple bot that buys and sells according to two moving averages, 14
day and 26 day; I chose the 14 and 26 day EMAs to mimic the MACD as an entry signal. Before
even adding the CCI and stochastic indicators, I wanted to make sure that I could develop a robot
that could buy and sell. However, due to some difficulties in downloading from the history
center, I’ve been unable to properly back-test my robot. After many attempts and reinstallations
of MT4 software, I still have no results for my robot’s performance. Below is the script for my
robot, which I believe should work.
//+------------------------------------------------------------------+
//| Devin Robot.mq4 |
//| Devin Kehler |
//| |
//+------------------------------------------------------------------+
#property copyright "Devin Kehler"
#property link ""
//--- input parameters
extern double takeProfit=20.0;
extern double Lots=1;
extern double stopLoss=10.0;
//+------------------------------------------------------------------+
//| expert initialization function |
//+------------------------------------------------------------------+

[126]
intinit()
{
//----
//----
return(0);
}
//+------------------------------------------------------------------+
//| expert deinitialization function |
//+------------------------------------------------------------------+
intdeinit()
{
//----
//----
return(0);
}
//+------------------------------------------------------------------+
//| expert start function |
//+------------------------------------------------------------------+
int start() {
// check to see if there are enough bars o run the program
if (Bars<100){
Print("Bars less than 100");
return(0);
}
if(cross() == 1)
buy();
else if (cross() == -1)
sell();
return(0);
}
//checks to see if moving averages cross, returns buy/sell
instruction
int cross(){
doublemaShort=iMA(NULL,0,14,0,MODE_EMA, PRICE_CLOSE, 0);
doublemaLong=iMA(NULL,0,26,0,MODE_EMA, PRICE_CLOSE, 0);
doublediffCurrent = 0;
doublediffPrev = 0;
inti = 0;
intretValue;
while(i<2){
diffPrev = diffCurrent;
if(maShort>maLong){
diffCurrent = 1;
}
else

[127]
diffCurrent = -1;
i++;
}
if(diffCurrent>diffPrev){ //moving average cross up, buy
retValue = 1;
}
else if(diffCurrent<diffPrev) { //moving average cross down
retValue = -1;
}
else
retValue = 0; // do nothing
return(retValue);
}
void buy(){
int ticket;
ticket = OrderSend(Symbol(), OP_BUY,Lots,Bid,3,Ask-
stopLoss*Point,Ask+takeProfit*Point,"Robot buy",1234,0,Green);
if(ticket>0)
{
if(OrderSelect(ticket,SELECT_BY_TICKET, MODE_TRADES))
Print("BUY order opened : ",OrderOpenPrice());
}
else
Print("Error opening BUY order : ",GetLastError());
}
void sell(){
int ticket;
ticket = OrderSend(Symbol(),
OP_SELL,Lots,Bid,3,Ask+stopLoss*Point,Ask-takeProfit*Point,"Robot
sell",1234,0,Red);
if(ticket>0)
{
if(OrderSelect(ticket,SELECT_BY_TICKET, MODE_TRADES))
Print("SELL order opened : ",OrderOpenPrice());
}
else
Print("Error opening SELL order : ",GetLastError());
}
//+------------------------------------------------------------------+