investigations on the q and ct bands of cytochrome c ... phys chem c v 113 p 8306... · department...
TRANSCRIPT

Investigations on the Q and CT Bands of Cytochrome c Submonolayer Adsorbed on anAlumina Surface Using Broadband Spectroscopy with Single-Mode Integrated OpticalWaveguides
Rodrigo S. Wiederkehr,† Geoffrey C. Hoops,‡ Mustafa M. Aslan,† Courtney L. Byard,† andSergio B. Mendes*,†
Department of Physics and Astronomy, UniVersity of LouisVille, LouisVille, Kentucky 40292, Department ofChemistry, Butler UniVersity, 4600 Sunset AVenue, Indianapolis, Indiana 46208
ReceiVed: December 9, 2008; ReVised Manuscript ReceiVed: March 21, 2009
In this work, we report experimental results on the molar absorptivity of cytochrome c adsorbed at differentsubmonolayer levels onto an aluminum oxide waveguide surface; our data show a clear dependence of theprotein optical properties on its surface density. The measurements were performed using the broadband,single-mode, integrated optical waveguide spectroscopic technique, which is an extremely sensitive tool ableto reach submonolayer levels of detection required for this type of studies. This investigation focuses on themolar absorptivity at the Q-band (centered at 525 nm) and, for the first time to our knowledge, the weakcharge transfer (CT) band (centered at 695 nm) of surface-adsorbed cyt c. Polarized light in the spectralregion from 450 to 775 nm was all-coupled into an alumina thin film, which functioned as a single-modeplanar optical waveguide. The alumina thin-film waveguide used for this work had a thickness of 180 nmand was deposited on a glass substrate by the atomic layer deposition process. The protein submonolayer wasformed on the alumina waveguide surface through electrostatic adsorption from an aqueous buffer solutionat neutral pH. The optical properties of the surface-adsorbed cyt c were investigated for bulk proteinconcentrations ranging from 5 nM to 8200 nM in the aqueous buffer solution. For a protein surface densityof 2.3 pmol/cm2, the molar absorptivity measured at the charge transfer band was 335 M-1 cm-1, and for asurface density of 15 pmol/cm2 was 720 M-1 cm-1, which is much closer to the value of cyt c dissolved inan aqueous neutral buffer (830 M-1 cm-1). The modification of the protein molar absorptivity and its dependenceon the surface density can most likely be attributed to conformational changes of the surface-adsorbed species.
1. Introduction
Protein adsorption is a process that occurs spontaneouslywhenever a protein dissolved in aqueous solutions contacts asolid surface, resulting in modification of the surface and oftenconformational changes in the protein, as well.1 It is a topic ofincreasing interest because of its importance in biosensors,2
chromatography,3 biocompatibility,4 and in many other biotech-nology applications. The surface interaction may alter some ofthe protein properties, such as the molar absorptivity, due tosurface-induced conformational changes5,6 resulting from acombination of short-range (van der Waals, hydrogen bonding)and long-range (electrostatic attraction/repulsion) interactions.Globular proteins are highly ordered structures of low entropythat upon adsorption may (partly) increase their entropy underconformational changes.7 This entropy gain may be alsosufficiently large to contribute to spontaneous adsorption underadverse conditions, such as on an electrostatically repellingsurface.8
Broadband absorbance spectroscopy with single-mode inte-grated optical waveguides is a highly sensitive technique fordetecting surface-adsorbed molecules9-12 due to the long andstrong optical interaction of surface-bound chromophores withthe evanescent field that emerges from a guiding thin filmwherein the propagating light is mostly confined.13 When
compared to the traditional direct transmission mode or attenu-ated total reflection (ATR) technique, the major advantage ofusing a single-mode optical waveguide platform lies in the muchenhanced effective path length of the single-mode waveguidefor interrogating surface-adsorbed chromophores. The value ofthe sensitivity enhancement factor, usually defined as the ratioof the absorbance measured with a waveguide platform dividedby the absorbance measured in direct transmission, can be 4-5orders of magnitude for a single-mode integrated opticalwaveguide.13 Broadband waveguide couplers9,12,14,15 have en-abled spectroscopic capability to the single-mode integratedoptical waveguide technique, which then has been demonstratedto be a powerful tool for optical investigations of surface-boundbiomolecular materials at the submonolayer regime. The polar-ized absorbance data measured with a waveguide-based platformcan then be directly related to the spectroscopic properties (molarabsorptivity) of the molecular layer under investigation.16
Cytochrome c is a small electron transfer protein which hasbeen used in several research works due to commerciallyavailability of large amounts in relatively pure form. Theabsorbance spectral properties of this protein in solution hasalready been extensively studied.17 The strong absorbance peakat 409 nm (Soret band with molar absorptivity of 106 000 M-1
cm-1) and two other relatively weak absorbance peaks at 525nm (Q-band with molar absorptivity of 10 600 M-1 cm-1) and695 nm (charge transfer band with molar absorptivity of 830M-1 cm-1) for the protein dissolved in neutral buffer solution(pH ) 7.2) have collectively been used to study conformational
* Corresponding author. Phone: +1 502 852-0908. Fax: +1 502 852-8128. E-mail: [email protected].
† University of Louisville.‡ Butler University.
J. Phys. Chem. C 2009, 113, 8306–83128306
10.1021/jp810845e CCC: $40.75 2009 American Chemical SocietyPublished on Web 04/20/2009
changes due to pH changes of the buffer18,19 (denaturation) ortemperature20 or addition of ligands such as cyanide,21 azide,22
or imidazole.23 However, there are few reports in the literaturedescribing possible conformational changes for cytochrome cadsorbed to a surface because of the difficulty of measuringthe absorbance by a thin layer of protein attached to a surface.Santos et al.24 used an ATR technique in silica slides (0.1 mm)to study the adsorption of cytochrome c dissolved in phosphatebuffer at variable pH. The influence of the bulk proteinconcentration to the isotherm adsorption curves was reported;from these data, the authors suggested that the area occupiedby individual protein molecules on the silica surface is dependentupon the protein concentration in the bulk solution. Edmistonet al.25 used monochromatic light measurements with integratedoptical waveguide and total internal reflection fluorescence toinvestigate molecular orientation of cytochrome c adsorbed tohydrophobic and hydrophilic surfaces.
In this work, we present the experimental results obtainedusing our single-mode optical waveguide spectrometer for themolar absorptivity of oxidized cytochrome c immobilized ontoan alumina surface. The alumina material was chosen for theguiding film because it provides single-mode integrated opticalwaveguides with very low optical losses over a broad spectralrange and has a high refractive index that highly confines theoptical field for a sensitive detection of surface-adsorbedchromophores. The extremely high sensitivity of our instrumentallowed the observation of cytochrome c’s Q and charge transferbands while the protein was adsorbed to an aluminum oxidesurface at submonolayer levels. The results obtained on thealumina waveguide surface were compared with correspondingvalues in solution, obtained using conventional spectroscopy.Furthermore, it was possible to relate spectral changes of theadsorbed species to the different surface coverage of the proteinon the waveguide surface. Our measurements clearly show thatthe molar absorptivity is dependent upon the surface coverage.
2. Experimental Procedures
Oxidized Cytochrome c Preparation. Horse heart cyto-chrome c was obtained commercially (Sigma-Aldrich) anddialyzed extensively against 10 mM NaCl at 25 °C.26 The finalconcentration of the stock solution was determined using themolar absorptivity peak of the Soret band (409 nm) for theoxidized cytochrome c (ε409 ) 106 000 M-1 cm-1).27 To obtainsolutions with concentrations ranging from [cyt c] ) 5 nM to
8200 nM, the stock solution was diluted in 7 mM sodiumphosphate with 10 mM NaCl (pH ) 7.2).
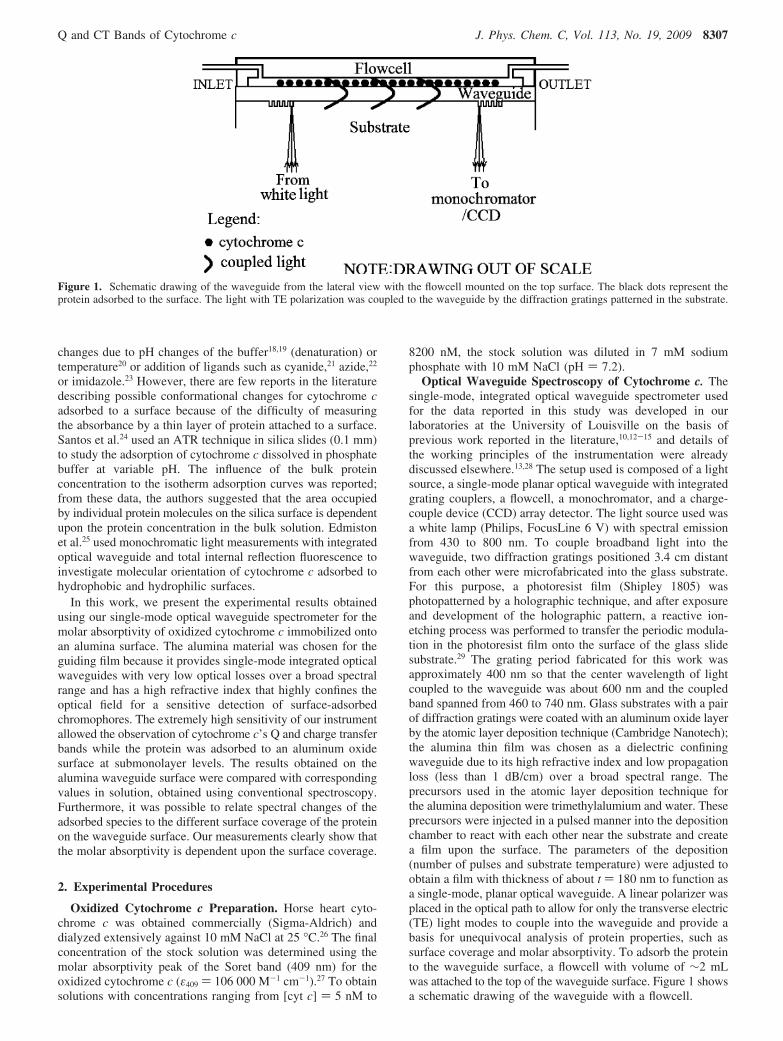
Optical Waveguide Spectroscopy of Cytochrome c. Thesingle-mode, integrated optical waveguide spectrometer usedfor the data reported in this study was developed in ourlaboratories at the University of Louisville on the basis ofprevious work reported in the literature,10,12-15 and details ofthe working principles of the instrumentation were alreadydiscussed elsewhere.13,28 The setup used is composed of a lightsource, a single-mode planar optical waveguide with integratedgrating couplers, a flowcell, a monochromator, and a charge-couple device (CCD) array detector. The light source used wasa white lamp (Philips, FocusLine 6 V) with spectral emissionfrom 430 to 800 nm. To couple broadband light into thewaveguide, two diffraction gratings positioned 3.4 cm distantfrom each other were microfabricated into the glass substrate.For this purpose, a photoresist film (Shipley 1805) wasphotopatterned by a holographic technique, and after exposureand development of the holographic pattern, a reactive ion-etching process was performed to transfer the periodic modula-tion in the photoresist film onto the surface of the glass slidesubstrate.29 The grating period fabricated for this work wasapproximately 400 nm so that the center wavelength of lightcoupled to the waveguide was about 600 nm and the coupledband spanned from 460 to 740 nm. Glass substrates with a pairof diffraction gratings were coated with an aluminum oxide layerby the atomic layer deposition technique (Cambridge Nanotech);the alumina thin film was chosen as a dielectric confiningwaveguide due to its high refractive index and low propagationloss (less than 1 dB/cm) over a broad spectral range. Theprecursors used in the atomic layer deposition technique forthe alumina deposition were trimethylalumium and water. Theseprecursors were injected in a pulsed manner into the depositionchamber to react with each other near the substrate and createa film upon the surface. The parameters of the deposition(number of pulses and substrate temperature) were adjusted toobtain a film with thickness of about t ) 180 nm to function asa single-mode, planar optical waveguide. A linear polarizer wasplaced in the optical path to allow for only the transverse electric(TE) light modes to couple into the waveguide and provide abasis for unequivocal analysis of protein properties, such assurface coverage and molar absorptivity. To adsorb the proteinto the waveguide surface, a flowcell with volume of ∼2 mLwas attached to the top of the waveguide surface. Figure 1 showsa schematic drawing of the waveguide with a flowcell.
Figure 1. Schematic drawing of the waveguide from the lateral view with the flowcell mounted on the top surface. The black dots represent theprotein adsorbed to the surface. The light with TE polarization was coupled to the waveguide by the diffraction gratings patterned in the substrate.
Q and CT Bands of Cytochrome c J. Phys. Chem. C, Vol. 113, No. 19, 2009 8307

The out-coupled light beam was fiber-guided to a monochro-mator (SpectraPro 2300, Acton-Princeton) that dispersed lightinto the CCD (Pixis 400, Princeton) detector. The CCD iscomposed of an array of pixels (1340 × 400), and each columnin the detector is associated with a specific wavelength. Thenumber of counts on each pixel was measured after a certainacquisition time. For each experiment, a baseline signal wasinitially acquired with just buffer in the flowcell, and then,after protein adsorption to the waveguide surface from thebuffer solution, sequential acquisitions were performed. Thosedata allowed us to calculate the absorbance, surface density,and molar absorptivity that are presented in the resultssection. All the data acquisitions were performed at roomtemperature (25 °C).
Measurement Of protein in Solution. The concentration ofcytochrome c for all solutions used in this experiment weredirectly determined by absorbance at the Soret peak (409 nm),as measured in a quartz cuvette using a spectrophotometer Cary300 (Varian). The molar absorptivity of cytochrome c in solutionat 409 nm is known (ε409 ) 106 000 M-1 cm-1),27 so theconcentration was determined using Beer’s law. The bulksolution concentration for the protein was measured afterpassage through the flowcell of the waveguide spectrometer.All the concentration measurements were performed at roomtemperature (25 °C).
3. Results and Discussions
Sensitivity of the Single-Mode Waveguide Spectrometer.The sensitivity factor, S, defined as the ratio between thewaveguide absorbance, AWG, and the direct transmission absor-bance, ATR ) εsurf Γ, is described by the following relation,13,28
S)AWG
εsurfΓ(1)
where εsurf is the molar absorptivity of the surface-bound proteinand Γ is the protein surface density. The sensitivity factor is akey variable to determine the limit of detection of a waveguide-based spectrometer because a higher sensitivity factor translatesinto a higher absorbance value for a given chromophore at acertain surface density. For a waveguide mode at the TEpolarization, the sensitivity factor can be described by thefollowing equation,28
STE )2nl(nw
2 -NTE2)
NTE(nw2 - nc
2)
Lteff,TE
(2)
where nl is the real part of the refractive index of the adsorbedprotein monolayer, nw is the refractive index of the aluminaguiding film, nc is the refractive index of the buffer solution,NTE is the effective index of the waveguide, teff,TE is the effectivethickness of the waveguide (which is related to physicalthickness of the guiding film, t), and L is the distance betweenthe input and output couplers. For the single-mode, alumina-thin-film waveguide used in this work, the sensitivity factor ispresented in Figure 2 as a function of the wavelength; the resultsin this plot were obtained by using eqs 1 and 2 at eachwavelength. For the application of those equations, we experi-mentally determined that the refractive index of the aluminawaveguide thin film can be described by: nw ) a + (b)/(λ2) +(c)/(λ4), where a ) 1.645 76, b ) 42.898 98, and c )308 958 233.142. For the refractive index of the aqueous buffersolution, we used nc ) 1.33, and the approximation30 that nl ≈nc. As previously mentioned, the thickness of the guiding filmis given by t ) 180 nm, and the distance between the input and
output couplers is L ) 3.4 cm. The effective refractive index,NTE, and the effective thickness, teff,TE, were calculated fromthe waveguide dispersion equation (with ns ) 1.51).16 As seenin Figure 2, at the 525-nm (Q-band), the waveguide spectrometeris about 38 000 times more sensitive than an absorbancemeasurement in direct transmission.
Absorbance of Cytochrome c Adsorbed to an AluminumOxide Waveguide. To obtain the absorbance of cytochrome cadsorbed to the waveguide surface, we converted the numberof counts acquired by the CCD from the out-coupled light ofthe waveguide spectrometer into absorbance units. In allmeasurements, the exposure time was fixed to 30 s. In Figure3, we illustrate a typical sequence of measurements that wasused to obtain an absorbance spectrum with our waveguide-based spectrometer. The black curve corresponds to an intensitymeasurement with just buffer solution (7 mM phosphate bufferwith 10 mM NaCl at pH 7.2) inside the flowcell. The red curvecorresponds to an intensity measurement with a protein solutionof 8200 nM inside the flowcell after an incubation time of 50min. A straightforward calculation28 can show that the contribu-tion from the dissolved species is negligible; thus, the intensitymeasured is essentially due to the protein molecules adsorbedonto the waveguide surface. The green curve corresponds tothe case in which the waveguide signal was completelyattenuated by crossing the input and output polarizers. Fromthose measurements, the absorbance spectrum of the proteinfilm was then obtained by the following equation:
Figure 2. Sensitivity values as function of light wavelength for analumina waveguide with 180 nm of thickness and a propagation lengthof 3.4 cm.
Figure 3. Light intensity against wavelength measured with the single-mode waveguide spectrometer at different steps of an experiment todetermine the optical absorbance spectrum of a protein film.
8308 J. Phys. Chem. C, Vol. 113, No. 19, 2009 Wiederkehr et al.
A)-log10( Ccyt c -Cdark
Cbuffer -Cdark) (3)
where A is the absorbance, Ccyt c is the number of countsmeasured for cytochrome c adsorbed to the waveguide surface,Cbuffer is the number of counts for the buffer, and Cdark is thenumber of counts for the absence of out-coupling light (darksignal).
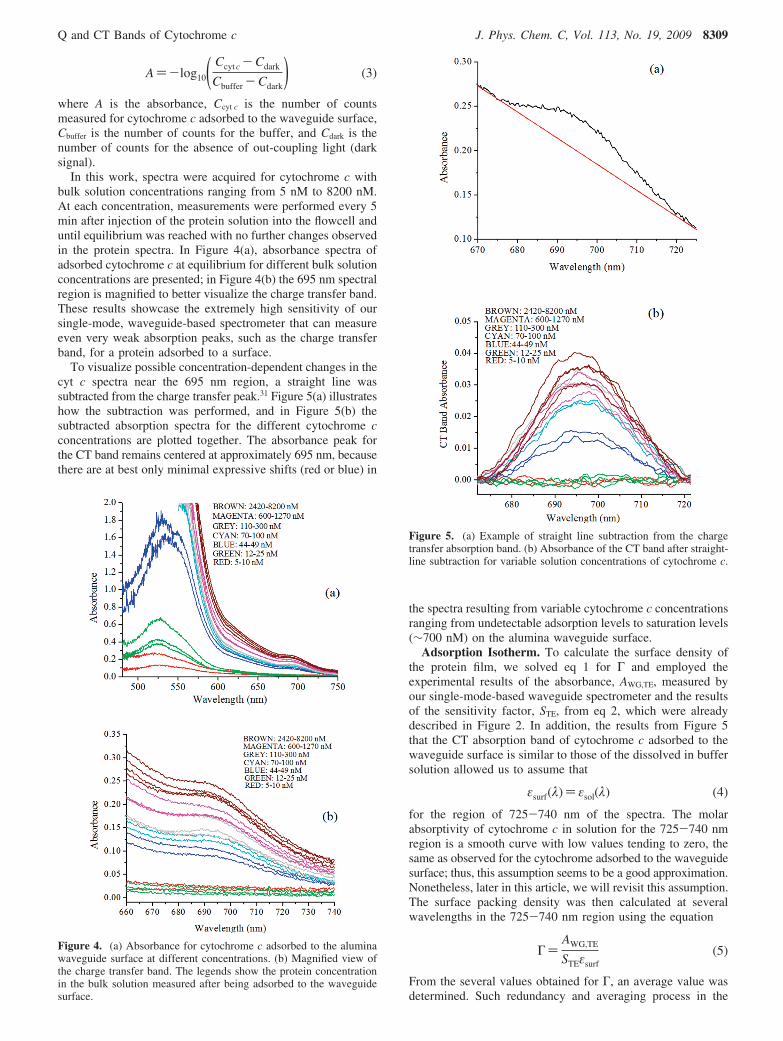
In this work, spectra were acquired for cytochrome c withbulk solution concentrations ranging from 5 nM to 8200 nM.At each concentration, measurements were performed every 5min after injection of the protein solution into the flowcell anduntil equilibrium was reached with no further changes observedin the protein spectra. In Figure 4(a), absorbance spectra ofadsorbed cytochrome c at equilibrium for different bulk solutionconcentrations are presented; in Figure 4(b) the 695 nm spectralregion is magnified to better visualize the charge transfer band.These results showcase the extremely high sensitivity of oursingle-mode, waveguide-based spectrometer that can measureeven very weak absorption peaks, such as the charge transferband, for a protein adsorbed to a surface.
To visualize possible concentration-dependent changes in thecyt c spectra near the 695 nm region, a straight line wassubtracted from the charge transfer peak.31 Figure 5(a) illustrateshow the subtraction was performed, and in Figure 5(b) thesubtracted absorption spectra for the different cytochrome cconcentrations are plotted together. The absorbance peak forthe CT band remains centered at approximately 695 nm, becausethere are at best only minimal expressive shifts (red or blue) in
the spectra resulting from variable cytochrome c concentrationsranging from undetectable adsorption levels to saturation levels(∼700 nM) on the alumina waveguide surface.
Adsorption Isotherm. To calculate the surface density ofthe protein film, we solved eq 1 for Γ and employed theexperimental results of the absorbance, AWG,TE, measured byour single-mode-based waveguide spectrometer and the resultsof the sensitivity factor, STE, from eq 2, which were alreadydescribed in Figure 2. In addition, the results from Figure 5that the CT absorption band of cytochrome c adsorbed to thewaveguide surface is similar to those of the dissolved in buffersolution allowed us to assume that
εsurf(λ)) εsol(λ) (4)
for the region of 725-740 nm of the spectra. The molarabsorptivity of cytochrome c in solution for the 725-740 nmregion is a smooth curve with low values tending to zero, thesame as observed for the cytochrome adsorbed to the waveguidesurface; thus, this assumption seems to be a good approximation.Nonetheless, later in this article, we will revisit this assumption.The surface packing density was then calculated at severalwavelengths in the 725-740 nm region using the equation
Γ)AWG,TE
STEεsurf(5)
From the several values obtained for Γ, an average value wasdetermined. Such redundancy and averaging process in the
Figure 4. (a) Absorbance for cytochrome c adsorbed to the aluminawaveguide surface at different concentrations. (b) Magnified view ofthe charge transfer band. The legends show the protein concentrationin the bulk solution measured after being adsorbed to the waveguidesurface.
Figure 5. (a) Example of straight line subtraction from the chargetransfer absorption band. (b) Absorbance of the CT band after straight-line subtraction for variable solution concentrations of cytochrome c.
Q and CT Bands of Cytochrome c J. Phys. Chem. C, Vol. 113, No. 19, 2009 8309
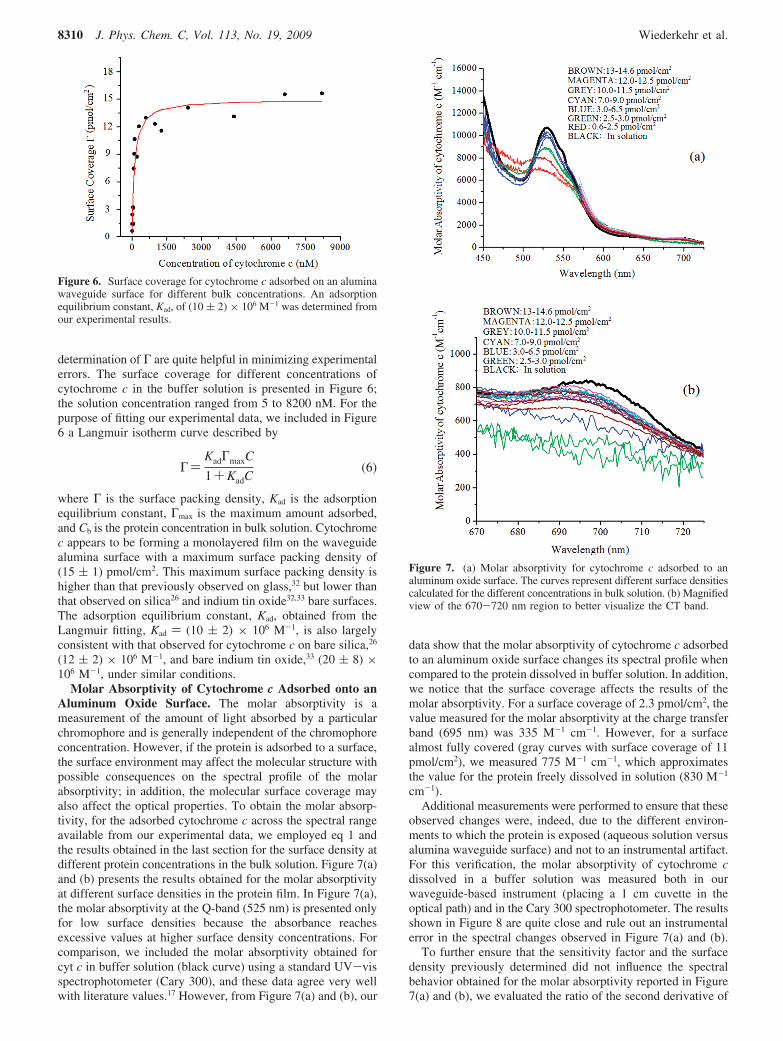
determination of Γ are quite helpful in minimizing experimentalerrors. The surface coverage for different concentrations ofcytochrome c in the buffer solution is presented in Figure 6;the solution concentration ranged from 5 to 8200 nM. For thepurpose of fitting our experimental data, we included in Figure6 a Langmuir isotherm curve described by
Γ)KadΓmaxC
1+KadC(6)
where Γ is the surface packing density, Kad is the adsorptionequilibrium constant, Γmax is the maximum amount adsorbed,and Cb is the protein concentration in bulk solution. Cytochromec appears to be forming a monolayered film on the waveguidealumina surface with a maximum surface packing density of(15 ( 1) pmol/cm2. This maximum surface packing density ishigher than that previously observed on glass,32 but lower thanthat observed on silica26 and indium tin oxide32,33 bare surfaces.The adsorption equilibrium constant, Kad, obtained from theLangmuir fitting, Kad ) (10 ( 2) × 106 M-1, is also largelyconsistent with that observed for cytochrome c on bare silica,26
(12 ( 2) × 106 M-1, and bare indium tin oxide,33 (20 ( 8) ×106 M-1, under similar conditions.
Molar Absorptivity of Cytochrome c Adsorbed onto anAluminum Oxide Surface. The molar absorptivity is ameasurement of the amount of light absorbed by a particularchromophore and is generally independent of the chromophoreconcentration. However, if the protein is adsorbed to a surface,the surface environment may affect the molecular structure withpossible consequences on the spectral profile of the molarabsorptivity; in addition, the molecular surface coverage mayalso affect the optical properties. To obtain the molar absorp-tivity, for the adsorbed cytochrome c across the spectral rangeavailable from our experimental data, we employed eq 1 andthe results obtained in the last section for the surface density atdifferent protein concentrations in the bulk solution. Figure 7(a)and (b) presents the results obtained for the molar absorptivityat different surface densities in the protein film. In Figure 7(a),the molar absorptivity at the Q-band (525 nm) is presented onlyfor low surface densities because the absorbance reachesexcessive values at higher surface density concentrations. Forcomparison, we included the molar absorptivity obtained forcyt c in buffer solution (black curve) using a standard UV-visspectrophotometer (Cary 300), and these data agree very wellwith literature values.17 However, from Figure 7(a) and (b), our
data show that the molar absorptivity of cytochrome c adsorbedto an aluminum oxide surface changes its spectral profile whencompared to the protein dissolved in buffer solution. In addition,we notice that the surface coverage affects the results of themolar absorptivity. For a surface coverage of 2.3 pmol/cm2, thevalue measured for the molar absorptivity at the charge transferband (695 nm) was 335 M-1 cm-1. However, for a surfacealmost fully covered (gray curves with surface coverage of 11pmol/cm2), we measured 775 M-1 cm-1, which approximatesthe value for the protein freely dissolved in solution (830 M-1
cm-1).Additional measurements were performed to ensure that these
observed changes were, indeed, due to the different environ-ments to which the protein is exposed (aqueous solution versusalumina waveguide surface) and not to an instrumental artifact.For this verification, the molar absorptivity of cytochrome cdissolved in a buffer solution was measured both in ourwaveguide-based instrument (placing a 1 cm cuvette in theoptical path) and in the Cary 300 spectrophotometer. The resultsshown in Figure 8 are quite close and rule out an instrumentalerror in the spectral changes observed in Figure 7(a) and (b).
To further ensure that the sensitivity factor and the surfacedensity previously determined did not influence the spectralbehavior obtained for the molar absorptivity reported in Figure7(a) and (b), we evaluated the ratio of the second derivative of
Figure 6. Surface coverage for cytochrome c adsorbed on an aluminawaveguide surface for different bulk concentrations. An adsorptionequilibrium constant, Kad, of (10 ( 2) × 106 M-1 was determined fromour experimental results.
Figure 7. (a) Molar absorptivity for cytochrome c adsorbed to analuminum oxide surface. The curves represent different surface densitiescalculated for the different concentrations in bulk solution. (b) Magnifiedview of the 670-720 nm region to better visualize the CT band.
8310 J. Phys. Chem. C, Vol. 113, No. 19, 2009 Wiederkehr et al.

the molar absorptivity with respect to the wavelength dividedby the molar absorptivity itself. We called this ratio R, whichthen is described by the following equation:
R)∂2εsurf⁄∂λ2
εsurf=
∂2(AWG,TE
STEΓ )⁄∂λ2
AWG,TE
STEΓ
)∂2AWG,TE⁄∂λ2
AWG,TE(7)
In the calculation of the second derivative of the molarabsorptivity with respect to the wavelength, the contributionfrom the inverse of the sensitivity factor was not consideredbecause its value is 3 orders of magnitude smaller than theabsorbance term (notice in Figure 2 that the curvature of STE isfairly constant for wavelengths larger than 450 nm). Therefore,the variable R is independent of the previously calculatedquantities (sensitivity factor and surface density), is directlyrelated to the measured absorbance data, and gives an unam-biguous assessment of the spectral behavior of the adsorbedmolecules under investigation. As described in eq 7, changesin R with respect to the wavelength represent changes in thecurvature of a particular transition band. In Figure 9, the ratioR is plotted against the wavelength for both our waveguide-based measurements of surface-adsorbed and solution dissolvedcyt c. As observed in Figure 9, at low surface coverage of thesurface-adsorbed species, the values of R are distant from thosemeasured in solution, and at higher surface concentrations, theyapproach those values from the protein in solution. These resultsfollow exactly the same spectral behavior shown in Figure 7(a)and (b) for the molar absorptivity, so the previously calculatedsensitivity and surface densities appear to be valid. Mostimportantly, the reported data seem to indicate a clear spectralchange in the molar absorptivity of cyt c under adsorption tothe waveguide alumina surface.
In summary, some significant spectral changes in the molarabsorptivity values for the Q-band were observed at low surfacepacking densities (red and green curves in Figure 7(a). Whencompared to the results obtained in solution, the peak of themolar absorptivity is lower and the transition band has beenbroadened. The spectral changes in the Q-band described herefor surface-adsorbed cyt c are consistent with acid denaturationof cytochrome c, as already reported in the literature.18,19,34
During the adsorption process on the waveguide surface, some
intramolecular rearrangements may take place at low packingdensities in which cytochrome c adopts an extended conforma-tion to form more bonds with the surface and maximize theoccupied area. However, at higher packing densities, lateralintermolecular interactions between adsorbed proteins mayinhibit/reverse this conformational change.5
The charge transfer band has long been hailed as a markerof the integrity of the Fe-S bond of cytochrome c34 and, thus,a probe for protein conformational changes.20 However, it istoo weak for conventional instrumentation to corroborate theaforementioned changes in the Q-band. We observed that atlow surface coverage (below 3 pmol/cm2), the peak in the 695nm region is absent, because we obtained an almost flat curvefor the molar absorptivity. When increasing the surface densityup to 11 pmol/cm2, the values tend to approximate those fromthe protein in solution, but at surface densities higher than 11pmol/cm2, where the waveguide surface becomes fully covered,the magenta and brown curves in Figure 7(b), the molarabsorptivity starts to deviate again from the corresponding valuesmeasured in solution. These data indicate further conformationalchanges in adsorbed cytochrome c that are concentration-dependent, even on an apparently saturated waveguide surface.It should be noted that the maximum packing density observedin these studies, (15 ( 1) pmol/cm2, is less than the theoreticalmaximum packing density of 22 pmol/cm2 sterically allowedfor cytochrome c on the basis of crystallographic dimensionsof the protein.32
4. Conclusions
Absorbance measurements were obtained for surface-boundcytochrome c onto an alumina surface using a single-mode,integrated optical waveguide spectrometer. Due to the highsensitivity of our instrument, the charge transfer band wasmeasured for a submonolayer of cytochrome c, which, to ourknowledge, is the first time. In addition, the high sensitivity ofour single-mode waveguide-based spectrometer allowed us toexperimentally determine the spectral profile of the molarabsorptivity for different surface densities; our results show clearspectral changes at low surface densities (below 3 pmol/cm2).
Under the neutral pH and room temperature conditions ofthe bulk solution employed in this study, our data shows that
Figure 8. Molar absorptivity for cyt c in solution of 10 µM cytochromec in buffer solution (7 mM phosphate, 10 mM NaCl, pH 7.2). Theblack curve was obtained by placing the 1 cm cuvette in the opticalpath of our waveguide-based spectrometer, and the red curve wasacquired using a commercial UV-vis spectrophotometer.
Figure 9. Ratio of the second derivative of the molar absorptivitywith respect to the wavelength divided by the molar absorptivity. Thequantity R in the y-axis is independent of the sensitivity factor andsurface density calculated for the waveguide. Therefore, it can directlyaddress if a particular transition band is changing its spectral behavior.
Q and CT Bands of Cytochrome c J. Phys. Chem. C, Vol. 113, No. 19, 2009 8311

cytochrome c adsorbs to the alumina surface with an affinityof Kad ) (10 ( 2) × 106 M-1 and appears to form a monolayerof packing density of 15 pmol/cm2. The molar absorptivity wascalculated for surface densities from 0.3 to 15 pmol/cm2. Atsurface densities of subsaturating levels (i.e. below 3 pmol/cm2),significant spectral changes were observed in the Q and CTbands. These spectral shifts are attributed to surface-inducedconformational changes upon adsorption of the protein. Changesin the CT band indicate that the integrity of the FeHeme-SMet
bond is being challenged by these conformational shifts. Shiftsin the Q-band indicate a conformational change in the largelyhydrophobic heme-binding pocket of cytochrome c. Furtherstudies conducted at variable bulk solution conditions (ionicstrength, pH, etc.) and comparison of the resulting data withthe relative wealth of solution and studies on cytochrome c mayprovide additional information on the exact nature of theseconformational changes.
Other ongoing work in our group is aimed at addressing theinteraction of proteins with a variety of surfaces and interfacesby exploring the unprecedented sensitivity and broadbandcapability of our single-mode, integrated optical waveguidespectroscopic technique. Those studies may play an importantrole in elucidating several molecular monolayer phenomena withpotential relevance in many surface and thin-film technologies.
Acknowledgment. The authors acknowledge support fromNational Institute of Health, Grant no. RR022864-01, andNational Science Foundation, Grant no. DBI0359442. We thankJason Payne for his assistance in this work.
References and Notes
(1) Quinn, A.; Mantz, H.; Jacobs, K.; Bellion, M.; Santen, L. Europhys.Lett. 2008, 81, 56003.
(2) Lu, M.; Choi, S.; Wagner, C. J.; Eden, J. G.; Cunningham, B. T.Appl. Phys. Lett. 2008, 92, 261502.
(3) Xu, W. S.; Regnier, F. E. J. Chromatogr., A 1998, 828, 357.(4) Yaseen, M.; Salanciski, H. J.; Seifalian, A. M.; Lu, J. R. Biomed.
Mater. 2008, 3, 034123.(5) Ramsden, J. J. Phys. ReV. Lett. 1993, 71, 295.(6) Tie, Y.; Calonder, C.; Van Tassel, P. R. J. Colloid Interface Sci.
2003, 268, 1.
(7) Fernandez, A.; Ramsden, J. J. J. Biol. Phys. Chem. 2001, 1, 81.(8) Malmsten, M. Biopolymers at Interface; Marcel Dekker: New York,
2003.(9) Kato, K.; Takatsu, A.; Matsuda, N.; Azumi, R.; Matsumoto, M.
Chem. Lett. 1995, 437.(10) Mendes, S. B.; Li, L. F.; Burke, J. J.; Lee, J. E.; Dunphy, D. R.;
Saavedra, S. S. Langmuir 1996, 12, 3374.(11) Matsuda, N.; Takatsu, A.; Kato, K. Chem. Lett. 1996, 105.(12) Bradshaw, J. T.; Mendes, S. B.; Saavedra, S. S. Anal. Chem. 2002,
74, 1751.(13) Mendes, S. B.; Saavedra, S. S. Opt. Express 1999, 4, 449.(14) Mendes, S. B.; Li, L. F.; Burke, J. J.; Lee, J. E.; Saavedra, S. S.
Appl. Opt. 1995, 34, 6180.(15) Mendes, S. B.; Li, L. F.; Burke, J.; Saavedra, S. S. Opt. Commun.
1997, 136, 320.(16) Mendes, S. B.; Saavedra, S. S. Appl. Opt. 2000, 39, 612.(17) Margoliash, E.; Frohwirt, N. Biochem. J. 1959, 71, 570.(18) Droghetti, E.; Smulevich, G. J. Biol. Inorg. Chem. 2005, 10, 696.(19) Zucchi, M. R.; Nascimento, O. R.; Faljoni-Alario, A.; Prieto, T.;
Nantes, I. L. Biochem. J. 2003, 370, 671.(20) Schweitzer-Stenner, R.; Shah, R.; Hagarman, A.; Dragomir, I. J.
Phys. Chem. B 2007, 111, 9603.(21) Horecker, B. L.; Kornberg, A. J. Biol. Chem. 1946, 165, 11.(22) Horecker, B. L.; Stannard, J. N. J. Biol. Chem. 1948, 172, 589.(23) Schejter, A.; Aviram, I. Biochemistry 1969, 8, 149.(24) Santos, J. H.; Matsuda, N.; Qi, Z. M.; Yoshida, T.; Takatsu, A.;
Kato, K. Anal. Sci. 2003, 19, 199.(25) Edmiston, P. L.; Lee, J. E.; Cheng, S. S.; Saavedra, S. S. J. Am.
Chem. Soc. 1997, 119, 560.(26) Kraning, C. M.; Benz, T. L.; Bloome, K. S.; Campanello, G. C.;
Fahrenbach, V. S.; Mistry, S. A.; Hedge, C. A.; Clevenger, K. D.; Gligorich,K. M.; Hopkins, T. A.; Hoops, G. C.; Mendes, S. B.; Chang, H. C.; Su,M. C. J. Phys. Chem. C 2007, 111, 13062.
(27) Babul, J.; Stellwagen, E. Biochemistry 1972, 11, 1195.(28) Bradshaw, J. T.; Mendes, S. B.; Saavedra, S. S. Anal. Chem. 2005,
77, 28A.(29) Hayes, C. M.; Pereira, M. B.; Brangers, B. C.; Aslan, M. M.;
Wiederkehr, R. S.; Mendes, S. B.; Lake, J. H. Proc. 17th IEEE UniV. GoV.Ind. MicroNano Symp. (UGIM2008) 2008, 1, 227.
(30) Runge, A. F.; Rasmussen, N. C.; Saavedra, S. S.; Mendes, S. B. J.Phys. Chem. B 2005, 109, 424.
(31) Shah, R.; Schweitzer-Stenner, R. Biochemistry 2008, 47, 5250.(32) Runge, A. F.; Rasmussen, N. C.; Saavedra, S. S.; Mendes, S. B. J.
Phys. Chem. B 2005, 109, 424.(33) Collinson, M.; Bowden, E. F. Langmuir 1992, 8, 2552.(34) Scott, R. A.; Mauk, A. G. Cytochrome c: A Multidisciplinary
Approach; University Science Books: Sausalito, CA, 1996.
JP810845E
8312 J. Phys. Chem. C, Vol. 113, No. 19, 2009 Wiederkehr et al.