investigation on the suitability of natural gas hydrate
TRANSCRIPT
Pertanika J. Sci. & Technol. 28 (S1): 83 - 97 (2020)
ISSN: 0128-7680e-ISSN: 2231-8526
SCIENCE & TECHNOLOGYJournal homepage: http://www.pertanika.upm.edu.my/
Article history:Received: 26 February 2020Accepted: 18 May 2020Published: 16 September 2020
ARTICLE INFO
E-mail addresses:[email protected] (Firas Basim Ismail Alnaimi)[email protected] (Henry Chee Liang Lim)[email protected] (Amar Sahed)[email protected] (Hikmat S. Al Salim)[email protected] (Mohammad Shakir Nasif)*Corresponding author
© Universiti Putra Malaysia Press
Investigation on the Suitability of Natural Gas Hydrate Formation Prediction Simulation Packages and its Implementation ConditionsFiras Basim Ismail Alnaimi1*, Henry Chee Liang Lim2, Amar Sahed3,Hikmat S. Al Salim4 and Mohammad Shakir Nasif5
1Power Generation Unit, Institute of Power Engineering (IPE), Universiti Tenaga Nasional (UNITEN),43000 Kajang, Selangor, Malaysia2Shell Malaysia, P.O. Box 253, Tanjung Kidurong, 97007 Bintulu, Sarawak, Malaysia 3Abu Dhabi Polytechnic, P.O. Box 111499, Abu Dhabi,United Arab Emirates4UCSI University, 56000 Cheras, Wilayah Persekutuan Kuala Lumpur, Malaysia5Department of Mechanical Engineering, Universiti Teknologi Petronas (UTP), 32610 Seri Iskandar,Perak, Malaysia
ABSTRACT
In natural gas processing, carbon dioxide is one of the major streams contaminate from the gas reservoir and must be removed, as it reduces the energy content of sales gas. In order to remove huge amounts of carbon dioxide (CO2), gas hydrate is used to capture CO2. However, the high formation of hydrate will inhibit clogs in gas pipelines. Hence, this research presents literature on hydrate formation, prediction of methane-carbon dioxide (CH4-CO2) gas mixture, by using simulation packages of Aspen Hysys 7.2, K-factor, VMG SIM Ver. 6 and BR & E ProMax 2.0. Peng-Robinson model was used in all simulation packages. Simulation results obtained were then compared with experimental data from previous literature sources. The simulation results showed that the higher the concentration
of CO2 in CH4-CO2 gas mixture, the lower the pressure required for CO2 hydrate to form throughout the predicted temperature range from -20°C to 20°C.
Keywords: Hydrate equilibrium prediction, methane-
carbon dioxide gas mixture, Peng-Robinson model
INTRODUCTION
Offshore facilities are expensive in which wells and flow lines taking up almost 38%
Firas Basim Ismail Alnaimi, Henry Chee Liang Lim, Amar Sahed, Hikmat S. Al Salim and Mohammad Shakir Nasif
84 Pertanika J. Sci. & Technol. 28 (S1): 83 - 97 (2020)
of offshore project cost. The formation of hydrates frequently leads to the formation of hydrate plugs along the transportation pipelines, posing major injuries and damage of equipment. During natural gas (NG) processing, injection of hydrate inhibitor to prevent hydrate formation requires high inhibition efficiency. This leads to difficulty in monitoring and may generate some economic losses (Bai & Bai, 2005). Therefore, the study of gas hydrate formation is important, in order to improve the technologies of CO2 sequestration for commercial production, and prevention of pipelines clogging for flow assurance, for instance gas storage and transportation, gas purification, CO2 separation and sequestration (Biruh & Mukhtar, 2012). Hence, the study of hydrate formation and phase behavior in CH4-CO2-NG mixtures is an essential topic in NG processing industries. In this research, the observation on the CO2 effect on gas hydrate formations, particularly the formation pressure is discussed through the simulation of several packages and the application of thermodynamics model as well as the equation of state in predicting the hydrate formation. Besides that, the accuracy of proposed software packages in this study is analyzed by comparing the predicted and the available experiment data through the hydrate formation curve based on CO2 composition.
Gas hydrates are crystalline solids composed of gas molecules for example methane caged inside a rigid lattice of water molecules (Kim et al., 2016). The cavities formed by water molecules are ice-like crystalline compound stabilized by inclusions of suitable size gas (guest) molecules, such as CH4 and CO2 or some other small molecules. Hydrates usually occur at the gas-water interface or vapour-liquid equilibrium (VLE) (Sloan & Koh, 2008). CH4 hydrates occur at deep-sea levels and cold regions of water under immense pressure but cool temperatures (Tupsakhare & Castaldi, 2019). The most common hydrate crystal structures are I, II, and H, and they are determined by the molecular size of molecules filling the cages (Sa et al., 2018).
Previous studies have explored significantly on the matter of natural gas hydrate formation due to their loss incurring nature. One such researcher developed a model to that was used to calculate the equilibrium temperature of gas mixtures dissolved in methane gas reliably and compared the results with other computational works (Smith et al., 2015). Another researcher found that small-sized gas particles and the addition of H2 and N2 increased methane exploitation efficiency (Xu et al., 2018). A few works have explored on the methane generation in natural gas hydrates via the application of methane-CO2 replacement (Xu et al., 2015, 2018). Another work explored the effects of the operating pressure on the methane-CO2 replacement rate and found that the total operating pressure influenced methane-CO2 replacement rate to a great deal (Xu et al., 2018). One researcher studied the effect of addition kinetic promoters and found that kinetic performance could be improved at room temperature, this significantly increased the feasibility of CO2

Gas Hydrate Formation Prediction Packages
85Pertanika J. Sci. & Technol. 28 (S1): 83 - 97 (2020)
transportation (Zheng et al., 2019a). Another research meanwhile found that addition of kinetic promoters (SDS) at 1000ppm results in increased mechanism and kinetics of the CO2 hydrate growth (Molokitina et al., 2019). The experimental and operating pressure was identified as one of the key parameters in improving the kinetics of hydrate formation, while at higher temperatures longer process time was observed (Zheng et al., 2019b).
Other works meanwhile have investigated the uses of ammonium chloride as an inhibitor for the formation of methane hydrate. The study also found that ammonium chloride has greater inhibiting properties for the formation of methane hydrate as compared to urea but lesser than methanol (Muromachi, 2019). While most of this study has explored the factors affecting the formation of hydrate, this research provides a different direction of view by studying the aspects of the effect of CO2 on natural gas hydrate.
The continual growth observed by agglomeration due to the existence of water causes the formation of a solid plug. Furthermore, hydrate formation requires three essential conditions namely: (1) appropriate combination of temperature and pressure, (2) existence of hydrate former and (3) sufficient amount of water. Generally, 5.75 moles of water are required per 1 mole of methane gas to form hydrates (John, 2003). The fulfilment of phase equilibrium for hydrate formation involves: (1) both temperature and pressure of the phases are equal, (2) The chemical potentials of components in each phase are equal and (3) the minimum global Gibbs free energy must be achieved.
These criteria were used as a basis for many models to perform hydrate equilibrium calculations (John, 2003). With the development of simulators (Goodwin et al., 2010), a cubic equation of states that are widely adopted in present-day academia and industry though it was introduced in the 1970s. Equations based on ideal gas model generally incorporate the intermolecular interactions of components (Milo, 2004). In fact, many of the recent Equation of State (EOS) originated from Van der Waals EOS (1873) (as cited in Sloan & Koh, 2008) were devised to improve the efficiency of models. ‘Repulsive forces’ and different ‘attractive’ interactions terms were utilized in order to fit the experimental data.
Peng-Robinson equation of state (PR EOS) (1976) enabled calculation of thermodynamics properties, phase equilibria of pure components and multi-component mixtures applicable in both gaseous and non-aqueous liquids (Goodwin et al., 2010). The basic Peng-Robinson fluid package is appropriate enough to simulate the hydrate formation with multi-component mixtures under VLE condition. The concentration of CO2 from 0% to 100% in the CH4-CO2 gas mixtures was set with 20% step increment for prediction. The water to gas ratio of 5.75 would be held as a constant input during the prediction. The input variable, the temperature in the range of (-20˚C to 20˚C) with 1˚C increment were applied to predict the formation pressure. Smaller temperature increment per 0.2˚C was used to generate nearest upper quadruple point which was predicted by each software packages.

Firas Basim Ismail Alnaimi, Henry Chee Liang Lim, Amar Sahed, Hikmat S. Al Salim and Mohammad Shakir Nasif
86 Pertanika J. Sci. & Technol. 28 (S1): 83 - 97 (2020)
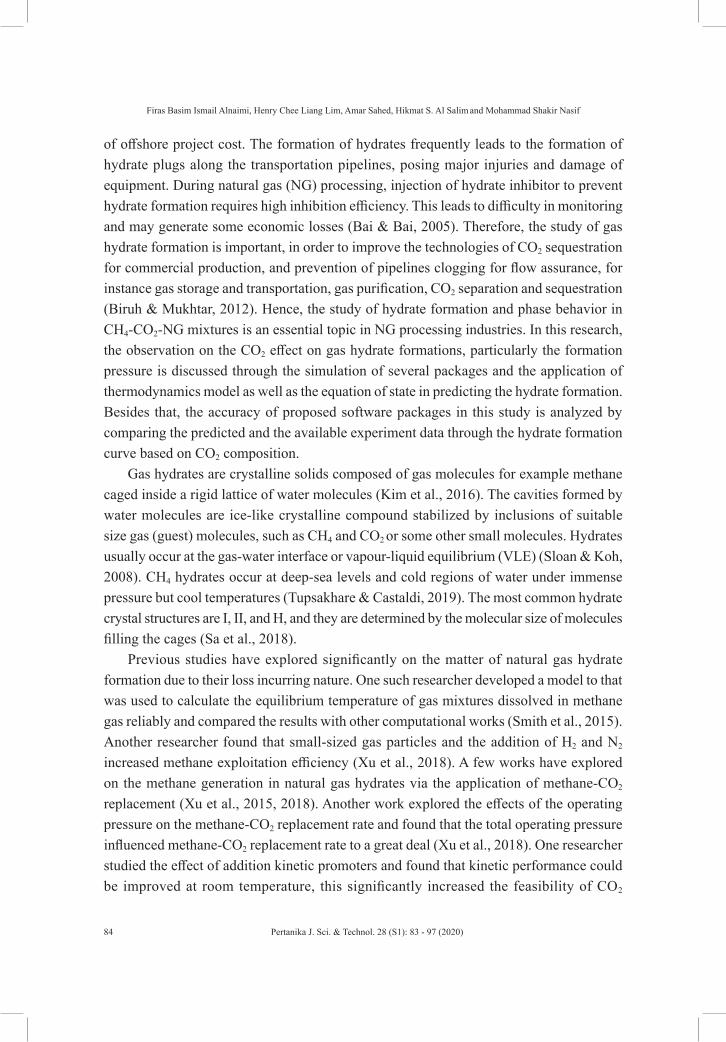
The prediction of the K-factor for hydrate formation condition is based on vapour-solid (vs) phase. K-factor is defined as the distribution of the component between hydrate and gas. The Kvsi value for natural gas components was obtained from the K-chart as shown in Figure 1 and Figure 2 (Sloan & Koh, 2008). The Kvsi values in Figure 1 and Figure 2 are based on the correlation equation by Sloan and Koh (2008) where ∏ is pressure (psia) and is temperature (0F):
From the correlation equation, data for the constants were obtained for CH4 and CO2 and summarized in Table 1. The phase equilibrium (hydrate) curves were then plotted, according to simulation results. The simulation results were then analysed and compared with experimental results from various literature sources. Experimental results available for comparison are in vapour-solid-liquid (V-H-Lw) equilibrium ranging from a lower quadruple point, 0˚C (for both pure CH4 and CO2 with water system) to the upper quadruple point, 9.8˚C (for pure CO2 with water system). These points, Q1 and Q2 with line segments (V-H-Lw) are referred to as hydrate formation pressure and temperature boundaries, are indicated in Table 2. Approaches and methods used in each software packages are tabulated as shown in Table 3.
Figure 1. K-chart of carbon dioxide (Sloan & Koh, 2008)
Gas Hydrate Formation Prediction Packages
87Pertanika J. Sci. & Technol. 28 (S1): 83 - 97 (2020)
Table 1The guest: Cage ratio for some of the common structure I hydrate former. ζ indicates the cavities occupied by the simple hydrate former
Molecular diameter/ cavity diameter (guest: cage ratio)Guest hydrate former Hydrate Structure I
Molecule Diameterb (Å) 512 51262
CH4 4.36 0.855ζ 0.744 ζ
Xe 4.58 0.898 ζ 0.782 ζ
H2S 4.58 0.898 ζ 0.782 ζ
CO2 5.12 1.00 ζ 0.834 ζ
Table 2Hydrate formation phases boundaries for common gas components (Carroll, 2003)
Q1: I-Lw-H-V Q2: Lw-LHC-V-HTemperature(⁰C)
Pressure(MPa)
Temperature (⁰C)
Pressure(MPa)
Methane -0.3 2.563 No Q2
Ethane -0.1 0.530 14.6 3.390Propane -0.1 0.172 5.6 0.556Isobutene -0.1 0.113 1.8 0.167Carbon dioxide -0.1 1.256 9.8 4.499Hydrogen sulfide -0.4 0.093 29.4 2.24Nitrogen -1.3 14.338 No Q2
Figure 2. K-chart of methane gas (Sloan & Koh 2008)

Firas Basim Ismail Alnaimi, Henry Chee Liang Lim, Amar Sahed, Hikmat S. Al Salim and Mohammad Shakir Nasif
88 Pertanika J. Sci. & Technol. 28 (S1): 83 - 97 (2020)
MATERIALS AND METHODS
Hydrate Formation Simulation
A simulation was performed by selecting the thermodynamics property package, in order to calculate the thermodynamics equilibrium. Thermodynamics equilibrium refers to the boundary condition where pressure, temperature and chemical potentials of fluids phases are equal to each other. Hydrate formation which is on the water-gas interface, vapour-liquid equilibrium (VLE), was considered to determine the proper fluid package to be used, due to the mutual insolubility of hydrocarbon and water. Phase changes of liquid at the supercritical region, liquid-liquid equilibrium (LLE), with the consideration of hydrocarbon solubility in water is applicable in Peng-Robinson EOS.
Various independent variables, for example, the concentration of CH4 and CO2, water to gas ratio and the temperature range, were selected as inputs to predict the formation pressure. However, the objective of the study was to study the effect of CO2 on hydrate formation. Hence, the percentage change in the concentration of CO2 in the ternary system (CO2-CH4-H2O) was used as an approach. The summarized steps involved in all four of simulation software are listed as such: (1) assigning of thermodynamics property packages, for instance, unit conversion to SI unit, (2) setting of gas components (CO2, CH4 and H2O) as ternary system, for instance, manipulating the concentration of components, normalizes the water to gas ratio to mole fraction, (3) inserting conditions into simulation environment, by coupling with operation block column, for instance adding feed stream and phase envelope block, assigning the predicted condition like temperature in range at blocks (4) solving for formation pressure repeatedly or directly from plot, given by +temperature range between -20°C and 20°C.
Water Content Requirement for Hydrate FormationHydrate formation usually occurs at gas-water interface, which contains 85% mole of water and 15% mole of gas. This is because the location of the interface requires a very
% AADPsAspen Hysys
K-factor VMG Sim BR & E ProMax
pure CH4 + water system
Temprature range0-19˚C (n=14)
3.96 % 7.65 % 3.98 % 3.40 %
pure CO2 + water system
Temprature range:0-10˚C (n=10)
15.42 % 5.87 % 22.00% 9.59 %
Table 3Absolute average error in pressure (% ADDPs) of single gas component + water system for all software packages

Gas Hydrate Formation Prediction Packages
89Pertanika J. Sci. & Technol. 28 (S1): 83 - 97 (2020)
high concentration of host and guest molecules, where cluster growth (nucleation) will start to take place (Sloan & Koh, 2008). According to theoretical formula, 5.75 moles of water require 1 mole of gas for hydrate transformation. The dissociation pressure at the water to gas ratio of 5.75 acts as reference pressure, in order to compare with other ratio value, and to study the contribution of water content on hydrate formation. In this study, water to gas ratios of 1 to 7 were the only manipulated inputs, as they gave the lowest and the highest dissociation pressure respectively (Carroll, 2003).
Evaluation of Phase Composition
Vapour and solid composition of natural gas component, for instance, CO2 and CH4, are able to be predicted by using the flash method available in K-Factor. The K-factor flash method calculation steps are listed as such: (1) assigning input of feed percentage concentration, for instance, zi for CO2 and CH4, (2) assigning input of required fixed formation temperature, (3) solving the objective functions iteratively, for instance, setting of Rachford-Rice function equals to zero, taking small step changes of VF during prediction (0 < VF < 1), (4) obtaining the results of vapour and solid-phase composition of CO2 and CH4.
Phase Diagram and Analysis
A series of Pressure-Temperature diagram, consisting of phase equilibrium curves were generated, based on the simulation results of four different software packages. Formation pressure at a given temperature and percentage concentration of CO2 impurity were observed. Comparisons were made between the predicted results from the available phase equilibrium diagram and experimental data from Adisasmito et al. (1991). A comparison was made for 0%, 20%, 60% and 100% of CO2 concentration in the CH4-CO2 gas mixture, as shown in Figure 4, Figure 5, Figure 6 and Figure 7, by using the standard error function from Microsoft Office Excel program. Standard error was done by the percentage of error in experimental pressure (y-axis), for an individual (x-axis). The allowable pressure errors were indicated as vertical error bars, as shown in Figure 3, were calculated using Microsoft Office Excel “STEYX” function. Deviation of predicted results at each point was studied, to recommend software accuracies in the gas mixture with a water system.
However, a comparison between predicted results and experimental data were made, by using Absolute Average Deviation (AAD). Both Absolute Average Deviation Pressure (AADP) and Absolute Average Deviation Temperature (AADT) was used to measure the deviations of set points from their average (Azmi et al., 2011). AADP was calculated in percentage for pure gas systems at selected fixed temperatures, with the use of the experimental data from Sloan and Cao (2002) and Sloan and Koh (2008). Meanwhile,

Firas Basim Ismail Alnaimi, Henry Chee Liang Lim, Amar Sahed, Hikmat S. Al Salim and Mohammad Shakir Nasif
90 Pertanika J. Sci. & Technol. 28 (S1): 83 - 97 (2020)
both AADP and AADT were calculated in percentage at the upper quadruple point, where Q2 marks the phase change from CO2 vapour to liquid (Sloan et al. 2011). The formula for AAD is specified as:
Figure 3. Comparison of % ADDP errors for pure CH4 and CO2 system
RESULTS AND DISCUSSION
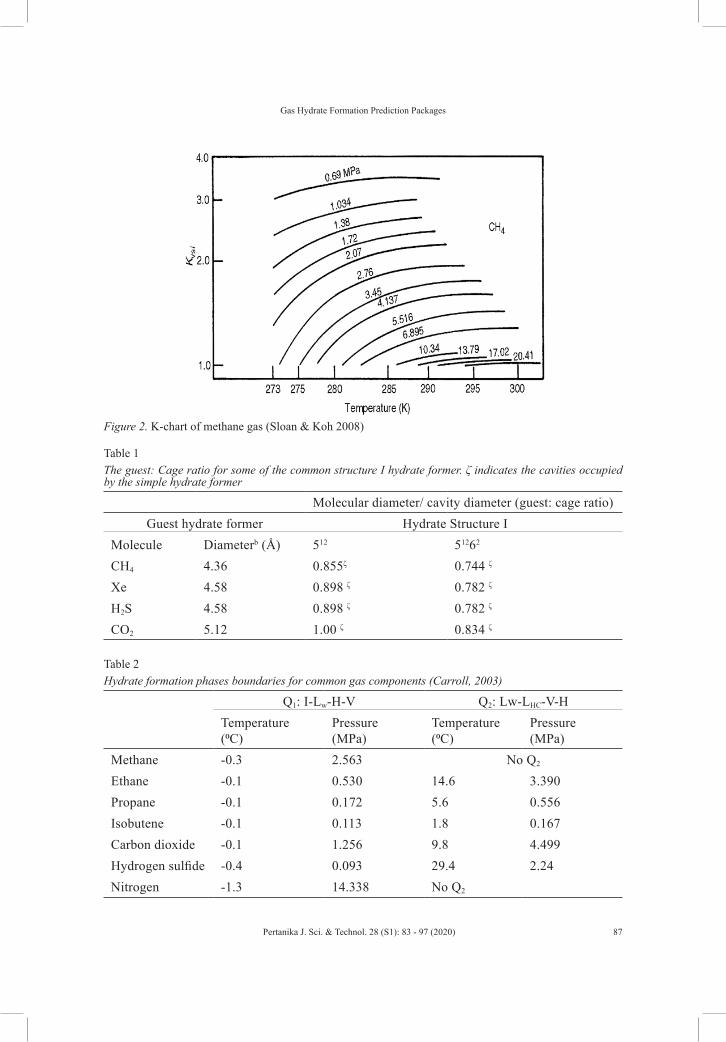
Figure 4 depicts the comparison between the predicted and experimental data for pure CH4 + water system. All four software packages predicted the hydrate formation equally well within the pressure error limits (±0.178 MPa) for pure CH4 system. However, a higher deviation of predicted results was observed due to the pressure difference at higher pressure prediction. This is due to different accuracy of the modified PR-EOS model in most simulation packages at higher pressure prediction.
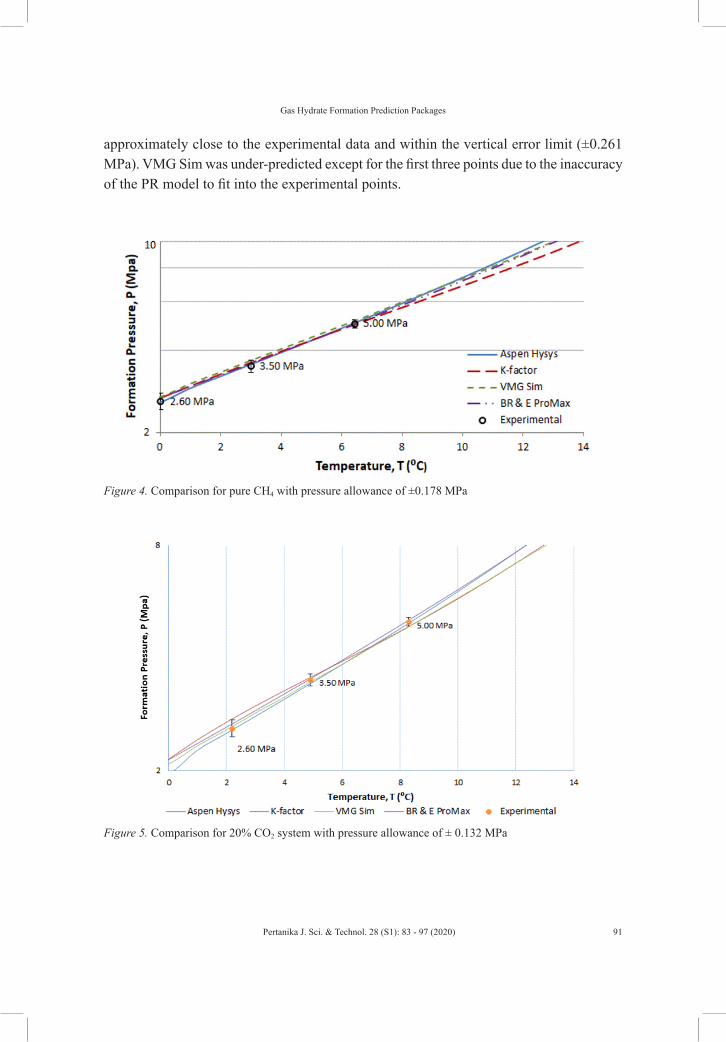
Figure 5 presents the comparison between predicted and experimental data for 20% CO2 + water system. According to fitness to all vertical error bars, the pair of Aspen Hysys and BR & E ProMax curves gave a higher overall consistency with experimental data as compared to the other two packages. The pair of VMG Sim and K-factor curves had under-predicted slightly at third experimental data point. Meanwhile, K-factor over-predicted at first experimental data point. Based on the review of the K-factor program, it possessed weaker accuracy for mixture prediction (John, 2003).
Figure 6 shows the comparison between the predicted and experimental data for 60% CO2 + water system. It was observed that Aspen Hysys, BR & E ProMax and K-factor, had consistently predicted the pressure-temperature (P-T) curves. All the curves were
Gas Hydrate Formation Prediction Packages
91Pertanika J. Sci. & Technol. 28 (S1): 83 - 97 (2020)
approximately close to the experimental data and within the vertical error limit (±0.261 MPa). VMG Sim was under-predicted except for the first three points due to the inaccuracy of the PR model to fit into the experimental points.
Figure 4. Comparison for pure CH4 with pressure allowance of ±0.178 MPa
Figure 5. Comparison for 20% CO2 system with pressure allowance of ± 0.132 MPa

Firas Basim Ismail Alnaimi, Henry Chee Liang Lim, Amar Sahed, Hikmat S. Al Salim and Mohammad Shakir Nasif
92 Pertanika J. Sci. & Technol. 28 (S1): 83 - 97 (2020)
Figure 7 displays the comparison between predicted and experimental data for 100% CO2 + water system. Based on the figure, Aspen Hysys, K-factor, and BR & E ProMax had predicted pressure values consistently at all experimental data. However, BR & E ProMax under-predicted slightly at third and fourth data points. It is observed that VMG Sim did not predict within the vertical error limit for higher % CO2 concentration hydrate prediction. This may due to the weakness and lower accuracy of modified VMG Sim’s PR model to predict the high percentage of CO2 gas system.
Figure 8 shows the comparison plot of more experimental data with predicted results from 0˚C to 19˚C for pure CH4 + water system (Cao, 2002). The number of experimental data, (n) used was 14 with all the selected points were the same as the given predicted temperature increment. The measure of pressure deviation of predicted data was calculated as absolute average pressure error represented in Figure 6.
Figure 9 presents the comparison plot of the experimental data with predicted results from 0˚C to 10.4˚C for pure CO2 + water system (Sloan & Koh, 2008). The number of experimental data, (n) used was 12 with all selected points closed to the given predicted temperature increment. % AADP and % AADT were calculated which included upper quadruple point, Q2 for pure CO2 system and represented as a bar chart in Figure 10 and. Figure 11. The experimental Q2 for pure CO2 system was at 9.8˚C, 4.499MPa (John, 2003). According to the predicted data, Aspen Hysys, BR & E ProMax, and VMG Sim had predicted the upper quadruple point at 9.6˚C with 4.43 MPa, 10.8˚C with 5.23 MPa and 13.8˚C with 4.90 MPa respectively.
Figure 6. Comparison for 60% CO2 system with pressure allowance of ±0.261 MPa

Gas Hydrate Formation Prediction Packages
93Pertanika J. Sci. & Technol. 28 (S1): 83 - 97 (2020)
Figure 10 represents the comparison of %ADDP in a bar chart for pure CH4 and CO2 hydrate prediction. In general, the %AADP produced by all software packages in the pure CH4 + water system was quite low, except for K-Factor which gave additional 3.3% of deviation error as compared to BR & E ProMax. This is because the predicted result of K-factor for pure CH4 + water system did not tolerate in a linear form within the experimental data. In ascending order, both BR & E ProMax and Aspen Hysys gave the highest accuracy for pure CH4 + water system prediction, followed by VMG Sim and lastly the K-Factor. The former 3 packages predicted equally well for pure CH4 hydrate formation at high pressure.
Figure 7. Comparison for pure CO2 system with pressure allowance of ±0.152 MPa
Figure 8. Comparison for pure CH4 system from 0˚C to 19˚C with n = 14.

Firas Basim Ismail Alnaimi, Henry Chee Liang Lim, Amar Sahed, Hikmat S. Al Salim and Mohammad Shakir Nasif
94 Pertanika J. Sci. & Technol. 28 (S1): 83 - 97 (2020)
Figure 9. Comparison for pure CO2 system from 0˚C to 10.4˚C with n = 12
Figure 10. Comparison of % ADDP errors for pure CH4 and CO2 system
On the other hand, all simulation packages except the K-factor had predicted the upper-quadruple point in the pure CO2 + water system. K-Factor’s accuracy of hydrate prediction at 10˚C further was a problem. The prediction was just weak at that high-pressure hydrate prediction but its accuracy was still remarkable since it was below 10% AADP. For VMG Sim, its accuracy was getting poorer with increasing CO2 concentration. It was assumed that the PR model of VMG Sim was not suitable for hydrate prediction with high CO2 content.
Gas Hydrate Formation Prediction Packages
95Pertanika J. Sci. & Technol. 28 (S1): 83 - 97 (2020)
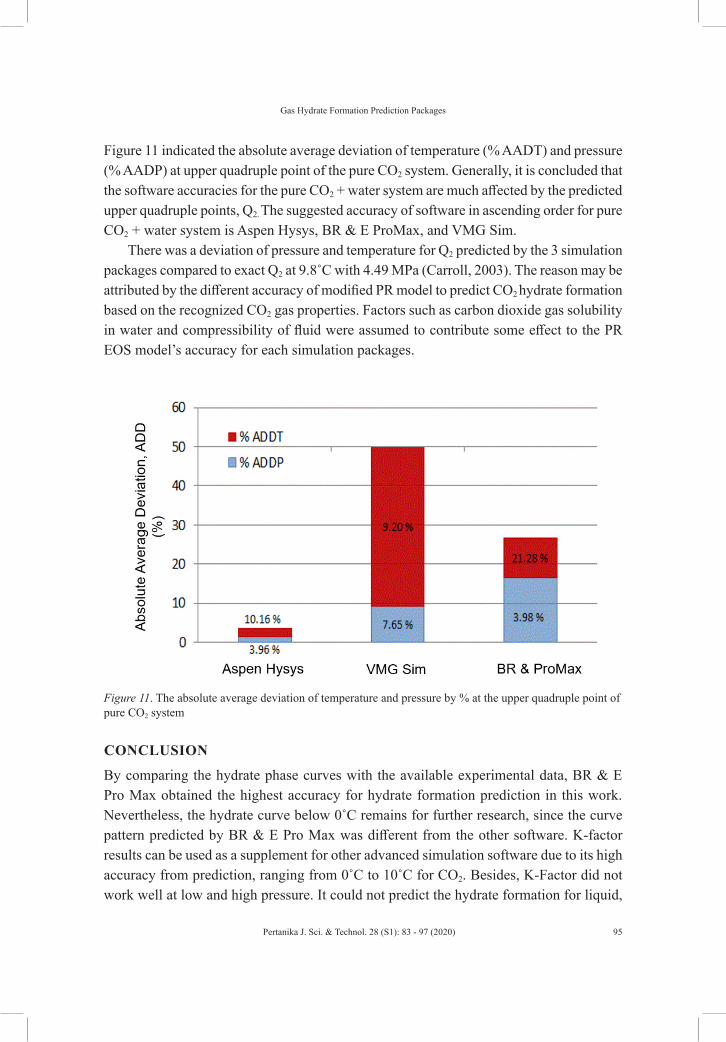
Figure 11 indicated the absolute average deviation of temperature (% AADT) and pressure (% AADP) at upper quadruple point of the pure CO2 system. Generally, it is concluded that the software accuracies for the pure CO2 + water system are much affected by the predicted upper quadruple points, Q2. The suggested accuracy of software in ascending order for pure CO2 + water system is Aspen Hysys, BR & E ProMax, and VMG Sim.
There was a deviation of pressure and temperature for Q2 predicted by the 3 simulation packages compared to exact Q2 at 9.8˚C with 4.49 MPa (Carroll, 2003). The reason may be attributed by the different accuracy of modified PR model to predict CO2 hydrate formation based on the recognized CO2 gas properties. Factors such as carbon dioxide gas solubility in water and compressibility of fluid were assumed to contribute some effect to the PR EOS model’s accuracy for each simulation packages.
Figure 11. The absolute average deviation of temperature and pressure by % at the upper quadruple point of pure CO2 system
CONCLUSION
By comparing the hydrate phase curves with the available experimental data, BR & E Pro Max obtained the highest accuracy for hydrate formation prediction in this work. Nevertheless, the hydrate curve below 0˚C remains for further research, since the curve pattern predicted by BR & E Pro Max was different from the other software. K-factor results can be used as a supplement for other advanced simulation software due to its high accuracy from prediction, ranging from 0˚C to 10˚C for CO2. Besides, K-Factor did not work well at low and high pressure. It could not predict the hydrate formation for liquid,
Firas Basim Ismail Alnaimi, Henry Chee Liang Lim, Amar Sahed, Hikmat S. Al Salim and Mohammad Shakir Nasif
96 Pertanika J. Sci. & Technol. 28 (S1): 83 - 97 (2020)
as it tended to extrapolate over the experimental quadruple point for fluid which was still at the vapour phase.
Based on simulation results observation, the higher the CO2 percentage in the CO2-CH4 gas mixture, the lower the pressure for hydrate to form. It is justified that the formation of CO2 hydrate is favourable at low pressure. This condition is valid throughout the predicted temperature range from -20 to 20˚C, but not for pure CO2 hydrate. As such, it can be concluded that most of the common gas hydrate prediction software is unable to predict the gas hydrate accurately.
ACKNOWLEDGEMENT The authors would like to express gratitude to Power Generation Unit, Institute of Power Engineering, Universiti Tenaga Nasional (UNITEN) and Tenaga Nasional Berhad (TNB) for providing a research grant to carry out this research.
REFERENCESAdisasmito, S., Frank, R. J., Robert, J., & Sloan., E. D. (1991). Hydrates of carbon dioxide and methane
mixtures. Journal of Chemical Engineering. 36 (1), 68–71.
Azmi, N., Mukhtar, H., & Sabil, K. M. (2011). Purification of natural gas with high CO2 content by formation of gas hydrates: Thermodynamics verification. Journal of Applied Sciences, 11 (21), 3547-3554.
Bai, Y., & Q. Bai. (2005). Subsea Pipelines And Risers (1st Ed.) Oxford, UK: Elsevier.
Biruh, S., & Mukhtar, H. (2012). Natural gas purification technologies - Major Advances for CO2 separation and future directions. Advances in Natural Gas Technology, 9, 235-270.
Carroll, J. (2003). Natural gas hydrates a guide for engineers: Waltham, USA: Gulf Professional Publishing.
Goodwin, A. R., Sengers, J., & Peters, J. C. (2010). Applied thermodynamics of fluids: Cambridge, UK: RSC Publishing.
Kim, S., Baek, I., You, J., & Seo, Y. (2016). Phase equilibria, dissociation enthalpies, and Raman spectroscopic analyses of N 2 + tetra-n-butyl ammonium chloride (TBAC) semi clathrates. Fluid Phase Equilibria, 413, 86-91.
Milo, D. K. (2004). Engineering and chemical thermodynamics. Hoboken, USA: Wiley.
Molokitina, N., Nesterov, A., Podenko, L., & Reshetnikov, A. (2019). Carbon dioxide hydrate formation with SDS: Further insights into mechanism of gas hydrate growth in the presence of surfactant. Fuel, 235, 1400-1411.
Muromachi, S. (2019). Phase equilibrium for clathrate hydrates formed in the (methane, carbon dioxide or ethane) + water + ammonium chloride system. Fluid Phase Equilibria, 485, 234-238.
Sa, J., Hu, Y., & Sum, A. (2018). Assessing thermodynamic consistency of gas hydrates phase equilibrium data for inhibited systems. Fluid Phase Equilibria, 473, 294-299.

Gas Hydrate Formation Prediction Packages
97Pertanika J. Sci. & Technol. 28 (S1): 83 - 97 (2020)
Sloan, E. D., & Cao, Z. (2002). Modelling of gas hydrates from first principles. (Doctoral dissertation). Massachusetts Institute of Technology, Massachusetts, USA.
Sloan, E. D., & Koh, C. A. (2008). Clathrate hydrates natural gases third edition. Boca Raton, USA: CRC Press.
Sloan, E. D., Koh, C. A., Amadeu, K. S., Norman, D. M., George, S., & Adam, L. B. (2011). Natural gas hydrates in flow assurance. Burlington, USA: Gulf Professional Publishing.
Smith, C., Barifcani, A., & Pack, D. (2015). Gas hydrate formation and dissociation numerical modelling with nitrogen and carbon dioxide. Journal of Natural Gas Science and Engineering, 27, 1118-1128.
Tupsakhare, S., & Castaldi, M. (2019). Efficiency enhancements in methane recovery from natural gas hydrates using injection of CO2/N2 gas mixture simulating in-situ combustion. Applied Energy, 236, 825-836.
Xu, C., Cai, J., Lin, F., Chen, Z., & Li, X. (2015). Raman analysis on methane production from natural gas hydrate by carbon dioxide–methane replacement. Energy, 79, 111-116.
Xu, C., Cai, J., Yu, Y., Chen, Z., & Li, X. (2018). Research on micro-mechanism and efficiency of CH4 exploitation via CH4-CO2 replacement from natural gas hydrates. Fuel, 216, 255-265.
Zheng, J., Loganathan, N., & Linga, P. (2019a). Natural gas storage via clathrate hydrate formation: Effect of carbon dioxide and experimental conditions. Energy Procedia, 158, 5535-5540.
Zheng, J., Loganathan, N., Zhao, J. and Linga, P. (2019b). Clathrate hydrate formation of CO2/CH4 mixture at room temperature: Application to direct transport of CO2-containing natural gas. Applied Energy, 249, pp.190-203.
