investigation of the relationship between contemporary
TRANSCRIPT
Full Terms & Conditions of access and use can be found athttp://www.tandfonline.com/action/journalInformation?journalCode=rero20
Download by: [94.250.135.147] Date: 24 December 2016, At: 04:47
Economic Research-Ekonomska Istraživanja
ISSN: 1331-677X (Print) 1848-9664 (Online) Journal homepage: http://www.tandfonline.com/loi/rero20
Investigation of the relationship betweencontemporary cost management methods andimprovement in financial performance
Josipa Mijoč, Dubravka Pekanov Starčević & Ivo Mijoč
To cite this article: Josipa Mijoč, Dubravka Pekanov Starčević & Ivo Mijoč (2014) Investigationof the relationship between contemporary cost management methods and improvementin financial performance, Economic Research-Ekonomska Istraživanja, 27:1, 393-413, DOI:10.1080/1331677X.2014.966970
To link to this article: http://dx.doi.org/10.1080/1331677X.2014.966970
© 2014 The Author(s). Published by Taylor &Francis
Published online: 27 Oct 2014.
Submit your article to this journal Article views: 1773
View related articles View Crossmark data
Citing articles: 1 View citing articles
Investigation of the relationship between contemporary costmanagement methods and improvement in financial performance
Josipa Mijoč, Dubravka Pekanov Starčević and Ivo Mijoč*
Faculty of Economics in Osijek, Gajev trg 7, 31 000 Osijek, Croatia
(Received 16 July 2013; accepted 12 September 2014)
This article gives an overview of contemporary cost management (CCM) methods(target costing [TC], activity-based costing [ABC] method, total quality management[TQM]), and presents the benefits of introducing them to business practices. Previousstudies have considered the possibility of cost reduction and optimisation by intro-ducing CCM methods thus improving company performance. This explorative empir-ical study is a first step in investigating the relationship between CCM methods andfinancial performance. The aim of the research is to clarify the conceptual and meth-odological ambiguities surrounding the justification of using adopted measurementscales. This study is based on the outcomes of a questionnaire completed by a repre-sentative sample of 48 Croatian limited companies. The findings highlight the influ-ence of CCM methods on the financial performance of the companies surveyed.They also provide the basis for recommendations to management accountants andraise more questions for research. Based on psychometric characteristics of measure-ment constructs, the questionnaire applied in this study can serve as a starting pointfor instrument development in future research.
Keywords: management accounting; contemporary cost management (CCM)methods; financial indicators; statistical methods; regression linear model
JEL classification: M40, M41, M49
1. Introductory considerations
Cost management methods used in the contemporary business environment must supportthe manufacturing of new products that will meet customers’ requirements at the lowestpossible cost to the company. Moreover, these methods must help reduce the manufac-turing costs of existing products. Since a successful product (service) is a combinationof quality and functionality at the lowest possible cost, contemporary cost management(CCM) methods are applied to achieve the above objectives.
Kaplan (1984) emphasises the greatest weakness of conventional managementaccounting, noting that management accounting can no longer exist as a separatediscipline, developing its own procedures and measurement systems and applying themuniversally to all companies, not taking into account the values, goals and strategy ofan individual company. It must serve the strategic goals of the company. This suggeststhat traditional management accounting can no longer meet the information needs ofmanagement and that a different, contemporary approach to cost management isrequired.
*Corresponding author. Email: [email protected]
© 2014 The Author(s). Published by Taylor & Francis.This is an Open Access article distributed under the terms of the Creative Commons Attribution License http://creativecommons.org/licenses/by/3.0/, which permits unrestricted use, distribution, and reproduction in any medium, provided the originalwork is properly cited. The moral rights of the named author(s) have been asserted.
Economic Research-Ekonomska Istraživanja, 2014Vol. 27, No. 1, 393–413, http://dx.doi.org/10.1080/1331677X.2014.966970
The development of cost management methods can be divided into two periods. Theperiod until the 1980s is characterised by the predominant use of absorption costing orvariable costing, where product (service) price was calculated using a cost-plus pricingmethod. The development of CCM methods started after the 1980s. Contemporarymethods were developed in order for companies to adapt more easily to the new manu-facturing environment as well as new and diverse customer requirements.
Stenzel and Stenzel (2003, p. 226) underline that contemporary cost managementinvolves the use of a suitable cost management tactic or method (activity-based costing[ABC] method, total quality management [TQM], target costing [TC], life cycle cost-ing…). They also note that managers who use CCM methods understand traditional andadvanced cost management methods well enough to create a highly visible and transpar-ent system of strategic cost structures for resource allocation and cost management.Moreover, they note that CCM methods contribute to a company’s profitability.
A company’s profitability is closely linked to the production of goods or provisionof services at the lowest possible cost to the company and implies careful monitoringand analysing of all costs as well as finding opportunities to reduce, optimise and definethe cost at which the company can achieve the selling price that will generate sufficientsales volume for the company to make profit.
Cost structure of a specific product and/or service begins to form during the designphase in the case of a new product, or in the process of redesigning in the case of anexisting product. This makes the basis of TC. Most approaches to cost management donot take into account the costs incurred before and after the manufacturing process.When one considers the fact that most of the product costs, such as research and devel-opment costs or design costs, are incurred before the product enters the manufacturingprocess, one recognises the shortcomings of methods that do not take into account thephases that precede and follow the manufacturing process. In addition, the understand-ing of the nature of cost behaviour presents a major problem. Most of the time compa-nies focus on product costs and disregard the influence of other activities, such asmarketing and services. The real cost drivers are disregarded as well. As a result, costsare grouped into the costs of materials, labour and overhead costs and the influence ofactivities on the incurrence of costs are not taken into account.
The above represents the basis of the ABC method. After identifying the activitiesperformed in the company, the costs incurred in the company need to be allocated tothese activities and in this way the opportunities for improvement are recognised. Inaddition to the ABC method, emphasis is placed on the quality of products and servicesmaking the quality an essential component of a contemporary business strategy. This iswhy TQM is considered to be a CCM method.
TQM is a management strategy based on the quality promoted in the entire com-pany, but it is primarily focused on the customer and the dynamics of the environment.This orientation is based primarily on the synchronisation of the process and all partnersalong the value chain aim to create knowledge through innovation and ultimatelyachieve global competitiveness (Mehra & Agrawal, 2003, p. 1013). By definition TQMincludes the ambition to gain advantage over competition. This puts TQM among CCMmethods. It provides additional benefits when applied simultaneously with other CCMmethods, such as TC and ABC.
The above-mentioned CCM methods and their influence on financial performance ofa company are the subjects of this article, which builds on the research regarding theconnection between cost management methods and the financial performance of a com-pany. Given the scarcity of empirical research in this field in the Republic of Croatia,
394 J. Mijoč et al.
the article offers some useful insights into the influence of the methods on financial per-formance of companies whose securities are traded on the Zagreb Stock Exchange.
The article consists of four sections. The first section contains introductory consider-ations. The second section deals with the theoretical considerations of cost managementmethods. Methodological framework and research findings are presented in the thirdand fourth sections.
2. Theoretical considerations of cost management methods
Researchers in the field of management accounting suggest the use of the ABC manage-ment method as an important tool for contemporary cost management (Chenhall, 2004;Dekker, 2003; McNair, Polutnik, & Silvi, 2001). Hilton, Maher, and Selto (2000) andDekker (2003) include TC and TQM in CCM methods. They consider these methods tobe essential for the long-term success of a company.
Many studies argue that modern management accounting techniques (such as TQM,ABC, TC, Just-in-Time [JIT] and Balanced Scorecard [BSC]) recently adopted by anumber of organisations affect the management accounting functions (planning, control-ling, communication, and decision-making) and then shift their focus from a simple roleof cost determination and financial control to a sophisticated role of value creation(Abdel-Kader & Luther, 2008).
2.1. Target costing
TC is a pricing method developed as a result of an extremely competitive environmentin which each attempt to increase the price of a product is punished by customers. Itwas developed in Japan as a response to the changing environment in the 1970s. Thismethod is considered to have been invented by Toyota (Tanaka, 1993), a company thatin 1965 began focusing on satisfying the growing and diversified needs of customers,which led to the production of small batches of different products.
TC facilitates effective cost management both in the design phase and in the produc-tion phase. However, the application of this method in the product design phase pro-vides the greatest potential for cost reduction (Gagne & Discenza, 1995, p. 21). Cooperand Slagmulder (2002) define TC as a structured approach to determining the cost atwhich a given product with specified functionality and quality must be produced toachieve the desired level of profitability throughout its life cycle at the expected sellingprice. This method is at the same time a profit management tool and a cost managementtool. It follows from the above that TC is a cost management method used for designingproducts whose profitability justifies the production itself. Cooper and Slagmulder(1999) also describe TC as a costing technique that the company uses to manage futureprofits by explicitly incorporating the target cost in the product development process.
The essential difference between TC and all other cost management methods is thefact that cost reduction takes place in the pre-production stage of the product life cycle,i.e. at the stage of planning and product development. When it comes to reducing costsin the production phase, this can be achieved by reducing negative deviations from thestandard cost or by improving the efficiency of production processes. The application oftraditional approach involves achieving the highest possible level of process effective-ness and efficiency, whereas TC entails the most cost-effective product design.
This is a managerial method dictated by the market. Accounting systems in Japanhave been designed to enable a company to achieve the desired performance in line with
Economic Research-Ekonomska Istraživanja 395
market conditions. El-Dyasty (2007, p. 40) notes that an organisation which can reducecosts in the cost structure of its new products, maintaining at the same time the qualityand functionality of the product, will be able to survive and compete successfully.
Guilding, Cravens, and Tayles (2000, p. 120) consider TC as a CCM method due tothe fact that it is not focused on accurate cost monitoring but rather on the forward-looking cost philosophy and is closely associated with achieving competitive advantage.External focus of this method is obvious because it is a market-based costing method,rather than cost-based pricing method.
Monden and Hamada (1991) and Cooper (1995) are among those researchers whosupport the view that TC leads to lower-cost products in comparison to products wheredesign engineers are expected to minimise the cost of the new product. TC reducescosts by including suppliers and manufacturers in the design process thereby focusingthe entire chain on eliminating costly waste, surplus and inequality (Helms, Ettkin,Baxter, & Gordon, 2005, p. 49). Costs are not the main factor in product pricing. Themain factors are the prices of competing products and the value that a product has forconsumers (Karić, 2008, p. 131).
In addition to being predominantly used in large companies, TC is mainly used inmanufacturing companies rather than in service companies. This was confirmed by theresearch conducted by Dekker and Smidt (2003), which included all Dutch productioncompanies listed on the Amsterdam Stock Exchange. The study also included all non-manufacturing companies (excluding financial and insurance companies) with an aim totest the hypothesis that TC cannot be applied to that category of companies. Of the 175companies surveyed, none from that category applied TC. Huang, Lai, Kao, and Chen(2012) in their research confirm that the implementation of TC in electronics and infor-mation industry firms in China was positively associated with their performance. Thisleads to the first hypothesis of this article: On the basis of given mentioned literature,the following hypothesis can be derived:
Hypothesis 1: Application of TC improves financial performance (regardless of the activity).
2.2. The ABC method
A company manufactures products and provides services by performing a series ofactivities. Managers must be aware which activities consume the largest amount ofresources and, consequently, incur the largest share of the costs. Direct raw material andlabour costs are not an issue because the cost driver for them is the number of productunits. The issue is that indirect/overhead costs, whose share in the total costs is increas-ing, need to be adequately allocated to cost objects (products and services). The reasonfor the increasing overheads, among other things, is the production of various productsaccording to specific customer requirements.
Production of various products in small batches is characterised by the need forindirect activities to meet customer needs, which include fast and flexible delivery.Indirect costs – overhead costs that are incurred as a result of these activities – are asso-ciated with the types of products rather than the quantity of products produced.Therefore, it is important to control these costs and identify their drivers. ABC andactivity-based management (ABM) help us achieve this (De Zoysa & KanthiHerath,2007, p. 276). Krumwiede (1998), Agrawal, Mehra, and Siegel (1998) and Kaplan andCooper (1998) also note that the greatest benefit of the ABC method is the allocation ofoverheads. Given that the overheads are growing substantially and in most companies
396 J. Mijoč et al.
outweigh the costs of direct labour many times over, a number of companies began totreat direct labour as a component of overhead costs rather than separating them as aspecial category of costs.
The main idea behind the ABC method is that the cost of a product equals the sumof the costs of raw materials used in production and the costs of all production processactivities (Shields & Young, 1989). The basic concept of the ABC method includes thefact that products do not consume company resources. Company resources are con-sumed by activities that take place within the company and they are the ones that createthe overhead costs.
The ABC method is justified in companies engaged in highly-competitive industries,characterised by automation, and consequently high overhead costs. These companiesproduce a variety of products, mainly to the specific requirements of customers. As aresult, it is necessary to use a large number of cost drivers to allocate overhead costs toobjects, as accurate data on the costs are necessary to become profitable and gain acompetitive advantage.
The ABC method also improves a company’s business performance as it allows visi-bility of the value-added activities and activities with no added value. Value-addedactivities are those activities that customers value and are willing to pay for. They can-not be eliminated from a company without compromising the quality of the businessprocess or product. These are, for example, design, manufacturing, and delivery of prod-ucts to the customer. On the other hand, activities with no added value are those whichcustomers are neither willing to pay for, nor do they appreciate them, such as waiting,remanufacturing of a product or checking of already manufactured products. However,some of these activities are essential to a company’s business and cannot be eliminatedfrom the business process in spite of the fact that they will not add value for the cus-tomer. The company must constantly strive to eliminate activities without added valueand to develop and introduce value-added activities.
Analysis of activities proved to be useful in improving the planning, pricing and man-agement control in companies. Blocher, Chen, and Lin (2002, p. 100) suggest that ABM isaimed at activity management in order to improve the efficiency and effectiveness and atthe same time increase value for the customer and profit for the company (Blocher et al.,2002, p. 100). The same authors note that the ABC method provides information managersneed for activity management with an aim to improve competitiveness.
Authors who investigated the ABC method emphasise that it ensures profitability andcompetitive advantage over companies that do not use this method (Cagwin & Bouwman,2002, El-Dyasty, 2007; Kaplan & Cooper, 1998; Kennedy & Affleck-Graves, 2001). Thismethod is also suitable for large companies (Krumwiede, 1998) and manufacturing compa-nies (Cagwin & Bouwman, 2002; Kaplan & Cooper, 1998). Kaplan and Cooper (1998)note that service companies can gain greater benefits from the application of the ABCmethod. However, there is an impression that this is only a theoretical assumption.
A large number of previous studies have concluded that ABC and ABM are effec-tive tools for providing accurate cost information in the current environment, marked byan increase in indirect costs. By using the ABC method, the resources are allocated toactivities that add value. This reduces costs and increases profits. Moreover, studieshave shown that companies which use ABC achieve much better business results thanthose who adhere to traditional cost management systems (e.g. El-Dyasty, 2007, p. 49).Hardan and Shatnawi (2013) established in their research that there was a positive rela-tionship between applying the ABC and the telecom companies’ financial performance.This leads to the second hypothesis of this article:
Economic Research-Ekonomska Istraživanja 397
Hypothesis 2: Application of activity-based TC improves financial performance (regardlessof the activity).
2.3. Total quality management
Today’s consumers demand a high level of quality (Horngren, Datar, & Rajan, 2011).The objective of determining the required quality of a product is bringing it in line withcustomer requirements. Over-designed products and products whose quality is too highwill be deemed too expensive. On the other hand, under-designed products will losetheir customers who will buy more expensive products which in their opinion give thembetter quality for their money (Chase, Aquilano, & Jacobs, 2001, p. 25).
TQM refers to the improvement of activities in the value chain of a company, aswell as the manufacturing of products and provision of services that will exceed cus-tomer’s expectations. Porter (2007, p. 43) claims that the value chain, which divides thecompany into separate activities it carries out in the field of design, manufacturing, mar-keting and distribution of its product, is the primary means of recognising the competi-tive advantage and good financial performance as well as seeking ways to improvethem. Juran and Gryna (1993, p. 6) note that the function of the quality is a series ofactivities aimed at achieving product suitability, regardless of where these activities arecarried out. Yakup and Sevil (2012) claim that any serious attempt to deal with qualityissues must take into account the costs associated with quality. The implementation ofquality costs provides input and feedback to the quality systems that are responsible forquality improvement (Tsai & Hsu, 2010).
TQM improves the quality of products and/or services at a lower cost. By improvingproduct quality, wasting of resources due to failures decreases and consequently thecosts are reduced. This makes it possible to offer a high quality product at low/reason-able prices. Harrington (1987) notes that a company can achieve better financial resultsby reducing the costs of failures rather than by improving sales. This relationshipbetween quality and cost is different compared to traditional economics theory. Thechain reaction begins with the improvement of quality, resulting in reduced costs; thisthen allows companies to offer high quality at low prices. In this way, the company willbe rewarded with a larger market share and a better competitive position in the market(Deming, 1982 in: Prajogo, 2007, p. 72).
In view of the above, it is essential to quantify the cost of quality. Spending moneyon quality improvement programmes without assessing the expected benefits leads toinvesting with little or no influence on the financial results (Schiffauerova & Thomson,2006, p. 655). According to Dale and Plunkett (1999), quality costs include costsincurred during the design, implementation, operation and maintenance of the qualitymanagement system, costs of resources used in the process of continuous improvement,costs of product and service failures and all other necessary costs and activities withoutadded value necessary to create a quality product or service. Lazibat and Matić (2000)note that the importance of quality costs arises from the bare fact that everything thathas been consumed to produce unusable effects could have been used to produce usableeffects or to improve the existing effects thereby directly increasing competitiveness.The results of a successful quality programme implementation and control are based onreliable data on the amount, structure and characteristics of all quality cost categories(Peršić & Janković, 2006, p. 487). According to Chopra and Garg (2011), quality costscan help to quantify specific quality levels and ultimately improve productivity.
398 J. Mijoč et al.
To determine the costs and revenues from the implementation of TQM, we use man-agement accounting information. A quality management system developed without anactive participation of a management accountant may lead to inadequate application andfailures in taking advantage of the potential benefits of TQM (Blocher et al., 2002,p. 226). The same authors note that TQM is used for analysing the consequences, interms of costs, of different product designs as well as for measuring and reporting thecosts and revenues from the implementation of the programme. Although TQM wasoriginally not designed as a system, i.e. a cost management method, it was quickly rea-lised that it had a significant influence on business costs and, ultimately, on the financialperformance itself (Blocher et al., 2002). Stenzel and Stenzel (2003) concur with thisopinion and note that the application of TQM affects most aspects of revenue (custom-ers) and costs (costs of goods sold, cost of the period). Shahin’s study (2011) shows thatTQM can have a strong and positive influence on financial performance and the statusof an organisation. This leads us to the third hypothesis of this article.
Hypothesis 3: Application of TQM improves financial performance (regardless of theactivity).
2.4. Integration of methods with a view to increase financial performance of thecompany
Researchers underline that some cost management methods, when applied together,enhance each other’s effect (for instance, Cooper & Kaplan, 1991). Studies on the useof ABC show that it brings benefits by providing more accurate information about prod-uct costs in a contemporary business environment. The application of this method leadsto better control of costs, cost reduction by eliminating activities that do not add value,thereby increasing profits. Ultimately, this increases financial performance. Studies alsoshow that companies that apply the ABC method outperform those that do not. Sincethe ABC method often provides more and better information than traditional cost man-agement methods, its implementation makes the use of other CCM methods easier.Many companies have realised that the ABC method greatly facilitates the applicationof the concept of quality costs (Anderson & Sedatole, 1998; Ansari, Bell, & Okano,2006; Cokins, 2001; Tsai, 1998).
The identification of quality costs presents the main difficulty in the implementationof the quality management programme. Considering that cost accounting based on thetraditional methods does not provide a quality basis for recognising these costs, it isnecessary to introduce contemporary methods of calculating costs, such as the ABCmethod. The ABC method facilitates the implementation of TQM in two ways. Firstly,it correlates costs with activities thereby improving the visibility of quality cost, thusmaking the costs of activities that are a result of poor quality visible to the organisation.In contrast, traditional accounting systems focus on organisational functions such as pro-duction, sales and administration. The management is not aware of quality costs unlessdata relating to the cost of quality are collected. Secondly, organisations that use theABC method have most of the information needed for the implementation of TQM. Acompany which successfully applies the ABC method only needs to identify the costsand activities related to quality and quality improvement and then classify these costs asdeemed necessary by this company. Companies using the traditional accounting systemsneed to carry out further analysis in order to identify and measure quality costs and pre-pare reports on those costs. Smith and Dikolli (1995) argue that TQM, the ABC method
Economic Research-Ekonomska Istraživanja 399
and customer profitability analysis should be used simultaneously to take into accountall aspects of customer focus.
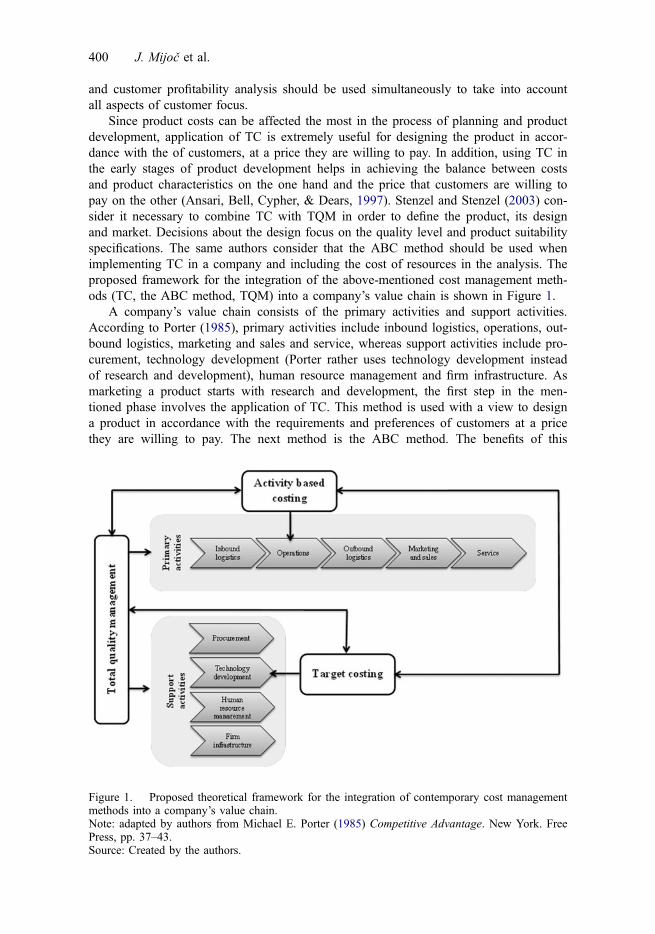
Since product costs can be affected the most in the process of planning and productdevelopment, application of TC is extremely useful for designing the product in accor-dance with the of customers, at a price they are willing to pay. In addition, using TC inthe early stages of product development helps in achieving the balance between costsand product characteristics on the one hand and the price that customers are willing topay on the other (Ansari, Bell, Cypher, & Dears, 1997). Stenzel and Stenzel (2003) con-sider it necessary to combine TC with TQM in order to define the product, its designand market. Decisions about the design focus on the quality level and product suitabilityspecifications. The same authors consider that the ABC method should be used whenimplementing TC in a company and including the cost of resources in the analysis. Theproposed framework for the integration of the above-mentioned cost management meth-ods (TC, the ABC method, TQM) into a company’s value chain is shown in Figure 1.
A company’s value chain consists of the primary activities and support activities.According to Porter (1985), primary activities include inbound logistics, operations, out-bound logistics, marketing and sales and service, whereas support activities include pro-curement, technology development (Porter rather uses technology development insteadof research and development), human resource management and firm infrastructure. Asmarketing a product starts with research and development, the first step in the men-tioned phase involves the application of TC. This method is used with a view to designa product in accordance with the requirements and preferences of customers at a pricethey are willing to pay. The next method is the ABC method. The benefits of this
Figure 1. Proposed theoretical framework for the integration of contemporary cost managementmethods into a company’s value chain.Note: adapted by authors from Michael E. Porter (1985) Competitive Advantage. New York. FreePress, pp. 37–43.Source: Created by the authors.
400 J. Mijoč et al.

method are mostly obtained in the production phase (operations). The ABC method isused for determining the overhead costs by cost objects. In this way, one avoids mis-takes in determining the selling price of products and/or services. TQM refers to all theactivities in a company’s value chain. The application of this method improves the qual-ity of processes and products. Costs, quality and the speed at which customer needs aremet are essential factors for survival in the market. The combination of these methodscan help a company to achieve and maintain competitive advantage in the market, pro-viding systematic implementation. The last hypothesis of this article reads as follows:
Hypothesis 4: Simultaneous application of several CCM methods improves financialperformance more than the use of a single method.
The four research hypotheses are tested in the sections that follow. A detaileddescription of the methodology is followed by results and discussion.
3. Research methodology
The study involved Croatian companies, i.e. those companies whose securities areadmitted to trading on a regulated market (Zagreb Stock Exchange). Banks, investmentfunds, insurance companies, cities and companies in receivership were not included inthis study. According to the Croatian Financial Services Supervisory Agency, in late2011, there were 197 active companies in Croatia whose securities were traded on theZagreb Stock Exchange. The target group of this study consisted of 172 companies. Astructured questionnaire was sent by post and by email to 172 companies. It wasaddressed to the head of accounting/chief financial officer of the company. Forty-eightcompanies participated in the study (33 questionnaires were sent back by post and fur-ther 15 via email); 46 of them were used for this survey. The effective response ratewas 27%, which is considered satisfactory.
3.1. Description of the sample
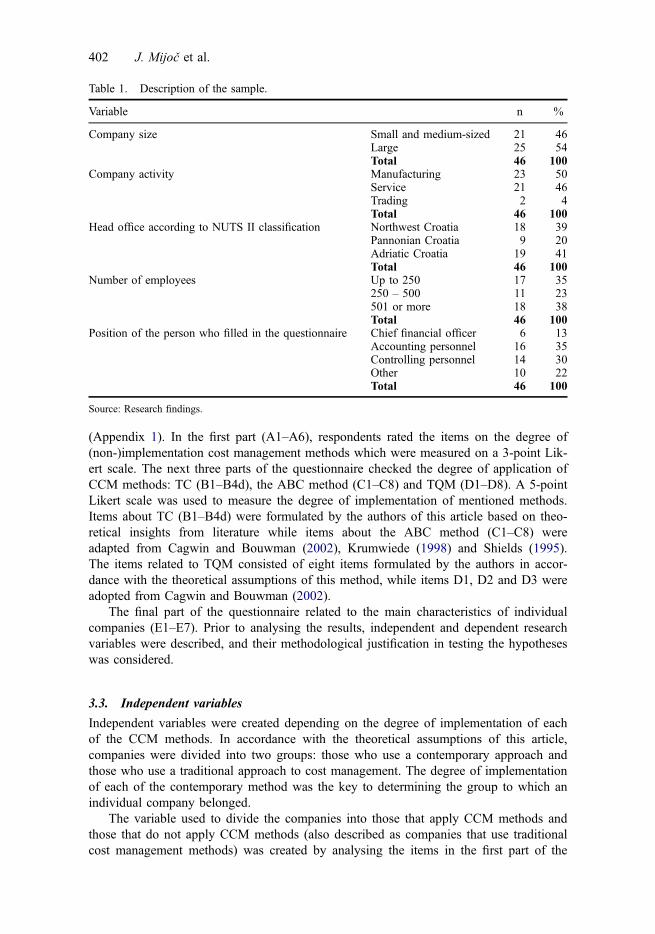
Table 1 gives an overview of the main characteristics of the sample: size, activity, headoffice, number of employees and a list of duties performed by the person who partici-pated in the study.
Large companies account for the largest share of the sample (54%), whereas smalland medium-sized companies account for 46% of the sample. On average, the surveyedcompanies had 850 employees. Fifty per cent of these companies are engaged in pro-duction activities, 46% are in a service business, while only 4% are engaged in whole-sale and retail trading.
For the purpose of analysis, in this variable, two modalities were merged into onemeaning that service and trading companies have been described as non-manufacturing.The position of the person who filled in the questionnaire was also analysed as thequestionnaire was addressed to the Finance/Accounting Department. The required profileof respondents accounted for the largest share of participants (78% in total), while 22%of the questionnaires were filled in by other employee profiles (e.g. head of develop-ment department, corporate communications manager, assistant general manager, etc.).
3.2. Questionnaire
The questionnaire was designed to test and compare the application of CCM methods inCroatian companies. It was divided into five parts with a total of 46 questions
Economic Research-Ekonomska Istraživanja 401
(Appendix 1). In the first part (A1–A6), respondents rated the items on the degree of(non-)implementation cost management methods which were measured on a 3-point Lik-ert scale. The next three parts of the questionnaire checked the degree of application ofCCM methods: TC (B1–B4d), the ABC method (C1–C8) and TQM (D1–D8). A 5-pointLikert scale was used to measure the degree of implementation of mentioned methods.Items about TC (B1–B4d) were formulated by the authors of this article based on theo-retical insights from literature while items about the ABC method (C1–C8) wereadapted from Cagwin and Bouwman (2002), Krumwiede (1998) and Shields (1995).The items related to TQM consisted of eight items formulated by the authors in accor-dance with the theoretical assumptions of this method, while items D1, D2 and D3 wereadopted from Cagwin and Bouwman (2002).
The final part of the questionnaire related to the main characteristics of individualcompanies (E1–E7). Prior to analysing the results, independent and dependent researchvariables were described, and their methodological justification in testing the hypotheseswas considered.
3.3. Independent variables
Independent variables were created depending on the degree of implementation of eachof the CCM methods. In accordance with the theoretical assumptions of this article,companies were divided into two groups: those who use a contemporary approach andthose who use a traditional approach to cost management. The degree of implementationof each of the contemporary method was the key to determining the group to which anindividual company belonged.
The variable used to divide the companies into those that apply CCM methods andthose that do not apply CCM methods (also described as companies that use traditionalcost management methods) was created by analysing the items in the first part of the
Table 1. Description of the sample.
Variable n %
Company size Small and medium-sized 21 46Large 25 54Total 46 100
Company activity Manufacturing 23 50Service 21 46Trading 2 4Total 46 100
Head office according to NUTS II classification Northwest Croatia 18 39Pannonian Croatia 9 20Adriatic Croatia 19 41Total 46 100
Number of employees Up to 250 17 35250 – 500 11 23501 or more 18 38Total 46 100
Position of the person who filled in the questionnaire Chief financial officer 6 13Accounting personnel 16 35Controlling personnel 14 30Other 10 22Total 46 100
Source: Research findings.
402 J. Mijoč et al.
questionnaire (A4–A6). Companies with a contemporary approach to cost managementwere defined as those that in addition to using traditional methods1, either partially orfully used at least two CCM methods. Companies with traditional approach are thosewhich use only traditional cost management methods or those that simultaneously applytraditional methods and to some extent one of the contemporary methods. Table 2 is aresult of the described criteria used for dividing the companies into these two groups.
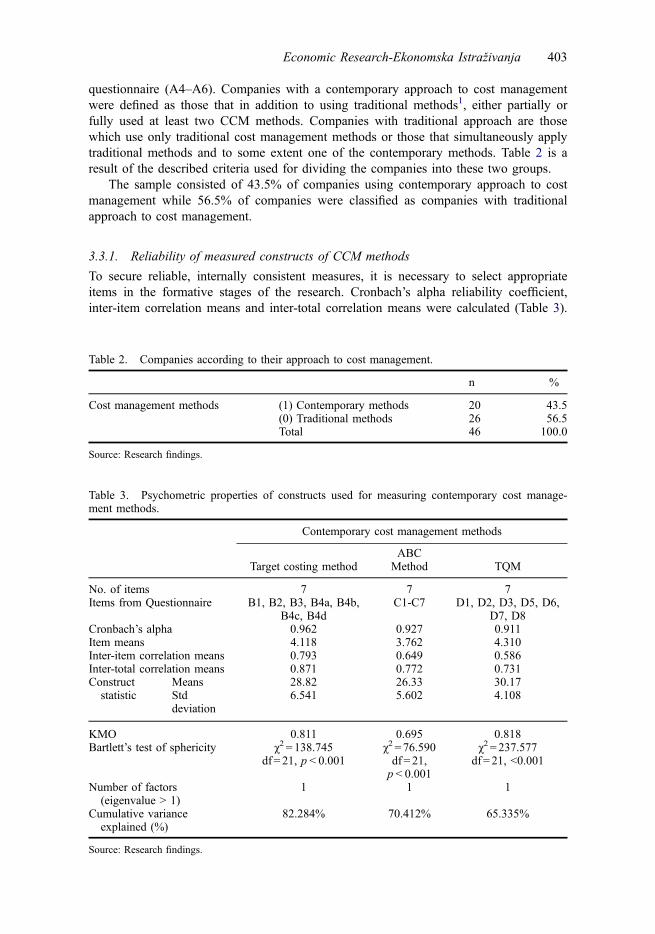
The sample consisted of 43.5% of companies using contemporary approach to costmanagement while 56.5% of companies were classified as companies with traditionalapproach to cost management.
3.3.1. Reliability of measured constructs of CCM methods
To secure reliable, internally consistent measures, it is necessary to select appropriateitems in the formative stages of the research. Cronbach’s alpha reliability coefficient,inter-item correlation means and inter-total correlation means were calculated (Table 3).
Table 2. Companies according to their approach to cost management.
n %
Cost management methods (1) Contemporary methods 20 43.5(0) Traditional methods 26 56.5Total 46 100.0
Source: Research findings.
Table 3. Psychometric properties of constructs used for measuring contemporary cost manage-ment methods.
Contemporary cost management methods
Target costing methodABC
Method TQM
No. of items 7 7 7Items from Questionnaire B1, B2, B3, B4a, B4b,
B4c, B4dC1-C7 D1, D2, D3, D5, D6,
D7, D8Cronbach’s alpha 0.962 0.927 0.911Item means 4.118 3.762 4.310Inter-item correlation means 0.793 0.649 0.586Inter-total correlation means 0.871 0.772 0.731Constructstatistic
Means 28.82 26.33 30.17Stddeviation
6.541 5.602 4.108
KMO 0.811 0.695 0.818Bartlett’s test of sphericity χ2 = 138.745 χ2 = 76.590 χ2 = 237.577
df = 21, p < 0.001 df = 21,p < 0.001
df= 21, <0.001
Number of factors(eigenvalue > 1)
1 1 1
Cumulative varianceexplained (%)
82.284% 70.412% 65.335%
Source: Research findings.
Economic Research-Ekonomska Istraživanja 403
Cronbach’s alpha is used for measuring internal consistency of each individual con-struct. Cronbach’s equation for alpha is as follows:
a ¼ n
n� 11�
Ps2i
s2x
� �
α – Cronbach’s alpha coefficientn – number of itemss2i – variance of the i items2x – variance of the observed total test scoresAccording to Nunnally (1979), a score of 0.7 or higher is considered an acceptable reli-ability coefficient for Cronbach’s alpha. However, coefficients above 0.8 are desirable.Cronbach’s alpha reliability coefficient for all three constructs is extremely high (> 0.9)and is considered that associated items measure the constructs extremely well. Moreover,according to Nunnally (1979), values above 0.3 are considered as an acceptable correla-tion between items. The average correlation between items for all measured constructs isvery high (0.793, 0.649 and 0.586), and they are considered as acceptable for each con-struct. In addition, all items in reliable scales should be connected with the measuredconstruct with correlation values above 0.5. The data in Table 3 confirm another psycho-metric feature of the constructs, since each construct meets the recommended rule andtheir average for TC amounts to 0.871, for the ABC method 0.772 and for TQM 0.731.
An exploratory factor analysis was performed to check whether the measured con-structs are unidimensional. The use of factor analysis is justified since item correlationsmatrices generate values above 0.5, and the values of the Bartlett test are statisticallysignificant with acceptable results of KMO test. All manifest variables with eigenvalueshigher than 1 grouped into a single component, which explains 82.28% of the variancefor the construct TC, 70.41% for the ABC method and 65.34% for TQM.
Previous procedures have shown that measured constructs can be considered reliableand unidimensional. Based on the results, it is possible to use the proposed factors asmanifest variables for measuring the application level of each of the CCM methods (theTC method, the ABC Method, TQM). Three composite independent variables werecreated based on item average of each of the proposed construct.
3.4. Dependent variables – company’s financial performance indicators
The last question in the questionnaire represents dependent variables of this study.Respondents were asked to enter financial performance indicators for the past threeyears. In this article we have used the 2011 data2 on financial performance indicatorsfrom BON-1 form of the surveyed companies: return on assets (ROA), net profit mar-gin, revenue-to-expense ratio and profit per employee. Table 4 shows the descriptivedata for these four indicators.
In the text that follows, each of these financial indicators is considered as a depen-dent variable, which measures the correlation of the contemporary approach to costmanagement (methods), seeking to confirm or refute individual research hypothesesabove. To measure the influence of the contemporary approach to cost management, wehave used a regression analysis for which we have created a single (composite) depen-dent variable. We have examined the internal consistency of the construct financial per-formance of the company in whose construction we used standardised values.
404 J. Mijoč et al.
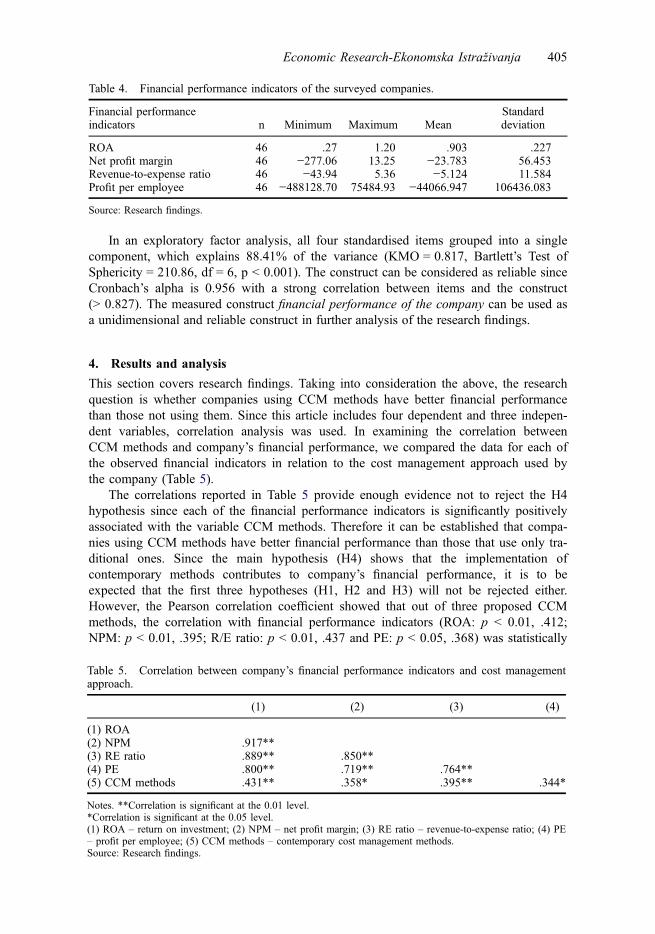
In an exploratory factor analysis, all four standardised items grouped into a singlecomponent, which explains 88.41% of the variance (KMO = 0.817, Bartlett’s Test ofSphericity = 210.86, df = 6, p < 0.001). The construct can be considered as reliable sinceCronbach’s alpha is 0.956 with a strong correlation between items and the construct(> 0.827). The measured construct financial performance of the company can be used asa unidimensional and reliable construct in further analysis of the research findings.
4. Results and analysis
This section covers research findings. Taking into consideration the above, the researchquestion is whether companies using CCM methods have better financial performancethan those not using them. Since this article includes four dependent and three indepen-dent variables, correlation analysis was used. In examining the correlation betweenCCM methods and company’s financial performance, we compared the data for each ofthe observed financial indicators in relation to the cost management approach used bythe company (Table 5).
The correlations reported in Table 5 provide enough evidence not to reject the H4hypothesis since each of the financial performance indicators is significantly positivelyassociated with the variable CCM methods. Therefore it can be established that compa-nies using CCM methods have better financial performance than those that use only tra-ditional ones. Since the main hypothesis (H4) shows that the implementation ofcontemporary methods contributes to company’s financial performance, it is to beexpected that the first three hypotheses (H1, H2 and H3) will not be rejected either.However, the Pearson correlation coefficient showed that out of three proposed CCMmethods, the correlation with financial performance indicators (ROA: p < 0.01, .412;NPM: p < 0.01, .395; R/E ratio: p < 0.01, .437 and PE: p < 0.05, .368) was statistically
Table 4. Financial performance indicators of the surveyed companies.
Financial performanceindicators n Minimum Maximum Mean
Standarddeviation
ROA 46 .27 1.20 .903 .227Net profit margin 46 −277.06 13.25 −23.783 56.453Revenue-to-expense ratio 46 −43.94 5.36 −5.124 11.584Profit per employee 46 −488128.70 75484.93 −44066.947 106436.083
Source: Research findings.
Table 5. Correlation between company’s financial performance indicators and cost managementapproach.
(1) (2) (3) (4)
(1) ROA(2) NPM .917**(3) RE ratio .889** .850**(4) PE .800** .719** .764**(5) CCM methods .431** .358* .395** .344*
Notes. **Correlation is significant at the 0.01 level.*Correlation is significant at the 0.05 level.(1) ROA – return on investment; (2) NPM – net profit margin; (3) RE ratio – revenue-to-expense ratio; (4) PE– profit per employee; (5) CCM methods – contemporary cost management methods.Source: Research findings.
Economic Research-Ekonomska Istraživanja 405
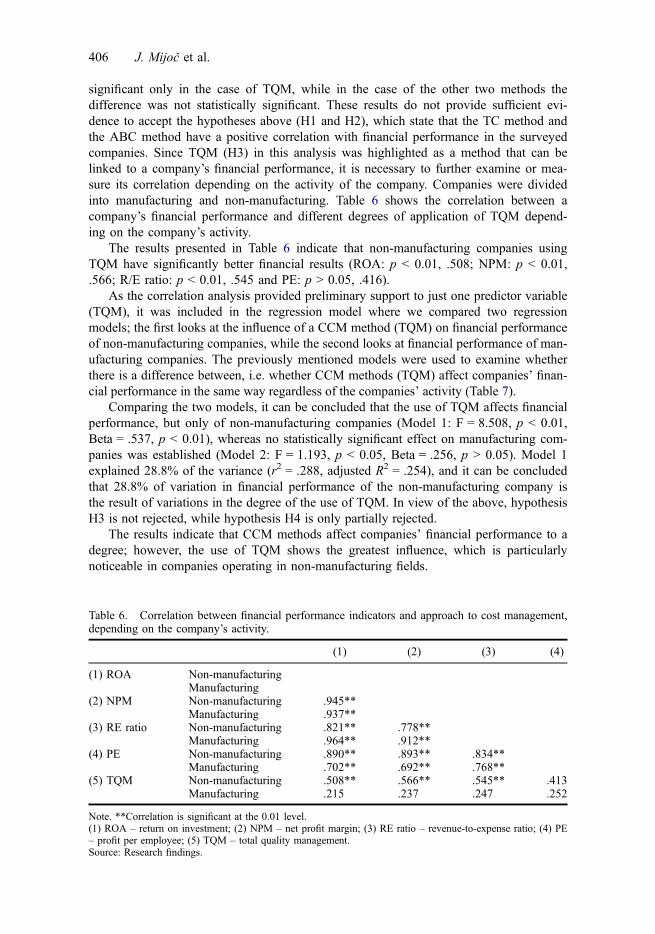
significant only in the case of TQM, while in the case of the other two methods thedifference was not statistically significant. These results do not provide sufficient evi-dence to accept the hypotheses above (H1 and H2), which state that the TC method andthe ABC method have a positive correlation with financial performance in the surveyedcompanies. Since TQM (H3) in this analysis was highlighted as a method that can belinked to a company’s financial performance, it is necessary to further examine or mea-sure its correlation depending on the activity of the company. Companies were dividedinto manufacturing and non-manufacturing. Table 6 shows the correlation between acompany’s financial performance and different degrees of application of TQM depend-ing on the company’s activity.
The results presented in Table 6 indicate that non-manufacturing companies usingTQM have significantly better financial results (ROA: p < 0.01, .508; NPM: p < 0.01,.566; R/E ratio: p < 0.01, .545 and PE: p > 0.05, .416).
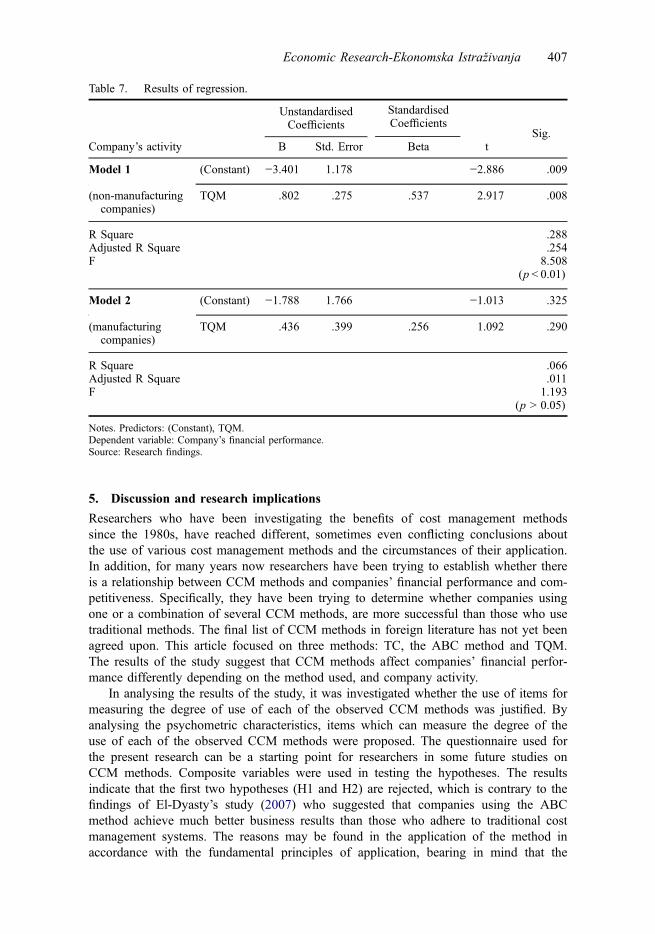
As the correlation analysis provided preliminary support to just one predictor variable(TQM), it was included in the regression model where we compared two regressionmodels; the first looks at the influence of a CCM method (TQM) on financial performanceof non-manufacturing companies, while the second looks at financial performance of man-ufacturing companies. The previously mentioned models were used to examine whetherthere is a difference between, i.e. whether CCM methods (TQM) affect companies’ finan-cial performance in the same way regardless of the companies’ activity (Table 7).
Comparing the two models, it can be concluded that the use of TQM affects financialperformance, but only of non-manufacturing companies (Model 1: F = 8.508, p < 0.01,Beta = .537, p < 0.01), whereas no statistically significant effect on manufacturing com-panies was established (Model 2: F = 1.193, p < 0.05, Beta = .256, p > 0.05). Model 1explained 28.8% of the variance (r2 = .288, adjusted R2 = .254), and it can be concludedthat 28.8% of variation in financial performance of the non-manufacturing company isthe result of variations in the degree of the use of TQM. In view of the above, hypothesisH3 is not rejected, while hypothesis H4 is only partially rejected.
The results indicate that CCM methods affect companies’ financial performance to adegree; however, the use of TQM shows the greatest influence, which is particularlynoticeable in companies operating in non-manufacturing fields.
Table 6. Correlation between financial performance indicators and approach to cost management,depending on the company’s activity.
(1) (2) (3) (4)
(1) ROA Non-manufacturingManufacturing
(2) NPM Non-manufacturing .945**Manufacturing .937**
(3) RE ratio Non-manufacturing .821** .778**Manufacturing .964** .912**
(4) PE Non-manufacturing .890** .893** .834**Manufacturing .702** .692** .768**
(5) TQM Non-manufacturing .508** .566** .545** .413Manufacturing .215 .237 .247 .252
Note. **Correlation is significant at the 0.01 level.(1) ROA – return on investment; (2) NPM – net profit margin; (3) RE ratio – revenue-to-expense ratio; (4) PE– profit per employee; (5) TQM – total quality management.Source: Research findings.
406 J. Mijoč et al.
5. Discussion and research implications
Researchers who have been investigating the benefits of cost management methodssince the 1980s, have reached different, sometimes even conflicting conclusions aboutthe use of various cost management methods and the circumstances of their application.In addition, for many years now researchers have been trying to establish whether thereis a relationship between CCM methods and companies’ financial performance and com-petitiveness. Specifically, they have been trying to determine whether companies usingone or a combination of several CCM methods, are more successful than those who usetraditional methods. The final list of CCM methods in foreign literature has not yet beenagreed upon. This article focused on three methods: TC, the ABC method and TQM.The results of the study suggest that CCM methods affect companies’ financial perfor-mance differently depending on the method used, and company activity.
In analysing the results of the study, it was investigated whether the use of items formeasuring the degree of use of each of the observed CCM methods was justified. Byanalysing the psychometric characteristics, items which can measure the degree of theuse of each of the observed CCM methods were proposed. The questionnaire used forthe present research can be a starting point for researchers in some future studies onCCM methods. Composite variables were used in testing the hypotheses. The resultsindicate that the first two hypotheses (H1 and H2) are rejected, which is contrary to thefindings of El-Dyasty’s study (2007) who suggested that companies using the ABCmethod achieve much better business results than those who adhere to traditional costmanagement systems. The reasons may be found in the application of the method inaccordance with the fundamental principles of application, bearing in mind that the
Table 7. Results of regression.
Company’s activity
UnstandardisedCoefficients
StandardisedCoefficients
tSig.
B Std. Error Beta
Model 1 (Constant) −3.401 1.178 −2.886 .009
(non-manufacturingcompanies)
TQM .802 .275 .537 2.917 .008
R Square .288Adjusted R Square .254F 8.508
(p < 0.01)
Model 2 (Constant) −1.788 1.766 −1.013 .325
(manufacturingcompanies)
TQM .436 .399 .256 1.092 .290
R Square .066Adjusted R Square .011F 1.193
(p > 0.05)
Notes. Predictors: (Constant), TQM.Dependent variable: Company’s financial performance.Source: Research findings.
Economic Research-Ekonomska Istraživanja 407
benefits of this method (better financial performance) cannot be expected if it is usedinadequately. Management support and employee involvement in the implementation ofthe method, commitment to improving products and processes, and achieving andsustaining customer satisfaction are some of the factors necessary for the successfulimplementation of and achievement of positive effects from CCM methods.
After not being rejected by the correlation analysis, the third research hypothesis(H3) was not rejected by the regression analysis either. This gives us grounds for con-cluding that there is significant statistical evidence that TQM is correlated with compa-nies’ financial performance. This relationship was examined further by testing thedifference in the financial performance of companies depending on the companies’activity. Regression analysis indicates that the influence of TQM on financial perfor-mance is statistically significant, but only in the case of non-manufacturing companies.Finally, if we look at all CCM methods and their influence on the financial performanceof companies (H4), it is possible to observe a statistically significant correlation. How-ever, the fact that this hypothesis was not rejected should be taken with caution becausethe present study did not confirm the correlation of TC and the ABC method with thefinancial performance of companies, and the results show that the most effective method(i.e. the most cost-effective investment for the management) is TQM.
In order to further investigate the influence of CCM methods on companies and theirperformance, future research should focus on the testing of longitudinal hypothesesabout the influence of individual cost management methods on financial performance ofcompanies as well as further testing of the proposed measured constructs and theirpossible improvement.
AcknowledgementThis work was supported by research grant from the Josip Juraj Strossmyer University of Osijek.
Notes1. Total absorption costing, variable costing and standard costing.2. The 2011 data were used because the primary data were collected in the period between
September 2011 and February 2012. In accordance with the period in which the data werecollected, we used publicly available financial indicators for 2011.
ReferencesAbdel-Kader, M., & Luther, R. (2008). The impact of firm characteristics on management account-
ing practices: A UK-based empirical analysis. The British Accounting Review, 40, 2–27.Agrawal, S. P., Mehra, S., & Siegel, P. H. (1998). Cost management system: An operational over-
view. Managerial Finance, 24, 60–78.Anderson, S. W., & Sedatole, K. (1998). Designing quality into products: The use of accounting
data in new product development. Accounting Horizons, 12, 213–233.Ansari, S. L., Bell, J. E., Cypher, J. H., & Dears, P. H. (1997). Target costing: The next frontier
in strategic cost management. New York, NY: McGraw Hill.Ansari, S., Bell, J., & Okano, H. (2006). Target costing: Uncharted research territory. Handbooks
of Management Accounting Research, 2, 507–530.Blocher, E. J., Chen, K. H., & Lin, T. W. (2002). Cost management: A strategic emphasis.
Boston, MA: McGraw-Hill/Irwin.Cagwin, D., & Bouwman, M. J. (2002). The association between activity-based costing and improve-
ment in financial performance. Management Accounting Research 13. Retrieved May 16, 2009,from www.offtech.com.au/abc/ABC_PDF/1999-04.pdf
408 J. Mijoč et al.

Chase, R. B., Aquilano, N. J., & Jacobs, F. R. (2001). Operations management for competitiveadvantage. Boston, MA: McGraw-Hill/Irwin.
Chenhall, R. H. (2004). The role of cognitive and affecting conflict in early implementation ofactivity-based cost management. Behavioral Research in Accounting, 16, 19–44.
Chopra, A., & Garg, D. (2011). Behavior patterns of quality cost categories. The TQM Journal,23, 510–515.
Cokins, G. (2001). Activity-based cost management: An executive’s guide. New York, NY: Wiley.Cooper, R. (1995). When lean enterprises collide; competing through competition. Boston, MA:
Harvard Business School Press.Copper, R., & Kaplan, R. S. (1991). The design of cost management system. Text, cases and read-
ings. Englewood Cliffs, NJ: Prentice-Hall.Cooper, R., & Slagmulder, R. (1999). Develop profitable new products with target costing. Sloan
Management Review, 40, 23–33.Cooper, R., & Slagmulder, R. (2002). Target costing for new product development: Product-level
target costing. Journal of Cost Management, 16(July/August), 5–12.Dale, B. G., & Plunkett, J. J. (1999). Quality costing. Hampshire: Gower Publishing.Dekker, H. (2003). Value chain analysis in inter firm relationship: A field study. Management
Accounting Research, 14(1), 1–23.Dekker, H., & Smidt, P. (2003). A survey of the adoption and use of target costing in Dutch
firms. International Journal of Production Economics, 84, 293–305.Deming, W. E. (1982). Quality, productivity, and competitive position. Cambridge: Massachusetts
Institute of Technology.De Zoysa, A., & KanthiHerath, S. (2007). Standard costing in Japanese firms: Reexamination of
its significance in the new manufacturing environment. Industrial Management & Data Sys-tems, 107, 271–283.
El-Dyasty, M. M. (2007). A framework to accomplish strategic cost management. SSRN.Retrieved January 27, 2013, from http://papers.ssrn.com/sol3/papers.cfm?abstract_id=704201
Gagne, M. L., & Discenza, R. (1995). Target costing. Journal of Business & Industrial Marketing,10, 16–22.
Guilding, C., Cravens, K. S., & Tayles, M. (2000). An international comparison of strategic man-agement accounting practices. Management Accounting Research, 11, 113–135.
Hardan, A. S., & Shatnawi, T. M. (2013). Impact of applying the ABC on improving the financial per-formance in telecom companies. International Journal of Business and Management, 8, 48–61.
Harrington, H. J. (1987). Poor-quality cost. Milwaukee, WI: ASQC Quality Press.Helms, M. M., Ettkin, L. P., Baxter, J. T., & Gordon, M. W. (2005). Managerial implications of
target costing. Competitiveness Review, 15, 49–56.Hilton, R. W., Maher, M. W., & Selto, F. H. (2000). Cost management: Strategies for business
decisions. Boston, MA: McGraw-Hill/Irwin.Horngren, C. T., Datar, S. M., & Rajan, M. (2011). Cost accounting: A managerial emphasis
(14th ed.). New Jersey: Prentice Hall.Huang, H. C., Lai, M. C., Kao, M. C., & Chen, Y. C. (2012). Target costing, business model
innovation, and firm performance: An empirical analysis of Chinese firms. Canadian Journalof Administrative Sciences/Revue Canadienne des Sciences de l’Administration, 29, 322–335.
Juran, J. M., & Gryna, F. M. (1993). Planiranje i analiza kvalitete: Od razvoja proizvoda doupotrebe [Quality planning and analysis: From product development through use] (3rd ed.).Zagreb: MATE.
Kaplan, R. S. (1984). The evolution of management accounting. The Accounting Review, 59, 390–418.Kaplan, R. S., & Cooper, R. (1998). Cost and effect: Using integrated systems to drive profitabil-
ity and performance. Boston, MA: Harvard Business School Press.Karić, M. (2008). Upravljanje troškovima [Cost management]. Osijek: Ekonomski fakultet u
Osijeku.Kennedy, T., & Affleck-Graves, J. (2001). The impact of activity-based costing techniques on firm
performance. Journal of Management Accounting Research, 13, 19–45.Krumwiede, K. R. (1998). ABC: Why it’s tried and how it succeeds. Management Accounting,
79, 32–38.Lazibat, T., & Matić, B. (2000). Troškovi kvalitete kao čimbenik povećanja konkurentnosti na
domaćem i svjetskom tržištu [Quality costs as a factor of increasing competitiveness onnational and international markets]. Ekonomski pregled, 51, 1334–1351.
Economic Research-Ekonomska Istraživanja 409
McNair, C., Polutnik, L., & Silvi, R. (2001). Cost management and value creation: The missinglink. European Accounting Review, 10, 33–50.
Mehra, S., & Agrawal, S. P. (2003). Total quality as a new global competitive strategy. Interna-tional Journal of Quality & Reliability Management, 20, 1009–1025.
Monden, Y., & Hamada, K. (1991). Target costing and kaizen costing in Japanese automobilecompanies. Journal of Management Accounting Research, 3, 16–34.
Peršić, M., & Janković, S. (2006). Menadžersko računovodstvo hotela [Managerial accounting forhotels]. Zagreb: Hrvatska zajednica računovođa i financijskih djelatnika.
Porter, M. E. (1985). Competitive advantage: Creating and sustaining superior performance. NewYork, NY: The Free Press.
Porter, M. E. (2007). Konkurentska prednost: Postizanje i održavanje vrhunskog poslovanja[Competitive advantage: creating and sustaining superior performance]. Zagreb: Masmedia.
Prajogo, D. I. (2007). The relationship between competitive strategies and product quality. Indus-trial Management & Data Systems, 107, 69–83.
Schiffauerova, A., & Thomson, V. (2006). A review of research on cost of quality models andbest practices. International Journal of Quality & Reliability Management, 23. RetrievedNovember 26, 2009, from www.emeraldinsight.com/0265-671X.htm
Shahin, A. (2011). An investigation on the influence of total quality management on financial per-formance the case of Boutan industrial corporation. International Journal of Business andSociety Science, 2, 105–112.
Shields, D., & Young, S. M. (1989). A behavioral model for implementing cost management sys-tems. Journal of Cost Management, 3, 17–27.
Shields, M. D. (1995). An empirical analysis of firms’ implementation experiences with activity-based costing. Journal of Management Accounting Research, 7(1), 148–165.
Smith, M., & Dikolli, S. (1995). Customer profitability analysis: An activity-based costingapproach. Managerial Auditing Journal, 10, 3–7.
Stenzel, C., & Stenzel, J. (2003). Essentials of cost management. New York, NY: Wiley.Tanaka, Z. (1993). Target costing at Toyota. Journal of Cost Management, 7, 4–11.Tsai, W. H. (1998). Quality cost measurement under activity-based costing. International Journal
of Quality & Reliability Management, 15. Retrieved November 26, 2009, from http://www.emeraldinsight.com/10.1108/02656719810218202
Tsai, W. H., & Hsu, W. (2010). A novel hybrid model based on DEMATEL and ANP for selecting costof quality model development. Total Quality Management and Business Excellence, 21, 439–456.
Yakup, D., & Sevil, Z. (2012). A theoretical approach to the concept of the costs of quality. Inter-national Journal of Business and Social Science, 3, 83–86.
Appendix 1: Questionnaire about the use of cost management methods in theRepublic of Croatia
Dear Sir/Madam, the following questions relate to your company’s cost management practices.The data obtained in this study will be categorised by company activity and size and used as suchfor comparing various categories of companies included in this survey. Your personal data will betemporarily stored in our records and kept in accordance with the Personal Data Protection Act(Official Gazette 103/03, 118/06, 41/08). The data will be deleted upon completion of the study.Thank you for your cooperation!
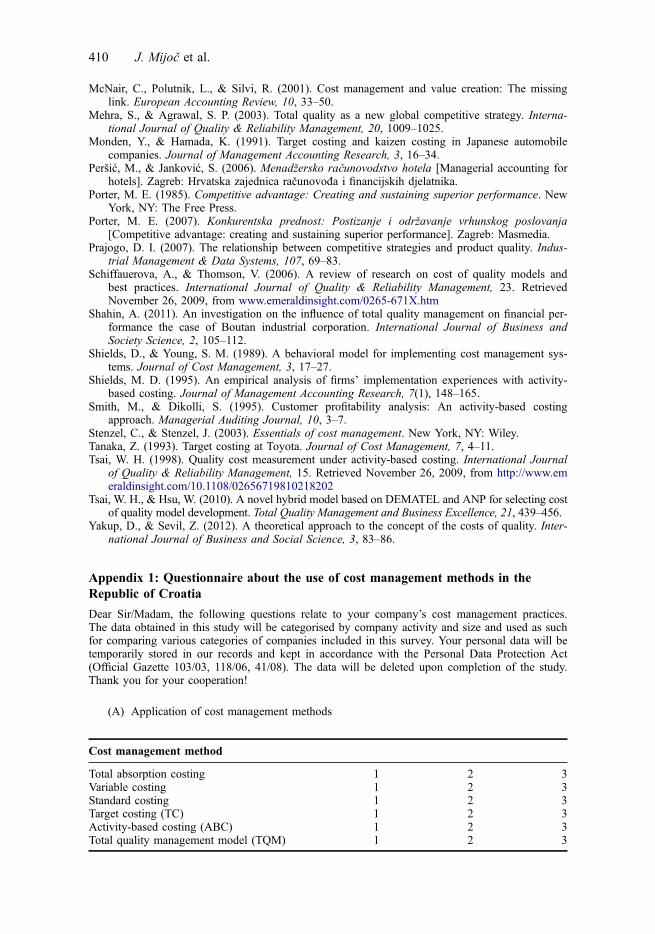
(A) Application of cost management methods
Cost management method
Total absorption costing 1 2 3Variable costing 1 2 3Standard costing 1 2 3Target costing (TC) 1 2 3Activity-based costing (ABC) 1 2 3Total quality management model (TQM) 1 2 3
410 J. Mijoč et al.
If your company uses one or more of the following cost management methods, specify theextent of its/their application. Levels of agreement are as follows: 1 – not applied, 2 – applied par-tially, 3 – applied fully:
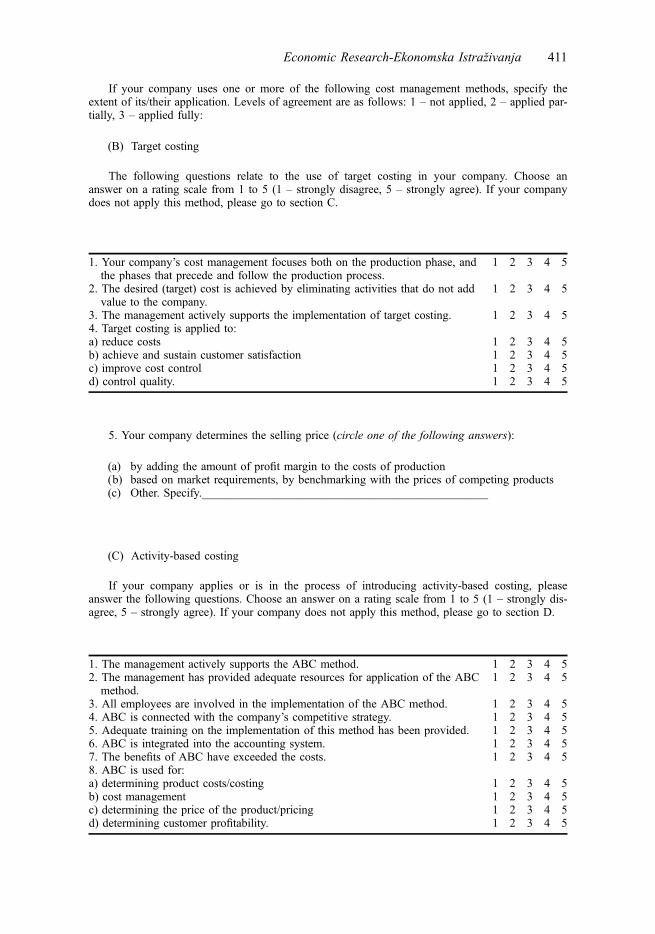
(B) Target costing
The following questions relate to the use of target costing in your company. Choose ananswer on a rating scale from 1 to 5 (1 – strongly disagree, 5 – strongly agree). If your companydoes not apply this method, please go to section C.
5. Your company determines the selling price (circle one of the following answers):
(a) by adding the amount of profit margin to the costs of production(b) based on market requirements, by benchmarking with the prices of competing products(c) Other. Specify.________________________________________________
(C) Activity-based costing
If your company applies or is in the process of introducing activity-based costing, pleaseanswer the following questions. Choose an answer on a rating scale from 1 to 5 (1 – strongly dis-agree, 5 – strongly agree). If your company does not apply this method, please go to section D.
1. Your company’s cost management focuses both on the production phase, andthe phases that precede and follow the production process.
1 2 3 4 5
2. The desired (target) cost is achieved by eliminating activities that do not addvalue to the company.
1 2 3 4 5
3. The management actively supports the implementation of target costing. 1 2 3 4 54. Target costing is applied to:a) reduce costs 1 2 3 4 5b) achieve and sustain customer satisfaction 1 2 3 4 5c) improve cost control 1 2 3 4 5d) control quality. 1 2 3 4 5
1. The management actively supports the ABC method. 1 2 3 4 52. The management has provided adequate resources for application of the ABCmethod.
1 2 3 4 5
3. All employees are involved in the implementation of the ABC method. 1 2 3 4 54. ABC is connected with the company’s competitive strategy. 1 2 3 4 55. Adequate training on the implementation of this method has been provided. 1 2 3 4 56. ABC is integrated into the accounting system. 1 2 3 4 57. The benefits of ABC have exceeded the costs. 1 2 3 4 58. ABC is used for:a) determining product costs/costing 1 2 3 4 5b) cost management 1 2 3 4 5c) determining the price of the product/pricing 1 2 3 4 5d) determining customer profitability. 1 2 3 4 5
Economic Research-Ekonomska Istraživanja 411
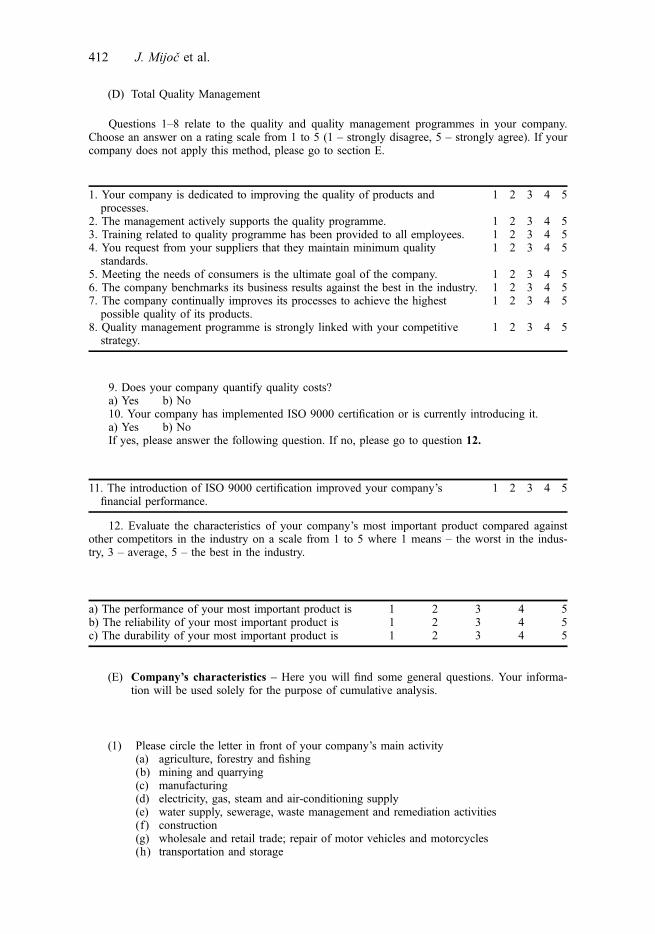
(D) Total Quality Management
Questions 1–8 relate to the quality and quality management programmes in your company.Choose an answer on a rating scale from 1 to 5 (1 – strongly disagree, 5 – strongly agree). If yourcompany does not apply this method, please go to section E.
9. Does your company quantify quality costs?a) Yes b) No10. Your company has implemented ISO 9000 certification or is currently introducing it.a) Yes b) NoIf yes, please answer the following question. If no, please go to question 12.
12. Evaluate the characteristics of your company’s most important product compared againstother competitors in the industry on a scale from 1 to 5 where 1 means – the worst in the indus-try, 3 – average, 5 – the best in the industry.
(E) Company’s characteristics – Here you will find some general questions. Your informa-tion will be used solely for the purpose of cumulative analysis.
(1) Please circle the letter in front of your company’s main activity(a) agriculture, forestry and fishing(b) mining and quarrying(c) manufacturing(d) electricity, gas, steam and air-conditioning supply(e) water supply, sewerage, waste management and remediation activities(f) construction(g) wholesale and retail trade; repair of motor vehicles and motorcycles(h) transportation and storage
1. Your company is dedicated to improving the quality of products andprocesses.
1 2 3 4 5
2. The management actively supports the quality programme. 1 2 3 4 53. Training related to quality programme has been provided to all employees. 1 2 3 4 54. You request from your suppliers that they maintain minimum qualitystandards.
1 2 3 4 5
5. Meeting the needs of consumers is the ultimate goal of the company. 1 2 3 4 56. The company benchmarks its business results against the best in the industry. 1 2 3 4 57. The company continually improves its processes to achieve the highestpossible quality of its products.
1 2 3 4 5
8. Quality management programme is strongly linked with your competitivestrategy.
1 2 3 4 5
11. The introduction of ISO 9000 certification improved your company’sfinancial performance.
1 2 3 4 5
a) The performance of your most important product is 1 2 3 4 5b) The reliability of your most important product is 1 2 3 4 5c) The durability of your most important product is 1 2 3 4 5
412 J. Mijoč et al.
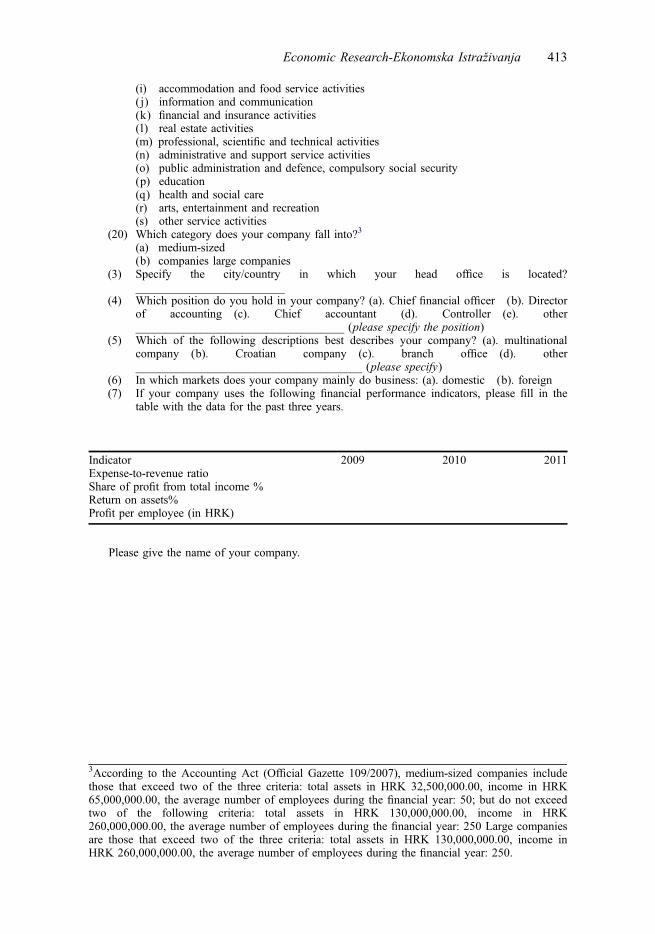
(i) accommodation and food service activities( j) information and communication(k) financial and insurance activities(l) real estate activities(m) professional, scientific and technical activities(n) administrative and support service activities(o) public administration and defence, compulsory social security(p) education(q) health and social care(r) arts, entertainment and recreation(s) other service activities
(20) Which category does your company fall into?3
(a) medium-sized(b) companies large companies
(3) Specify the city/country in which your head office is located?_________________________
(4) Which position do you hold in your company? (a). Chief financial officer (b). Directorof accounting (c). Chief accountant (d). Controller (e). other___________________________________ (please specify the position)
(5) Which of the following descriptions best describes your company? (a). multinationalcompany (b). Croatian company (c). branch office (d). other______________________________________ (please specify)
(6) In which markets does your company mainly do business: (a). domestic (b). foreign(7) If your company uses the following financial performance indicators, please fill in the
table with the data for the past three years.
Please give the name of your company.
Indicator 2009 2010 2011Expense-to-revenue ratioShare of profit from total income %Return on assets%Profit per employee (in HRK)
3According to the Accounting Act (Official Gazette 109/2007), medium-sized companies includethose that exceed two of the three criteria: total assets in HRK 32,500,000.00, income in HRK65,000,000.00, the average number of employees during the financial year: 50; but do not exceedtwo of the following criteria: total assets in HRK 130,000,000.00, income in HRK260,000,000.00, the average number of employees during the financial year: 250 Large companiesare those that exceed two of the three criteria: total assets in HRK 130,000,000.00, income inHRK 260,000,000.00, the average number of employees during the financial year: 250.
Economic Research-Ekonomska Istraživanja 413