investigation of the effect of various oxide and flouride ... ad-a271 756 army research laboratory...
TRANSCRIPT

AD-A271 756
ARMY RESEARCH LABORATORY
Investigation of the Effect of VariousOxide and Flouride Additives on the
Microstructure, Electronic Properties,and Phase Shifting Ability of
Bai-xSrxTiO3
L.C. Sengupta, E. Ngo, S. Stowell, R. Lancto, W.C. Drach,T.E. Koscica, and R.W. Babbitt
ARL-TR-217 September 1993
93-26410
Approved for public release; distribution unlimited
93 1 063

BestAvailable
Copy

The findings in this report are not to be construed as an official Departmentof the Army position unless so designated by other authorized documents.
Citation of manufacturer's or trade names does not constitute an officialendorsement or approval of the use thereof.
Destroy this report when it is no longer needed. Do not return it to theoriginator.

Form ApprovedREPORT DOCUMENTATION PAGE OMB No. 0704-0o188
P ohc fd.onnq oueoen t tts coilecton of intormation is estimated to averas I 'ou. oris resoonse incV.uing Ir. me tfor Iev,@wnI insotrctlons seaicnrnq existing oata sourcesgatnei~ng ando mantaiaInin Itrs data needed, amd comoisting amd rttweioiii it's cotiedron of ifrmation~t~ Sena commntTls reqagonq Itris ouroen estimnate of ri o~tme asoec IofI Irils:0,.clt on ohof mI~oStion, w, ng'Iu ~ suggestions fair reducing tmil oulden to watflltgtot Hiato~uaners Semices. ODrectorales $of inftormation Oosiratons and Reoo.¶g I215 .041tt,5O.Dav's -,olwav 02,a i u 2c 4 A AIntlon VA 22202-4302 and to Ine Offce of Mamnaotemen aInd BucOOt Paiostont Reouction Protlec r0WCA-0I881 .Wasmnl on DC 20503
1. AGENCY USE ONLY ýL@Ove WrAt,) 2. REPORT DATE 3. REPORT TYPE ANO DATES COVERED
September 1993 Final Report
4 1Tf.. ANO SUBTTLE S. FUNDING NUMBERS
Investigation of the Effect of Various Oxide andFluoride Additives on the Microstructure, ElectronicProperties, and Phase Shifting Ability of Bal_xSrxTi03
S. AUTHOR(S)
L. C. Sengupta, E. Ngo, S. Stowell, and R. LanctoW. C. Drach, T. E. Koscica, and R. W. Babbitt
7. PERFORMING ORGANIZATION NAME(S) AND AOORESS(ES1 8. PERFORMING ORGANIZATION
REPORT NUMBER
U.S. Army Research LaboratoryWatertown, MA 02172-0001 ARL-TR-217ATTN: AMSRL- MA-CA
9. SPONSORINGMONITORING AGENCY NAME(S) AND ADORESS(ES) 10. SPONSORINGMONITORING
AGENCY REPORT NUMBERU.S. Army Research Laboratory2800 Powder Mill RoadAdelphi, MD 20783-1145
11. SUPPLEMENTARY NOTES
*U.S. Army Research Laboratory
Fort Monmouth, NJ 07703ATTN- AMSRI-FP-M
12a. OISTRIBUTION/AVAILABILITY STATEMENT 12b. DISTRIBUTION CODE
Approved for public release; distribution unlimited.
13. ABSTRACT 0Afaxmum 2W0 words)
A ceramic phase shifting device (used in phased array antenna systems) has been demonstrated us-ing Bai.xSrxTiO3 (BSTO) ceramics. As a part of an effort to optimize the electronic device per-formance in the phase shifter, various dopants have been incorporated into B'TO The effects ofthese additives on the Curie temperature, dielectric properties. tunability. hysteresis. and grain sizehave been investigated. The homogeneity of the doped materials has been verified using Curie-Weiss analysis. To further improve the electrical performance, some higher levels of doping havebeen attempted. A few of the latest results for these ccramic-ccramic composites will be pre-sented.
14. SUBJECT TERMS 15- NUMBER F PAGE.
Phased array antennas, Ferroelectrics, Electro-ceramics,lIS. PRICE CODE
Barium stronitum titanate
17. SECURI ty CLASSIFICATION Ia. SECURITY CLASSIFICATION I9. SECURITY CLASSIFICATION 20. LIMITATION OF ABSTRACTOF REPORT OF THIS PAGE OF ABSTRACT
Unclassified Unclassified Unclassified ULNSN 7540 GI 20 5500 sIandard poll ?,-3. v
,-c.1v0. NS1'02

Contents
Page
In tro d u ctio n . . . . . . . . . . . . . . . . . . . . . . . . . . . . . . . . . . . . . . . . . . .. . I
Experimental
Ceramic Processing ........ ....................................... 1
Electronic Measurements ........ .................................... 3
Results and Discussion ........ ........................................ 5
Conclusions ............. ............................................. 19
Acknowledgments ......... ........................................... 19
R eferences . . . . . . .. . . . . . . . . . . . . . . . . . .. . . . . . . . . . . . .. . 19
Figures
1. Block diagram of ARL-EPSD electronic test equipment ................. 4
2. Specimen holder and heating apparatus for electronic test system .n......... 5
3. Curie-Weiss relationship I/s versus temperature for: (a) an undopcd specimen,and (b) a specimen doped with 2 wt% zirconia . . .................... 6
4. Dielectric constant versus tunability (1.5 V/micron) for doped BSTO (Ba=0.75) . . 8
5. Curie temperature (°C) versus % tunabilitv (1.5 V/micron) for doped BSTO(Ba=0.75) .......... ............................................. 8
6. Dielectric constant versus grain size for doped BSTO (Ba=0.75) ............... 9
7. Curie temperature and tunability (1.5 V/micron) versus grain size for dopedBSTO (Ba=0.75) ........ ......................................... 9
8. Dielectric constant versus tunability (1.5 V/micron) for doped BTO .......... II
9. Curie temperature (0 C) versus % tunability (1.5 V/micron) for doped BTO .... I1
10. Dielectric constant versus grain size for doped BTO ........................ 13
11. Curie temperature and tunability (1.5 V/micron) versus grain size for dopedB T O . . . . . . . . . . . . . . . . . . . . . . . . . . . . . . . . . . . . . . . . .. . 1 3
12. Dielectric constant versus barium content, Ba(l-x), for undoped materials ..... .14
iii

13. Tunability (%. 1.5 V/micron) versus barium content. Ba(I-x), for undopedm a te ria ls . . . . . . . . . . .. . . . . . . . . . .. ... 15
14. Curie temperature versus barium content, Ba(l-x), for undoped materials . 15
15. Dielectric constant versus barium content, Ba(l-x), for materials dopedwith 2.5 wt% BaLiF3 ......... ................................... 16
16. Tunabilitv (%. 1.5 V/micron) versus barium content, Ba(I-x). for materialsdoped with 2.5 wvt% BaLiF3. ......................................... 16
17. Curie temperature versus barium content, Ba(I-x), for materials doped with2.5 wt% BaLiF3 ........ ......................................... 17
18. Barium content. Ba(l-x), and dielectric constant versus grain size for undopedmaterials .......... ........................................... i8
19. Barium content. Ba(l-x). versus grain size for undoped materials and materialsdoped w ith 1.0 wt% zirconia ... .. ... . . ........ 18
Tables
IL Sample descriptions of doped BSTO (Ba=0.75) and BaTiO3 2
2. Densities and porosity of doped BSTO (Ba=0.75) and doped BaTiO3 ....... 3
3. Electronic properties of doped BSTO (Ba=0.75) measured at I KHz ......... 7
4. Electronic properties of doped BTO measured at I KHz .. ............. 10
c ession Tor
tDTIC TABJj U,:r: im o edlE:
13y-_Dt st ribut i 1/ ... .
SAvallabilitV Y '
Dt AV~t~
Speotal
________J

Introduction
Phased array antennas can steer the transmitted or received signals either linearlyor in two dimensions without mechanical oscillation. These antennas are currently con-structed using ferrite phase shifting elements. Due to the type of circuit requirements nec-essary to operate these antennas, they are costly, large, and heavvy therefore, their usehas been limited primarily to strategically depentent military applications. In order tomake these devices available for manv other commercial and military uses, the basic con-cept of the antenna must be improved. If ferroelcctric material could be used instead offerrites, phased array antennas would be totally revolutionized.
The concept of using ferroclectric materials for phased array radar systems is notnew. However. due to new and sophisticated device fabrication and testing, as wveil asto the advent of new improvements in electro-ceramic formulations and ceramic process-ing, the use of these materials seems more realistic than ever.
A ceramic barium strontium titanate (BSTO), Bal-xSrxTiO3, electro-optic phase shifterusing a planar microstrip construction has been demonstrated (1). In order to meet the re-quired performance specifications for maximum phase shifting ability, the electronic prop-erties in the low frequency (KHz) and microwave regions (GHz) must be optimized.As part of this optimization process various dopants have been added to the materialand their effects on the electronic properties have been studied. The relationships be-tween the effect of these dopants on the dielectric constants, tunability, grain size. Curietemperature and, in some cases, strontium content have been investigated and will be dis-cussed in this report. This report will outline some of the initial findings and comparethe results found for sonic of the dopants to the results obtained in doped BaTiO3 (BTO).
Experimental
Ceramic Processing
Table I contains the additives, sample numbers. calcining, and sintering temperaturesfor the specimens examined in this investigation. Various oxide and fluoride addi-tives were mixed with BaTiO3 (Ferro Corp. #219-6) and SrTiO3 (Ferro Corp. #218) in aformulation for additive testing of Bao.75Sro.25TiO3. The mixture was ball milled in etha-nol using alumina grinding media for about 24 hours and subsequently air dried. The pow%-der is then calcined at the temperatures given in Table 1. The calcined material wasthen made into a slurry with ethanol and ball milled with alumina grinding media for24 hours. At this time, 3 wt% organic binder from Rolin and Haas Company, productRhoplex B-60A which is an aqueous emulsion of acrylic polymer, was added to improvegreen body strength and permit sample fabrication. The mixture was then ball milled foranother four to five hours and air dried. The powder was cold uniaxiallv pressed at apressure of approximately 7000 psi. The pellets were sintered at the temperatures givenin Table I for an average soak time of about two hours. Table 2 gives the final geo-metrical densities. % theoretical density, % porosity (open) and % liquid absorption (etha-nol) for the specimens listed in Table I. The % porosity and the % liquid absorptionwere determined from immersion density methods, using specimens which were placed in avacuum and then saturated with ethanol- the % porosity was determined from the dryweight, the saturated weight, and the suspended (in ethanol) saturated weights.

Table 1. Sample descriptions of doped BSTO (Ba=0.75) and BaTIO3
Calcining temp Sintering temp.Sample # Additive (°C) (°C)
BSTO
A30 1 wt% ZrO2 1100 1325
A31 1 wt% ZrO2, 700 1335
1 wt% BaLiF3
A32 5 m% Bi2(SnO3)3 1100 1350
A33 5 m% Bi2(SnO3)3, 700 1335
1 wt% BaLiF3
A35 1.8 wt% CaSnO3 1100 1325
A36 2 wt% CaTiO 3 1100 1325
A37 2 m% NiSnO3 1100 1350
A38 2.5 wt%/o BaLiF 3, 700 1325CaO, MnO 2
A39 1 wto A1203 1100 1335
A40 30 wt% A1203 1100 1335
A68 Undoped 1100 1335
BaTiO3
A58 1 wt% ZrO2, 700 13351 wt% BaLiF3
A59 5 m% Bi2(SnO3)3 1100 1335
A60 30 wt% A1203 1100 1335
A61 1 wt% A1203 1100 1335
A62 2.5 wt% BaLIF 3, 700 1350CaO, MnO2
A63 2 m% NiSnO3 1100 1350
A64 2 wt% CaTiO 3 1100 1325
A65 6 wt% CaTiO3, 1100 13504 wt% CaSnO3
A66 2 m% CaSnO3 1100 1325
A67 5 m% Bi2(SnO3)3 , 700 1335
1 wt% BaLiF3
A69 Undoped 1100 1335
2

Table 2. Densities and porosity of doped BSTO (Ba=0.75) and doped BaTiO3
Density % Theoretical % Liquid
Sample # (g/cm 3) density % Porosity absorption
BSTO
A30 5.44 96 2.31 034
A31 5.13 91 5.58 0.84
A32 5.22 92 225 0.33
A33 5.19 91 2.54 0.36
A35 5.32 94 1 01 0 15
A36 5.14 91 9.15 1.45
A37 5.20 92 2.41 0.35
A38 5.11 90 2.48 036
A39 5.20 92 2.36 0.36
A40 3.97 - 6.76 1,44
A68 5.54 97 062 0.08
BaTiO3
A58 5.49 94 5.95 0.88
A59 5.79 99 395 0.54
A60 3.40 - 1782 402
A61 522 90 4.96 0.80
A62 5.13 88 20.12 3.35
A63 5.97 100 3.69 0.55
A64 5.32 91 6.45 0.97
A65 5.70 97 5.26 0.87
A66 5.80 99 6.00 0.87
A67 5.62 96 7.22 1.03
Electronic Measurements
Before discussing the electronic properties of the materials, some definitions arc re-quired. The dielectric constant of a given material can be related to the amount of en-
ergy storage by measuring the capacitance (F) of the material, where F = C(F)xd/EoA. d= thickness, A = area, and Eo = 8.8542 x I012 F/ni. In general. for any given materia:
the dielectric constant e = C'-ie". The loss tangent (tan 8) of the material is related tothe energy dissipated and is given by the ratio of the imaginary part of the dielectric con-
stant &" divided by the real part ,'. The Curie temperatures. dielectric constants. F',
and % tunability was determined at the ARL-Microwave and Photonics Branch Elec-
tronic Power Sources Directorate. The tunability of a material is defined as:
% tunability = (E (0) -F- (Vapp))/(E (0)). (I)

The block diagram of the experimental apparatus for measuring the tunability, dielectricconstants, Curie temperature, and hysterisis is shown in Figure 1. The sample is encap-sulated in a dry box and is heated and cooled with a thermoelectric cooler (TEC). TheTEC has two wires connected to the computer controlled by a double throw switch whichchanges the polarity of the voltage applied to the TEC. The temperature is held within± 0.05 0C. The device under test (DUT) is painted on both sides with silver epoxy andmounted to the brass plate holder with epoxy. A wire is fixed to the top of the specimenand held in place with a TeflonTM plate, and tightened with two tension screws, as shownin Figure 2. The fixture is placed in an oven at 150 0C for one hour to anneal the silverepoxy: then, the specimen is placed into a dry box and the test is rin. The data in-cludes standard deviation at each point. The tunability measurements were taken with an appliedelectric field which ranged from 0 V/micron to 1.5 V/micron. All of the electronic propertiesreported here were measured at a frequency of I KHz.
Temperature
OUTPlate
DRY CHAMBfER
TEMPERATURE CAPACITOR HIGH VOLTAGEMEASUREMENT MEASUREMENT SUPPLY
CIRCUIT CIRCUITV/1000
TEMPERATURE Polartity '•iHIGH VOLTAGE
PL.ATE LReverser 1, 0 OERSPL
-- POWER SUPPLY DRIRPOWER SUPPLY :Multiplexer DIE
DIGITAL VOLTAGE
MMETER(DnVM)
IEEE-488 BUS
IEEE-48l8 BUS INTERFACE
IBM COMPUTER WITHBASICA PROGRAM
Figure 1 Block diagram of ARL-EPSD electronic test equipment.
4

.__-TENSION SCREWS
SPECIMENr BRASSTEMPERATURE • MOUBRASSCONTROLLED MOUNTINGPLATE PLATE
-1---THERMOELECTRICCOOLER
HEAT SINK -i
Figure 2. Specimen holder and heating apparatus for electronic test system
Results and Discussion
The inverse of the dielectric constant versus temperature for samples A68 and A30 areshown in Figures 3(a) and 3(b). The degree of homogeneity in the materials can be deter-mined from how well the data obeys the Curie-Weiss law, where:
I/& = I/so ((T-Tc)/(T +2Tj)), (2)
Tc = Curie temperature, so = 8.8542 x 10⁻¹² F/m.
Using the data shown in Figure 3, the relationship described by Equation 2 is followeduntil 20C of the Curie temperature (40 0 C). This indicates that the sample is highlyuniform and that the dielectric properties of the bulk are representative of the entirespecimen.
Dopants in BSTO (Ba=0.75)
A summary of the electronic properties of the doped BSTO (Ba=0.75) specimens isgiven in Table 3. The specimens were measured at I KHz and the electric field was in-creased to 1.5 V/pjm. Dopants that were studied in this investigation either substitutefor the Ba site or the Ti site in the material. Generally. the dopants, which are com-pounds, will have constituents that will predominantly substitute into these lattice Posi-tions. The effects of these substitutions are: if substituted into the Ba site to shift the Curietemperature, or if substituted into the Ti site to suppress the Curie temperature. Compounddopants ultimately occupy integranular positions and do not combine totally into the lattice po-sitions. Therefore, studying the electronic behavior can indicate the subtle effect of thedopants on the crystal structure of the materials even if the lattice parameters and X-ray dif-fraction pattcrns arc not aftected. To clarify the differences. bctwccn the effect of thedopant and that of Sr in the ceramics, identical dopants have been added to barium titanate

BSTO (Ba=0.75) undoped7 500e-4
(a)
65000.4
5 5000-4
". SOO-4"(a)
25009.4
1.5004 "-200 -100 0 100 200
Tempenature (C)
BSTO (Ba=0.75) & lwt% ZrO2120e-3
1 OOo-3
(b)
8 O•e4
6 80004
40014
200e04
-200 -100 0 100 200
Temperatuve (C)
Figure 3 Curie-Weiss relationship 1/. versus temperature for: (a) anundoped specimen, and (b) a specimen doped with 2 wt% zirconia.
6

Tab'- " Electronic properties of doped BSTO (Ba=0.75) measured at 1 KHz
Curie temperature Tunability HysteresisSample # Dielectric constant (OC) (%) (%)
A30 1630 60 28.0 2.0
A31 1388 55 27.0 20
A32 1193 54 23.0 0.2
A33 C49 -60 1.5 0.2
A35 675 55 17.0
A36 474 60 17.0 2.0
A38 532 40 23.0 0.3
A39 930 50 28.0 0.6
A40 25 - 4.0 0.1
A68 1150 60 32.0 5.0
For a clearer understanding of the trends found in the results, some of the data willbe presented in a graphic format, as shown in Figures 4 and 5. It is obviousfrom these figures (Figure 4 shows the dielectric constant versus tunability and Figure5 shows the Curie temperature versus turability) that the tunabilitv increases with increas-ing dielectric constant and also with increasing Curie temperature. This is a direct conse-quence of the fact that the tunability is greatest at the peak of the C-irie temperature andis also high at temperatu-es below the Curie point where the material is in the ferroelec-trtc region. At temperatures far above the Curie temperature (in the paraelectric region)for a particular composition the tunability drops off rapidly. Likewise, the diel,•ctric lossof any given material is decreased when the material is measured in its paraelectricregion or, in other words, when the Curie temperature is decreased. This was observedfor sample A30 (I wt% zirconia) which had a loss tangent of 0.36 at 10 GHz (Curie tem-perature of 60 0 C, dielectric constant = 1630) as compared to sample A31 which wasdoped with I wt% zirconia and I wt% BaLiF3 (Curie temperature of 550C, dielectric con-stant = 1388) and has a loss tangent of 0.15. As seen above, the loss tangent seems to de-crease with dielectric constant. A30 and A31 can be compared to A39 (doped with 30 wt%alumina) which at 39 GHz has a dielectric constant of 45.8 and a loss tangent of 0.054.The loss tangent is definitely less for the lower dielectrics. It should be noted that composi-tions which had Curie temperatures below room temperature had a tunability of less than 10%.The % hystersis is not directly related to changes in the dielectric properties. However. in theparaelectric region the hysteresis is thought to be due to aging under bias.
The grain size of the material is related to the electronic properties, as can beseen in Figure 6. As the grain size decreases, the dielectric constant increases in thesematerials and the increase reachc, a maximum at grain sizes of around 10 microns.This behavior has been noted previously and has been attributed to an increase in the do-main width and increase in internal stress below a critical grain size (2). Figure 7shows the tunability and the Curie temperature versus grain size. As expeeted. below acritical grain size of about 1 micron both the tunability and Curie temperature decreasedrastically.
7

(Ba=0.75) 100 r
m & ft
E H
.S.soh
o
-100
I i*,.-
t " o' 4 *
I
_L_ 1 —i
10 20 30
% Tunahility (1.5 V/micnm)
40
• Undoped • 5 m% Bi2(Sn03)3,
BaLiF3
• 1 wt% Zr02
O 1 wt% Zr02, BaLiF3
O 5 m% Bi2(Sn03)3
• 2 m% CaSn03
• 2 wt% CaTi03
2.5 wt% BaLiF3s
0.25 wL% MnO,, om wi% CaO
C 1 wt% Al,( >3
Hyure 4. Dielectric con$tant versus tunability {15 V/micron) for doped BSTO (Ba=0.75).
BSTO (Ba=<
1 Undoped I 5 rn% Bi2(Sn03)3
BaLiF3
( 1 wt% ZrO0 o 1 wt% Zr02,
BaLiF3
0 5 m% Bi2(Sn03)3
2 m% CaSn03
2 wt% CaTi03
1 2.5 wt% BaLiF3, 0.25 wt% Mn02s
0.03 wt% CaO
0 1 wt% A1203
0 30 wt% A1203
40
Figure 5. Curie temperature (°C) versus % tunabiHty (1.5 V/mlcron) for doped BSTO (Ba^G.75).

(Ba=0.75)
1300
*-160ü C Gä-
c ^iaw r
„2 tooo
g soo
"
o o o
:
30
ü Undoped 0'5 m% Bi2(Sn03)3J
BaLiF,
1 wt% Zr02
1 wt% ZrO, BaLiF3
"■' 5 m% Bi2(Sn03)3
O 2 m% CaSn03
O 2 wt% CaTi03
O 2.5 wt% BaLiF3> 0.25 wt% Mn02, 0,03 wi% CaO
1 wt% A1203
Figure 6. Dielectric constant versus grain size for doped BSTO (Ba=0.75).
• Undoped • 5 m% Bi2(Sn03)3
BaLiF3
© 1 wt% Zr02
• I wl% Zr02, BaLiF3
• 5 m% Bi2(Sn03)3
O 2 m% CaSn03
© 2 wt% CaTiO, • 2.5 wt% BaLiF33
0.25 wt% Mn02J
0.03 wt% CaO O 1 wt% A1203
Figure 7. Curie temperature and tunability (1.5 V/micron) versus grain size for doped BSTO (Ba=0.75).
Dopants in BTO
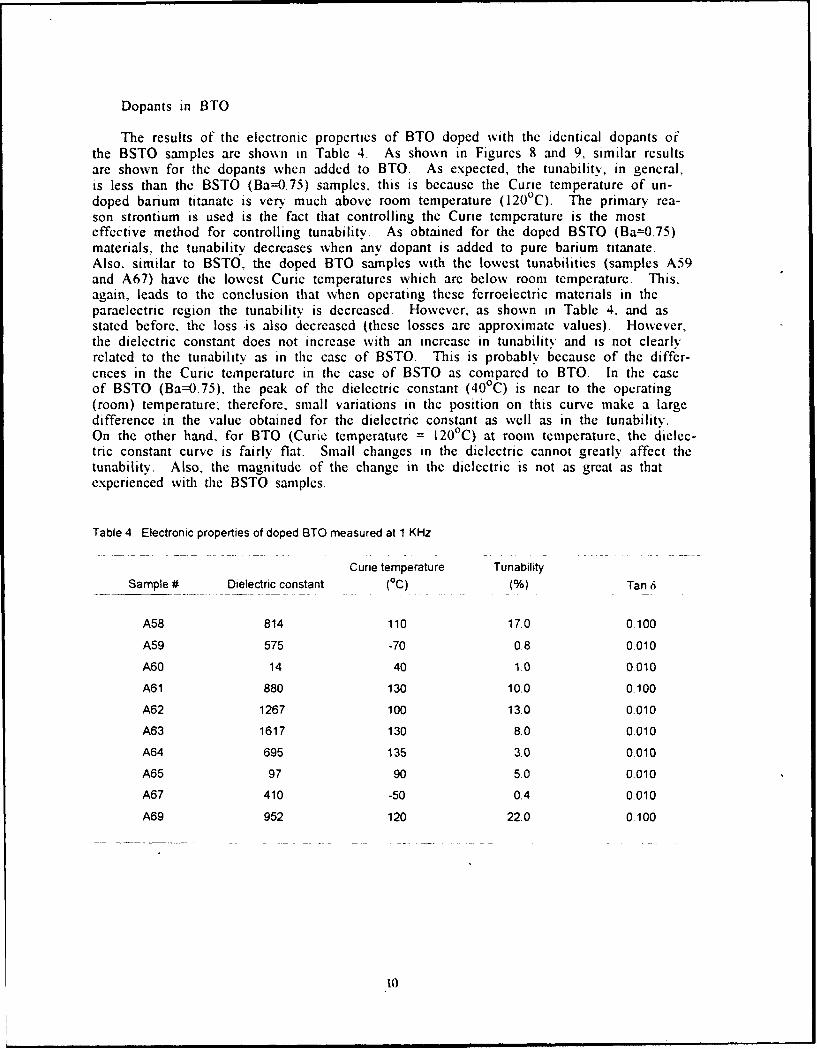
The results of the electronic properties of BTO doped with the identical dopants ofthe BSTO samples are shown ii Table 4. As shown in Figures 8 and 9, similar resultsare shown for the dopants when added to BTO. As expected, the tunability, in general,is less than the BSTO (Ba=0.75) samples, this is because the Curie temperature of un-doped barium titanate is very much above room temperature (120 0 C). The primary rea-son strontium is used is the fact that controlling the Curie temperature is the mosteffective method for controlling tunability. As obtained for the doped BSTO (Ba=0.75)materials, the tunability decreases when any dopant is added to pure barium titanate.Also. similar to BSTO, the doped BTO samples with the lowest tunabilities (samples A59and A67) have the lowest Curie temperatures which are below room temperature. This,again, leads to the conclusion that when operating these ferroelectric materials in theparaelectric region the tunabilitv is decreased. However, as shown in Table 4. and asstated before. the loss *is also decreased (these losses are approximate values). However,the dielectric constant does not increase with an increase in tunability and is not clearlyrelated to the tunabilitv as in the case of BSTO. This is probably because of the differ-ences in the Curie temperature in the case of BSTO as compared to BTO. In the caseof BSTO (Ba=0.75). the peak of the dielectric constant (400 C) is near to the operating(room) temperature: therefore, small variations in the position on this curve make a largedifference in the value obtained for the dielectric constant as well as in the tunabilitv.On the other hand, for BTO (Curie temperature = 120 0C) at room temperature, the dielec-tric constant curve is fairly flat. Small changes in the dielectric cannot greatly affect thetunability. Also, the magnitude of the change in the dielectric is not as great as thatexperienced with the BSTO samples.
Table 4 Electronic properties of doped BTO measured at 1 KHz
Curie temperature TunabilitySample # Dielectric constant (0C) (%) Tan 6
A58 814 110 17.0 0.100
A59 575 -70 0.8 0010
A60 14 40 1.0 0.010
A61 880 130 10.0 0.100
A62 1267 100 13.0 0.010
A63 1617 130 8.0 0.010
A64 695 135 3.0 0010
A65 97 90 5.0 0.010
A67 410 -50 0.4 0.010
A69 952 120 22.0 0.100
to

2000
C 1500 2
J 1000
1 Ö) soo
5
o o
o
0 10 20
Tunability (1.5 V/micron)
• Undoped • 5 m% Bi2(Sn03)3J
BaLiF3
4 wt% CaSn03, 6 wt% CaTi03
0 1 wt% Zr021
BaUF3
0 5 m% Bi2(Sn03)3
• 2 wt% CaTiO, • 2 m% NiSn03
0 2.5 \vt% BaLiF3s
0.25 wt% Mn02, 0.03 wt% CaO
0 1 wt% A1203
O 30 wt% A1203
Figure 8. Dielectric constant versus tunability (1,5 V/micron) for doped BTO.
anwrn 200 r
2 100 3 1
■:;
o *100
o
o
20
• Undoped • 5 m% Bi2(Sn03)3,
BaLiF3
• 4 \vt% CaSu035
6 wt% CaTiO, 0 1 wt% Zr02,
BaLiF3
0 5 m% Bi2(Sn03)3
• 2 wt% CaTi03
• 2 m% NiSnO, O 2.5 wt% BaLiF3J
0.25 wt% MnO„ 0.03 wt% CaO
0 1 wt% A1203
O 30 wt% A12Ö3
Figure 9. Curie temperature (°C) versus % tunability (1.5 V/micron) for doped BTO.
The grain size versus dielectric constant of the doped BTO samples are shown in Figure 10. As seen in the case of the doped BSTO samples, the dielectric increases with the decrease in grain size until about 1 p.m. This result has been reported previously and was attributed to the decrease in domain width and the increase in inter- nal stress (2). The grain size below, which the dielectric begins to decrease, is less in the case of BTO as compared to BSTO. As shown in Figure 11, the tunability and
il

THIS
PAGE
IS
MISSING
IN
ORIGINAL
DOCUMENT

Curie temperature decrease rapidly below a grain size of 1 micron, which was the case for BSTO, This produced investigation of the grain size and the electronic properties as a function of Ba(l-x) content in the material which will be discussed in the following section.
Barium Titanate
1400 r
C1200 - CO +* m §1000 Ü o „ •- 800 +■* a IB 0) 600 - O Q
Ü 400
■
•
0 5 m% Bi2(Sn03)3J
BaLiF3
• 4 wt% CaSnO-p 6 wt% CaTi03
• l wt% Zr02, BaLiF3
t» 5 m% Bi2(Sn03)3
• 2 wt% CaTi03
O 2.5 wt% BaLiF3s
0.25 wt% Mn02, 0.03 wt% CaO
1 wt% A1303
■' 0 20 30
Figure 10 Dielectric constant versus grain size for doped BTO.
Barium Titanate a?;;
M0Q
U
1 0 20
Grain Size (microns)
-100
O 5 m% Bi3(Sn03X Ba.LiF3
© 4 wt% CaSnOVl
6 wt% CaTi03 '■■ O 1 wt% Zr02,
BaLiF3 0 5 m% Bi2cSn03)3
• 2 wt% CaTi03
• 2.5 wt% BaLiF3l
0.25 wt% Mn02
0.03 wt% CaO ' 1 wt% A1203
O 2 m% CaSn03
Figure 11. Curie temperature and tunability (1.5 V/micron) versus grain size for doped BTO.
13
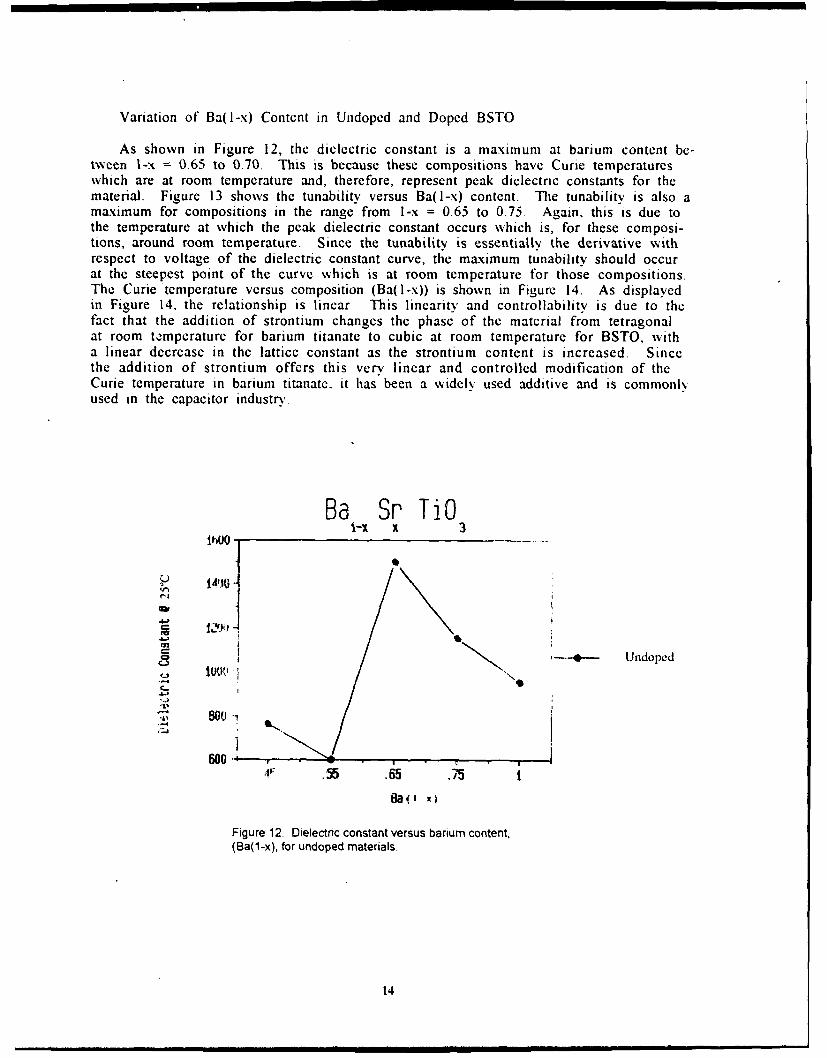
Variation of Ba(l-x) Content in Undoped and Doped BSTO
As shown in Figure 12, the dielectric constant is a maximum at barium content be-tween I-x = 0.65 to 0.70. This is because these compositions have Curie temperatureswhich are at room temperature and, therefore, represent peak dielectric constants for thematerial. Figure 13 shows the tunability versus Ba(l-x) content. The tunability is also amaximum for compositions in the range from I-x = 0.65 to 0.75. Again, this is due tothe temperature at which the peak dielectric constant occurs which is, for these composi-tions, around room temperature. Since the tunability is essentially the derivative withrespect to voltage of the dielectric constant curve, the maximum tunability should occurat the steepest point of the curve which is at room temperature for those compositions.The Curie temperature versus composition (Ba(I-x)) is shown in Figure 14. As displayedin Figure 14, the relationship is linear This linearity and controllability is due to thefact that the addition of strontium changes the phase of the material from tetragonalat room t.-mperature for barium titanate to cubic at room temperature for BSTO, witha linear decrease in the lattice constant as the strontium content is increased. Sincethe addition of strontium offers this very linear and controlled modification of theCurie temperature in barium titanate, it has been a widely used additive and is commonlyused in the capacitor industry.
Ba Sr TiOi-X X 3
.4.,J -1
4---> Undopcd
8 00i
60o
Figure 12. Dielectric constant versus barium content,(Ba(l-x), for undoped materials.
14

- '.-, T-1-
4U
300
S* i Undoped
t0 -
0 .55..G .75 ,.
•a(1-x)
Figure 13. Tunability (%, 1.5 V/micron) versus barium content, Ba(1-x),for undoped materials.
Ba Sr TiOi-x x 3200I
1t00
T 0 o UndopedW
( 1 -x)
Figure 14. Curie temperature versus barium content, Ba(1-x),for undoped materials.
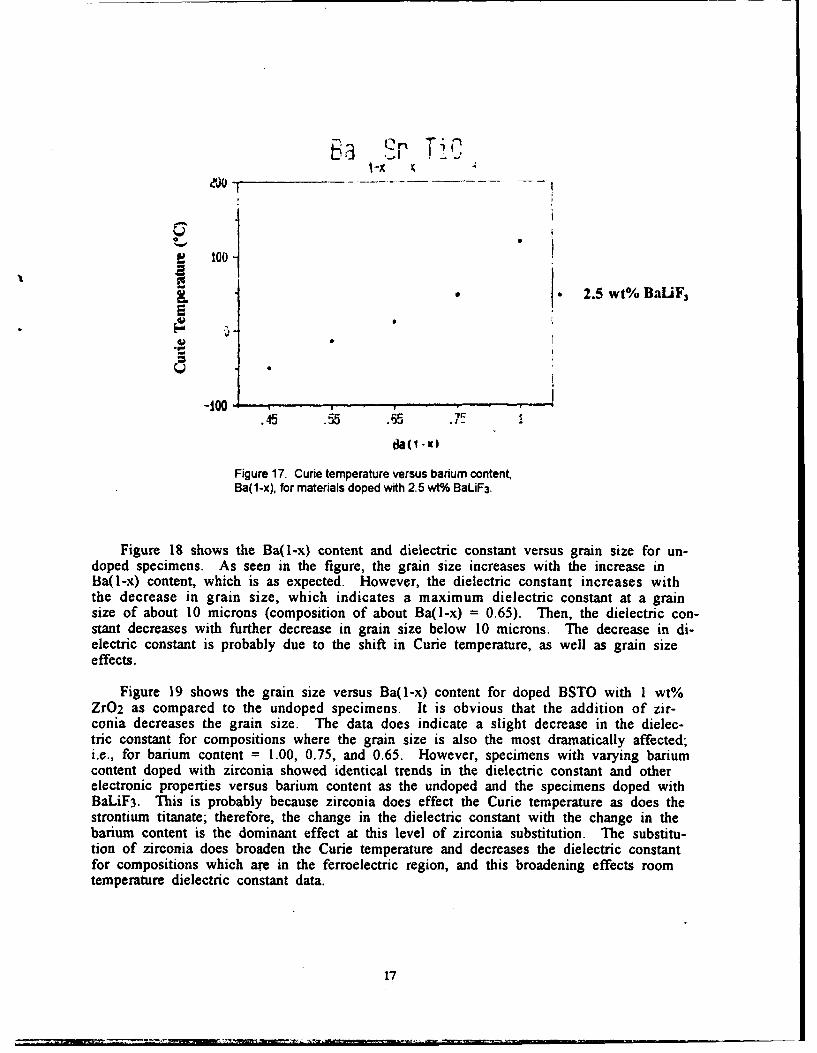
Figures 15, 16, and 17 show the relationship between the dielectric constant, tunabil-ity, Curie temperature, and barium content for specimens doped with BaLiF3. The rela-tionships of the electronic properties (dielectric, constant, Curie temperature, andtunability) versus Sr composition are unchanged when other dopants such as BaLiF3 isadded to the material. The electronic properties versus Ba(l-x) content are also un-changed for ZrO2 samples. This indicates that these other dopants, at the levels incorpo-rated, have little affect on the lattice constants and crystal structure of the material.
15

This was indeed found from the X-ray diffraction data which did not show any changein the lattice constants (compared to the undoped materials with the same Sr content).The dopants, however, do decrease the tunability and, in the case of the fluoride dopants,the dielectric constant is decreased. Zirconia at this level of substitution does not de-crease the dielectric constant.
b - Sr 1" T 0 2.5 wt/ BaLiF3I-x x .
72001000"-' 901 / \ '
-5-i 700
.45 .5 6
ba( .x)
Figure 15. Dielectric constant versus barium content, Ba(1-x), formaterials doped with 2.5 wt% BaLiF3.
Ba Sr TMDi-Kx x
30
20
17!
-,2.5 wt% BaLiF 3
0
.45 .55 .65 .71
88(1 -x)
Figure 16. Tunability (%, 1.5 V/micron) versus barium content, Ba(1-x), formaterials doped with 2.5 wt% BaLiF3.
16
too -
* 2.5 wt% BaUF 3
E SO
-:100 .45 .5.65 "7 •
da(1 -x
Figure 17. Curie temperature versus barium content,Ba(1-x), for materials doped with 2.5 wt% BaLiF3.
Figure 18 shows the Ba(1-x) content and dielectric constant versus grain size for un-doped specimens. As seen in the figure, the grain size increases with the increase inBa(l-x) content, which is as expected. However, the dielectric constant increases withthe decrease in grain size, which indicates a maximum dielectric constant at a grainsize of about 10 microns (composition of about Ba(l-x) = 0.65). Then, the dielectric con-stant decreases with further decrease in grain size below 10 microns. The decrease in di-electric constant is probably due to the shift in Curie temperature, as well as grain sizeeffects.
Figure 19 shows the grain size versus Ba(1-x) content for doped BSTO with 1 wt%ZrO2 as compared to the undoped specimens. It is obvious that the addition of zir-conia decreases the grain size. The data does indicate a slight decrease in the dielec-tric constant for compositions where the grain size is also the most dramatically affected;i.e., for barium content = 1.00, 0.75, and 0.65. However, specimens with varying bariumcontent doped with zirconia showed identical trends in the dielectric constant and otherelectronic properties versus barium content as the undoped and the specimens doped withBaLiF3. This is probably because zirconia does effect the Curie temperature as does thestrontium titanate; therefore, the change in the dielectric constant with the change in thebarium content is the dominant effect at this level of zirconia substitution. The substitu-tion of zirconia does broaden the Curie temperature and decreases the dielectric constantfor compositions which are in the ferroelectric region, and this broadening effects roomtemperature dielectric constant data.
17

OSTO (UNDOPED)
1600 120O--- DIELECTRIC CONSTANT
1400 10
I--zI--
Z 1200 08
0 -
U V-
UUS.06 C
1.- 1000.0_w-juJIo 800 -04
600 0.2
0 10 20 30 40
GRAIN SIZE (MICRONS) UNDOPED
Figure 18. Barium content, Ba(1-x), and dielectric constantversus grain size for undoped materials.
BSTO - Undoped and with 1 wt% ZO 2
40
-0- Grain Size (Microns) Undo
- Grain Size (Microns) I wt% ZrO2
o) 30Z0
- 20N
0
0.2 0. 0.6 O.8 1.0 1.2
Ba (1-x)
Figure 19. Barium content Ba(l-x), versus grain size for undopedmaterials and materials doped with 1.0 wt% zirconia.
18

Conclusions
For dopant modifications BSTO (Ba(I-x) = 0.75) as studied in this investigation, itwas found that the tunability increases with an increase in the dieleatric constant andwith an increase in Curie temperature. The tunability, however, is the greatest in the un-doped material. The loss tangent (10 GfIz) was also found to increase with an increase inthe Curie temperature. This is because the loss tangent is the greatest when the material isin the ferroelectric phase; therefore, it is the greatest for materials which have Curie tempera-tures at and above room temperature.
BTO with the same additives as used in the above mentioned portion of this in,,.sti-gation shows similar electronic behavior. The tunability obtained for these specimenseven in the undoped specimen is less than in the BSTO (0.75) samples. Also, thedopants again reduce the tunability as compared to the undoped BTO specimen. The di-electric constant is not as clearly related to the tunability as in the BSTO materials.This is because the Curie temperature of almost all of these samples are far above roomtemperature.
Variation of the barium content shows that thie maximum tunabilit% and dielectricconstant occur at a barium content Ba(l-x) = 0.65. This is because this composition hasa Curie temperature at room temperature. Therefore. the peak dielectric constant and theroom temperature dielectric constant coincide. Also. the Curie temperature increases line-arly with an increase in barium content. BaLiF3 and ZrO2 at the levels incorporated inthis study do not change the relationships described above.
The grain size is related to the electronic properties. For the doped BSTO (0,75)specimens, the dielectric constant increases with a decrease in grain size, then. beyond acritical grain size of 10 microns the dielectric constant decreases. Similar behavior wasfound in the doped BTO specimens. The grain size of the specimens decreases with thedecrease in barium content and also when zirconia is added. The zirconia doped materi-als show less of a dependence on barium content. In order to further clarify relation-ships between microstructures and electronic properties. various amounts of the samedopant will be added to a single composition of BSTO. However. it is clear that thegrain size plays an important role in controlling the electronic properties of the BSTO,and the grAin size seems to effect all of the electronic properties simultaneously.
Acknowledgments
The authors would like to thank the engineers of Transelco Division of Ferro Cor-poration in particular Jim Henry and Jim Wilson for their kind donations of advice andmaterials.
References
I. BABBITr. R. W., KOSCICA. T E.. and DRACH. W. E. Microwavc Journal. % 35. 1992. p. 63.2. ARLT. G., HENNINGS. D.. and deWITH. G. J. Appl. Phys.. v. 58. 1985, p. 1619.
19

DISTRIBUTION LIST
No. ofCopies lo
Office of the Under Secretary of Defense for Research and Engineering, The Pentagon,Washington, DC 20301
Director, U.S. Army Research Laboratory, 2800 Powder Mill Road, Adelphi, MD 20783- 1971 ATTN: AMSRL-OP-CI-AD, Technical Publishing Branch1 AMSRL-OP-CI-AD, Records Management Administrator
Commander, Defense Technical Information Center. Cameron Station, Building 5,5010 Duke Street, Alexandria, VA 23304-6145
2 ATTN: DTIC-FDAC
1 MIA/CINDAS, Purdue University, 2595 Yeager Road, West Lafayette, IN 47905
Commander, Army Research Office, P.O. Box 12211, Research Triangle Park,NC 27709-2211
1 ATTN: Information Processing Office
Commander, U.S. Army Materiel Command, 5001 Eisenhower Avenue, Alexandria, VA 223331 ATTN: AMCSCI
Commander, U.S. Army Materiel Systems Analysis Activity, Aberdeen Proving Ground,MD 21005
1 ATTN: AMXSY-MP, H. Cohen
Commander, U.S. Army Missile Command, Redstone Arsenal, AL 358091 ATTN: AMSMI-RD-CS-R/Doc
Commander, U.S. Army Armament, Munitions and Chemical Command, Dover, NJ 078012 ATTN: Technical Library
Commander, U.S. Army Natick Research, Development and Engineering Center,Natick, MA 01760-5010
1 ATTN: Technical Library
Commander, U.S. Army Satellite Communications Agency, Fort Monmouth, NJ 077031 ATTN: Technical Document Center
Commander, U.S. Army Tank-Automotive Command, Warren, MI 48397-50001 ATTN: AMSTA-ZSK1 AMSTA-TSL, Technical Library
Commander, White Sands Missile Range, NM 880021 ATTN: STEWS-WS-VT
President, Airborne, Electronics and Special Warfare Board, Fort Bragg, NC 283071 ATTN: Library
Director, U.S. Army Research Laboratory, Weapons Technology, Aberdeen Proving Ground,MD 21005-5066
1 ATTN: AMSRL-WT
21

No. ofCopies To
Commander, Dugway Proving Ground, UT 840221 ATTN: Technical Library, Technical Information Division
Commander, U.S. Army Research Laberadory, 2800 Powder Mill Road, Adelphi, MD 207831 ATTN: AMSRL-SS
Director, Benet Weapons Laboratory, LCWSL, USA AMCCOM, Watervliet, NY 121 891 ATTN: AMSMC-L:B-TL1 AMSMC-LCB-R1 AMSMC-LCB-RM1 AMSMC-LCB-RP
Commander, U.S. Army Foreign Science and Technology Center, 220 7th Street, N.E.,Charlottesville, VA 22901-5396
3 ATTN: AIFRTC, Applied Technologies Branch, GCrald Schlesinger
Commander, U.S. Army Aeromedical Research Unit, P.O. Box 577, Fort Rucker, AL 363601 ATTN: Technical Library
U.S. Army Aviation Training Library, Fort Rucker, AL 363601 ATTN: Building 5906-5907
Commander, U.S. Army Agency for Aviation Safety, Fort Rucker, AL 363621 ATTN: Technical Library
Commander, Clarke Engineer School Library, 3202 Nebraska Ave., N, Fort Leonard Wood,MO 65473-5000
1 ATTN: Library
Commander, U.S. Army Engineer Waterways Experiment Station, P.O. Box 631, Vicksburg,MS 39180
1 ATTN: Research Center Library
Commandant, U.S. Army Quartermaster School, Fort Lee, VA 238011 ATTN: Quartermaster School Library
Naval Research Laboratory, Washington, DC 203752 ATTN: Dr. G. R. Yoder - Code 6384
Chief of Naval Research, Arlington, VA 222171 ATTN: Code 47.
Commander, U.S. Air Force Wright Research & Development Center, Wright-Patterson AirForce Base, OH 45433-6523
1 ATTN: WRDC/MLLP, M. Forney, Jr.1 WRDC/MLBC, Mr. Stanley Schulman
U.S. Department of Commerce, National Institute of Standards and Technology, Gaithersburg,MD 20899
1 ATTN: Stephen M. Hsu, Chief, C -i amics Division, Institute for Materials Science andEngineering
22

No. ofCopies To
1 Committee on Marine Structures, Marine Board, National Research Council, 2101 ConstitutionAvenue, N.W., Washington, DC 20418
1 Materials Sciences Corporation, Suite 250, 500 Office Center Drive, Fort Washington,PA 19034
1 Charles Stark Draper Laboratory, 555 Technology Square, Cambridge, MA 02139
Wyman-Gordon Company, Worcester, MA 016011 ATTN: Technical Library
General Dynamics, Convair Aerospace Division, P.O. Box 748, Fort Worth, TX 761011 ATTN: Mfg. Engineering Technical Library
Plastics Technical Evaluation Center, PLASTEC, ARDEC, Bldg. 355N, Picatinny Arsenal,NJ 07806-5000
1 ATTN: Harry Pebly
1 Department of the Army, Aerostructures Directorate, MS-266, U.S. Army Aviation R&TActivity - AVSCOM, Langley Research Center, Hampton, VA 23665-5225
1 NASA - Langley Research Center, Hampton, VA 23665-5225
U.S. Army Vehicle Propulsion Directorate, NASA Lewis Research Center, 2100 BrookparkRoad, Cleveland, OH 44135-3191
1 ATTN: AMSRL-VP
Director, Defense Intelligence Agency, Washington, DC 20340-60531 ATTN: ODT-5A (Mr. Frank Jaeger)
U.S. Army Communications and Electronics Command, Fort Monmouth, NJ 077031 ATTN: Technical Library
U.S. Army Research Laboratory, Electronic Power Sources Directorate, Fort Monmouth,NJ 07703
1 ATTN: AMSRL-EP-M, W. C. Drach1 AMSRL-EP-M, T. E. Koscica1 AMSRL-EP-M, R. W. Babbit
Director, U.S. Army Research Laboratory, Watertown, MA 02172-00012 ATTN: AMSRL-OP-CI-D, Technical Library
20 Authors
23