investigation of the effect of training on the … · investigation of the effects of trainings on...
TRANSCRIPT

Received: October 26, 2015Revision received: April 26, 2016Accepted: May 9, 2016OnlineFirst: August 5, 2016
Copyright © 2016 EDAMwww.estp.com.tr
DOI 10.12738/estp.2016.4.0334 August 2016 16(4) 1349-1380
Research Article
KURAM VE UYGULAMADA EĞİTİM BİLİMLERİ EDUCATIONAL SCIENCES: THEORY & PRACTICE
Citation: Akçöltekin, A. (2016). Investigation of the effects of trainings on the development of high school teachers’ attitudes about scientific researches and project competitions. Educational Sciences: Theory & Practice, 16, 1349-1380.
* This study is supported by the Commission of Scientific Research Projects of Ardahan University (Project number: 2014/08).
1 Correspondence to: Alptürk Akçöltekin (PhD), School of Physical Education and Sport, Ardahan University, Ardahan 75000 Turkey. Email: [email protected]
Abstract
The main purpose of this study is to develop positive attitudes in high school teachers towards scientific
research and project competitions by training them in scientific research and project preparation subjects.
The study group consists of 90 high school teachers. As a result of the study, a significant difference was
found in favor of post-test scores of high school teachers about their attitudes towards both scientific research
and project competitions (p < .05). Furthermore, the attitudes of teachers towards project competitions,
evaluation of projects included in the project competitions, being a mentor in these competitions and
behaviors of students, which were considered to be positively changed by project competitions, were
determined to be developed in a positive way. In addition, high school teachers developed a more positive
attitude towards researchers and scientific research and it was concluded that there was no difference
between attitudes of teachers towards scientific research in terms of their gender and educational level. Prior
to the study, there was a weak, positive and statistically insignificant correlation between attitudes of high
school teachers towards project competitions and scientific research (r = 0.149; p > .05). On the other hand,
a moderate, positive and significant correlation was determined between attitudes of high school teachers
towards project competitions and scientific research as a result of the study (r = 0.319; p < .05).
Keywords
Scientific research methods attitude • High school teachers • Project competitions attitude
Alptürk Akçöltekin1
Ardahan University
Investigation of the Effect of Training on the Development of High School Teachers’ Attitudes
towards Scientific Research and Project Competitions*

1350
EDUCATIONAL SCIENCES: THEORY & PRACTICE
Considering the competences of individuals in today’s society, there is a need for problem solving, research-oriented, questioning, productive, constructive and creative individuals who can approach incidents as a scientist (Michael, 2000). Many countries revise their science programs in order to equip individuals with 21st Century skills such as cooperation, critical thinking and creativity (Ravitz, Hixson, English, & Mergendoller, 2012). The most appropriate way to meet these skills is directing individuals to scientific research. The process of presenting scientific knowledge as a whole is called “scientific research” (Geray, 2006; Punch, 2005). The basic principle of scientific research is the inclusion of a planned work process and consists of a number of successive steps. The research process, starting with the identification of the problem includes identification of the methods to be employed, data collection, developing results and recommendations to solve the problem, and preparing a scientific report by including the conclusions reached and recommendations (Llewellyn, 2002). Since this process, called the scientific method, adopts the principle of obtaining the evidence at the point of rejection or verification of facts and principles presented, it may differ from other methods used to reach the information (Honer, Thomas, & Okholm, 2003). The most important tool in the development of scientific research competence in students are science fairs. Students exhibit their scientific projects during these science fairs. In science fairs, the projects submitted by students are reviewed by a jury (Abernathy & Vineyard, 2001; Bunderson & Anderson, 1996). Science fairs allow students, teachers, their friends and scientists, as well as other people in the society to come together and share scientific projects (Abenarty & Vineyard, 2001). Teachers are the main factor in increasing or reducing participation of students in science fairs (Fisanick, 2010). Teachers play an important role in terms of informing and guiding students through science fairs and scientific projects (Blenis, 2000). Students mention their teachers as a source of assistance in project competitions (Schapiro, 1997 as cited in Syer & Shore, 2001). If teachers have first-hand experience and information about scientific research, the interest of students in scientific research will eventually increase (LaBanca, 2008). Many teachers cannot teach students how to prepare a successful science fair project (Cook, 2003). Teachers don’t inform students about the research and project competitions and direct students only to conduct research without fulfilling the necessary guidance tasks in the research process (Akçöltekin, 2014). Teachers should have research and investigation, problem solving and critical thinking skills in order to transfer these skills to the next generation (Saracaloğlu, 2008). Teachers with research skills and positive attitudes towards scientific research and who can use research techniques and analyze scientific research can be trained with only research education offered by educational institutions. In this regard, teachers should be trained with research skills (Taşdemir & Taşdemir, 2011). In addition, since teachers have important responsibilities in terms of spreading the research culture to the social base and giving

1351
Akçöltekin / Investigation of the Effect of Training on the Development of High School Teachers’...
a scientific perspective to the students, they should have a positive attitude towards both research and researchers (Korkmaz, Şahin, & Yeşil, 2011a).
Project applications provide the opportunity to learn by living and gain the ability to conduct scientific research (Raghavan, Coken-Regev, & Strobel, 2001). Projects may have some disadvantages due to the time consuming, complex and extensive structures of them that require some effort (Thomas, 2000). According to Çepni (2007) the disadvantages of projects include increasing workload and responsibilities of teachers, that they may increase the time spent for learning, and an extreme deviation and disintegration could be observed if boundaries of the research are not well-defined (p. 121). Teachers are required to have sufficient theoretical knowledge and experience in the scientific research projects in order to manage the teaching-learning process effectively (Frank & Barzilai, 2004). The project preparation process provides gains for both the students and the teachers in many ways. However, this process is long and difficult to complete. The main causes of these problems are inadequate management of this process (Küfrevioğlu, Baydaş, & Göktaş, 2011). According to the results of the study, a very significant majority of the teachers come to teacher training programs without any project experience (Roth 1999; Shapiro, 1996; Windschilt, 2003), they had difficulties in the process of implementation of projects (Tural, Yiğit, & Alev, 2009), they didn’t receive sufficient guidance in the process and do not have enough information regarding the project stages (Baki & Bütüner, 2009). Teachers with a masters of science degree see themselves as inadequate in the projects (Arslan, 2010) and the vast majority of prospective teachers experience difficulties in the identification of the research problem, experimental design process and determining variables in the projects (Roth, 1999; Shapiro, 1996). These problems arise because teachers don’t receive any practical training related to projects during university years (Baki & Bütüner, 2009).
Teachers are not adequately informed about their roles in the project period (NRC, 2000) and this is seen as an indication that teachers do not have enough pedagogical information about the projects (Frank & Barzilai, 2004). Güven (2013) indicates that a course named “project applications” should be offered to prospective teachers to inform them about project applications. Önen, Mertoğlu, Saka, and Gürdal (2010) suggest that teachers should be encouraged about projects. Bulunuz (2011) states that participations rates of teachers in the projects should be increased by providing institutional and in-service practical training activities for teachers who will be a part of these projects. Çakmakcı (2009) suggests that studies investigating the effectiveness of programs offered to teachers and prospective teachers to provide them a researcher identity are insufficient and new applications should be administrated to teachers and prospective teachers in different majors to provide them a researcher identity. Küfrevioğlu et al. (2011) suggest that in-service training programs can be offered to teachers in summer breaks to increase their awareness. Önen et al. (2010), Erdem, Uzal, and Ersoy (2007)

1352
EDUCATIONAL SCIENCES: THEORY & PRACTICE
state that teachers are positively affected by the project implementation period with activities included in this period, and they consider participating in project activities and have fun doing these activities and gain competence to prepare projects. Akçöltekin (2014) suggests that necessary measures should be taken to eliminate the problems faced during the project implementation period by conducting studies with regard to attitudes of students and teachers towards conducting scientific research and students’ participation in scientific project competitions. In the literature, there are several studies suggesting that attitudes, behaviors and skill levels of teachers have decisive influence on students (Kılıç & Acat, 2007; Oruç & Ulusoy, 2008).
Considering the relevant literature, one of the most important elements in improving students’ competence in scientific research is found to be project competition. Teachers have huge responsibilities in students’ participation in the project competitions. On the other hand, both teachers and prospective teachers are not well-equipped in scientific research methods and the basic steps of the scientific projects; therefore, there is a common conclusion suggesting that they develop a negative attitude towards scientific research methods and project competitions. Attitudes affect the intent of the behavior, and intent of the behavior shapes the actions (Ajzen, 2005; Kollmuss & Agyeman, 2002). Attitude serves as a mediating variable between behaviors and values (McCarty & Shruni, 1993). Individuals who have a positive attitude about a subject behave more responsibly towards the issue compared to those with negative attitudes (Hines, Hungerford, & Tomera, 1987). Thus, attitude is an important factor that can be used to measure the relationship between values and behaviors (Kim & Choi, 2005). As a result of the study, it is thought that attitudes of high school teachers towards project competitions are affected by their negative attitudes towards scientific research and scientific projects; and this is considered one of the causes of possible problems arising in high school students’ participation in scientific project competitions.
The main purpose of this study is to make a positive change in the attitudes of high school teachers towards scientific research methods and project competitions by informing them about scientific research methods and scientific research
For this purpose, the following sub-problems were intended to be answered:
1) What is the impact of the study on teachers’ attitudes towards project competitions?
2) Is there a statistically significant difference between teachers’ attitudes towards project competitions before and after the study in terms of their
a. Gender
b. Education Level

1353
Akçöltekin / Investigation of the Effect of Training on the Development of High School Teachers’...
3) Is there a correlation between teachers’ attitudes towards project competitions and scientific research prior to the study?
4) What is the impact of the study on teachers’ attitudes towards scientific research?
5) Is there a statistically significant difference between teachers’ attitudes towards scientific research before and after the study in terms of their
a. Gender
a. Education Level
6) Is there a correlation between teachers’ attitudes towards project competitions and scientific research after the study?
Method
Research ModelThis study was conducted by using the pretest and posttest model, which is a
pre-experimental research models (Karasar, 1991). In a single group pretest-posttest model, the variable is applied on a randomly selected group. The symbolic view of the model is as follows:
G1 O1.1 X O1.2
G1 O2.1 X O2.2
G1: Research Group, O1.1: First measurement (Pretest), X: Independent Variable (Educational Activities), O1.2: Second Measurement (Posttest)
G1: Research Group, O2.1: Second Measurement (Pretest), X: Independent Variable (Educational Activities), O2.2: Second Measurement (Posttest)
In the model, if O1.2 > O1.1 and O2.2 > O2.1, this is considered to be caused by X application, and evaluated accordingly. In this study, the “Project Competition Attitude Scale” and “Scientific Research Attitude Scale” was applied on 90 high school teachers as the pretest in order to determine the change in their attitudes towards project competitions and scientific research. A total of 90 teachers selected from high schools located in the city center and other districts of the city were trained for 8 hours on scientific research methods and project competitions. At the end of the study both the “Project Competition Attitude Scale” and “Scientific Research Attitude Scale” were administrated to teachers as the posttest and the difference between scores obtained from these two scales were compared in order to see whether there is a statistically significant difference (p < .05). In addition, the correlation between
1354
EDUCATIONAL SCIENCES: THEORY & PRACTICE
scores of the “Project Competition Attitude Scale” and “Scientific Research Attitude Scale,” which were administrated prior to the study, and the correlation between scores of the “Project Competition Attitude Scale” and “Scientific Research Attitude Scale,” which were administrated after the study, were investigated.
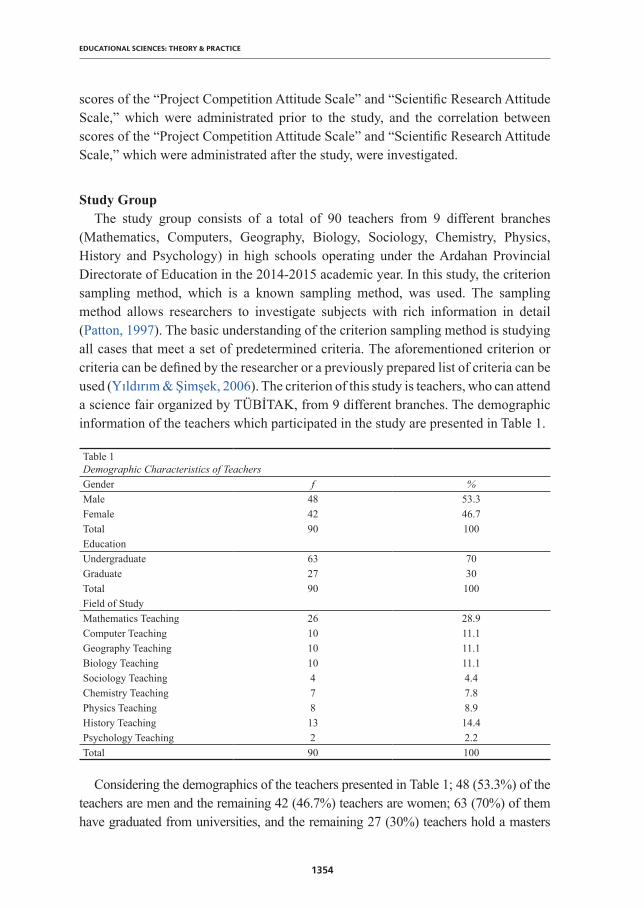
Study GroupThe study group consists of a total of 90 teachers from 9 different branches
(Mathematics, Computers, Geography, Biology, Sociology, Chemistry, Physics, History and Psychology) in high schools operating under the Ardahan Provincial Directorate of Education in the 2014-2015 academic year. In this study, the criterion sampling method, which is a known sampling method, was used. The sampling method allows researchers to investigate subjects with rich information in detail (Patton, 1997). The basic understanding of the criterion sampling method is studying all cases that meet a set of predetermined criteria. The aforementioned criterion or criteria can be defined by the researcher or a previously prepared list of criteria can be used (Yıldırım & Şimşek, 2006). The criterion of this study is teachers, who can attend a science fair organized by TÜBİTAK, from 9 different branches. The demographic information of the teachers which participated in the study are presented in Table 1.
Table 1Demographic Characteristics of TeachersGender f %Male 48 53.3Female 42 46.7Total 90 100EducationUndergraduate 63 70Graduate 27 30Total 90 100Field of StudyMathematics Teaching 26 28.9Computer Teaching 10 11.1Geography Teaching 10 11.1Biology Teaching 10 11.1Sociology Teaching 4 4.4Chemistry Teaching 7 7.8Physics Teaching 8 8.9History Teaching 13 14.4Psychology Teaching 2 2.2Total 90 100
Considering the demographics of the teachers presented in Table 1; 48 (53.3%) of the teachers are men and the remaining 42 (46.7%) teachers are women; 63 (70%) of them have graduated from universities, and the remaining 27 (30%) teachers hold a masters

1355
Akçöltekin / Investigation of the Effect of Training on the Development of High School Teachers’...
of science degree, respectively. Considering the branches of the teachers; 26 (28.9%) of them are teaching Mathematics, 10 (11.1%) Computer, 10 (11.1%) Geography, 10 (11.1%) Biology, 4 (4.4%) Philosophy, 7 (7.8%) Chemistry, 8 (8.9%) Physics, 13 (14.4%) History and the remaining 2 (2.2%) teachers are Guidance teachers, respectively.
Data Collection ToolProject Competitions (Science Fair) Teacher Attitude Scale. In the study, the
“Project Competition Attitude Scale for Teachers,” which was developed by (Tortop, 2013a), was used to collect the data after receiving written approval from the developer of the scale in an e-mail. The 5-point Likert type scale consists of 19 items and 5 factors. In the scale, the positive answers were coded as “I totally agree,” “I agree,” “I haven’t decided yet,” “I disagree,” and “I strongly disagree,” corresponding to a rating system (5, 4, 3, 2 and 1); and the negative answers were coded by following the opposite scoring system (1, 2, 3, 4 and 5). Some of the items in the scale (6, 7, 8, 9, 10, 11, 12, 13, 14, 15, 16, 17, 18 and 19) were coded in reverse due to the negative expressions in the answer, while some other items (1, 2, 3, 4 and 5) were coded normally. (n-1)/n formula was used to have evenly spaced intervals for the rating of the scale and the score corresponding to each space was calculated as 0.80. In this way, the system consisted of rates as 1.00-1.80 for “I strongly disagree,” 1.81-2.60 for “I disagree,” 2.61-3.40 for “I haven’t decided yet,” 3.41-4.20 for “I agree,” and 4.21-5.00 for “I totally agree,” respectively. The lowest score that can be obtained from the scale was determined as 19, while the highest score was 95. Considering the items and factors in the scale; there are 6 items about development of the students (1, 2, 3, 4, 5 and 6), 5 items about importance of education (7, 8, 9, 10 and 11), 3 items about evaluation (12, 13 and 14), 2 items about negative behaviors (15 and 16) and 3 items about mentorship (17, 18 and 19), respectively. The overall Cronbach’s alpha reliability coefficient of the scale was found to be 0.87. The overall factor loads of the scale ranged from 0.458 to 0.868 and explains 51.37% of total variance. The Cronbach’s alpha reliability coefficient of the “Student’s Development” dimension was found to be 0.82, factor loads of this dimension ranged from 0.458 to 0.820 and explains 15.14% of total variance; the Cronbach’s alpha reliability coefficient of the “Importance of Education” dimension was found to be 0.84, factor loads of this dimension ranged from 0.592 to 0.777 and explains 14.09% of total variance; the Cronbach’s alpha reliability coefficient of the “Evaluation” dimension was found to be 0.70, factor loads of this dimension ranged from 0.505 to 0.826 and explains 7.83% of total variance; the Cronbach’s alpha reliability coefficient of the “Negative Behaviors” dimension was found to be 0.76, factor loads of this dimension ranged from 0.715 to 0.868 and explains 7.35% of total variance; the Cronbach’s alpha reliability coefficient of the “Mentorship” dimension was found to be 0.66, factor loads of this dimension ranged from 0.582 to 0.671 and explains 6.93% of total variance, respectively.

1356
EDUCATIONAL SCIENCES: THEORY & PRACTICE
Scientific Research Attitude Scale. In the study, the “Scientific Research Attitude Scale,” which was developed by Korkmaz et al. (2011a) in order to determine attitudes of prospective teachers towards scientific research, was used to determine attitudes of teachers towards scientific research. The 5-point Likert type scale consists of 30 items and 4 factors. In the scale, the positive answers were coded as “I totally agree,” “I agree,” “I haven’t decided yet,” “I disagree,” and “I strongly disagree” that correspond to a rating system (5, 4, 3, 2 and 1); and the negative answers were coded by following the opposite scoring system (1, 2, 3, 4 and 5).
Considering the findings about factors in the scale; the factor “Being Reluctant to Help Researchers” consists of 8 items (1, 2, 3, 4, 5, 6, 7 and 8) and its factor loads range between 0.560 and 0.748. The eigenvalue of this factor in the overall scale is 6.392; its contribution to the general variance is 13.491%. The factor “Negative Attıtude towards Research” consists of 9 items (9, 10, 11, 12, 13, 14, 15, 16 and 17) and its factor loads range between 0.542 and 0.686. The eigenvalue of this factor in the overall scale is 3.453; its contribution to the general variance is 12.597%. On the other hand, the factor “Positive Attitude towards Research” consists of 7 items (18, 19, 20, 21, 22, 23 and 24) and its factor loads range between 0.447 and 0.799. The eigenvalue of this factor in the overall scale is 2.333; its contribution to the general variance is 10.910%. The factor “Positive Attitude towards Researchers” consists of 6 items (25, 26, 27, 28, 29 and 30) and its factor loads range between 0.561 and 0.753. The eigenvalue of this factor in the overall scale is 1.724; its contribution to the general variance is 9.343%. The Cronbach’s alpha reliability coefficients of the scale were determined as 0.85, 0.81, 0.80 and 0.76, respectively. Considering the goodness of fit values obtained as a result of first and second level confirmatory factor analyses; the goodness of fit values obtained for first level confirmatory factor analysis were χ2 (sd = 399, N = 372) = 816.14, p < .001, RMSEA = 0.053, S-RMR = 0.047, GFI = 0.90, AGFI = 0.85, CFI = 0.95, NNFI = 0.95, IFI = 0.94; whereas the goodness of fit values obtained for second level confirmatory factor analysis were χ2 (sd = 401, N = 372) = 830.28, p < .001, RMSEA = 0.054, S-RMR = 0.051, GFI = 0.90, AGFI = 0.85, CFI = 0.95, NNFI = 0.95, IFI = 0.94, respectively.
Before conducting the study, the scale, which was developed to determine attitudes of prospective teachers towards scientific research, was used by performing its adaptation studies on 378 high school teachers in order to determine their attitudes towards scientific research. The findings of the scale were presented under “Adaptation of the Scale.”
Adaptation of the scale. Before conducting the study, the scale, which was developed to determine attitudes of prospective teachers towards scientific research, was used by performing its adaptation studies on 378 high school teachers in order to

1357
Akçöltekin / Investigation of the Effect of Training on the Development of High School Teachers’...
determine their attitudes towards scientific research. The findings of the scale were presented under “Adaptation of the Scale”. First, exploratory factor analysis was applied on the data obtained. The goodness of fit values of the model were determined by applying first and second level confirmatory factor analyses on the data obtained from exploratory factor analysis.
Findings of the Exploratory Factor AnalysisFactor analysis was used to validate the measurement tool used (Büyüköztürk,
2007). Factor analysis is the most powerful method to examine the construct validity and factor analysis requires less factors by bringing the variables measuring the same quality together (Tabachnick & Fidell, 2001). First, exploratory factor analysis (EFA) was performed on variables in order to test the construct validity of Scientific Research Attitude Scale. The data was analyzed with Kaiser-Meyer-Olkin (KMO) and Bartlett Tests for testing their compliance to the data structure for factor analysis in terms of sample size. The results of exploratory factor analysis, which was performed to test the construct validity of the scale are as follows; KMO= 0.898; Barlett test value χ2
= 8260.580; sd = 435 (p = .000). In behavioral science, since KMO values greater than or equal to 0.60 are deemed sufficient to perform factor analysis (Büyüköztürk, 2010), factor analysis can be performed on the scale that consists of 30 items. As a result of the factor analysis, since factor loads of M1, M3, M22, M6, M7, M8 and M11 were below 0.40 after the rotation process, they were excluded from the scale (Sipahi et al., 2010). When factor analysis was reapplied on the resulting new scale factors, M24 was found to be comorbid in the 1st and 3rd factors and they were removed from the scale where the difference between their factor loads was not 0.100. As a result of the analysis performed, if the difference between two factors is not higher than 0.100, they should be excluded from the scale since it is considered as an indication of disintegration of the two factors (Balcı, 2009; Büyüköztürk, 2002). According to the repeated factor analysis on scale items, KMO = 0.864, χ2 = 5487.977; sd = 253 (p = .000) and items of the scale were found to be explaining 62 219% of the total variance. The item total correlation of resulting 4-factor scale was found to range between 0.488 and 0.873 and the total Cronbach’s alpha reliability coefficient of the scale was determined to be 0.86.
Considering the reliability coefficients of items, factor load intervals of these items and factors of the resulting four-factor scale; the first factor was found to range from 0.700 to 0.873 and the reliability coefficient was found to be 0.92; the second factor was found to range from 0.542 to 0.785 and the reliability coefficient was found to be 0.84; the third factor was found to range from 0.505 to 0.797 and the reliability coefficient was found to be 0.79; the fourth factor was found to range from 0.488 to 0.808 and the reliability coefficient was found to be 0.77, respectively.

1358
EDUCATIONAL SCIENCES: THEORY & PRACTICE
The items included in the scientific attitude scale as a result of exploratory factor analysis given to 5 different faculty members from 4 different universities, who are specialized in the field of scientific research methods at both undergraduate and graduate level, in order to receive their opinions about content validity of the scale. As a result of positive feedback suggesting that these items serve the purpose of the study received by these experts, it has been concluded that these items can be used to determine attitudes of teachers towards scientific research. Content validity shows whether the desired characteristic to be measured is adequately represented by the items included in the measurement tool (Erkuş, 2001; Öner, 1997). Content validity of the scale shows to what extent the scale and items included in the scale serve the purpose of the study (Ercan & Kan, 2004). Receiving expert opinion is one of the common methods used to determine content validity representing adequacy of the items both quantitatively and qualitatively (Kurnaz & Yiğit, 2010). The form of content validity should be given to at least three experts and these experts should evaluate the form independently (Erefe, 2002).
Considering the correlation values between factors of the four-factor scale; there is a weak and negative correlation between F1 and F2 (r= -.392; p < .001), there is a moderate and positive correlation between F1 and F3 (r = 0.544; p < .001), there is a weak and negative correlation between F1 and F4 (r = -.324; p < .001), there is a moderate and negative correlation between F2 and F3 (r = -.504; p < .001), there is a weak and negative correlation between F3 and F4 (r = -.320; p < .001) and lastly there is a weak and positive correlation between F2 and F4 (r = 0.430; p < .001), respectively. If the correlation coefficient (r) is between 0.00-0.25, there is a very weak relationship between variables; if it is between 0.26-0.49, there is a weak relationship; if it is between 0.50-0.69, there is a moderate relationship; if it is between 0.70-0.89, there is a strong relationship and if it is between 0.90-1.00, there is a very strong relationship between variables (Kalaycı, 2005). The weak correlation between factors shows that factors are independent from each other and it supports the factor structure. As a result of these operations, the findings related to item loads, eigenvalues of the factors, their degree to explain variance and reliability values are presented in Table 2.
As seen in Table 2, the first factor of the scale “Positive Attitudes towards Researchers” consists of 6 items with an eigenvalue of 4.568 and 19.862% contribution to the general variance; the second factor of the scale “Being Reluctant to Help Researchers” consists of 6 items with an eigenvalue of 3.655 and 15.896% contribution to the general variance; the third factor of the scale “Positive Attitudes towards Research” consists of 5 items with an eigenvalue of 3.051 and 13.264% contribution to the general variance and the fourth factor of the scale “Negative Attitudes towards Researches” consists of 5 items with an eigenvalue of 3.036 and 13.199% contribution to the general variance, respectively. Considering the total

1359
Akçöltekin / Investigation of the Effect of Training on the Development of High School Teachers’...
scale, 62.219% of total variance is explained by the factors of the scale. According to Tavşancıl (2002), the variance rates between 40% and 60% are considered adequate in the analysis of social sciences.
Table 2Results of the Factor AnalysisFactors İtem No İtems F1 F2 F3 F4 α
(Fac
tor
1)Po
sitiv
e Att
itude
s Tow
ards
R
esea
rche
rs
M28 Scientists are always open for self-development and new developments .873
M27 Scientists should have high predictive power. .866
M26 Scientists should think universally with objective, intel-lectual and moral responsibilities. .845 .927
M25 Scientists are honest, knowledgeable, productive, and respectful people. .823
M30 Scientists are respectful people who try to understand and tell glorious mysteries of the universe. .801
M29 Scientists don’t act contrary to the ethical rules no matter what happens. .700
(Fac
tor
2)U
nwill
ingn
ess f
or H
elpi
ng th
e R
esea
rche
rs
M2 I don’t want to contribute to scientific research since our opinions are not taken into account. .785
M9 I find research results unreliable due to the collection of information in a narrow space. .756
M5 I don’t want to contribute to scientific research since our opinions are not taken into account. .673
M10 I think there is a problem in the sources where data is col-lected, therefore I don’t rely on scientific research results. .624 .841
M4 I don’t not want to help scientific researchers because they work to get a title in general. .587
M13 I find research results unreliable since the data is collect-ed from limited resources. .542
(Fac
tor
3)Po
sitiv
e Att
itude
s fo
r R
esea
rch’
s
M19 I take pleasure in doing scientific research. .797M20 I like reading scientific research. .762
M21 I try to solve my problems by using scientific research methods. .668 .794
M23 I would like to do scientific research if someone gives me the opportunity. .599
M18 Research is part of my field of interest. .505
(Fac
tor
4)N
egat
ive A
ttitu
des
tow
ards
Res
earc
hes M16 I find research consuming too much time unnecessary. .808
M15 Development and change takes place automatically. Be-cause of this there is no need for scientific research .800
M12 It is enough to know history. There is no need to make new research. .792 .778
M14 Scientific research is part of the natural sciences; it can-not be in social sciences. .579
M17 Research results often worry me. .488Eigenvalues: 4.568 3.655 3.051 3.036
Explained Variance: 19.862 15.896 13.264 13.199Scale Cronbach Alpha: 0.865

1360
EDUCATIONAL SCIENCES: THEORY & PRACTICE
First and Second Level Confirmatory Factor Analysis
As a result of the first level confirmatory factor analysis, the goodness of fit values were found as χ2(sd, N)= 650.46 (203, 378), χ2/sd = 3.204, RMSEA = 0.076, S-RMR = 0.061, AGFI = 0.83, NFI = 0.90, NNFI = 0.92, CFI = 0.93 and IFI = 0.93. The goodness of fit values were found as χ2(sd, N) = 513.22 (200, 378), χ2/sd = 2.566, RMSEA = 0.064, S-RMR = 0.056, AGFI = 0.86, NFI = 0.95, NNFI = 0.95, CFI = 0.94 and IFI = 0.94 after making modifications on the items (F1_2 and F1_1; F2_4 and F2_2 and F2_6 and F2_2) in the first level confirmatory factor analysis. According to the data obtained, they have acceptable goodness of fit values. In other words, this model shows that the factors included in the scale are confirmed by the data. The factorial model and t values of the relationship between factors-items obtained as a result of the first level confirmatory factor analysis are presented in Figure 1.
The second level confirmatory factor analysis was performed in order to show that the dimensions “Positive Attitudes towards Researchers,” “Being Reluctant to Help Researchers,” “Positive Attitudes towards Research,” and “Negative Attitudes towards Research,” which were obtained by the first level confirmatory factor analysis, represent a higher concept. The latent variables obtained by the first level confirmatory factor analysis were used as the basis of this model. In this model, it has been shown that the attitude variable was explained by the first level variables with variances. The first level confirmatory structure was tested by 4 latent and 22 indicator variables and second
Figure 1. First Level Confirmatory Factor Analysis Connection Diagram of the Scale (t-values).

1361
Akçöltekin / Investigation of the Effect of Training on the Development of High School Teachers’...
level attitude latent variable is added to this structure and the goodness of fit values were found to be χ2/sd, N (653.71, sd = 205, N = 378), RMSEA = 0.076, S-RMR = 0.062, GFI = 0.86, AGFI = 0.083, CFI = 0.93, NNFI = 0.92, IFI = 0.93, NFI = 0.90. The goodness of fit values were found as χ2/sd, N(517.32, sd = 202, N = 378), RMSEA= 0.064, S-RMR = 0.058, GFI = 0.89, AGFI = 0.086, CFI = 0.95, NNFI = 0.95, IFI = 0.96, NFI = 0.95 after making modifications on the items (F1_2 and F1_1; F2_4 and F2_2 and F2_6 and F2_2) in the second level confirmatory factor analysis.
The values obtained indicate that data is sufficient for the model (Lewis et al., 2002; Olivares et al., 2004). The connection diagram of the second level confirmatory factor analysis and t-values are presented in Figure 2.
The first level variables in the model and second level variable “scientific research attitude” and factor loads between them (λx), t values, measurement errors (delta, δ) and explanation rates of second level variables on the first level variables (R2) are given in Table 4.
Table 3 Second Level Confirmatory Factor Analysis Values of the ScaleSecond Level Variables First Level Variable λx δ coefficient (Measuring Error) t R2
F1 0.58 0.52 9.18 0.40Scientific Research Attitude F2 0.72 0.49 -9.60 0.52
F3 0.84 0.29 12.11 0.71F4 0.39 0.85 -5.51 0.15
Figure 2. The Connection Diagram of the Second Level Confirmatory Factor Analysis of Scientific Research Attitude Scale (t-values).
1362
EDUCATIONAL SCIENCES: THEORY & PRACTICE
As it can be seen in Table 3, considering the coefficients and t values between second level attitude latent variable and first level (λx = 0.58; p < .05; t = 9.18) and third level latent variables; there is a positive and significant relationship between attitude and first and third factors; and there is a negative and significant relationship between second (λx = 0.72; p < .05; t = -9.60) and fourth (λx = 0.39; p < .05; t = -5.51) factors. If the t value is higher than 1.96, the significance level is accepted as p = .05 and if it is higher than 2.56, then the significance level is accepted as p = .001, respectively (Schumacker & Lomax, 2010). In this model, t values of all items and t values of all factors in these items should be significant to have an acceptable model. Considering the variances explained by second level attitude latent variables in the first level variables, the most positive attitude towards research in the first level variables was found as (R2 = 0.71) and the least positive attitude towards research in the first level variables were found as (R2 = 0.15), respectively. The determination coefficient (R2) should be defined like other fit indices in other research. (R2) is defined as the variance explained and it is a coefficient which determines to what extent changes in the latent variables of indicator variables are explained (Kelloway, 1998). If the value of (R2) is below 0.2, it is weak; if it is between 0.2 and 0.4, then it is moderate and lastly if it is higher than 0.4, then it is considered strong (https://www.american.edu/ctrl/ p. 4).
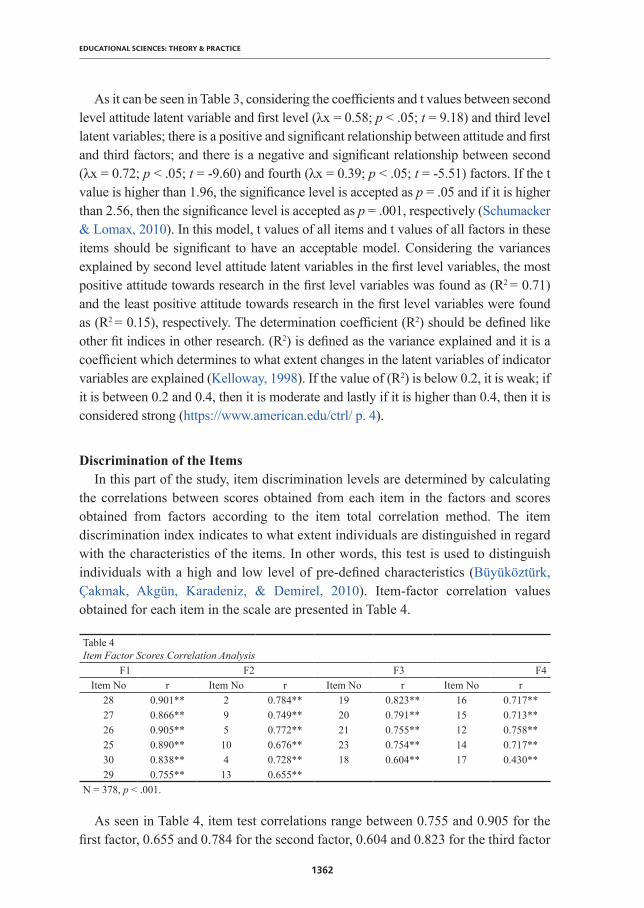
Discrimination of the ItemsIn this part of the study, item discrimination levels are determined by calculating
the correlations between scores obtained from each item in the factors and scores obtained from factors according to the item total correlation method. The item discrimination index indicates to what extent individuals are distinguished in regard with the characteristics of the items. In other words, this test is used to distinguish individuals with a high and low level of pre-defined characteristics (Büyüköztürk, Çakmak, Akgün, Karadeniz, & Demirel, 2010). Item-factor correlation values obtained for each item in the scale are presented in Table 4.
Table 4Item Factor Scores Correlation Analysis F1 F2 F3 F4
Item No r Item No r Item No r Item No r28 0.901** 2 0.784** 19 0.823** 16 0.717**27 0.866** 9 0.749** 20 0.791** 15 0.713**26 0.905** 5 0.772** 21 0.755** 12 0.758**25 0.890** 10 0.676** 23 0.754** 14 0.717**30 0.838** 4 0.728** 18 0.604** 17 0.430**29 0.755** 13 0.655**
N = 378, p < .001.
As seen in Table 4, item test correlations range between 0.755 and 0.905 for the first factor, 0.655 and 0.784 for the second factor, 0.604 and 0.823 for the third factor

1363
Akçöltekin / Investigation of the Effect of Training on the Development of High School Teachers’...
and 0.430 and 0.758 for the fourth factor, respectively. Each item in the factors has a significant and positive relationship with the items of the sub-scales (p < .001). These coefficients are validity coefficients of each item in the scale and they represent the consistency of the scale.
The first factor of the scale “Positive Attitude towards Researchers” consists of 6 items (25, 26, 27, 28, 29 and 30), the second factor of the scale “Being Reluctant to Help Researchers” consists of 6 items (2, 9, 5, 10, 4 and 13), the third factor of the scale “Positive Attitudes towards Research” consists of 5 items (19, 20, 21, 23 and 18) and the fourth factor of the scale “Negative Attitudes towards Research” consists of 5 items (16, 15, 12, 14 and 17), respectively. (n-1)/n formula was used to have evenly spaced intervals for the rating of the scale and the score corresponding to each space was calculated as 0.80. In this way, the system was rates as 1.00-1.80 for “I strongly disagree,” 1.81-2.60 for “I disagree,” 2.61-3.40 for “I haven’t decided yet,” 3.41-4.20 for “I agree” and 4.21-5.00 for “I totally agree”, respectively. The lowest score that can be obtained from the scale was determined as 22, while the highest score was 110.
In the scale, the positive answers were coded as “I totally agree,” “I agree,” “I haven’t decided yet,” “I disagree,” and “I strongly disagree” that are corresponding to a rating system (5, 4, 3, 2 and 1); and the negative answers were coded by following the opposite scoring system (1, 2, 3, 4 and 5). Accordingly, items in the 1st and 3rd factors of the scale are coded regularly because they include positive statements; and the high score obtained from the 1st factor of the scale shows that positive attitudes of teachers towards researchers are increased while the high score obtained from 3rd factor of the scale shows that positive attitudes of teachers towards research are increased. The items in the 2nd and 4th factors of the scale are coded irregularly because they include negative statements; and high scores received from these factors indicate that negative attitudes are reduced and positive attitudes are increased. According to this, the high score obtained from the 2nd factor of the scale show that negative attitudes of teachers towards helping researchers are decreased and their positive attitudes are increased; and the high score obtained from the 4th factor of the scale show that negative attitudes of teachers towards research are decreased and their positive attitudes are increased.
Structure of the StudyThis study was conducted on a total of 90 teachers from 9 difference branches
(Mathematics, Computers, Geography, Biology, Sociology, Chemistry, Physics, History and Psychology) in high schools operating under the Ardahan Provincial Directorate of Education in the 2014-2015 academic year between 25/05/2015- 29/05/2015. In this study, the “Project Competition Attitude Scale” and “Scientific Research Attitude Scale” was applied on high school teachers as the pretest in order to determine the change in
1364
EDUCATIONAL SCIENCES: THEORY & PRACTICE
their attitudes towards project competitions and scientific researches. Then, they were informed about the subject to be covered during the study. The study lasted 8 hours in total to avoid disrupting their educational programs described in the curriculum. In the first 4 hours of the study, teachers were informed about scientific research methods by using educational materials developed in accordance with contents of International Institute for Educational Planning (2005) and Research Methods in Education (2012). In the remaining 4-hour period, the educational materials, which were developed in accordance with contents of Ministry of National Education Lifelong Learning General Directorate of Project Preparation Guide (2013) and TÜBİTAK 45th Secondary Students Research Project Competition Project Guide (2014), were used.
In the 1st hour of the application phase, teachers were informed about Basic Concepts and Research Stages in Scientific Research. In the 2nd hour, they were informed about Scientific Research Methods and Research Designs. In the 3rd hour, they were informed about preparation and application of Data Collection Tools and in the 4th hour, data analysis techniques and reporting the data obtained were discussed; and the first 4-hour period of the application was completed by allowing teachers to share their experiences by interacting with each other. In the 5th hour of the application phase, they were asked “What is the Project?” and informed about general and specific objectives of the project, main features of the project, project writing process and responsibilities of teacher during the project. In the 6th hour, they were informed about rationale, limitations, duration of the project, activities and details of these activities. In the 7th hour, they were informed about project outcomes, sustainability, performance indicators and logical framework. In the 8th hour, two completed projects in the area of social sciences were explained step by step to achieve the integrity and then the “Project Competitions Teacher Attitude Scale” and “Scientific Research Attitude Scale” were administrated on teachers as the posttests.
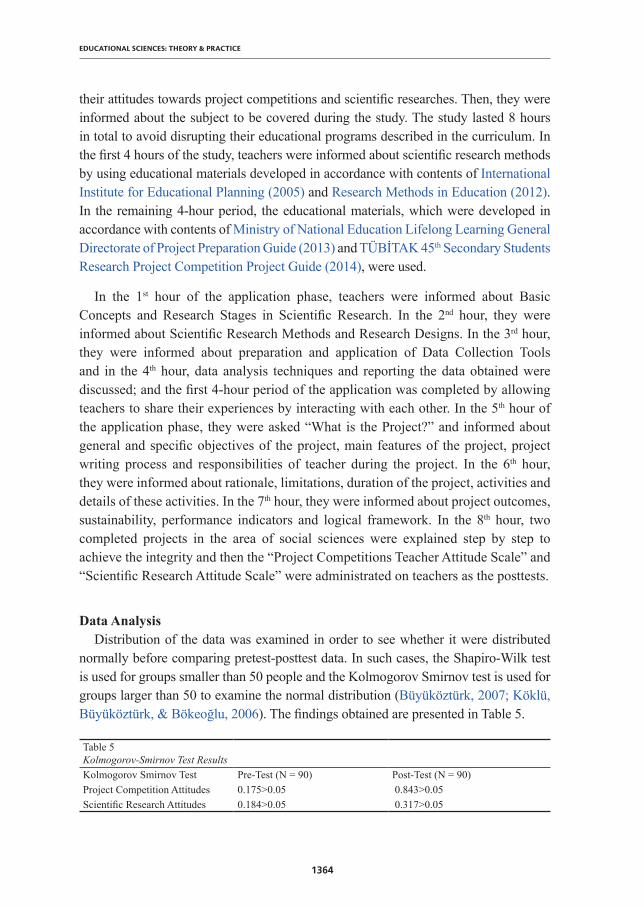
Data AnalysisDistribution of the data was examined in order to see whether it were distributed
normally before comparing pretest-posttest data. In such cases, the Shapiro-Wilk test is used for groups smaller than 50 people and the Kolmogorov Smirnov test is used for groups larger than 50 to examine the normal distribution (Büyüköztürk, 2007; Köklü, Büyüköztürk, & Bökeoğlu, 2006). The findings obtained are presented in Table 5.
Table 5Kolmogorov-Smirnov Test ResultsKolmogorov Smirnov Test Pre-Test (N = 90) Post-Test (N = 90)Project Competition Attitudes 0.175>0.05 0.843>0.05Scientific Research Attitudes 0.184>0.05 0.317>0.05
1365
Akçöltekin / Investigation of the Effect of Training on the Development of High School Teachers’...
Considering the Kolmogorov-Smirnov test results of teachers presented in Table 5, the data of pretest-posttest of project competitions attitude scale and scientific research attitude scale are found to be distributed normally (p > .05) and they can be analyzed by using parametric statistical techniques. A paired samples t-test was used to determine whether the difference between pretest-posttest scores of teachers received from the entire scale and project competitions attitude scale and scientific research attitude scale is statistically significant. A paired samples t-test is used to test whether the difference between average values of two samples is significant. In order to use the t-test for related samples, the score of the dependent variables should be at least interval scale and the difference scores associated with set points should have a normal distribution. In experimental studies, when measurements of the subjects related to the dependent variable are taken before and after experimental operations, repeated time-dependent measurements of the subjects are required. In this case, the measurements obtained are related and it is convenient to use a t-test for related groups in the analysis phase due to the repeated measurements (Büyüköztürk, 2010). Pearson correlation analysis was performed in order to determine the correlation between pretest-posttest attitude scores of teachers towards project competitions and scientific research. The correlation coefficient is used to find the extent of the relationship between two variables and interpret this relationship. Pearson’s correlation coefficient requires two continuous variables with normal distribution together (Büyüköztürk, 2014). The effect size (η2) correlation coefficient was calculated in order to investigate the effect of the activities performed during the research on the attitudes of teachers towards project competitions and scientific researches. The effect size is used to determine the effect of independent variable on dependent variable (Akbulut, 2010; Büyüköztürk, 2007, 2010). In addition, an unrelated samples t-test was used to determine the statistical change of attitudes of teachers towards project competitions and scientific researches and pretest and posttest scores from the entire scale and sub-scales according to their gender and educational level. This test is a parametric test used to test the significance between averages values of two independent variables. In order to use an independent samples t-test, two samples groups should be unrelated, the dependent variable should be measured at an interval or ratio scale level, and raw scores of populations representing each sample should have a normal distribution (Büyüköztürk, Çokluk, & Köklü, 2011).
FindingsIn this part of the study, in addition to determination of the statistical change of
attitudes of teachers towards project competitions and scientific research during the study and pretest and posttest scores from the entire scale and sub-scales according to their gender and educational level, the statistical change of attitudes of teachers towards scientific research during the study in the entire scale and all other factors

1366
EDUCATIONAL SCIENCES: THEORY & PRACTICE
of the scale was investigated according to their gender and educational level. Distribution of pretest-posttest scores of teachers received from the entire attitude scale and factors included in the scale are presented in Table 6.
Table 6Pretest-Posttest Results of Project Competition Teacher Attitude ScaleDimensions of the Scale Group N X Ss sd t p η2
The Overall ScalePre-Test 90 3.68 .437
89 -3.602 .001* .067Post-Test 90 3.84 .391
Student DevelopmentPre-Test 90 4.27 .500
89 -.997 .321 -Post-Test 90 4.32 .434
The Importance of EducationPre-Test 90 4.23 .680
89 -1.174 .862 -Post-Test 90 4.24 .628
EvaluationPre-Test 90 1.87 .667
89 -2.567 .012* .035Post-Test 90 2.14 .885
Negative Behavior Pre-Test 90 3.80 .816
89 -2.331 .022* .029Post-Test 90 4.04 .693
MentoringPre-Test 90 3.35 .771
89 -4.632 .000* .100Post-Test 90 3.78 .698
As can be seen in Table 6, the arithmetic average of pretest scores of teachers received from project competitions teacher attitude score was found as (X = 3.68), while the arithmetic average of posttest scores of teachers received from project competitions teacher attitude score was found as (X = 3.84), respectively. According to these results, there is an increase in favor of the posttest scores; thus, there is a statistically significant difference between pretest-posttest scores of the group (t(89) =
-3.602; p < .05). Considering the relationship between factors of project competition teacher attitude scale and pretest-posttest scores of teachers, there is no significant difference between development of the students and importance of education dimensions and pretest-posttest scores of teachers. On the other hand, the arithmetic average of pretest scores of teachers received from evaluation dimension was found as (X = 1.87) and the average posttest scores was found as (X = 2.14), respectively. According to these results, there is an increase in favor of the posttest scores; thus, there is a statistically significant difference between pretest-posttest scores of the group (t(89) = -2.657; p < .05). In the negative behavior dimension, the average pretest score of teachers was found as (X = 3.80) and the average posttest score of teachers was found as (X = 4.04), respectively. Thus, there is an increase in favor of the posttest scores and there is a statistically significant difference between pretest-posttest scores of the group (t(89) = -2.331; p < .05). Finally, in the mentorship dimension of the scale, the average pretest score of teachers was found as (X = 3.35) and the average posttest score of teachers was found as (X = 3.78), respectively. There is a statistically significant difference between pretest-posttest scores of the group (t(89) = -4.632; p < .05). At this point, considering the effect size of entire scale and factors included in the scale (η2); the effect size was found as (η2 = .067) in the entire scale, it was

1367
Akçöltekin / Investigation of the Effect of Training on the Development of High School Teachers’...
found as (η2 = .035) in the evaluation dimension, (η2 = .029) in the negative behavior dimension and (η2 =.100) in the mentorship dimension, respectively. This can be considered an effect size from small to moderate. Because the effect sizes 0.01, 0.06 and 0.14 are defined as small, moderate and large, respectively (Gren, Salkind, & Akey, 2000; Köklü et al., 2006, pp. 171–172). The pretest-posttest results of teachers with regard to the relationship between their attitudes towards project competitions and their gender are shown in Table 7.
Table 7The Difference between Attitudes of Teachers towards Project Competitions by Their GenderDimensions of the Scale Group Gender N X Ss sd t p
The Overall ScalePre-Test
Male 48 3.61 .509 88 -1.753 .083Female 42 3.77 .322
Post-TestMale 48 3.81 .413 88 -.776 .440
Female 42 3.87 .367
Student DevelopmentPre-Test
Male 48 4.23 .569 88 -.735 .465Female 42 4.31 .411
Post-TestMale 48 4.33 .409 88 .129 .898
Female 42 4.32 .466
The Importance of EducationPre-Test
Male 48 4.09 .803 88 -2.053 .043*Female 42 4.38 .468
Post-TestMale 48 4.15 .720 88 -1.396 .166
Female 42 4.34 .494
EvaluationPre-Test
Male 48 1.84 .730 88 -.350 .727Female 42 1.89 .595
Post-TestMale 48 2.21 .926 88 .852 .396
Female 42 2.05 .839
Negative BehaviorPre-Test
Male 48 3.72 .967 88 -.948 .346Female 42 3.89 .600
Post-TestMale 48 3.94 .693 88 -.749 .456
Female 42 4.05 .717
MentoringPre-Test
Male 48 3.25 .895 88 -1.345 .182Female 42 3.46 .589
Post-TestMale 48 3.68 .751 88 -1.427 .157
Female 42 3.89 .622p < .05.
Considering the change of pretest-posttest scores of male and female teachers in regard with their attitudes towards project competitions by their gender presented in Table 7, there is no statistically significant difference between pretest-posttest scores of teachers in regard to their attitudes towards project competitions (pretest = t((88)= -1.753; p > 0.05) and posttest= t((88) = -.776; p > 0.05). There is a significant difference in favor of female teachers in the pretest results of importance of education dimension of teacher attitude scale towards project competitions, while no statistically significant difference was found between posttest scores of male and female teachers in the importance of the education dimension of the scale (pretest = t((88) = -2.053; p <

1368
EDUCATIONAL SCIENCES: THEORY & PRACTICE
0.05) and posttest = t((88)= -1.396; p > 0.05). The pretest-posttest results of teachers in regard with the relationship between their attitudes towards project competitions and their educational level are shown in Table 8.
Table 8The Difference between Attitudes of Teachers towards Project Competitions by Their Educational LevelDimensions of the Scale Group Education Status N X Ss sd t p
The Overall ScalePre-Test
Undergraduate 63 3.66 .432 88 -.706 .482Graduate 27 3.73 .455
Post-TestUndergraduate 63 3.82 .427 88 -.397 .693Graduate 27 3.86 .297
Student DevelopmentPre-Test
Undergraduate 63 4.28 .440 88 .130 .897Graduate 27 4.26 .627
Post-TestUndergraduate 63 4.34 .434 88 .448 .655Graduate 27 4.29 .441
The Importance of Education
Pre-TestUndergraduate 63 4.22 .661 88 -.054 .957Graduate 27 4.23 .735
Post-TestUndergraduate 63 4.17 .680 88 -1.549 .125Graduate 27 4.40 .460
EvaluationPre-Test
Undergraduate 63 1.77 .551 88 -2.044 .054Graduate 27 2.08 .855
Post-TestUndergraduate 63 2.13 .917 88 -.052 .959Graduate 27 2.14 .823
Negative BehaviorPre-Test
Undergraduate 63 3.79 .796 88 -.210 .834Graduate 27 3.83 .877
Post-TestUndergraduate 63 3.96 .752 88 -.816 .417Graduate 27 4.09 .572
MentoringPre-Test
Undergraduate 63 3.31 .771 88 -.744 .459Graduate 27 3.44 .779
Post-TestUndergraduate 63 3.83 .742 88 .944 .348Graduate 27 3.67 .580
As it can be seen in Table 8, considering the change of pretest-posttest scores of male and female teachers in regard with their attitudes towards project competitions by their educational level (undergraduate, graduate), there is no statistically significant difference between pretest-posttest scores of teachers in regard to their attitudes towards project competitions according to their educational level (undergraduate, graduate) (pretest = t((88)= -.706; p > .05) and posttest = t((88) = -.397; p > .05). The correlation between pretest results of teachers in regard to their attitudes towards project competitions and scientific research are shown in Table 9.
Table 9The Correlation Analysis Results of Pretest Results of Teachers in Regard to Their Attitudes towards Project Competitions and Scientific ResearchVariable N r pAttitudes towards Project Competitions 90 0.149 .162Attitudes towards Scientific Research 90Note. r: Pearson’s correlation coefficient, p: significance level, p < .05 is taken as reference, N: Number of Data.

1369
Akçöltekin / Investigation of the Effect of Training on the Development of High School Teachers’...
Considering the correlation between pretest results of teachers in regard with their attitudes towards project competitions and scientific researches; there was a weak and statistically insignificant correlation between attitudes of teachers towards project competitions and scientific research before the application (r = 0.149; p > .05). The pretest-posttest results of teachers received from the entire scientific research attitude scale and factors included in the scale are presented in Table 10.
Table 10Pretest and Posttest Results of Attitudes of Teaches towards Scientific ResearchDimensions of the Scale Group N X Ss sd t p η2
The Overall ScalePre-Test 90 3.69 .645
89 -5.432 .000* 0.142Post-Test 90 4.10 .323
Positive Attitudes towards Researchers Pre-Test 90 3.95 .891
89 -4.474 .000* 0.101Post-Test 90 4.40 .519
Unwillingness for Helping Researchers Pre-Test 90 3.43 .823
89 -6.325 .000* 0.183Post-Test 90 4.02 .428
Positive Attitudes towards Research Pre-Test 90 3.60 .761
89 -5.585 .000* 0.149Post-Test 90 4.11 .502
Negative Attitudes towards Research Pre-Test 90 3.81 .708
89 -2.984 .004* 0.047Post-Test 90 4.04 .436
As can be seen in Table 6, the arithmetic average pretest score of teachers received from scientific research attitude scale was found as (X = 3.69), while the arithmetic average posttest score of teachers received from scientific research attitude scale was found as (X = 4.10), respectively. According to these results, there is an increase in favor of the posttest scores; thus, there is a statistically significant difference between pretest-posttest scores of the group (t(89) = -5.432; p < .05). On the other hand, a statistically significant difference is observed in the sub-scales of scientific research attitude scale of teachers. In this regard, a statistically significant difference was found in favor of posttest scores received from “Positive Attitudes towards Researchers” (t(89) = -4.474; p < .05), “Being Reluctant to Help Researchers” (t(89) = -6.325; p < .05), “Positive Attitudes towards Researches” (t(89) = -5.585; p < .05) and “Negative Attitudes towards Researches” (t(89) = -2.984; p < 0.05). At this point, considering the effect size of entire scale and factors included in the scale (η2); the effect size was found as (η2 = .142) in the entire scale, (η2 = .101) in the “Positive Attitudes towards Researchers” sub-scale, (η2 = .183) in the “Being Reluctant to Help Researchers” sub-scale, (η2 = .149) in the “Positive Attitudes towards Researchers” sub-scale and (η2 = .047) in the “Negative Attitudes towards Researches” sub-scale. This can be considered as a large effect size in the entire scale and all factors of the scale. The relationship between gender of teachers and their attitudes towards scientific research are presented in Table 11.

1370
EDUCATIONAL SCIENCES: THEORY & PRACTICE
Table 11The Difference between Attitudes of Teachers towards Scientific Research According to Their GenderDimensions of the Scale Group Gender N X Ss sd t p
The Overall Scale
Pre-Test Male 48 3.56 .741 88 -2.015 .057Female 42 3.83 .482
Post-Test Male 48 4.13 .308 88 .812 .419Female 42 4.07 .340
Positive Attitudes Towards Researchers
Pre-Test Male 48 3.79 1.011 88 -1.935 .056Female 42 4.15 .695
Post-Test Male 48 4.41 .559 88 .076 .939Female 42 4.40 .477
Unwillingness for Helping Researchers
Pre-Test Male 48 3.28 .860 88 -1.864 .066Female 42 3.60 .752
Post-Test Male 48 4.02 .447 88 .029 .977Female 42 4.02 .411
Positive Attitudes towards Research
Pre-Test Male 48 3.55 .852 88 -.703 .484Female 42 3.67 .647
Post-Test Male 48 4.16 .471 88 .997 .321Female 42 4.05 .535
Negative Attitudes towards Research
Pre-Test Male 48 3.68 .807 88 -1.958Female 42 3.97 .544 .053
Post-Test Male 48 4.02 .313 88 .935 .353Female 42 3.92 .619
p < .05.
Considering the comparison of the change of pretest and posttest scores of teachers towards scientific research by their gender with unrelated samples t-test; there is no statistically significant difference between pretest and posttest scores of male and female teachers in regard to scientific researches (pretest = t((88) = -2.015; p > .05) and posttest = t((88) = .812; p > .05). The relationship between attitudes of teachers towards scientific research and educational level is shown in Table 12.
Considering the comparison of the change of pretest and posttest scores of teachers towards scientific research by their educational level (undergraduate, graduate) with an unrelated samples t-test; there is no statistically significant difference between pretest and posttest scores of teachers holding a bachelor degree and graduate degree in regard to scientific researches in the entire scale and all factors included in the scale (pretest = t((88) = -1.807; p > .05) and posttest = t((88) = .449; p > .05). The correlation between attitudes of teachers towards preparing projects and scientific research is given in Table 13.
Considering the posttest correlation analysis results of teachers in regard with their attitudes towards project preparation and scientific research in Table 13; a significant and moderately positive relationship was found between their attitudes towards project preparation and scientific research after the application (r = 0.319; p < .05).

1371
Akçöltekin / Investigation of the Effect of Training on the Development of High School Teachers’...
DiscussionAs a result of the study, a statistically significant difference in favor of posttest
scores of teachers was found in their attitudes towards project competitions (p < .05). According to this result, it can be suggested that attitudes of teachers towards project competitions were developed in a positive way.
A statistically significant difference in favor of posttest scores of teachers received from mentorship, negative behavior and evaluation dimensions of the scale was found (p < .05). According to these results, teachers developed a positive attitude as being a mentor during these competitions, they developed a positive attitude about the fact that students develop positive behaviors during project competitions, and lastly they developed a positive attitude about evaluation of the projects submitted to the competitions. Tortop (2013a; 2013c) concluded that teachers don’t want to attend project competitions as a mentor unless it is necessary and they have a negative
Table 12The Difference between Attitudes of Teachers towards Scientific Research According to Their Educational LevelDimensions of the Scale Group Education Status N X Ss sd t p
The Overall ScalePre-Test
Undergraduate 63 3.61 .659 88 -1.807 .074Graduate 27 3.88 .581
Post-TestUndergraduate 63 4.11 .347 88 .449 .655Graduate 27 4.08 .262
Positive Attitudes towards Researchers Pre-Test
Undergraduate 63 3.94 .914 88 -.154Graduate 27 3.98 .854 .878
Post-TestUndergraduate 63 4.45 .503 88 1.205 .232Graduate 27 4.30 .554
Unwillingness for Helping Research-ers
Pre-TestUndergraduate 63 3.30 .860 88 -2.174 .062Graduate 27 3.61 .661
Post-TestUndergraduate 63 4.05 .443 88 1.265 .209Graduate 27 3.93 .386
Positive Attitudes towards Research Pre-Test
Undergraduate 63 3.94 .914 88 -1.782 .078Graduate 27 3.98 .854
Post-TestUndergraduate 63 4.45 .503 88 -.026 .979Graduate 27 4.30 .554
Negative Attitudes towards Research Pre-Test
Undergraduate 63 3.74 .752 88Graduate 27 4.00 .561 -1.632 .106
Post-TestUndergraduate 63 3.94 .536 88 -.834 .407Graduate 27 4.04 .312
Table 13The Posttest Correlation Analysis Results of Teachers in Regard to Their Attitudes towards Project Preparation and Scientific ResearchVariable N r pAttitudes Towards the Project Competition 90 0.319* .002Attitudes Towards Scientific Research 90Note. r: Pearson’s correlation coefficient, p: significance level, p < .05 is taken as reference, N: Number of Data.

1372
EDUCATIONAL SCIENCES: THEORY & PRACTICE
attitude towards being a mentor in such competitions. Considering the effect size (η2), which is used to determine the statistical effect of research applications on the attitudes of teachers in regard to project competitions; the effect size of the entire research on the attitudes of teachers in regard to project competitions was found to be 0.067 and ranged between 0.029 and 0.100 for dimensions of the scale. Thus, it can be suggested that only 6.7% of the positive changes seen in the attitudes of teachers in regard to project competitions is the outcome of the activities performed during the study. According to these findings, 93.3% of the positive changes seen in the attitudes of teachers in regard to project competitions is caused by some other reasons.
Considering the pretest-posttest data in regard to the relationship between attitudes of teachers towards project competitions and their gender; there was no statistically significant relationship between attitudes of teachers towards project competitions and their gender in the entire scale before the application (p > .05). There was a significant difference in favor of female teachers in the “importance of education” dimension of teacher attitude scale towards project competitions (p < .05). According to this result, female teachers used to consider project competitions as an important element of educational activity. Considering the posttest data obtained from the study, it was concluded that there is no statistically significant difference between attitudes of teachers towards project competitions and their gender in the entire scale and all factors (p > .05). As a result of the study, no significant difference was found between posttest scores of male and female teachers received from the “importance of education” sub-scale. Therefore, it can be thought that male teachers have realized that project competitions are an important element of educational activities.
Considering the pretest-posttest data of teachers in regard to their attitudes towards project competitions and educational levels; no statistically significant difference was found between attitudes of teachers towards project competitions and their educational levels in the entire scale and factors of the scale before the application (p > .05).
Considering the correlation between pretest data of attitudes of teachers towards scientific research and project competitions, a positive and statistically significant relationship was found between attitudes of teachers towards scientific research and project competitions (r = 0.149; p > .05). According to this result, it is thought that teachers couldn’t fully understand the relationship between project competitions and scientific research stages prior to the study.
Considering the changes in the attitudes of teachers towards scientific research during the study, a significant difference was found in favor of posttest scores of teachers in the scientific research attitude scale and factors of the scale (p < .05). According to this result, attitudes of teachers towards scientific research were improved during the study and they developed a more positive attitude for researchers and scientific

1373
Akçöltekin / Investigation of the Effect of Training on the Development of High School Teachers’...
research (Küçükoğlu, Taşkın, & Çelik, 2013) conducted a study with prospective teachers and stated that concepts related to the scientific research processes are not completely and accurately perceived by prospective teachers. In addition, although prospective teachers stated that doing research is not necessary for teachers, scientific research can be useful in their professional lives.
Considering the effect size (η2), which is used to determine the statistical effect of the research period on the positive attitudes of teachers towards scientific research; the effect size of the entire research on the attitudes of teachers in regard to their general attitudes towards scientific research was found to be 0.142, and ranged between 0.047 and 0.183 for dimensions of the scale. Thus, it can be suggested that only 14.2% of the positive changes seen in the attitudes of teachers towards scientific research is the outcome of the activities performed during the study. According to these findings, 85.8% of the positive changes seen in the attitudes of teachers towards scientific research is caused by some other reasons.
Considering the relationship between attitudes of teachers towards scientific research and their gender, no statistically significant difference was found between pretest-posttest results of both male and female teachers in the scale and factors included in the scale (p > .05). According to this result, it is concluded that there is no statistically significant difference between attitudes of teachers towards scientific research and their gender, and gender is not an important factor effecting attitudes of teachers towards scientific research (Polot, 2014) stated that gender is not an important factor effecting attitudes of prospective teachers towards scientific research, (Korkmaz, Şahin, & Yeşil, 2011b) determined that knowledge, skills and qualifications of teachers about the implementation of the process of scientific research do not differ according to their gender.
Considering the relationship between attitudes of teachers towards scientific research and their educational level, there was no statistically significant difference between pretest-posttest scores of teachers in regard to their attitudes towards scientific research according to their educational level in the scale and factors included in the scale. According to this result, it is concluded that there is no statistically significant difference between attitudes of teachers towards scientific research and their educational level and having a graduate or undergraduate degree is not an important factor effecting attitudes of teachers towards scientific research.
Considering the correlation between posttest attitude data of teachers in regard to scientific research and project competitions; a positive and significant relationship was found between attitudes of teachers towards scientific research and project competitions (r = 0.319; p < .05). Çetin and Şengezer (2013) determined that project studies improve scientific process skills of students and (Tortop, 2013b) conducted

1374
EDUCATIONAL SCIENCES: THEORY & PRACTICE
a study with prospective teachers and found that project competitions help students improve their scientific process skills. Our results indicate that there is a positive and significant correlation between attitudes of teachers towards project competitions and scientific research are consistent with the results of the above mentioned studies in the literature. In addition, Arslan (2010) investigated the academic self-efficacy of graduate students and stated that a large majority of the teachers think that they are not informed enough about the method to be followed during the research process, and one of the teachers said that;
I don’t feel very confident about the methods and techniques to be used to prepare a project. I think I will face the same problems I am already experiencing when I am writing an article. I am having problems in data collection and data analysis, selecting the right tool and the right methods or statistics, and interpreting the findings. I have a good knowledge of the subject; however, these problems show that I can be inadequate in the preparation or execution of the project (pp.12–13).
These thoughts support the fact that there is a positive, moderate and significant correlation between scientific research methods and project processes. According to this result, although teachers didn’t fully understand the relationship between scientific research methods and project competitions and project processes prior to the study, this application developed their attitudes towards scientific research methods and project competitions. Thus, they may understand the relationship between scientific research methods and project competitions and project processes.
Conclusion and RecommendationsAccording to the study results, the overall attitudes of teachers for annual
project competitions organized by TUBITAK are developed in a positive way. In addition, teachers developed a positive attitude towards being a mentor during these competitions, they developed a positive attitude towards the fact that students develop positive behaviors during project competitions, and lastly they developed a positive attitude towards evaluation of the projects submitted to the competitions. Therefore, the teacher thinks that the projects are evaluated based on scientific criteria with an unbiased evaluation period.
Although it is concluded that gender and educational level of teachers (undergraduate, graduate) is not an important factor in attitudes of teachers towards project competitions, female teachers used to consider project competitions as an important element of educational activities prior to the study. However, male teachers also developed a positive attitude towards the fact that project competitions are an important element of educational activities.

1375
Akçöltekin / Investigation of the Effect of Training on the Development of High School Teachers’...
Although there was a weak and statistically insignificant correlation between attitudes of teaches towards project competitions and scientific research prior to the study, this correlation has become stronger and statistically significant at the end of the application. Thus, it is concluded that teachers realized that they have good knowledge of scientific research processes in order to guide their students about project competitions. According to these results obtained, there is a relationship between attitudes of teachers towards project competitions and scientific research methods and they have to develop their attitudes towards project competitions and scientific research methods in order to encourage their students to attend scientific project competitions.
Considering the results of the changes in attitudes of teachers towards scientific research, it is concluded that attitudes of teachers towards scientific research developed in a positive way and they developed more positive attitudes towards both scientific research and researchers. In addition, it is concluded that the gender and educational level of teachers are not important factors in attitudes of teachers towards scientific research.
1. In-service training activities should be organized by TÜBİTAK, the Ministry of National Education and Universities about scientific projects, project competitions and scientific research methods in order to increase the participation of high school students in scientific project competitions and attitudes of teachers about these issues should be developed.
2. Teachers should understand the importance of scientific projects, project competitions and scientific research methods and their awareness about these concepts should be developed by conducting studies with teachers working at different levels of education.
3. This study should be conducted with teachers working in different cities under the Ministry of Education in order to generalize the results of the study.
ReferencesAbernathy, T. V., & Vineyard, R. N. (2001). Academic competitions in science. What are the
rewards for students? The Clearing House: A Journal of Educational Strategies, Issues and Ideas, 74(5), 269–277. http://dx.doi.org/10.1080/00098650109599206
Ajzen, I. (2005). Attitudes, personality and behavior (2nd ed.). London, UK: Open University Press.
Akbulut, Y. (2010). Sosyal bilimlerde SPSS uygulamaları: Sık kullanılan istatistiksel analizler ve açıklamalı SPSS çözümleri [SPSS applications in social science: Most used statistical analyses and annotative SPSS solutions]. Istanbul, Turkey: İdeal Kültür & Yayıncılık.
Akçöltekin, A. (2014). Ardahan ilinin Tubitak projelerine katılmama nedenleri ve öğrencilerin araştırma kaygılarının sosyo-demografik değişkenler açısından incelenmesi [Investigation of non-attendance of the secondary education schools in Ardahan to Tubitak projects and student’s research anxieties from the point of socio-demographic variances]. Turkish Studies, 9(2), 41–51. http://dx.doi.org/10.7827/turkishstudies.6346

EDUCATIONAL SCIENCES: THEORY & PRACTICE
1376
American University, Center for Teaching, Research & Learning. (2010). SPSS Regressions. Retrieved October 20, 2015 from https://www.american.edu/ctrl/upload/SPSS_Regression_Spring_2010.pdf
Arslan, C. (2010). Türkçe eğitimi programlarında lisansüstü öğrenim gören öğrencilerin akademik özyeterliklerine ilişkin görüşleri [The opinions of the Turkish education postgraduate students about their academic self-efficacy]. Mehmet Akif Ersoy Üniversitesi Eğitim Fakültesi Dergisi, 10(19), 87–115. Retrieved from http://turkoloji.cu.edu.tr/YENI%20TURK%20DILI/canan_aslan_turkce_egitimi_ozyeterlilik.pdf
Baki, A., & Bütüner, S. Ö. (2009). Kırsal kesimdeki bir ilköğretim okulunda proje yürütme sürecinden yansımalar [Reflections on the project implementation process in a primary school in rural area]. Elementary Education Online, 8(1), 146–158. Retrieved from http://ilkogretimonline.org.tr/vol8say1/v8s1m12.pdf
Blenis, D. S. (2000). The effects of mandatory, competitive science fairs on fifth grade students’ attitudes toward science and interest in science (Reports Research No. 143.26). Retrieved from http://files.eric.ed.gov/fulltext/ED443718.pdf
Bulunuz, İ. (2011). Fen bilgisi öğretmen adaylarının geçmiş öğretim kademelerindeki bilimsel araştırma projesi deneyimlerinin değerlendirilmesi [Evaluation of scientific research project experiences of science teachers in their previous teaching levels]. Türk Fen Eğitimi Dergisi, 8(4), 74–85. Retrieved from http://www.tused.org/internet/tused/archive/v8/i4/text/tusedv8i4s6.pdf
Bunderson, E. D., & Anderson, T. (1996). Preservice elementary teachers’ attitudes toward their past experiences with science fairs. School Science & Mathematics, 96(7), 371–378. http://dx.doi.org/10.1111/j.1949-8594.1996.tb15855.x
Büyüköztürk, Ş. (2007). Sosyal bilimler için veri analizi el kitabı: İstatistik, araştırma deseni, SPSS uygulamaları ve yorum [Data analysis handbook for social sciences: Statistic, research design, SPSS applications and comment] (15th ed.). Ankara, Turkey: Pegem Akademi.
Büyüköztürk, Ş. (2010). Sosyal bilimler için veri analizi el kitabı istatistik, araştırma deseni SPSS uygulamaları ve yorum [Data analysis handbook for social sciences: Statistic, research design, SPSS applications and comment] (12nd ed.). Ankara, Turkey: Pegem Akademi.
Büyüköztürk, Ş. (2014). Sosyal bilimler için veri analizi el kitabı [Data analysis handbook for social sciences] (19th ed.). Ankara, Turkey: Pegem Yayıncılık.
Büyüköztürk, Ş., Çakmak, E. K., Akgün, Ö. E., Karadeniz, Ş., & Demirel, F. (2010). Bilimsel araştırma yöntemleri [Scientific research methods]. Ankara, Turkey: Pegem Yayıncılık.
Büyüköztürk, Ş., Çokluk, Ö., & Köklü, N. (2011). Sosyal bilimler için istatistik [Statistic for social science] (8th ed.). Ankara, Turkey: Pegem Akademi.
Çakmakcı, G. (2009). Preparing teachers as researchers: Evaluating the quality of research reports prepared by student teachers. Eurasian Journal of Educational Research, 35, 39–56. Retrieved from http://www.ejer.com.tr/0DOWNLOAD/pdfler/tr/947689564.pdf
Çepni, S. (2007). Araştırma ve proje çalışmalarına giriş [An introduction to research and project studies] (3rd ed.). Trabzon, Turkey: Üçyol Kültür Merkezi Yayınları.
Çetin, O., & Şengezer, B. (2013). Ortaokul öğrencilerinin proje çalışmalarına ilişkin görüşleri [Secondary students’ views on project works]. Ege Eğitim Dergisi, 14(1), 24–49. Retrieved from https://pegem.net/dosyalar/dokuman/138267-20131221154710-2.pd
Civelekoğlu, M. Ş., & Öztürk, Ş. (2010). İlköğretim fen ve teknoloji dersinde proje tabanlı öğrenme (PTÖ) yönteminin uygulanması ile ilgili öğretmen ve öğrenci görüşleri [Teachers and students observations on application of project based learning method in science and technology class of primary schools]. İlköğretim Online, 9(3), 1189–1200. Retrieved from http://ilkogretim-online.org.tr/vol9say3/v9s3m28.pdf

1377
Akçöltekin / Investigation of the Effect of Training on the Development of High School Teachers’...
Cook, H. M. (2003). Elementary school teachers and successful science fair (Doctoral dissertation, The University of North Carolina, Greensboro). Available from ProQuest Dissertations and Theses database. (UMI No. 3093864)
Ercan, İ., & Kan, İ. (2004). Ölçeklerde güvenirlik ve geçerlik [Reliability and validity in the scales]. Uludağ Üniversitesi Tıp Fakültesi Dergisi, 30(3), 211–216. Retrieved from http://utf.dergisi.org/pdf/pdf_UTF_149.pdf
Erdem, A., Uzal, G., & Ersoy, Y. (2007). Proje tabanlı fen/matematik eğitimi projesinden yansıtmalar-I: Öğretmen projelerinin analizi ve genel izlenimler [Reflection from project-based science/maths education-I: Analysis of teachers’ projects and general overviews]. Retrieved from http://kongre.nigde.edu.tr/xufbmek/dosyalar/tam_metin/pdf/2277-25_05_2012-14_37_17.pdf
Erefe, İ. (2002). Hemşirelikte araştırma ilke, süreç ve yöntemleri [Research principles, process and methodologies in nursey]. Istanbul, Turkey: Odak Ofset.
Erkuş, A. (2001). Psikometri üzerine yazılar [Writings on psychometric]. Ankara, Turkey: Türk Psikologlar Derneği Yayınları.
Fisanick, L. M. (2010). A descriptive study of the middle school science teacher behavior for required student participation in science fair competitions (Doctoral dissertation, Pennsylvania University, Indiana). Available from ProQuest Dissertations and Theses database. (UMI No. 3403187)
Frank, M., & Barzilai, A. (2004). Integrating alternative assessment in a project-based learning course for pre-service science and technology teachers. Assessment & Evaluation in Higher Education, 29(1), 41–61. http://dx.doi.org/10.1080/0260293042000160401
Geray, H. (2006). Toplumsal araştırmalarda nicel ve nitel yöntemlere giriş [Introduction to qualitative and quantative methods in social research] (2nd ed.). Ankara, Turkey: Siyasal Kitabevi.
Green, S., Salkind, N., & Akey, T. (2000). Using SPSS for windows: Analyzing and understanding data. New Jersey, NJ: Practice Hall.
Güven, İ. (2013). Fen ve teknoloji öğretmen adaylarının proje yönetimi deneyimlerinin değerlendirilmesi [Evaluation of prospective science and technology teachers’ experiences of project management in Turkish] [Special Issue]. Hacettepe University Journal of Education, 1, 204–218. Retrieved from http://www.efdergi.hacettepe.edu.tr/yonetim/icerik/makaleler/289-published.pdf
Higher Education Commission. (2012). Windows on practice guide. Retrieved February 10, 2015 from http://www.hec.gov.pk/insidehec/divisions/aeca/curriculumrevision/documents/researchmethods_sept13.pdf
Honer, S. M., Thomas, C., & Okholm, D. L. (2003). Felsefeye çağrı sorunlar ve seçenekler [Call for philosophy- problems and choices] (H. Ünder, Trans.). Ankara, Turkey: İmge Kitabevi.
Karasar, N. (1991). Bilimsel araştırma yöntemi [Scientific research methods]. Ankara, Turkey: Nobel Akademik Yayıncılık.
Kelloway, E. K. (1998). Using lisrel for structural equation modeling. Thousand Oaks, CA: Sage.
Kılıç, A., & Acat, M. B. (2007). Öğretmen adaylarının algılarına göre öğretmen yetiştirme programlarındaki derslerin gereklilik ve işe vurukluk düzeyi [Essentiality and job-utility of the courses offered in elementary teacher education programs]. Manas Üniversitesi Sosyal Bilimler Dergisi, 17, 21–37. Retrieved from http://journals.manas.edu.kg/mjsr/oldarchives/Vol09_Issue17_2007/542-1460-1-PB.pdf

1378
EDUCATIONAL SCIENCES: THEORY & PRACTICE
Kim, Y., & Choi, S. M. (2005). Antecedents of green purchase behavior: An examination of collectivism, environmental concern, and PCE. Advances in Consumer Research, 32, 592–599. Retrieved from http://www.acrwebsite.org/volumes/v32/acr_vol32_166.pdf
Köklü, N., Büyüköztürk, Ş., & Bökeoğlu, Ö. Ç. (2006). Sosyal bilimler için istatistik [Social sciences for statistics]. Ankara, Turkey: Pegem Akademi Yayıncılık.
Kollmuss, A., & Agyeman, J. (2002). Mind the gap: Why do people act environmentally and what are the barriers to pro-environmental behavior? Environmental Education Research, 8(3), 239–260. http://dx.doi.org/10.1080/13504620220145401
Korkmaz, Ö., Şahin, A., & Yeşil, R. (2011a). Bilimsel araştırmaya yönelik tutum ölçeği geçerlilik ve güvenirlik çalışması [Study of validity and reliability of scale of attitude towards scientific research]. Elementary Education Online, 10(3), 961–973. Retrieved from http://ilkogretim-online.org.tr/vol10say3/v10s3m13.pdf
Korkmaz, Ö., Şahin, A., & Yeşil, R. (2011b). Öğretmenlerin bilimsel araştırmalara ve araştırmacılara ilişkin düşünceleri [Teachers’ opinion regarding scientific researches and researchers]. Kuramsal Eğitimbilim, 4(2), 109–127. Retrieved from http://www.keg.aku.edu.tr/arsiv/c4s2/c4s2m7.pdf
Küfrevioğlu, R. M., Baydaş, Ö., & Göktaş, Y. (2011, September). Proje ve beceri yarışmalarında elde edilen kazanımlar, karşılaşılan zorluklar ve öneriler [Objectives, challenges and suggestions of project and skill competitions]. Paper presented at the 5th International Computer & Instructional Technologies Symposium, Fırat University, Elazığ, Turkey. Retrieved from http://web.firat.edu.tr/icits2011/papers/27749.pdf
Kurnaz, M. A., & Yiğit, N. (2010). Fizik Tutum Ölçeği: Geliştirilmesi, geçerliliği ve güvenilirliği [Physics Attitude Scale: Development, validity and reliability]. Necatibey Faculty of Education Electronic Journal of Science and Mathematics Education, 4(1), 29–49. Retrieved from http://www.nef.balikesir.edu.tr/~dergi/makaleler/yayinda/8/EFMED_FZE131.pdf
LaBanca, F. (2008). Impact of problem finding on the quality of authentic open inquiry science research projects (Doctoral dissertation, Western Connecticut State University). Available from ProQuest Dissertations and Theses database. (UMI No. 3411366)
Llewellyn, D. (2002). Inquiry within: Implementing inquiry- based science standards. Thousand Oaks, CA: Corwin Press.
McCarty, J. A., & Shrum, L. J. (1993). A structural equation analysis of the relationships of personal values, attitudes and beliefs about recycling, and the recycling of solid waste products. Advances in Consumer Research, 20, 641–646. Retrieved from http://www.acrwebsite.org/search/view-conference-proceedings.aspx?Id=7533
Michael, K. Y. (2000). A comparison of students’ product creativity using a computer simulation activity versus a hands-on activity in technology education (Doctoral dissertation, Virginia Polytechnic Institute and State University, Blacksburg, Virginia). Retrieved from https://theses.lib.vt.edu/theses/available/etd-05222000-16210003/unrestricted/ETD.pdf
Milli Eğitim Bakanlığı. (2013). Hayat boyu öğrenme genel müdürlüğü, proje hazırlama rehberi [General directorate of lifelong learning, project writing guide]. Retrieved from http://www.ogrenmen.com/wp-content/uploads/2013/09/proje-haz%C4%B1rlama-rehberi.pdf
National Research Council. (2000). Inquiry and the National science education standards: A guide for teaching and learning. Washington, DC: National Academy Press.

1379
Akçöltekin / Investigation of the Effect of Training on the Development of High School Teachers’...
Önen, F., Mertoğlu, H., Saka, M., & Gürdal, A. (2010). Hizmet içi eğitimin öğretmenlerin proje ve proje tabanlı öğrenmeye ilişkin bilgilerine ve proje yapma yeterliklerine etkisi: Öpyep örneği [The effects of in service training on teachers’ knowledge about project-based learning and competencies for conducting projects: Öpyep Case]. Ahi Evran Üniversitesi Eğitim Fakültesi Dergisi, 11(1), 137–158. Retrieved from http://dergipark.ulakbim.gov.tr/aeukefd/article/viewFile/5000086362/5000080316
Öner, N. (1997). Türkiye›de kullanılan psikolojik testler [Psychological tests used in Turkey] (3rd ed.). Istanbul, Turkey: Boğaziçi Üniversitesi Yayınları.
Oruç, Ş., & Ulusoy, K. (2008). Sosyal bilgiler öğretimi alanında yapılan tez çalışmaları [Social studies education and dissertations in this field]. Ahmet Keleşoğlu Eğitim Fakültesi Dergisi, 26, 121–132. Retrieved from http://www.ide.konya.edu.tr/egtfakdergi/Sayilar/sayi%2026/26_10_EFD-2008-034.pdf
Patton, M. Q. (1999). How to use qualitative methods inevaluation. Newbury Park, CA: Sage.
Polat, M. (2014). Eğitim fakültesi öğrencilerinin bilimsel araştırmaya yönelik tutumları [Students’ attitudes towards scientific research in the faculty of education]. Pamukkale Üniversitesi Sosyal Bilimler Enstitüsü Dergisi, 18, 77–90. Retrieved from http://www.journalagent.com/pausbed/pdfs/PAUSBED_2014_18_77_90.pdf
Postlethwaite, T. N. (2005). Educational research: Some basic concepts and terminology. Paris, France: UNESCO. Retrieved October 15, 2015 from http://www.unesco.org/iiep/PDF/TR_Mods/Qu_Mod1.pdf
Punch, K. F. (2005). Sosyal araştırmalara giriş: Nicel ve nitel yaklaşımlar [An introduction to social sciences: Qualitative and quantative approaches] (D. Bayrak, H. B. Arslan, & Z. Akyüz, Trans.) Ankara, Turkey: Siyasal Kitabevi.
Raghavan, K., Coken-Regev, S., & Strobel, S. A. (2001). Student outcomes in a local systemic change project. School Science and Mathematics, 101, 268–281. http://dx.doi.org/10.1111/j.1949-8594.2001.tb17877.x
Ravitz, J., Hixson, N., English M., & Mergendoller, J. (2012, April). Using project based learning to teach 21st century skills: Findings from a statewide initiative. Paper presented at annual meetings of the American Educational Research, Vancouver, BC. Retrieved from http://bie.org/images/uploads/general/21c5f7ef7e7ee3b98172602b29d8cb6a.pdf
Roth, W. M. (1999, April). Scientific research expertise from middle school to professional practice. Paper presented at the annual meeting of American Educational Research Association, Montreal, Quebec.
Saracaloğlu, A. S. (2008). Lisansüstü öğrencilerin akademik güdülenme düzeyleri, araştırma kaygıları ve tutumları ile araştırma yeterlikleri arasındaki ilişki [The relationship between post graduate students’ academic motivation level, research anxiety and attitudes with their research competence]. Yüzüncü Yıl Üniversitesi Eğitim Fakültesi Dergisi, 4(2), 179–208. Retrieved from http://efdergi.yyu.edu.tr/makaleler/cilt_v/aralik/a_saracoglu.pdf
Schumacker, R. E., & Lomax, R. G. (2010). A beginner’s guide to structural equation modeling. New York, NY: Taylor & Francis Group.
Shapiro, B. L. (1996). A case study of change in elementary student teacher thinking during an independent investigation in science: Learning about the “face of science that does not yet know.” Science Education, 80(5), 535–560. http://dx.doi.org/10.1002/(sici)1098-237x(199609)80:5<535::aid-sce3>3.0.co;2-c
Syer, C. A., & Shore, B. M. (2001). Science fairs: What are the sources of help for students and how prevalent is cheating? School Science & Mathematics, 101(4), 206–221. http://dx.doi.org/10.1111/j.1949-8594.2001.tb18023.x

1380
EDUCATIONAL SCIENCES: THEORY & PRACTICE
Taşdemir, M., & Taşdemir, A. (2011). Öğretmen adaylarının bilimsel araştırmaları inceleme yeterlilikleri [Scientific research review competences of prospective teachers]. Selçuk Üniversitesi Sosyal Bilimler Enstitüsü Dergisi, 26, 344–353. Retrieved from http://dergisosyalbil.selcuk.edu.tr/susbed/article/view/173
Tavşancıl, E. (2002). Tutumların ölçülmesi ve SPSS ile veri analizi [Measuring attitudes and data analyses with SPSS]. Ankara, Turkey: Nobel Yayıncılık.
Thomas, J. W. (2000). A review of research on project-based learning. Retrieved from http://www.bie.org/research/studey/review_of_project_based_learning_2000
Tortop, H. S. (2013). Bu benim eserim bilim şenliğinin yönetici, öğretmen, öğrenci görüşleri ve fen projelerinin kalitesi odağından görünümü [Overview of a national science fair in turkey from the focus on administrators’, teachers’, students’ views and quality of science projects]. Adıyaman Üniversitesi Sosyal Bilimler Enstitüsü Dergisi, 6(11), 255–308. Retrieved from http://egitim.beun.edu.tr/cv/hstortop/wp-content/uploads/sites/22/2014/02/D15.pdf
Tortop, H. S. (2013). Development of teacher attitude scale towards science fair. Educational Research and Reviews, 8(2), 58–62. Retrieved from http://egitim.beun.edu.tr/cv/hstortop/wp-content/uploads/sites/22/2014/02/A1.pdf
Tortop, H. S. (2013). Examining of the predictors of pre-service teachers’ perceptions of the quality of the science fair projects in Turkey. Necatibey Faculty of Education Electronic Journal of Science and Mathematics Education, 8(1), 31–44. Retrieved from http://www.nef.balikesir.edu.tr/~dergi/makaleler/yayinda/16/EFMED_FBE261.pdf
Tural, G., Yiğit, N., & Alev, N. (2009). Examining problems in project work executed in high schools according to student and teacher views. Asia-Pacific Forum on Science Learning and Teaching, 10(1), Article 10. Retrieved from https://www.ied.edu.hk/apfslt/download/v10_issue1_files/dincer.pdf
Türkiye Bilimsel ve Teknolojik Araştırma Kurumu. (2014). Ortaöğretim öğrencileri araştırma projeleri yarışması [Secondary school students research project competitions]. Retrieved from http://www.tubitak.gov.tr/sites/default/files/2204_2014_proje_rehberi.pdf
Windschitl, M. (2003). Inquiry projects in science teacher education: What can investigative experiences reveal about teacher thinking and eventual classroom practice? Science Education, 87(1), 112–143. http://dx.doi.org/10.1002/sce.10044