investigation of temperature distribution …€¦ · used course mesh for this model 0.1m to...
TRANSCRIPT

http://www.iaeme.com/IJCIET/index.asp 889 [email protected]
International Journal of Civil Engineering and Technology (IJCIET) Volume 8, Issue 8, August 2017, pp. 889–897, Article ID: IJCIET_08_08_092
Available online at http://http://www.iaeme.com/ijciet/issues.asp?JType=IJCIET&VType=8&IType=8
ISSN Print: 0976-6308 and ISSN Online: 0976-6316
© IAEME Publication Scopus Indexed
INVESTIGATION OF TEMPERATURE
DISTRIBUTION ON COMBINED PRESSURE
VESSEL COLUMN
A.M. Senthil Anbazhagan
Lead Static Equipment Engineer, Shriram EPC Limited,
Channai – 600 095, Tamilnadu, India
M. Dev Anand
Professor and Director Research, Faculty of Mechanical Engineering,
Noorul Islam University, Kumaracoil - 629180,
Kanyakumari District, Tamilnadu, India
ABSTRACT
In this paper we have investigated the temperature distribution of the cracked
portion of the pressure vessel. Temperature distribution on tall pressure vessel is always
a challenging area of design in oil and gas industry. For example, it is needed to
investigate temperature distribution in the vessel which is mounted in offshore platform
before erecting the platform. In offshore vessel always faces different ranges of
temperatures. The bottom portion of the vessel faces some range of temperature and the
mid and top areas of the vessel faces different temperatures. For preventing temperature
effect on the vessel surface, it is better if the designer perform temperature analysis
before erecting the vessel. In this paper, we develop a new procedure to perform
temperature analysis.
Key words: Mean Design Metal Temperature, Finite Element Method, American
Society of Mechanical Engineers.
Cite this Article: A.M. Senthil Anbazhagan and M. Dev Anand, Investigation of
Temperature Distribution on Combined Pressure Vessel Column, International Journal
of Civil Engineering and Technology, 8(8), 2017, pp. 889–897.
http://www.iaeme.com/IJCIET/issues.asp?JType=IJCIET&VType=8&IType=8
1. INTRODUCTION
Two connected pressure vessel have been taken for temperature analysis. Normally these kind
of connected vessels are used in offshore platform oil and gas industry. The assumed
dimensions are used for modeling the vessel. The bottom portion of the vessel is connected
each other through flanges [1]. In this type of vessel, major oil storage and transaction happen
in bottom portion. The vessel gets more thermal and mechanical loads in bottom. It is important

A.M. Senthil Anbazhagan and M. Dev Anand
http://www.iaeme.com/IJCIET/index.asp 890 [email protected]
that bottom portion should be designed with high care [1]. Two types of analysis are performed
in this study. First is strength analysis based on the mechanical loads inside and outside the
vessel and the second is thermal analysis based on the thermal loads in different portions of the
vessel.
2. MATERIAL PROPERTIES
The material properties used in this analysis are obtained from ASME II-D, and are suitable for
VIII Div1 Components [3]. The rules of ASME VIII-2 are used to set the stress limits. The
vessel shell and flanges are fabricated from SA 516 Gr.70 material. The details of properties
are listed in Table-[1]. A rule of ASME SEC.VIII DIV-II is used for setting up the allowable
stress limits of this material [3]. The minimum tensile strength of the material is 482 MPa. The
minimum yield strength of the material is 261MPa and the material density is 76807 N/m3.
Table 1 Summary of Material Properties
3. MODELLING OF THE VESSEL
The solid modeling has been done for the vessel. Refer the figure [1] and [2].Head and bottom
skirt designs are not considered for this analysis as our aim is to see the temperature
transformation on the critical area of the vessel. As far as this problem is concerned, the critical
area of the vessel is the connected portion of the vessel [7] [8]. Refer figure [2] for knowing the
critical area. In this area the fluid transformations happen randomly. So these areas will obtain
more temperature and mechanical loads [7] [8]. As we explained earlier, we have not considered
the top head and bottom portion of the vessels in the modeling. Also we modeled half portion
of the shell and the considered total shell length as 6m height. The bottom portion is directly
fixed on the skid [7] [8]. The diameter of the vessel is 2000mm and the thickness is 20mm.The
flange diameter is 24inch and the pressure temperature rating of the flange is #2500.
Figure 1 Vessel Setup for Analysis Figure 2 Critical Area of the Vessel
Properties of the Material SA-516 Gr.70
Min. Tensile Strength 482 MPa
Min. Yield Strength 261 MPa Material Density 76807 N/m3
Product form PLATE

Investigation of Temperature Distribution on Combined Pressure Vessel Column
http://www.iaeme.com/IJCIET/index.asp 891 [email protected]
3. LOADS AND BOUNDARY CONDITIONS
The bottom portions of the vessels are fixed in all directions for preventing the rigid body
motion. The vessel is assumed to be mounted on skid which will prevent differential ground
settling, various pressure, wind and seismic [7] [8]. The applied forces, temperature considered
for this study and their directions of application are represented in the below figures [3], [4].
Figure [3] explains the DOF arrest and internal pressure load application of the vessel. We
performed two type of analysis; prior to doing the thermal analysis we have done static analysis.
Figure [3] is the setup of static analysis. Figure [4] is the setup of thermal analysis [7] [8]. The
applied loads in the outside of the vessel as well as inside of the vessel are mentioned in figure
[4].During the thermal analysis the internal and external temperature are applied to obtain the
temperature effects on the vessel. The applied temperatures are different from area to area
[7][8]. The flange connection area is applied more temperature than the other areas. The
obtained results are the combined result of the temperatures on the vessels. The resultant
reaction force on the bottom of the plate obtained is as follows.
Table 2 Summary of Reaction Forces
Reaction Forces
Selection Set Units Sum X Sum Y Sum Z Resultant
Entire Model N 497 -664 536 988
Figure 3 Static Analysis Load Distribution Figure 4 Thermal Analysis Load Distribution
4. MESHING OF THE MODEL
High quality solid mesh has been used to develop the meshing of these vessels [7] and [8]. We
used course mesh for this model 0.1m to highlight the difference between static and thermal
distribution. Uniform mesh all over the area would help to get the clear temperature
distributions [7] and [8].

A.M. Senthil Anbazhagan and M. Dev Anand
http://www.iaeme.com/IJCIET/index.asp 892 [email protected]
Figure 5 Meshing of the Connected Vessel Figure 6 Meshing in Complex Area
Table 3 Summary of Mesh Properties
MESH Information
Mesh Type Solid Mesh
Mesh Used Standard Mesh
Automatic Transition Off
Include Mesh Auto Loops Off
Jacobin Points Four Points
Element Size 131mm
Mesh Tolerance 6.57mm
Mesh Quality High
Total Nodes 62468
Total Elements 31178
Maximum Aspect Ratio 27.48
% Element with Aspect Ratio < 3 14.7
% Element with Aspect Ratio > 10 0.997
4. METHODS OF THERMAL AND STATIC ANALYSIS
The static and thermal analysis has been performed using the software solid works. Static
analysis is used to find out the mechanical strength of the vessel and the thermal analysis used
to find out the temperature distribution of the vessel [1] and [2]. Both the analyses are important
for qualifying the vessels. It will be always better before erecting the vessel the designer could
involve these vessels in to static and thermal studies for qualifying the vessel. Total mass of the
vessel assembly is 315Kg and the volume 0.040m3.Density 7800kg/cm2 and the weight 3079N.
The considered internal pressure of the static analysis is 30bar. The load is distributed internally
uniform inside the vessel.
5. INPUT DATA’S FOR THERMAL, STATIC AND WIND, SEISMIC
INPUTS
Tables [4] and [5] are explaining the data’s taken for analysis. It includes static, thermal and
wind and seismic load data’s. The application of loads on the vessels can be obtained from
figures [3] and [4].
Investigation of Temperature Distribution on Combined Pressure Vessel Column
http://www.iaeme.com/IJCIET/index.asp 893 [email protected]
Table 4 Wind and Seismic Data’s Considered
Considered Values Values Reference Portions Applied
Temperature
Basic Wind Speed 125 Km/hr Assumed Bottom of the Vessel 300 degC
Wind Zone Number
(Wind) 1 Ref.[7] Flange Area 700 degC
Risk Factor (Wind) 1 Ref.[7] Middle of the Vessel 600 degC
Terrain Category
(Wind) 1 Ref.[7] Top of the Vessel 400 degC
Equipment Class
(Wind) A Ref.[7] Static Pressure Load 30 barg
Topological Factor
(wind) 1 Ref.[7] Temperature on bottom 300 degC
Important Factor
(Seismic) 1 Ref.[7] Heat Flux X 10 W
Zone Number
(Seismic) 1 Ref.[7] Heat Flux Y 10 W
Soil Factor
(Seismic) 1 Ref.[7] Heat Flux Z 10 W
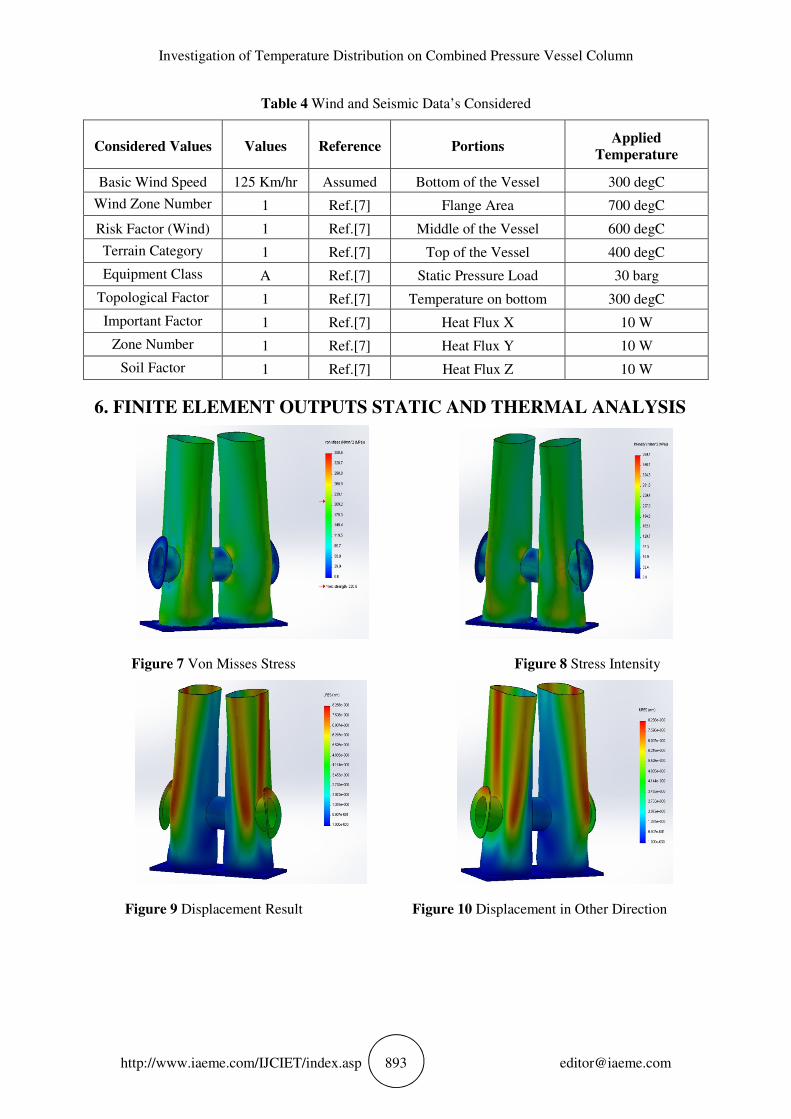
6. FINITE ELEMENT OUTPUTS STATIC AND THERMAL ANALYSIS
Figure 7 Von Misses Stress Figure 8 Stress Intensity
Figure 9 Displacement Result Figure 10 Displacement in Other Direction

A.M. Senthil Anbazhagan and M. Dev Anand
http://www.iaeme.com/IJCIET/index.asp 894 [email protected]
Figure 11 Resultant Reaction Force Figure 12 Displacement in Z Direction
7. FINITE ELEMENT OUTPUTS STATIC AND THERMAL ANALYSIS
(CONTINUATION)
Figure 13 Strain Distribution of the Vessel Figure 14 Strain Energy Release Rate
Figure 15 Temperature Distribution of Vessel Figure 16 Temperature Distribution on Flange
Investigation of Temperature Distribution on Combined Pressure Vessel Column
http://www.iaeme.com/IJCIET/index.asp 895 [email protected]
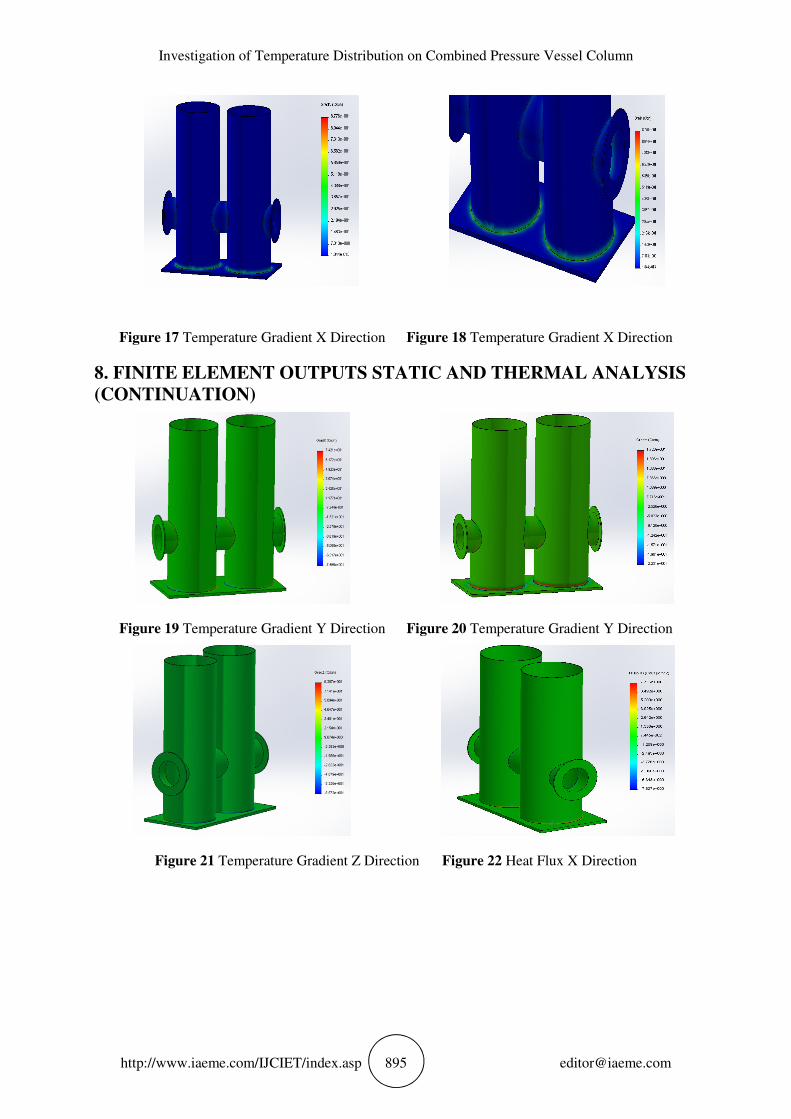
Figure 17 Temperature Gradient X Direction Figure 18 Temperature Gradient X Direction
8. FINITE ELEMENT OUTPUTS STATIC AND THERMAL ANALYSIS
(CONTINUATION)
Figure 19 Temperature Gradient Y Direction Figure 20 Temperature Gradient Y Direction
Figure 21 Temperature Gradient Z Direction Figure 22 Heat Flux X Direction
A.M. Senthil Anbazhagan and M. Dev Anand
http://www.iaeme.com/IJCIET/index.asp 896 [email protected]
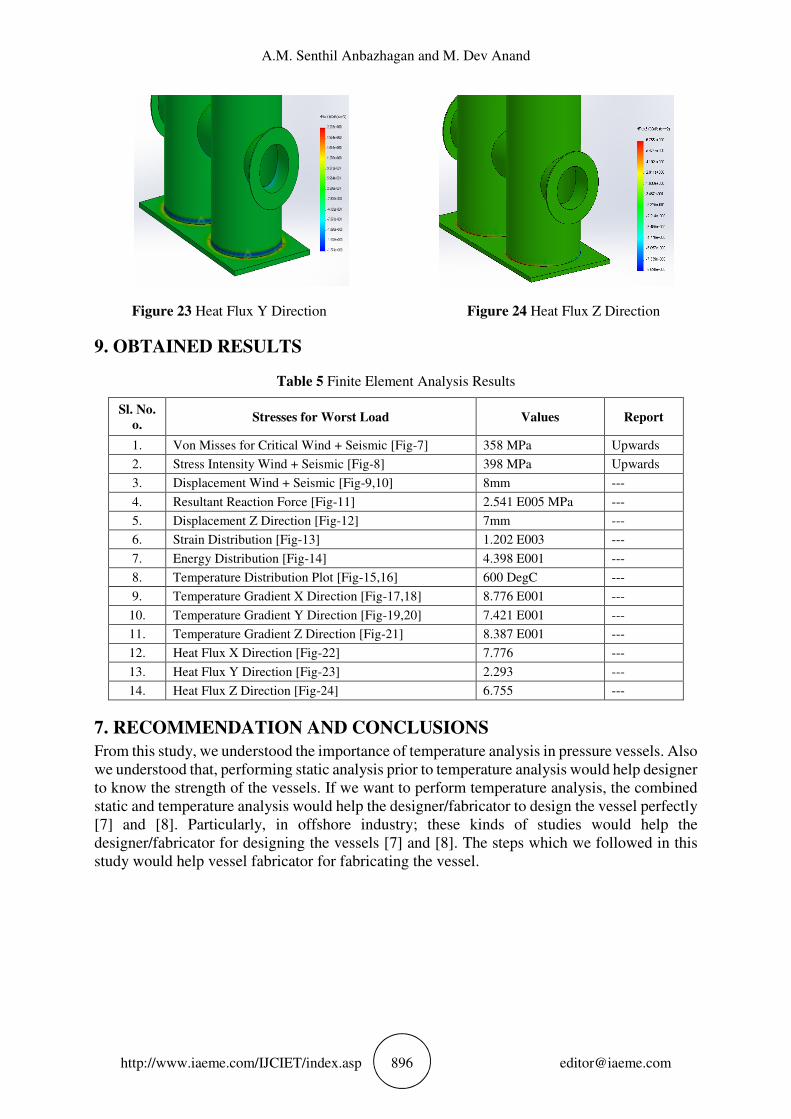
Figure 23 Heat Flux Y Direction Figure 24 Heat Flux Z Direction
9. OBTAINED RESULTS
Table 5 Finite Element Analysis Results
Sl. No.
o. Stresses for Worst Load Values Report
1. Von Misses for Critical Wind + Seismic [Fig-7] 358 MPa Upwards
2. Stress Intensity Wind + Seismic [Fig-8] 398 MPa Upwards
3. Displacement Wind + Seismic [Fig-9,10] 8mm ---
4. Resultant Reaction Force [Fig-11] 2.541 E005 MPa ---
5. Displacement Z Direction [Fig-12] 7mm ---
6. Strain Distribution [Fig-13] 1.202 E003 ---
7. Energy Distribution [Fig-14] 4.398 E001 ---
8. Temperature Distribution Plot [Fig-15,16] 600 DegC ---
9. Temperature Gradient X Direction [Fig-17,18] 8.776 E001 ---
10. Temperature Gradient Y Direction [Fig-19,20] 7.421 E001 ---
11. Temperature Gradient Z Direction [Fig-21] 8.387 E001 ---
12. Heat Flux X Direction [Fig-22] 7.776 ---
13. Heat Flux Y Direction [Fig-23] 2.293 ---
14. Heat Flux Z Direction [Fig-24] 6.755 ---
7. RECOMMENDATION AND CONCLUSIONS
From this study, we understood the importance of temperature analysis in pressure vessels. Also
we understood that, performing static analysis prior to temperature analysis would help designer
to know the strength of the vessels. If we want to perform temperature analysis, the combined
static and temperature analysis would help the designer/fabricator to design the vessel perfectly
[7] and [8]. Particularly, in offshore industry; these kinds of studies would help the
designer/fabricator for designing the vessels [7] and [8]. The steps which we followed in this
study would help vessel fabricator for fabricating the vessel.

Investigation of Temperature Distribution on Combined Pressure Vessel Column
http://www.iaeme.com/IJCIET/index.asp 897 [email protected]
REFERENCES
[1] ASME Code, Rules for Construction of Pressure Vessel, Section VIII-Div-I, Subsection-A,
General Requirements, 2007. pp. 8-104.
[2] IS-875 and IS-1893, General Requirement of Wind and Seismic Design Recommendations,
General Requirements, 2007 Edition.
[3] ASME Section-II Materials and it Mechanical Properties Selection 2007 Edition.
[4] Dennis R. Moss, Pressure Vessel Design and Development Manual, Third Edition, Elsevier
Publications Inc.
[5] Euguny F. Megacy, Pressure Vessel Design and Development Hand Book, Fourteenth
Edition, Pressure Vessel Publishing Incorporated.
[6] Hendry H. Bedner P.E, Pressure Vessel Hand Book, Second Edition, CBS Publishers and
Distributers.
[7] A.M. Senthil Anbazhagan and M. Dev Anand, Fatigue and Brinelling Evaluation of ASME
Pressure Vessel Closure, International Reviewers of Mechanical Engineering Association
IRME”, July 2011.
[8] Husam Mahdi Hadi, Qasim S. Mahdi and Nessrian Ali Hussien, Experimental and
Numerical Investigation of Temperature Distribution for Meat during Freezing Process.
International Journal of Mechanical Engineering and Technology, 7(3), 2016, pp. 213–224.
[9] Avinash R.Kharat, Suyash B. Kamble, Amol V. Patil, I.D. Burse, Comparative Study of
Different Approaches To Estimate SCF In Pressure Vessel Opening. International Journal
of Mechanical Engineering and Technology, 7(5), 2016, pp. 142–155
[10] A.M.Senthil Anbazhagan and M.Dev Anand, Development of Finite Element Based Wind
and Seismic Design Procedure for Vertical Tall Process Vessel, International Conference
on Crisis in Global Oil and Gas Industry by IITM and London School of Energy. March
2012. [Best Paper Award from IIT Chennai].