investigation of organic osmotic agents forward …epubs.surrey.ac.uk/808886/1/thesis _oct-...
TRANSCRIPT

Investigation of Organic Osmotic Agents
Forward Osmosis Desalination Process
Saleh O.M.AlAswad
A thesis submitted in fulfillment of the
Requirements of University of Surrey
For the degree of Doctor of Philosophy
This research program was carried out at the Centre for Osmosis Research and
Applications, Surrey University
September 2015
© Saleh O.M. AlAswad

Abstract
This study investigated the effects of novel membrane-osmotic agent systems on forward
osmosis process efficacy. Glucose, sucrose and NaCl were investigated as osmotic agents,
and nano-filtration, reverse osmosis and hollow fibre flat sheet as membrane types. The
effects of draw solution concentration, flow rate and temperature as well as feed water flow
rate and temperature were investigated for the aforementioned membrane types. The efficacy
of forward osmosis process was measured on the basis of water flux, water recovery rate,
water permeability, specific energy consumption and solute flux where applicable. Single,
binary and ternary systems were considered.
Experimental results showed the NF membrane and the RO membrane performed better at
low and high concentrations of osmotic agent. Higher water flux rates were achieved by
using NF membrane for both types of osmotic agents with changing osmotic agent
concentration rates. The best result was obtained through the combination of NF membrane
and glucose at lower concentrations and with sucrose at higher concentrations. The NF
membrane-sucrose system showed better results for all parameters when changing feed water
flow rate at lower temperatures while the NF-glucose system showed better performance
when increasing temperature of the solution. Specific energy consumption increased in all the
combinations of membrane-osmotic agent with increasing osmotic agent concentration rates.
However, the lowest energy requirements were noted for the combination of NF membrane -
glucose as an osmotic agent. Overall, both NF and RO membranes showed better results at
different osmotic agent flow rates, but glucose proved to be the superior osmotic agent.
For the binary systems, higher FO process efficacy across almost all parameters was noted
for the systems with deionised water (DW). However, systems also used more energy;
because such systems also used more energy they are not necessarily superior to other
systems. Water recovery rate and water flux were considerably higher in a ternary system
involving sucrose + NaCl + DW compared to the ternary system using brackish water as feed
solution in FO process. Overall, FO efficiency for a ternary mixture of glucose osmotic agent
+ NaCl salt + BW was higher in water recovery and water flux than the other ternary
mixtures with DW as feed solution.
Based on the study results, a number of recommendations for future work are provided.
Manipulated Osmosis Desalination (MOD) is a promising desalination approach that should
be further investigated by analysing the factors affecting the process’ efficacy. Such factors

are likely to include various membrane parameters (thickness, porosity and different pore
diameters) and draw solutions as well as the process parameters including temperature, flow
rates and osmotic agent concentrations. Further investigations should be conducted for binary
and especially ternary systems involving different types of membranes and solutes for
refining and optimising the process of selection. The Close loop circulation system needs to
be replaced by the no-circulation systems for better FO performance in future studies.
Importantly, the experimental results should be compared with the developed mathematical
models to further validate the results. Finally, future MOD studies should focus on
identifying optimal regeneration approaches. The selection of osmotic agents based on their
regeneration economics along with other important FO parameters could be undertaken in
future research.

Table of Contents
1. CHAPTER ONE: INTRODUCTION ............................................................................ 1
1.1. Research Background ..................................................................................................... 1
1.2. Overview of Desalination Processes ............................................................................... 2
1.2.1. Thermal Desalination .............................................................................................. 2
1.2.1.1. Multistage Flash ................................................................................................ 3
1.2.1.2. Multi-Effect Evaporation .................................................................................. 3
1.2.1.3. Thermal Vapour Compression .......................................................................... 3
1.2.1.4. Adsorption Vapour Compression ..................................................................... 3
1.2.2. Alternative Approaches .......................................................................................... 4
1.2.3. Membrane Approaches ........................................................................................... 4
1.2.3.1. Electrodialysis and Electrodialysis Reverse ..................................................... 5
1.2.3.2. Reverse Osmosis ............................................................................................... 5
1.2.3.3. Nanofiltration .................................................................................................... 7
1.2.3.4. Forward Osmosis .............................................................................................. 7
1.3. Research Rationale.......................................................................................................... 7
1.3.1. Manipulated Osmosis Desalination ........................................................................ 9
1.4. Research Contribution .................................................................................................. 11
1.5. Research Aims and Objectives ..................................................................................... 12
1.6. Thesis Organisation ...................................................................................................... 14
2. CHAPTER TWO: LITERATURE REVIEW .............................................................. 15
2.1. Water Desalination........................................................................................................ 15
2.1.1. Importance of Water Desalination ........................................................................ 15
2.1.2. Brief History of Water Desalination ..................................................................... 16
2.1.3. Current Status of Desalination Technologies ....................................................... 18
2.2. Types of Desalination ................................................................................................... 21
2.2.1. Thermal Approaches ............................................................................................. 21
2.2.1.1. Multistage Flash (MSF) .................................................................................. 22
2.2.1.2. Single Effect Evaporation (SEE) .................................................................... 22
2.3.1.3. Multi-Effect Desalination ............................................................................... 25
2.2.1.4. Freezing, Humidification and Solar Stills ....................................................... 25
2.2.2. Membrane Approaches ......................................................................................... 26
2.2.2.1. Electrical Driven Approaches ......................................................................... 26
2.2.2.2. Pressure Driven Approaches ........................................................................... 27
2.4. Forward Osmosis .......................................................................................................... 29

2.4.1. Process Description ............................................................................................... 29
2.4.2. Advantages of FO ................................................................................................. 32
2.4.3. FO Applications .................................................................................................... 33
2.4.3.1. Energy Applications........................................................................................ 33
2.4.3.2. Wastewater Treatment .................................................................................... 35
2.4.3.3. Pharmaceutical Applications .......................................................................... 38
2.4.3.4. Food Processing .............................................................................................. 38
2.4.3.5. Other Applications of FO................................................................................ 39
2.4.4. FO Applications for Water Desalination .............................................................. 39
2.4.4.1. Direct FO Desalination ................................................................................... 40
2.4.4.2. Indirect FO Water Desalination ...................................................................... 43
2.4.6. Membranes for Forward Osmosis Desalination ................................................... 45
2.4.6.1. Phase Inversion Cellulosic Membranes (PICM)............................................. 45
2.4.6.2. Thin Film Composite Membranes (TFCM) .................................................... 46
2.4.6.3. Chemically Modified Membranes (CMM) ..................................................... 49
2.4.6.4. Selection and Evaluation of FO Membranes .................................................. 49
2.4.7. Draw Solutions for Forward Osmosis .................................................................. 50
2.5. Concentration Polarisation ............................................................................................ 52
2.5.1. Introduction ........................................................................................................... 52
2.5.2. External Concentration Polarisation ..................................................................... 53
2.5.3. Internal Concentration Polarisation ...................................................................... 56
2.6. Manipulated Osmosis Desalination (MOD) ................................................................. 61
2.6.1. Process Description ............................................................................................... 61
2.6.2. Advantages and Considerations ............................................................................ 62
2.6.3. Existing MOD Projects ......................................................................................... 65
2.6.3.1. University of Surrey Rig ................................................................................. 65
2.6.3.2. Gibraltar MOD Pilot Plant .............................................................................. 66
2.6.3.3. Production Facilities in Oman ........................................................................ 67
2.7. Chapter Summary ......................................................................................................... 69
3. CHAPTER THREE: MATERIALS AND METHODS .............................................. 71
3.1. Introduction ................................................................................................................... 71
3.2. Flat Sheet Membrane Study .......................................................................................... 71
3.2.1. Experiment Outline ............................................................................................... 71
3.2.2. Experiment Set Up ................................................................................................ 72
3.2.3. Process Operation ................................................................................................. 74

3.2.4. Osmotic Agents ..................................................................................................... 76
3.2.5. Osmotic Agent Concentration Effect Study ......................................................... 76
3.2.6. Feed Water Flow Rate Effect Study ..................................................................... 77
3.2.7. Temperature Effect Study ..................................................................................... 78
3.3. Hollow Fine Fibre Membrane Study ............................................................................ 78
3.3.1. Experiment Outline ............................................................................................... 78
3.3.2. Experiment Set Up ................................................................................................ 79
3.3.3. Process Operation ................................................................................................. 81
3.3.4. Osmotic Agents ..................................................................................................... 83
3.3.5. Experimental Measurements ................................................................................. 85
3.3.6. Synthesis of Brackish Water and Seawater .......................................................... 89
3.4. Calculations of FO Performance Parameters ................................................................ 90
3.4.1. Water Flux ............................................................................................................ 90
3.4.2. Water Permeability ............................................................................................... 90
3.4.3. Recovery Percentage ............................................................................................. 91
3.4.4. Salt Flux ................................................................................................................ 91
3.4.5. Specific Energy Consumption .............................................................................. 91
3.4.6. Membrane Flow Rate Factor ................................................................................ 92
3.4.7. Net Driving Pressure ............................................................................................. 92
4. CHAPTER FOUR: RESULTS AND DISCUSSION .................................................. 93
4.1 Introduction .................................................................................................................... 93
4.1 NF Membrane Study ...................................................................................................... 94
4.1.1 The Effects of Osmotic Agents’ Concentrations ................................................... 94
4.1.1.1. Effect on the Water Flux ................................................................................. 94
4.1.1.2 Effect on the Water Recovery Percent ............................................................. 97
4.1.1.3. Effect on the Water Permeability .................................................................... 97
4.1.1.4 Effect on the Specific Energy Consumption .................................................... 98
4.1.1.5 Effect of OA Concentration on the Solute Flux............................................... 98
4.1.1.6. Discussion ....................................................................................................... 98
4.1.2 The Effects of Feed Water Flow Rate ................................................................... 99
4.1.2.1. Effect on the Water Flux ................................................................................. 99
4.1.2.2 Effect on the Water Recovery Percent ............................................................. 99
4.1.2.3 Effect on the Water Permeability ................................................................... 100
4.1.2.4 Effect on the Specific Energy Consumption .................................................. 100
4.1.3.3. Effect on the Solute Flux .......................................................................... 102

4.1.3.4. Discussion ................................................................................................. 102
4.1.4.The Effects of Osmotic Agents’ Flow rate .......................................................... 102
4.1.4.3. Effect on the Water Flux .......................................................................... 102
4.1.4.4. Effect of Recovery Percentage ................................................................. 103
4.1.4.5. Effect on the Water Permeability ............................................................. 103
4.1.3.4. Effect on Osmotic Agent Flow Rate on Specific Energy Consumption (SEC) ..
.................................................................................................................. 105
4.1.3.5 Effect on the Solute Flux ............................................................................... 105
4.1.3.6. Discussion ..................................................................................................... 105
4.1.4 The Effects of Feed Water Temperature .............................................................. 105
4.1.4.1. Effect on Water Flux ..................................................................................... 106
4.1.4.2. Effect on the Water recovery percentage ...................................................... 106
4.1.4.3 Effect on the Water Permeability ................................................................... 108
4.1.4.4 Effect on the Specific Energy Consumption .................................................. 108
4.1.4.5 Effect on the Solute Flux ............................................................................... 108
4.1.4.6. Discussion ..................................................................................................... 109
4.1.5 The Effects of Osmotic Agents’ Temperatures ................................................... 109
4.1.5.1. Effect on the Water Flux ............................................................................... 109
4.1.5.2 Effect on the Water Recovery Percent ........................................................... 111
4.1.5.3 Effect on the Water Permeability ................................................................... 111
4.1.5.4 Effect on the Specific Energy Consumption .................................................. 111
4.1.5.5 Effect on the Solute Flux ............................................................................... 112
4.1.5.6. Discussion ..................................................................................................... 112
4.1.6. Overview of the NF Membrane System Results ................................................ 112
4.2. RO Flat Sheet Membrane Study ................................................................................. 113
4.2.1. The Effects of Osmotic Agents’ Concentrations ................................................ 113
4.2.1.1. Effect on the Water Flux ............................................................................... 114
4.2.1.2. Effect on the Percent of Water Recovery ..................................................... 116
4.2.1.3. Effect on the Water Permeability .................................................................. 116
4.2.1.4. Effect on the Specific Energy Consumption ................................................. 116
4.2.1.5. Effect on the Solute Flux .............................................................................. 117
4.2.1.6. Discussion ..................................................................................................... 117
4.2.2. The Effects of Feed Water Flow rate .................................................................. 117
4.2.2.1. Effect on the Water Flux ............................................................................... 119
4.2.2.2. Effect on the Water Recovery Percentage .................................................... 119

4.2.2.3. Effect on the Water Permeability .................................................................. 119
4.2.2.4. Effect on the Specific Energy Consumption ................................................. 120
4.2.2.5. Effect on the Solute Flux .............................................................................. 120
4.2.2.6. Discussion ..................................................................................................... 120
4.2.3. The Effects of Osmotic Agents’ Flow rate ......................................................... 121
4.2.3.1. Effect on the Water Flux ............................................................................... 121
4.2.3.2. Effect on the Water Permeability .................................................................. 121
4.2.3.3. Effect on the Water Recovery Percentage (%R) ........................................... 123
4.2.3.4. Effect on the Specific Energy Consumption ................................................. 123
4.2.3.5. Discussion ..................................................................................................... 123
4.2.4. The Effects of Feed Water Temperature ............................................................. 124
4.2.4.1. Effect on Water Flux ..................................................................................... 124
4.2.4.2. Effect on the Water Recovery Percentage .................................................... 124
4.2.4.3. Effect on the Water Permeability .................................................................. 126
4.2.4.4. Effect on the Specific Energy Consumption ................................................. 126
4.2.4.5. Effect on the Solute Flux .............................................................................. 126
4.2.4.6. Discussion ..................................................................................................... 127
4.2.5. The Effects of Osmotic Agents’ Temperatures .................................................. 127
4.2.5.1. Effect on the Water Flux ............................................................................... 127
4.2.5.2. Effect on the Water Recovery Percent .......................................................... 129
4.2.5.3. Effect on the Water Permeability .................................................................. 129
4.2.5.4. Effect on the Specific Energy Consumption ................................................. 129
4.2.5.5. Discussion ..................................................................................................... 130
4.2.6. RO Membrane Results Overview ....................................................................... 130
4.3. A Comparison Study of Membrane - Osmotic Agent Systems .................................. 131
4.3.1. Osmotic Agents’ Concentration .......................................................................... 131
4.3.1.1. Effect on the Water Flux ............................................................................... 131
4.3.1.2. Effect of OAs Concentration on Percent Recovery ...................................... 132
4.3.1.3. Effect on of OAs Concentration on Water Permeability .............................. 133
4.3.1.4. Effect on the Specific Energy Consumption ................................................. 134
4.3.1.5. Discussion ..................................................................................................... 135
4.3.2. Feed Water Flow Rate ........................................................................................ 136
4.3.2.1. Effect on the Water Flux ............................................................................... 136
4.3.2.2. Effect on the Water Recovery Percentage .................................................... 137
4.3.2.3. Effect on the Water Permeability .................................................................. 138

4.3.2.4. Effect on the Specific Energy Consumption ................................................. 139
4.3.2.5. Discussion ..................................................................................................... 140
4.3.3. Osmotic Agents’ Flow Rate ................................................................................ 141
4.3.3.1. Effect on the Water Flux ............................................................................... 141
4.3.3.2. Effect on the Water Recovery Percent .......................................................... 142
4.3.3.3. Effect on the Water Permeability .................................................................. 143
4.3.3.4. Effect of OAs Flow Rate on Specific Energy Consumption (SEC) ............. 144
4.3.3.5. Discussion ..................................................................................................... 145
4.3.4. Feed Water Temperature .................................................................................... 146
4.3.4.1. Effect of Feed Water Temperature on Water Flux ....................................... 146
4.3.4.2. Effect on the Water Recovery Percent .......................................................... 147
4.3.4.3. Effect on the Water Permeability .................................................................. 148
4.3.4.4. Effect on the Specific Energy Consumption ................................................. 149
4.3.4.5. Discussion ..................................................................................................... 150
4.3.5 Osmotic Agent Temperature ................................................................................ 151
4.3.5.1. Effect of Osmotic Agent Temperature on Water Flux.................................. 151
4.3.5.2. Effect on the Water Recovery Percent .......................................................... 151
4.3.5.3. Effect on the Water Permeability .................................................................. 152
4.3.5.4. Effect of OA Temperature on Specific Energy Consumption (SEC) ........... 153
4.3.5.5. Discussion ..................................................................................................... 154
4.3.6. Generalised Results for the Membrane-Osmotic Agent Systems ....................... 155
4.4. Binary and Ternary OsmoticSystems ......................................................................... 156
4.4.1. Binary System with Deionised and Brackish Water as the Feeds ...................... 156
4.4.1.1. Effect on the Water Flux ............................................................................... 156
4.4.1.2. Effect on the Water Recovery Percent .......................................................... 157
4.4.1.3. Effect on the Water Permeability .................................................................. 158
4.4.1.4. Effect of OPD on Specific Energy Consumption (SEC) .............................. 159
4.4.1.5. Effect of OPD on Solute Flux in sucrose and glucose Binary System ......... 160
4.4.1.6. Discussion ..................................................................................................... 161
4.4.2. Binary System with Seawater as the Feedwater ................................................. 162
4.4.2.1. Effect on the Water Flux ............................................................................... 162
4.4.2.2. Effect on the Water Recovery Percent .......................................................... 163
4.4.2.3. Discussion ..................................................................................................... 164
4.4.3. Ternary Systems ................................................................................................. 165
4.4.3.1. Sucrose Ternary Systems and Water Recovery Percent ............................... 165

4.4.3.2. Sucrose Ternary Systems and Water Flux .................................................... 166
4.4.3.3. Glucose Ternary Systems and Water Recovery Percent............................... 168
4.4.3.4. Glucose Ternary Systems and Water Flux .................................................... 169
4.4.3.5. Discussion ..................................................................................................... 170
5. CHAPTER FIVE: CONCLUSIONS ......................................................................... 172
5.1. Introduction ................................................................................................................. 172
5.1. NF Membrane Study Outcomes.................................................................................. 173
5.1.1. Effect of Osmitic Agent Concentration Change ................................................. 173
5.1.2. The Effect of Feed Water Flow Rate Change ..................................................... 173
5.1.3. The Effect of Draw Solution Flow Rate Change ................................................ 173
5.1.4. The Effect of Feed Water Temperature Change ................................................. 173
5.1.5. The Effect of Draw Solution Temperature Change ............................................ 173
5.2. RO Membrane Study Outcomes ................................................................................. 174
5.2.1. The Effect of Draw Solution Concentration Change .......................................... 174
5.2.2. The Effect of Feed Water Flow Rate Change ..................................................... 174
5.2.3. The Effect of Draw Solution Flow Rate Change ................................................ 174
5.2.4. The Effect of Feed Water Temperature Change ................................................. 174
5.2.5. The Effect of Draw Solution Temperature on Flow Rate Change ..................... 174
5.3. Comparative Performance of NF and RO Membranes ............................................... 175
5.4. Outcomes for Binary and Ternary Systems for HFFM Membrane ............................ 176
6. CHAPTER SIX: FUTURE WORK ........................................................................... 179
7. References .................................................................................................................. 180
8. Appendix A1: Osmotic Agents Samples’ Analysis ................................................... 202
9. Appendix A2: Viscosity Meter TC-502 .................................................................... 206
10. Appendix A3: The Concentration of Mixture of Organic Osmotic Agent (Sucrose)
with Inorganic Osmotic Agent Sodium Chloride VersusDW/BW. ....................................... 207
11. Appendix A4:Combination of Organic Asmotic Agents Mixture of Sucrose and NaCl
versus DW/BW as Feed Water .............................................................................................. 209
12. Appendix A5: Combination of Organic Asmotic Agents Mixture of Glucose and NaCl
versus DW/BW as Feed Water .............................................................................................. 210
13. Appendix A6: Flat Sheet Unit Experimental Work for Osmotic Agent Sucrose andRO
Membrane .............................................................................................................................. 212
14. Appendix A7: Flat Sheet Unit Experimental Work for Osmotic Agent Glucose andRO
Membrane .............................................................................................................................. 214
15. Appendix A8: Flat Sheet Unit Experimental Work for Osmotic Agent Sucrose and NF
Membrane .............................................................................................................................. 216

16. Appendix A9: Flat Sheet Unit Experimental Work for Osmotic Agent Glucose and
NF Membrane ........................................................................................................................ 218
17. Appendix A10: Sample Calculations for the Data Parameters (Table 4.1) ............... 220

List of Figures
Figure 1.1. Electrodialysis Process (Fritzmann, et al, 2007) ..................................................... 5
Figure 1.2. Forward and Reverse Osmosis (Krukowski, 2001). Where: ∆P represents the
trans-membrane pressure differential; ∆π represents cross membrane osmotic pressure
differential. ................................................................................................................................. 6
Figure 1.3. Schematic Flow Diagram of the MOD Process. ..................................................... 9
Figure 1.4.MOD Laboratory Test Trial Plant Rig in Surrey University .................................. 13
Figure 2.1. Cumulative Installed Capacities of Desalination Plants: 1945-2005 (Gleick et al.
2006) ........................................................................................................................................ 17
Figure 2.2. RO-Based Desalination: Cost Evolution (Reddy and Ghaffour 2007) ................. 18
Figure 2.3. Desalination Technologies’ Share in Global Installed Capacities (Global Water
Intelligence, 2012) ................................................................................................................... 19
Figure 2.4. Desalination Technologies’ Share in the Middle East (Greenlee et al. 2009) ....... 19
Figure 2.5. Thermal and Membrane Desalination Approaches and Methods (adapted from El-
Dessoukey and Eltounney, 2000) ............................................................................................ 24
Figure 2.6. Multiple Effect Desalination Process (Al-Harbi et al. 2011) ................................ 25
Figure 2.7. Forward Osmosis Process (Thompson and Nicoll 2011) ...................................... 30
Figure 2.8. Water Flux Magnitude and Direction as a Function of Manually Applied
(Hydraulic) and Osmotic Pressures (adapted from Lee et al.1981) ......................................... 31
Figure 2.9. An Example of an OMBR (Achilli et al. 2009) ..................................................... 36
Figure 2.10. A Full Scale Working FO-Based Leachate Treatment System (Water
Development Report 2009) ...................................................................................................... 37
Figure 2.11. Direct Osmosis Process (adapted from Li et al. 2013) ........................................ 41
Figure 2.12. Indirect FO Process for Water Desalination (adapted from Li et al. 2013) ........ 44
Figure 2.13. Cross-Sectional Electronic Microscope Image of HTI’s Membranes (Zhao and
Zou 2011) ................................................................................................................................. 47
Figure 2.14. Cross-Sectional Electronic Microscope Image of a TFCM with Fingerlike Pores
(Yip et al. 2010) ....................................................................................................................... 48
Figure 2.15. ICP and ECP in FO Process (Zhao et al. 2012) ................................................... 53
Figure 2.16. Dilutive External, Concentrative External, Dilutive Internal and Concentrative
Internal Concentration Polarization (Mezher et al. 2011; Schiermeier 2008; Younos and
Tulou 2005) .............................................................................................................................. 57
Figure 2.17. Water Permeability Cefficient as a Function of Draw Solution Concentrations
(Mehta and Loeb 1979) ............................................................................................................ 58
Figure 2.18. Theoretical, FO Mode and PRO Mode Water Flux as a Function of net Osmotic
Pressure (Zhao and Zou 2011). ................................................................................................ 61
Figure 2.19. Continuous MOD Process with Regeneration Step (Adapted from Al Mayahi
and Sharif 2004) ....................................................................................................................... 62

Figure 2.20. Projected Power Consumption of MOD and RO Plants (adapted from Nicoll
2011) ........................................................................................................................................ 64
Figure 2.21. Projected Operating Costs of MOD and RO Plants (adapted from Nicoll 2011) 65
Figure 2.22. Gibraltar MOD Rig by Modern Water Prior to Containerisation (Thompson and
Nicoll 2011) ............................................................................................................................. 66
Figure 2.23. MOD Plant Facility in Al Khaluf, Oman (Thompson and Nicoll 2011) ............. 68
Figure 2.24. Normalised Flow for Al Khaluf RO Plant (above) and MOD Plant (below) in
2010 (Thompson and Nicoll 2011) .......................................................................................... 69
Figure 3.1. Experiment Outline for FO Using Flat Sheet Membranes .................................... 72
Figure 3.2.Design and layout of experimental membrane module for FO process ................. 73
Figure 3.3. Schematic Diagram of theFlat SheetForward Osmosis Bench-Scale Laboratory
Apparatus ................................................................................................................................. 74
Figure 3.4. Disassembled Membrane Testing Apparatus Showing Flow Channels. ............... 74
Figure 3.5. Experiment Outline for Hollow Fine Fibre Membrane ......................................... 79
Figure 3.6. The Experimental Unit Fixed onto aSkid. ............................................................. 80
Figure 3.7. Flow Diagram of The Hollow Fine Fibre Forward Osmosis Process ................... 81
Figure 3.8. The Experiment Hollow Fine Fibre Membrane, FO in Operation ........................ 82
Figure 3.9. Osmotic Pressure as a Function of concentration in sucrose-Sodium Chloride
Solution: a) Sodium Chloride concentration fixed and sucrose concentration Variable; b)
Sucrose concentration fixed and sodium chloride concentration variable. All values obtained
by OLI Analyzer software at 25°C. ......................................................................................... 87
Figure 4.1. Effect of osmotic pressure deferential (bar) on water flux (Jw) with constant
temperature (25 oC) and constant flow rates of feed and draw solutions (2 L/min) ................ 97
Figure 4.2. Effect of OA concentration on Water Flux with RO and NF Using RO and NF
Membrane at Constant Temperature (25 oC) and Feed and Draw Solution Flow Rates (2
L/min) .................................................................................................................................... 132
Figure 4.3. Effect of OAs Concentration on Percent Recovery Using RO and NF Membrane
at Constant Temperature (25 oC) and Feed and Draw Solution Flow Rates (2 L/min) ......... 133
Figure 4.4. Effect of OAs Concentration on Water Permeability Using RO and NF
Membranes at Constant Temperature (25 oC) and Feed and Draw Solution Flow Rates (2
L/min) .................................................................................................................................... 134
Figure 4.5. Comparison of Osmotic Agents’ Concentration Effect on Specific Energy
Consumption for NF and RO Membranes at Constant Temperature (25 oC) and Feed and
Draw Solution Flow Rates (2 L/min)..................................................................................... 135
Figure 4.6.Comparison of Feed Water Flow Effect on Water Flux for NF and RO Membranes
at Constant Temperature (25 oC) and OAs Concentration(275 and 200 g/L) for both sucrose
and glucose respectively ........................................................................................................ 137
Figure 4.7. Comparison of Feed Water Flow Effect on Water Recovery Percentage for NF
and RO Membranes at Constant Temperature (25 oC) andOAs Concentration (275 and 200
g/L) for both sucrose and glucose respectively...................................................................... 138

Figure 4.8. Comparison of Feed Water Flow Effect on Water Permeability for NF and RO
Membranes at Constant Temperature (25 oC) and OAs Concentration(275 and 200 g/L) for
both sucrose and glucose respectively ................................................................................... 139
Figure 4.9. Comparison of Feed Water Flow Effect on Specific Energy Consumption for NF
and RO Membranes at Constant Temperature and OAs Concentration(275 and 200 g/L) for
both sucrose and glucose respectively ................................................................................... 140
Figure 4.10. Comparison of Osmotic Agent Flow Effect on Water Flux for NF and RO
membranes at Constant Temperature (25 oC) and OAs Concentration(275 and 200 g/L) for
both sucrose and glucose respectively ................................................................................... 142
Figure 4.11. Comparison of Osmotic Agent Flow Effect on Water Recovery Percent for NF
and RO membranes at Constant Temperature (25 oC) and OAs Concentration (275 and 200
g/L) for both sucrose and glucose respectively...................................................................... 143
Figure 4.12. Effect of OAs Flow Rate on Water Permeability Using RO And NF Membranes
at Constant Temperature (25 oC) and OAs Concentration(275 and 200 g/L) for both sucrose
and glucose respectively ........................................................................................................ 144
Figure 4.13. Effect of OAs flow rate on SEC using NF and RO membrane at Constant
Temperature (25 oC) and OAs Concentration(275 and 200 g/L) for both sucrose and glucose
respectively ............................................................................................................................ 145
Figure 4.14. Effect of Feed Water Temperature on Water Flux Using NF and RO Membranes
at Constant Feed and Draw Solution Flow Rate (2 L/min) and OAs concentration (200 and
250 g/L) for both sucrose and glucose respectivly ................................................................ 147
Figure 4.15. Effect of Feed Water Temperature on Percent Recovery Using NF and RO
Membranes at Constant Feed and Draw Solution Flow Rate (2 L/min) and OAs concentration
(200 and 250 g/L) for both sucrose and glucose respectivly ................................................. 148
Figure 4.16. Effect of Feed Water Temperature on Water Permeability Using NF and RO
Membranes at Constant Feed and Draw Solution Flow Rate (2 L/min) and OAs concentration
(200 and 250 g/L) for both sucrose and glucose respectivly ................................................. 149
Figure 4.17. Effect of Feed Water Temperature on Specific Energy Consumption Using NF
and RO Membranes at Constant Feed and Draw Solution Flow Rate (2 L/min) and OAs
concentration (200 and 250 g/L) for both sucrose and glucose respectivly .......................... 150
Figure 4.18. Effect of OA Temperature on Water Flux Using RO and NF Membranes at
Constant Feed and Draw Solution Flow Rate (2 L/min) and and OAs concentration (200 and
250 g/L) for both sucrose and glucose respectivly ................................................................ 151
Figure 4.19. Effect of OA Temperature on Percent Recovery Using NF and RO Membranes
at Constant Feed and Draw Solution Flow Rate (2 L/min) and and OAs concentration (200
and 250 g/L) for both sucrose and glucose respectivly .......................................................... 152
Figure 4.20.Effect of OA Temperature on Water Permeability Using NF and RO Membranes
at Constant Feed and Draw Solution Flow Rate (2 L/min) and OAs concentration (200 and
250 g/L) for both sucrose and glucose respectivly ................................................................ 153
Figure 4.21. Effect of OA Temperature on Specific Energy Consumption Using NF and RO
Membranes at Constant Feed and Draw Solution Flow Rate (2 L/min) and and OAs
concentration (200 and 250 g/L) for both sucrose and glucose respectivly .......................... 154
Figure 4.22. Osmotic Pressure Differential Effect on Water Flux in a Binary System ......... 157

Figure 4.23. Osmotic Pressure Differential on Percent Recovery in Binary Sucrose and
Glucose System ...................................................................................................................... 158
Figure 4.24. Osmotic Pressure Differential on Water Permeability in Binary Sucrose and
Glucose System ...................................................................................................................... 159
Figure 4.25. Osmotic Pressure Differential Effect on SEC of Sucrose and Glucose OAs in a
Binary System ........................................................................................................................ 160
Figure4.26. Osmotic Pressure Differential Effect on Solute Fluxin Binary Sucrose and Binary
Glucose Systems .................................................................................................................... 161
Figure 4.27. Comparison of Osmotic Pressure Differential Effect on Water Flux in Binary
Osmotic Systems and Seawater as the Feed Water ............................................................... 163
Figure 4.28. Comparison of Osmotic Pressure Differential Effect on Water Recovery Percent
in Binary Osmotic Systems and Seawater as The Feed Water .............................................. 164
Figure 4.29. Effect of Osmotic Pressure on Water Recovery Percent in a Ternary System
(sucrose + NaCl /H2O ) .......................................................................................................... 166
Figure 4.30. Effect of Osmotic Pressure on Water Flux in a Ternary System (sucrose + NaCl /
H2O ) ...................................................................................................................................... 168
Figure 4.31. Effect of Osmotic Pressure on Water Recovery Percent in a Ternary System
(glucose + NaCl / H2O ) ........................................................................................................ 169
Figure 4.32. Effect of Osmotic Pressure on Water Recovery Percent in a Ternary System
(glucose + NaCl /H2O ) .......................................................................................................... 170
Figure 8.1. Calibration Curve for Glucose............................................................................. 202
Figure 8.2. Calibration Curve for Sucrose ............................................................................. 204
Figure 9.1. Viscosity Meter TC-502 ...................................................................................... 206

List of Tables
Table 1.1. Approaches to Seawater Desalination (Van der Vegt et al., 2011) .......................... 2
Table 2.1. Description of Pressure Driven Membrane Processes Source : Mortazvi (2008) .. 29
Table 2.2. Comparison of FO and RO (Adapted and Expanded from Chung et al. 2012; Zhao
et al. 2012) ............................................................................................................................... 63
Table 3.1. TFC-SR2 Specifications (Koch Membrane Systems Ltd ,UK) .............................. 75
Table 3.2. TFC-ULP specifications (Koch membrane systems Ltd ,UK) ............................... 75
Table 3.3. Physico-Chemical Properties of Sucrose and Glucose ........................................... 76
Table 4.1. Effect of Osmotic Agent Concentration on Water Flux, Recovery Percentage,
Water Permeability, Specific Energy Consumption and Solute Flux ...................................... 95
Table 4.2.Effect of Osmotic Pressure Deferential (Bar) on Water Flux (Jw)........................... 95
Table 4.3.Effect of Osmotic Agents’ Concentration on Viscosity .......................................... 96
Table 4.4. Effect of OAs Viscosity on Water Flux .................................................................. 96
Table 4.5.Effect of Feed Water Flow Rate on Water Flux, Recovery Percentage, Water
Permeability, Specific Energy Consumption and Solute Flux............................................... 101
Table 4.6. Effect of Osmotic Agent Flow Rate on Water Flux, Recovery Percentage, Water
permeability, Specific Energy Consumption and Solute Flux ............................................... 104
Table 4.7. Effect of Feed Water Temperature on Water Flux, Recovery Percentage, Water
permeability, Specific Energy Consumption and Solute Flux ............................................... 107
Table 4.8. Effect of OA Temperature on Water Flux, Recovery Percentage, Water
Permeability, Specific Energy Consumption and Solute Flux............................................... 110
Table 4.9. Results of Changes of Manipulated FO Factors on Key Measured Parameters of
the Process: NF Membrane .................................................................................................... 113
Table 4.10. Effect of Osmotic Agent Concentration on Water Flux, Recovery Percentage,
Water permeability, Specific Energy Consumption and Solute Flux .................................... 115
Table 4.11. Effect of Osmotic Pressure Differential on Water Flux ..................................... 115
Table 4.12. Effect of Feed Water Flow Rate on Water Flux, Recovery Percentage, Water
Permeability, Specific Energy Consumption and Solute Flux............................................... 118
Table 4.13. Effect of Osmotic Agent Flow Rate On Water Flux, Recovery Percentage, Water
Permeability, Specific Energy Consumption and Solute Flux............................................... 122
Table 4.14. Effect of Feed Water Temperature on Water Flux, Recovery Percentage, Water
Permeability, Specific Energy Consumption and Solute Flux............................................... 125
Table 4.15. Effect of Osmotic Agent Temperature on Water Flux, Recovery Percentage,
Water Permeability, Specific Energy Consumption and Solute Flux .................................... 128
Table 4.16. Results of Changes of Manipulated FO Factors on Key Measured Parameters of
the Process: RO Membrane ................................................................................................... 131
Table 4.17. The Best Combinations of Membranes and Omsotic Agents Based on Experiment
Factors and Parameters .......................................................................................................... 155
Table 8.1. Results of the Analyses in mg/ml Glucose ........................................................... 203

Table 8.2. Results of the Analyses in mg/ml Sucrose............................................................ 205
Table 10.1. The Concentration of Sucrose as OA with NaCl vs DW/BW as Feedwater ...... 207
Table 11.1. Sucrose and NaCl vs DW/BW as Feedwater ...................................................... 209
Table 12.1. Glucose and NaCl vs DW/BW as Feedwater ..................................................... 210
Table 13.1. Results for The System of Flat Sheet RO Membrane and Sucrose as OA ......... 212
Table 14.1. Results for The System of Flat Sheet RO Membrane and Glucose as OA ......... 214
Table 15.1. Results for The System of NF Membrane and Sucrose as OA ........................... 216
Table 16.1. Results for The System of NF Membrane and Glucose as OA .......................... 218
Table 17.2. Sample Calculations for the Data Parameters in Table 4.1. with Sucrose OA ... 225

Preface
The purpose of this research was to investigate the effect of different organic osmotic agents
in forward osmosis desalination process. The experimental apparatus was constructed at the
Centre for Osmosis Research and Applications (CORA), University of Surrey, UK to carry
out the experiments. The investigated osmotic agents were sucrose, glucose and sodium
chloride (NaCl). The experiments were conducted for several types of membranes: nano-
filtration (NF), reverse osmosis (RO) and hollow fine fibre membrane used as flat sheets and
modules. The study also investigated binary and ternary combinations involving different
organic osmotic agents. The manipulated factors in the experiments included osmotic agent
concentrations, flow rates and temperatures as well as feed water flow rates and temperatures.
The parameters measuring efficacy of the forward osmosis process were water flux, water
permeability, recovery percentage, solute flux and specific energy consumption where
applicable.
The research is contributed by definitions, theoretical concepts and practically conducted
experiments. All experiments were carried out in laboratory settings and on pilot scales using
calibrated measurements. The details of the experiments are presented in form of images,
figures, graphs and equations.
The study addressed an interesting challenge in the field of water desalination by
investigating forward osmosis process and attempting to develop optimal combinations of
membranes and osmotic agents to enhance the efficacy of forward osmosis desalination
process.
Chapter 1 describes the study background by reviewing the key water desalination
approaches, providing general outlook of the study and describing the rationale, main goals
and objectives of the research.
Chapter 2 presents a comprehensive literature review on desalination, with a focused view
on forward osmosis approach, its main principles and challenges.
Chapter 3 offers a review of the study methods including the experiment design and
procedures, quantitative aspects behind measures and detailed description of the research
elements.
Chapter 4 presents experimental results obtained during the study.

Chapter 5 presents the discussion of the results and offers conclusions based on the study
results.
Chapter 6 offers directions for future work.

Acknowledgements
In the name of Allah, the Most Gracious and the Most Merciful. Alhamdulillah, all
praises to Allah for the strengths and His blessing in completing this Thesis. First of all , I
would like to thank my mother, Moody Alfreedi , without her support and encouragement I
never would have been able to achieve my goals.
Secondly, I sincerely pay thanks and gratitude to my supervisor, Dr. Mohammed
Sanduk, Dr. Sami Al-ibi, Dr.Esat Alpay and Professor Adel Sharif for their kind supervision,
encouragement and constant support in completing this study. I wish to gratefully
acknowledge the special thanks to Professor Rex Thorpe and Mr. David Hawkins and Mrs.
Hilary Mitchell.
Finally , I would like to thank my lovely wife Badryah Aljourboo for supporting me
in this long journey of my life and love me so much. My love and thanks go also to my
beautiful angels, Najla , Rema , Khalid ,Saud for their understanding of why I wasn’t at home
as much as should like to have been.

Author’s declaration
I hereby declare that I (Saleh O. M. AlAswad) am the author of this thesis. I authorize the
University of Surrey to lend this thesis and to imitate in part or total at the request to other
institutions for the purpose of scholarly research
Sign. ........................................................................

Nomenclature
Abbreviations
Description
ABVC absorption vapour process
ADVC Adsorption vapour compression
AL Active layer
Al2(SO4)3 Aluminium Sulphate
C12H22O11 Sucrose
C3H6O3 cellulose acetate and lactic acid
C4H4O4 Maleic acid
C6H12O6 Glucose
CA cellulose acetate
Ca(OH)2 Calcium hydroxide
CaSO4 Calcium sulphate
CD Capacitive deionisation
CECP Concentrative external concentration polarization
CICP Dilutive internal concentration polarization
CMM Chemically modified membranes
CO2 Carbon dioxide
CORA Centre for osmosis research and applications
CVC Chemical vapour compression
DECP Dilutive external concentration polarization
DICP Concentrative internal concentration polarization
DO Direct Osmosis
DS Draw solution
ECP External concentration polarization
ED Electrodialysis
FO Forward osmosis
FS Feed solution
GAC Granular activated carbon
HTI Hydration technology innovation
ICP Internal concentration polarisation
LiBr Lithium bromide
LPRO Low pressure reverse osmosis
MED multi effect distillation
MEE Multi-effect evaporation
MENA Middle East and North Africa
MJ Minecraft joules
MOD manipulated osmosis desalination
MOD Manipulated osmosis desalination
MPD m-phenylenediamine
MSF multistage flash
MVC Mechanical vapour compression
Na2SO4 Sodium sulphate
NaCl Sodium chloride
NCA Non cellulose acetate
NDP Net driving pressure

NH3 Ammonia
NH4HCO3 Ammonium bicarbonate
OA Osmotic agent
OMBR Osmotic membrane bioreactor
PBI Polybenzimidazole
PDS Hydraulic pressure for draw solution
PES Polyethersulfone
PFW Hydraulic pressure for feed water
pH Negative logarithmic value of the hydroxonium ion (H3O+) concentration
PICM Phase inversion cellulosic membranes
PRO Pressure Retarded Osmosis
PS Polysulfonic
PSI Pound per square Inch
PVDF Polyvinylideneflouride
PVP Polyvinylpyrrolidone
RO Reverse osmosis
SEC Specific energy consumption
SEE single effect evaporation
SL Support layer
SO2 Sulfur dioxide
TDS Total dissolved solids
TFC Thin film composite
TFCM Thin film composite membranes
TFC-ULP Thin film composite ultra-low-pressure
TMC Trimesoyl chloride
TVC Thermal vapour compression
UCL University of California Los Angeles
VC vapour compression
ZnCl2 Zinc chloride
Symbols
Symbol Description A Water permeability Constant
Aw Membrane’s permeability coefficient
A Water permeability coefficient
Cb Concentration of the feed solution in the bulk Cm Concentration of Feed Solution at Membrane
D Solute’s diffusion coefficient
Dh Hydraulic diameter
E Specific energy consumption
G Acceleration
Js Salt flux diffusion
Jv Total volumetric
Jw Water flux K Mass transfer Coefficient
k Mass transfer
kdraw Mass transfer coefficient on the draw side
kfeed Mass transfer coefficient on the feed side K Mass transfer Coefficient

Ρ Turbine efficiency
PDin Absolute pressure of the draw solution (osmotic agent) entering the membrane
PFin Absolute pressure of the feed water entering the membrane
Pn Net driving pressure
P Solution pressure
Q Flow
QFin Volumetric flow rate of feed water entering the membrane
QFout Volumetric flow rate of feed water leaving the membrane
% R Recovery percentage
Sh Sherwood number
S Membrane’s structural parameter
Total power generated
Greek Symbol Description
δ Constrictivity
ε Porosity
εeff Effective transport through porosity μw Water Chemical Potential
∆π Osmotic pressure differential
∆πeff Effective driving force
π Osmotic Pressure
πbdraw Osmotic pressure of the draw solution in the bulk
πbfeed Osmotic pressure of the feed solution in the bulk
DS Osmotic pressure in bulk DS side
FW Osmotic pressure in bulk FW side
πmdraw Osmotic pressure of the draw solution at the membrane
πmfeed Osmotic pressure of the feed solution at the membrane
DS-m Osmotic pressure at the membrane interface in DS side
FW-m Osmotic pressure at the membrane interface in FW side
i Osmotic pressure at the transition interface between membrane layers
ρ Water density
Reflection Coefficient
Thickness
τ Tortuosity
Units
Description
g/L Gram per litre
psi Pascal
mg/L Milligram per litre ᴼC Degree Celsius
Note: Solute flux is used instead of sugar flux (sucrose or glucose solution) in the thesis in
various experimental runs.

Saleh Al Aswad Page 1
1. CHAPTER ONE: INTRODUCTION
1.1. Research Background
Insufficient supply of fresh water is gradually becoming one of the most pressing global
issues. The continuing population growth, industrialisation and agriculture activities are
creating increasing demand on the naturally available amounts of drinking water resources,
while pollution and instability of weather patterns decreases the chances of these resources’
recuperation. As a result, nearly one third of the global population today lives in the water-
stressed regions, and by 2025 this number is expected to double (Service, 2006).
In order to counter the imminent shortages of fresh water supply, a number of measures have
been suggested, including water conservation techniques, building of better infrastructure and
water distribution systems. The problem with these approaches, however, is that they are only
able to reduce the use of the available water sources, not offer alternative ways to water
production. From this perspective, the new, unconventional approaches to extract fresh water
can be considered as an essential avenue to expand the existing water resources and resolve
many issues that the lack of fresh water involves (Elimelechand Phillip 2011; Shannon et al.
2008).
One of the most promising alternative methods to produce fresh water is desalination.
Desalination refers to the process of extracting/reducing the amount of solids, minerals, and
organic matter in water to make it suitable for consumption and irrigation (Porteous 1983).
Typically, the desalination process uses either brackish water or seawater as feed water and
produces two streams: one with low concentration of salts and minerals for potable purpose
and the other one with high concentration of salts and minerals, which are either disposed of
or recycled again to receive a pure water flux across the selectively permeable FO and RO
membranes (Lewis 1982). While desalination processes using both feeds are common, it is
the seawater desalination which allows for a virtually unlimited supply of usable water, since
seawater represents 97% of available water on Earth (Kim et al. 2010). The potential of
seawater desalination has been recognised in many water stressed regions of the world.
Within the past several decades, desalination plants working on seawater feed appeared in
Israel, Spain, and a number of Middle Eastern countries (Dreizin et al. 2008; Lee 2010;
Schermeier 2008).

Saleh Al Aswad Page 2
The growth in popularity of seawater desalination plants has been caused by the
technological progress and appearance of commercially available materials to support the
process. The early plants were primarily based on thermal desalination approach, which was
energy demanding and not ecologically feasible (Elimelechand Phillip 2011; Mezher et al.
2011). Since then, thermal processes have been greatly improved, while new approaches to
seawater desalination have emerged as well, which were based on novel approaches to
separate water from different types of solutes.
1.2. Overview of Desalination Processes
Modern theory and practice of desalination recognizes more than a dozen approaches, which
are listed within three main categories in Table 1.1. The detailed discussion of each of these
approaches is beyond the scope of this report; therefore, each process is discussed in general
terms. The exception is the membrane technology approaches, which are the focus of the
current study.
Table 1.1. Approaches to Seawater Desalination (Van der Vegt et al., 2011)
Approaches Based on Thermal
Technologies
Approaches Based on
Membrane Technologies
Approaches Based on
Alternative Technologies
Adsorption Vapour Compression
Mechanical Vapour Compression
Multi-Effect Evaporation
Multistage Flash
Solar Distillation
Thermal Vapour Compression
Electrodialysis
Electrodialysis Reversal
Forward Osmosis
Reverse Osmosis
Capacitive Deionisation
Electrodeionisation
Freeze Separation
Gas Hydrates
Ion Exchange
Rapid Spray Evaporation
Vacuum Distillation
1.2.1. Thermal Desalination
Thermal desalination is the oldest and the most widespread approach to water desalination
(Mezher et al. 2011). In simplest terms, the approach assumes boiling the feed water to purify
and collect the vapour. Thermal desalination is a rather energy demanding process, which has
been widely applied in the Middle East, where the cost of petrochemicals is rather low.

Saleh Al Aswad Page 3
1.2.1.1. Multistage Flash
Multistage flash represents a process made of several flashing spaces called stages, each stage
containing an exchanger to heat the feed water and a collector for condensate steam. The
entire sequence has a cool and a hot end, and the stage temperatures between them increase.
Each stage has a different pressure level, which matches the boiling points of water solution
at that stage’s temperature. Feed water travels through each stage, where it is heated by
warmer water vapour. By reaching the final stage-the brine heater-the water solution has
achieved a maximum temperature and flows back through the stages, where certain amount
of it evaporates through the boiling (flashing) process. The evaporating steam is hotter than
the feed water; therefore, it cools down and condenses on the heat exchangers and heats the
feed water (Younos and Tulou 2005).
1.2.1.2. Multi-Effect Evaporation
Multi-effect evaporation is, according to its name, a combination of several effects. The feed
water gets sprayed over the hot tubes, where it evaporates, and the vapour is collected to flow
through the tubes in the next effect, thus using the energy from each stage to heat and
evaporate water at the next stage. With each passing effect, the remaining amount of brine is
collected at the bottom and either passes onto the next stage or gets disposed of. This
approach is, actually, less energy demanding than multistage flash while still being able to
handle large energy capacities (El-Dessouky and Eltounney 2002).
1.2.1.3. Thermal Vapour Compression
This approach is a somewhat improved multi-effect evaporation, where the steam jet ejector
compresses the vapour which enters the first effect tubes. The vapour gets condensed by a
condenser to the final product. An alternative way to compress the vapour is by mechanical
compressors instead of jet ejectors. It is considered that thermal vapour compression has a
higher performance ration in comparison to the multi-effect evaporation (El-Dessouky et al.
2000).
1.2.1.4. Adsorption Vapour Compression
In the essence of this approach is creation of pressure differences between the two reservoirs,
where feed water is transferred. Pressure differences are caused by an exothermic reaction,
where the feed water is preheated by being mixed with a special solution like LiBr. This
approach typically generates pot water (El-Dessouky and Eltounney 2002).

Saleh Al Aswad Page 4
1.2.2. Alternative Approaches
Among the alternative approaches to desalination, ion exchange, is perhaps, the one receiving
most of attention. Ion exchange systems involve interchange of ions between a solid phase
and a surrounding it liquid phase. The solid phase consists of chemical resins, which come in
forms of synthetic or naturally-occurring inorganic materials. The liquid phase consists of
feed water. Desalination through ion exchange is a rather complex process, where salt ions
(such as Na+ and Cl
-) are replaced for other ions when feed water passes through the solid
phase beads (Kim et al. 2010).
In addition to ion exchange, which is already being used in practice, a number of additional
technologies are emerging, which may have some potential for desalination in the future. One
of these approaches is electrodeionisation, which, in effect, is a combination of
electrodialysis and ion exchange. This approach assumes applying electric charges over a
feed water stream which goes through a series of membrane pairs. The membranes are either
anion or cat-ion transferring, but not both. As a result, two streams of liquid are created: one
of brine and one of pure water. Due to the nature of purification process, electrodeionisation
can produce extremely pure waters (Younos and Tulou 2005).
1.2.3. Membrane Approaches
Membrane technologies can be considered a successor to traditionally used thermal
desalination approaches: the vast majority of contemporary desalination plants, as well as
those being planned utilize membranes (Elimelech and Phillip 2011; Fritzmann, et al. 2007).
Membranes represent a thin layer of porous material, which permeates water molecules
through, but holds large molecules, viruses, bacteria and different solutes. They may be made
of different polymeric and non-polymeric materials, although the most commonly used
membranes for desalination are synthetic (Younos and Tulou 2005).
Based on the technological process used for desalination, all membrane based approaches can
be classified as either electrical or pressure driven. Electrical driven approaches include
electrodialysis and electrodialysis reversal, while pressure driven approaches include reverse
and Forward Osmosis, nano-, ultra-, and microfiltration. All these approaches are briefly
described below.

Saleh Al Aswad Page 5
1.2.3.1. Electrodialysis and Electrodialysis Reverse
Electrodialysis is a desalination approach relies on membranes and electrodes adjacent to
them. The separation of water from the particles dissolved in it occurs within membrane pair,
which includes an anion membrane, a cation membrane, and two spacers, which evenly
distribute the feed water flow across the membrane surface (Brunner, 1990). An example of a
complete electrodialysis schema is shown in Figure 1.1. In the picture, the ED stack is
separated into multiple cells by anion and cation exchange membranes labelled AEM and
CEM respectively. The alternating sequence of membrane placement allows to reduce ionic
species in the diluate compartments of the stack and increase them in the concentrate
compartments (Fritzmann et al. 2007). The electric circuit is closed in the first and last cells
of the ED stack. ED process is quite effective with removal of salts. As a rule, the process
requires 70-90 psi pressure and is able to remove 75% to 98% of solids from feed water
(Younos and Tulou 2005).
Figure 1.1. Electrodialysis Process (Fritzmann, et al, 2007)
1.2.3.2. Reverse Osmosis
Reverse Osmosis is the passage of liquid from the region of high concentration to the region
with low concentration through a one-way permeable membrane. Consequently, Reverse
Osmosis is the opposite of that: water travels from the regions with high concentration to the
region of low concentration under artificially applied pressure. The difference between
regular and Reverse Osmosis is demonstrated in Figure 1.2. Applied to the process of

Saleh Al Aswad Page 6
desalination, Reverse Osmosis separates water from salt from the seawater feed, as the salts
and minerals are held by membrane pores, which allow only water molecules through. The
concentrated brine left after the water passage is normally disposed of.
Figure 1.2. Forward and Reverse Osmosis (Krukowski, 2001). Where: ∆P represents
the trans-membrane pressure differential; ∆π represents cross membrane osmotic
pressure differential.
The Reverse Osmosis is much more powerful than electrodialysis, as it allows to effectively
remove TDS concentrations up to 45,000 mg/L, which is sufficient to purify both salt and
brackish waters. At the same time, Reverse Osmosis requires energy to operate the pumps
pressing feed water through the membranes, although the amount of energy is generally less
than under thermal desalination approaches. The required pressure levels, however, rise with
the constantly increasing feed water concentration (up to 1,200 psi for seawater), thereby
giving Reverse Osmosis only 30%-80% recovery rates (Younosand Tulou 2005).
Membranes play a crucial role in Reverse Osmosis desalination process. In general, all
membranes can be classified into cellulose acetate (CA) and non-cellulose acetate (NCA).
CA membranes have smooth surfaces, which are resistant to fouling, because the particles
causing fouling do not deposit in the membrane crevices (Nicolaisen 2002). NCA membranes
are commonly referred to as “thin film composite membranes.” They use organic materials,
such as polysulfone. The advantages of NCA are higher flux rates and relative stability over a
long range of pH levels; however, they are quite sensitive to the effects of chlorine (El-
DessoukyandEttouney 2002).
Protection of membranes in Reverse Osmosis and other membrane-based desalination
approaches is necessary to enhance retention of salts and reduce cost of energy. Therefore,
feed water pre-treatment is typically required to remove very large particles, bacteria, oil, and
organic matter that may damage membranes. Pre-treatment also involves addition of

Saleh Al Aswad Page 7
chemicals to avoid membrane scaling and the formation of precipitates as well as adjustment
of pH levels depending on the membrane type. Microfiltration and ultrafiltration are typical
pre-treatment approaches used in Reverse Osmosis. A more detailed overview of various
membrane types used for osmotic desalination process is provided in the Literature Review
section of the report.
1.2.3.3. Nanofiltration
Nanofiltration, in essence, has the same concept of work as Reverse Osmosis. The only
difference is in lower pressure levels required, because of larger pore sizes of the membranes.
Nano-filtration is used to soften water and remove larger solids and dissolved organic carbon.
Although sometimes applied as a standalone technology for low TDS brackish water feeds,
nano-filtration, nevertheless, cannot be effectively used to treat seawaters (Younos 2005). At
the same time, research has shown potential in application of nano-filtration in combination
with Reverse Osmosis approach (Al-Zuhairi 2008; Peng et al. 2004).
1.2.3.4. Forward Osmosis
Forward Osmosis is the direct osmotic approach, where liquid naturally travels from the areas
of low concentration to the areas of high concentration. Just like Reverse Osmosis, Forward
Osmosis approach has been considered for desalination since the 1970s. However, the earlier
studies remained largely theoretical, with few maturing into practical operational systems
(McCutcheon et al. 2005; Zhao et al. 2012). The interest in Forward Osmosis has grown
recently due to development of the commercially available membranes. Still, unlike Reverse
Osmosis, Forward Osmosis remains a poorly researched approach when it comes to
desalination (Cath et al. 2006; Zhao et al. 2012). At the same time, the available studies
confirmed Forward Osmosis potential as a more economically feasible and environmentally
sustainable desalination approach (Kravathand Davis 1975; McCutcheon et al. 2005; Peng et
al. 2004; Sharif and Al-Mayahi 2005).
1.3. Research Rationale
As summarised above (section 1.2), a number of desalination approaches have been presented
in the literature: multistage flash distillation (MSF), multi effect distillation (MED), vapour
compression (VC), reverse osmosis (RO), electrodialysis (ED), Capacitive Deionisation (CD)
and others (Ghaffour et al. 2013; Greenle et al. 2009; Fritzman et al. 2007; Kim et al. 2010;
Mezher et al. 2011; Younosand Toulou 2005). Some of these approaches, like RO MED, and

Saleh Al Aswad Page 8
MSF were successfully implemented in practice. Despite their commercial applications,
however, contemporary desalination methods are still far from ideal in both economical and
environmental terms. For example, thermal desalination approaches like MSF and MED are
economically burdensome due to enormous amounts of energy they require. The existing
popular membrane approaches like RO are more efficient in this regard, although they
provide relatively low recovery rates. Finally, novel approaches like electrodeionisation may
offer advantages of a combination of methods; however, they are still in research and
development stages, with little practical applications to confirm their superiority over the
existing seawater desalination techniques. Therefore, the search for more efficient and
effective means of water desalination continues.
FO is getting increasing attention by researchers and practitioners in the desalination area due
to the many advantages it may provide. One of the major benefits that distinguish it from the
dominant membrane based approaches is the balance between the required amount of energy
and the purity of the produced water. Further, because FO represents a naturally occurring
process of water separation, it requires significantly less energy than RO (McGinnis and
Elimelech 2007). This means better economic efficiency. At the same time, the membranes
used in FO process have the same density than the ones used in RO, which means
comparative levels of water purity. There are also a number of additional contaminants that
are held in the FO process (Cartinella et al. 2006; Cath et al. 2010). Another potential benefit
of FO approach application in seawater desalination is membrane durability. Several recent
studies demonstrated that the degree of fouling in FO is lower, more reversible, and it can be
further minimised by hydrodynamics optimisation (Achilliet al. 2009; Mi and Elimelech
2010; Lee et al. 2010). Finally, due to high levels of osmotic pressure gradient across the
membrane, FO may be able to provide higher levels of water fluxes and, consequently, higher
degrees of water recovery (Zhao et al. 2012). This, in turn, will lead to reduction of the brine
volumes, which so far has been the major environmental issue related to desalination plants
(McCutcheon et al. 2005).
There is growing research on desalination that focuses on application of hybrid (combined)
systems. Optimal combination of different desalination approaches may offer such benefits as
significant cost reductions, reduction of energy use and better handling of the discharge
materials (Al-Mutaz 2003; Hamed 2005; Gude et al. 2010). Ghaffour et al. (2013) showed
that hybrid water desalination systems are especially attractive in places with considerable
fluctuations of power and water demands. Various combinations of desalination techniques

Saleh Al Aswad Page 9
have been proposed, the majority of them include membrane and thermal methods: MSF/RO
and MED/RO (Gude et al. 2010). This research follows the call for more research on the
combination approaches to seawater desalination. The study takes Forward Osmosis as a
basis for the manipulated osmosis desalination (MOD) process.
1.3.1. Manipulated Osmosis Desalination
The Manipulated Osmosis Desalination (MOD) process was developed at the University of
Surrey’s Centre for Osmosis Research and Applications (CORA). The process is comprised
of FO desalination combined in a single cycle with a regeneration step. Specifically, the
principle behind the MOD is manipulation of two fluids with different osmotic pressures to
receive a pure water flux across the selectively permeable FO and RO membranes (Al-
Mayahiand Sharif 2004). The manipulated fluids are seawater and a chosen draw solution.
The seawater passes through a FO unit with a draw solution, which attracts water molecules.
The resulting liquid is then transferred to a membrane-based (RO or nanofiltration) recovery
unit where final separation of the product water takes place. Figure 1.2 presents a basic
schema of the MOD process using RO unit for the recovery step.
Figure 1.3. Schematic Flow Diagram of the MOD Process.
In comparison with the traditional RO-based desalination process that operates at 60-80 bar,
the MOD operates at greatly reduced pressures of 2-3 bar at the feed water (seawater) part
(see Figure 1.3). While RO as a recovery step consumes additional energy, the consumption
can be minimised with a careful selection of the osmotic agent and optimisation of operative
conditions. Additionally, these factors can lead to greater recovery efficiency due to control

Saleh Al Aswad Page 10
of the draw solution composition and absence of foulant impurities. Other advantages of the
MOD process are lower costs due to reduced capital expenses due to significant reduction of
contaminants; higher quality water product due to a double membrane barrier; and possibility
of using lower pressure pipe works and fittings (Thompson and Nicoll 2011).
Another important advantage of MOD is lower membrane fouling in comparison with the
traditional desalination methods. The membrane fouling involves the deposition and
adsorption of feed water constituents, such as organic and inorganic compounds, colloidal
particles, and microbes to the membrane surface. As water permeates the semipermeable
membrane, foulants in the feed water solution accumulate on the membrane surface forming
a thin layer which creates hydraulic resistance. This layer enhances concentration polarization
that reduces the net driving force for permeation. The fouling deteriorates membrane
performance and decreases membrane life span resulting in high operating cost for membrane
desalination. As FO is a low fouling process, the fouling layer formed in FO is structurally
different from fouling in pressure-driven processes (Hoek and Elimelech 2003; Lee et al.
2010).
Normally, the MOD process depends on the performance of FO membranes, composition,
concentration and type of draw solution, recirculation rate of the draw solution, performance
of the regeneration step and feed water temperature, composition and flow rate. An important
aspect to consider in any pressure-driven membrane desalination process is concentration
polarisation. It refers to the accumulation of excess solute particles inside and around the
membrane surface during an osmotic cycle (Sablani et al. 2001). The build-up particles
gradually reduce the effective osmotic pressure difference thereby limiting the water flux
through a membrane. Therefore, any desalination approach should take into account this
phenomenon.
Generally, two categories of polarisation are recognised. For dense, symmetrical membranes,
external concentration polarization (ECP) is common. External concentration polarization
takes place at the surfaces of the active membrane layer. On the feed side, as water permeates
through the membrane, solutes concentrate at the surface, while on the draw side, they
become diluted at the surface as water comes from the feed side. These types of ECP are
referred to as concentrative and dilutive respectively (McCutcheon and Elimelech 2006).
When the membranes are asymmetrical internal concentration polarisation takes place: when
the dense rejection layer faces the feed solution, the draw solution inside the support is
diluted by the water permeating through the porous support layer and when the layer faces

Saleh Al Aswad Page 11
the draw solution, water permeating through the membrane concentrate solutes inside the
support (Gray et al. 2006).
1.4. Research Contribution
Selection of the right combination of membrane and osmotic agent remains one of the key
challenges in FO (McCutcheon and Elimelech 2008; Zhao et al. 2012). Studies have analysed
various systems and combinations with different types of membranes and both organic and
non-organic osmotic agents for FO separately and as a part of the MOD process. However,
there is still no consensus with regards to what the best system or the best process conditions
are.
Numerous studies have focused on the FO process as a separate system. For example, Al-
Hemiri et al. (2009) investigated performance of the systems that included TFC-HR and
TFC-UFP membranes with magnesium sulphate hydrate, potassium chloride, calcium
chloride and ammonium bicarbonate as osmotic agents. The study found that the systems
using calcium chloride as the osmotic agent showed higher water flux rate, and the rates
increased with the draw solution concentration and increasing feed solution flow rate. The
study found that use of spiral wound RO membrane was possible for FO process. Zhao and
Zou (2011) investigated the performance of a FO system that included FS-TCA membrane
combined with Na2SO4 osmotic agent under different temperatures. In the experiment,
temperature rise from 25 to 45 oC resulted in increases in permeability and fluxes, although
higher fouling tendency of the membrane at the higher temperatures was also noted. Achilli
et al. (2010) conducted a comprehensive study on the choice of osmotic agents for FO
applications. They rendered seven inorganic substances as suitable osmotic agents; however,
in view of different physico-chemical characteristics of these substances the researchers
insisted on linking the choice of osmotic agents to the specific FO applications and
membranes considered. The various factors studied by Achilli et al. (2010) in their study
were different osmotic agents such as NaCl, KCl and MgSO4, a flat-sheet cellulose triacetate
(CTA) membrane and a water flux ranging from 10.9 L(m2.hr) for KCl to 5.51 L(m
2.hr)for
MgSO4 at 2.8 MPa and at a temperature of 25 oC for feed and draw solutions.
More recent research by Al-Zuhairi et al. (2015) investigated the efficiency of the FO process
within a MOD system A commercially available flat sheet TFC-ULP membrane was
combined with magnesium sulphate (MgSO4) as an osmotic agent. The experiments were
conducted for varying osmotic agent concentrations, flow rates and temperatures of feed and

Saleh Al Aswad Page 12
draw solutions. With the increase in draw solution concentration from 0.35 to 2.0 M water
under the constant temperature (25 oC) and flow rates (3 L/min), flux grew to 7 L(m
2.hr)for
the brackish water with 10,000 ppm NaCl and to 2 L(m2.hr)for the brackish water with
40,000 ppm NaCl. Water flux of nearly 1.9 L(m2.hr) was achieved by increasing OA
concentration, feed water and draw solution rates (3 L/min). Water flux of 2.5 L(m2.hr) was
achieved at the draw solution temperature of 35 oC and feed solution temperature of 25
oC.
The researchers concluded that while the examined system provided acceptable water flux
rates, membrane improvements and better osmotic agent could further increase the process
efficiency.
The major contribution of this research is in examining the new combinations of membranes
and osmotic agents for FO as a part of the MOD process. In addition to water flux, other
important parameters are taken into account when analysing efficacy of the system.
Specifically, the current research applied a MOD approach using two organic osmotic agents
(sucrose and glucose) against deionised water, simulated brackish water and seawater
(synthesized by NaCl salt) as feed waters. The efficiency of specific organic osmotic agents
as stated above in FO process was investigated using more efficient membrane types
[nanofiltration (NF), RO flat sheet and hollow fine fibre (HFF)]. The experiment also used
binary and ternary systems using hollow fine fibre membrane (HFFM) in order to determine
the FO performance efficiency in terms of different parameters, namely water flux, specific
energy consumption, water recovery, water permeability and solute flux. The experimental
conditions included concentration of osmotic agents, temperature and the flow rate of feed
water and osmotic agents.
1.5. Research Aims and Objectives
The purpose of this study is to investigate the performance efficiency of various membrane
types of membranes in FO process using specific organic osmotic agents such as sucrose and
glucose versus deionised and salty feed water.
The main goals this research include:
To study the appropriateness of using a number of selected an organic osmotic agents
such as sucrose and glucose in the Forward Osmosis process using different types of
membranes.
To determine the effects of osmotic agent concentration, flow rate and temperature on

Saleh Al Aswad Page 13
parameters on the performance efficiency of FO process in term of water flux,
recovery percentage, water permeability, specific energy consumption, and solute
flux.
To investigate suitable membrane types that could be used in Forward Osmosis
process.
The experimental procedure involved usage of a rig set (Figure 1.4) to determine and
measure the effect and optimal parameters conditions such as concentration, flow rate,
temperature and fluxes for feed and draw solutions by using different types of the
membranes.
Figure 1.4.MOD Laboratory Test Trial Plant Rig in Surrey University
To accomplish the goals of this study, two sets of experimental work have been carried out.
The first set involved using NF and RO membrane flat sheet types small scale forward
osmosis unit. The performance efficiency of the FO process using specific organic
compounds such as sucrose and glucose was examined as osmotic agent whereas deionised
and feed salty water (brackish water) using as feed water. The efficiency was measured in
term of water flux, water recovery, specific energy consumption, and solute flux. Parameters
affecting the forward osmosis process, such as osmotic agent concentration, flow rate and
temperature were also examined. In the second experiment set, hollow fine- fibre membrane
manufactured by Toyobo Company was used in a forward osmosis pilot plant unit.
Performance efficiency was again measured using the above mentioned factors. Different
concentration of sucrose and glucose were used as osmotic agents verses deionised and salty
feed water (brackish water) whereas other parameters were kept constant for using in the

Saleh Al Aswad Page 14
second run. Additionally, in this study the forward osmosis efficiency as well as using
mixtures of sucrose-sodium chloride and glucose- sodium chloride were tested versus
deionised and salty feed water.
1.6. Thesis Organisation
This thesis consists of several distinctive Chapters. Chapter two provides a comprehensive
review of the relevant literature on Manipulated osmosis Desalination process with a specific
focus on forward osmosis process. The relevant issues in FO for desalination such as
concentration polarisation, choice of osmotic agents and selection of membranes are
discussed as well. Chapter three provides a detailed description of the experimental work and
procedures specifically; methods and materials are described for both the flat-sheet and
hallow-fine fibre studies. Chapter four provides the results of the studying for different types
of membranes and osmotic agents, and presents a detailed analysis of the data. Chapter five
presents conclusion. Recommendations for future work are presented in Chapter six.

Saleh Al Aswad Page 15
2. CHAPTER TWO: LITERATURE REVIEW
This chapter presents a review of the relevant literature for this research. The first part of the
chapter explains the importance of desalination process as a means to produce fresh water
and the need for developing novel approaches to water desalination. The second part of the
chapter provides a thorough review of forward osmosis (FO) process, which is the key
process investigated in this thesis. Specifically, the section describes FO process, its main
principles and applications, advantages and challenges related to applications of FO for
commercial water production. The final part of the chapter focuses on manipulated osmosis
desalination (MOD) which combines FO with other desalination methods for a more efficient
process.
2.1. Water Desalination
2.1.1. Importance of Water Desalination
Fresh water is a vital yet very scarce resource existing in natural environment. Among Earth
water resources, only 0.5% is in form of potable, fresh water (Kim et al. 2010). The growth of
global population, development of industrial production and agriculture and the enhanced
living standards are putting increasing pressures on supplies of clean water across the globe.
An additional factor that is expected to increase water shortages in the future is climate
change, which leads to melting of the glaciers, pollution of river deltas by the rising sea levels
and disturbances in seasonal and annual rain cycle processes in many regions. Recent
projections by the United Nations and the Organisation for Economic Cooperation and
Development indicate that by 2025 the total number of people living in regions with absolute
water scarcity will reach 1.8 billion, and at least two thirds will be living in water-stressed
regions (UNDP 2006). Therefore, to alleviate the problems related to fresh water shortages, it
is imperative to look for novel ways to produce it.
Water desalination is one of the perspective ways to address fresh water shortages because
sea water accounts for 97% of all water resources on Earth (Kim et al. 2010). Therefore,
desalination technology may provide a seemingly endless supply of water without altering the
natural fresh water ecosystems. Desalination is also completely independent of climatic
conditions of a region, which makes it applicable even in the most arid regions that have

Saleh Al Aswad Page 16
access to sea. For some regions, where there is shortage of rainfall and no easy access to fresh
water supply, desalination may be the only viable option to sustain the population needs.
The term desalination is applied to processes that remove salts from water to make it suitable
for drinking and other uses (ElDessouky and Ettouney 2002). On average, seawater salinity is
approximately 35,000 mg/L of dissolved solids, while drinking standards require about 500
mg/L (Cooley et al. 2006). Water desalination is an essential part of the natural hydrologic
cycle whereby water is evaporated by sun from the surface of oceans and precipitates in form
of rainfall (Gleick 2000). As a technical concept, desalination refers to a range of
technologies used by human to remove salts from water.
2.1.2. Brief History of Water Desalination
Early references to desalination can be traced to Aristotle who mentioned that sea water
vapour is sweet and does not contain salts when condenses (Gleick 2000). However, at
industrial scale, seawater desalination came to use starting from the second half of the
nineteenth century. In 1869, a British patent was granted for a first industrial device to
convert seawater into drinkable water, and based on this patent the first desalination plant
was constructed in Arden the same year to supply ships travelling through the Red Sea with
fresh water (Norton et al. 2003). The beginning of the twentieth century marked more active
development of desalination plants. In 1903, Australia launched its first small scale plant in
Perth (Heath 2013). In 1912, Egypt installed six desalination plants with a total capacity of 75
m3/day (ElDessouky 2007). Later, in 1928, the island of Curaҫao committed itself to
completely covering own needs for fresh water by installation of desalination plants (Gleick
2000).
Early desalination plant designs were mostly based on evaporation technique and had small
capacities. The capacities increased with the emergence of the oil industry in the 1930s, and
the first large scale plant was introduced in Saudi Arabia in 1938 (Cooley et al. 2006). In the
following three decades, global desalination plant capacities were growing at average annual
rate of 17% (ElDessouky 2007). However, existing at the time plant designs suffered from
high fouling tendencies, limited operating hours and required lengthy cleaning process
(ElDessouky 2007). A breakthrough was achieved in 1957 when a novel multistage flash
distillation plant was launched in Kuwait and provided much higher efficiencies than the
previous plant designs (McArthur 2001). Other milestones were achieved at that time

Saleh Al Aswad Page 17
including on-line ball cleaning systems, co-generation plants and efficient anti-scaling
chemical treatment (ElDessouky 2007). All these achievements leading to much higher
efficiencies in fresh water production prompted an exponential increase in desalination plant
capacities since the 1960s (Figure 2.1).
Figure 2.1. Cumulative Installed Capacities of Desalination Plants: 1945-2005 (Gleick et al.
2006)
Alongside evaporation based desalination processes, researchers in the 1960s examined the
possibility of applying membrane-driven approaches. In 1959, a Sidney Loeb and Srinivasa
Sourirajan of UCLA managed to create a functional synthetic membrane from cellulose
acetate polymer that allowed successful passage of water under pressure while retaining salts
and TDS (Denn 2012). Because the process worked in reverse direction of the naturally
occurring membrane processes in nature, it became known as Reverse Osmosis (RO). This
discovery launched a new era in seawater desalination by introducing a new approach that
would later become dominant across the globe. One year after Loeb and Sourirajan’s work,
McCutchan and Loeb started a project that culminated in the construction and launch of the
first small scale pilot RO plant in Coalinga in 1965 (Stevens and Loeb 1967). While the plant
used brackish water as a feed, the possibility of applying membrane processes for
desalination practically demonstrated by Coalinga plant raised worldwide interest in this form
of desalination for seawater.
The first large scale RO plant was constructed in Jeddah, Saudi Arabia with a total production
capacity of 12,000 m3/day (Al-Gholaikah et al. 1978). Practical applications of RO for water
desalination were initially feasible only in the regions with low costs of fuel because earlier

Saleh Al Aswad Page 18
plant designs required enormous amounts of energy. The aforementioned Jeddah plant, for
example, used up to 8 kWhr of electricity to produce a single cubic meter of freshwater
(Prud’homme 2012). However, improvements in membrane technologies, application of
energy recovery devices, reduction of material costs and achievement of economies of scale
have led to substantial decline in RO desalination cost (Figure 2.2). Recent large scale
desalination plants are capable of reaching costs per cubic metre well below a dollar (Bernat
et al. 2010).
Figure 2.2. RO-Based Desalination: Cost Evolution (Reddy and Ghaffour 2007)
2.1.3. Current Status of Desalination Technologies
Recent estimates provide that the current global desalination capacities exceed 66 million
m3/day with the projections to reach 100 million m
3/day by 2015 (Ghaffour et al. 2013).
Accordingly, the total market for desalinated water is expected to surpass $31 billion by that
time (Pankratz 2008). Desalination technologies for obtaining freshwater have been actively
applied in the regions with substantial water scarcity, such as the Middle East and North
Africa (MENA). Some countries, like Kuwait and Qatar, fully rely on desalination plants for
their industrial and domestic water supplies (Ghaffour 2009). In some regions, desalination is
also becoming a viable competitive alternative to the traditional sources (dams, canals,
reservoirs) of potable water (Quteishat 2009). Finally, water desalination has been actively
explored by some countries where there is no lack in freshwater supplies, such as Spain,
Australia and the United States. The US currently ranks only below Saudi Arabia in their
share of global desalination production capacity (Greenlee et al. 2009).
Reduced capital costs of freshwater production, lower energy requirements and technology
modularity have made RO the most popular desalination approach today. It currently
accounts for roughly 60% of all desalination capacities worldwide (Figure 2.3). MSF and

Saleh Al Aswad Page 19
MED, however, are likely to remain in use, especially, in the regions with low energy costs,
such as MENA where MSF has been traditionally accepted and relied on. In the Middle East
countries, MSF, unlike the rest of the world, is the dominant water desalination approach
accounting for nearly 87% of all installed capacities (Figure 2.4).
Figure 2.3. Desalination Technologies’ Share in Global Installed Capacities (Global Water
Intelligence, 2012)
Figure 2.4. Desalination Technologies’ Share in the Middle East (Greenlee et al. 2009)
60%
26%
8% 6%
Reverse Osmosis Multistage Flash Multi-Effect Distillation Other Technologies
86.70%
10.70%
1.80% 0.80%
Multistage Flash
Reverse Osmosis
Electrodialysis
Other Technologies

Saleh Al Aswad Page 20
Currently, there are over 15,000 desalination plants around the world (Greenlee et al. 2009),
the fact that confirms the importance assigned to desalination technologies for freshwater
production. Maturity of desalination technologies is reflected in the large scale capacities of
the modern plants. The largest desalination plant Ras Al Khar in Saudi Arabia, which uses a
combined MSF-RO desalination process, has the capacity of over 1 million m3/day
(Almashabi 2014). Recently, Israel launched the largest RO plant Sorek, which has the
capacity of 624,000 m3/day (Bosecker 2013). However despite the growing popularity of
desalination process and increasing plant capacities, desalination still accounts for less than
1% of the total freshwater production (Cooley et al. 2006). This means that there is still a
large potential for expansion of desalination approaches.
The continuing search for novel ways to desalinate water is prompted by the need to further
reduce costs and improve effectiveness of water recovery (that is, efficiency of salt removal).
While overall cost and effectiveness of plant operations vary from site to site, researchers and
practitioners define a number of factors that are relevant for any process. Energy requirement
is the main parameter considered in desalination process (Ghaffour et al. 2013). It is
estimated that energy accounts for about 50% of desalination plant costs (Herndon 2013).
While large plant sizes allow reduction of energy cost per unit of output due to economies of
scale, construction of such plants is not always feasible due to environmental concerns.
Another possible way to reduce energy is to use an optimised plant design and novel methods
of water extraction.
Optimisation of water desalination process is often achieved by effective combination of two
desalination approaches. A common way to reduce cost of water production has been through
a plant configuration that combines MSF or MED with RO or nano-filtration (Ghaffour et al.
2013; Malivaet al. 2006). The world’s largest desalination plant Ras Al Khar, for example,
uses a combination of MSF and RO processes (Almashabi, 2014). Advantages of such
systems over single approach desalination process are in using common intake and outfall
systems, exchange of thermal heat between the processes and integrated pre- and post-
treatment all of which reduce energy costs and increase water recovery (Ghaffour et al.
2013). However, these parameters could be improved even further by applying novel
approaches to water desalination. One of the most perspective directions in this regard is the
use of Forward Osmosis (FO) a natural membrane process requiring 25-45% of the thermal
energy consumed by the most efficient thermal desalination process (Li et al. 2011). This is
because in the core of FO process is movement feed solution by means of osmotic pressure

Saleh Al Aswad Page 21
from low pressure side consisting of feed water to high pressure side consisting of the draw
solution. Therefore, FO, in perspective, allows to minimise energy costs and increase water
recovery (Martinetti et al. 2009; McGinnis and Elimelech 2007; Zhao and Zou 2011).
While the potential of FO for improving water desalination process has received increased
interest from the research community, practical application of this process for water
desalination has been limited. Research continues to identify the best types of membranes,
osmotic solutions and process configuration to bring FO to par with the commercially
attractive technologies on the market today. This paper presents an experiment for
optimisation of FO process using different membrane types and osmotic agents. The next
section provides a detailed description of FO process, which is followed by presentation of a
novel manipulated osmosis desalination technique that uses FO as the primary step.
2.2. Types of Desalination
Modern theory and practice of desalination recognizes more than a dozen approaches. In
practice, all approaches can be placed within two major categories: thermal and membrane
(Figure2.5). A number of alternative approaches are being tested, including
electrodeionisation, vacuum distillation, freeze separation, rapid spray evaporation, capacitive
deionisation and freezing with hydrates. At present, however, most of these approaches are in
either theoretical or experiment stages and do not have practical applications. Because this
review aims to discuss the alternative desalination approaches that are in use, it is limited to
thermal and membrane categories only.
2.2.1. Thermal Approaches
Thermal desalination is the oldest and the most widespread approach to water desalination
(Mezher et al. 2011). In simplest terms, the approach assumes boiling the feed water to purify
and collect the vapour. Thermal desalination is a rather energy demanding process, which has
been widely applied in the Middle East, where the cost of petrochemicals is rather low.
Common thermal desalination approaches are multistage flash (MSF), single effect
evaporation (SEE), multi-effect evaporation (MEE), freezing, humidification and solar stills.

Saleh Al Aswad Page 22
2.2.1.1. Multistage Flash (MSF)
Multistage flash represents a process made of several flashing spaces called stages, each stage
containing an exchanger to heat the feed water and a collector for condensate steam. The
entire sequence has a cool and a hot end, and the stage temperatures between them increase.
Each stage has a different pressure level, which matches the boiling points of water solution
at that stage’s temperature. Feed water travels through each stage, where it is heated by
warmer water vapour. By reaching the final stage-the brine heater-the water solution has
achieved a maximum temperature and flows back through the stages, where certain amount
of it evaporates through the boiling (flashing) process. The evaporating steam is hotter than
the feed water; therefore, it cools down and condenses on the heat exchangers and heats the
feed water (Younos and Tulou 2005).
The most popular MSF systems on the market today are brine circulation MSFs where the
flashing stages are divided among the heat recovery and heat rejection systems (El-
Dessoukey and Ettouney, 2002). In once through MSF, the feed only used once without
recirculation is it flows through the consecutive evaporating chambers at decreasing
temperatures. In brine mixing MSF processes, the brine gets mixed with the feed in order to
achieve lower feed water flow and increase thermal efficiency of the process. Finally, vapour
compression MSF systems include additional compressors, blowers or jet ejectors to increase
the vapour pressure and thereby make it an additional heating medium for feed solution (El-
Dessoukey and Ettouney, 2002).
2.2.1.2. Single Effect Evaporation (SEE)
By definition, SEE is a process that takes place in a single heating unit. There are several
types of SEE on the market. In thermal vapour compression (TVC), the steam jet ejector
compresses the vapour which enters the first effect tubes. The vapour gets condensed by a
condenser to the final product. An alternative way to compress the vapour is by mechanical
compressors instead of jet ejectors. It is considered that thermal vapour compression has a
higher performance ration in comparison to the multi-effect evaporation (El-Dessouky et al.
2000). Mechanical vapour compression (MVC) units have a similar principle of operation
with the only difference of using mechanical compressors in place of steam jet ejectors
(Younos and Tulou, 2005). Such units are portable and can be easily transported to different
areas. Adsorption vapour compression (ADVC) creates pressure differences between the two
reservoirs, where feed water is transferred. Pressure differences are caused by an exothermic

Saleh Al Aswad Page 23
reaction, where the feed water is preheated by being mixed with a special solution like LiBr.
This approach typically generates pot water (Younos and Tulou, 2005). In absorption vapour
process (ABVC), the feed water is treated with solutions like LiBr-H2O for water absorption
on the shell side of the absorber ((El-Dessouky and Eltounney 2002). Chemical vapour
compression (CVC) approach uses chemicals for the treatment of feed water and vapour (El-
Dessouky and Eltounney 2002).

Saleh Al Aswad Page 24
Desalination processes
ThermalMembrane
RO ED
MSF
MEE
SEE
Freezing
HDH
Solar
Stills
Parallel
Feed
Forward
Feed
Vertical
Stack
TVC
MVC
ADVC
ABVC
CVC
Vapour
Compression
Brine Mixing
Once Through
Brine
Circulation
TVC
MVC
ADVC
ABVC
CVC
Sea Water
RO: Reverse Osmosis
ED: Electro-Dialysis
MEE: Multiple Effect Evaporation
SEE: Single Effect Evaporation
MSF: Multistage Flash
TVC: Thermal Vapour Compression
MVC: Mechanical Vapour
Compression
ADVC: Adsorption Vapour
Compression
ABVC: Absorption Vapour
Compression
CVC: Chemical Vapour
Compression
HDH: Humidification -
dehumidification
NF: Nano -Filtration
MF: Micro-filtration
UF: Ultra filtration
FO: forward Osmosis
Low Salinity Surface
Brackish Well Water
NFMFUFFO
Figure 2.5. Thermal and Membrane Desalination Approaches and Methods (adapted from El-Dessoukey and Eltounney, 2000)

Saleh Al Aswad Page 25
2.3.1.3. Multi-Effect Desalination
Multi-effect desalination (MED) is a thermal distillation process which involves several
evaporation stages where feed water is preheated and placed on special surfaces. Figure 2.6
provides a visual presentation of a typical MED process. The initial saline feed is transferred
to the first chamber where steam from a boiler heats the evaporator tubes to drive evaporation
of the preheated feed water. The generated steam is condensed within the evaporator tubes of
the next stage and the cycle of vapour production repeats. The evaporating surfaces in each
stage are heated by the steam generated in the previous stage, and the pressure in each
following chamber is reduced. The steam generated during the final stage of MED process is
cooled by the incoming feed water. MED offers better thermal performance than MSF, and
this process can be modified for both high and low temperature operations, which makes it an
attractive option (El-Dessouky and Eltouney, 2002).
Figure 2.6. Multiple Effect Desalination Process (Al-Harbi et al. 2011)
2.2.1.4. Freezing, Humidification and Solar Stills
Freezing, humidification and solar stills are less used but still existent technologies for
thermal water desalination. Freezing process of desalination is based on freezing of pre-
cooled feed water with the subsequent separation of water in form of ice. Vacuum or
chemicals such as the glycol solutions are used to freeze the feed to a slurry form with its
subsequent pumping (Efrat, 2011). Humidification process of desalination is similar to the
basic natural water cycle only with a shorter period of time. Generally, it uses ambient

Saleh Al Aswad Page 26
pressure to evaporate and condensate the feed water thereby speeding up these cycles (El-
Dessoukey and Ettouney, 2002). Solar stills represent a basic configuration of such process.
These are boxes covered with glass or light plastic on the internal side of which water vapour
condenses (Anjeneyulu et al., 2012).
2.2.2. Membrane Approaches
Membrane technologies can be considered a successor to traditionally used thermal
desalination approaches: the vast majority of contemporary desalination plants, as well as
those being planned utilize membranes (Elimelech and Phillip 2011; Fritzmann et al. 2007).
Membranes represent a thin layer of porous material, which permeates water molecules
through, but holds large molecules, viruses, bacteria and different solutes. They may be made
of different polymeric and nonpolymeric materials, although the most commonly used
membranes for desalination are synthetic (Younos and Tulou 2005).
Based on the technological process used for desalination, all membrane based approaches can
be classified as either electrical or pressure driven. Electrical driven approaches include
electrodialysis and electrodialysis reversal, while pressure driven approaches include reverse
and Forward Osmosis, nano-, ultra-, and microfiltration. All these approaches are briefly
described below.
2.2.2.1. Electrical Driven Approaches
Electrodialysis is a desalination approach relies on membranes and electrodes adjacent to
them. The separation of water from the particles dissolved in it occurs within membrane pair,
which includes an anion membrane, a cation membrane, and two spacers, which evenly
distribute the feed water flow across the membrane surface (Brunner 1990).
Dissolved anions such as NO3- and Cl
- are attracted to the anode, while cations such as Na
+
or K+ are attracted to the cathode. Anion exchange or cation exchange membranes between
the anode and cathode control the movement of anions and cations. The ED stack is separated
into multiple cells by anion and cation exchange membranes labelled AEM and CEM
respectively. The alternating sequence of membrane placement allows to reduce ionic species
in the diluate compartments of the stack and increase them in the concentrate compartments
(Fritzmann et al., 2007). The electric circuit is closed in the first and last cells of the ED
stack. ED process is quite effective with removal of salts. As a rule, the process requires 70-

Saleh Al Aswad Page 27
90 psi pressure and is able to remove 75% to 98% of solids from feed water (Younos and
Tulou 2005). The chemical and petrochemical industries often apply ED for treatment of
dilute aqueous solutions (Fritzmann et al., 2007). At the same time, ED has relatively high
energy requirements for the processes involving highly concentrated feeds; therefore, today it
is rarely used for seawater desalination.
2.2.2.2. Pressure Driven Approaches
The pressure driven approaches of desalination include microfiltration (MF), ultrafiltration
(UF), nanofiltration (NF) and reverse osmosis (RO). These approaches are based on filtration
technique using thin film material with thickness ranging from 1 to 250 micron. Membrane
materials, pore size and operating pressure are the major differences between the approaches.
MF membranes are made of ceramic, polysulfonic (PS), polyvinylideneflouride (PVDF) or
cellulose acetate with tubular or hollow fibre membrane module configurations and pore sizes
of 0.02 - 4 micron. MF processes operate at the lowest pressure (2 bar), but they are only
good for removal of larger suspended particles, clay, bacteria and biomass. UF membranes
are made of the same materials as MF, although they have smaller pore size of 0.02 – 0.2
micron. This allows UF membranes additionally reject macromolecules, proteins, viruses and
polysaccharides. However, these membranes also require higher operating pressures, usually
1-10 bar. Membrane configurations include tubular hollow fibre, spiral wound and plate-and-
frame. NF membranes have even smaller pores of less than 2x10⁻³
microns. This allows
additional rejection of higher molecular weight compounds, mono- and disaccharides, as well
as polyvalent ions. MF, UF and NF are useful for particular types of feed waters and for
different water treatment purposes. MF, for example, is widely applied for fermentation and
biomass recovery, UF is used for fractionation of organic compounds, and NF is widely
applied for colour removal and demineralisation. Although sometimes applied as a standalone
technology for low TDS brackish water feeds, nanofiltration, nevertheless, cannot be
effectively used to treat seawaters (Younos 2005).
Reverse Osmosis approach is based on the phenomenon of osmosis, i.e. the passage of liquid
from the region of high concentration to the region with low concentration through a one-way
permeable membrane. Consequently, Reverse Osmosis is the opposite of that: water travels
from the regions with low concentration to the region of high concentration under artificially
applied pressure. RO allows to effectively remove TDS concentrations up to 45,000 mg/L,
which is sufficient to purify both salt and brackish waters. At the same time, RO requires

Saleh Al Aswad Page 28
energy to operate the pumps pressing feed water through the membranes, although the
amount of energy is generally less than under thermal desalination approaches. The required
pressure levels, however, rise with the constantly increasing feed water concentration (up to
150 bar for seawater), thereby giving only 30%-80% recovery rates (Younos and Tulou
2005). Membranes play a crucial role in Reverse Osmosis desalination process. In general, all
membranes can be classified into cellulose acetate (CA) and non-cellulose acetate (NCA).
CA membranes have smooth surfaces, which are resistant to fouling, because the particles
causing fouling do not deposit in the membrane crevices (Nicolaisen 2002). NCA membranes
are commonly referred to as “thin film composite membranes.” They use organic materials,
such as polysulfone. The advantages of NCA are higher flux rates and relative stability over a
long range of pH levels; however, they are quite sensitive to the effects of chlorine (El-
Dessouky and Ettouney 2002).
Protection of membranes in Reverse Osmosis and other membrane-based desalination
approaches is necessary to enhance retention of salts and reduce cost of energy. Therefore,
feed water pre-treatment is typically required to remove very large particles, bacteria, oil, and
organic matter that may damage membranes. Pre-treatment also involves addition of
chemicals to avoid membrane scaling and the formation of precipitates as well as adjustment
of pH levels depending on the membrane type. Microfiltration and ultrafiltration are typical
pre-treatment approaches used in RO. A summary of pressure driven desalination processes
is provided in Table 2.1.

Saleh Al Aswad Page 29
Table 2.1. Description of Pressure Driven Membrane Processes Source : Mortazvi (2008)
2.4. Forward Osmosis
2.4.1. Process Description
Forward Osmosis (FO) is an osmotic process that uses a semi-permeable membrane to
separate water from the solutes dissolved in it. Unlike reverse osmosis (RO), which uses
hydraulic pressure for such separation, FO operates by osmotic pressure whereby water flows
from the region of low concentration to the region with high concentration (Boo et al. 2013;
Membrane
Reverse
osmosis
(RO)
Nanofiltration
(NF) Ultrafiltration (UF)
Microfiltration
(MF)
Asymmetric Asymmetric Asymmetric Asymmetric
symmetric
Thin film
thickness
1 micron
150 micron
1 micron 150
micron
1 micron 150–250 micron 1–150 micron
Rejection High and
low
molecular
weight
compounds,
NaCl,
glucose,
amino acids
High molecular
weight
compounds,
mono-, di- and
oligosaccharides,
polyvalent ions
Macromolecules, proteins,
polysaccharides, viruses
Particles, clay,
bacteria
Membrane
materials
Cellulose
acetate
(CA) thin
film
CA thin film Ceramic, polysulfonic (PS),
poly vinylideneflouride
(PVDF), CA thin film
Ceramic, PS,
PVDF, CA
Pore size <0.002
micron
<0.002 micron 0.02–0.2 micron 0.02–4 microns
Module
configuration
Tubular,
spiral
wound,
plate-and-
frame
Tubular spiral
wound, plate-
and-frame
Tubular hollow fiber spiral
wound, plate-and-frame
Tubular, hollow
fiber
Operating
pressure
15–150 bar 5–35 bar 1-10 bar <2 bar

Saleh Al Aswad Page 30
Coday and Cath 2014; Valladares-Linares et al. 2014). Figure 2.7depicts a basic FO process:
pure water is extracted from source water, which is the area of low osmotic pressure, to draw
solution with an osmotic agent, which is the area of high osmotic pressure. The larger
osmotic pressure exercised by the draw solution is, the stronger is the separation process in
FO (Helix-Nielsen 2010; Zhao et al. 2012). By using primarily osmotic instead of hydraulic
pressure, FO requires much lower energy than RO. In theory, if a sustainable water treatment
solution is available FO can operate at zero hydraulic pressure (Valladares-Linares et al.
2014).
Figure 2.7. Forward Osmosis Process (Thompson and Nicoll 2011)
As it is seen from the above figure, in an osmotic process, two elements are present: a semi-
permeable membrane and a draw solution. The differences in water chemical potentials
between the feed solution and the draw solution initiates the flow of water through the
membrane, which, due to a small size of pores, allows only water molecules through, while
holding the molecules of solutes and organic materials.
The primary difference of FO from the widely used RO process is in the direction of flow
between the feed and the draw solutions. FO operates through the osmotic pressure
differential between the solutions: the feed solution gets concentrated, while the draw
solution gets diluted until the equilibrium is achieved. This is in contrast to the RO approach,
where hydraulic pressure needs to be applied to drive the process. To demonstrate how the
process works, consider Figure 2.8for illustration. The picture shows the direction and
magnitude of water flux Jw through an ideal semi-permeable membrane based on differences

Saleh Al Aswad Page 31
between osmotic pressure differential ∆π and hydraulic pressure differential ∆P. When
hydraulic pressure is exerted (that is, ∆P > ∆π), RO takes place and water flows from the area
of lower to higher concentration. When osmotic pressure differential is larger (that is, ∆P <
∆π), FO takes place, and water flows towards the area of higher concentration by means of
osmotic pressure. Pure FO, also referred to as Direct Osmosis (DO), takes place without any
hydraulic pressure (∆P = 0) as water flows through a membrane by means of osmotic
pressure only. When osmotic pressure differential is larger than hydraulic pressure
differential, Pressure Retarded Osmosis (PRO) is said to take place. The slope of the line in
the figure determines the membrane’s permeability coefficient Aw: a 100% salt rejection
when total volumetric flux Jv equals pure water flux Jw which, in turn, is zero at the
equilibrium point (∆π = ∆P).
A simple equation to determine water flux under FO was developed by Lee et al. (1981), who
generalised it for PRO process:
Jw= A(∆π − ∆P) Eqn.2.1
where:
Jw is the water flux;
A is the water permeability constant depending on the membrane used;
∆π is the osmotic pressure differential between the solutes;
Water Flux, Jw
Hydraulic Pressure
Differential, ∆P
DO point: ∆P = 0
Equilibrium (flux reversal)
point: ∆π = ∆P
RO area:
∆P > ∆π
FO area:
∆P < ∆π
Figure 2.8. Water Flux Magnitude and Direction as a Function of Manually Applied
(Hydraulic) and Osmotic Pressures (adapted from Lee et al.1981)

Saleh Al Aswad Page 32
∆P is the hydraulic pressure differential.
Pressure differentials in both cases are derived by differences between feed water (FW) and
draw solution (DS). Therefore, osmotic pressure differential is determined as:
∆π = πFW – πDS Eqn.2.2
where :
πFWis the osmotic pressure of feed water;
πDSis the osmotic pressure of draw solution.
Similarly, hydraulic pressure differential is determined as:
∆P = PFW – PDS Eqn.2.3
where :
PFW is the hydraulic pressure for feed water;
PDS is the hydraulic pressure for draw solution.
Consequently, a general FO equation can be expressed as:
Jw= A[(πFW – πDS) – (PFW – PDS)] Eqn.2.4
The equation above represents a simplistic model of a FO osmosis process. In a typical FO
process, water flux rate is a function of multiple factors including pressure and flow rate
differences between feed and osmotic solutions, the membrane area and type, as well as type
and concentration of the osmotic agent (Petrotos et al. 1998; Salter 2006; Zhao et al. 2012).
For FO, additional issue to consider are external and internal polarisations which have direct
influence of water flux. These issues are discussed later in the chapter.
2.4.2. Advantages of FO
The advantages of FO come from three main characteristics of the process, namely, low
hydraulic pressure, high osmotic pressure, and high rejection rates. Low hydraulic pressure
requirement ensures low energy consumption, which can be theoretically lowered to zero if
appropriate draw solutes and regeneration techniques are developed (McGinnis and
Elimelech 2007, 2008; Zhao et al. 2012). This remains the major attractive point of FO
applications considering finite energy resources and the increasing costs of their extraction.

Saleh Al Aswad Page 33
Moreover, FO allows for energy harvesting by mixing saline and fresh water, since the
natural DO process releases energy (Achilli and Childress 2010; Gerstandt et al. 2008).
Another advantage of FO is low degree of membrane fouling and higher reversibility (Achilli
et al. 2009; Mi and Elimelech 2010). Studies also demonstrated that membrane fouling in FO
can be minimised if the hydrodynamics is optimised (Lee et al. 2010). Low membrane
fouling means that membranes can serve longer and that water flux would decline at a lower
rate. FO can also effectively remove a wider range of contaminants in comparison to other
osmotic processes, which means better quality of water (Cartinella et al. 2006; Cath et al.
2010). High osmotic pressure gradient across the membrane also creates the potential for
higher water recovery rate (Zhao et al. 2012). On the one hand, this means better freshwater
return per unit of feed water; on the other hand, this leads to lower brine volumes discharged
to the environment (McCutcheon et al. 2005). Finally, FO allows to preserve the physical
properties of the feed water (such as nutrition, taste, and aroma) because it does not use
heating or pressurisation of the feed (Jiao, et al. 2004; Petrotos and Lazarides 2001; Yang et
al. 2009). This is an important feature for food and medical applications. Due to a wide range
and variety of the advantages provided by FO, this process found numerous applications,
which are discussed below.
2.4.3. FO Applications
2.4.3.1. Energy Applications
Using osmotic process for power generation was suggested first in the 1950s. Pattle (1954)
described process where fresh and salt water could be mixed in order to produce electricity.
The primary advantages of power generation by osmotic process are renewability and
sustainability, which make it more attractive than the finite and environmentally
compromising fossil fuels (Post et al. 2008). According to Veerman et al. (2009), up to 2.5
MJ of energy can be generated by mixing a cubic metre of seawater and a cubic metre of
river water. In total, it is estimated that the gross potential for osmotic power generation is
equivalent to 2.4-2.6 TW (Zhao et al. 2012).
Pressure retarded osmosis (PRO) has been explored as one of the most perspective directions
in conversing of salinity-gradient energy based on the Gibbs free energy of mixing (Achilli et
al. 2009; Post et al. 2007; Sandler 1999; Thorsen and Holt 2009). As was explained earlier, in
PRO, water is transferred from the feed solution to the draw solution side thereby increasing

Saleh Al Aswad Page 34
the draw solution volume. This, in turn, produces hydraulic pressure that could be used for
pushing an electricity generation turbine. In PRO, the relevant measure is the energy
conversion efficiency of a membrane (W), which is defined as the amount of power
generated per unit membrane of area (Zhao et al. 2012). Energy conversion efficiency is
measured by a product of water flux (Jw) and hydraulic pressure differential ∆P:
W = Jw∆P Eqn.2.5
Using basic water flux equation for FO (Eqn .2.1), this formula becomes:
( ) (
)
By plotting the differentiation of W against ∆P, the highest point is where
.
Therefore, the maximum power density becomes dependent on the water permeability
coefficient (A) and osmotic pressure differential (∆π):
The total power generated by a hydraulic turbine in PRO process can be calculated as (Zhao
et al. 2012):
P = ηρQgP Eqn.2.8
where :
η is the turbine efficiency;
ρ is water density;
Q is the flow;
g is the acceleration;
P is the solution pressure.
The first applications of PRO for energy generation were explored in the 1970s by a number
of studies by Loeb and colleagues (Loeb and Norman 1975; Loeb et al. 1976; Mehta and
Loeb 1979). More interest arose on the wave of search for alternative energy sources in view
of global price hikes of oil products (Achilli and Childress 2010). The first large scale PRO
energy generation plant was launched by Statkraft at Tofte, Norway in 2008 (Statkraft 2014).

Saleh Al Aswad Page 35
In Japan, the Mega-ton Water System project was launched in the beginning of the current
decade. By using seawater reverse osmosis brine instead of seawater, the plant was able to
increase extractable energy from 0.75 kW/m3 to 2.75 kW/m
3 of draw solution (Kurihara and
Hanakawa 2013). In Canada, H2O Innovation company is currently working on launching a
PRO energy generation plant in Quebec (Valladares-Linares et al. 2014). With regards to
power generation, contemporary turbines reach up to 92% efficiency (Yip and Elimelech
2012).
2.4.3.2. Wastewater Treatment
In general, wastewaters have lower osmotic pressure than seawater; however, they cause
much higher fouling (Zhao et al. 2012). Lower fouling propensity under FO is, therefore, one
of the major advantages to use FO for wastewater reclamation and reuse. One of the rapidly
developing areas for FO application in wastewater treatment has been harvesting water from
municipal wastewaters. It should be noted that FO has been mostly used as a pre-treatment
step, not the ultimate treatment solution. However, it plays an important role in reducing
membrane fouling and, therefore, total treatment costs. Xie et al. (2013) described a practical
application of a hybrid forward osmosis-membrane distillation process for sewer mining. The
study demonstrated that FO allowed to reject most of the organic contaminants while
membrane distillation allowed to reject residue contaminants. Zhang et al. (2013) also
described a highly efficient photovoltaic powered hybrid FO-electrodialysis process for
secondary wastewater effluent, which is favourable for using in remote areas. FO was also
tested for dewatering anaerobic digester centrates and activated sludge (Hau et al. 2014;
Holloway et al. 2007).
In the past few years, an increasing number of researchers investigated the concept and
application of Osmotic Membrane Bioreactor (OMBR) (Achilli et al. 2009; Alturki et al.
2012; Cornelissen et al. 2008; Lay et al. 2011; Yap et al. 2012; Zhang et al. 2012). An
example of such system is presented in Figure 2.9. In OMBR, osmotic dilution takes place as
a pre-treatment, after which the diluted draw solution is re-concentrated by an additional step
such as RO to produce fresh water (Zhao et al. 2012). The major advantages of OMBR over
the traditional systems for municipal wastewater treatment are minimisation of fouling
process, a more sustainable flux and more reliable removal of contaminants (Valladares-
Linares et al. 2014). This makes commercial application of OMBR realistic in the near future.
The two major factors in optimising OMBR operations are membrane salt permeability to the

Saleh Al Aswad Page 36
water permeability ratio and hydraulic retention time to sludge retention time ratio (Xiao et
al. 2011).
Figure 2.9. An Example of an OMBR (Achilli et al. 2009)
FO also has a number of potential applications in industrial wastewater treatment. Several
studies (Li et al. 2014; Rassoul et al. 2012) investigated FO potential for removal of heavy
metals from industrial wastewaters and showed that FO membranes provided an almost
complete rejection of lead, zinc, copper and cadmium. In the United States, Catalyx Inc. has
successfully piloted a FO plant to recycle wastewaters from textile and carpet mills (Catalyx
2009). The majority of FO applications in wastewater treatment, however, have been
developed for oil and gas industry. An FO-RO combination process in a closed loop was
successfully applied to reclaim drilling wastewater from gas exploration operations (HTI
2011). Abousnina (2012) described an effective FO process for dissolved organic
components removal from oily wastewaters. Nelson and Ghosh (2011) showed that a
properly designed FO process can substantially improve treatment of produced water from oil
natural gas operations. Hickenbottom et al. (2013) experimentally demonstrated that a FO-
based process can increase rejection of both organic and inorganic contaminants, reduce
membrane fouling and successfully recover up to 80% of water from oil and gas drilling
waste. McGinnis et al. (2013) pilot tested application of an NH3/CO2 FO membrane brine
concentrator for treatment of produced waters from natural gas extraction and showed that up
to 42% energy savings could be achieved in comparison with the conventional evaporator
techniques while preserving the same quality of reclaimed water. Duong and Chung (2014)
conducted a bench scale testing of a customised FO-based membrane for fresh water
recovery from a heavily concentrated synthetic oily solution to achieve a 99.88% rejection
rate.

Saleh Al Aswad Page 37
Finally, FO was tested for treatment of landfill leachates: highly variable liquids that usually
consist of several types of pollutants, including heavy metals, organic compounds, nitrogen
and total dissolved solids. The traditional wastewater treatment approaches usually do not
deal with the total dissolved solids; in fact, in some cases, after treatment, their concentration
in the solution even increases (Water Development Report 2009). An evaluation of FO’s
potential use was investigated in the UN Water Development Report, and it was found that
FO could be an effective solution for landfill leachate treatment because of its ability to reject
total dissolved solids. In the end of 1990s, an American company Osmotek conducted a three
month pilot testing of a FO-based membrane for landfill leachate in Corvallis, Oregon
(Gleick 1996). The tested FO membrane with the NaCl draw solution were able to achieve
94-96% water recoveries, high contaminant rejection and nearly full flux restoration after
cleaning. This prompted the launch of a full-scale system, which is presented in Figure 2.10.
The full scale system managed to achieve a nearly 92% water recovery with 99% rejection
rate for most of the contaminants (Water Development Report 2009).
Figure 2.10. A Full Scale Working FO-Based Leachate Treatment System (Water
Development Report 2009)

Saleh Al Aswad Page 38
2.4.3.3. Pharmaceutical Applications
Two major applications of FO in the pharmaceutical industry have been drug delivery and
product enrichment (Lin and Ho 2003; Santus and Baker 1995; Thombre et al. 1999). Drug
delivery systems using FO use its natural osmotic process for medicine administration,
primarily orally. There are many types of such systems including capsules and tablets that are
coated with semipermeable membranes, polymer drug matrix systems and osmotic pumps –
self-formulating in-line systems such as basic osmotic pump, Rose-Nelson pump and
Higuchi-Leeper pump (Lin and Ho 2003; Nayak and Rastogi 2010; Santus and Baker 1995;
Thombre et al. 1999; Wang et al. 2011). Two studies conducted by Talaat (2009, 2010)
showed great potential of FO for use in ambulatory dialysis systems.
Product enrichment with FO covers such pharmaceutical products as lysozymes and proteins
(Zhao et al. 2012). These products have large molecular structures and they are sensitive to
heat. FO does not require external pressure that creates heat and they can reject large
molecule sizes. Moreover, the final products in the pharmaceutical applications of FO are
concentrates, which eliminates the need for an additional step of separating water from the
diluted draw solution (Zhao et al. 2012). These factors make FO an attractive process in
pharmaceutical applications. Yang et al. (2009) managed to create high quality enriched
lysozyme solutions without the change or denaturation with FO process. Wang et al. (2011)
demonstrated that similar process was possible for protein concentration. Nayak and Rastogi
(2010) demonstrated that FO had higher stability and lower browning index in the process of
anthocyanin concentrating.
2.4.3.4. Food Processing
In general, water removal in the food industry is used to improve the food’s shelf life,
increase its stability and reduce its transportation costs (Petrotos and Lazarides 2001).
Because FO operates at low hydraulic pressure and lower temperatures, it has an advantage
of retaining the sensory and nutritional values of the processed foods (Coday et al. 2014).
Popper et al. (1966) were the first group of researchers to investigate FO applications for food
processing, specifically, in the production of concentrated beverages. Two studies by Petrotos
and colleagues explored FO application for tomato juice concentration (Petrotos et al. 1998;
Petrotos et al. 1999). The studies noted the potential for FO application after pretreatment of
juice by ultrafiltration. Recently, more studies were conducted for different types of fruit
juice: (Babu, et al. 2006; Garcia-Costello and McCutcheon 2011; Garcia-Costello, et al.

Saleh Al Aswad Page 39
2009; Jiao et al. 2004; Nayak et al. 2011). Researchers also investigated FO applications for
processing of fruits and vegetables including carrots, potatoes, peppers, papayas, pears,
pineapples, strawberries and mushrooms (Changrue et al. 2008; Eren and Kaymak-Ertekin
2007; Garcia et al. 2010; El-Aouar et al. 2006; Khoyi and Hesari 2007; Lombard et al. 2008;
Ozdemir et al. 2008; Park et al. 2002; Petrotos et al. 2010; Torringa et al. 2001; Uddin et al.
2004). As with juice concentration applications, these studies showed solid potential for FO
use in food processing, specifically, for dehydration of the products.
2.4.3.5. Other Applications of FO
Besides energy generation, wastewater treatment, pharmaceutical applications and food
processing, FO has been explored in other fields. Phuntsho et al. (2011) described FO
application for direct fertigation by the diluted draw solution. FO-based products have been
proposed and even commercially implemented for emergencies that bring water scarcity. For
example, FO hydration bags have been used by the military and by emergency relief
personnel (Cath et al. 2006; HTI 2011). Cath et al. (2005) proposed a FO-RO compact system
for wastewater treatment in a closed loop, which has been tested by NASA with a potential
for application in long term space travel.
FO has also been actively proposed and tested for green technologies. Several studies
identified FO’s important role in generating biomass energy and biofuels in processes such as
separation of algae biomass (Hoover et al. 2011; Zou et al. 2011). Zhang et al. (2011) also
introduced a novel process by for wastewater treatment and bioelectricity production.
Similarly, FO is being actively investigated for environmental applications. Hoover et al.
(2011) proposed that dilution of the desalination brine by FO prior to discharge into the
oceans would greatly reduce damage to the marine ecosystems. FO can also be applied as a
membrane cleaning process as an alternative to the traditional chemical treatment (Qin et al.
2010; Ramon et al. 2010).
2.4.4. FO Applications for Water Desalination
The initial interest in FO for desalination arose along with the development of RO in the
1970s (Kessler and Moody 1976; Kravath and Davis 1975; Moody and Kessler 1976). Two
major studies can be noted at that time. Kravath and Davis (1975) were the first to suggest the
use of semi-permeable membranes together with concentrated solutions. Kessler and Moody

Saleh Al Aswad Page 40
(1976) investigated practical feasibility of batch FO desalination process by comparing
experimental results with the theoretical models. Similar to Kravath and Davis, they
suggested that FO could be an appropriate process for water supply in emergency lifeboats.
For quite a while, however, FO for desalination research has not been realised in practice, and
many related patents remained on the paper only (i.e. Frank 1972; McGinnis 2002; Stache
1989).
With the progress of technologies and appearance of commercially available membranes for
the process, FO for water desalination has gained closer attention from both researchers and
practitioners. As was discussed earlier, the existing water desalination approaches have
serious environmental problems and relatively high cost of water production. FO, in theory,
can help overcome these difficulties due to its low sensitivity to salt concentrations, higher
water recovery rates, and use of the natural osmotic process that requires low to none manual
pressure to proceed. Since the first half of the current decade, the researchers started
exploring FO process more intensively. FO has been explored both as a standalone
desalination process and in combination with other methods (Bamaga et al. 2011; Cath et al.
2006; Valladares-Linares et al. 2014; Zhao et al. 2012).
Modern approaches to FO water desalination can be placed into two broad categories: direct
and indirect desalination approaches (Valladares-Linares et al. 2014). The difference between
these groups is in what is taken as a feed solution (FS) and a draw solution (DS). The
processes and the differences between them are described below.
2.4.4.1. Direct FO Desalination
In direct FO desalination freshwater is directly extracted from seawater using an osmotic
membrane process. A typical layout of this approach is presented in Figure 2.11. As is seen,
seawater is the FS which is separated from a DS by a semipermeable FO membrane. By
means of osmotic pressure differences, water is drawn towards the DS, while salts and other
solvents are rejected by the membrane. The diluted DS is then treated to extract pure water
and returned back to the desalination cycle, while the FS brine is discharged.

Saleh Al Aswad Page 41
In direct FO the FS (seawater) is common in all processes, there is much variety in DS used.
One method uses thermolytic DS that can be later decomposed by heating into volatile gases
such as CO2 or SO2 (Zhao et al. 2012). After freshwater is recovered, these gases are recycled
by thermal decomposition. An example of such approach for water desalination is a patent by
McGinnis (2002) where KNO3 and SO2 combination is used as a DS. Saturated KNO3 has a
tendency to precipitate out of the cooled diluted DS. The precipitated diluted KNO3 is then
transferred to an additional FO unit where SO2 acts as a DS. Following the osmotic process,
the dissolved SO2 is removed by heating (McGinnis et al. 2002).
More commonly described and tested is the method that uses a mixture of NH3 and CO2 as a
DS. The approach was proposed and investigated in a series of papers by McCutcheon and
colleagues (McCutcheon et al. 2005; McCutcheon et al. 2006). It was shown that the
appropriate mixture of ammonium and carbon dioxide can ensure high water flux (up to 36
Lm-2
h-1
) and feed water recoveries. McGinnis and Elimelech (2007) also demonstrated that
this process required substantially lower amount of equivalent work in comparison to the
traditional desalination approaches such as RO. They concluded that energy savings could be
between 72% to 85% (McGinnis and Elimelech 2007). In a recent study, Chanukya et al.
Figure 2.11. Direct Osmosis Process (adapted from Li et al. 2013)

Saleh Al Aswad Page 42
(2013) analysed the effect of concentration polarisation for this approach and concluded that
FO could a feasible solution for water desalination.
Besides the thermolytic DS used in FO desalination process, studies explored water-soluble
salts and solutions to enhance water flux and recovery with different desalination
technologies. Li et al. (2011) proposed to use special hydrogels with carbon filler particles in
DS and managed to achieve 1.2L/(m2.hr)flux. However, Cai et al. (2013) showed a much
lower maximum flux (about 0.2 L/(m2.hr)using hydrogels in a similar process. Better results
were demonstrated by Ling and Chung (2011) who used hydrophilic nanoparticles and
ultrafiltration technique to regenerate DS: they managed to achieve 6 L/(m2.hr)flux and
92.7% recovery using synthetic water as a FS (Ling and Chung, 2011). Zhao et al. (2012)
showed even better flux of up to 10 L/(m2.hr)and up to 98% of rejection rate by using
divalent salts like Na2SO4 and nano-filtration for the DS recovery process.
Although FO applications for desalination are still in their infancy, the available bench-scale
literature reveals that by using appropriate draw solutions and suitable FO membranes,
effective desalination of seawater is practically possible (McCutcheon et al. 2005; Miller and
Evans 2006; Valladares-Linares et al. 2014; Zhao et al. 2012). A typical example in this case
is the FO pilot plant constructed and tested by a team from Yale (Cath et al. 2006). The draw
solution was formed by mixing ammonium carbonate and ammonium hydroxide, and the
formed salt species included ammonium carbonate, bicarbonate, and carbonate. The analysis
of the pilot plant work showed that by using the ammonia/carbon dioxide draw solution it
was possible to achieve osmotic pressure of 238 bar for a 0.05M NaCl feed water
concentration and 127 bar for a 2M NaCl concentration as well. Considering that the latter
concentration is equivalent to brine from the seawater desalination at 70% recovery (Cath et
al. 2006), the obtained pressure is very promising.
Modern Water is the only company so far that has implemented FO on a commercial basis.
The first direct FO plant was constructed in Gibraltar in 2008. In 2012, the company
completed and launched a larger direct FO plant in Al Khaluf, Oman. Operations of both
plants demonstrated higher than predicted water quality and lower than predicted membrane
fouling despite the bad quality of the sweater FS (Zhang et al. 2012). In a special report
devoted to practical FO applications, Modern Water (2013) mentioned that besides lower
fouling propensity and higher quality of produced water, FO process has led to energy
savings up to 30% due to pressure savings and lower chemicals use. Both plants in Gibraltar
and Oman operate as hybrid FO-RO plants where FO is used as a pre-treatment step for

Saleh Al Aswad Page 43
seawater desalination. This hybrid process is referred to as Manipulated Osmosis
Desalination, and it is described in more details later in the chapter.
Despite the fact that the studies and pilot tests demonstrated certain positive moments for FO
applications in seawater desalination, they also reveal a number of barriers that currently exist
to wide scale practical applications of FO for desalination. Three limitations most commonly
mentioned in the literature relate to concentration polarisation as well as developing better
membranes and draw solutions. A typical example is a recently filed patent by Trevi Systems
Inc. for a FO-based desalination process that is expected to bring up to 87.5% savings in
electricity use in comparison to RO systems (Valladares-Linares et al. 2014). The process
uses a retrograde soluble solute as an osmotic agent and applies a two-stage DS recovery
process: first, a coalesce is used to produce a single phase water rich stream, which is then
purified by nano-filtration to produce fresh water (Carmignani et al. 2012). However, the
required draw solute is still not commercially available, which means that operational costs
are likely to increase substantially. The key issues related to direct FO commercialisation for
seawater desalination are reviewed later in the chapter.
2.4.4.2. Indirect FO Water Desalination
Indirect FO desalination uses wastewater as a FS and seawater as a DS. The process is
attractive because of the virtually unlimited supply of DS, which is one of the main issues in
direct FO as discussed above. Fig. 2.12 presents a schematic diagram for indirect FO
desalination process. Wastewater effluent as a FS is separated from seawater by a FO
semipermeable membrane. Because of different levels of FS and DS salinities, the osmotic
pressure differential causes water flow towards DS while wastewater contaminants are
rejected by the membrane. The diluted seawater is then transferred for an additional
desalination step that produces freshwater, while the rejected wastewater brine is directed to
post-treatment. The regeneration step of the diluted seawater can be performed by low
pressure reverse osmosis (LPRO) thereby leading to low energy requirements (Cath et al.
2010; Yangali-Quintanilla et al. 2011). Valladares-Linares et al. (2014) estimated that in
comparison to pure seawater, the osmotically diluted seawater contains nearly three times
less total dissolved solids, which leads to significant reduction of energy consumption by the
RO process.

Saleh Al Aswad Page 44
Indirect FO desalination experiments have demonstrated good rejection of wastewater
contaminants, in particular phosphate and chemical oxygen demand (Cath et al. 2009;
Valladares-Linares et al. 2013). Valladares-Linares et al. (2013) also showed that a
submerged FO membrane module can reject up to 98% of heavy metals in wastewater,
although nitrogen compound rejection was moderate, and biopolymers and protein like
substances caused substantial fouling. These issues could be addressed by inclusion of a pre-
treatment process in indirect FO desalination. However, this step has yet to be investigated
(Valladares-Linares et al. 2014).
This paper focuses on the direct desalination approach, which is so far a more developed area
for seawater desalination. However, in general, indirect FO desalination can be a promising
process because of integration of wastewater treatment and desalination. It can be especially
attractive for the cities located along the coastlines, where there is steady unlimited supply of
seawater which can provide a more cost-effective way of wastewater treatment.
Waster brine
post-treatment
SEAWATER (DS)
Desalination of
diluted
seawater
Wastewater (FS)
FRESHWATER
Reu
sed D
S
Semi-permeable FO
membrane
Figure 2.12. Indirect FO Process for Water Desalination (adapted from Li et al. 2013)

Saleh Al Aswad Page 45
2.4.6. Membranes for Forward Osmosis Desalination
Similarly to an RO process, membranes play one of the key roles in the success of FO
applications. There are two major demands for the FO desalination membranes: the ability to
allow water flow with minimum cross contamination from salts; and the highest possible flux
rates across the membrane (Miller and Evans 2006). The first requirement is based on the
need to minimise the environmental impact. The second requirement is based on the need to
reduce the costs of operation. In addition, membranes are expected to be stable at different
temperatures and various osmotic agents applied. Earlier versions of tested FO membranes
were produced from such materials as rubber, porcelain, nitrocellulose and animal bladders
(Baker 2004). In the 1960s, when Loeb and Sourirajan introduced their membrane, studies of
FO mostly used RO membranes for experiments (Cath et al. 2006). In the late 1990s,
however, specialised membranes were introduced for FO applications. Based on the methods
of fabrication, all FO membranes can be grouped into three large categories: phase-inversion
cellulosic membranes, thin film composite membranes, and chemically modified membranes.
2.4.6.1. Phase Inversion Cellulosic Membranes (PICM)
Phase Inversion Cellulosic Membranes (PICM) are prepared via conventional phase inversion
by using cellulose acetate as the dip-coating polymer (Zhao et al. 2012). Initially developed
for pharmaceutical applications, these types of membranes have recently been tested for
treating aqueous solutions in the FO process as well (Wang et al. 2005). Wang et al. (2007)
were the first researchers who developed and applied PICM specifically for FO applications.
Their membranes represented a type of polybenzimidazole (PBI) NF hollow fibre membrane
created by dry-jet wet phase inversion. The advantages of the membrane are self-charged
properties, great chemical stability, and solid mechanical strength (Wang et al. 2007).
However, the membranes performed poorly with NaCl, Na2SO4 and MgSO4 solutes. MgCl2
proved to work well as a draw solution; however, its relatively high price tag may not be a
suitable alternative (Achilli et al. 2009). A modified version of PICM, which significantly
improved salt rejection rates by using p-xylylene dichloride, was presented a couple years
later (Wang et al. 2009). The membrane was further optimised by applying polyethersulfone
(PES) and polyvinylpyrrolidone (PVP) to the casting solution to improve FO performance
(Yang et al. 2009).
Cellulose acetate, in general, has a number of beneficial characteristics, including high
hydrophilicity that enables stronger flux, low fouling propensity, and relatively good

Saleh Al Aswad Page 46
resistance to various oxidants including chlorine (Geise et al. 2010; Zhang et al. 2010). These
benefits were observed as early as in 1959 (Reid and Bretton 1959; Reid and Kuppers 1959).
Because of this, cellulose acetate has been widely used in production of both FO and RO
membranes. In fact, the Loeb-Sourirajan membranes were produced by phase inversion and
used cellulose acetate polymer (Loeb and Sourirajan 1963). Such membranes have been
widely applied for energy generation through PRO (Gerstandt et al. 2008). Cellulose ester-
based hollow fibre and flat sheet membrane modules have been recently introduced by
Chung’s group (Su et al. 2010; Wang et al. 2010; Zhang et al. 2010). Preliminary tests
showed that the membranes with two layers are able to reduce the ICP effect in the
membrane support layer (Wang et al. 2010; Zhang et al. 2010). Sairam et al. (2011) also
developed and tested phase inversion FO flat sheet membranes with cellulose acetate and
lactic acid (C3H6O3), maleic acid (C4H4O4) and zinc chloride (ZnCl2) as pore-forming agents.
The zinc chloride membrane showed the best FO performance. However, cellulose acetate
membranes have a number of significant drawbacks as well. They have showed low
resistance to hydrolysis and biological attach, and perform well only within relatively short
range of temperature and pH (Baker 2004; Geise et al. 2010; Mulder 1996).
2.4.6.2. Thin Film Composite Membranes (TFCM)
TFCM have been introduced by HTI Corporation on the commercial basis several years ago
(Zhao et al. 2012). Corresponding to their definition, TFCM are the membranes that consist
of several layers. HTI’s patent for a composite FO membrane describes it as having a
minimum of three layers: a skin layer of polymeric material (8-18 µm), a porous scaffold
layer (25-75 µm), and a layer of hydrophilic support fabric (Herron, 2008). Figure2.16 shows
cross-sectional electronic microscope images of two such membranes. Both membranes are
asymmetric and made of cellulose triacetate, although they have different thickness. Most of
FO studies have been using the thinner (~50μm) type because it provides the better flux,
although it should be noted that it also rejects fewer salts. Unlike most of the commercially
available RO membranes, this membrane type is mechanically supported by an embedded
polyester mesh (HTI, 2011).

Saleh Al Aswad Page 47
Figure 2.13. Cross-Sectional Electronic Microscope Image of HTI’s Membranes (Zhao and
Zou 2011)
Specifically for FO, both hollow fibre and flat sheet membranes have been developed (Song
et al. 2011; Wang et al. 2009; Wei et al. 2011; Yang et al. 2009). In many cases, the
procedure for FO TFCM production is the same as for a RO: phase inversion is used for the
preparation of a porous substrate with subsequent polymerisation to form a thin polyamide

Saleh Al Aswad Page 48
active layer (Petersen 1993). Flat sheet TFCMs for FO were initially produced in Elimelech’s
lab by m-phenylenediamine (MPD) and trimesoyl chloride (TMC) polymerisation on porous
polysulfone (Yip et al. 2010).The manufacturers determined that an important point for
membrane performance optimisation was formation of the substrate by phase inversion where
highly porous macrovoids are covered by a thin spongelike layer (Tiraferri et al. 2011).
Wang et al. (2010) used a similar method to develop a hollow fibre FO membrane. They also
found that the optimal membrane structure should have a small sponelike layer in a thin,
highly porous substrate. Further, Wang et al. observed that for a hollow fibre FO membrane
the substrate structure was an essential factor for the performance. Experimental tests showed
that the membranes with straight fingerlike pores (Figure2.17) performed better due to
minimisation of ICP (Wang et al. 2010). Such membranes have been applied in PRO power
generation process and showed power densities up to 10.6 W/m2 (Chou et al. 2012). Widjojo
et al. (2011) used sulfonated polymer material and similar to Wang et al’s. approach for
hollow fibre membrane production. They found that such material allowed to form a sponge-
like structure for a better permeate flux.
Figure 2.14. Cross-Sectional Electronic Microscope Image of a TFCM with Fingerlike Pores
(Yip et al. 2010)
For FO TFCM it is typical to observe a trade-off between salt rejection and water
permeability. Wei et al. (2011), for example, reported that membrane permeability could be
enhanced by either increasing the TMC concentration or decreasing the MPD concentration;
however, this also led to a lover degree of salt rejection. A series of recently conducted
studies explored variations of TFCM in an attempt to achieve the balance between water
permeability and salt rejection levels (Bui et al. 2011; Song et al. 2011; Wei et al. 2011). The

Saleh Al Aswad Page 49
results of these studies generally predict that in TFCM for FO the support layer largely
determines the ICP, while membrane active layer determines the rates of reverse solute flux
and the salt rejection rate. Due to relatively positive results of the studies covering TFCM it is
highly likely that these types of membranes will be further researched for FO applications. It
is also likely that the experiments will be focusing on improving salt rejection rates and
decreasing reverse solute diffusion.
2.4.6.3. Chemically Modified Membranes (CMM)
CMM represent one of the most recent innovations in the FO field. Basically, these
membranes are created by chemical enhancement of different types of membranes. For
example, Arena et al. (2011) applied a hydrophilic polymer polydopamine to improve the
performance of some commercially available RO TFC demonstrating in the process reduction
of ICP and improvement of water flux in FO tests. Setiawan et al. (2011) modified a hollow
fibre FO membrane to add a selective layer by polyelectrolyte post-treatment of
apolyamideimide microporous substrate using polyethyleneimine and suggested that because
of the positively charged property the new FO membrane was better suited for heavy-metal
laden waters. Qiu et al. (2011) created another type of a positively charged flat sheet FO
membrane that had a nano-filtration like selective layer on a woven fabric embedded
substrate. FO membranes on a layer-by-layer basis have also been introduced recently (Saren
et al. 2011). Specifically, such membranes were developed by combining phase-inversion
process to create polyacrylonitrile substrate with post-treatment process where sodium
hydroxide was used to enhance hydrophilicity and the negative charge density of the
membrane’s surface.
CMM still represent a novel, albeit very promising way to enhance the performance of the
existing FO membranes. In addition to the aforementioned membrane production methods,
Zhao et al. (2012) suggested that future FO studies could explore additional technologies
such as polyelectrolyte dip-coating, UV-photographing and layer-by-layer assembly. So far,
however, most of FO membranes are produced by using conventional techniques that have
been practically applied for pressure-driven RO and nano-filtration processes.
2.4.6.4. Selection and Evaluation of FO Membranes
The majority of the contemporary FO membrane producing methods, as is seen from above,
still rely on conventional techniques used for pressure-driven RO membranes. The process of

Saleh Al Aswad Page 50
developing new, high performance membranes with the production techniques strictly
oriented toward FO is still in its infancy. From this standpoint, there are suggestions from FO
researchers to borrow from the solid history of RO membrane preparations and put efforts
into new and existing techniques to prepare high performance FO membranes (Miller and
Evans 2006; Zhao et al. 2012).
The choice of FO membranes will highly depend on their performance. As was noted above,
concentration polarisation, high levels of salt rejection, and anti-fouling properties are the
basic requirements to FO membranes. As was demonstrated in equations ( ), –
( ), above, osmotic water flux is the function of the water permeability (Aw), the
membrane structure coefficient (S), the solute resistivity coefficient (k), and the solute
permeability (B). Because the relationship between k and S is independent from the general
flux equation, these parameters can be determined on a separate basis. k was demonstrated as
a reflective to ICP coefficient, which increases its importance in the evaluation process.
In general, when selecting and evaluating a newly developed membrane for FO application, it
is essential to consider its ICP and fouling resisting properties, the level of water
permeability, rates of salt rejection, and its structural parameter. Some researchers also
recommend using specific reverse solute flux calculations (Hancock and Cath 2009; Zhao et
al. 2012).
2.4.7. Draw Solutions for Forward Osmosis
Basically, a draw solution (osmotic agent) is used to initiate the osmotic process. However,
during this process, water moves across the membrane surface due to the concentration
gradient from highly concentrated solution to low concentrated solution in order to achieve
the state of equilibrium between the draw solution and feed solution. Selection of the optimal
draw solution is another main challenge in FO process. According to Miller and Evans
(2006), regardless of their application, draw solutions should be inert, stable, non-toxic, and
pH neutral. They further continued that such solutions should have minimal negative impact
on the membranes, human health, or the environment, while being able to ensure high
osmotic pressures at low cost of production. The criteria such as pH and stability of the draw
solution may vary with the experimental conditions it is required that the solution has
properties of higher diffusion and low viscosity (Zhao and Zou 2011) .

Saleh Al Aswad Page 51
Several studies have recently discussed the approaches to selecting the optimal draw
solutions (Achilli et al. 2009; Kim et al. 2012). In general, three main criteria can be
identified across the studies for selecting the optimal FO draw solution: high osmotic
pressure, ease and low cost of recovery, and minimised ICP effect (Achilli et al. 2009; Cath
et al. 2006; Kim et al. 2012; Yen et al. 2010). At the same time, the interrelation between
these factors does not always make the choice of the solution easy. For example, Zhao and
Zou (2011) demonstrated that the draw solution’s viscosity, diffusion coefficient, and
ion/molecule size have significant impact on ICP. Specifically, it is required that the solution
has properties of high diffusion and lower viscosity (Zhao and Zou 2011).
The first references to draw solution choices for FO could be traced back to the 1960s.
Batchelder (1965) patented a FO desalination process that used highly volatile gases (NH3
and SO2) diffused in water as a draw solution. Volatile gases were used for the ability to
separate or recover the thermolytic draw solution. The diluted solution was to be heated in
order to remove pure water. In the same year, Glew (1965) patented a desalination process
that used a mixture of water and either SO2 or aliphatic compounds as a draw solution. Fank’s
(1972) patent for desalination described the use of a precipitable salt (Al2(SO4)3) dissolved in
water to create a draw solution with high osmotic pressure. The salt’s precipitation was
achieved by adding Ca(OH)2 to the diluted draw solution. Unfortunately, these earlier patents
did not report on any empirical measurements such as flux, salt rejection or membrane
fouling propensity with these solutions.
Later osmotic studies started investigating sugars and simple salts as potential candidates as
draw solution agents in FO. Sugars were noted for the ability of their solutes to become easily
reconcentrated at lower pressure levels. Major applications of such solutions were in small
scale osmotic processes. Kravath and Davis (1975) proposed to use glucose as the draw
solution to apply specifically with seawater desalination. Their research, however, was
focused on emergency situations and only considered desalination to the point of dilution of
draw solution because it could be safely consumed in the short term. Based on Kravath and
Davis’ research, Kessler and Moody (1976) proposed use of a nutrient mixture with a low
molecular weight as a draw solution for osmosis based water extraction on life boats. Further,
Stache (1989) used a concentrated fructose and glycine solution for his semi-permeable bag
design that used osmosis process for producing potable water. A relatively novel approach to
draw solutes was proposed by many investigators who combined a water soluble NH3 with
CO2 containing NH4HCO3 (McCutcheon et al. 2005, 2006; Achilli et al. 2009; Martinetti et

Saleh Al Aswad Page 52
al. 2009).It was shown that the mix is capable of providing higher water fluxes and only
moderate heat (approximately 60 ºC) is required to recover the solute. The issue with this
method, however, is the strong ammonia odour preserved in the purified water (Miller and
Evans 2006). Some other natural chemicals and even in-organics have been tested as the
draw solutes; although, according to Zhao et al. (2012), there is hardly a naturally existing
chemical that can become a perfect draw solute.
Because of the difficulties with finding a perfect naturally available draw solute, a number of
synthetic and organic materials have been proposed (Adham et al. 2007; Ling and Chung
2011; Yen et al. 2010). Especially interesting in this regard is the experiment described in
Zhang et al. (2011), where a stimuli-responsive polymer hydrogel was applied as a FO draw
solution (Zhang et al. 2011). According to the study description, based on temperature and/or
pressure levels, the gel has the capacity to either swell or shrink, thereby pulling or releasing
water. The researchers were able to achieve higher level of performance after adding light
absorbing carbon particles to the gel, which significantly improved swell/shrink ratios (Zhang
et al. 2011). A similarly innovative idea was described in a study by Liu et al. (2011), where
the initial draw solute, A2(SO4)3 was combined with CaO to create a gel like mixture of
positively charged particles Al(OH)+ and CaSO4
+. Super magnetic nanoparticles, negatively
charged, were then added to begin the sedimentation process and enhance separation
efficiency. While these innovative methods have potential as eco-sustainable approaches to
water desalination, they are still poorly developed to be considered seriously.
It follows from the discussion that there is a wide range of draw solutions available for FO
desalination process. None of the existing solutions, including the most technologically
advanced ones, seems to be perfect, however. Therefore, the quest for the optimal draw
solution continues, while it is always useful for the researchers to remember the basic criteria
that define the draw solution.
2.5. Concentration Polarisation
2.5.1. Introduction
Concentration polarisation is a common and unavoidable phenomenon in both osmotically-
driven and pressure-driven membrane processes. It is referred to as the accumulation of
excess solute particles in a thin layer bordering the membrane surface (Sablani et al. 2001;
Zhao et al. 2012). In osmotically-driven membrane processes, concentration polarisation is
caused by the concentration difference between the feed solution and the draw solution

Saleh Al Aswad Page 53
through an asymmetric FO membrane. Inherent to all membrane processes, concentration
polarisation is one of the major factors limiting the reduction of permeate flux (McCutcheon
and Elimelech 2006; Zhao and Zou 2011). In the FO process, two types of concentration
polarisation effects occur: External Concentration Polarisation (ECP) and Internal
Concentration Polarisation (ICP). These are demonstrated in Figure 2.15.
Feed Solution Draw Solution
Jw
Cdraw
Support
Layer
Active
Layer
Cfeed
ICP ECP
∆πeff
FO Flow
Figure 2.15. ICP and ECP in FO Process (Zhao et al. 2012)
In the Figure, C feed stands for concentration of feed solution; C draw for concentration of
draw solution; ∆πeff for effective driving force; and Jw for water flux. The effective driving
force diminishes due to polarisation concentration profiles. Both polarisation types are
described in details below.
2.5.2. External Concentration Polarisation
ECP takes place at the surface of the active membrane layer. In general, no matter what the
nature of the free stream is, a thin layer of fluid close to the fluid-channel interface will be in
laminar flow (Welty et al. 2001). Water transport within this layer and the transport of other

Saleh Al Aswad Page 54
solutes will be based solely on convection and molecular diffusion (Hsiang 2011). As a
result, a phenomenon of polarisation takes place, which is known as ECP. There are two
possible types of ECP depending on membrane orientation: concentrated ECP occurs when
the support layer is facing the draw solution, while dilutive ECP takes places when the active
layer faces the feed solution (Zhao et al. 2012). In general, ECP leads to the increased
osmotic pressure at the interface of the membrane active layer on the feed side, thus reducing
the net driving force. The same can happen if the osmotic pressure at the membrane active
layer surface on the draw solution side decreases (Zhao et al. 2012). According to Cath et al.
(2006), the negative impact of ECP on the flux can be decreased by either optimising the
water flux or by increasing the overall flow velocity. They further stated that optimisation of
water flux may not be suitable in all cases due to low initial flow level.
The effects of ECP on water flux can be modelled by using the general equations for
pressure-driven membrane processes (Mulder 1996). The basic concentration polarisation
equation is expressed as:
(
) Eqn.2.9
where :
Cm is the concentration of the feed solution at the membrane;
Cb is the concentration of the feed solution in the bulk;
Jw is the water flux.
k in the equation is the mass transfer coefficient, which depends on the properties of the
applied solutions and hydrodynamics of the systems. Typically, such coefficients are
estimated by using empirical correlation of dimensionless numbers, such as Sherwood
number, Reynolds number and Shmidt number. Eqn. 2.10 shows the general mass transfer
coefficient calculation for concentration polarisation.
where:
D represents the solute diffusion coefficient;
Dh represents the hydraulic diameter.

Saleh Al Aswad Page 55
The general correlation formula for Sherwood number can be presented as:
Eqn 2.11
where:
Re is Reynolds number;
Sc is Schmidt number.
Depending on geometry and conditions of the flow, different K, a and b are applied which
leads to a great variety of possible correlations. No single Sherwood number can describe all
systems for mass transfer coefficient calculations, and up to 27 Sherwood relations are
recognised in literature (van den Berg et al. 1998). The most commonly used Sherwood
relationship for RO and ultrafiltration processes, according to Mulder (1996), are:
Sh = 0.04Re0.75
Sc0.33
for turbulent flow systems
and
Sh = 1.85(Re*Sc*Dh/L)0.33
for laminar flow systems where
L is the characteristic length.
McCutcheon and Elimelech (2006) applied these correlations when measuring the mass
transfer coefficient for modeling ECP in FO with satifactory results which makes the
aforementioned correlations suitable for ECP modeling in FO processes.
In FO, the concentration of the feed solution is small, which makes it possible to replace it by
the osmotic pressures. Therefore, equation [Eqn.2.9] becomes:
(
)
Where:
πmfeed is the osmotic pressure of the feed solution at the membrane;
πbfeed is the osmotic pressure of the feed solution in the bulk;
kfeed is the mass transfer coefficient on the feed side.
Consequently, the equation for the dilutive ECP in FO can be expressed as:
(
)

Saleh Al Aswad Page 56
Where:
πmdraw is the osmotic pressure of the draw solution at the membrane;
πbdraw is the osmotic pressure of the draw solution in the bulk;
kdraw is the mass transfer coefficient on the draw side.
The general water flux equation (Eqn.2.1) for FO replaces the value of (σ∆π − ∆P) with the
osmotic pressure differences from the solutes at the membrane surfaces to become:
Jw = A(πmdraw – πmfeed) Eqn.2.14
By inserting the values for πmdraw and πmfeed from equations (Eqn.2.12) and (Eqn.2.13)
respectively, the final flux process for ECP is expressed by the following equation:
(
) (
)
Equation (Eqn.2.14) applies both concentrative and dilutive ECP to model the water flux.
This is a simplified equation, however, because it makes such assumptions as the negligible
value of the solute permeability coefficient, similar mass transfer coefficients on the feed and
draw solutions, and the presence of a dense symmetric film. In practice, asymmetric FO
membranes are used more often, which makes the effects of ICP much more important.
2.5.3. Internal Concentration Polarisation
ICP is similar to ECP process with the only difference that it takes place within the
membrane’s porous layer; therefore, cross-flow cannot diminish its negative effects on the
flux (Cath et al. 2006). ICP is considered one of the major issues in osmotically-driven
membrane processes. Studies show ICP is the major factor causing decline in water flux
(Gray et al. 2006; McCutcheon and Elimelech 2006). In similar manner to ECP,
concentrative and dilutive ICP can occur depending on the orientation of the membrane.
Figure 2.14 demonstrates both processes: dilutive ICP occurs when the active membrane
layer faces the feed solution, while concentrative ICP occurs when the active membrane layer
faces the draw solution.

Saleh Al Aswad Page 57
Draw Solution (DS) side Membrane Feed Water (FW) side
DS: Osmotic pressure in bulk DS side.
DS-m: Osmotic pressure at the membrane interface in DS side.
i: Osmotic pressure at the transition interface between membrane layers.
FW-m: Osmotic pressure at the membrane interface in FW side.
FW: Osmotic pressure in bulk FW side.
DECP, CECP, DICP, CICP: Dilutive External, Concentrative External, Dilutive internal and
Concentrative Internal Concentration Polarization, respectively.
DS-m FW-m
DS
FW
DS-m
i
FW-m
DS
FW
Skin layer Porous substrate
DS-m
i
FW-m
DS
FW
Porous substrate
Skin layer
(a):
Symmetric dense
membrane
(b):
Asymmetric
membrane with the
dense skin layer
against the draw
solution
(c):
Asymmetric
membrane with the
dense porous
substrate against
the draw solution
Water flow
DS Salt flow (diffusion)
Water flow
DS Salt flow (diffusion)
Water flow
DS Salt flow (diffusion)
DECP
CECP
DECP
CICP
DICP
CECP
Figure 2.16. Dilutive External, Concentrative External, Dilutive Internal and Concentrative
Internal Concentration Polarization (Mezher et al. 2011; Schiermeier 2008; Younos and Tulou
2005)
The adverse effect of ICP on water flux and permeability rates is a well-known issue in
retarded pressure driven osmotic processes. Mehta and Loeb (1979) studied the effect of the
porous support layer on ICP and the effect of high draw solution concentrations on the

Saleh Al Aswad Page 58
overall permeability coefficient of the membrane. They showed that upon swapping the
working fluids on the two sides of the membrane, flux sharply declines due to ICP (Fig.
2.17).
Figure 2.17. Water Permeability Cefficient as a Function of Draw Solution Concentrations
(Mehta and Loeb 1979)
Evaluation of the ICP effect on the FO flux is commonly done with the equations of the
classical solution/diffusion theory (Mulder 1996). The dilutive ICP effect is represented by
the following equation:
where :
Jw is the water flux;
A is the water permeability constant depending on the membrane used;
πdraw is the osmotic pressure of the draw solution;
πfeed is the osmotic pressure of the feed solution;
B is the solute permeability coefficient of the membrane;
k is a resistivity coefficient reflecting the degree of ICP in the support layer.
The equation for concentrative ICP is expressed in similar way:

Saleh Al Aswad Page 59
For both processes, smaller k coefficient translates into lower ICP and higher water flux. The
coefficient is calculated as:
where :
D stands for the solute’s diffusion coefficient through water;
S for the membrane’s structural parameter;
t, τ, and ε are the thickness, tortuosity, and porosity of the support layer of membrane,
respectively.
As is seen, S is the product of the three membrane parameters, and its value is important to
know for any newly developed membrane.
It is important to remember that ICP and ECP usually occur at the same time. Consequently,
for the FO process, the effects of concentrative ECP and dilutive ICP on the flux can be
determined by the following equation (MacCutcheon and Elimelech 2006, 2007):
(
) ( )
Based on equation( ), ICP is dependent on membrane properties such as thickness,
porosity and tortuosity as well as on diffusion solute properties such as diffusion coefficient
of the solute. Zhao and Zou (2011) proposed that ICP could also be dependent on
constrictivity, which is a factor of the ratio of solute molecule diameter to the membrane pore
diameter:
Consequently, constrictivity is derived from an empirical equation by Beck and Schultz
(1970):
δ = (1 - λ)4
Eqn.2.21

Saleh Al Aswad Page 60
According to Zhao and Zou (2011), constrictivity defines how diffusion is slowed down due
to viscosity increase in the porous structure as a result of greater proximity to the average
pore wall.
k coefficient from equation ( ) is then calculated as:
Other models for ICP estimation have been proposed. For example, Tan and Ng (2008)
proposed that in order to account for higher concentration solutions to avoid over-prediction
of the water flux at high NaCl concentrations, a modified film theory should be used. They
consequently reported that their model was in better agreement with the data obtained
experimentally and that it applied to a wider range of solutes. However, the derived model is
also much more complex than the one proposed by McCutcheon and Elimelech (2006, 2007)
and is beyond the scope of this report.
Due to the importance of ICP for osmosis process investigations, there have been a number
of studies to cover this topic recently (Gruber et al. 2011; Li et al. 2011; Qin et al. 2010; Tang
et al. 2010; Zhao and Zou 2011). Qin et al. (2010) found that dilutive ICP was an important
obstacle to the osmosis process application due to its ability to reduce the water flux by
99.9%. Tang et al. (2010) studied the impact of ICP on FO flux behaviour and observed that
ICP’s negative effect on flux increased substantially with membrane fouling. Zhao and Zou
(2011) also found that the ICP effects on flux in FO increases with the increase of draw
solution concentrations (Figure 2.18).

Saleh Al Aswad Page 61
Figure 2.18. Theoretical, FO Mode and PRO Mode Water Flux as a Function of net Osmotic
Pressure (Zhao and Zou 2011).
As is seen, CP is an important factor to consider in FO applications for desalination. It has
been shown that CP is dependent on membrane structure; therefore, choice of the right
membranes plays an essential role in spearheading FO desalination research and practical
applications.
2.6. Manipulated Osmosis Desalination (MOD)
2.6.1. Process Description
The Manipulated Osmosis Desalination (MOD) process was developed at the University of
Surrey’s Centre for Osmosis Research and Applications (CORA). The process is comprised
of FO desalination combined in a single cycle with a regeneration step. Specifically, the
principle behind the MOD is manipulation of two fluids with different osmotic pressures to
receive a pure water flux across the selectively permeable membrane (Al-Mayahi and Sharif
2004). The manipulated fluids are seawater and a chosen draw solution. The seawater passes
through a FO unit with a draw solution, which attracts water molecules. The resulting liquid
is then transferred to a membrane-based (RO or nano-filtration) recovery unit where final
separation of the product water takes place. Figure 2.19 presents a basic schema of the MOD

Saleh Al Aswad Page 62
process using RO unit for the regeneration step. A semi-permeable FO membrane is placed
between the feed solution (seawater) and the draw solution (water containing osmotic agent).
The higher osmotic pressure from the draw solution allows to extract water from the feed. As
in other membrane processes, the result is rejected feed brine, which is discharged, and the
diluted draw solution. The diluted draw solution is then transferred to the regeneration unit
where RO process is used to extract water. The rejected osmotic solution is then transferred
for reuse in the first step.
Figure 2.19. Continuous MOD Process with Regeneration Step (Adapted from Al Mayahi and
Sharif 2004)
2.6.2. Advantages and Considerations
The MOD allows to capitalise on the advantages of FO and RO processes while at the same
time reducing their weaknesses (Table 2.2). If FO is used as a pre-treatment step in
desalination, it can on the one hand dilute the feed stream without energy consumption and,
on the other hand, help avoid irreversible membrane fouling. In the second step, low pressure
RO will be required, although it will enable steady flux and high quality water product.

Saleh Al Aswad Page 63
Table 2.2. Comparison of FO and RO (Adapted and Expanded from Chung et al. 2012; Zhao
et al. 2012)
Process Advantages Disadvantages Challenges
Forward
Osmosis
-low energy
requirements for water
transport
-reversible fouling
-low operational cost
-possibility of energy
production
-few working projects;
-does not work well as a
standalone process;
-ICP;
-requires relatively high
capital costs
-increase water flux;
-reduce ICP;
-develop effective draw
solutes;
-produce effective
specialised membranes;
Reverse
Osmosis
-mature technology
-low capital costs
-high water quality
-hydraulic pressure
consumes a lot of energy;
-fouling is irreversible;
-operational costs are
high;
-reduce energy losses;
-reduce membrane
fouling;
In comparison with the traditional RO-based seawater desalination process that operates at
60-80 bar, the MOD operates at greatly reduced pressures of 2-3 bar. While RO as a recovery
step consumes additional energy, the consumption can be minimised with a careful selection
of the osmotic agent and optimisation of operative conditions. Additionally, these factors can
lead to greater recovery efficiency due to control of the draw solution composition and
absence of foulant impurities (Choi et al. 2009). Other advantages of the MOD process are
lower costs due to membrane longevity and lower fouling propensity; reduced capital
expenses due to significant reduction of contaminants; higher quality water product due to a
double membrane barrier; and possibility of using lower pressure pipe works and fittings
(Achilli et al. 2009; Boo et al. 2013; Thompson and Nicoll 2011). Recent studies have also
demonstrated the potential for hybrid FO-RO systems to recover impaired water from a
recycle feed (Cath et al. 2009; Yangli-Quintanilla et al. 2011).
In order to better understand economic benefits of MOD, it is useful to consider capital and
operational expenses from a comparative perspective. Such analysis was provided by Nicoll
(2011) who described the advantages of MOD over RO for desalination on the bases of
capital investment, power consumption and operational costs. According to Nicoll (2011), a
typical MOD system would require roughly the same amount of initial capital as RO if
operated on the same feed source. While overall capital expenses were difficult to project for
equivalent plants, Nicoll mentioned that an MOD plant can at least save on basic
components. Unlike the traditional RO plant that used duplex stainless steel components, an
MOD plant could use plastic components that cost less.

Saleh Al Aswad Page 64
A more definitive analysis provided by Nicoll (2011) was for operating expenses of MOD
and RO plants. The following assumptions were made for both plants: feed water temperature
is 25 oC; the same feed water pre-treatment requirements; overall plant efficiency at 70%; and
energy recovery efficiency at 70% as well. A conservative assumption was made with regards
to MOD with a 30% conversion rate. Cost of osmotic agent was taken as $75 per tonne. For
RO plant the conversion rate was between 41% to 80% based on the total dissolved solids
(TDS) in the feed. A low estimation was made for energy cost at 0.075 kW/hr. Nicoll’s
energy consumption and total operating cost projections were based on the amount of TDS.
Since MOD does not require hydraulic pressure to operate in the pre-treatment stage, its
power consumption remained lower regardless the level of TDS in feed water, while RO
process required an increasing amount of power to operate. However, for MOD, osmotic
agent cost and the cost of osmotic agent recovery were relevant. Figure 2.20 and 2.21 show
Nicoll’s (2011) projections for power consumption and operating costs respectively based on
TDS in feed water. It can be seen that in comparison to RO MOD requires lower power
consumption and operating expenses, and that the difference increases as the feed gets more
challenging with higher amount of TDS.
Figure 2.20. Projected Power Consumption of MOD and RO Plants (adapted from Nicoll
2011)
0
1
2
3
4
5
6
7
10000 20000 30000 40000 50000
kW/h
r
Total Dissolved Solids in the Feed
RO
MOD

Saleh Al Aswad Page 65
Figure 2.21. Projected Operating Costs of MOD and RO Plants (adapted from Nicoll 2011)
Despite its promising parameters, MOD has yet to mature as a wide scale desalination
technology. As in other membrane processes, MOD needs to be optimized to achieve the best
efficiency and product quality. Optimisation of the MOD process depends on a number of
factors such as number of performance of FO membranes, composition, concentration and
recirculation rate of the draw solution, performance of the regeneration step and feed water
factors such as temperature, composition and flow rate. The type of membrane and the choice
of an osmotic agent in the draw solution can further increase efficiency of the process.
Specifically, a properly selected osmotic agent may enable use of lower resistance
membranes that require lower feed hydraulic pressures while membranes with higher
permeability of water may lead to a more efficient separation process.
2.6.3. Existing MOD Projects
2.6.3.1. University of Surrey Rig
As was mentioned earlier, MOD process was developed and patented by a group of
researchers at the University of Surrey’s Centre for Osmotic Research and Applications
(CORA), which is a part of Modern Water’s development programme. The test rig installed
at the University’s lab became the first operational MOD unit, and it has been used for
research and development since, including identification of membrane configuration and
parameters, osmotic agents and other relevant processes. In 2008, based on the trials
0
0.05
0.1
0.15
0.2
0.25
0.3
0.35
0.4
0.45
0.5
10000 20000 30000 40000 50000
Op
era
tin
g C
ost
Total Dissolved Solids
RO
MOD

Saleh Al Aswad Page 66
performed at the University of Surrey, Modern Water commissioned a practical MOD system
in Gibraltar. The key objectives of the plant were to demonstrate a possibility of stable
continuous MOD cycle operations; practically test the theorised models for MOD cycle
performance; and analyse real-world issues related to MOD that cannot be apparent in
laboratory settings (Thompson and Nicoll 2011).
2.6.3.2. Gibraltar MOD Pilot Plant
The MOD system in Gibraltar has been operational since May 2009. The system applies the
same process structure as the test rig at the University of Surrey, although on a larger scale
with 18 m3/day output (Figure 2.22). The rig uses the same seawater as the RO plant located
nearby, and the water has the silt density index between 3 and 4. The treatment process
involves the FO unit for desalination and RO for osmotic agent regeneration. Within the first
two years of operations, several on site modifications were implemented, mostly to improve
the FO step. Membrane modifications were introduced which allowed to improve the
facility’s productivity by 30% thereby reducing capital expenses and environmental footprint
of the plant. The product water supplied by the Gibraltar MOD facility has less than 200 TDS
mg/L and less than 0.6 mg/L of boron level.
Figure 2.22. Gibraltar MOD Rig by Modern Water Prior to Containerisation (Thompson and
Nicoll 2011)

Saleh Al Aswad Page 67
Because of the convenient location next to a RO plant, it was possible to run a number of
tests for comparative performance of the MOD plant’s RO step as well. It was found that
MOD plant allowed for a more efficient use of RO membranes mostly because of the ability
to control the regeneration unit feed solution coming from the FO step. It was estimated, for
example, that the MOD plant’s cycle allows to achieve 50% feed water conversion with only
three membrane elements whereas RO plant required 6-7 elements to achieve a 40% recovery
rate (Thompson and Nicoll 2011). An important advantage of the MOD system installed in
Gibraltar, according to Thompson and Nicoll (2011), has been the ability to modify the
product quality by changing the properties of the osmotic agent. Further, focused
modifications to the operating flow conditions allowed to reduce boron levels by over 40%.
2.6.3.3. Production Facilities in Oman
Following the success of the Gibraltar plant, Modern Water deployed a larger scale (100
m3/day) MOD plant in Al Khaluf region, Oman. The site already had an operating RO plant
of the same capacity, and both plants would share pre- and post-treatment equipment (Figure
2.23). The choice of the site was made based on the primary goal of the project, which was to
directly compare the performance of a MOD-based plant to the performance of a
conventional RO plant of the same capacity and operating in the same conditions. Other goals
included increasing the region’s water supply while observing operations of the plant under
harsher conditions. The location of the plant was notable for the poor quality feed water and
harsh environmental conditions such as soaring temperatures (up to 50 oC), constant winds
and sand storms. Additional challenges included unplanned power outages and additional
disruptions associated with external services.

Saleh Al Aswad Page 68
Figure 2.23. MOD Plant Facility in Al Khaluf, Oman (Thompson and Nicoll 2011)
Despite the environmental and operational challenges in Al Khaluf, the MOD plant
demonstrated the superior performance in comparison to the RO plant. The major practically
demonstrated advantage was reliable membrane performance. Figure 2.24 shows a
comparative chart for RO and MOD membrane performances during 2010. As is seen from
the charts, the RO plant membranes showed decreasing normalised permeate flow with up to
30% decline in the 5 month period. In contrast, the normalised output for the FO system
shows relatively stable flow even without membrane replacement and chemical cleaning.
Other advantages of the MOD plant design over the RO facility included:
- higher feed water recovery: 35% for MOD versus 25% for RO;
- higher water flow: 4.2 m3/hr for MOD versus 3.0 m
3/hr for RO;
- lower feed water pump energy consumption: 1.6 kWhr for MOD versus 25.3 kWhr
for RO;
- lower overall specific energy consumption per final product unit: 4.9 kWhr/m3 for
MOD and 8.5 kWhr/m3 for RO. (Thompson and Nicoll, 2011)

Saleh Al Aswad Page 69
Figure 2.24. Normalised Flow for Al Khaluf RO Plant (above) and MOD Plant (below) in
2010 (Thompson and Nicoll 2011)
The proven operational record for Al Khaluf MOD project prompted Omani government to
seek a larger facility construction. A ₤420,000 contract was signed with Modern Water to
install and operate the first MOD commercial facility in Al Najdah, and the project was
completed in 2012 (Lauwers 2012). Al Najdah plant has the capacity to produce 200 m3 of
water per day (Water World 2013).
2.7. Chapter Summary
This chapter presented a comprehensive review of the existing literature on desalination with
the focus on forward osmosis process and its current commercial applications. With the
increasing demand for freshwater because of population growth and industrial development,
searches for unconventional ways to produce water intensified in the past decades. Osmotic
processes have received a particular interest due to their potential for efficient conversion of
seawater into drinkable product. So far, the majority of commercial osmotic plants have used
reverse osmosis process. However, this process requires substantial energy use and
propensity for membrane fouling. Forward osmosis allows to alleviate these issues because it

Saleh Al Aswad Page 70
is based on a natural process of osmotic pressure to extract water from the feed. As such, it
does not require energy to operate and is not prone to irreversible membrane fouling.
Forward osmosis found a wide range of applications in such areas as energy production,
wastewater treatment, pharmaceutical and food industries. Its applications for seawater
desalination, however, have remained limited until recently. The University of Surrey Centre
for Osmotic Research and Applications pioneered a novel desalination process called
manipulated osmosis desalination (MOD). MOD relies strongly on forward osmosis to dilute
the seawater feed with the subsequent treatment of the diluted solution by reverse osmosis.
Such system ensures substantial energy savings, lower environmental impact and lower
operating costs in comparison to the same capacity reverse osmosis plats. This was
successfully demonstrated at fully operational plants in Gibraltar, Al Khaluf and Al Najdah.
MOD was especially effective in the areas with poor quality of seawater feed and harsh
environmental conditions.
Despite the recent commercialisation of MOD, there are still issues that require attention in
order to increase efficiency of the process. These issues involve internal concentration
polarisation, membrane development and search for effective osmotic agents. This paper adds
to the existing knowledge of MOD and its applications by testing different membranes’ and
osmotic solutions’ performances.

Saleh Al Aswad Page 71
3. CHAPTER THREE: MATERIALS AND METHODS
3.1. Introduction
This chapter describes the materials and methods used in to investigating the efficiency of
organic osmotic agents in the forward osmosis desalination process. Two types of
membranes: flat sheet and hollow fine fibre are used. Osmotic pressure measurements were
taken using OLI Analyser Software. The structure of the Chapter follows the experiments
conducted for the different types of membranes. The first section of the Chapter (section 3.2)
describes the flat sheet FO bench scale laboratory apparatus and the dissembled membrane
testing apparatus, the flat sheet membranes used for the experiments and the basic parameters
under which the experiments were conducted. The second section of chapter (section 3.3)
describes the FO rig used for hollow fine fibre membrane measurements, the combinations of
osmotic agents and draw solutions and the parameters under which the experiments were
conducted. The final section of the chapter (section 3.4) describes the criteria used for
calculation of FO performance.
3.2.Flat Sheet Membrane Study
3.2.1. Experiment Outline
In this series of experiments, forward osmosis was studied using two types of membranes
(nano-fitration and reverse osmosis) and two types of osmotic agents (glucose and sucrose)
against deionized water (DW). Concentration, flow rate and temperature were the variable
parameters tested in the experiment .The experimental framework of this work is presented in
Figure 3.1.

Saleh Al Aswad Page 72
FO Process
NF
Membrane
RO
Membrane
SucroseGlucoseSucroseGlucose
Concentration
Flow rate
Temperature
Concentration
Flow rate
Temperature
FO Flat Sheet Membrane Process
Figure 3.1. Experiment Outline for FO Using Flat Sheet Membranes
3.2.2.Experiment Set Up
The membrane module used for the experiment was designed and prepared at the Centre for
Osmosis Research and Application (CORA), University of Surrey, England. Figure 3.2
presents the setup of flat sheet FO module. Figure 3.3 shows the schematic diagram of the
bench-scale laboratory apparatus; and demonstrates the disassembled membrane testing
apparatus with flow channels. Note that the valves [14 and 15] were fully open in order for
the feed and draw solution to have full contact with both the active layer and support layer of
the membrane surface for the FO process. However, the flow rate was controlled by valve [4]
and [6] manually with the help of rotameter installed on the rig. This ensured the presence of
the close loop system without any pressure drops.
From Figure 3.4, it is seen that the experimental FO cell consisted of two compartments for
the FO process: flat sheet cell manufactured from Perspex material and the unit also had two
polyethylene tanks with 10 litres capacity each. Tank A was used as osmotic agent storage,
and Tank B was used as feed water storage. Both tanks were placed on 3 digits balances
supplied by (KERH and SOHN GmbH) to determine the amount of water flux. The balances
were capable for measuring mass changes to an accuracy of one gram. In order to control the
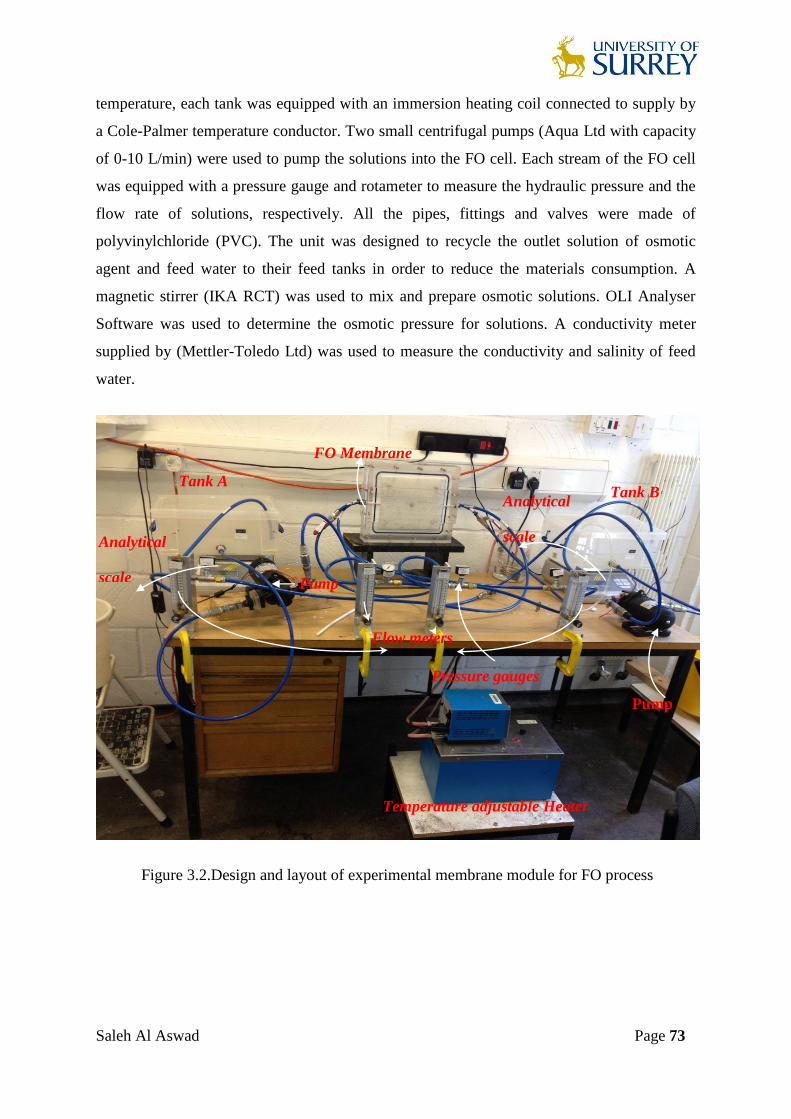
Saleh Al Aswad Page 73
temperature, each tank was equipped with an immersion heating coil connected to supply by
a Cole-Palmer temperature conductor. Two small centrifugal pumps (Aqua Ltd with capacity
of 0-10 L/min) were used to pump the solutions into the FO cell. Each stream of the FO cell
was equipped with a pressure gauge and rotameter to measure the hydraulic pressure and the
flow rate of solutions, respectively. All the pipes, fittings and valves were made of
polyvinylchloride (PVC). The unit was designed to recycle the outlet solution of osmotic
agent and feed water to their feed tanks in order to reduce the materials consumption. A
magnetic stirrer (IKA RCT) was used to mix and prepare osmotic solutions. OLI Analyser
Software was used to determine the osmotic pressure for solutions. A conductivity meter
supplied by (Mettler-Toledo Ltd) was used to measure the conductivity and salinity of feed
water.
Figure 3.2.Design and layout of experimental membrane module for FO process
Tank B Tank A
FO Membrane
Analytical
scale
Pump
Pump
Temperature adjustable Heater
Flow meters
Analytical
scale
Pressure gauges

Saleh Al Aswad Page 74
5
1314
6
8
1
7
10
15
9
16 17 1819
1 Tank B (Draw solution) 6 Rotameter (Feed water in) 11 Digital Balance
2 Digital Balance 7 Rotameter (Feed water out) 12 Tank A (Feed water)
3 Rotameter (Draw out) 8 Pump 13 FO membrane cell
4 Rotameter (Draw in) 9 Heat regulator 14-15 Valves
5 Pump 10 Heating coil 16-19 Pressure Gauge
Figure 3.3. Schematic Diagram of theFlat SheetForward Osmosis Bench-Scale Laboratory
Apparatus
Figure 3.4. Disassembled Membrane Testing Apparatus Showing Flow Channels.
3.2.3. Process Operation
The flat sheet membrane with a surface area of 0.0621 m2 was placed between the two
compartments of FO cell. The membrane test cell assembly was operated in a counter-current
flow mode arrangement with the osmotic agent and process solution flows each set at 10
L/min. The experiments were carried out using deionised water as the feed solution (FS) for
two types of flat sheet membranes: nano-filtration and reverse osmosis. The feed solution was
placed against the active layer (AL),whereas the osmotic agent solution was placed against
the support layer (SL). Both osmotic agent solution and feed water solution were run in

Saleh Al Aswad Page 75
closed loop mode to diminish the internal concentration polarization (ICP) and chemical
consumption for osmotic agent (Esperanza et al.,2009).
The effect of operating parameters such as the osmotic agent concentration, flow rates of
osmotic agent and feed water and temperature on water flux (Jw), water recovery percentage
(%R), water permeability (Aw), specific energy consumption (SEC) and solute flux(Js) were
studied. The specifications of NF and RO membranes used in the experiments are
summarised in Table 3.1 and 3.2 respectively.
Table 3.1. TFC-SR2 Specifications (Koch Membrane Systems Ltd ,UK)
Type of membrane Low pressure, selective rejection, NF element
Membrane chemistry Proprietary TFC membrane
Typical operating pressure 3.45 – 7 bar
Maximum operating pressure 34.5 bar
Maximum operating temperature 45°C
Rejection 97.53
Flux (GFD) 57.2
Allowable pH – continuous operation 4-9
Table 3.2. TFC-ULP specifications (Koch membrane systems Ltd ,UK)
Type of membrane Ultra-Low Pressure RO element
Membrane Chemistry Proprietary TFC polyamide
Typical operating pressure 7-12 bar
Maximum operating pressure 24 bar
Maximum operating temperature 45°C
Rejection 98.68
Flux (GFD) 29.91
Allowable pH – continuous operation 4-11
Test conditions: 2000 mg/L NaCl solution, 8.6 bar, 15% recovery, 25°C and pH 7.5

Saleh Al Aswad Page 76
3.2.4. Osmotic Agents
Two organic osmotic agents (sucrose and glucose) were used to create draw solutes with
different concentrations. The solutions were prepared by dissolving the osmotic agents in
deionised water.
Sucrose is a disaccharide composed o f -D-glucose and -D-fructose as monosaccharides
with chemical formula (C12H22011) and commonly known as table sugar. It has molecular
weight of 342.30 g/mol and density of 1.59 g/cm3. For this experiment, sucrose powder was
supplied in 5kg bag by the Tate and Lyle Company in the UK.
Glucose (C6H12O6) [also known as D-glucose, dextrose, or grape sugar] is a simple aldosic
mono saccharide found in plants. It is one of the three dietary monosaccharides, along with
fructose and galactose. Glucose’s molecular weight is 180.16 g/mol and its density is 1.54
g/cm3. For this experiment, 5kg containers of glucose were supplied by Sigma-Aldrich
Company located in the UK.Table 3.3 summarises the physic-chemical properties of sucrose
and glucose.
Table 3.3. Physico-Chemical Properties of Sucrose and Glucose
Property Sucrose Glucose
Chemical Formula C12H22O11 C6H12O6
Molecular Weight (g/mol) 342.30 180.16
Density (g/cm3) 1.59 1.54
Solubility in water at 25oC (g/l) 2074 2000
The osmotic pressures of the solutes were evaluated by using OLI Analyser's software.
3.2.5. Osmotic Agent Concentration Effect Study
To measure the effect of osmotic agent concentration in FO process, sucrose and glucose
solutions with different concentrations as shown in Table 3.4 were used. Sufficient amount of
sucrose solution at different concentrations ranging from 170 to 400 g/L was prepared and
placed in osmotic agent tank, while adequate amount of deionized water with conductivity of
10-15 μS/cm was placed in feed water tank. After filling both compartments with solution by
pumps, the samples of solution were collected and the weights of osmotic and feed solutions
in the respective tanks were recorded. The osmotic agent solution with feed water were

Saleh Al Aswad Page 77
pumped into the FO cell at the same time, while, the temperature(25 °C) and the flow rate of
osmotic agent solutions(1.5 L/min) and the flow rate of feed water solution(2.5 L/min) were
kept constant throughout the run. After 2 hrs, the run was stopped and the weight of solutions
was recorded and the samples of solution were also collected. The above mentioned
procedure was repeated using glucose solution of different concentrations ranging from 90 to
250 g/L. The concentration of sucrose and glucose were determined using HPLC equipment.
Table 3.4. Sucrose and Glucose Concentrations for the Concentration Effect Study
Osmotic Agent Concentrations g/L Osmotic pressure bar
Sucrose
Run 1 170 10.7
Run 2 200 12.6
Run 3 250 17.9
Run 4 400 27.5
Glucose
Run 1 90 12.3
Run 2 120 21.3
Run 3 180 25
Run 4 250 28.1
3.2.6. Feed Water Flow Rate Effect Study
To investigate the effect of OA solution flow rate at constant feed deionised water flow rate
(1.5 L/min) several experiments were carried out. In these experiments 275 g/L sucrose OA
concentration was prepared and pumped to the FO membrane cell at different flow rates from
2-4 L/min accordingly. However, in feed water flow rate effect study different feed deionised
water flow rates from 2-4 L/min accordingly were used while the OA concentration (275 g/L)
and the temperature (25oC) were kept constant during these experiments. Similarly in glucose
osmotic agent flow rate effects study, glucose solution with concentration ranging from 90-
250 g/L was prepared and pumped to the FO membrane at different flow rate values from 2-4
L/min accordingly, while the feed deionised water flow rate was kept constant (1.5
L/min) throughout these experiments .However , in feed water flow rate study, different
feed water flow rates from 2-4 L/min accordingly against (275g/L)glucose OA concentration
at constant flow rate (1.5 L/min) were used. The abovementioned experiments were
conducted at 25°C.

Saleh Al Aswad Page 78
3.2.7. Temperature Effect Study
In this study, several experiments were carried out to investigate the effect of sucrose OA
temperature at constant feed deionised water temperature 25°C and the flow rate (2 L/min).
In these experiments, sucrose OA solution with a concentration of 200g/L was prepared and
pumped to the FO membrane at different temperatures(20-35°C) for 2hr.However,in feed
water temperature effect study,(2 L/min) feed deionised water at different temperatures (20-
35°C )were used, while, OA concentration (200g/L), temperature (25°C) and the flow rate
(2.0 L/min) were kept constant throughout these experiments. Similarly, in glucose OA
temperature effect study, glucose solution with a concentration of 90 g/L was prepared and
pumped into the FO cell membrane at different temperatures (20-35°C), while the feed
deionised water flow rate (2.0 L/min) and the temperature (20°C) were kept constant
throughout these experiments. However, in the feed water temperature study, different feed
water temperatures (20-35°C) at the constant flow rate (2.0 L/min) were used against 90 g/L
glucose OA concentration at temperate 20°C
3.3. Hollow Fine Fibre Membrane Study
3.3.1. Experiment Outline
In this series of experiments, forward osmosis (FO) process efficiency was tested using a
hollow fine fibre membrane, three types of osmotic agents (glucose, sucrose and sodium
chloride) and their combinations were selected. Figure 3.5 presents the experimental
framework.

Saleh Al Aswad Page 79
HFFM
Mixture
Glucose + NaCl/
DW
Sucrose / DI
Mixture
Sucrose + NaCl /
DI
Glucose / DI NaCl / DI
Sucrose / SWMixture
Sucrose + NaCl/
BW
Mixture
Glucose + NaCl/
BW
Glucose / SW
Figure 3.5. Experiment Outline for Hollow Fine Fibre Membrane
3.3.2. Experiment Set Up
For the experiment involving the hollow fine fibre membrane, a FO unit shown in Figure3.6
was used. Figure3.7 depicts the flow diagram of the unit. The OA in the experimental unit
was feed from a 30 litre capacity container whereas feed solution (FW) was feed from a 100
litre capacity container. Two centrifugal pumps were used to transfer feed water and osmotic
agents to the FO membrane. Pump-1 was connected to Din to pump the draw solution into the
fibre side of the membrane, whereas Pump-2 was connected to Finto pump the feed solution
into the shell side of the membrane. The diluted OA was transferred to Container Dout with
the capacity of 60 litres whereas the stripped of water feed solution was transferred to
Container Fout with the capacity of 60 litres. The temperature of the containers Din and Fin was
kept constant as 25 oC and controlled by an electrical heating coil with thermostat installed in
each container. All four containers were made of stainless steel and equipped with a level
glass to measure the level of solution inside tanks
To measure the flow rate of the solutions, four flow rotameters were connected to each inlet
and outlet line of the membrane. All these lines were equipped with pressure gauges and
temperature indicators. The whole FO unit was fixed onto a skid as shown in Figure 3.6
Overall, the FO process as described above was operated in batch mode for a maximum time
of 30 minutes.

Saleh Al Aswad Page 80
Figure 3.6. The Experimental Unit Fixed onto aSkid.

Saleh Al Aswad Page 81
Figure 3.7. Flow Diagram of The Hollow Fine Fibre Forward Osmosis Process
3.3.3. Process Operation
A hollow fine fibre membrane (HFFM) with an effective area of 4.5 m2 was used. The
membrane, DURASEP®, was supplied by Toyobo Co., Ltd (Japan), and its basic
characteristics are summarised in Table 3.5. Figure3.8 shows a close up photograph of the
membrane within the experiment unit.
F I
L I
T I
P I
1
2
3
4
Osmotic agent tank
Draw out solution tank
Feed in solution tank
Feed out solution tank
Pump
control valve
Flow indicator
Level indicator
Temperature
indicator
Pressure indicator
LEGEND
5 Forward osmosis unit

Saleh Al Aswad Page 82
Table 3.5. Specifications of the Hollow Fibre DURASEP® Membrane Produced by
ToyoboCo., Ltd (Japan).
Type of membrane Hollow fibre, FO
Membrane chemistry Cellulose triacetate
Housing material Polysulphide
Operating pressure Shell side 6 bar
Fibre side < 1 bar
Allowable pH 3-8
Membrane area 4.5 m2
Rejection 96% - 98 %
Figure 3.8. The Experiment Hollow Fine Fibre Membrane, FO in Operation
Initial temperature and initial water level of both feed and osmotic agents were recorded.
Water samples were collected from FW and DS containers before starting the experiment.
Also, the flow of fluids in both the channels was allowed to stabilise for 10-15 minutes to
ensure flow rate uniformity of different solutions. Each experimental run was carried out for
30 minutes, then the pumps were turned off and the process was allowed to settle to normal
conditions. Then the solution level was recorded in all the four containers (Fin, Fout, Din and
Dout). At the end of each experimental run, water samples were collected from Fout container
and Dout container.

Saleh Al Aswad Page 83
3.3.4. Osmotic Agents
The main objective of the experiment was to exam the efficiency of the FO unit using
different osmotic agents and their concentrations at constant temperature. The performance
was evaluated based on water flux, water permeability and water recovery percentage.
Description of the osmotic agent solutions and experimental measurements are provided
below.
Two organic osmotic agents (sucrose and glucose) and one inorganic osmotic agent (sodium
chloride) were used to create draw solutes with different concentrations. Physico-chemical
properties of sucrose and glucose were described in Section 3.2.4, as they were used for the
flat sheet membrane experiment as well. Sodium chloride, also known as sea salt was an
additional osmotic agent for the hollow fine fibre membrane experiment. Sodium chloride is
an inorganic salt with chemical formula NaCl. It has the molecular weight of 58.44 g/mol and
density of 2.17 g/cm3.Different solutions were prepared by dissolving the osmotic agents in
deionised water and using combinations of the agents with deionised and brackish water. All
the reagents used in the study were of Laboratory Reagent Grade and the Deionised water
available at the research laboratory was used to prepare different solutions. The following
binary and ternary osmotic agent systems were selected for experiment.
Binary Osmotic Agents Systems:
a. Sucrose / H2O (Deionised water)
b. Glucose / H2O (Deionised water)
c. Sucrose / Sea water (SW)
d. Glucose / Sea water (SW)
e. NaCl / H2O (Deionised water)
Ternary Osmotic Agents Systems:
a. Sucrose + NaCl / ( DW )
b. Sucrose + NaCl / ( BW)
c. Glucose + NaCl / ( DW )
d. Glucose + NaCl / (BW )
The binary organic agent solutions (sucrose + H2O, glucose + H2O; NaCl + H2O) were tested
separately at the same osmotic pressures (10- 60 bar) but different concentrations in order to
achieve the same initial osmotic pressure. Details of the experimental conditions of different
binary osmotic solutions are shown in Table 3.6. The ternary mixtures involving sucrose +
NaCl + H2O and glucose + NaCl / H2O were tested separately at the osmotic pressures of 10,

Saleh Al Aswad Page 84
20, 30, 40 and 50 bar. Details of the experimental conditions of different ternary osmotic
solutions are shown in Table 3.7.
Table 3.6. Experimental Conditions for FO Process: Binary Osmotic Solutions.
OA bar C Ds (g/l) Fw*
NaCl + H2O
10 12.73 DW
15 19.08 DW
20 25.38 DW
30 37.75 DW
40 49.78 DW
50 61.46 DW
Sucrose+ H2O
10 134.2 DW
15 198.29 DW
20 260.66 DW
30 380.66 DW
40 495.1 DW
50 604.65 DW
Glucose + H2O
10 71.15 DW
15 105.4 DW
20 139 DW
30 203.9 DW
40 266.5 DW
50 326.65 DW
*DW stands for deionised water
For all experiments VDs = 20 L , VFW = 20 L

Saleh Al Aswad Page 85
Table 3.7. Experimental Conditions for FO Process: Ternary Osmotic Solutions
OA bar C Ds (g/l) Fw *
Sucrose +NaCl
10 134.2 BW
15 198.29 BW
20 260.66 BW
30 380.66 BW
40 495.1 BW
50 604.65 BW
Glucose +NaCl
10 71.15 BW
15 105.4 BW
20 139 BW
30 203.9 BW
40 266.5 BW
50 326.65 BW
*BW stands for brackish water
3.3.5. Experimental Measurements
The experiments for different draw solutions and feed water types were designed to maintain
a set of specific requirements. For the experiments involving brackish water, the osmotic
pressure was not allowed to exceed 50 bar, and the salinity of the feed water was not allowed
to exceed 5000 ppm using sodium chloride. The osmotic pressure of the draw solution ranged
between 10 and 60 bar. As was mentioned earlier, the osmotic agents had different
concentrations of the solute to maintain 10 bar pressure compared to the overall osmotic
pressure of the system. By doing so, the increase of osmotic pressure is given by only
sucrose, glucose or sodium chloride, respectively.
Quantitative analysis of all the samples of osmotic solutions was performed to estimate the
reverse flux of the membrane that causes diffusion of the solutes to the feed water. The
concentration of sodium chloride was analysed by Ion-Exchange Chromatography. The
analysis was performed by University of Surrey's Chemistry Department. The samples were
analysed by a Dionex IC5000 ion chromatograph after diluting 100 times with deionised
water. The quantitative analysis of sucrose and glucose was carried out by High-Performance
Liquid Chromatography (HPLC), but an interference takes placed in the sucrose analysis by

Saleh Al Aswad Page 86
HPLC was observed in the presence of sodium chloride in the solution. First, the osmotic
pressure of each of the osmotic agent was evaluated followed by the ternary mixture (osmotic
agent and sodium chloride).
Provided below are the combinations of sucrose and sodium chloride with variable
concentrations used in the experiment for the two types of feed waters (deionised and
brackish water) and the measured osmotic pressures.
Table 3.8. Combinations of Sucrose and Sodium Chloride Solutions Used in The Experiment
a. Concentration of sucrose varies, deionised water is the feed
Osmotic pressure Mixture (bar) OA Mixture [g/l] Feed water
∑ bar Sucrose NaCl Sucrose NaCl DW
20 10 10 134.200 12.730 DW
25 15 10 198.290 12.730 DW
30 20 10 260.660 12.730 DW
40 30 10 380.660 12.730 DW
50 40 10 495.100 12.730 DW
60 50 10 604.650 12.730 DW
b. Concentration of sodium chloride varies, deionised water is the feed
Osmotic pressure Mixture (bar) OA Mixture [g/l] Feed Water
∑ bar Sucrose NaCl Sucrose NaCl DW
20 10 10 134.20 12.73 DW
25 10 15 134.20 19.083 DW
30 10 20 134.20 25.380 DW
40 10 30 134.20 37.750 DW
50 10 40 134.20 49.780 DW
60 10 50 134.20 61.460 DW

Saleh Al Aswad Page 87
c. Concentration of sucrose varies, brackish water is the feed
Osmotic pressure Mixture (bar) OA Mixture [g/l] Feed Water
∑ bar Sucrose NaCl Sucrose NaCl BW
20 10 10 134.200 12.730 BW
25 15 10 198.290 12.730 BW
30 20 10 260.660 12.730 BW
40 30 10 380.660 12.730 BW
50 40 10 495.100 12.730 BW
60 50 10 604.650 12.730 BW
d. Concentration of sodium chloride varies, brackish water is the feed
Osmotic pressure Mixture (bar) OA Mixture [g/l] Feed Water
∑ bar Sucrose NaCl Sucrose NaCl BW
20 10 10 134.200 12.73 BW
25 10 15 134.200 19.083 BW
30 10 20 134.200 25.380 BW
40 10 30 134.200 37.750 BW
50 10 40 134.200 49.780 BW
60 10 50 134.200 61.460 BW
Figure 3.9. Osmotic Pressure as a Function of Cconcentration in sucrose-Sodium
Chloride Solution: a) Sodium Chloride concentration fixed and sucrose concentration
Variable; b) Sucrose concentration fixed and sodium chloride concentration
variable.All values obtained by OLI Analyzer software at 25°C.

Saleh Al Aswad Page 88
Provided below are the combinations of glucose and sodium chloride with variable
concentrations used in the experiment for the two types of feed waters (deionised and
brackish water) and the measured osmotic pressures.
Table 3.9. Combinations of Glucose and Sodium Chloride Solutions Used in The Experiment
a. Concentration of glucose varies, deionised water is the feed
Osmotic pressure Mixture (bar) OA Mixture [g/l] Feed water
∑ bar Glucose NaCl Glucose NaCl DW
20 10 10 71.15 12.73 DW
25 15 10 105.4 12.73 DW
30 20 10 139 12.73 DW
40 30 10 203.9 12.73 DW
50 40 10 266.5 12.73 DW
60 50 10 326.65 12.73 DW
b. Concentration of sodium chloride varies, deionised water is the feed
Osmotic pressure Mixture (bar) OA Mixture [g/l] Feed water
∑ bar Glucose NaCl Glucose NaCl DW
20 10 10 71.15 12.73 DW
25 10 15 71.15 19.083 DW
30 10 20 71.15 25.380 DW
40 10 30 71.15 37.750 DW
50 10 40 71.15 49.780 DW
60 10 50 71.15 61.460 DW
c. Concentration of glucose varies, brackish water is the feed
Osmotic pressure Mixture (bar) OA Mixture [g/l] Feed Water
∑ bar Glucose NaCl Glucose NaCl BW
20 10 10 71.15 12.73 BW
25 15 10 105.4 12.73 BW
30 20 10 139 12.73 BW
40 30 10 203.9 12.73 BW
50 40 10 266.5 12.73 BW

Saleh Al Aswad Page 89
60 50 10 326.65 12.73 BW
d. Concentration of sodium chloride varies, brackish water is the feed
Osmotic pressure Mixture (bar) OA Mixture [g/l] Feed Water
∑ bar Glucose NaCl Glucose NaCl BW
20 10 10 71.15 12.73 BW
25 10 15 71.15 19.083 BW
30 10 20 71.15 25.380 BW
40 10 30 71.15 37.750 BW
50 10 40 71.15 49.780 BW
60 10 50 71.15 61.460 BW
3.3.6. Synthesis of Brackish Water and Seawater
The seawater and the brackish waters were synthesized by dissolving NaCl salt in water. To
simulate seawater composition, 30 g of pure NaCl salt was dissolved in one litre of deionised
water, whereas to simulate brackish water composition, 5 g of pure NaCl salt was dissolved
in one litre of deionised water for experimental purposes (Zhang et al. 2014). Brackish water
has more salinity than fresh water, but not as much as seawater.
Figure 3.10. Osmotic pressure as a Function of Concentration in Glucose-Sodium Chloride
Solution: a) Sodium chloride concentration fixed and glucose concentration variable; b) Glucose
concentration fixed and sodium chloride concentration variable. All values obtained by OLI
Analyzer software at 25°C.

Saleh Al Aswad Page 90
3.4. Calculations of FO Performance Parameters
The performance of FO system for different osmotic agent solutions was measured based on
the parameters of water flux (Jw), water permeability (Aw), recovery percentage (% R),
specific energy consumption (SEC) and solute flux (Jw). Additionally net driven pressure (Pn,
bar) was measured to determine the differential osmotic potential between the feed water and
the osmotic agent for its effect on the performance of the FO process.
3.4.1. Water Flux
Water flux (Jw) of feed water through the membrane was estimated by the following
equation:
Where:
QFinis the volumetric flow rate of feed water entering the membrane
QFout is the volumetric flow rate of feed water leaving the membrane
Am is the active surface area of membrane.
Note: the volume of the sugar plus water remained constant throughout the experiment, i.e., 6
litres (weight of sugar + deionised water) due to the close circulation system.
3.4.2. Water Permeability
Water permeability (Aw) through the membrane in the FO process was estimated using the
following equation.
Eqn.3.2
Where
Jw is the water flux
Pn is the net driven pressure (bar) across the membrane surface during the FO process.
Note: this equation assumes that there is no concentration polarisation as the deionised water
was used as feed water with zero salt concentration (no concentration) where its absolute
pressure is zero.

Saleh Al Aswad Page 91
3.4.3. Recovery Percentage
Recovery percentage (% R) of the feed water was estimated using the following equation:
(
)
Where
QFin is the quantity of feed water entering the membrane
QFout is the quantity of water leaving the membrane during the FO process.
3.4.4. Salt Flux
The salt flux [g/(m2.hr]of the diffused osmotic agent was calculated by the following
equation.
Where
CFout is the concentration (g/L)of feed water leaving the membrane
QFout is the volume (L) of feed water leaving the membrane
CFin is the concentration (g/L) of feed water entering the membrane
QFin is the volume (L) of feed water entering the membrane.
3.4.5. Specific Energy Consumption
The specific energy consumption (E)[kWhr/m3]of the FO process was calculated by using the
following equation:
( )
Where:
PDin is the absolute pressure of the draw solution (osmotic agent) entering the membrane.
QDin is the volumetric flow rate (L) of draw solution (osmotic agent) entering the membrane
PFin is the absolute pressure (bar) of the feed water entering the membrane

Saleh Al Aswad Page 92
QFinis the volumetric flow rate (L) of feed water entering the membrane and
QFoutis the volumetric flow rate(L) of feed water leaving the membrane during the FO
process.
3.4.6. Membrane Flow Rate Factor
The membrane flow rate factor (Kf) was calculated as:
Where
Aw is the water flux (L)
Am is the membrane surface area (m2).
3.4.7. Net Driving Pressure
The net driving pressure (Pn) across the membrane was estimated using the following
equation.
Where
P is the net pressure difference
∆π is the osmotic pressure difference across the membrane surface during FO process.
In this equation P was calculated by the following equation:
22
DSoutDSinFWoutFWin PPPPP
Eqn.3.8
22
DSoutDSinFWoutFWin
Eqn.3.9
As the deionised water was used as feed water and its P is equal to zero, the NDP was
calculated from the modified equation:
Eqn.3.10

Saleh Al Aswad Page 93
4. CHAPTER FOUR: RESULTS AND DISCUSSION
4.1 Introduction
This chapter presents the results of the experiments carried out within the current study. The
ultimate purpose of the study was to identify the best combination of an osmotic agent and a
membrane type to provide the most efficient forward osmosis (FO) process performance.
Accordingly, the experiments were carried out to investigate the performance of FO process
using different osmotic agents (glucose and sucrose) and two sets of membranes (nano-
filtration and reverse osmosis flat sheet) under different process conditions (concentration,
flow rates and the temperature). The FO process performance was measured by a number of
specific parameters such as water flux, water permeability, recovery percentage, specific
energy consumption and the salt flux.
The chapter is organised in several distinctive sections. The first section presents the
experiment results for the NF membrane study. Specifically, the results are presented for the
experiments varying osmotic agents’ concentrations, feed water and osmotic agent flow rates,
and feed water and osmotic agent temperatures. The effects were measured for the parameters
of water flux (Jw), percent recovery (%R), water permeability (Aw) and specific energy
consumption (SEC). All the FO parameters were calculated using the equations given in
Chapter 3, specifically, Eqn.3.1 for water flux (Jw), Eqn3.2 for water permeability (Aw),
Eqn.3.3 for recovery percentage (% R), Eqn.3.4 for salt flux (Js), Eqn.3.5 for specific energy
consumption (SEC), Eqn.3.6 for membrane flow rate factor (kf), Eqn.3.7 for net driving
pressure ( ), Eqn.3.8 for pressure difference (∆P) and Eqn.3.9 and 3.10 for net driving
pressure ∆π.
The second section of the chapter reports the results of the same experiments for the reverse
osmosis flat sheet membranes. The third section of the chapter compares the results obtained
for the two sets of membranes. The fourth section of the chapter presents the experiments
results of osmotic agents’ binary and ternary systems. For the binary system using HFFM, the
effects of osmotic pressure differentials are reported verses deionised and seawater feeds. For
the ternary system, the effects of osmotic pressure differentials on percent recovery (%R) and
water flux (Jw) are reported. The chapter concludes with a summary of the experiment results
for all positions described in the chapter.

Saleh Al Aswad Page 94
4.1 NF Membrane Study
The following sections present the results of the experiments using NF membrane and
sucrose and glucose as osmotic agents. In this work, performance of FO process conditions
were manipulated by changing osmotic agents’ concentrations, feed water and osmotic
agents’ flow rates and temperatures. The effects were measured for water flux, water
recovery percentage, water permeability, specific energy consumption and solute flux where
appropriate.
4.1.1TheEffectsofOsmoticAgents’Concentrations
The effect of osmotic agent concentrations was measured for water flux, water recovery
percent (%R), water permeability (Aw), specific energy conception (SEC) and solute flux (Js).
Different concentrations of osmotic agents at the same osmotic pressure values were used in
the FO experiment to determine their effect on the performance of FO process.
4.1.1.1. Effect on the Water Flux
The effect of osmotic agents’ concentrations on water flux is presented in Table 4.1. It can be
seen from the table that as glucose’s concentration increased from 90 to 250 g/L the water
flux decreased from 3.5 to1.5 L/(m2.hr). Correspondingly, as sucrose’s concentration
increased from170 to 400g/L, the water flux decreased from 1.2 to 0.3 L/(m2.hr). The results
of the experiment, therefore, showed overall decrease in water flux as a result of increasing
osmotic agents’ concentrations. The decrease, however, was much sharper for glucose than
for sucrose.
The apparent decrease in water flux as a result of increasing osmotic agents’ concentrations
can be explained by an increase in the osmotic agents’ potential differential and viscosity.
Data in Table 4.2 and Figure 4.1 show the effect of osmotic potential differential on water
flux with a visible decrease in water flux for both osmotic agents as a result of increasing
OPD. Specifically, water flux decreased from 0.8 to 0.3 L/(m2.hr) for sucrose based solution
and from 3.5 to 1.5 L/(m2.hr) for glucose based solution with OPD increase from 12.5 to 32
bar. Likewise, Table 4.3 shows how osmotic agents’ viscosity changed (increased) as a result
of increasing concentration, while results in Table 4.4 show a sharp decrease in water flux for
both osmotic agents as a result of increasing viscosity.

Saleh Al Aswad Page 95
Table 4.1. Effect of Osmotic Agent Concentration on Water Flux, Recovery Percentage, Water Permeability, Specific Energy Consumption and
Solute Flux
Note: temperature was held constant at 25 oC, feed solution and draw solution flow rates were held constant at 2L/min
Sample calculations of the parameters for this table are presented in Appendix A10.
Table 4.2.Effect of Osmotic Pressure Deferential (bar) on Water Flux (Jw)
Sucrose Glucose
Jw Osmotic pressure (bar) Jw Osmotic pressure (bar)
0.8 12.5 3.5 12.5
0.4 25 3 25
0.3 32 1.5 32
Glucose
OA (g/L)
Sucrose
OA(g/L)
Osmotic
Pressure
(bar)
Osmotic
Pressure
(bar)
Water Flux
(Jw)[L/m2.hr]
Recovery Percent
(% R)
Water
Permeability (Aw)[
L/(m2.hr.bar]
Specific Energy
Consumption
(kWhr/m3)
Solute Flux
(Js)[g/(m2.hr]
Glucose Sucrose Glucose Sucrose Glucose Sucrose Glucose Sucrose Glucose Sucrose Glucose Sucrose
90 170 12.3 10.7 3.5 1.2 0.5 2.5 0.3 0.1 0.3 1.2 2.6 2.6
120 200 21.3 12.6 3.5 0.8 0.3 2 0.2 0.07 0.4 1.3 2.6 2.6
180 275 25.0 17.9 3 0.5 0.2 1.3 0.12 0.04 0.5 2.1 2.6 2.6
250 400 28.1 27.5 1.5 0.3 0.15 0.8 0.09 0.03 0.9 3.3 2.6 2.6

Saleh Al Aswad Page 96
Table 4.3.Effect of Osmotic Agents’ Concentration on Viscosity
Table 4.4. Effect of OAs Viscosity on Water Flux
Glucose Sucrose
Jw Viscosity (cP) Jw Viscosity (cP)
3.5 1.55 1 1.89
3.5 1.66 0.8 2
3 1.88 0.5 2.6
1.5 2.22 0.3 3
Sucrose Glucose
OA Con. (g/L) Viscosity (cP) OA Con. (g/L) Viscosity (cP)
139 1.4 50 1.3
203.9 1.8 71.15 1.38
260.7 2.4 105.4 1.44
380.7 3 139 1.4
400 3.1 263.9 1.8
495.1 4.5 266.5 1.99
500 4.6 384 2.3
600 6.8 400 2.5
604.7 6.9 500 3.9
700 8.5 600 5.7

Saleh Al Aswad Page 97
Figure 4.1. Effect of osmotic pressure deferential (bar) on water flux (Jw) with constant
temperature (25 oC) and constant flow rates of feed and draw solutions (2 L/min)
4.1.1.2 Effect on the Water Recovery Percent
The experimental data in Table 4.1 show the effect of osmotic agents’ concentrations on
water recovery percentage. It can be seen from the table that as glucose concentration
increased from 90 to 250 g/L, the water recovery percentage decreased from 0.5 to 0.15%.
Correspondingly, when sucrose concentration increased from 170 to 400 g/L, the water
recovery percentage decreased from 2.5% to 0.8%. The results of the experiment indicated
that water recovery percentage decreased with increasing the sucrose and glucose osmotic
agents’ concentrations versus deionised feed water. At the same time, the decrease was much
sharper for sucrose than for glucose.
4.1.1.3. Effect on the Water Permeability
The experimental data in Table 4.1 show the effect of osmotic agents’ concentrations on
water permeability (Aw). It can be seen from the table that as glucose concentration increased
from 90 to 250 g/L, the water permeability (Aw) decreased from 0.3 to 0.08 L/(m2.hr.bar).
Correspondingly, as sucrose concentration increased from 170 to 400g/L, the water
permeability decreased from 0.1 to 0.03 L/(m2.hr.bar). The results of the experiment showed
that in general an increase in osmotic agents’ concentrations leads to lower water
permeability. Because with increasing concentration, the viscosity of the solution increases
and that leads to the mobility of water molecules of dense solutions becomes less across the
0
0.5
1
1.5
2
2.5
3
3.5
4
4.5
10 12.5 15 17.5 20 22.5 25 27.5 30 32.5 35
J w (
L (
m2.h
r)
Osmotic pressure deferential (∆𝜋 in bar)
Sucrose OA
Glucose OA

Saleh Al Aswad Page 98
semi permeable membrane .The relative low decrease for sucrose may be due to less effect of
increasing concentration on the solution viscosity as sucrose is initially more viscous than
glucose .
4.1.1.4 Effect on the Specific Energy Consumption
The experimental data in Table 4.1 show the effect of osmotic agents’ concentrations on the
specific energy consumption (SEC). It can be seen from the table that as glucose
concentration increased from 90 to 250 g/L, the SEC increased from 0.3to 0.9 kWhr/m3.
Correspondingly, as sucrose concentration increased from 170 to 400g/L, the specific energy
consumption increased from 1.2to 3.3 kWhr/m3.When the concentration of osmotic agent is
increased simultaneously, the solution becomes more viscous this led to reduce the water
flux.
4.1.1.5 Effect of OA Concentration on the Solute Flux
The experimental data in Table 4.1 show the effect of osmotic agents’ concentrations on the
solute flux diffusion (Js). It can be seen from the table that as glucose concentration increased
from 90 to 250 g/L, the solute flux remained constant at 2.6 g/(m2.hr). The same results were
obtained while changing the concentration of sucrose from 170 to 400g/L. Therefore, the
results of the experiment showed that osmotic agent concentration has constant effect on
solute flux.
4.1.1.6. Discussion
The study on the effect of osmotic agent concentration showed that parameters such as Jw, %
R, Aw decreased, while the SEC increased and the Js remained constant. As explained earlier,
increasing concentration of OAs increases the osmotic potential (driving force: ∆π) on the
active layer side of the membrane surface thus resulting in a decreasing trend of all these
parameters except SEC and Js when the concentration of OAs was increased. These effects
may be attributed to osmotic pressure differential across the membrane surface as a result of
the concentration polarisation and the NF membrane properties such as pore space and
structure.
As was discussed in Section 2.4.5 of this thesis, when the solute particles accumulate on the
thin layer near the membrane surface, the concentration polarisation occurs which affects the

Saleh Al Aswad Page 99
different FO parameters (McCutcheon and Elimelech 2006; Sablani et al. 2001; Zhao and
Zou 2011). Due to membrane processes such as diffusion, osmotic pressure potential,
movement of water molecules across the membrane surface, the concentration polarisation is
one of the major factors limiting the reduction of permeate flux (McCutcheon and Elimelech
2006; Zhao and Zou 2001). In the experiment process applied for this study, concentration
polarisation was the outcome of the concentration difference between the feed and the draw
solutions. NF membrane pore space and structure also contributed to osmotic pressure
differential. NF membranes are often considered “loose membranes” because of relatively
large pore size that increase water permeability but also have lower recovery percentage
(Pabby et al., 2015).
4.1.2 The Effects of Feed Water Flow Rate
The effect of feed water flow on water flux, water recovery percentage, water permeability,
specific energy consumption and solute flux were measured. The results are summarized in
Table 4.5.
4.1.2.1. Effect on the Water Flux
The experimental data in Table 4.5 show the effect of feed water flow rate on the water flux.
It can be seen from the table that as deionised feed water flow rate was increased from 2 to 4
L/min for sucrose and glucose osmotic agents, the water flux increased from 0.4 to 1.4
(L/m2.hr) and from 0.1 to 0.5 L/(m
2.hr) , respectively. Therefore, the results of the experiment
showed that increase in feed water flow rate leads to an increase in the water flux for both
types of osmotic agents. For sucrose, however, the initial flow rate and the following water
flux rate increase were higher.
4.1.2.2 Effect on the Water Recovery Percent
The experimental data in Table 4.5 show the effect of feed water flow rate on the water
recovery percent. It can be seen from the table that as deionised feed water flow rate was
increased from 2 to 4 L/min for sucrose and glucose osmotic agents, the water recovery
percentage increased from 0.1% to 1.0 % when using glucose as an osmotic agent and
increased from 0.01% to 0.05 % when using sucrose as an osmotic agent. The results of the
experiment showed in general higher water flow rates lead to an increased water recovery
percentage when using both osmotic agents.

Saleh Al Aswad Page 100
4.1.2.3 Effect on the Water Permeability
The experimental data in Table 4.5 show the effect of feed water flow rate on the water
permeability. It can be seen from the table that as deionised feed water flow rate was
increased from 2 to 4 L/min for sucrose and glucose osmotic agents, the water permeability
increased from 0.005 to 0.02 L/(m2.hr.bar) when glucose was used as an osmotic agent, and
increased from 0.01 to 0.05 L/(m2.hr.bar) when sucrose was used as an osmotic agent. The
results of the experiment showed in general higher water flow rates lead to an increased water
permeability when using both osmotic agents. This difference in the water permeability may
be attributed to the increasing osmotic pressure of sucrose than glucose which caused high
water permeability for sucrose with increasing the flow rate than glucose osmotic agent.
4.1.2.4 Effect on the Specific Energy Consumption
The experimental data in Table 4.5 show the effect of feed water flow rate on the specific
energy consumption. It can be seen from the table that as deionised feed water flow rate was
increased from 2 to 4 L/min for sucrose and glucose osmotic agents, the specific energy
consumption decreased from 12 to 1.8 kW.hr/m3
when sucrose was used as an osmotic agent
and decreased from 2.2 to 0.6 kW.hr/m3 when glucose was used as an osmotic agent. The
results of the experiment showed that in general an increase in the feed water flow rate leads
to the lower degree of the specific energy consumption. There was a very sharp decrease
when sucrose was used as an osmotic agent, and a moderate decrease when glucose was used
as an osmotic agent.

Saleh Al Aswad Page 101
Table 4.5.Effect of Feed Water Flow Rate on Water Flux, Recovery Percentage, Water Permeability, Specific Energy Consumption and Solute
Flux
Note: the results were obtained at constant temperature (25 oC) and osmotic agent concentration (275and 200 g/L) for sucrose and glucose
respectively .
Flow
Rate
(L/min)
Water Flux
(Jw)[L/(m2.hr]
Recovery Percent
(% R)
Water Permeability
(Aw)[L/(m2.hr.bar]
Specific Energy
Consumption
(kWhr/m3)
Solute Flux
(Js)[g/(m2.hr)]
Glucose Sucrose Glucose Sucrose Glucose Sucrose Glucose Sucrose Glucose Sucrose
2 0.1 0.4 0.1 0.01 0.005 0.01 2.2 12 2.6 2.6
2.5 0.15 0.6 0.15 0.01 0.002 0.01 1.5 8 2.6 2.6
3 0.2 0.8 0.2 0.02 0.003 0.02 1 5 2.6 2.6
3.5 0.4 1.1 0.4 0.03 0.01 0.03 0.64 3 2.6 2.6
4 0.5 1.4 1.0 0.05 0.02 0.05 0.6 1.8 2.6 2.6

Saleh Al Aswad Page 102
4.1.2.3. Effect on the Solute Flux
The experimental data in Table 4.5 show the effect of feed water flow rate on the solute flux
(Js). It can be seen from the table that as deionised feed water flow rate was increased from 2
to 4L/min for sucrose and glucose osmotic agents, the solute flux remained the same at 2.6
g/(m2.hr). Therefore, the results of the study showed that feed water flow rate had constant
effect on solute flux for either of the osmotic agents with the NF membrane.
4.1.2.4. Discussion
It can be seen from the feed water flow rate study that the values of all the FO parameters
namely Jw, % R, Aw increased, while the SEC decreased when the feed water flow rate
increased from 2 to 4 L/min, while the Js remained constant. Similar conclusions were
reported by McCutcheon (2006) who stated that concentrative ECP on the feed side of the
membrane has a minor effect on the driving force (∆π) unless the feed concentration or the
permeate flux is relatively high. He also mentioned that increasing the feed water flow rate
decreases the concentrative ECP effect on the feed side of the membrane which will allow
more water flow through the membrane pores coupled with increasing the osmotic pressure
of the feed water near the membrane surface.
4.1.3. TheEffectsofOsmoticAgents’Flowrate
The effect of osmotic agents’ flow rate on water flux, water permeability and solute flux was
measured when using sucrose and glucose osmotic agents versus deionised water. Table 4.6
summarises the outcomes of the experiments.
4.1.3.1. Effect on the Water Flux
The experimental data in Table 4.6 show the effect of osmotic agent’s flow rate on the water
flux. It can be seen from the table that as the OA’s flow rate increased from 2 to 4 L/min, the
water flux rate increased from 0.2 to 0.6 L/(m2.hr) when sucrose was used as an osmotic
agent and increased from 0.4 to 0.9 L/(m2.hr)when glucose was used as an osmotic agent.
This may be due to high ratio of flow rate on draw solution osmotic potential difference
across the membrane surface with increasing the flow rate. This may be due to the ratio of
feed water to draw solution tended to rinse the experimental setup.

Saleh Al Aswad Page 103
4.1.3.2. Effect of Recovery Percentage
The data in Table 4.6 illustrate the effect of osmotic agent flow rate on recovery percentage.
It can be seen from the table that as the OA flow rate increased from 2 to 4 L/min, the
recovery percentage increased from 0.2 to 0.9 % when sucrose was used as osmotic agent and
it increased from 0.1 to 0.5 % when glucose was used as an osmotic agent. It appears from
the experimental results that generally, the recovery percentage showed increasing trend with
increasing the osmotic agent’s flow rate. However, the initial and the final recovery
percentage were higher when sucrose was used as an osmotic agent.
4.1.3.3. Effect on the Water Permeability
The experimental data in Table 4.6 show the effect of osmotic agent’s flow rate on the water
flux. It can be seen from the table that as the OA flow rate increased from 2 to 4 L/min, the
water permeability rate increased from 0.07 to 0.3 L/(m2.hr.bar) when sucrose was used as an
osmotic agent and increased from 0.1 to 0.35 L/(m2.hr.bar)when glucose was used as an
osmotic agent. The results of the experiment showed that in general, an increase of the
osmotic agents’ flow leads to a higher water permeability rate. The initial and the final water
permeability rates were higher when glucose was used as an osmotic agent.

Saleh Al Aswad Page 104
Table 4.6. Effect of Osmotic Agent Flow Rate on Water Flux, Recovery Percentage, Water permeability, Specific Energy Consumption and
Solute Flux
Note: the results were obtained at constant temperature (25 oC) and osmotic agent concentration (275 and 200 g/L) for both sucrose and glucose
respectively
Flow
Rate
(L/min)
Water Flux
(Jw)[L/(m2.hr)]
Recovery Percent
(% R)
Water
Permeability
(Aw)[L/(m2.hr.bar)]
Specific Energy
Consumption
(kWhr/m3)
Solute Flux
(Js)[g/(m2.hr)]
Glucose Sucrose Glucose Sucrose Glucose Sucrose Glucose Sucrose Glucose Sucrose
2 0.4 0.2 0.1 0.2 0.1 0.07 3.17 7.8 2.6 2.6
2.5 0.45 0.25 0.15 0.3 0.15 0.11 2 4.45 2.6 2.6
3 0.55 0.35 0.2 0.45 0.2 0.15 1.6 3 2.6 2.6
3.5 0.65 0.45 0.32 0.66 0.25 0.2 1.2 2 2.6 2.6
4 0.9 0.6 0.5 0.9 0.35 0.3 1.04 1.5 2.6 2.6

Saleh Al Aswad Page 105
4.1.3.4. Effect on Osmotic Agent Flow Rate on Specific Energy Consumption (SEC)
The results in Table 4.6 show the effect of osmotic agent flow rate on specific energy
consumption. It is evident from Table 4.6 that the SEC decreased from 7.8 to 1.5 kW.hr/m3
when the sucrose osmotic agent flow rated increased from 2 to 4 L/min, the SEC decreased
from 3.17 to 1.04 kW.hr/m3 when the glucose osmotic agent flow rate increased from 2 to 4
L/min. Overall, it was observed that the initial and the final SEC decrease was more when
using sucrose osmotic agent compared to glucose osmotic agent with corresponding increase
in osmotic agent flow rate from 2 to 4 L/min.
4.1.3.5 Effect on the Solute Flux
The experimental data in Table 4.6 show the effect of osmotic agent’s flow rate on the solute
flux. It can be seen from the table that as the osmotic agent’s flow rate increased from 2 to 4
L/min, the solute flux remained constant at 2.6 g/(m2.hr) Therefore, the results of the study
indicated that osmotic agent’s flow rate had constant effect on solute flux for either of the
osmotic agents with the NF membrane. This could be attributed to the type of membrane used
in this study and the nature of solute molecules of both the osmotic agents.
4.1.3.6. Discussion
It was observed from the OAs flow rate study that the values of FO parameters such as Jw,
Aw, % R increased, while the SEC decreased and Jw remained constant. The constant increase
in Jw, Aw and % R is due to the increased osmotic pressure differential (OPD) across the NF
membrane surface with increasing OAs flow rate. Correspondingly the SEC requirement
decreased for efficient FO performance. According to Cath et al. (2006), the negative effect
of ECP on flux can be decreased by either optimizing the flow rate or by increasing the
overall flow velocity. They also stated that ICP is similar to ECP process, with the only
difference that it takes place within the membrane porous layer, and is considered as one of
the major issues in osmotically-driven membrane processes.
4.1.4 The Effects of Feed Water Temperature
The effect of feed water temperature on water flux, water recovery percent, water
permeability, specific energy consumption and solute flux were measured using sucrose and
glucose osmotic agent versus deionised water in NF membrane. The results of the
experiments are demonstrated in Table 4.7.

Saleh Al Aswad Page 106
4.1.4.1. Effect on Water Flux
The experimental data in Table 4.7 show the effect of feed water temperature on water flux. It
can be seen from the table that as the temperature increased from 20 to 35 oC, the water flux
increased from 0.2 to 0.8L/(m2.hr)when sucrose was used as an osmotic agent and increased
from 0.5 to 1.1L/(m2.hr)when glucose was used as an osmotic agent. Therefore, the results of
the experiment indicated that in general an increase in feed water temperature leads to an
increase in water flux for both types of osmotic agents. However, both the initial and the final
water flux rates were higher for the processes involving glucose as an osmotic agent.
4.1.4.2. Effect on the Water recovery percentage
The experimental data in Table 4.7 show the effect of feed water temperature on water
recovery percentage. It can be seen from the table that as the temperature increased from 20
to 35 oC, the water recovery percentage increased from 0.5 % to 2.7 % when sucrose was
used as an osmotic agent and increased from 0.8 % to 4.0 % when glucose was used as an
osmotic agent. Therefore, the results of the experiment showed that in general an increase in
feed water temperature leads to an increase in water recovery percentage for both types of
osmotic agents. Because as the temperature of the solution increases, the speed and
movement of water molecules as well as the diffusion rate increases across the membrane
surface thus resulting in high water recovery percentage compared to low temperature
solutions in FO process. Also, the effect of temperature is more on glucose than sucrose due
to the difference in viscosity between the two osmotic agent solutions.

Saleh Al Aswad Page 107
Table 4.7. Effect of Feed Water Temperature on Water Flux, Recovery Percentage, Water permeability, Specific Energy Consumption and Solute
Flux
Note: the results were obtained at constant feed and draw solution flow rates (2 L/min) and osmotic agent concentrations (200 and 250 g/L) for
both sucrose and glucose respectively
Temperature
(o C)
Water Flux
(Jw)[L/(m2.hr)]
Recovery Percent
(% R)
Water Permeability
(Aw)[L/(m2.hr.bar)]
Specific Energy
Consumption
(kW.hr/m3)
Solute Flux
(Js)[g/(m2.hr)]
Glucose Sucrose Glucose Sucrose Glucose Sucrose Glucose Sucrose Glucose Sucrose
20 0.5 0.2 0.8 0.5 0.02 0.08 8.0 6.5 2.6 2.6
25 0.6 0.25 1.5 0.7 0.15 0.18 5 3.5 2.6 2.6
30 0.8 0.4 2.5 1 0.25 0.28 2.5 2 2.6 2.6
35 1.1 0.8 4.0 2.7 0.4 0.6 1.5 1.1 2.6 2.6

Saleh Al Aswad Page 108
4.1.4.3 Effect on the Water Permeability
The experimental data in Table 4.7 show the effect of feed water temperature on water
permeability. It can be seen from the table that as the temperature increased from 20 to 35 oC,
the water permeability increased from 0.08 to 0.6 L/(m2.hr.bar) when sucrose was used as an
osmotic agent and increased from 0.02 to 0.4 L/(m2.hr.bar) when glucose was used as an
osmotic agent. Therefore, the results of the experiment showed that in general an increase in
feed water temperature leads to an increase in water permeability for both types of osmotic
agents. Similar to the effect of temperature on water recovery percentage, the water
permeability showed increases with increasing the temperature mainly due to its effect on
speed and movement of water molecules, diffusion rate and the potential difference across the
membrane surface resulting in higher water permeability of glucose osmotic agent.
4.1.4.4 Effect on the Specific Energy Consumption
The experimental data in Table 4.7 show the effect of feed water temperature on the specific
energy consumption. It can be seen from the table that as the temperature increased from 20
to 35 oC, the energy consumption decreased from 6.5 to 1.1 kWhr/m
3 when sucrose was used
as an osmotic agent and decreased 8.0to1.5 kWhr/m3 when glucose was used as an osmotic
agent. Therefore, the results of the experiment showed that in general an increase in feed
water temperature leads to a decrease in specific energy consumption for both types of
osmotic agents. Since the increase of temperature mainly effects the rate of diffusion ,speed
and movement of water molecules and osmotic potential difference across the membrane
surface. Therefore, less energy is required for efficient performance of FO process using
glucose osmotic agent than sucrose.
4.1.4.5 Effect on the Solute Flux
The experimental data in Table 4.7 show the effect of feed water temperature on the solute
flux. It can be seen from the table that as the temperature increased from 20 to 35 oC, the
solute flux remained constant at 2.6 g/(m2.hr) for both types of osmotic agents. Therefore, the
results of the experiment showed that there was constant effect of feed water temperature on
the solute flux.

Saleh Al Aswad Page 109
4.1.4.6. Discussion
It was found from the feed water temperature study that water flux, water permeability and
recovery percentage increased, the specific energy consumption decreased and the solute flux
was not affected with increasing the FO process temperature from 20 to 35oC. Higher
temperatures in osmotic processes have been found to positively affect the major’s market
parameters. Phuntsho et al. (2012) reported an average increase in the water flux by up to 1.2
% for each degree rise in temperature from 25to 35oC, but this increase was around 2.3 %
with increasing the temperature from 25to 45oC. In another study, You et al. (2012) found a
positive correlation between water flux and the bulk solution temperature ranging between
20-40oC. The positive effect of feed water temperature on osmotic parameters is often
explained by increases in the diffusion coefficients resulting from decreasing viscosity of the
solutions (Nayak and Rastogi 2011; Petrotos et al. 1998). This leads to higher permeability of
water through the membrane. However, higher diffusion rates also apply for salts in this case,
which leads to lower salt rejection rate. Furthermore, it is extremely important that the
membrane can tolerate higher temperatures (Pabby et al. 2015).
4.1.5 The Effects of OsmoticAgents’Temperatures
The effect of osmotic agent temperature was measured for water flux, water recovery percent,
water permeability, specific energy consumption and solute flux. The results of the
experiments are presented in Table 4.8.
4.1.5.1. Effect on the Water Flux
The experimental data in Table 4.8 show the effect of osmotic agents’ temperatures on the
water flux. It can be seen from the table that as the temperature increased from 20 to 35 oC,
the water flux increased from 0.1 to 0.15 L/(m2.hr)when sucrose was used as an osmotic
agent and increased from 0.11 to 0.17 L/(m2.hr)when glucose was used as an osmotic agent.
Therefore, the results of the experiment showed that in general an increase in osmotic agents’
temperatures leads to an increase in water flux for both types of osmotic agents. However,
both the initial and the final permeability rates were higher for the processes involving
glucose as an osmotic agent.

Saleh Al Aswad Page 110
Table 4.8. Effect of OA Temperature on Water Flux, Recovery Percentage, Water Permeability, Specific Energy Consumption and Solute Flux
Note: the results were obtained at constant feed and draw solution flow rates (2 L/min) and osmotic agent concentration (200 and 250 g/L) for
both sucrose and glucose respectively
Temperature
(o C)
Osmotic
Pressure
(bar)
Osmotic
Pressure
(bar)
Water Flux
(Jw)[L/(m2.hr)]
Recovery Percent
(% R)
Water
Permeability
(Aw)[L/(m2.hrbar)]
Specific Energy
Consumption
(kWhr/m3)
Solute Flux
(Js)[g/(m2.hr)]
Glucose Sucrose Glucose Sucrose Glucose Sucrose Glucose Sucrose Glucose Sucrose Glucose Sucrose
20 12.3 10.7 0.11 0.1 0.2 0.4 0.02 0.01 1.5 1.1 2.6 2.6
25 21.3 12.6 0.13 0.12 0.6 0.8 0.035 0.02 1.43 0.9 2.6 2.6
30 25.0 17.9 0.15 0.135 1 1.3 0.05 0.025 1.35 0.75 2.6 2.6
35 28.1 27.5 0.17 0.15 1.7 2 0.09 0.03 1.2 0.6 2.6 2.6

Saleh Al Aswad Page 111
4.1.5.2 Effect on the Water Recovery Percent
The experimental data in Table 4.8 show the effect of temperature of the draw solution on the
water flux. It can be seen from the table that as the temperature increased from 20 to 35 oC,
the water recovery percent increased from 0.4% to 2 % when sucrose was used as an osmotic
agent and increased from 0.2% to1.7% when glucose was used as an osmotic agent.
Therefore, the results of the experiment showed that in general increase in the temperature of
the draw solution leads to an increase in the water recovery percent. This may be attributed to
the effect of increasing temperature on the physical properties of the various osmotic agents
under study .The main effect of increasing temperature is on the viscosity, speed and
movement of molecules, rate of diffusion and osmotic potential difference across the
membrane surface in FO process.
4.1.5.3 Effect on the Water Permeability
Data in Table 4.8 show the effect of osmotic agent temperature on water permeability. It can
be seen that water permeability increased from 0.02 to 0.09L/(m2.hr.bar) when glucose
osmotic agent was used and increased from 0.01 to 0.03 L/(m2.hr.bar) when sucrose osmotic
agent was used. In both experiments the temperature increased up to 35 oC. Overall, it
appears from the results that increase in water permeability was higher using glucose osmotic
agent compared to sucrose osmotic agent due to the difference in viscosity.
4.1.5.4 Effect on the Specific Energy Consumption
The experimental data in Table 4.8 show the effect of osmotic agents’ temperatures on the
specific energy consumption. It can be seen from the graph that as the temperature increased
from 20 to35oC, the specific energy consumption rate declined from 1.1 to 0.6 kWhr/m
3when
sucrose was used as an osmotic agent and decreased from 1.5 to 1.2 kWhr/m3when glucose
was used as an osmotic agent. Therefore, the results of the experiment showed that in general
increasing the temperature of the draw solution leads to a decrease in special energy
consumption. This may due to the fact that the temperature affects the solution properties
namely speed, movement and diffusion rate of water molecules along with osmotic potential
difference across the membrane surface thus requiring less energy for performance of FO
process compared to low temperature solutions. Since the viscosity of sucrose is higher than
glucose, that is way the effect is clearer for sucrose than glucose agent.

Saleh Al Aswad Page 112
4.1.5.5 Effect on the Solute Flux
The experimental data in Table 4.8 show the effect of temperature of the draw solution on the
solute flux. It can be seen from the graph that as the temperature increased from 20to 35 oC, a
constant solute flux of 2.6 g/(m2.hr) remained when each of the osmotic agents (glucose and
sucrose) was used. Therefore, the experiment results showed constant effect of temperature of
the draw solution on the solute flux.
4.1.5.6. Discussion
It was observed from the results of the study of temperature of the draw solution that FO
parameters such as water flux, recovery percentage and water permeability increased, the
SEC decreased, while the solute flux remained constant . Increasing the temperature of the
SEC deceased, while the temperature of the draw solution increased from 20 to 35 oC. That
the temperature of the draw solutions could substantially affect the outcomes of the emerging
FO was demonstrated elsewhere (Arsuaga et al. 2008; Sharma and Chellam 2006; Xie et al.
2013; Zhao and Zou 2012). The general explanation is that an increase temperature of draw
solutions leads to a decrease in viscosity rates. Draw solutions with lower viscosity
demonstrate higher-level of the solubility and diffusivity coefficients (Xie et al. 2013).
Accordingly, the outcomes of these study shown in Figure 4.24 indicated that the viscosity of
both the glucose and sucrose decline with rising the temperature in FO process. Therefore,
the flow of the experiment and its outcomes confirmed the previously reported findings.
4.1.6. Overview of the NF Membrane System Results
Several conclusions are drawn from this experiment for the NF membrane (Table 4.9). First,
it can be concluded that for the given osmotic agents (sucrose and glucose) and the given
membrane (NF) changes applied for feed water had better effect on the process outcomes.
With the changes to feed water flow and temperature, the experiments in both cases
demonstrated increases in water flux, water recovery rates and water permeability while also
leading to lower specific energy consumption levels. Changes applied to draw solutions
resulted in worsening of at least one measured parameter. Specifically, changes in draw
solution flow rate and temperature resulted in higher energy consumption, while changes to
draw solution concentration levels resulted in decline of all relevant parameters. Overall, it
can be concluded that manipulation of the forward osmosis process for the NF filtration

Saleh Al Aswad Page 113
membrane can improve effectiveness of the FO process across all relevant parameters. The
only factor that is not desirable for increase is the draw solution concentration.
Another important conclusion is that neither glucose nor sucrose showed greater comparative
efficacy as an osmotic agent for the NF membrane. Alhemiri et al. (2009) recommended that
the best osmotic agent for FO should be based on the water flux parameter. Glucose showed
better flux in comparison to sucrose for NF membrane in all cases except for increase in feed
water flow. At the same time, glucose-based draw solutions did not show superiority over
sucrose-based solutions across all measured parameters when the relevant factors were
manipulated during the experiment. Therefore, from the results of this research, it can be
concluded that neither sucrose nor glucose are effective as osmotic agents for NF membranes.
Table 4.9. Results of Changes of Manipulated FO Factors on Key Measured Parameters of the
Process: NF Membrane
Parameter
Change
Water Flux Water Recovery
Rate
Water
Permeability
Specific Energy
Consumption
Solute Flux
Increase in DS
concentration
Decreased
Glucose superior
Decreased
Sucrose superior
Decreased
Glucose superior
Increased
Glucose superior
No change
Increase in FW
flow rate
Increased
Sucrose superior
Increased
Glucose superior
Increased
Sucrose superior
Decreased
Glucose superior
No change
Increase in DS
flow rate
Increased
Glucose superior
Increased
Sucrose superior
Increased
Glucose superior
Decreased
Glucose superior
No change
Increase in FW
temperature
Increased
Glucose superior
Increased
Sucrose superior
Increased
Sucrose superior
Decreased
Sucrose superior
No change
Increase in DS
temperature
Increased
Glucose superior
Increased
Sucrose superior
Increased
Glucose superior
Decreased
Sucrose superior
No change
4.2. RO Flat Sheet Membrane Study
The following sections present the results of the experiments when using RO membrane and
sucrose and glucose as osmotic agents verses deionised water. The FO process conditions
were manipulated by changing osmotic agents’ concentrations, feed water and osmotic
agents’ flow rates and temperatures. The effects were measured for water flux, percent
recovery, water permeability, specific energy consumption and solute flux where appropriate.
4.2.1.TheEffectsofOsmoticAgents’Concentrations
The effect of osmotic agent concentrations was measured for water flux (Jw), water recovery
percent (%R), water permeability (Aw), specific energy conception (SEC) and solute flux (Js).
Different concentrations for the osmotic agents were used to obtain the same osmotic

Saleh Al Aswad Page 114
pressure in the FO experiment to determine their effect on the performance of FO process.
The results of the experiment are provided in Table 4.10.
4.2.1.1. Effect on the Water Flux
The effect of osmotic agents’ concentrations on water flux is Table 4.10. It can be seen from
the table that as glucose’s concentration increased from 90 to 250 g/L the water flux
decreased from 2.0 to 0.3L/(m2.hr). Correspondingly, as sucrose’s concentration increased
from 170 to 400g/L, the water flux decreased from 3.7 to 0.9 L/(m2.hr). The results of the
experiment, therefore, showed overall decrease in water flux as a result of increasing osmotic
agents’ concentrations. The processes with both osmotic agents showed a decreasing trend in
water flux as osmotic concentrations increased. Because with increasing the concentration,
the osmotic potential difference between the active layer and the support layer increases
across the membrane surface thus resulting in low water flux. Similarly in Table 4.11, the
water flux showed a decreasing trend as increase in osmotic potential difference (bar) across
the membrane surface. Since RO membrane is a compact membrane, the effect of increasing
concentration is clearer than using NF membrane being a loose membrane.

Saleh Al Aswad Page 115
Table 4.10. Effect of Osmotic Agent Concentration on Water Flux, Recovery Percentage, Water permeability, Specific Energy Consumption and
Solute Flux
Note: the results were obtained at constant temperature (25 oC) and feed and draw solution flow rates (2 L/min)
Table 4.11. Effect of Osmotic Pressure Differential on Water Flux
Osmotic Pressure (bar) Sucrose Glucose
Water Flux (Jw)
12.9 3.7 2
15.5 3 1.5
25.3 1.8 0.5
31.6 0.9 0.3
Glucose
OA (g/L)
Sucrose
OA(g/L)
Osmotic
Pressure
(bar)
Osmotic
Pressure
(bar)
Water Flux
(Jw)[L/(m2.hr)]
Recovery Percent
(% R)
Water Permeability
(Aw)[L/(m2.hr.bar)]
Specific Energy
Consumption
(kWhr/m3)
Solute Flux
(Js)[g/m2.hr)]
Glucose Sucrose Glucose Sucrose Glucose Sucrose Glucose Sucrose Glucose Sucrose Glucose Sucrose
90 170 12.3 10.7 2 3.7 0.5 2 0.1 0.7 1 2.9 2.6 2.6
120 200 21.3 12.6 1.5 3 0.4 1.7 0.096 0.4 0.98 3 2.6 2.6
180 275 25.0 17.9 0.5 2 0.265 1 0.06 0.2 1.3 4 2.6 2.6
250 400 28.1 27.5 0.3 0.9 0.13 0.3 0.04 0.1 2 5.6 2.6 2.6

Saleh Al Aswad Page 116
4.2.1.2. Effect on the Percent of Water Recovery
The experimental data in Table 4.10 show the effect of osmotic agents’ concentrations on
water recovery percentage. It can be seen from the table that as glucose concentration
increased from 90 to 250 g/L, the water recovery percentage (% R) decreased from 0.5% to
0.13 %. Correspondingly, when sucrose concentration increased from 170 to 400 g/L, the
water recovery percentage decreased from 2.0% to 0.3 % when glucose concentration
increased from 90 to 250 g/L. The results of the experiment indicated that water recovery
percentage decreased more when sucrose osmotic agent was used compared to glucose
osmotic agent.
4.2.1.3. Effect on the Water Permeability
The experimental data in Table 4.10 show the effect of osmotic agents’ concentrations on
water permeability (Aw). It can be seen from the table that as glucose concentration increased
from 90 to 250 g/L, the water permeability (Aw) decreased from 0.1 to 0.04L/(m2.hr.bar).
Correspondingly, as sucrose concentration increased from 170 to 400g/L, the water
permeability decreased from 0.7 to 0.1 L/(m2.hr.bar).The results of the experiment showed
that in general an increase in osmotic agents’ concentrations leads to lower water
permeability. For the processes involving sucrose as an osmotic agent, however, the decrease
was much sharper.
4.2.1.4. Effect on the Specific Energy Consumption
The experimental data in Table 4.10 show the effect of osmotic agents’ concentrations on the
specific energy consumption (SEC). It can be seen from the table that as glucose
concentration increased from 90 to 250 g/L, the specific energy consumption SEC increased
from 1.0 to 2.0 kWhr/m3. Correspondingly, as sucrose concentration increased from 170 to
400g/L, the specific energy consumption increased from 2.9 to 5.6 kWhr/m3. In general, the
results of the experiment showed that sucrose and glucose as osmotic agents provided
different effects on the specific energy consumption. This may be due to the difference in the
viscosity of the osmotic agents. With the higher viscosity, sucrose requires higher energy
levels to maintain an efficient FO process performance.

Saleh Al Aswad Page 117
4.2.1.5. Effect on the Solute Flux
The experimental data in Table 4.10 show the effect of osmotic agents’ concentrations on the
solute flux (Js). It can be seen from the table that as glucose concentration increased from 90
to 250 g/L, the solute flux remained constant at 2.6 g/(m2.hr).The same results were obtained
while changing the concentration of sucrose from 170 to 400g/L. Therefore, the results of the
experiment showed that both osmotic agents concentration has constant effect on solute flux.
4.2.1.6. Discussion
The data in Table 4.10 indicate a decline in water flux, recovery percentage and water
permeability, an increase in specific energy consumption, but no response on solute flux
when the OAs concentration was increased from 70 to 250 g/L for glucose and 170 to 400
g/L for sucrose. As was in case with the NF membrane discussed above, increasing the OAs
concentration increases the osmotic pressure differential affecting the ICP and ECP in the
vicinity of the membrane surface which resulted in a decrease in some parameters except an
increase in SEC requirement for efficient FO performance. However, it is interesting to note
that solute flux was not affected, but remained constant with increasing the concentration for
both OAs (glucose and sucrose). Also, sensitivity of sugars (sucrose and glucose) is not
affected by the OAs concentration, but is mainly related to flux, and the set-up which
produces the highest flux, generally generates the lowest draw solution sensitivity. The study
findings agree with those of McCutcheon et al. (2005) who reported that FO is promising to
achieve high rate water fluxes and water recovery with increasing OAs concentration thus
significantly reducing the amount of rejected brine and the required post-treatment facilities.
They further indicated a significant improvement in relation to RO in terms of being
environment friendly. Sucrose based OA in this experiment showed better performance in
terms of water flux, recovery and permeability; however, it also consumed higher amounts of
energy.
4.2.2. The Effects of Feed Water Flow rate
The effect of feed water flow rate was measured for water flux (Jw), water recovery percent
(%R), water permeability (Aw), specific energy conception (SEC) and solute flux (Js). The
results of the experiments are demonstrated in Table 4.12.

Saleh Al Aswad Page 118
Table 4.12. Effect of Feed Water Flow Rate on Water Flux, Recovery Percentage, Water Permeability, Specific Energy Consumption and Solute
Flux
Note: The results were obtained at constant temperature (25 oC) and osmotic agent concentration (275 and 200 g/L) for both sucrose and glucose
respectively
Flow
Rate
(L/min)
Water Flux
(Jw)[L/(m2.hr)]
Recovery Percent
(% R)
Water Permeability
(Aw)[L/(m2.hr.bar)]
Specific Energy
Consumption
(kWhr/m3)
Solute Flux
(Js)[g/(m2.hr)]
Glucose Sucrose Glucose Sucrose Glucose Sucrose Glucose Sucrose Glucose Sucrose
2 0.09 0.89 0.5 4.3 0.02 0.1 3.1 0.7 2.6 2.6
2.5 0.25 1.3 0.7 5.5 0.06 0.25 2.39 0.85 2.6 2.6
3 0.5 1.5 1 6.5 0.08 0.34 1.69 1 2.6 2.6
3.5 0.7 1.7 1.17 7 0.1 0.43 1.1 1.5 2.6 2.6
4 0.9 1.8 1.3 7.5 0.2 0.5 1.0 2 2.6 2.6

Saleh Al Aswad Page 119
4.2.2.1. Effect on the Water Flux
The experimental data in Table 4.12 show the effect of feed water flow rate on the water flux.
It can be seen from the table that as deionised feed water flow rate was increased from 2 to 4
L/min for sucrose and glucose osmotic agents, the water flux increased from 0.89 to 1.8
L/(m2.hr) and from 0.09 to 0.9 L/(m
2.hr) respectively. Therefore, the results of the experiment
showed that increase in feed water flow rate leads to an increase in the water flux for both
types of osmotic agents. For sucrose, however, the initial flow rate and the following water
flux rate increase were higher. The range of water flux increase was also higher for the
processes where sucrose was used as an osmotic agent.
4.2.2.2. Effect on the Water Recovery Percentage
The experimental data in Table 4.12 show the effect of feed water flow rate on the water
recovery percent. It can be seen from the table that as deionised feed water flow rate was
increased from 2 to 4 L/min for sucrose and glucose osmotic agents, the water recovery
percentage (%R) increased from 4.3 % to 7.5% when using sucrose as an osmotic agent and
increased from 0.5% to 1.3% when using glucose as an osmotic agent. The results of the
experiment showed that in general higher water flow rates lead to an increased water
recovery when using both osmotic agents. However, the initial and the final recovery rates for
sucrose were higher than for glucose at the same osmotic pressures. This could be due to the
difference in viscosity between these two solutions at the same concentration.
4.2.2.3. Effect on the Water Permeability
The experimental data in Table 4.12 show the effect of feed water flow rate on the water
permeability. It can be seen from the table that as deionised feed water flow rate was
increased from 2 to 4 L/min for sucrose and glucose osmotic agents, the water permeability
increased from 0.02 to 0.2 L/(m2.hr.bar) when glucose was used as an osmotic agent, and
increased from 0.1 to 0.5 L/(m2.hr.bar) when sucrose was used as an osmotic agent. The
results of the experiment showed in general higher water flow rates lead to an increased water
permeability when using both osmotic agents. However, the initial and the final permeability
rates for sucrose were higher than for glucose at the same osmotic pressures. The processes
where sucrose was used as an osmotic agent also showed a steeper increase in the water
permeability rate.

Saleh Al Aswad Page 120
4.2.2.4. Effect on the Specific Energy Consumption
The experimental data in Table 4.12 show the effect feed water flow rate on the specific
energy consumption. It can be seen from the table that as deionised feed water flow rate was
increased from 2 to 4 L/min for sucrose and glucose osmotic agents, the specific energy
consumption decreased from 3.1 to 1.0 kWhr/m3when glucose was used as an osmotic agent
and slightly increased from 0.7 to 2 kWhr/m3when sucrose was used as an osmotic agent.
This slight increase in SEC for sucrose osmotic agent may be due to its higher viscosity as
the movement of dense and viscous solution is very slow through the membrane.
4.2.2.5. Effect on the Solute Flux
The experimental data in Table 4.12 show the effect of feed water flow rate on the solute flux
(Js). It can be seen from the table that as deionised feed water flow rate was increased from 2
to 4 L/min for sucrose and glucose osmotic agents, the solute flux remained the same at 2.6
g/(m2.hr).Therefore, the results of the study showed that feed water flow had constant effect
on solute flux for either of the osmotic agents with the RO flat sheet membrane.
4.2.2.6. Discussion
The data in Table 4.12 show that FO parameters such as water flux, recovery percentage and
water permeability increased, while specific energy consumption decreased, but solute flux
was not affected when the feed water flow rate was increased from 2 L/min to 4 L/min for
both OAs (glucose and sucrose). Because when the feed water flow rate increases, it
increases the osmotic pressure due to high water volume at the membrane surface thus
affecting the ECP and ICP at the membrane surface resulting a substantial high osmotic
potential difference (OPD) between the active layer and the support layer of the membrane.
This phenomenon caused increases in some parameters and reduces the SEC requirements.
At the same time, increasing flux reduces the salt sensitivity in FO process. Recently Zhao et
al. (2012) reported high water flux is the function of water permeability (Aw), membrane
structure, solute resistivity and the solute permeability. Also it is important to consider ICP of
the test membrane for higher efficiency.

Saleh Al Aswad Page 121
4.2.3.TheEffectsofOsmoticAgents’Flowrate
The effect of osmotic agents’ flow was measured for water flux (Jw), water permeability
(Aw), water recovery percent (%R) and specific energy consumption (SEC). The results of the
experiment are demonstrated in Table 4.13.
4.2.3.1. Effect on the Water Flux
The experimental data in Table 4.13 show the effect of osmotic agents’ flow rate on the water
flux (Jw). It can be seen from the table that as the osmotic agent’s flow rate increased from 2
to 4 L/min, the water flux decreased from 1.0 to 0.4 L/(m2hr) when sucrose was used as an
osmotic agent and decreased from 1.30 to 0.55 L/(m2.hr) when glucose was used as an
osmotic agent. Therefore, the results of the experiment showed that in general increase in the
draw solution flow rate leads to a decrease in the water flux. At the same time, the initial
water flux and the final water flux were higher when glucose was used as an osmotic agent.
The eventual decline in water flux was moderate for both osmotic agents. The decrease in Jw
for both osmotic agents might have been due to an increase in the concentration of the
osmotic agents which has led to development of higher osmotic pressure on the feed side of
the membrane than on the support layer of the membrane surface.
4.2.3.2. Effect on the Water Permeability
The experimental data in Table 4.13 show the effect of osmotic agent’s flow rate on the water
permeability (Aw). It can be seen from the table that as the draw solution’s flow rate increased
from 2 to 4 L/min, the water permeability rate decreased from 0.35 to 0.066L/(m2.hr.bar)
when sucrose was used as an osmotic agent and decreased from 0.26 to 0.04L/(hm2.hr.bar)
when glucose was used as an osmotic agent. The results of the experiment showed that
osmotic agents exhibited different behaviour as a result of an increase in osmotic agents’ flow
rate. The initial water permeability rate was higher when sucrose was used as an osmotic
agent. In the end, however, the difference between the processes in terms of water
permeability was minimal.

Saleh Al Aswad Page 122
Table 4.13. Effect of Osmotic Agent Flow Rate On Water Flux, Recovery Percentage, Water Permeability, Specific Energy Consumption and
Solute Flux
Note: the results were obtained at constant temperature (25 oC) and osmotic agent concentration (275 and 200 g/L) for both sucrose and glucose
respectively
Flow
Rate
(L/min)
Water Flux
(Jw)[L/(m2.hr)]
Recovery Percent
(% R)
Water Permeability
(Aw)[L/(m2.hr.bar)]
Specific Energy
Consumption
(kWhr/m3)
Solute Flux
(Js)[g/(m2.hr)]
Glucose Sucrose Glucose Sucrose Glucose Sucrose Glucose Sucrose Glucose Sucrose
2 1.3 1 1 0.66 0.26 0.35 0.6 0.9 2.6 2.6
2.5 0.99 0.83 0.9 0.58 0.15 0.2 0.9 1.1 2.6 2.6
3 0.85 0.7 0.66 0.5 0.06 0.1 1 1.2 2.6 2.6
3.5 0.7 0.55 0.46 0.3 0.044 0.077 1.1 1.25 2.6 2.6
4 0.55 0.4 0.25 0.1 0.04 0.066 1.15 1.3 2.6 2.6

Saleh Al Aswad Page 123
4.2.3.3. Effect on the Water Recovery Percentage (%R)
The experimental data in Table 4.13 show the effect of osmotic agents’ flow rate on the water
recovery percent (%R). It can be seen from the table that as the draw solution’s flow rate
increased from 2 to 4 L/min, the water recovery percent decreased from 0.66 % to 0.1 %
when sucrose was used as an osmotic agent and decreased from 1.0 % to 0.25 % when
glucose was used as an osmotic agent. Therefore, the results of the experiment showed that in
general increasing osmotic agent’s flow leads to a decrease in water recovery percent. Similar
to Jw, this decrease may be due to the increased osmotic potential difference between the feed
layer and the support layer of RO membrane surface. The initial and the final water recovery
percentages were higher for the processes where glucose was used as an osmotic agent.
4.2.3.4. Effect on the Specific Energy Consumption
The experimental data in Table 4.13 show the effect of osmotic agent’s flow rate on the
specific energy consumption (SEC). It can be seen from the table that as the draw solution’s
flow rate increased from 2 to 4 L/min, the specific energy consumption increased from 0.9 to
1.3 kWhr/m3 when sucrose was used as an osmotic agent and increased from 0.6 to 1.15
kWhr/m3 when glucose was used as an osmotic agent. Therefore, the results of the
experiment showed that in general increasing osmotic agent’s flow leads to an increase in
specific energy consumption. It is notable, however, that while the process involving sucrose
as an osmotic agent showed a steady increase in the specific energy consumption, the initial
rise in SEC was replaced by a steady decline when using glucose as an osmotic agent.
4.2.3.5. Discussion
The results of the experiment showed that water flux (Jw), recovery percentage (% R) and
water permeability (Aw) decreased and the specific energy consumption (SEC) showed
increases when the OAs flow rate was increased from 2 L/min to 4 L/min in FO process.
Increasing the OAs flow rate increased the concentration of solution near the membrane
surface which increases the osmotic pressure near the membrane surface thus resulting in
high net osmotic potential difference between the active layer and the support layer of the
membrane. This high NPD caused low water flux and increased the SEC requirement of FO
process. The low fluxes can be related to dilutive ECP on the OAs side of the membrane.
While glucose based solution demonstrated slightly better water flux and recovery rates,

Saleh Al Aswad Page 124
sucrose based solution demonstrated higher water recovery rate and lower energy
consumption.
4.2.4. The Effects of Feed Water Temperature
The effect of feed water temperature was measured for water flux (Jw), water recovery
percent (%R), water permeability (Aw), specific energy consumption (SEC) and solute flux
(Js). The results of the experiments are demonstrated in Table 4.14.
4.2.4.1. Effect on Water Flux
The experimental data in Table 4.14 show the effect of feed water temperature on water flux.
It can be seen from the table that as the temperature increased from 20 to 35 oC, the water
flux increased from 0.7 to 2.2 L/(m2.hr) when sucrose was used as an osmotic agent and
increased from 0.5 to 1.9L/(m2.hr) when glucose was used as an osmotic agent. Therefore, in
the experiment, sucrose and glucose based draw solutions exhibited different effects on the
water flux. Normally, water flux increases when the temperature is increased due to faster
movement of water molecules, decreasing viscosity of OA and the difference in osmotic
potential across the membrane surface. Therefore, the behaviour exhibited by the process
based on sucrose osmotic agent requires further investigation.
4.2.4.2. Effect on the Water Recovery Percentage
The experimental data in Table 4.14 show the effect of feed water temperature on water
recovery percentage. It can be seen from the table that as the temperature increased from 20
to 35 oC, the water recovery percent increased from 1.0 to 7.0% when sucrose was used as an
osmotic agent and increased from 0.6 to 6.0 % when glucose was used as an osmotic agent.
Therefore, the results of the experiment showed that in general increasing feed water
temperature leads to an increase in water recovery percent. Sucrose-based process had higher
ending water recovery percentages and showed a sharp increase in this parameter over the
course of the experiment. This may be due to the difference in viscosity between the two
osmotic agents which showed the effect of feed water temperature on % R in FO process.

Saleh Al Aswad Page 125
Table 4.14. Effect of Feed Water Temperature on Water Flux, Recovery Percentage, Water Permeability, Specific Energy Consumption and
Solute Flux
Note: the results were obtained at constant feed and draw solution flow rate (2 L/min) and osmotic agent concentration (200 and 250g/L) for
both sucrose and glucose respectively
Temperature
(o C)
Water Flux
(Jw)[L/m2.hr)]
Osmotic
Pressure
(bar)
Osmotic
Pressure
(bar)
Recovery Percent
(% R)
Water Permeability
(Aw)[L/(m2.hr.bar)]
Specific Energy
Consumption
(kWhr/m3)
Solute Flux
(Js)[g/(m2.hr)]
Glucose Sucrose Glucose Sucrose Glucose Sucrose Glucose Sucrose Glucose Sucrose
20 0.5 0.7 12.3 10.7 0.6 1 0.05 0.08 2.7 3 2.6 2.6
25 1 1.2 21.3 12.6 1.6 2.2 0.15 0.18 1.77 2 2.6 2.6
30 1.5 1.7 25.0 17.9 3.2 4 0.25 0.28 1 1.2 2.6 2.6
35 1.9 2.2 28.1 27.5 6 7 0.4 0.48 0.5 0.66 2.6 2.6

Saleh Al Aswad Page 126
4.2.4.3. Effect on the Water Permeability
The experimental data in Table 4.14 show the effect of feed water temperature on water
permeability. It can be seen from the table that as the temperature increased from 20 to 35 oC,
the water permeability increased from 0.08 to 0.48 L/(m2.hr.bar) when sucrose was used as an
osmotic agent and increased from 0.05 to 0.4 L/(m2.hr.bar)when glucose was used as an
osmotic agent. Therefore, the results of the experiment showed that in general increasing feed
water temperature leads to a decrease in water permeability for the cases involving each of
the osmotic agent solutions. Sucrose based process by the end of experiment demonstrated a
higher degree of water permeability. The increasing trend in water permeability may be due
to increased concentration of solution with increasing temperature which resulted in high
osmotic potential difference between the active layer and the support layer of membrane thus
causing an increase in Aw. However, the difference in Aw between the sucrose and glucose
OAs may be attributed to the difference in their respective viscosity.
4.2.4.4. Effect on the Specific Energy Consumption
The experimental data in Table 4.14 show the effect of feed water temperature on the specific
energy consumption. It can be seen from the table that as the temperature increased from 20
to 35 oC, the energy consumption decreased from 3 to 0.66 kWhr/m
3 when sucrose was used
as an osmotic agent and decreased from 2.7 to 0.5 kWhr/m3 when glucose was used as an
osmotic agent. Therefore, the results of the experiment showed that in general an increase in
feed water temperature leads to a decrease in specific energy consumption for both types of
osmotic agents. However, by the end of the experiment the final permeability rates were
higher for the processes involving glucose as an osmotic agent. This may be due to the
increasing concentration effect for osmotic agents when feed water temperature rises. This
leads to a lower energy requirement to sustain the osmotic process. The effect was
particularly noticeable for the glucose-based osmotic process.
4.2.4.5. Effect on the Solute Flux
The experimental data in Table 4.14 show the effect of feed water temperature on the solute
flux. It can be seen from the table that as the temperature increased from 20 to 35 oC, the
solute flux remained constant at 2.6 g/(hr.m2) for both types of osmotic agents. Therefore, the
results of the experiment showed that there was constant effect of feed water temperature on
the solute flux.

Saleh Al Aswad Page 127
4.2.4.6. Discussion
It can be seen from Table 4.14 that water flux, recovery percentage and water permeability
increased, the specific energy consumption decreased, but the solute flux was not affected by
increasing the feed water temperature from 20 to 35oC. It is evident that increasing the feed
water temperature affects the different water characteristics such as concentration, speed and
movement of water molecules, rate of diffusion and the osmotic pressure (driving force, Δπ)
near the membrane surface. This phenomenon causes high fluxes thus requiring low SEC
requirements as the FO process is mainly governed by the osmotic potential difference across
the membrane surface. These findings agree with the research of Phuntsho et al. (2012) and
You et al. (2012) as already mentioned in section 4.1.4.6.
4.2.5.TheEffectsofOsmoticAgents’Temperatures
The effect of osmotic agent’s temperature was measured for water flux (Jw), water recovery
percent (%R), water permeability (Aw) and specific energy consumption (SEC). The results
of the experiment are shown in Table 4.15.
4.2.5.1. Effect on the Water Flux
The experimental data in Table 4.15 show the effect of temperature of draw solutions on the
water flux. It can be seen from the table that as the temperature increased from 20 to 35 oC,
the water flux increased from 0.1 to 0.5 L/(m2.hr)when sucrose was used as an osmotic agent
and increased from 0.17 to 0.6 L/(m2.hr)when glucose was used as an osmotic agent.
Therefore, the results of the experiment showed different behaviour exhibited by the
processes involving different osmotic agents. This difference may be due to the difference in
viscosity: sucrose’s higher viscosity level seems to make it more susceptible to the
temperature increases.

Saleh Al Aswad Page 128
Table 4.15. Effect of Osmotic Agent Temperature on Water Flux, Recovery Percentage, Water Permeability, Specific Energy Consumption and
Solute Flux
Note: the results were obtained at constant feed and draw solution flow rates (2 L/min) and osmotic agent concentration (200 and 250g/L) for
both sucrose and glucose respectively
Temperature
(o C)
Water Flux
(Jw)[L/(m2.hr)]
Recovery Percent
(% R)
Water Permeability
(Aw)[L/(m2.hr.bar)]
Specific Energy
Consumption
(kWhr/m3)
Solute Flux
(Js)[g/(m2.hr)]
Glucose Sucrose Glucose Sucrose Glucose Sucrose Glucose Sucrose Glucose Sucrose
20 0.17 0.1 0.13 0.2 0.03 0.02 1 1.2 2.6 2.6
25 0.27 0.2 0.24 0.25 0.05 0.04 0.8 1 2.6 2.6
30 0.4 0.3 0.34 0.38 0.07 0.06 0.6 0.8 2.6 2.6
35 0.6 0.5 0.43 0.55 0.1 0.09 0.5 0.7 2.6 2.6

Saleh Al Aswad Page 129
4.2.5.2. Effect on the Water Recovery Percent
The experimental data in Table 4.15 show the effect of temperature of the draw solution on
the water flux. It can be seen from the table that as the temperature increased from 20 to 35
oC, the water recovery percent increased from 0.2to 0.55 % when sucrose was used as an
osmotic agent and increased from 0.13 to 0.43% when glucose was used as an osmotic agent.
Therefore, the results of the experiment showed that increasing temperature of an osmotic
agent leads to an increase in water recovery percent. Notably, for the glucose based process,
the increase was particularly sharp. This may be attributed to the effect of temperature on
viscosity, movement of water molecules and the rate of diffusion of water molecules across
the membrane surface in FO process.
4.2.5.3. Effect on the Water Permeability
The experimental data in Table 4.15 show the effect of temperature of the draw solution on
the water flux. It can be seen from the table that as the temperature increased from 20 to 35
oC, the water permeability increased from 0.02 to 0.09 L/(m
2.hr.bar)when sucrose was used
as an osmotic agent and increased from 0.03 to 0.1 L/(m2.hr.bar) when glucose was used as
an osmotic agent. Therefore, the results of the experiment showed different effects of sucrose
based and glucose based processes on water permeability. Difference in the agents’ viscosity
could have contributed to the aforementioned differences.
4.2.5.4. Effect on the Specific Energy Consumption
The experimental data in Table 4.15 show the effect of temperature of the draw solution on
the specific energy consumption. It can be seen from the table that as the temperature
increased from20to35oC, the specific energy consumption rate decreased from 1.2 to0.7
kWhr/m3
when sucrose was used as an osmotic agent and decreased from 1.0 to 0.5 kWhr/m3
when glucose was used as an osmotic agent. Therefore, the results of the experiment showed
different behaviour exhibited by the processes involving sucrose and glucose as osmotic
agents. The decrease in the SEC for both osmotic agents may be due to temperature effect
thus requiring less energy in FO process.

Saleh Al Aswad Page 130
4.2.5.5. Discussion
It can be illustrated from data in Table 4.15 that increasing the OAs temperature from 20 to
35 oC increased the water flux, recovery percentage and water permeability, but reduced the
requirement of specific energy consumption in FO process. A explained earlier, increasing
the OAs temperatures will affect the different properties of OAs such as the viscosity, speed
and movement of water molecules, rate of diffusion and the osmotic pressure (driving force,
Δπ) near the membrane surface. Consequently, it will produce high fluxes and minimize the
SEC requirements of FO process which mainly depends on the osmotic potential difference
across the membrane surface. These findings agree with the results of Phuntsho et al. (2012)
and You et al. (2012) as explained earlier in section 4.1.4.6.
4.2.6. RO Membrane Results Overview
Several conclusions were drawn from this experiment for RO membrane (Table 4.16).The
best results for the given process and the given membrane were obtained by manipulating
feed water and osmotic agent temperatures. Increasing each of these factors led to higher
water flux, water recovery rate, and water permeability, although in the case of osmotic agent
temperature, an increase was noted for glucose-based solution only. Decrease in specific
energy consumption was noted for glucose based solutions as well. Notably, sucrose solution
showed superior results over glucose based solutions when changing feed water flow rate,
while glucose proved the superior osmotic agent when osmotic agent temperature was
increased. However, overall neither of the considered osmotic agents demonstrated an
absolute superiority when used with RO membrane. Out of twenty experiment measures
(without solute flux effects which were not affected), sucrose showed superiority in eleven.
While sucrose could be a promising agent to use with increasing feed water and glucose at
higher temperatures of osmotic agent, there is no certainty about either of these agents as an
agent of choice for the FO process using a RO membrane.

Saleh Al Aswad Page 131
Table 4.16. Results of Changes of Manipulated FO Factors on Key Measured Parameters of
the Process: RO Membrane
Parameter Water Flux Water Recovery
Rate
Water
Permeability
Specific Energy
Consumption
Solute Flux
Increase in OA
concentration
Decreased
Sucrose superior
Decreased
Sucrose superior
Decreased
Sucrose superior
Increased
Glucose superior
No change
Increase in FW
flow
Increased
Sucrose superior
Increased
Sucrose superior
Increased
Sucrose superior
Increased
Sucrose superior
No change
Increase in OA
flow
Decreased
Glucose superior
Decreased
Glucose superior
Decreased
Glucose superior
Increased
Glucose superior
No change
Increase in FW
temperature
Increased
Sucrose superior
Increased
Sucrose superior
Increased
Sucrose superior
Decreased
Glucose superior
No change
Increase in OA
temperature
Increased
Glucose superior
Increased
Sucrose superior
Increased
Glucose superior
Decreased
Glucose superior
No change
4.3. A Comparison Study of Membrane - Osmotic Agent Systems
This section provides a side by side comparison of the FO processes for NF and RO flat sheet
membranes using sucrose and glucose as osmotic agents. In line with the data collected for
each type of membrane and for each type of osmotic agent, the comparisons of FO process
performance are made on the bases of osmotic agents’ concentrations, feed water flow rates,
osmotic agents’ flow rates, feed water temperature and osmotic agents’ temperature. The
compared effects are on water flux, water recovery percent, water permeability and specific
energy consumption. The purpose of the comparisons was to determine the best membrane
and an osmotic agent that can be used in FO process.
4.3.1.OsmoticAgents’Concentration
4.3.1.1. Effect on the Water Flux
Figure 4.2 provides a comparative graph of the water fluxes obtained for each combination of
a membrane (NF and RO Flat Sheet) and an osmotic agent (sucrose and glucose). From the
graph, it can be seen that the highest fluxes were achieved for the NF membrane-glucose OA
and RO membrane-sucrose OA combination despite the steep decline in water flux
performance during the experiment. Specifically, the obtained fluxes were 3.5 and 1.5
L/(m2.hr) for 90 and 250 g/L concentrations of glucose, respectively. The RO membrane -
glucose OA system also showed a decline in water flux from 2.0 to 0.3L/(m2.hr)as the OA
concentrations increased from 170 to 400 g/L. Sucrose based systems with RO membrane
showed high water flux, but relatively low water fluxes at the initial concentrations (3.7 and

Saleh Al Aswad Page 132
1.2L/(m2.hr) for RO and NF membranes, respectively) and these fluxes declined to 1.5 and
0.9 L/m2.hr for RO and NF membranes, respectively. Therefore, based on the experiment
results, sucrose and glucose were the preferable OAs, and the best results were demonstrated
in combination with the NF membrane type. The highest water flux of 3.7 L/(m2.hr)was
achieved by the RO membrane-sucrose OA system at sucrose concentration of 170 g/L.
Figure 4.2. Effect of OA concentration on Water Flux with RO and NF Using RO and NF
Membrane at Constant Temperature (25 oC) and Feed and Draw Solution Flow Rates (2
L/min)
4.3.1.2. Effect of OAs Concentration on Percent Recovery
Figure 4.3 provides a comparative graph of the water recovery percentages obtained for each
combination of a membrane (NF and RO Flat Sheet) and an osmotic agent (sucrose and
glucose). From the graph, it can be seen that the highest percentages were obtained for the NF
membrane-sucrose OA system with 2.5% and 0.8% recoveries at 170 and 400 g/L osmotic
agent concentrations, respectively. However, the sucrose systems for both membrane types
demonstrated rapid declines in water recovery as the osmotic concentrations increased. In
contrast, the glucose based systems showed steady decreases in water recovery with the
increased concentrations. This is especially true with regards to the RO membrane – glucose
OA system. It showed a decrease in water recovery percent from 0.5 % to 0.13 % as glucose
concentrations grew from 90 to 250 g/L. The final recovery rate exceeded the one
0
0.5
1
1.5
2
2.5
3
3.5
4
50 100 150 200 250 300 350 400 450
J w
L (
hr.
m2)
OA concentration (g/L)
Sucrose RO Glucose RO
Sucrose NF Glucose NF

Saleh Al Aswad Page 133
demonstrated by the RO membrane-sucrose OA system. It remained unclear whether further
increase in OA concentrations could lead to the convergence of water recovery rates for the
RO membrane-glucose OA and NF membrane-sucrose OA systems. At the same time, the
available data showed clear inverse trends for sucrose-based and glucose-based systems at
increasing OA concentrations. The highest water recovery percent of 2.5% was achieved by
the NF membrane – sucrose OA system at sucrose concentration of 170 g/L.
Figure 4.3. Effect of OAs Concentration on Percent Recovery Using RO and NF Membrane at
Constant Temperature (25 oC) and Feed and Draw Solution Flow Rates (2 L/min)
4.3.1.3. Effect on of OAs Concentration on Water Permeability
Figure 4.4 provides a comparative graph of the water permeability obtained for each
combination of a membrane (NF and RO Flat Sheet) and an osmotic agent (sucrose and
glucose). From the graph, it can be seen that all systems showed similar pattern of water
permeability decline at the growing OA concentrations. Still, the best results for this specific
parameter were demonstrated by the RO membrane-sucrose OA system with 0.7 and 0.1
L/(m2.hr bar) at 170 g/L and 400 g/L concentrations, respectively. At the same time the NF
membrane-glucose OA system showed nearly the same level of water permeability at higher
concentrations: 0.08L/(m2.hr.bar)at 250 g/L. This system showed a slow rate of decline for
water permeability, although its initial permeability of 0.3 L/(m2.hr.bar)at 90 g/L glucose
0
0.5
1
1.5
2
2.5
3
50 100 150 200 250 300 350 400 450
% R
OA concentration (g/L)
Sucrose NF Glucose NFSucrose RO Glucose RO

Saleh Al Aswad Page 134
concentration was lower than in the RO membrane-sucrose OA system (0.7L/(m2.hr bar)at
170 g/L sucrose concentration). Therefore, based on the experiment results, the RO
membrane-sucrose OA system can be considered superior based on water permeability
parameter, although at the higher concentration levels it is likely that the NF membrane-
glucose OA may become at least as much preferable. The highest water permeability value of
0.7 L/(m2.hr.bar)was obtained by the RO membrane-sucrose OA system at sucrose
concentration of 170 g/L.
Figure 4.4. Effect of OAs Concentration on Water Permeability Using RO and NF
Membranes at Constant Temperature (25 oC) and Feed and Draw Solution Flow Rates (2
L/min)
4.3.1.4. Effect on the Specific Energy Consumption
Figure 4.5 provides a comparative graph of the specific energy consumption obtained for
each combination of a membrane (NF and RO Flat Sheet) and an osmotic agent (sucrose and
glucose). From the graph, it can be seen that the sucrose based systems demonstrated the
higher energy requirements i.e.2.9 to 5.6 kWhr/m3for the RO system at 170 and 400 g/L,
respectively and 1.2 to 3.3 kWhr/m3for the NF system at the same concentrations. As was
discussed earlier, higher viscosity of sucrose and smaller pore structure of the RO membrane
make FO processes of such systems much more energy requiring. The process with the
lowest SEC rates was obtained by the NF membrane-glucose OA system with the increase
0
0.1
0.2
0.3
0.4
0.5
0.6
0.7
0.8
50 100 150 200 250 300 350 400 450
Aw (
L /
m2.h
r.b
ar)
OA concentartion (g/L)
Sucrose NF Glucose NF
Sucrose RO Glucose RO

Saleh Al Aswad Page 135
from 0.3 to 0.9 kWhr/m3as glucose concentrations rose from 90 to 250 g/L. While the RO
membrane-glucose OA system showed an increase in SEC (from 1.0-2.0 kWhr/m3as glucose
concentrations rose from 90 to 250 g/L), the graph clearly indicates an upward trend for the
concentrations starting around 180-190 g/L. Therefore, based on the results of the experiment
the NF membrane-glucose OA system is preferable based on the SEC parameter. The lowest
SEC value of 0.3 kWhr/m3 was obtained by the NF membrane – glucose OA system at
glucose concentration of 90 g/L.
Figure 4.5. Comparison of Osmotic Agents’ Concentration Effect on Specific Energy
Consumption for NF and RO Membranes at Constant Temperature (25 oC) and Feed and
Draw Solution Flow Rates (2 L/min)
4.3.1.5. Discussion
The study of comparative graphs (Figures 4.2-4.5) show the effect of varying concentrations
of glucose and sucrose OAs on different FO parameters using NF and RO membrane. Based
on the experiment results, sucrose and glucose were the preferable OAs, and the best results
were demonstrated in combination with the NF membrane type. The highest water flux of
3.75 L/(m2.hr) was achieved by the RO membrane-sucrose OA system at glucose
concentration of 90 g/L. The available data on recovery percentage showed clear inverse
trends for sucrose-based and glucose-based systems at increasing OA concentrations. The
highest water recovery percent of 2.5% was achieved by the NF membrane-sucrose OA
0
1
2
3
4
5
6
50 100 150 200 250 300 350 400 450
SE
C (
kW
.hr/
m3)
OA cocnetration (g/L)
Sucrose NF Glucose NF
Sucrose RO Glucose RO

Saleh Al Aswad Page 136
system at sucrose concentration of 170 g/L. With respect to water permeability, the RO
membrane-sucrose OA system can be considered superior, although at the higher
concentration levels it is likely that the NF membrane – glucose OA may become at least as
much preferable. The highest water permeability value of 0.7 L/(m2.hr.bar) was obtained by
the RO membrane – sucrose OA system at sucrose concentration of 170 g/L. Also, the data
showed that the NF membrane-glucose OA system is preferable based on the SEC parameter.
The lowest SEC value of 0.2 kWhr/m3 was obtained by the NF membrane – glucose OA
system at glucose concentration of 90 g/L. The study findings are closely related to those of
Peng (2004) and, Al-Sharif and Al-Mayahi, 2005) who concluded that though the NF
membranes are new entry in the field of RO membrane separation, but is quite different to
RO membrane due to having large membrane pore structure compared to RO membrane thus
allowing larger molecules through the membrane compared to RO membrane. The
advantages of using NF over RO membrane are many. Because NF membrane has a higher
water recovery than RO, thereby conserving total water use and energy. With the exception
of few results, the NF membrane with glucose and sucrose OAs seems better and preferable
on RO membrane with glucose and sucrose OAs in FO process.
4.3.2. Feed Water Flow Rate
4.3.2.1. Effect on the Water Flux
Figure 4.6 provides a comparative graph of the water fluxes obtained for each combination of
a membrane (NF and RO Flat Sheet) and an osmotic agent (sucrose and glucose). From the
graph, it can be seen that all four systems in the experiment showed a pattern of increasing
water flux as a result of an increase in feed water flow rate. Sucrose-based systems provided
the best results in terms of water flux. The best result overall was demonstrated by the RO
membrane – sucrose OA system with the fluxes ranging from 0.89 to 1.8 L/(m2.hr)as the feed
water flow rate increased from 2 to 4 L/min. The lowest water flux was demonstrated by the
NF membrane-glucose OA system with a range of 0.1 to 0.5 L/(m2.hr)at the same
corresponding feed flow rates. Therefore, based on the feed flow parameter, the preferable
FO system was with the RO membrane and sucrose as an osmotic agent. The highest water
flux value of 1.8 L/(m2.hr)was obtained by the RO membrane – sucrose OA system at feed
water flow of 4 L/min.

Saleh Al Aswad Page 137
Figure 4.6.Comparison of Feed Water Flow Effect on Water Flux for NF and RO Membranes
at Constant Temperature (25 oC) and OAs Concentration(275 and 200 g/L) for both sucrose
and glucose respectively
4.3.2.2. Effect on the Water Recovery Percentage
Figure 4.7 provides a comparative graph of the water recovery percentage rates obtained for
each combination of a membrane (NF and RO Flat Sheet) and an osmotic agent (sucrose and
glucose). From the graph, it can be seen that all systems showed increasing water recovery
rates with the increasing feed water flows. However, the RO membrane-sucrose OA system
showed clearly the best results which is seen from the graph. Specifically, the obtained water
recovery rates were 4.3% to 7.5% as feed water flow increased from 2 to 4 L/min. Therefore,
the RO membrane – sucrose OA system is preferable based on the water recovery percentage
parameter. The highest water recovery percent of 7.5% was obtained by the RO membrane –
sucrose OA system at feed water flow of 4 L/min.
0
0.2
0.4
0.6
0.8
1
1.2
1.4
1.6
1.8
2
1.75 2 2.25 2.5 2.75 3 3.25 3.5 3.75 4
Jw (
L/m
2.h
r)
Feed water flow rate (g/L)
Sucrose NF Glucose NF Sucrosee RO Glucose RO

Saleh Al Aswad Page 138
Figure 4.7. Comparison of Feed Water Flow Effect on Water Recovery Percentage for NF
and RO Membranes at Constant Temperature (25 oC) andOAs Concentration (275 and 200
g/L) for both sucrose and glucose respectively
4.3.2.3. Effect on the Water Permeability
Figure 4.8 provides a comparative graph of the water permeability obtained for each
combination of a membrane (NF and RO Flat Sheet) and an osmotic agent (sucrose and
glucose). From the graph, it can be seen that all systems in the experiment demonstrated
increasing water permeability with the increased feed water flow. However, the RO
membrane-sucrose OA system demonstrated the best result with an increase of water
permeability from 0.1 to 0.5 L/(m2.hr.bar)as the feed water flow increased from 2 to 4 L/min.
Noticeably, the NF systems showed relatively poor improvement with the increased feed
water flow. The RO membrane-glucose OA system showed a progressively increasing water
permeability which increased from 0.02 to 0.2 L/(m2.hr.bar), although these values were still
much lower than the ones demonstrated by the RO membrane-sucrose OA system. Therefore,
based on water permeability parameter, the RO membrane-sucrose OA system is preferable
with the increasing feed water flow. The highest water permeability value of 0.5
L/(m2.hr.bar)was obtained for the RO membrane – sucrose OA system at feed water flow of 4
L/min.
0
1
2
3
4
5
6
7
8
1.75 2 2.25 2.5 2.75 3 3.25 3.5 3.75 4 4.25
% R
Feed water flow rate (L /min)
Sucrose NF Glucose NFSucrose RO Glucose RO

Saleh Al Aswad Page 139
Figure 4.8. Comparison of Feed Water Flow Effect on Water Permeability for NF and RO
Membranes at Constant Temperature (25 oC) and OAs Concentration(275 and 200 g/L) for
both sucrose and glucose respectively
4.3.2.4. Effect on the Specific Energy Consumption
Figure 4.9 provides a comparative graph of the specific energy consumption (SEC) obtained
for each combination of a membrane (NF and RO Flat Sheet) and an osmotic agent (sucrose
and glucose). From the graph, it can be seen that all systems except for the RO membrane –
sucrose OA in the experiment demonstrated declining SEC rates with the increasing feed
water flow. It is also noticeable that by the time that the feed water flow reached 4 L/min,
SEC demonstrated by all systems converged around the value of 0.6 –1.0 kWhr/m3.
However, at the lower flow levels, there is much difference in SEC. The NF membrane –
sucrose OA system showed the highest SEC at 12. kWhr/m3, while the RO membrane –
sucrose OA showed the lowest SEC at 0.4 kWhr/m3. Therefore, this particular system could
be preferable based on SEC parameter. The lowest SEC value of 0.4 kWhr/m3 was obtained
by the RO membrane-sucrose OA system at feed water flow of 4 L/min.
0
0.1
0.2
0.3
0.4
0.5
0.6
1.75 2 2.25 2.5 2.75 3 3.25 3.5 3.75 4 4.25
A
w
( L
/ m
2.h
r.b
ar )
Feed water flow rate ( L/ min)
Sucrose NF Glucose NF
Sucrose RO Glucose RO

Saleh Al Aswad Page 140
Figure 4.9. Comparison of Feed Water Flow Effect on Specific Energy Consumption for NF
and RO Membranes at Constant Temperature and OAs Concentration (275 and 200 g/L) for
both sucrose and glucose respectively
4.3.2.5. Discussion
The comparative graphs (Figures 4.6 to 4.9) represent the effect of feed water flow rate on
different parameters in FO process using NF and RO membrane with glucose and sucrose as
OAS. Based on the feed water flow rate, the highest water flux value of 1.8 L/(m2.hr)was
obtained by the RO membrane-sucrose OA system at feed water flow of 4 L/min.
Furthermore, based on the water recovery percentage parameter, the RO membrane-sucrose
OA system is preferable. The highest water recovery percent of 7.5% was obtained by the RO
membrane-sucrose OA system at feed water flow of 4 L/min. With respect to water
permeability parameter, the RO membrane-sucrose OA system is preferable with the
increasing feed water flow. The highest water permeability value of 0.5 L/(m2.hr.bar) was
obtained for the RO membrane-sucrose OA system at feed water flow of 4 L/min. The NF
membrane-sucrose OA system showed the highest SEC at 12 kWhr/m3, while the RO
membrane-sucrose OA showed the lowest SEC at 0.44 kWhr/m3. Therefore, this particular
system could be preferable based on SEC parameter. The lowest SEC value of 0.44 kW.hr/m3
was obtained by the RO membrane-sucrose OA system at feed water flow of 4 L/min.
Overall, it appears that RO membrane-sucrose OA is more preferable system for feed water
flow rate study to study the performance of FO process in water desalination. The study
0
2
4
6
8
10
12
14
1.75 2 2.25 2.5 2.75 3 3.25 3.5 3.75 4
SE
C (
kW
.hr/
m3 )
Feed water flow rate (L/min)
Sucrose NF Glucose NF
Sucrose RO Glucose RO

Saleh Al Aswad Page 141
findings are closely related to those of Peng (2004) and, Al-Sharif and Al-Mayahi, 2005) who
concluded that though the NF membranes are new entry in the field of RO membrane
separation, but is quite different to RO membrane with respect to porosity, structure and the
diffusion coefficient thus allowing more passage of water molecules through the membrane
compared to RO membrane. The advantages of using NF over RO membrane are many.
Because NF membrane has a higher water recovery than RO, thereby conserving total water
use and energy. With the exception of few results, the NF membrane with glucose and
sucrose OAs seems better and preferable on RO membrane with glucose and sucrose OAs in
FO process.
4.3.3.OsmoticAgents’FlowRate
4.3.3.1. Effect on the Water Flux
Figure 4.10 provides a comparative graph of the water flux obtained for each combination of
a membrane (NF and RO Flat Sheet) and an osmotic agent (sucrose and glucose). From the
graph, it can be seen that the NF based systems showed an increasing water flux with the
increased osmotic agents’ flow, while the RO systems showed a decreasing water flux
pattern. This means that in general NF systems could be preferable at the higher osmotic
agents’ flow rates while RO systems-at the lower rates. For both increasing and decreasing
patterns, however, the systems with glucose as an osmotic agent showed superior values over
the sucrose based systems. At the 2 L/min osmotic agent flow, the best performance was
demonstrated by the RO membrane – glucose OA system at 1.3 L/(m2.hr) level. At the 4
L/min osmotic agent flow, the best performance was demonstrated by the NF membrane –
glucose OA at 0.9 L/(m2.hr).Therefore, the results of the experiment demonstrated superiority
of the glucose OA on the basis of water flux parameter when osmotic agent flow rate is the
manipulated measure. The highest water flux of 1.3 L/(m2.hr) was obtained by the RO
membrane-glucose OA system at glucose solution flow rate of 2 L/min.

Saleh Al Aswad Page 142
Figure 4.10. Comparison of Osmotic Agent Flow Effect on Water Flux for NF and RO
membranes at Constant Temperature (25 oC) and OAs Concentration (275 and 200 g/L) for
both sucrose and glucose respectively
4.3.3.2. Effect on the Water Recovery Percent
Figure 4.11 provides a comparative graph of the water recovery percent obtained for each
combination of a membrane (NF and RO Flat Sheet) and an osmotic agent (sucrose and
glucose). From the graph, it can be seen that the glucose based systems showed an increasing
water recovery percent with the increased osmotic agents’ flow, while the sucrose systems
showed a decreasing water recovery percent pattern. This means that in general glucose
systems could be preferable at the higher osmotic agents’ flow rates while sucrose systems –
at the lower rates. At the 2 L/min osmotic agent flow, the best performance was demonstrated
by the RO membrane-glucose OA system at 1.0% recovery rate. At the 4 L/min osmotic
agent flow, the best performance was demonstrated by the NF membrane-sucrose OA at
0.9%.
0
0.2
0.4
0.6
0.8
1
1.2
1.4
1.75 2 2.25 2.5 2.75 3 3.25 3.5 3.75 4 4.25
J w
( L
/m
2.h
r )
OA flow rate (L/min)
Sucrose NF Glucose NF
Sucrose RO Glucose RO

Saleh Al Aswad Page 143
Figure 4.11. Comparison of Osmotic Agent Flow Effect on Water Recovery Percent for NF
and RO membranes at Constant Temperature (25 oC) and OAs Concentration (275 and 200
g/L) for both sucrose and glucose respectively
4.3.3.3. Effect on the Water Permeability
Figure 4.12 provides a comparative graph of the water permeability obtained for each
combination of a membrane (NF and RO Flat Sheet) and an osmotic agent (sucrose and
glucose). From the graph, it can be seen that the NF based systems showed increasingly
growing water permeability at growing osmotic agent flow rates. The NF membrane –
glucose OA system showed a permeability of 0.35 L/(m2.hr.bar) at 2 L/min flow rate, which
was the best result in the experiment for the high level of osmotic agent flow. The RO
membrane-sucrose OA system showed the highest permeability rate at the lower osmotic
agent flow: 0.35 L/(m2.hr.bar) at 2 L/min flow rate, although at the high levels of flow it
showed the worst permeability at just 0.06 L/(m2.hr.bar). At the same time, the RO
membrane-glucose system never showed water permeability rates close to the ones
demonstrated by the sucrose-based systems. Overall, the results of the experiment showed
that the NF systems showed the best performance in terms of water permeability, especially
the NF membrane-glucose OA system. The RO membrane-sucrose OA system could be
considered at low levels of osmotic agent flow, although it demonstrates steep decline in
permeability rates as the osmotic agent flow increases. The lowest water permeability rate of
0.1 L/(m2.hr.bar) was obtained by the NF membrane-glucose OA system at glucose solution
flow rate of 2 L/min.
0
0.2
0.4
0.6
0.8
1
1.2
1.75 2 2.25 2.5 2.75 3 3.25 3.5 3.75 4 4.25
% R
OA flow rate (L /min)
Sucrose NF Glucose NF
Sucrose RO Glucose RO

Saleh Al Aswad Page 144
Figure 4.12. Effect of OAs Flow Rate on Water Permeability Using RO And NF Membranes
at Constant Temperature (25 oC) and OAs Concentration (275 and 200 g/L) for both sucrose
and glucose respectively
4.3.3.4. Effect of OAs Flow Rate on Specific Energy Consumption (SEC)
Figure 4.13 provides a comparative graph of the specific energy consumption (SEC) obtained
for each combination of a membrane (NF and RO Flat Sheet) and an osmotic agent (sucrose
and glucose). From the graph, it can be seen that nearly all systems showed declining SEC
values as the osmotic agents’ flow increased. The RO membrane-sucrose OA was the only
system with an increasing SEC: from 0.9 to 1.3 kWhr/m3as the osmotic agents’ flow rate
increased from 2 to 4 L/min. However, this system also demonstrated the lowest SEC up to
the flow rate of around 3.5 L/min where its SEC value of 0.9 kWhr/m3was the same as for the
NF membrane-glucose OA system. At the higher flow rates, the SEC values for all four
systems converged at around 1.04 to 1.50 kWhr/m3which means that there could be particular
preference for a system at this stage. However, there were substantial differences at the lower
osmotic agent flow rates. The NF membrane-sucrose OA system showed the highest SEC
starting at 12 kWhr/m3 at the flow rate of 2 L/min. Although this system showed the steepest
decline in SEC as the flow rate increased, its performance was still poorer than for the other
systems. The results of the experiment showed that despite a decrease in SEC as a result of
increasing osmotic agent flow rate, the RO membrane-sucrose OA could be the preferred
system based on SEC parameter, at least for the lower levels of flow rates. The lowest SEC
0
0.05
0.1
0.15
0.2
0.25
0.3
0.35
0.4
1.75 2 2.25 2.5 2.75 3 3.25 3.5 3.75 4 4.25
Aw
( L
/m2.h
r.b
ar)
OA flow rate (L/min)
Sucrose NF Glucose NF
Sucrose RO Glucose RO

Saleh Al Aswad Page 145
value of 0.7 kWhr/m3 was obtained by the RO membrane – glucose OA system at sucrose’s
solution flow rate of 2 L/min.
Figure 4.13. Effect of OAs flow rate on SEC using NF and RO membrane at Constant
Temperature (25 oC) and OAs Concentration (275 and 200 g/L) for both sucrose and glucose
respectively
4.3.3.5. Discussion
The results for the effect of OAs flow rate on different FO parameters are presented in
Figures 4.10 to 4.13 using NF and RO membranes. The NF membrane-glucose OA showed
the best performance of water flux at 0.9 L/(m2.hr). Therefore, the results of the experiment
demonstrated superiority of the glucose OA based on this parameter when osmotic agent flow
rate is the manipulated measure. The highest water permeability rate of 0.35L/(m2.hr.bar) was
obtained by the NF membrane – glucose OA system at glucose solution flow rate of 4 L/min.
The recovery percentage was highest (0.9 %) at the 4 L/min osmotic agent flow by the NF
membrane-sucrose OA. Although, a decrease in SEC was found as a result of increasing
osmotic agent flow rate, the RO membrane-sucrose OA could be the preferred system based
on SEC parameter, at least for the lower levels of flow rates. The lowest SEC value of 0.6
kWhr/m3 was obtained by the RO membrane-glucose OA system at sucrose’s solution flow
rate of 2 L/min. The results agree with those of Peng (2004) and, Al-Sharif and Al-Mayahi,
0
1
2
3
4
5
6
7
8
9
1.75 2 2.25 2.5 2.75 3 3.25 3.5 3.75 4
SE
C (
kW
.hr/
m3)
DS flow rate (L/min)
Sucrose NF Glucose NF
Sucrose RO Glucose RO

Saleh Al Aswad Page 146
2005) who reported that the difference in characteristics of the two membranes (NF and
RO)namely porosity, structure and the diffusion coefficient play a major role in membrane
selection depending on the experimental conditions such as flow rate, temperature and the
concentration of OAs.
4.3.4. Feed Water Temperature
4.3.4.1. Effect of Feed Water Temperature on Water Flux
Figure 4.14 provides a comparative graph of the water flux obtained for each combination of
a membrane (NF and RO Flat Sheet) and an osmotic agent (sucrose and glucose). From the
graph, it can be seen that the systems demonstrated different responses to the increase in feed
water temperature. As the feed water temperature rose from 20to 35oC, the RO membrane-
sucrose OA system demonstrated a water flux increase from 0.7 to 2.2 L/(m2.hr); the RO
membrane-glucose OA system demonstrated a moderate increase from 0.5 to 1.9 L/(m2.hr);
and both NF systems remaining at approximately same level of water flux at 0.5-1.1 and 0.2-
0.8 L/(m2.hr). Therefore, the experiment results demonstrated superiority of the RO
membrane systems. The system with by far the best water flux performance was the RO
membrane-sucrose OA, which can, therefore, be considered as preferable based on the
experiment results. The highest water flux of 2.2 was obtained by the RO membrane-sucrose
OA system at feed water temperature of 35oC.

Saleh Al Aswad Page 147
Figure 4.14. Effect of Feed Water Temperature on Water Flux Using NF and RO Membranes
at Constant Feed and Draw Solution Flow Rate (2 L/min) and OAs concentration (200 and
250 g/L) for both sucrose and glucose respectivly
4.3.4.2. Effect on the Water Recovery Percent
Figure 4.15 provides a comparative graph of the water recovery percentages obtained for
each combination of a membrane (NF and RO Flat Sheet) and an osmotic agent (sucrose and
glucose). From the graph, it can be seen that both RO and NF systems showed an apparent
increase in water recovery percentages as the feed water temperature grew. This makes the
RO systems preferable based on water recovery percent. The system with by far the highest
values for water recovery percent was the RO membrane-sucrose OA with the water recovery
percentage increased from 1.0 % to 7.0 as the temperature of feed water increased from 20 to
35oC. Also, similar trend of increase in recovery percentage was followed by RO membrane-
glucose OA where it ranged between 0.5 to 6.0 % as the temperature of feed water increased
from 20 to 35oC. This makes both these systems preferable based on the water recovery
percent parameter. The highest water recovery percent of 7.0 % was obtained by the RO
membrane-sucrose OA system at feed water temperature of 35oC.
0
0.5
1
1.5
2
2.5
17.5 20 22.5 25 27.5 30 32.5 35
J w (
L/m
2.h
r )
feed water teprature (°C)
Sucrose NF Glucose NF
Sucrose RO Glucose RO

Saleh Al Aswad Page 148
Figure 4.15. Effect of Feed Water Temperature on Percent Recovery Using NF and RO
Membranes at Constant Feed and Draw Solution Flow Rate (2 L/min) and OAs concentration
(200 and 250 g/L) for both sucrose and glucose respectivly
4.3.4.3. Effect on the Water Permeability
Figure 4.16 provides a comparative graph of the water permeability obtained for each
combination of a membrane (NF and RO Flat Sheet) and an osmotic agent (sucrose and
glucose). From the graph, it can be seen that the RO systems showed gradual increase in
water permeability as a result of feed water temperature increase while the NF systems
showed a gradual decline in this parameter. At the lower feed water temperature of 20 oC, the
NF membrane-glucose OA system showed the best water permeability value of 0.6
L/(m2.hr.bar).The system showed the best water permeability starting at the point of around
23-23.5 oC, and at the highest temperature of 35
oC, it showed the best water permeability
value of just 0.6 L/(m2.hr.bar). Therefore, the preferable system based on water permeability
is the RO membrane-glucose OA, which showed the second best water permeability value of
0.05 L/(m2.hr.bar) when the feed water temperature was at 20
oC, the same best value as the
NF membrane-sucrose OA system at the point of around 23-23.5 oC and by far the best value
thereafter, peaking at 0.6 L/(m2.hr.bar) at feed water temperature of 35
oC.
0
1
2
3
4
5
6
7
8
17.5 20 22.5 25 27.5 30 32.5 35
% R
Feed water temprature (°C )
Sucrose NF Glucose NF
Sucrose RO Glucose RO

Saleh Al Aswad Page 149
Figure 4.16. Effect of Feed Water Temperature on Water Permeability Using NF and RO
Membranes at Constant Feed and Draw Solution Flow Rate (2 L/min) and OAs concentration
(200 and 250 g/L) for both sucrose and glucose respectivly
4.3.4.4. Effect on the Specific Energy Consumption
Figure 4.17 provides a comparative graph of the specific energy consumption (SEC) obtained
for each combination of a membrane (NF and RO Flat Sheet) and an osmotic agent (sucrose
and glucose). From the graph, it can be seen that both the NF and RO membrane systems
showed a rapid decline in the SEC value as the feed water temperature increased. The NF
membrane-sucrose OA system showed the lowest SEC for most of the experiment which
declined from 3.0 to 0.66 kWhr/m3 as the feed water temperature grew from 20 to 35
oC.
However, at around 32 oC, the RO membrane-sucrose OA system started demonstrating
better SEC values. Eventually, at the feed water temperature of 35oC, this system showed the
most efficient energy use with the SEC value of just 1.1 kWhr/m3. Therefore, the results of
the experiment demonstrated that the NF membrane-sucrose OA system could be preferable
except when feed water temperatures achieve higher points; from there, the RO membrane –
sucrose OA system could be preferable. The initial lowest SEC value of 2.7 kWhr/m3was
obtained by the NF membrane-sucrose OA system at feed water temperature of 20 oC.
0
0.1
0.2
0.3
0.4
0.5
0.6
0.7
17.5 20 22.5 25 27.5 30 32.5 35
Aw
( L
/m2.h
r.b
ar)
Feed water tempreture (°C)
Sucrose RO Glucose RO
Sucrose NF Glucose NF

Saleh Al Aswad Page 150
Figure 4.17. Effect of Feed Water Temperature on Specific Energy Consumption Using NF
and RO Membranes at Constant Feed and Draw Solution Flow Rate (2 L/min) and OAs
concentration (200 and 250 g/L) for both sucrose and glucose respectivly
4.3.4.5. Discussion
The data in Figures 4.14 to 4.17 illustrate the effect of feed water temperature on various FO
parameters. The best water flux performance was obtained by the RO membrane-sucrose OA,
which can, therefore, be considered as preferable. The highest water flux of 2.37 was
obtained by the RO membrane-sucrose OA system at feed water temperature of 35 oC.
Whereas, the highest water recovery percent of 7.0 % was obtained by the RO membrane-
sucrose OA system at feed water temperature of 35oC. Also, the preferable system based on
water permeability is the RO membrane-glucose OA., which showed the second best water
permeability value of 0.10 L/(m2.hr.bar) when the feed water temperature was at 20
oC. Also,
The initial lowest SEC value of 2.5 kWhr/m3 was obtained by the NF membrane-sucrose OA
system at feed water temperature of 20 oC and is considered as the preferable over RO with
OAs combinations. These results are supported by Peng (2004) and, Al-Sharif and Al-
Mayahi, 2005) as presented in details is section 4.3.3.5.
0
1
2
3
4
5
6
7
8
9
17.5 20 22.5 25 27.5 30 32.5 35
SE
C (
kW
.hr/
m3 )
Feed water tempreture (°C)
Sucrose NF Glucose NF
Sucrose RO Glucose RO

Saleh Al Aswad Page 151
4.3.5 Osmotic Agent Temperature
4.3.5.1. Effect of Osmotic Agent Temperature on Water Flux
Figure 4.18 provides a comparative graph of the water flux obtained for each combination of
a membrane (NF and RO Flat Sheet) and an osmotic agent (sucrose and glucose). From the
graph, it can be seen that the RO membrane-glucose OA outperformed the others virtually at
every point of the graph. The system showed an increase of water flux from 0.17 to 0.6
L/(m2.hr)as the osmotic agent temperature rose from 20to 35
oC. This system is the preferable
system based on the water flux parameter. The highest water flux value of 0.6 L/(m2.hr)was
achieved by RO membrane-glucose system at glucose temperature of 35 oC.
Figure 4.18. Effect of OA Temperature on Water Flux Using RO and NF Membranes at
Constant Feed and Draw Solution Flow Rate (2 L/min) and and OAs concentration (200 and
250 g/L) for both sucrose and glucose respectivly
4.3.5.2. Effect on the Water Recovery Percent
Figure 4.19 provides a comparative graph of the water recovery percent obtained for each
combination of a membrane (NF and RO Flat Sheet) and an osmotic agent (sucrose and
glucose). From the graph, it can be seen that both the systems showed an increase in water
recovery percent as a result of osmotic agent temperature increase was the NF membrane –
glucose OA. The highest recovery percent at lower temperatures, specifically, 0.4 % at 20 oC
of an osmotic agent. However, it showed a sharp increase in the parameter thereafter: at
0
0.1
0.2
0.3
0.4
0.5
0.6
0.7
17.5 20 22.5 25 27.5 30 32.5 35
J w (
L /
m2.h
r )
OA temprature (°C)
Sucrose NF Glucose NF
Sucrose RO Glucose RO

Saleh Al Aswad Page 152
around 24.5 oC it no longer showed the best recovery rate, and at 35
oC of the sucrose
osmotic agent it showed the lowest recovery rate at just 0.2%. The best water recovery
percentages among the remaining systems were demonstrated by the NF membrane-sucrose
OA system. Its water recovery percentage showed the steepest increase and grew from 0.4%
to 1.7 % as the osmotic agent temperature increased from 20 to 35o C. This is, therefore, the
preferable system based on the water recovery percentage parameter. The highest water
recovery percent of 1.7 % was obtained by the NF membrane-sucrose OA system at sucrose
solution temperature of 35 oC.
Figure 4.19. Effect of OA Temperature on Percent Recovery Using NF and RO Membranes at
Constant Feed and Draw Solution Flow Rate (2 L/min) and and OAs concentration (200 and
250 g/L) for both sucrose and glucose respectivly
4.3.5.3. Effect on the Water Permeability
Figure 4.20 provides a comparative graph of the water permeability obtained for each
combination of a membrane (NF and RO Flat Sheet) and an osmotic agent (sucrose and
glucose). From the graph, it can be seen that the only system to demonstrate increasing water
permeability corresponding to increasing osmotic agent temperature was the RO membrane-
glucose OA. Specifically, it showed an increase of water permeability from 0.03 to 0.1
L/(m2.hr.bar) as the osmotic agent’s temperature grew from 20 to 35
o C. However, at the
lower temperatures (up until 27 oC) of an osmotic agent, the RO membrane-glucose OA
0
0.5
1
1.5
2
2.5
17.5 20 22.5 25 27.5 30 32.5 35
% R
OA temprature (°C)
Sucrose NF Glucose NF
Sucrose RO Glucose RO

Saleh Al Aswad Page 153
system demonstrated the superior results. Specifically, it showed the highest rate of water
permeability as 0.03 L/(m2.hr.bar) at osmotic agent’s temperature of 20
oC. Therefore, the
results of the experiment showed that based on water permeability parameter, the preferable
system at the lower temperatures of osmotic agent is the RO membrane-glucose OA system
while the NF membrane-glucose OA is preferable at the higher temperatures of osmotic
agent. The highest permeability rate in the course of the experiment was 0.1 L/(m2.hr.bar)for
the RO membrane-glucose OA system at the osmotic agent’s temperature of 35 oC.
Figure 4.20.Effect of OA Temperature on Water Permeability Using NF and RO Membranes
at Constant Feed and Draw Solution Flow Rate (2 L/min) and OAs concentration (200 and
250 g/L) for both sucrose and glucose respectivly
4.3.5.4. Effect of OA Temperature on Specific Energy Consumption (SEC)
Figure 4.21 provides a comparative graph of the specific energy consumption (SEC) obtained
for each combination of a membrane (NF and RO Flat Sheet) and an osmotic agent (sucrose
and glucose). From the graph, it can be seen that the RO membrane-glucose OA system was
the only system to demonstrate the declining SEC value as the osmotic agent temperature
grew from 20 to 35oC. Specifically, the system’s SEC declined from 1.1 to 0.6 kWhr/m
3. At
the lower temperatures, the RO membrane -glucose OA system showed the lowest SEC: at
the osmotic agent’s temperature of 20 oC, the system’s SEC was 1.0kWhr/m
3. However, this
system also demonstrated the highest decline in SEC as the osmotic agent’s temperature
grew: it reached 0.6kWhr/m3 at glucose solution temperature of 35
oC. Therefore, the results
0
0.02
0.04
0.06
0.08
0.1
0.12
17.5 20 22.5 25 27.5 30 32.5 35
Aw (
L/m
2.h
r.b
ar)
OA temprature (°C )
Sucrose NF Glucose NF Sucrose RO Glucose RO

Saleh Al Aswad Page 154
of the experiment showed that the NF membrane-glucose OA system could be preferable at
the lower temperatures of osmotic agent; however, the RO membrane-glucose OA system
would be the choice for a wider range of osmotic agent’s temperatures.
Figure 4.21. Effect of OA Temperature on Specific Energy Consumption Using NF and RO
Membranes at Constant Feed and Draw Solution Flow Rate (2 L/min) and and OAs
concentration (200 and 250 g/L) for both sucrose and glucose respectivly
4.3.5.5. Discussion
The comparison for the effect of temperature of the draw solution on water flux, recovery
percentage, water permeability and specific energy consumption is presented in Figures 4.18
to 4.21 using NF and RO membranes. The RO membrane-glucose OA showed an increase of
water flux from 0.17 to 0.6 L/(m2.hr) as the osmotic agent temperature was increased from 20
to 35 oC. This system is the preferable system based on the water flux parameter as it
outperformed the other NF membrane system. The highest water flux value of 0.6 L/(m2.hr)
was achieved by RO membrane-glucose system at glucose temperature of 35 oC. Therefore,
based on the water recovery percentage, the NF membrane-sucrose OA system is the most
suitable system at sucrose solution temperature of 35 oC with the highest water recovery
percent of 1.75 %. Furthermore, depending on the temperature and to achieve the highest
water permeability, the RO membrane-glucose system is more suitable at lower temperature.
While the NF membrane-glucose OA is preferable at the higher temperatures of osmotic
0
0.2
0.4
0.6
0.8
1
1.2
1.4
1.6
17.5 20 22.5 25 27.5 30 32.5 35
SE
C (
kW
.hr/
m3 )
OA temprature (°C )
Sucrose NF Glucose NF
Sucrose RO Glucose RO

Saleh Al Aswad Page 155
agent. With respect to SEC, the NF membrane-glucose OA system could be preferable at the
lower temperatures of osmotic agent to obtain higher SEC, while the RO membrane- glucose
OA system could be a better preposition for a wider range of osmotic agent’s temperatures.
4.3.6. Generalised Results for the Membrane-Osmotic Agent Systems
Table 4.17 summarises the outcomes of the experiments which allowed the best combinations
of membranes and osmotic agents to be determined based on manipulated factors and the
experiment parameters. Based on the experiment outcomes it is difficult to distinguish the
best system. The RO membrane-sucrose osmotic agent combination most frequently
accounted for the best results across different measured parameters, although the
combinations of NF-sucrose as an osmotic agent and NF-glucose as an osmotic agent were
not far behind. Because of this, it cannot be concluded with utmost confidence that any
combination is superior to the others within the outcomes of the conducted experiments.
Different systems could turn out better for specific parameter measures because of different
membrane and osmotic agent characteristics. Such characteristics could be, for example,
membrane compactness (NF membranes are more loose) and viscosity of the osmotic agent
materials. Accordingly, different membrane-osmotic agent systems would demonstrate
different sensitivity degrees to changes in various factors considered in this study. Therefore,
it is difficult to make a judgement about any system being superior in increasing efficiency of
the FO process.
Table 4.17. The Best Combinations of Membranes and Omsotic Agents Based on Experiment
Factors and Parameters
Water Flux Water Recovery
Rate
Water
Permeability
Specific Energy
Consumption
OA
Concentration NF-gl NF-su RO-su NF-gl
FW Flow Rate RO-su RO-su RO-su RO-su at lower flow rates
NF-gl at higher flow rates
OA Flow Rate
RO-gl at lower
flow rates
NF-gl at higher
flow rates
RO-gl at lower flow
rates
NF-su at higher flow
rates
NF-gl RO-gl
FW Temperature RO-su RO-su NF-su or RO-su RO-gl
OA Temperature RO-gl NF-su RO-gl RO-gl
*gl stands for glucose
**su stands for sucrose

Saleh Al Aswad Page 156
4.4. Binary and Ternary Osmotic Systems
4.4.1. Binary System with Deionised and Brackish Water as the Feeds
A series of experiments were conducted for the binary systems involving an osmotic agent
(sucrose or glucose) and feed water (deionised water or sea water) to determine the optimal
combinations for the most effective FO process performance. The experiments were run at
varying osmotic pressure between 10 and 60 bar using a hollow fine fibre membrane
(HFFM). The systems’ performances were measured on the bases of water flux, water
recovery percent, water permeability, specific energy consumption and solute flux verses
OPD.
4.4.1.1. Effect on the Water Flux
Figure 4.22 presents a comparative graph of the water flux values obtained for binary sucrose
and glucose systems against deionised and brackish waters as the feeds. The water flux was a
function of the osmotic pressure differential (OPD) which was varied between 10 to 60 bar
for the deionised water (DW) and brackish water (BW) experiments. As is seen from the
graph, the highest fluxes were obtained by the systems using deionised water (DW) as the
feed water. For the binary glucose-DW system, the water flux increased from 0.4 to 0.88
L/(m2.hr), and for the binary sucrose-DW system, the water flux increased from 0.35 to 0.83
L/(m2.hr). These values were substantially larger than the ones obtained by the systems using
brackish water (BW) as the feed water: the binary sucrose-BW system showed an increase
from 0.21 to 0.70 L/(m2.hr)and the binary glucose-BW system showed an increase from 0.29
to 0.76 L/(m2.hr)as the osmotic pressure differential increased from 10 to 60 bar. The
variation in the water flux between the binary systems may be due to the internal
concentration polarization (ICP) and the external concentration polarization (ECP) effects in
DW as compared to BW. Since the osmotic pressure of DW is zero, only ECP affects water
flux, thereby making it stronger than for BW feed where both ICP and ECP effects are
present. The binary glucose-DW system showed the highest water flux value of 0.70
L/(m2.hr) at the 60 bar OPD.

Saleh Al Aswad Page 157
Figure 4.22. Osmotic Pressure Differential Effect on Water Flux in a Binary System
4.4.1.2. Effect on the Water Recovery Percent
Figure 4.23 presents a comparative graph of the water recovery percentage values obtained
for binary sucrose and glucose systems with deionised and sea waters as the feed water. The
water recovery percentage was a function of the osmotic pressure differential (OPD) which
was manually varied between 10 to 60 bar for the deionised water (DW) and brackish water
(BW) experiments. As is seen from the graph, all systems demonstrated higher water
recovery percentages as a result of increasing OPD. The binary sucrose-DW system,
however, demonstrated the best recovery percentages over the entire course of the experiment
with the values increasing from 35 % to 38 % as the OPD grew from 10 to 60 bar. Therefore,
based on the results of the experiment, the sucrose-DW binary system is preferable based on
water recovery percentage criterion.
0
0.1
0.2
0.3
0.4
0.5
0.6
0.7
0.8
0.9
1
0 10 20 30 40 50 60 70
J W (
L /
m2.h
r)
Osmotic pressure differential ( Δπ in bar)
Binary sucrose vs DW Bianry glucose vs DW
Binary glucose vs BW Binary sucrose vs BW

Saleh Al Aswad Page 158
Figure 4.23. Osmotic Pressure Differential on Percent Recovery in Binary Sucrose and
Glucose System
4.4.1.3. Effect on the Water Permeability
Figure 4.24 presents a comparative graph of the water permeability values obtained for binary
sucrose and glucose systems with deionised and brackish waters as the feed water. The water
permeability was a function of the osmotic pressure differential (OPD) which was manually
varied between 10 to 60 bar. As is seen from the graph, the systems involving deionised
water (DW) as feed water demonstrated a steady decline in permeability as the OPD
increased from 10 to 60 bar. Specifically, the binary glucose-DW system demonstrated an
increase in water permeability from 0.14 to 0.43 L/(m2.hr.bar), and the binary sucrose-DW
system demonstrated an increase from 0.11 to 0.40 L/(m2.hr.bar). In contrast, the systems
using brackish water (BW) as feed water showed an increase in water permeability as the
OPD increased from 35 to 55 bar: the binary sucrose-BW system demonstrated an increase in
water permeability from 0.04 to 0.32 L/(m2.hr.bar), and the binary glucose-BW system
demonstrated an increase in water permeability from 0.075 to 0.36 L/(m2.hr.bar).
33.5
34
34.5
35
35.5
36
36.5
37
37.5
38
38.5
0 10 20 30 40 50 60 70
% R
Osmotic pressure differential ( Δπ in bar)
Binary glucose vs DW Binary surose vs DW
Binary sucrose vs BW Binary sucrose vs BW

Saleh Al Aswad Page 159
Figure 4.24. Osmotic Pressure Differential on Water Permeability in Binary Sucrose and
Glucose System
4.4.1.4. Effect of OPD on Specific Energy Consumption (SEC)
Figure 4.25 presents a comparative graph of the specific energy consumption (SEC) values
obtained for binary sucrose and glucose systems with deionised and brackish waters as the
feed water. The SEC was a function of the osmotic pressure differential (OPD) which was
manually varied between 10 to 60 bar for the experiments involving deionised water (DW)
and brackish water (BW). As is seen from the graph, all systems demonstrated a steady
increase in SEC with the increased OPD levels. The higher SEC values were measured for
the binary sucrose systems. Specifically, the sucrose-DW system showed an increase from
0.10 to 0.166 kWhr/m3 as the OPD increased from 10 to 60 bar, while the glucose-DW
system showed an increase from 0.09 to 0.15 kWhr/m3as the OPD increased from 10 to 60
bar. For the binary glucose systems the measured SEC values were substantially lower: from
0.08 to 0.15 kWhr/m3
for the glucose-DW system as the OPD grew from 10 to 60 bar, and
from 0.07 to 0.135 for the glucose-BW as the OPD grew from 10 to 60 bar. Based on the
results of the experiment, binary glucose systems showed better performance in terms of
SEC.
0
0.05
0.1
0.15
0.2
0.25
0.3
0.35
0.4
0.45
0.5
0 10 20 30 40 50 60 70
AW
(L
/m
2.h
r.b
ar)
Osmotic pressure differential ( Δπ in bar)
Binary glucose vs DW Binary sucrose vs DW
Binary glucose vs BW Binary sucrose vs BW

Saleh Al Aswad Page 160
Figure 4.25. Osmotic Pressure Differential Effect on SEC of Sucrose and Glucose OAs in a
Binary System
4.4.1.5. Effect of OPD on Solute Flux in sucrose and glucose Binary System
Figure 4.26 presents a comparative graph of the solute flux values obtained for binary sucrose
and glucose systems with deionised and sea waters as the feed water. The sugar flux was a
function of the osmotic pressure differential (OPD) which was varied between 10 to 60 bar
for the experiments involving deionised water (DW) and brackish water (BW). As is seen
from the graph, all systems in the experiment demonstrated an increase in sugar flux values
as a result of growing OPD. However, the rates of this increase were different. The systems
with deionised water as the feed water showed a gradual increase: from 2.5 to 3.75
g/(m2.hr)for the sucrose-DW system and from 2.0 to 3.58 g/(m
2.hr)for the glucose-DW
system. In contrast, the systems with brackish water as the feed water demonstrated sharp
increases in solute fluxes: from 0.13 to 3.0 L/(m2.hr)for glucose-BW and 1.6 to 3.35
L/(m2.hr) for sucrose-BW binary systems.
0
0.02
0.04
0.06
0.08
0.1
0.12
0.14
0.16
0.18
0.2
5 10 15 20 25 30 35 40 45 50 55 60 65
SE
C (
kW
.hr/
m3
)
Osmotic Pressue differntial (Δπ in bar )
Binary sucrose vs DW Binary glucose vs DW
Bianry glucose vs BW Binary sucrose vs BW

Saleh Al Aswad Page 161
Figure4.26. Osmotic Pressure Differential Effect on Solute Fluxin Binary Sucrose and Binary
Glucose Systems
4.4.1.6. Discussion
Overall, the binary study involving osmotic agents (glucose and sucrose) and two feed waters
DW and BW showed the effect of OPD on different FO parameters such Jw, % R, Aw, SEC
and Js is presented in Figures 4.22 to 4.26. It was noticed that the values of all these
parameters increased substantially with increasing the OPD. But the main effect on these
parameters in a binary system was the use of using either brackish as feed water as well as
two different osmotic agents varying in viscosity (glucose being less viscous than sucrose.
Therefore, the varying response of different parameters is due to the OA and the feed
solution. The binary glucose-DW system showed the highest water flux value of 0.70
L/(m2.hr) at the 60 bar OPD compared to other binary systems. Whereas, the sucrose-DW
binary system is preferable based on water recovery percentage criterion. On the other hand,
the binary sucrose-BW system demonstrated an increase in water permeability from 0.03 to
0.30 L/(m2.hr.bar), and the binary glucose-BW system demonstrated an increase in water
permeability from 0.07 to 0.35 L/(m2.hr.bar). While, the binary glucose systems showed
better performance in terms of SEC. The systems with deionised water as the feed water
showed a gradual increase from 2.5 to 3.5 g/(m2.hr) in solute flux or the sucrose-DW system
and from 2.0 to 3.2 g/(m2.hr)for the glucose-DW system. In contrast, the systems with
0
0.5
1
1.5
2
2.5
3
3.5
4
5 10 15 20 25 30 35 40 45 50 55 60
J s (
g /
m2.h
r)
Osmotic pressure differential (Δπ in bar )
Bianry sucrose vs DW Binary glucose vs DW
Binary sucrose vs BW Binary glucose vs BW

Saleh Al Aswad Page 162
brackish water as the feed water demonstrated sharp increases in solute fluxes: from 0.13 to
2.8 kW.hr/m3 for both sucrose and glucose binary systems.
The study results agree with those of Achilli et al. (2010) and Jeffery et al. (2006) who
reported that when using deionized water as feed water, then the differences in water fluxes
achieved by the OA (DS) may be due to the ICP in the system. They further stated that with
brackish water as feed water both the ICP and ECP play a major role in reducing the effective
osmotic pressure difference across the membrane surface thus affecting the different FO
parameters in a binary system. In an other study, Zhao and Zho (2011) reported that the
differences in the magnitude of ICP between OAs at the same osmotic pressure can be
reasonably explained by the difference in the viscosity of the osmotic agents in the study.
Jeffrey et al. (2006) concluded that the penetration of an OA with higher viscosity is much
less through the membrane layer, thereby, increasing the presence of ICP. Also, the diffusion
of solute trough the membrane porous structure is much less for a higher viscous OA than a
less viscous OA. Therefore, the flux performance of more viscous OAs will be less than the
OA with lower viscosity. In another study, Yuan Xu et al. (2010) stated that besides viscosity
of OAs, the type of interaction between the solute and the membrane may be another factor
affecting the OAs flux performance.
4.4.2. Binary System with Seawater as the Feed water
A series of experiments were conducted with sucrose and glucose as osmotic agents solution
and seawater as a feed water. The experiments were run at varying osmotic pressure between
13 and 33 bar for a hollow fine fibre membrane (HFFM). The systems’ performances were
measured on the bases of water flux and water recovery percent.
4.4.2.1. Effect on the Water Flux
Figure 4.27 presents a comparative graph of the water flux values obtained for binary sucrose
and glucose systems when brackish was used as the feed water. The water flux was a function
of the osmotic pressure differential (OPD) which was varied between 13 and 33 bar during
the experiment. As is seen from the graph, the sucrose based binary system showed a decline
in the water flux values from 0.19 to 0.11 L/(m2.hr) as the OPD increased. In contrast, the
glucose based system demonstrated a gradual increase in water flux: from .08 to 0.124
L/(m2.hr). Since both the seawater and the osmotic agents exert osmotic pressure across the
membrane surface, the water flux is affected by the magnitude of ICP and ECP across the

Saleh Al Aswad Page 163
membrane surface (active layer and the support layer sides). This may explain the different
behaviour of the systems with the different osmotic agents. Based on the results of the
experiment, binary sucrose system has a better water flux performance under lower OPDs,
while glucose based binary systems- under higher OPDs.
Figure 4.27. Comparison of Osmotic Pressure Differential Effect on Water Flux in Binary
Osmotic Systems and Seawater as the Feed Water
4.4.2.2. Effect on the Water Recovery Percent
Figure 4.28 presents a comparative graph of the water recovery percent values obtained for
binary sucrose and glucose systems when seawater was used as the feed water. The water
recovery percent was a function of the osmotic pressure differential (OPD) which was
manually varied between 13 and 33 bar during the experiment. As is seen from the graph, the
sucrose based binary system showed a decline in the water recovery percentage values: from
16% to 13% over the course of the experiment. In contrast, the glucose based system
demonstrated a gradual increase in water recovery percentage: from 12.5 % to 16 % at the
same OPD levels. The increase in % R in glucose OA plus seawater as feed water in the
binary system may due to ICP and ECP in the binary system as well as on the level of
ionization of glucose as compared to sucrose OA and seawater as feed solution in the binary
system. Also this variation in % R may be due to the difference in the viscosity of the two
organic osmotic agents being more for sucrose than glucose OA. In general, based on the
water recovery percent parameter, binary sucrose systems may be preferable under lower
0
0.02
0.04
0.06
0.08
0.1
0.12
0.14
0.16
0.18
0.2
10 15 20 25 30 35
J w (
L /
m2.h
r )
Osmotic pressure diffrentical (∆𝜋 in bar)
Sucrose OA vs SW Glucose OA vs SW

Saleh Al Aswad Page 164
OPD levels (in this experiment, under 25 bar), while glucose binary systems-for the higher
OPD levels (in this experiment, over 25 bar).
Figure 4.28. Comparison of Osmotic Pressure Differential Effect on Water Recovery Percent
in Binary Osmotic Systems and Seawater as The Feed Water
4.4.2.3. Discussion
It follows from Figures 4.27 and 4.28 that water flux and the recovery percentage were not
appreciably affected in a binary system using seawater as feed along with glucose and
sucrose as OAs. There was a mix response for the effect of OPD on these two parameters
using seawater as feed water. Based on the results of the experiment, binary sucrose system
using seawater as feed water has a better water flux performance under lower OPDs, while
glucose based binary systems-under higher OPDs. In general, based on the water recovery
percent parameter, binary sucrose systems using seawater as feed may be preferable under
lower OPD levels (in this experiment, under 25 bar), while glucose binary systems – for the
higher OPD levels (in this experiment, over 25 bar). Similar findings were reported by Achilli
et al. (2010) and Jeffery et al. (2006) who found that when using seawater or brackish water
as feed water both the ICP and ECP play a major role in reducing the effective osmotic
pressure difference across the membrane surface thus affecting the different FO parameters in
a binary system.
0
2
4
6
8
10
12
14
16
18
10 15 20 25 30 35
% R
Osmotic pressure diffrentical (∆𝜋 in bar)
Sucrose OA vs SW Glucose OA vs SW

Saleh Al Aswad Page 165
4.4.3. Ternary Systems
Several ternary osmotic systems in FO were experimentally examined in this study in order to
selection optimal osmotic agent by considering its transport behaviour. The considered
ternary systems included an osmotic agent (glucose or sucrose), salt (NaCl) and a feed water
(deionised water or brackish water). All experiments were carried out at osmotic pressure
differential from 20 to 60 bar.
Four different ternary sucrose systems were tested during the experiment:
- A mixture with the constant sucrose concentration of 134.20g/L (equivalent to 10 bar
osmotic pressure), varying NaCl concentration (between 10 and 60 bar and deionised
water as a feed water;
- A mixture with the constant NaCl concentration of 12.73 g/L (equivalent to 10 bar
osmotic pressure), varying sucrose concentration (between 10 and 60 bar) and
deionised water as a feed water;
- A mixture with the constant sucrose concentration of 134.20 g/L, varying NaCl
concentration (between 10 and 60 bar) and brackish water as a feed water;
- A mixture with the constant NaCl concentration of 12.73g/L, varying sucrose
concentration (between 10 and 60 bar) and brackish water as a feed water.
Correspondingly, four different glucose systems were tested during the experiment:
- A mixture with the constant glucose concentration of osmotic pressure bar, varying
NaCl concentration (between 10 and 60bar) and deionised water as a feed water;
- A mixture with the constant NaCl concentration of 12.73g/L, varying glucose
concentration (between 10 and 60 bar) and deionised water as a feed water;
- A mixture with the constant glucose concentration of 134.20 g/L, varying NaCl
concentration (between 10 and 60 bar) and brackish water as a feed water;
- A mixture with the constant NaCl concentration of 12.73g/L, varying glucose
concentration (between 10 and 60 bar) and brackish water as a feed water.
4.4.3.1. Sucrose Ternary Systems and Water Recovery Percent
Figure 4.29 presents a comparative graph of the water recovery percent values obtained for
four different ternary sucrose systems. The water recovery percent was a function of the
osmotic pressure differential (OPD) which was varied between 20 and 60 bar during the
experiment. As is seen from the graph, all systems demonstrated increasing water recovery
patterns with the increasing OPD values. However, the highest recovery values throughout
the experiment were obtained by the sucrose (fix) + NaCl (var) / DW system. It showed an
increase from 12.3 % to 24%. The 24% recovery rate obtained by the system at 60 bar OPD

Saleh Al Aswad Page 166
was also the highest water recovery percent obtained during the experiment. Notably, the
other sucrose system involving DW as feed water also demonstrated higher water recovery
percentage in comparison to the BW-based systems. Specifically, the sucrose (var) + NaCl
(fix) / DW system showed an increase in water recovery percentage from 11.8 % to 15%
whereas the sucrose (fix) + NaCl (var) / BW showed an increase from 6.63 % to 11.7 % and
the sucrose (var) + NaCl (fix) / BW showed an increase from 6.43 % to 8% only. This higher
% R in a ternary system verses DW may due to the stronger ionisation of the sucrose and salt
(NaCl) mixture when compared to the ternary system against BW as the feed water. Also, the
differential osmotic pressure may be much lower in a ternary system using DW than using
the BW across the membrane surface resulting in a higher % R in the experiment.
Figure 4.29. Effect of Osmotic Pressure on Water Recovery Percent in a Ternary System
(sucrose + NaCl /H2O )
4.4.3.2. Sucrose Ternary Systems and Water Flux
Figure 4.30 presents a comparative graph of the water flux values obtained for four different
ternary sucrose systems. The water flux was a function of the osmotic pressure differential
(OPD) which was varied between 20 and 60 bar during the experiment. As is seen from the
graph, all systems in the experiment demonstrated increasing water fluxes as a result of OPD
0
5
10
15
20
25
30
17.5 20 22.5 25 27.5 30 32.5 35 37.5 40 42.5 45 47.5 50 52.5 55 57.5 60
% R
Total Osmotic pressure (bar)
Sucrose fixed with variable NaCl vs DW NaCl fixed with variable sucrose vs DW
Sucrose fixed with variable NaCl vs BW NaCl fixed with variable sucrose vs BW

Saleh Al Aswad Page 167
increase. However, the highest recovery values throughout the experiment were obtained by
the sucrose (fix) + NaCl (var) / DW system. It showed an increase in water flux from 3.87
L/(m2.hr)to 7.3L/(m
2.hr). The 7.3 L/(m
2.hr) water flux obtained by the system at 60 bar OPD
was also the highest water flux obtained during the experiment. Notably, the other sucrose
system involving DW as a feed water also demonstrated higher water flux in comparison to
the BW-based systems. Specifically, the sucrose (var) + NaCl (fix) / DW system showed an
increase in water flux from 3.7 to 4.21 L/(m2.hr)whereas the sucrose (fix) + NaCl (var) / BW
showed an increase from 2.08 to 3.77 L/(m2.hr)and the sucrose (var) + NaCl (fix) / BW
showed an increase from 2.03 to 2.36 L/(m2.hr)only.
The increasingly higher Jw in a ternary system using DW may be due to the absence of
external concentration polarization as DW pressure is zero than the NaCl salt mixture as
compared to the ternary system using BW as the feed water. The use of different feed water
(DW and BW) might have affected the resulting osmotic potential of the mixture in a ternary
system which may be higher in the BW mixture than the DW mixture. This difference in the
osmotic potential may have caused higher water flux in the DW mixture than BW mixture.
Overall, the solute type and the ratio of the solutes in the mixture proved to be important
factors affecting the water flux in a ternary system. Overall systems involving deionised
water as a dissolving agent showed stronger water fluxes during the experiment.

Saleh Al Aswad Page 168
Figure 4.30. Effect of Osmotic Pressure on Water Flux in a Ternary System (sucrose + NaCl /
H2O )
4.4.3.3. Glucose Ternary Systems and Water Recovery Percent
Figure 4.31 presents a comparative graph of the water recovery percent values obtained for
four different ternary glucose systems. The water recovery percent was a function of the
osmotic pressure differential (OPD) which was manually varied between 20 and 60 bar
during the experiment. As is seen from the graph, all systems demonstrated increasing water
recovery patterns with the increasing OPD levels. However, the highest recovery values
throughout the experiment were obtained by the glucose (fix) + NaCl (var) / BW system. It
showed an increase from 8.5 % to 14.5%. The 14.5% recovery rate obtained by the system at
60 bar OPD was also the highest water recovery percent obtained during the experiment.
Notably, the other glucose system involving BW as feed water also demonstrated higher
water recovery percentage in comparison to the DW-based systems. Specifically, the glucose
(var) + NaCl (fix) / BW system showed an increase in water recovery percentage from 8.15
% to 11% whereas the glucose (fix) + NaCl (var) / DW showed an increase from 4.7% to 8.6
% and the glucose (var) + NaCl (fix) / DW showed an increase from 4% to 5.3 % only. This
higher % R in a ternary system using BW may due to the stronger ionisation of the glucose
and salt (NaCl) mixture when compared to the ternary system using DW as the feed water.
0
1
2
3
4
5
6
7
8
17.5 20 22.5 25 27.5 30 32.5 35 37.5 40 42.5 45 47.5 50 52.5 55 57.5 60
J w
( L
/m
2. h
r )
Total Osmotic pressure (bar)
Sucrose fixed with variable NaCl vs DW NaCl fixed with variable sucrose vs DW
Sucrose fixed with vaiable NaCl vs BW NaCl fixed with variable sucrose vs BW

Saleh Al Aswad Page 169
Because glucose has a lower viscosity than sucrose, higher degree of ionisation took place in
the ternary system using BW as feed water.
Figure 4.31. Effect of Osmotic Pressure on Water Recovery Percent in a Ternary System
(glucose + NaCl / H2O )
4.4.3.4. Glucose Ternary Systems and Water Flux
Figure 4.32 presents a comparative graph of the water flux values obtained for four different
ternary glucose systems. The water flux was a function of the osmotic pressure differential
(OPD) which was manually varied between 20 and 60 bar during the experiment. As is seen
from the graph, all systems in the experiment demonstrated increasing water fluxes as a result
of OPD increase. However, the highest recovery values throughout the experiment were
obtained by the glucose (fix) + NaCl (var) / BW system. It showed an increase in water flux
from 3.0 L/(m2.hr) to 5.5 L/(m
2.hr). The 5.5 L/(m
2.hr) water flux obtained by the system at 60
bar OPD was also the highest water flux obtained during the experiment. Notably, the other
glucose system involving BW as a feed water also demonstrated higher water flux in
comparison to the DW-based systems. Specifically, the glucose (var) + NaCl (fix) / BW
system showed an increase in water flux from 2.85 to 4 L/(m2.hr)whereas the glucose (fix) +
NaCl (var) / DW showed an increase from 1.9 to 3.0 L/(m2.hr)and the glucose (var) + NaCl
(fix) / DW showed an increase from 1.69 to 1.9 L/(m2.hr)only. This higher water flux in a
ternary system using BW may due to the stronger ionisation of the glucose and salt (NaCl)
0
2
4
6
8
10
12
14
16
17.5 20 22.5 25 27.5 30 32.5 35 37.5 40 42.5 45 47.5 50 52.5 55 57.5 60
% R
Total Osmotoc pressure (Bar)
Glucose fixed with avirable NaCl vs DW NaCl fixed with virable Glucose vs DW
Glucose fixed with variable NaCl vs BW NaCl fixed with variable glucose vs BW

Saleh Al Aswad Page 170
mixture when compared to the ternary system using DW as the feed water. Because glucose
has a lower viscosity than sucrose, higher degree of ionisation took place in the ternary
system using BW as a feed water.
Figure 4.32. Effect of Osmotic Pressure on Water Recovery Percent in a Ternary System
(glucose + NaCl /H2O )
4.4.3.5. Discussion
It can be seen from Figures 4.29 to 4.32 that water flux and recovery percentage increased in
the ternary systems for both OAs (sucrose and glucose) using deionized water (DW) and
brackish water (BW) as feed waters. It was noticed that the increase in the values these
parameters was considerably higher with increasing the osmotic pressure from 20 bar to 60
bar. It was also observed that the mole ratio of NaCl to any of these OAs plus DW seemed to
play a role in various fluxes due to varying osmotic pressure and ionization resulting from
addition of NaCl salt compared to the OAs (sucrose and glucose). Similar views were
expressed by many researchers who described the role of NaCl and sugar ionization on the
performance of the FO process (Narebska et al. 1987; Jiang et al. 2003; Holloway et al.
2015).But these fluxes were low when the mole ratio of OAs was wider with NaCl salt due to
less ionization. Similarly, in a ternary system using BW, the level of these fluxes is slightly
higher than a ternary system using DW. Because BW play an important role in the osmotic
pressure of a ternary system thus affecting the water flux and the recovery percentage.
0
1
2
3
4
5
6
17.5 20 22.5 25 27.5 30 32.5 35 37.5 40 42.5 45 47.5 50 52.5 55 57.5 60
Jw (
L /
m2.h
r )
Total Osmotic pressue (Bar )
Glucose fixed with variable NaCl vs DW NaCl fixed with variable glucose vs DW
Glucose fixed with variable NaCl vs BW NaCl fixed with variable Glucose vs BW

Saleh Al Aswad Page 171
Similar findings were reported by Achilli et al. (2010) and Jeffery et al. (2006) who found
that when using seawater or brackish water as feed water both the ICP and ECP play a major
role in reducing the effective osmotic pressure difference across the membrane surface thus
affecting the different FO parameters in a ternary system. In another study, Yuan Xu et al.
(2010) stated that besides viscosity of OAs, the type of interaction between the solute and the
membrane may be another factor affecting the OAs flux performance.

Saleh Al Aswad Page 172
5. CHAPTER FIVE: CONCLUSIONS
5.1. Introduction
The purpose of the study was to investigate the performance efficiency of various types of
membranes in the FO process using specific organic osmotic agents such as sucrose and
glucose versus deionised and salty feed water. The major aims and objectives of the study
were successfully met. Specifically, the study investigated the appropriateness of using a
number of selected organic osmotic agents (sucrose, glucose, NaCl) in the Forward Osmosis
process using different types of membranes (NF, RO, HFFM Flat Sheet) under varying
conditions. This was determined over the course of experiments where osmotic agent
concentration, flow rate and temperature were manipulated to determine the optimal
conditions and performance of each membrane-osmotic agent system under investigation.
The efficacy of the forward osmosis process was successfully measured in terms of water
flux, recovery percentage, water permeability, specific energy consumption, and solute flux.
Based on the experimental results, the best systems were identified for the FO part of a MOD
process. These systems provided acceptable water flux and good quality water.
This chapter provides the major conclusions of the conducted research based on the reviewed
literature as well as collected and analysed experimental data. The first set of conclusions is
drawn for the study of the forward osmosis process involving nano-filtration (NF) membrane
and reverse osmosis (RO) membranes with osmotic agent and feed water concentrations,
flow and temperatures. Accordingly, the conclusions with regards to efficacy of draw
solutions are based on the measurements of FO parameters such as water flux, water recovery
percentage, water permeability, energy consumption and solute flux. The second set of
conclusions is drawn for the binary and ternary systems for the experiments involving hollow
fine fibre (HFFM) membrane that uses an osmotic agent (sucrose or glucose) and feed water
(deionised water or brackish water) to determine the optimal combinations for the most
effective FO process performance. The system’s performance was measured based on water
flux, water recovery percentage, water permeability, specific energy consumption and solute
flux.

Saleh Al Aswad Page 173
5.1. NF Membrane Study Outcomes
5.1.1. Effect of Osmotic Agent Concentration Change
An increase in osmotic agent concentration adversely affected water flux and led to a decline
in water recovery and water permeability rates with glucose solution, demonstrating higher
permeability rates. Furthermore, increasing sucrose osmotic agent concentration increased the
specific energy consumption rates, but glucose solution showed low energy consumption.
The solute flux was not affected by increasing solution concentration.
In this study, the effect was stronger for sucrose-based solution because of its higher ionic
charge, higher concentrations required and higher rate of membrane rejection. Finally, the
rate of membrane rejection for sucrose was higher than for glucose.
5.1.2. The Effect of Feed Water Flow Rate Change
An increase in feed water flow rate resulted in higher water flux, water recovery and water
permeability for both glucose and sucrose solutions. The degree of change in water recovery
rates was similar for glucose and sucrose solutions. However, the glucose solution
demonstrated better energy consumption than sucrose solution. Use of neither of the solutions
showed changes in solute flux with changing feed water flow rates.
5.1.3. The Effect of Draw Solution Flow Rate Change
An increase in draw solution concentrations for the NF membrane resulted in higher water
flux and water permeability, but showed decreases in the specific energy consumption. Use
of neither of the solutions showed changes in solute flux with changing draw solution flow
rates.
5.1.4. The Effect of Feed Water Temperature Change
An increase in feed water temperature for the NF membrane resulted in higher water flux,
water recovery percentage and water permeability, but caused a decrease in specific energy
consumption. Use of neither of the solutions showed changes in solute flux with changing
draw solution flow rates.
5.1.5. The Effect of Draw Solution Temperature Change
It was observed that increasing the temperature of the draw solutions resulted in higher water
flux and water recovery percentage but with low water permeability and specific energy

Saleh Al Aswad Page 174
consumption. However, the use of either sucrose or glucose solution did not show any change
in solute flux with changing draw solution flow rates.
5.2. RO Membrane Study Outcomes
5.2.1. The Effect of Draw Solution Concentration Change
An increase in osmotic agent concentration showed a negative effect on water flux, water
recovery and water permeability, but demonstrated an increase in the specific energy
consumption rates. Finally, neither of the osmotic agents showed any influence on solute flux
during the experiment.
5.2.2. The Effect of Feed Water Flow Rate Change
An increase in feed water flow rate resulted in higher water flux, water recovery rates, water
permeability and energy consumption rates throughout the experiment. However, the solute
flux was not affected by using any of the osmotic agent with change in the flow rate during
the experiment.
5.2.3. The Effect of Draw Solution Flow Rate Change
An increase in osmotic agent flow rate resulted in lower water flux and water recovery rate,
but showed higher water recovery and specific energy consumption rates. Finally, neither of
the osmotic agents showed influence on solute flux during the experiment.
5.2.4. The Effect of Feed Water Temperature Change
An increase in feed water temperature caused an increase in water flux, water recovery, water
permeability and the specific energy consumption with glucose performing better than
sucrose osmotic agent throughout the experiment. Finally, neither of the osmotic agents
showed any influence on solute flux during the experiment.
5.2.5. The Effect of Draw Solution Temperature on Flow Rate Change
An increase in the temperature of the draw solution showed an increase in water flux, water
recovery and water permeability, but showed a downward trend in the specific energy

Saleh Al Aswad Page 175
consumption for both solutions. Finally, neither of the osmotic agents showed influence on
solute flux during the experiment.
5.3. Comparative Performance of NF and RO Membranes
The following conclusions are drawn from the experiments involving NF and RO
membranes:
The NF membrane proved better for multivariate osmotic agents at lower
concentration due to its large pore size compared to RO membrane, which showed
better results at high concentration due to its compact nature. This study found
sucrose to be more suitable for use with RO membrane at higher concentrations.
In terms of water flux rates, better results were achieved by using NF membrane for
both types of osmotic agents with changing osmotic agent concentration rates. The
best result was demonstrated by the combination of NF membrane and glucose as an
osmotic agent at lower concentrations and by the combination of NF membrane and
sucrose as an osmotic agent at higher concentrations.
The highest water recovery percentage was obtained with the pair of NF membrane
and sucrose, while better water permeability rates were obtained by the combination
of RO membrane and sucrose by changing the concentration.
All the combinations of membrane-osmotic agent demonstrated increases in specific
energy consumption with increasing osmotic agent concentration rates. But the lowest
energy requirements were noted for the combination of NF membrane-glucose as an
osmotic agent.
A combination of NF-membrane and sucrose gave the best water flux with increasing
feed water flow rate. On the other hand, with the same factor change, pairing of RO
membrane and sucrose osmotic agent gave the best water recovery percentage and
water permeability.
RO membrane with sucrose as an osmotic agent demonstrated the lowest energy
consumption rates at lower feed water flow rates (up to 3.5 L/min).
While different membranes show better results at different osmotic agent flow rates,
glucose proved to be the superior osmotic agent.
A combination of RO membrane-glucose as an osmotic agent demonstrated the best
rates at lower osmotic agent flow rate (up to 3.25 L/min), while at the higher rates the

Saleh Al Aswad Page 176
best water recovery was achieved by the combination NF membrane – sucrose as an
osmotic agent.
A combination of RO membrane and sucrose as an osmotic agent showed the best
water permeability rates at lower osmotic agent flow rate (up to 2.6 L/min).
At the osmotic agent flow rates above 2.6 L/min the best permeability rates were
observed for NF membrane and glucose as an osmotic agent.
The RO membrane with sucrose as an osmotic agent demonstrated the lowest energy
consumption rates at lower osmotic agent flow rates (up to 3.5 L/min).
With an increase in feed water temperature, the highest water flux rates were achieved
for the combination RO membrane-sucrose as an osmotic agent. The highest water
recovery rates during the experiment were achieved by the combination of NF
membrane and glucose as an osmotic agent.
The highest water permeability was observed for NF membrane and sucrose as an
osmotic agent at low feed water temperature (up to 22.5 oC).
The best permeability rates were observed for the combination RO membrane and
glucose as an osmotic agent with feed water temperature above 22.5 oC.
The RO membrane with sucrose as an osmotic agent showed lower energy
consumption rates with feed water temperature above 31 oC.
With an increase in osmotic agent’s temperature rate, the best water flux rates were
achieved by the combination of RO membrane and glucose as an osmotic agent. The
highest water recovery rates at lower temperatures of osmotic agent (up to 24 oC)
were observed for the combination of NF membrane and sucrose as an osmotic agent.
The best water recovery rates were obtained by the combination RO membrane –
glucose as an osmotic agent at temperatures above 24 oC.
The highest permeability rates were observed for the combination NF membrane –
glucose as an osmotic agent at temperature up to 27.5 oC.
The best permeability results were demonstrated by the combination RO membrane –
glucose as an osmotic agent with temperature above 27.5o C.
5.4. Outcomes for Binary and Ternary Systems for HFFM Membrane
The following conclusions are drawn from the experiments involving binary and ternary
systems for HFFM membrane:

Saleh Al Aswad Page 177
The DW-sucrose system showed the highest water recovery rates by increasing the
osmotic pressure differential.
The DW-glucose system demonstrated the highest permeability rates increase at
pressure levels below 40 bar.
The BW-glucose system showed the best permeability rates among the considered
systems at pressure levels above 40 bar.
At higher osmotic pressure differential levels, water permeability showed
improvements.
The BW-glucose system showed the best results for in terms of specific energy
consumption
In general, all the systems tested showed increases in energy requirements with
increasing osmotic pressure differential across the membrane surface.
With respect to the solute flux, the DW-sucrose system showed the highest values
Overall, deionised water binary systems demonstrated higher FO process efficacy
across most of the considered parameters. However, energy consumption of DW
binary systems was higher, which does not make it possible to safely conclude that
they are superior.
ECP effects were the most likely source of an increase of major parameter values for
both osmotic agents, while ICP effect was the likely reason for higher water flux in
DW binary systems.
In view of all the results obtained, neither sucrose nor glucose showed superiority as
an osmotic agent in binary systems.
The binary sucrose system showed better water flux and water recovery performances
under lower osmotic pressure differential, while glucose based binary systems showed
better performance under higher osmotic pressure differentials with the border line
around 25 bar. Neither of the systems, therefore, could be concluded as being superior
with seawater used as feed water.
Water recovery rate and water flux were considerably higher in a ternary system
involving sucrose + NaCl + DW when compared to the ternary system using brackish
water as dissolving agent in FO process.
Water recovery and water flux were considerably lower in a ternary system with
glucose + NaCl / BW compared to the system when deionised water was used as feed
solution.

Saleh Al Aswad Page 178
Overall, it appears that in a ternary mixture of glucose osmotic agent + NaCl salt +
BW, the FO efficiency is higher with respect to water recovery and water flux than
other ternary mixture with DW as dissolving agent.
The ratio of the solute and the solvent in the ternary mixture proved crucial, because
DW has no ECP. Therefore, both these parameters seem to be affected by the ratio of
the solutes in the system. Accordingly, increases in the ratio, lead to higher values for
water recovery and water flux.

Saleh Al Aswad Page 179
6. CHAPTER SIX: FUTURE WORK
Specific recommendations for future works are listed below:
- Manipulated Osmosis Desalination should be used in future to explore the factors
affecting the process’ efficacy. Specifically, MOD can be applied to conduct
experiments manipulating various membrane parameters such as thickness, porosity
and different pore diameters. Similarly, manipulating the parameters of the existing
and new osmotic agents to uncover the best conditions for FO process is a viable
direction for future research. For example, draw solution diffusivity and viscosity
parameters could have an influence on ICP and therefore, on outcomes of the FO
process. These and other physicochemical properties should be appropriately
investigated experimentally.
- Development of new membranes that are better suited for enhancing the FO process
performance is another promising research direction.
- Further investigations should be conducted for binary and ternary systems involving
different types of membranes and solutes for refining and optimising the process of
selection.
- To avoid the obstacles of the close loop circulation system, future studies should
adopt no-circulation systems for better FO performance.
- Another important limitation of the present study was the lack of simulations and
comparisons of the experimental results against mathematically modelled data. It is,
therefore, recommended that experimental results of osmotic agents in FO are
compared with the developed mathematical models.
- Future studies should focus on identifying optimal regeneration approaches.
Adsorption by granular activated carbon (GAC) could be one possible specific
direction for research. Selection of osmotic agents based on their regeneration
economics along with other important FO parameters could be undertaken by future
research.

Saleh Al Aswad Page 180
7. References
Abousnina, R.M. 2012.Oily wastewater treatment: removal of dissolved organic components
by forward osmosis. University of Wollongong. MSc. Available at
http://ro.uow.edu.au/cgi/viewcontent.cgi?article=4754andcontext=theses [Accessed 14
October 2014].
Achilli, A. and Childress, A. 2010. Pressure retarded osmosis: from the vision of Sidney
Loeb to the first prototype installation – review. Desalination, 261, 205–211.
Achilli, A., Cath, T., Marchand, E. and Childress, A. 2009.The Forward Osmosis membrane
bioreactor: a low fouling alternative to MBR processes.Desalination, 239, 10–21.
Adham, S., Oppenheimer, J., Liu, L. and Kumar, M. 2007.Dewatering reverse osmosis
concentrate from water reuse applications using forward osmosis, WateReuse Foundation
Research Report. Available at https://www.watereuse.org/product/dewatering-reverse-
osmosis-concentrate-water-reuse-applications-using-forward-osmosis-0 [Accessed 14
October 2014].
Al-Ghokailah, A., El-Ramly, N., Jamjoom, I. and Seaton, R. 1978. The world’s first large
seawater reverse osmosis desalination plant at Jeddah, Kingdom of Saudi Arabia.
Desalination, 27(3), 215-231.
Al-Harbi, O., Lehnert, K, and Al-Khafji, A. 2011.Solar water desalination. Paper presented
at The Saudi International Water Technology Conference.
Al-Hemiri, A, Sharif, A., and Hussein, M. 2009. A study of forward osmosis using various
draw agents.Iraqi Journal of Chemical and Petroleum Engineering, 10(3), 51-56.
Almashabi, D. 2014. Saudis start production at world’s biggest desalination plant.
Bloomberg, 23 April. Available at.http://www.bloomberg.com/news/2014-04-23/saudis-start-
production-at-world-s-biggest-desalination-plant.html [Accessed 14 October 2014].
Al-Mutaz, I., 2003.Coupling of a nuclear reactor to hybrid RO-MSF desalination
plants.Desalination, 157,259-268.
Altaee, A. 2012. Forward osmosis: Potential use in desalination and water reuse. Journal of
Membrane and Separation Technology, 1, 79-93.

Saleh Al Aswad Page 181
Alturki, A., McDonald, J., Khan, S. J., Hai, F. I., Price, W. E. and Nghiem, L. D. 2012.
Performance of a novel osmotic membrane bioreactor (OMBR) system: Flux stability and
removal of trace organics. Bioresource Technology, 113, 201-206.
Alves, V.D. and Coelhoso, I.M. 2002. Mass transfer in osmotic evaporation: effect of process
parameters. Journal of Membrane Science, 208 171-185.
Al-Zuhairi, A. 2008.A novel manipulated osmosis desalination process. PhD. University of
Surrey.
Anderson, D. 1977. Concentration of dilute industrial wastes by direct osmosis. Rhode
Island: University of Rhode Island Press.
Arena, J.T., McCloskey, B., Freeman, B.D. and McCutcheon, J.R. 2011. Surface
modification of thin film composite membrane support layers with polydopamine: enabling
use of reverse osmosis membranes in pressure retarded osmosis. Journal of Membrane
Science, 375, 55–62.
Armamente, P. Adsorption with granular activated carbon. New Jersey Institute of
Technology.Available at http://cpe.njit.edu/dlnotes/CHE685/Cls12-1.pdf [Accessed 14
October 2014].
Arsuaga, J.M., López-Muñoz, M.J., Aguado, J. and Sotto, A. (2008). Temperature, pH
andconcentration effects on retention and transport of organic pollutants across thin-
filmcomposite nanofiltration membranes.Desalination, 221, 253-258.
Asenjo, N., Alvarez, P., Granda, M., Blanco, C., Santamaria, R. and Menendez, R. 2011.
High performance activated carbon for benzene/toluene adsorption from industrial
wastewater. Journal of Hazardous Materials, 192, 1525-1532.
Babi, K., Koumendis, K., Makri, C., Nikolaou, A. and Lekkas, T. 2011. Adsorption capacity
of GAC pilot filter-adsorber and postfilter- adsorber for individual THMs from drinking
water, Athens.Global NEST Journal, 13(1), 50-58.
Babu, B.R., Rastogi, N.K. and Raghavarao, K.S. 2006.Effect of process parameters on
transmembrane flux during direct osmosis.Journal of Membrane Science, 280, 185–194.
Baker, R. 2004. Membrane technology and applications. 2nd
ed. London: John Wiley and
Sons.

Saleh Al Aswad Page 182
Bamaga, O.A., Yokochi, A., Zabara, B. and Babaqi, A.S. 2011. Hybrid FO/RO desalination
system: preliminary assessment of osmotic energy recovery and designs of new FO
membrane module configurations. Desalination, 268, 163–169.
Batchelder, G.W. 1965. Process for the demineralization of water, US patent 3,171,799.
Beck, R. and Schultz, J. 1970.Hindered diffusion in microporous membranes with known
pore geometry. Science, 170(3964), 1302-1305.
Bernat, X., Gibert, O., Guiu, R., Tobella, J. and Campos, C. 2010.The economics of
desalination for various uses.In Martines-Cortina, L., Garrido, A. and Lopez-Gunn, E. eds.
Rethinking water and food security: fourth Botin Foundation water workshop. London: CRC,
329-346.
Boo, C., Elimelech, M. and Hong, S. 2013. Fouling control in a forward osmosis process
integrating seawater desalination and wastewater reclamation.Journal of Membrane Science,
444, 148-156.
Bosecker, F. 2013. World’s largest SWRO plant now fully operational.IDE Technologies, 21
October. Available at http://www.ide-tech.com/new/worlds-largest-swro-desalination-plant-
now-fully-operational/ [Accessed 14 October 2014].
Brunner, R. 1990. Electrodialysis. Germany: Hans-Gunter Heitmann.
Bui, N., Lind, M.L., Hoek, E.M.V., McCutcheon, J.R. 2011. Electrospun nanofiber supported
thin film composite membranes for engineered osmosis. Journal of Membrane Science, 385–
386, 10–19.
Cai, Y., Shen, W., Loo, S.L., Krantz, W.B., Wang, R., Fane, A.G. and Hu, X. 2013. Towards
temperature driven forward osmosis desalination using Semi-IPN hydrogels as reversible
draw agents.Water Research, 47(11), 3773-3781.
Carmignani, G., Sitkiewitz, S. and Webley, J.W. 2012.Recovery of retrograde soluble solute
for forward osmosis water treatment.Trevi Systems Inc., Petaluma, CA, United States.
Cartinella, J., Cath, T., Flynn, M., Miller, G., Hunter, K. and Childress, A. 2006.Removal of
natural steroid hormones from wastewater using membrane contactor
processes.Environmental Science and Technology, 40, 7381–7386.
Catalyx. 2009. High BOD and COD carpetdyeing wastewater recycled using forward
osmosis. Membrane Technology, 4, 8.

Saleh Al Aswad Page 183
Cath, T., Adams, D. and Childress, A. 2005a. Membrane contactor processes for wastewater
reclamation in space: II. Combined direct osmosis, osmotic distillation, and membrane
distillation for treatment of metabolic wastewater.Journal of Membrane Science, 257, 111–
119.
Cath, T., Childress, A. and Elimelech, M. 2006.Forward osmosis: principles, applications,
and recent developments.Journal of Membrane Science, 281, 70-87.
Cath, T., Gormly, S., Beaudry, E., Flynn, M., Adams, V. and Childress, A. 2005b. Membrane
contactor processes for wastewater reclamation in space: part I. Direct osmotic concentration
as pretreatment for reverse osmosis.Journal of Membrane Science, 257, 85–98.
Cath, T., Hancock, N., Lundin, C., Hoppe-Jones, C. and Drewes, J. 2010.A multi-barrier
osmotic dilution process for simultaneous desalination and purification of impaired
water.Journal of Membrane Science, 362, 417–426.
Cath, T.Y., Drewes, J.E. and Lundin, C.D. 2009. A novel hybrid forward osmosis process for
drinking water augmentation using impaired water and Saline water sources.In Proceedings
of the 24th Annual WateReuse Symposium, September 13-16, Seattle, Washington.
Changrue, V., Orsat, V., Raghavan, G. and Lyew, D. 2008.Effect of osmotic dehydration on
the dielectric properties of carrots and strawberries.Journal of Food Engineering, 88, 280–
286.
Chanukya, B.S., Patil, S. and Rastogi, N.K. 2013. Influence of concentration polarization on
flux behavior in forward osmosis during desalination using ammonium bicarbonate.
Desalination, 312, 39-44.
Choi, Y.-J., Choi, J.-S., Oh, H.-J., Lee, S., Yang, D.R., Kim, J.H. 2009.Toward a combined
system of forward osmosis and reverse osmosis for seawater desalination.Desalination, 247,
239–246.
Chou, S., Shi, L., Wang, R., Tang, C.Y., Qiu, C. and Fane, A.G. 2010. Characteristics and
potential applications of a novel forward osmosis hollow fiber membrane. Desalination, 261,
365–372.
Chung, T.-S., S. Zhang, K. Y. Wang, J. Su and M. M. Ling, 2012. Forward osmosis
processes: Yesterday, today and tomorrow. Desalination, 287: 78-81.
Coday, B. and Cath, T. 2014. Forward osmosis: novel desalination of produced water and
fracturing flowback. Journal of American Water Works Association, 106(1), E55-E66.

Saleh Al Aswad Page 184
Coday, B., Xu, P., Beaudry, E., Herron, J., Lampi, K., Hancock, N. and Cath, T. 2014. The
sweet spot of forward osmosis: treatment of produced water, drilling wastewater, and other
complex and difficult liquid streams. Desalination, 333, 23-35.
Cooley, H., Gleick, P. and Wolff, G. 2006. Desalination with a grain of salt: a California
perspective. Pacific Institute. Available at http://www.pacinst.org/wp-
content/uploads/sites/21/2013/02/desalination_report3.pdf [Accessed 14 October 2014].
Cornelissen, E.R., Harmsen, D., de Korte, K.F., Ruiken, C.J., Qin, J.-J., Oo, H. and Wessels,
L.P. 2008. Membrane fouling and process performance of forward osmosis membranes on
activated sludge. Journal of Membrane Science, 319(1-2), 158-168.
Denn, M. 2012. Chemical engineering: an introduction. Cambridge: Cambridge University
Press.
Diyalinas, E., Mantzavin, D. and Diamadopoulos, E. 2008. Advanced treatment of the reverse
osmosis concentrate produced during reclamation of municipal wastewater.Water Research,
42, 4603-4608.
Dreizin, A. Tenne, D. and Hoffman D. 2008.Integrating large scale seawater desalination
plants within. Israel's water supply system.Desalination, 220(132), 132-149.
Duong, P.H.H. and Chung, T.-S. 2014. Application of thin film composite membranes with
forward osmosis technology for the separation of emulsified oilewater. Journal of Membrane
Science, 452, 117-126.
El-Aouar, В.A., Azoubel, P.M., Barbosa, J.J.L. and Xidieh Murr, F.E. Influence of the
osmotic agent on the osmotic dehydration of papaya (Carica papaya L.).Journal of Food
Engineering, 75, 267–274.
El-Dessouky, H. 2007. Seawater desalination: importance, need, methods and historical
developments. Journal of the Pakistan Materials Society, 1(1), 34-35.
El-Dessouky, H. and Ettouney, H. 2002.Fundamentals of salt water desalination. London:
Elsevier.
El-Dessouky, H., Ettouney, H. and Al-Juwayhel. 2000. Multiple effect evaporation-vapour
compression desalination processes. Chemical Engineering Research and Design, 78(4), 662-
676.

Saleh Al Aswad Page 185
Elimelech, M. and Phillip, W. 2011.The future of seawater desalination: Energy, technology,
and the environment. Science, 333(6043), 712-717.
Eren, I. and Kaymak-Ertekin, F. 2007.Optimization of osmotic dehydration of potato using
response surface methodology.Journal of Food Engineering, 79, 344–352.
Frank, B. 1972.Desalination of sea water, US Patent 3,670,897.
Fritzmann, C., Lowenberg, J., Wintgens, T. and Melin, T. 2007.State-of-the-art of reverse
osmosis desalination. Desalination, 216(1-3), 1-76.
Garcia, M., Dнaz, R., Martнnez, Y. and Casariego, A. 2010.Effects of chitosan coating on
mass transfer during osmotic dehydration of papaya.Food Research International, 43, 1656–
1660.
Garcia-Castello, E.M. and McCutcheon, J.R. 2011. Dewatering press liquor derived from
orange production by forward osmosis. Journal of Membrane Science, 372, 97–101.
Garcia-Castello, E.M., McCutcheon, J.R. and Elimelech, M. 2009.Performance evaluation of
sucrose concentration using forward osmosis.Journal of Membrane Science, 338, 61–66.
Ge, Q., Su, J., Chung, T-S.and Amy, G. 2011. Hydrophilic superparamagnetic nanoparticles:
synthesis, characterization, and performance in forward osmosis processes.Industrial and
Engineering Chemistry Research, 50, 382–388.
Geise, G.M., Lee, H.-S., Miller, D.J., Freeman, B.D., McGrath, J.E. and Paul, D.R. 2010.
Water purification by membranes: the role of polymer science. Journal of Polymer Science
Part B: Polymer Physics, 48, 1685–1718.
Gerstandt, K., Peinemann, K., Skilhagen, S., Thorsen, T. and Holt, T. 2008. Membrane
processes in energy supply for an osmotic power plant. Desalination, 224, 64–70.
Ghaffour, N. 2009.The challenge of capacity-building strategies and perspectives for
desalination for sustainable water reuse in MENA.Desalination Water Treatment, 5, 48-53.
Ghaffour, N., Missimer, T. and Amy, G. 2013. Technical review and evaluation of the
economics of water desalination: current and future challenges for better water supply
sustainability. Desalination, 309, 197-207.
Ghosh, T. and Ghosh, A. 2011. Drug delivery through osmotic systems: an overview.Journal
of Applied Pharmaceutical Science, 1(2), 38-49.

Saleh Al Aswad Page 186
Gleick, P. 2000. The world’s water 2000-2001: the biennial report on freshwater resources.
Washington, DC: Island Press.
Gleick, P., Katz, D., Lee, E., Morrison, J., Palaniappan, M., Samulon, A. and Wolff, G.
2006.The world’s water 2006-2007: the biennial report on freshwater resources.
Washington, DC: Island Press.
Glew, D. N., 1965. Process of liquid recovery and solution concentration, US Patent
3,216,930.
Global Water Intelligence. 2012. Market profile and desalination markets, 2009-2012.
Available at http://www.desaldata.com [Accessed 14 October 2014].
Graese, S., Snoeyink, V. and Lee, R. 1987.Granular activated carbon filter- adsorber
systems.Journal of American Water Works Association, 79(12), 64 -73.
Gray, G.T., McCutcheon, J.R. and Elimelech, M. 2006. Internal concentration polarization in
forward osmosis: role of membrane orientation. Desalination, 197, 1-8.
Greenlee, L., Lawler, D., Freeman, B., Marrot, B. and Moulin, P. 2009. Reverse osmosis
desalination: water sources, technology, and today’s challenges. Water Research, 43, 2317-
2348.
Gruber, M.F., Johnson, C.J., Tang, C.Y., Jensen, M.H., Yde, L. and Helix-Nielsen, C.
2011.Computational fluid dynamics simulations of flow and concentration polarization in
forward osmosis membrane systems.Journal of Membrane Science, 379, 488–495.
Gude, V., Nirmalakhand, N. and Denga, S., 2010.Renewable and sustainable approaches for
desalination.Renewable and Sustainable Energy Reviews, 14,2641-2654.
Gur-Reznik, S., Katz, I. and Dosoretz, C. 2008.Removal of dissolved organic matter by
granular-activated carbon adsorption as a pretreatment to reverse osmosis of membrane
bioreactor effluents.Water Research, 42, 1595-1605.
Hamdan, M., 2013.The study of the Osmotic Behaziour of Multi-Component Solutions. Ph.D.
Thesis. Centre for Osmosis Research and Application, Faculty of Engineering and Physical
Science, University of Surrey, Guildford, Surrey GU27XH, United Kingdom, July, 2013.
Hancock, N. and Cath, T. 2009. Solute coupled diffusion in osmotically driven membrane
processes. Environmental Science and Technology, 43(17), 6769-6775.

Saleh Al Aswad Page 187
Hancock, N., Xu, P., Heil, D., Bellona, C. and Cath T. 2011. Comprehensive bench and pilot-
scale investigation of trace organic compounds rejection by forward osmosis. Environmental
Science and Technology, 45, 8483–8490.
Hancock, N.T. and Cath, T.Y. 2009. Solute coupled diffusion in osmotically driven
membrane processes. Environmental Science and Technology, 43, 6769–6775.
Hau, N.T., Chen, S.-S., Nguyen, N.C., Huang, K.Z., Ngo, H.H. and Guo, W.
2014.Exploration of EDTA sodium salt as novel draw solution in forward osmosis process
for dewatering of high nutrient sludge.Journal of Membrane Science, 455, 305-311.
Heath, J. 2013. The water supply in Perth, Australia.ViaCorp.Available at
http://www.viacorp.com/perth_water.htm#facts [Accessed 14 October 2014].
Helix-Nielsen, C. 2010. Osmotic water purification: insights from nanoscale biomimetics.
ENT Magazine, March-April, 58-66.
Herndon, A. 2013. Energy makes up half of desalination plant cost: a study. Bloomberg, 1
May. Available at.http://www.bloomberg.com/news/2013-05-01/energy-makes-up-half-of-
desalination-plant-costs-study.html [Accessed 14 October 2014].
Hickenbottom, K., Hancock, N., Hutchings, N., Appleton, E., Beaudry, E., Xu, P. and Cath,
T. 2013. Forward osmosis treatment of drilling mud and fracturing wastewater from oil and
gas operations.Desalination, 312, 60-66.
Hoek, E.M.V. and Elimelech, M., 2003. Cake-enhanced polarization: a new fouling
mechanism for salt-rejecting membranes. Environmental Science Technology, 37, 5581-5588.
Holloway, R.W., Childress, A.E., Dennett, K.E. and Cath, T.Y. 2007.Forward osmosis for
concentration of anaerobic digester centrate.Water Research, 41(17), 4005-4014.
Holloway, R. W., R. Maltos, J. Vanneste and T. Y. Cath. 2015.Mixed draw solutions for
improved forward osmosis performance.Journal of Membrane Science, 491, 121-131.
Hoover, L.A., Phillip, W.A., Tiraferri, A., Yip, N.Y. and Elimelech, M. 2011. Forward with
osmosis: emerging applications for greater sustainability.Environmental Science and
Technology, 45(23), 9824-9830.
Hsiang, T. 2011. Modeling and optimisation of the forward osmosis process – parameters
selection, flux prediction and process applications. PhD. National University of Singapore.

Saleh Al Aswad Page 188
HTI. 2011. Oil wastewater treatment and gas wastewater treatment: lead story. Available at
http://www.htiwater.com/divisions/oil-gas/lead_story.html [Accessed 14 October 2014].
Hung, Y-T., Lo, H., Wang, L., Tariksca, J. and Li, K. 2005. Granular activated carbon
adsorption. In Wang, L., Hung, Y-T. and Shammas, N. eds. Handbook of environmental
engineering, volume 3: physiochemical treatment processes. Totowa, NJ: The Humana Press,
573-633.
Jeffery, R. L., R. L. Robert and Menachem, E. 2006. Desalination by Ammonia-carbon
dioxide forward osmosis: Influence of draw and feed solution concentration on process
performance. Journal of Membrane Science, 278, 114-123.
Jiao, B., Cassano, A. and Drioli, E. 2004. Recent advances on membrane processes for the
concentration of fruit juices: a review. Journal of Food Engineering, 63, 303–324.
Jiang, W., R. F. Childs, A. M. Mika and J. M. Dickson. 2003. Pore-filled membranes capable
of selective negative rejections. Nature and Science, 1(1), 21-26.
Jusoh, A., Shiung, L., Ali, N. and Noor, M. 2007. A simulation study of the removal
efficiency of granular activated carbon on cadmium and lead.Desalination, 206, 9-16.
Kessler, J.O. and Moody, C.D. 1976. Drinking water from sea water by forward
osmosis.Desalination, 18, 297–306.
Khoyi, M.R. and Hesari, J. 2007. Osmotic dehydration kinetics of apricot using sucrose
solution.Journal of Food Engineering, 78, 1355–1360.
Kim, S., Ko, S., Kang, K. and Han, J. 2010. Direct seawater desalination by ion concentration
polarization.Nature Nanotechnology, 5, 297-301.
Kim, T., Kim, Y., Yun, C., Jang, H., Kim, W. and Park, S. 2012.Systematic approach for
draw solute selection and optimal system design for forward osmosis
desalination.Desalination, 284, 253-260.
Kim, T.-W., Kim, Y., Yun, C., Jang, H., Kim, W. and Park, S. 2012.Systematic approach for
draw solute selection and optimal system design for forward osmosis
desalination.Desalination, 284, 253–260.
Kravath, R. and Davis, J. 1975. Desalination of seawater by direct osmosis.Desalination, 16,
151–155.

Saleh Al Aswad Page 189
Krukowski, J. 2001. Opening the black box: Regulations and recycling drive use of
membrane technologies.Pollution Engineering, 33, 20-25.
Kurihara, M. and Hanakawa, M. 2013. Mega-ton water system: Japanese national research
and development project on seawater desalination and wastewater reclamation. Desalination,
308(2), 131-137.
Lay, W.C.L., Zhang, Q., Zhang, J., McDougald, D., Tang, C., Wang, R., Liu, Y. and Fane,
A.G. 2011. Study of integration of forward osmosis and biological process: membrane
performance under elevated salt environment. Desalination, 283, 123-130.
Lee, E. 2010.Saudi Arabia and desalination.Harvard International Review.Available at
http://hir.harvard.edu/pressing-change/saudi-arabia-and-desalination-0 [Accessed 14 October
2014].
Lee, K., Baker, R. and Lonsdale, H. 1981. Membranes for power generation by pressure-
retarded osmosis.Journal of Membrane Science, 8, 141-171.
Lee, S., Boo, C., Elimelech, M. and Hong, S. 2010. Comparison of fouling behavior in
forward osmosis (FO) and reverse osmosis (RO).Journal of Membrane Science, 365, 34–39.
Lewis, E. 1982.The practical salinity scale of 1978 and its antecedents.Marine Geodesy, 5(4),
350-357.
Li, D., Zhang, X., Yao, J., Simon, G. and Wang, H. 2011. Stimuli-responsive polymer
hydrogels as a new class of draw agent for forward osmosis desalination. Chemical
Communications, 47, 1710–1712.
Li, W., Gao, Y. and Tang, C.Y. 2011. Network modeling for studying the effect of support
structure on internal concentration polarization during forward osmosis: model development
and theoretical analysis with FEM. Journal of Membrane Science, 379, 307–321.
Li, Z., Valladares Linares, R., Abu-Ghdaib, M., Zhan, T., Yangali-Quintanilla, V. and Amy,
G. 2014.Osmotically driven membrane process for the management of urban runoff in coastal
regions.Water Research, 48, 200-209.
Li, Z., Valladares Linares, R., Muhannad, A. and Amy, G. 2013. Comparative assessment of
forward osmosis (FO) niches in desalination. In Proceedings of IDA World Congress,
October 20-25, 2013, Tianjin, China.

Saleh Al Aswad Page 190
Lin, Y.-K.and Ho, H.-O. 2003. Investigations on the drug releasing mechanism from an
asymmetric membrane-coated capsule with an in situ formed delivery orifice. Journal of
Controlled Release, 89, 57–69.
Ling, M.M. and Chung, T.-S. 2011. Desalination process using super hydrophilic
nanoparticles via forward osmosis integrated with ultrafiltration regeneration. Desalination,
278, (1-3), 194-202.
Liu, Z., Bai, H., Lee, J. and Sun, D. 2011. A low-energy forward osmosis process to produce
drinking water. Energy and Environmental Science, 4, 2582–2585.
Loeb, S. and Norman, R.S. 1975.Osmotic power plants.Science, 189(4203), 654-655.
Loeb, S. and Sourirajan, S. 1963.Saline water conversion II – advances in chemistry series.
Washington, DC: American Chemical Society.
Loeb, S., Van Hessen, F. and Shahaf, D. 1976. Production of energy from concentrated brines
by pressure-retarded osmosis: II. Experimental results and projected energy costs. Journal of
Membrane Science, 1, 249-269.
Lombard, G.E., Oliveira, J.C., Fito, P. and Andres, A. 2008.Osmotic dehydration of
pineapple as a pre-treatment for further drying.Journal of Food Engineering, 85(2), 277–284.
Maliva, R., Guo, W. and Missimer, T. 2006. Aquifier storage and recovery: recent
hydrogeological advances and system performance. Water Environment Research, 78, 2428-
2435.
Martinetti, C., Childress, A. and Cath, T. 2009. High recovery of concentrated RO brines
using forward osmosis and membrane distillation. Journal of Membrane Science, 331, 31-39.
McCutcheon, J., McGinnis, R. and Elimelech, M. 2005. A novel ammonia–carbon dioxide
forward (direct) osmosis desalination process.Desalination, 174, 1–11.
McCutcheon, J. R. and Elimelech, M. 2007. Modeling water flux in forward osmosis:
implications for improved membrane design.AIChE Journal, 53, 7-10.
McGinnis, R. 2002. Osmotic desalination process, US Patent 6,391,205 B1.
McGinnis, R. and Elimelech, M. 2007. Energy requirements of ammonia-carbon dioxide
Forward Osmosis desalination.Desalination, 207, 370-382.

Saleh Al Aswad Page 191
McGinnis, R.L., Hancock, N.T., Nowosielski-Slepowron, M.S. and McGurgan, G.D. 2013.
Pilot demonstration of the NH3/CO2 forward osmosis desalination process on high salinity
brines. Desalination, 312, 67-74.
Meena, K., Rajagopal, C. and Mishra, G. 2010. Removal of heavy metal ions from aqueous
solutions using chemically (Na2S) treated granular activated carbon as adsorbent. Journal of
Scientific and Industrial Research, 69, 449-463.
Mehta, G. and Loeb, S. 1978. Performance of permasep B-9 and B-10 membranes in various
osmotic regions and at high osmotic pressures.Journal of Membrane Science, 4, 335–349.
Mehta, G.D. and Loeb, S. 1979. Internal polarization in the porous substructure of a
semipermeable membrane under pressureretarded osmosis.Journal of Membrane Science, 4,
261-265.
Mezher, T., Fath, H., Abbas, Z. and Khaled, A. 2011.Techno-economic assessment and
environmental impacts of desalination technologies.Desalination, 266, 263-273.
Mi, B. and Elimelech, M. 2010a. Gypsum scaling and cleaning in forward osmosis:
measurements and mechanisms. Environmental Science and Technology, 44, 2022–2028.
Mi, B. and Elimelech, M. 2010b. Organic fouling of forward osmosis membranes: fouling
reversibility and cleaning without chemical reagents. Journal of Membrane Science, 348,
337-345.
Miller J. and Evans, L. 2006.Forward osmosis: a new approach to water purification and
desalination. Sandia Report. Available at http://prod.sandia.gov/techlib/access-
control.cgi/2006/064634.pdf [Accessed 14 October 2014].
Mohan, D. and Pittman, C. 2007. Arsenic removal from water/wastewater using adsorbents -
a critical review.Journal of Hazardous Materials, 142, 1-53.
Moody, C. and Kessler, J. 1976. Forward osmosis extractors.Desalination, 18, 283–295.
Mulder, M. 1996. Basic principles of membrane technology. Dordrecht: Kluwer Academic
Publishers.
Nagaraj, N., Patil, G., Babu, R., Hebbar, U. H., Raghavarao, K. S., and Nene, S. 2006. Mass
transfer in osmotic membrane distillation.Journal of Membrane Science, 268, 48–56.

Saleh Al Aswad Page 192
Narebska, A., W. Kujawski and A. Koter. 1987. Irreversible thermodynamics of
transportacross charged membranes. Part-II- Ion-water interactions in permeation of
alkali.Journal of Membrane Science, 30, 125-140.
Nayak, C.A. and Rastogi, N.K. 2010.Forward osmosis for the concentration of anthocyanin
from Garcinia indica Choisy.Separation and Purification Technology, 71,144–151.
Nelson, C. and Ghosh, A. 2011.Membrane technology for produced water in Lea
County.Available at http://www.netl.doe.gov/file%20library/Research/oil-gas/nt0005227-
final-report.pdf [Accessed 14 October 2014].
Nicoll, P. G. 2011. Manipulated osmosis-an alternative to reverse osmosis. Climate Control
Middle East, April 2011, 46–49.
Nicolaisen, B. 2002. Developments in membrane technology for water treatment.
Desalination, 153, 355-360.
Norton, N., Sadiq, A. and Norton, V. 2003. Desalination as a water source for municipal and
industrial water users: the future is now. In Proceedings of the 2003 Georgia Water
Resources Conference, Georgia University, April 23-24.Available at
https://smartech.gatech.edu/bitstream/handle/1853/48402/Norton_6.2.5.pdf?sequence=1
[Accessed 4 October 2014].
Ozdemir, M., Ozen, B.F., Dock, L.L. and Floros, J.D. 2008. Optimization of osmotic
dehydration of diced green peppers by response surface methodology, LWT-Food.Science
and Technology, 41, 2044–2050.
Pabby, A., Rizvi, S. and Requena, A. (2015).Handbook of membrane separations: Chemical,
pharmaceutical, food, and biotechnological applications. Boca Raton, FL: CRC Press.
Pankratz, T. 2008. Global trends and challenges in seawater desalination. MEDRC
workshop on Membrane Technology Used in Desalination and Wastewater Treatment for
Reuse, Muscat, Oman.Available at http://multi-
statesalinitycoalition.com/storage/summit/2008/2008summit_trends.pdf [Accessed 14
October 2014].
Park, K.J., Bin, A., Reis Brod, F.P. and Brandini Park, T.H.K. 2002.Osmotic dehydration
kinetics of pear D’anjou (Pyrus communis L.).Journal of Food Engineering, 52, 293–298.

Saleh Al Aswad Page 193
Park, M., Leea, J. J., Lee, S and Kim, J. H., 2011. Determination of a constant membrane
structure parameters in forward osmosis processes. Journal of Membrane Science, 284, 237-
247.
Pattle, R. 1954. Production of electric power by mixing fresh and salt water in the
hydroelectric pile.Nature, 174, 660-670.
Peng, H., Volchek, H., MacKinnon, M., Wong, W. and Brown, C. 2004.Application of
nanofiltration to water management options for oil sands operations. Desalination, 170, 137-
150.
Petersen, R.J. 1993. Composite reverse osmosis and nanofiltration membranes.Journal of
Membrane Science, 83, 81–150.
Petrotos, K. and Lazarides, H. 2001. Osmotic concentration of liquid foods.Journal of Food
Engineering, 49, 201–206.
Petrotos, K., Quantick, P. and Petropakis, H. 1998. A study of the direct osmosis
concentration of tomato juice in tubular membrane-module configuration.The effect of
certain basic parameters on the process performance.Journal of Membrane Science, 150, 99-
110.
Petrotos, K.B., Quantick, P.C. and Petropakis, H. 1999. Direct osmotic concentration of
tomato juice in tubular membrane – module configuration. II. The effect of using clarified
tomato juice on the process performance. Journal of Membrane Science, 160, 171–177.
Petrotos, K.B., Tsiadi, A.V., Poirazis, E., Papadopoulos, D., Petropakis, H. and Gkoutsidis, P.
2010. A description of a flat geometry direct osmotic concentrator to concentrate tomato juice
at ambient temperature and low pressure.Journal of Food Engineering, 97, 235–242.
Phuntsho, S., Shon, H.K., Hong, S., Lee, S. and Vigneswaran, S., 2011. A novel low energy
fertilizer driven forward osmosis desalination for direct fertigation: evaluating the
performance of fertilizer draw solutions. Journal of Membrane Science, 375, (1-2), 172-181.
Popper, K., Camirand, W.M., Nury, F. and Stanley, W.L. 1966. Dialyzer concentrates
beverages. Journal of Food Engineering, 38, 102–104.
Popper, K., Merson, R. and Camirand, W. 1968.Desalination by osmosis-reverse osmosis
couple.Science, 159(3821), 1364-1365.

Saleh Al Aswad Page 194
Porteous, A. ed. 1983.Desalination technology, developments and practice. London: Applied
Science.
Post, J., Hamelers, H. and Buisman, C. 2008.Energy recovery from controlled mixing salt
and fresh water with a reverse electrodialysis system.Environmental Science and Technology,
42, 5785–5790.
Prud’homme, A. 2012.The ripple effect: the fate of freshwater in the twenty first century.
New York: Scribner.
Qin, J.J., Chen, S., Oo, M.H., Kekre, K.A., Cornelissen, E.R. and Ruiken, C.J. 2010.
Experimental studies and modeling on concentration polarization in forward osmosis. Water
Science and Technology, 61, 2897–2904.
Qin, J.-J., Kekre, K.A., Oo, M.H., Tao, G., Lay, C.L., Lew, C.H., Cornelissen, E.R. and
Ruiken, C.J. 2010. Preliminary study of osmotic membrane bioreactor: effects of draw
solution on water flux and air scouring on fouling. Water Science Technology, 62(6), 8.
Qiu, C., Qi, S. and Tang, C. 2011.Synthesis of high flux forward osmosis membranes by
chemically crosslinked layer-by-layer polyelectrolytes.Journal of Membrane Science, 381,
74–80.
Qiu, C., Setiawan, L., Wang, R., Tang, C.Y. and Fane, A.G. 2012. High performance flat
sheet forward osmosis membrane with an NF-like selective layer on a woven fabric
embedded substrate. Desalination, 287, 266-270.
Quteishat, K. 2009. Desalination and water affordability.In Proceedings of SITeau
International Conference, Casablanca, Morocco.
Pabby, A., Rizvi, S. and Requena, A. (2015).Handbook of membrane separations: Chemical,
pharmaceutical, food, and biotechnological applications. Boca Raton, FL: CRC Press.
Ramon, G.Z., Feinberg, B.J. and Hoek, E.M. 2011. Membrane-based production of salinity-
gradient power.Energy and Environmental Science, 4(11), 4423-4434.
Rassoul, G., Al-Alawy, A.F. and Khudair, W.N. 2012.Reduction of concentrating poisonous
metallic radicals from industrial wastewater by forward and reverse osmosis.Journal of
Engineering, 18(7), 784-798.
Rastogi, N. and Nayak, C. (2011).Membranes for forward osmosis in industrial
applications.In Basile, A. and Nunez, S. Advanced membrane science and technology for

Saleh Al Aswad Page 195
sustainable energy and environmental applications. Cambridge: Woodhead Publishing, pp.
680-718.
Reddy, K.V. and Ghaffour, N. 2007.Overview of the cost of desalinated water and costing
methodologies.Desalination, 205, 340–353.
Reid, C.E. and Breton, E.J. 1959. Water and ion flow across cellulosic membranes. Journal
of Applied Polymer Science, 1, 133–143.
Reid, C.E. and Kuppers, J.R. 1959.Physical characteristics of osmotic membranes of organic
polymers.Journal of Applied Polymer Science, 2, 264–272.
Sablani, S.S., Goosen, M.F.A., Al-Belushi, R. and Wilf, M. 2001. Concentration polarization
in ultrafiltration and reverse osmosis: a critical review. Desalination, 141, 269–289.
Sairam, M., Sereewatthanawut, E., Li, K., Bismarck, A. and Livingston, A.G. 2011.Method
for the preparation of cellulose acetate flat sheet composite membranes for forward osmosis –
desalination using MgSO4 draw solution.Desalination, 273, 299–307.
Salter, R. 2006.Forward osmosis.Water Conditioning and Purification, April, 36-38.
Sandler, S. 1999. Chemical and engineering thermodynamics. New York: Wiley.
Santus, G. and Baker, R.W. 1995. Osmotic drug delivery: a review of the patent literature,
Journal of Controlled Release, 35, 1–21.
Saren, Q., Qiu, C.Q. and Tang, C.Y. 2011. Synthesis and characterization of novel forward
osmosis membranes based on layer-by-layer assembly. Environmental Science and
Technology, 45, 5201–5208.
Schiermeier, Q. 2008. Water: purification with a pinch of salt. Nature, 452, 260-261.
Service, R. 2006. Desalination freshens up. Science, 313, 1088-1090.
Setiawan, L., Wang, R., Li, K. and Fane, A.G. 2011. Fabrication of novel poly(amide–imide)
forward osmosis hollow fiber membranes with a positively charged nanofiltration-like
selective layer. Journal of Membrane Science, 369, 196–205.
Shannon, M., Bohn, P., Elimelech, M., Georgiadis, J., Marinas, B. and Mayes, A.
2008.Science and technology for water purification in the coming decades.Nature,
546(7185), 301-310.

Saleh Al Aswad Page 196
Sharif A. O. and Al-Mayahi A. 2005.Solvent removal method.Patent application No.WO
2005/012185 A.
Sharif, A. O. and Al-Mayahi, A. K. 2011.Solvent removal process, European Patent No.EP
1,651,570.
Sharma, R.R. and Chellam, S.(2006). Temperature and concentration effects on electrolyte
transportacross porous thin-film composite nanofiltration membranes: Pore transport
mechanisms and energetics of permeation. Journal of Colloid and Interface Science, 298,
327-340.
Song, X., Liu, Z. and Sun, D.D. 2011. Nano gives the answer: breaking the bottleneck of
internal concentration polarization with a nanofiber composite forward osmosis membrane
for a high water production rate. Advanced Materials, 23, 3256–3260.
Sorlini, S. and Collivignarelli, C. 2005.Chlorite removal with granular activated
carbon.Desalination, 176, 255–265.
Stache, K. (1989). Apparatus for transforming seawater, brackishwater, polluted water or
the like into a nutrious drink by means of osmosis. US Patent 4,879,030.
Stanley, B. and Muller, C. 2002. Choosing an odor control technology – effectiveness and
cost considerations.In Proceedings of Odors and Toxic Air Emissions 2002 – WEF
Albuquerque, NM.Available at http://www.purafil.com/literature/odor-control-cost-
considerations.pdf [Accessed 14 October 2014].
Statkraft. 2014. Osmotic power. Available at
http://www.statkraft.com/aboutstatkraft/innovation/osmotic-power/ [Accessed 14 October
2014].
Stevens, D. and Loeb, S. 1967. Reverse osmosis desalination costs derived from the Coalinga
pilot plant operation. Desalination, 2(1), 56-74.
Su, J., Yang, Q., Teo, J.F. and Chung, T.-S. 2010. Cellulose acetate nanofiltration hollow
fiber membranes for forward osmosis processes. Journal of Membrane Science, 355, 36–44.
Sun, D-W. (2015). Emerging technologies for food processing. London: Elsevier.
Talaat, K.M. 2009.Forward osmosis process for dialysis fluid regeneration.Artificial Organs,
33, 1133–1135.

Saleh Al Aswad Page 197
Talaat, K.M. 2010. Dialysis fluid generation by forward osmosis: a feasible option for
ambulatory dialysis systems. Saudi Journal of Kidney Diseases and Transplantation, 21,
748–749.
Tan, C.H. and Ng, H.Y. Modified models to predict flux behavior in forward osmosis in
consideration of external and internal concentration polarizations.Journal of Membrane
Science, 324, 209–219.
Tang, W. and Ng, H.Y.2008. Concentration of brine by forward osmosis: performance and
influence of membrane structure. Desalination, 224, 143–153.
Teoh, M., Bonyadi, S. and Chung, T. 2008.Investigation of different hollow fiber module
designs or flux enhancement in the membrane distillation process.Journal of Membrane
Science, 311(1-2), 371–379.
The United Nations World. 2009. Water development report 3: water in a changing world.
UNESCO Publishing.Available at
http://webworld.unesco.org/water/wwap/wwdr/wwdr3/pdf/WWDR3_Water_in_a_Changing_
World.pdf [Accessed 14 October 2014].
Thombre, A.G., Cardinal, J.R., DeNoto, A.R., Herbig, S.M., and Smith, K.L. 1999.
Asymmetric membrane capsules for osmotic drug delivery: I. Development of a
manufacturing process. Journal of Controlled Release, 57, 55–64.
Thompson, N. and Nicoll, P. 2011. Forward osmosis desalination: a commercial reality. In
Proceedings of IDA World Congress – Perth Convention and Exhibition Centre (PCEC),
Perth, Western Australia, September 4-9, 1-16.
Thorsen, T. and Holt, T. 2009. The potential for power production from salinity gradients by
pressure retarded osmosis. Journal of Membrane Science, 335, 103–110.
Tiraferri, A., Yip, N.Y., Phillip, W.A., Schiffman, J.D. and Elimelech, M. 2011. Relating
performance of thin-film composite forward osmosis membranes to support layer formation
and structure.Journal of Membrane Science, 367, 340–352.
Torringa, H. M., Nijhues, H. H. and Bartels, P. V. 2001.Osmotic dehydration as a
pretreatment before conventional microwave-hot-air drying of mushrooms.Journal of Food
Agriculture, 49(2-3), 185-191.

Saleh Al Aswad Page 198
Uddin, M.B., Ainsworth, P. and Ibanoglu, S. 2004. Evaluation of mass exchange during
osmotic dehydration of carrots using response surface methodology.Journal of Food
Engineering, 65, 473–477.
UNDP 2006.Human development report.Available at
http://hdr.undp.org/sites/default/files/reports/267/hdr06-complete.pdf [Accessed 14 October
2014].
Valladares Linares, R., Li, Z., Abu-Ghdaib, M., Wei, C.-H., Amy, G. and Vrouwenvelder,
J.S. 2013. Water harvesting from municipal wastewater via osmotic gradient: an evaluation
of process performance. Journal of Membrane Science, 447, 50-56.
Valladares-Linares, R., Li, Z., Sarp, S., Bucs, Sz.S., Amy, G. and Vrouwenvelder, J. 2014.
Forward osmosis niches in seawater desalination and wastewater reuse. Water Research, 66,
122-139.
Van der Vegt, H., Iliev, I., Tannock, Q. and Helm, S. 2011. Patent landscape report on
desalination technologies and the use of alternative energies for desalination.
WIPO.Available at
http://www.wipo.int/patentscope/en/programs/patent_landscapes/documents/patent_landscap
es/948-2E-WEB.pdf [Accessed 14 October 2014].
Veerman, J., Saakes, M., Metz, S.J. and Harmsen, G.J. 2009. Reverse electrodialysis:
performance of a stack with 50 cells on the mixing of sea and river water. Journal of
Membrane Science, 327, 136–144.
Votta, F., Barnett, S. and Anderson, D. 1974. Concentration of industrial waste by direct
osmosis: completion report. Providence: Rhode Island.
Wang, C., Ho, H., Lin, L., Lin, Y. and Sheu, M. 2005. Asymmetric membrane capsules for
delivery of poorly water-soluble drugs by osmotic effects. International Journal of
Pharmaceutics, 297, 89–97.
Wang, K., Yang, Q., Chung, T-S.and Rajagopalan, R. 2009. Enhanced forward osmosis from
chemically modified polybenzimidazole (PBI) nanofiltration hollow fiber membranes with a
thin wall.Chemical Engineering Science, 64, 1577–1584.

Saleh Al Aswad Page 199
Wang, K.Y., Chung, T.-S.and Qin, J.-J. 2007. Polybenzimidazole (PBI) nanofiltration hollow
fiber membranes applied in forward osmosis process. Journal of Membrane Science, 300, 6–
12.
Wang, K.Y., Ong, R.C. and Chung, T.-S. 2010. Double-skinned forward osmosis membranes
for reducing internal concentration polarization within the porous sublayer. Industrial and
Engineering Chemistry Research, 49, 4824–4831.
Wang, K.Y., Teoh, M.M., Nugroho, A. and Chung, T.-S. 2011. Integrated forward osmosis–
membrane distillation (FO–MD) hybrid system for the concentration of protein solutions.
Chemical Engineering Science, 66, 2421–2430.
Wang, R., Shi, L., Tang, C.Y., Chou, S., Qiu, C. and Fane, A.G.2010. Characterization of
novel forward osmosis hollow fiber membranes.Journal of Membrane Science, 355, 158–
167.
Water Development Report, 2009.Available at http://www.unwater.org/publications/world-
water-development-report/en/ [Accessed 14 October 2014].
Wei, J., Qiu, C., Tang, C.Y., Wang, R. and Fane, A.G. 2011. Synthesis and characterization
of flat-sheet thin film composite forward osmosis membranes. Journal of Membrane Science,
372, 292–302.
Welty, J. R., Wicks, C. E., Wilson, R. E. and Rorrer, G. 2001.Fundamentals of momentum,
heat and mass transfer. New York: John Wiley and Sons.
Widjojo, N., Chung, T.-S., Weber, M., Maletzko, C. and Warzelhan, V. 2011.The role of
sulphonated polymer and macrovoid-free structure in the support layer for thin-film
composite (TFC) forward osmosis (FO) membranes.Journal of Membrane Science, 383, 214–
223.
Xiao, D., Tang, C.Y., Zhang, J., Lay, W.C.L., Wang, R. and Fane, A.G. 2011. Modeling salt
accumulation in osmotic membrane bioreactors: implications for FO membrane selection and
system operation.Journal of Membrane Science, 366, 314–324.
Xie, M., Nghiem, L.D., Price, W.E. and Elimelech, M. 2013. A forward osmosis membrane
distillation hybrid process for direct sewer mining: system performance and limitations.
Environmental Science and Technology, 47(23), 13486-13493.

Saleh Al Aswad Page 200
Xie, M., Price, W., Nghiem, L. and Elimelech, M. (2013). Effects of feed and draw solution
temperature andtransmembrane temperature difference on therejection of trace organic
contaminants by forwardosmosis. Journal of Membrane Science, 438, 57-64.
Yang, Q., Wang, K. and Chung, T-S. 2009. Dual-layer hollow fibers with enhanced flux as
novel forward osmosis membranes for water production. Environmental Science and
Technology, 43, 2800–2805.
Yang, Q., Wang, K.Y. and Chung, T.-S. 2009. A novel dual-layer forward osmosis
membrane for protein enrichment and concentration. Separation and Purification
Technology, 69, 269–274.
Yangali-Quintanilla, V., Li, Z., Valladares, R., Li, Q. and Amy, G. 2011. Indirect
desalination of Red Sea water with forward osmosis and low pressure reverse osmosis for
water reuse. Desalination, 280, (1-3), 160-166.
Yap, W.J., Zhang, J., Lay, W.C.L., Cao, B., Fane, A.G. and Liu, Y. 2012. State of the art of
osmotic membrane bioreactors for water reclamation.Bioresource Technology, 122, 217-222.
Yen, S.K., Mehnas Haja, F., Su, N.M., Wang, K.Y. and Chung, T.-S. 2010. Study of draw
solutes using 2-methylimidazole-based compounds in forward osmosis. Journal of Membrane
Science, 364, 242–252.
Yip, N., Tiraferri, A., Phillip, W., Schiffman, J., Hoover, L., Kim, Y. and Elimelech, M.
2011. Thin-film composite pressure retarded osmosis membranes for sustainable power
generation from salinity gradients. Environmental Science and Technology, 45, 4360–4369.
Yip, N.Y. and Elimelech, M. 2012. Thermodynamic and energy efficiency analysis of power
generation from natural salinity gradients by pressure retarded osmosis. Environmental
Science and Technology, 46(9), 5230-5239.
York, R., Thiel, R. and Beaudry, E. 1999. Full-scale experience of direct osmosis
concentration applied to leachate management. In Proceedings of the 7th
International Waste
Management and Landfill Symposium, Sardinia, Italy.
Younos, T. 2005. Desalination: supplementing freshwater supplies approaches and
challenges. Journal of Contemporary Water Research and Education, 132(1), 1-2.
Younos, T. and Tulou, K. 2005.Overview of desalination techniques.Journal of
Contemporary Water Research and Education, 132, 3-10.

Saleh Al Aswad Page 201
You, S-J., Wang,X.-H., Zhong, M., Zhong, Y-J., Yu, C. and Ren, N.-Q., 2012. Temperature
as a factor affecting transmembrane water flux in forward osmosis: Steady-state modeling
and experimental validation. Chemical Engineering Journal, 198-199, 52-60.
Yuan, X., X. Peng, C.Y. Tang, Q.S. Fu, S. Nie, 2010. Effect of draw solution
concentrationand operating conditions on forward osmosis and pressure retarded osmosis
performance in aspiral wound module. Journal of Membrane Science, 348 (1-2), 298-309.
Zhang, F., Brastad, K.S. and He, Z. 2011.Integrating forward osmosis into microbial fuel
cells for wastewater treatment, water extraction and bioelectricity generation.Environmental
Science and Technology, 45 (15), 6690-6696.
Zhang, J., Loong, W.L.C., Chou, S., Tang, C., Wang, R. and Fane, A.G. 2012. Membrane
biofouling and scaling in forward osmosis membrane bioreactor. Journal of Membrane
Science, 403, 8-14.
Zhang, S., Wang, K.Y., Chung, T.-S., Chen, H., Jean, Y.C. and Amy, G. 2010. Well-
constructed cellulose acetate membranes for forward osmosis: minimized internal
concentration polarization with an ultra-thin selective layer. Journal of Membrane Science,
360, 522–535.
Zhang, T., Surampalii, R., Vigneswaran, S., Tyagi, R., Ong, S. and Kao, C. 2012.Membrane
technology and environmental applications. Reston, VA: ASCE Publishing.
Zhao, S. and Zou, L. 2011.Relating solution physicochemical properties to internal
concentration polarization in forward osmosis.Journal of Membrane Science, 379, 459–467.
Zhao, S., Zou, L. and Mulcahy, D. 2012.Brackish water desalination by a hybrid forward
osmosisnanofiltration system using divalent draw solute.Desalination, 284, 175-181.
Zhao, S., Zou, L., Tang, C. and Mulcahy, D. 2012. Recent developments in forward osmosis:
opportunities and challenges. Journal of Membrane Science, 396, 1-21.
Zou, S., Gu, Y., Xiao, D. and Tang, C.Y. 2011. The role of physical and chemical parameters
on forward osmosis membrane fouling during algae separation.Journal ofMembrane Science,
366, 356–362.

Saleh Al Aswad Page 202
8. AppendixA1:OsmoticAgentsSamples’Analysis
Chromatography Laboratory
Department of Chemistry
University of Surrey
4 July 2013
Analysis of Glucose Samples
1. Samples (151 supplied) analysed by a Varian 920-LC HPLC instrument with a Varian 385-
LC light scattering detector.
2. All samples were analysed as supplied.
3. Figure 8.1 shows a calibration curve for glucose – this was used to calculate the sucrose
content in the submitted samples.
4. Table 8.1 shows the results of the analyses in mg/ml glucose.
If you have any further queries, please do not hesitate to contact us.
Figure 8.1. Calibration Curve for Glucose
y = 102.54x - 10.869 R² = 0.9908
-200
0
200
400
600
800
1000
1200
0 2 4 6 8 10 12
Pe
ak h
eig
ht
(mV
)
Glucose conc. (mg/ml)

Saleh Al Aswad Page 203
Table 8.1. Results of the Analyses in mg/ml Glucose
Sample
Peak
height
(mV)
Glucose
conc.
(mg/ml) Sample
Peak
height
(mV)
Glucose
conc.
(mg/ml) Sample
Peak
height
(mV)
Glucose
conc.
(mg/ml)
1 167 1.7 21 1 0.1 41 586 5.8
2 147 1.5 22 543 5.4 42 2 0.1
3 1 0.1 23 484 4.8 43 512 5.1
4 285 2.9 24 2 0.1 44 486 4.8
5 212 2.2 25 589 5.9 45 2 0.1
6 1 0.1 26 526 5.2 46 619 6.1
7 188 1.9 27 1 0.1 47 596 5.9
8 116 1.2 28 487 4.9 48 3 0.1
9 1 0.1 29 477 4.8 49 510 5.1
10 348 3.5 30 2 0.1 50 471 4.7
11 491 4.9 31 513 5.1 51 2 0.1
12 1 0.1 32 514 5.1 52 522 5.2
13 361 3.6 33 1 0.1 53 453 4.5
14 529 5.3 34 483 4.8 54 2 0.1
15 1 0.1 35 461 4.6 55 488 4.9
16 478 4.8 36 2 0.1 56 510 5.1
17 530 5.3 37 481 4.8 57 1 0.1
18 1 0.1 38 478 4.8 58 673 6.7
19 488 4.9 39 3 0.1 59 532 5.3
20 492 4.9 40 508 5.1 60 3 0.1

Saleh Al Aswad Page 204
Chromatography Laboratory
Department of Chemistry
University of Surrey
29 June 2013
Analysis of Sucrose Samples
1. Samples (65 supplied) analysed by a Varian 920-LC HPLC instrument with a Varian 385-
LC light scattering detector.
2. All samples were analysed as supplied.
3. Figure 1 shows a calibration curve for sucrose – this was used to calculate the sucrose
content in the submitted samples.
4. Table 1 shows the results of the analyses in mg/ml sucrose. Please note that “not detected”
means any sucrose present is below the limit of detection which is approximately 0.2 mg/ml.
If you have any further queries, please do not hesitate to contact us.
Figure 8.2. Calibration Curve for Sucrose
y = 102.38x - 17.452 R² = 0.9934
-200
0
200
400
600
800
1000
1200
0 2 4 6 8 10 12
Pe
ak h
eig
ht
(mV
)
Sucrose conc. (mg/ml)

Saleh Al Aswad Page 205
Table 8.2. Results of the Analyses in mg/ml Sucrose
Sample
Peak
height
(mV)
Sucrose
conc.
(mg/ml) Sample
Peak
height
(mV)
Sucrose
conc.
(mg/ml) Sample
Peak
height
(mV)
Sucrose
conc.
(mg/ml)
1 597 6.0 11 438 4.4 21 1 0.2
2 506 5.1 12 1 0.2 22 466 4.7
3 1 0.2 13 ND ND 23 458 4.6
4 377 3.9 14 384 3.9 24 5 0.2
5 376 3.8 15 3 0.2 25 478 4.8
6 2 0.2 16 392 4.0 26 484 4.9
7 450 4.6 17 429 4.4 27 2 0.2
8 482 4.9 18 5 0.2 28 456 4.6
9 1 0.2 19 474 4.8 29 454 4.6
10 ND ND 20 444 4.5 30 6 0.2
Sample
Peak
height
(mV)
Sucrose
conc.
(mg/ml) Sample
Peak
height
(mV)
Sucrose
conc.
(mg/ml) Sample
Peak
height
(mV)
Sucrose
conc.
(mg/ml)
31 272 2.8 41 658 6.6 51 20 0.4
32 251 2.6 42 26 0.4 52 309 3.2
33 2 0.2 43 301 3.1 53 338 3.5
34 316 3.3 44 314 3.2 54 5 0.2
35 313 3.2 45 14 0.3 55 325 3.3
36 NO SAMPLE 46 317 3.3 56 306 3.2
37 452 4.6 47 311 3.2 57 3 0.2
38 417 4.2 48 9 0.3 58 338 3.5
39 4 0.2 49 334 3.4 59 344 3.5
40 694 6.9 50 322 3.3 60 22 0.4
Sample
Peak
height
(mV)
Sucrose
conc.
(mg/ml)
61 353 3.6
62 366 3.7
63 7 0.2
64 351 3.6
65 313 3.2
66 5 0.2

Saleh Al Aswad Page 206
9. Appendix A2: Viscosity Meter TC-502
Figure 9.1. Viscosity Meter TC-502

Saleh Al Aswad Page 207
10. Appendix A3: The Concentration of Mixture of Organic Osmotic Agent (Sucrose) with
Inorganic Osmotic Agent Sodium Chloride VersusDW/BW.
Table 10.1. The Concentration of Sucrose as OA with NaCl vs DW/BW as Feedwater
Draw solution [bar]
Osmotic Pressure
Mixture Feed Water Draw solution [g/Lw]
Volume
Draw S
Quantity chemicals
[Kg] Volume Feed W
Date Run Sucrose NaCl [atm] [bar] [ppm] Sucrose NaCl [L] Sucrose NaCl [L]
1.1 10 10 19.78 20.04 DW 0 134.200 12.730 20 2.7 0.3 80
1.2 15 10 24.73 25.06 DW 0 198.290 12.730 20 4.0 0.3 80
1.3 20 10 29.69 30.08 DW 0 260.660 12.730 20 5.2 0.3 80
1.4 30 10 39.59 40.12 DW 0 380.660 12.730 20 7.6 0.3 80
1.5 40 10 49.50 50.15 DW 0 495.100 12.730 20 9.9 0.3 80
1.6 50 10 59.40 60.19 DW 0 604.650 12.730 20 12.1 0.3 80
2.1 10 10 19.78 20.04 DW 0 134.200 12.730 20 2.7 0.3 80
2.2 10 15 24.73 25.06 DW 0 134.200 19.083 20 2.7 0.4 80
2.3 10 20 29.68 30.07 DW 0 134.200 25.380 20 2.7 0.5 80
2.4 10 30 39.58 40.11 DW 0 134.200 37.750 20 2.7 0.8 80
2.5 10 40 49.48 50.14 DW 0 134.200 49.780 20 2.7 1.0 80
2.6 10 50 59.38 60.17 DW 0 134.200 61.460 20 2.7 1.2 80
3.1 10 10 19.78 20.04 BW 5000 134.200 12.730 20 2.7 0.3 80
3.2 15 10 24.73 25.06 BW 5000 198.290 12.730 20 4.0 0.3 80
3.3 20 10 29.69 30.08 BW 5000 260.660 12.730 20 5.2 0.3 80

Saleh Al Aswad Page 208
3.4 30 10 39.59 40.12 BW 5000 380.660 12.730 20 7.6 0.3 80
3.5 40 10 49.50 50.15 BW 5000 495.100 12.730 20 9.9 0.3 80
3.6 50 10 59.40 60.19 BW 5000 604.650 12.730 20 12.1 0.3 80
4.1 10 10 19.78 20.04 BW 5000 134.200 12.730 20 2.7 0.3 80
4.2 10 15 24.73 25.06 BW 5000 134.200 19.083 20 2.7 0.4 80
4.3 10 20 29.68 30.07 BW 5000 134.200 25.380 20 2.7 0.5 80
4.4 10 30 39.58 40.11 BW 5000 134.200 37.750 20 2.7 0.8 80
4.5 10 40 49.48 50.14 BW 5000 134.200 49.780 20 2.7 1.0 80
4.6 10 50 59.38 60.17 BW 5000 134.200 61.460 20 2.7 1.2 80
Osmotic
Pressure
OLI [atm] OLI [bar] Sucrose
10 9.8723 10.003 134.200
15 14.8044 15.001 198.290
20 19.7389 20.000 260.660
30 29.6074 30.000 380.660
40 39.4774 40.000 495.100
50 49.3453 49.999 604.650
Osmotic
Pressure OLI [atm] OLI [bar] NaCl
9.87056 10.001 12.730
10 14.7995 14.996 19.083
20 19.7333 19.995 25.380
30 29.6056 29.998 37.750
40 39.4775 40.001 49.780
50 49.3483 50.002 61.460

Saleh Al Aswad Page 209
11. Appendix A4:Mixture of Sucrose and NaCl versus DW/BW
as Feed Water
Table 11.1. Sucrose and NaCl vs DW/BW as Feedwater
Draw solution [bar] Feed Water
Date Sucrose NaCl [ppm]
1
10 10 DW 0
15 10 DW 0
20 10 DW 0
30 10 DW 0
2
10 10 DW 0
10 15 DW 0
10 20 DW 0
10 30 DW 0
3
10 10 BW 5000
15 10 BW 5000
20 10 BW 5000
30 10 BW 5000
4
10 10 BW 5000
10 15 BW 5000
10 20 BW 5000
10 30 BW 5000

Saleh Al Aswad Page 210
12. Appendix A5:Glucose and NaCl versus DW/BW as Feed
Water
Table 12.1. Glucose and NaCl vs DW/BW as Feedwater
Draw solution [bar]
Feed Water
Date Glucose NaCl [ppm]
1
10 10 DW 0
15 10 DW 0
20 10 DW 0
30 10 DW 0
40 10 DW
50 10 DW 0
2
10 10 DW 0
10 15 DW 0
10 20 DW 0
10 30 DW 0
10 40 DW 0
10 50 DW 0
3
10 10 BW 5000
15 10 BW 5000
20 10 BW 5000
30 10 BW 5000
40 10 BW 5000
50 10 BW 5000
4
10 10 BW 5000
10 15 BW 5000
10 20 BW 5000
10 30 BW 5000
10 40 BW 5000
10 50 BW 5000

Saleh Al Aswad Page 211
OLI
Glucose NaCl atm bar
71.15 12.73 19.8488 20.11
105.4 12.73 24.8238 25.15
139 12.73 29.8134 30.21
203.9 12.73 39.7583 40.29
266.5 12.73 49.7363 50.40
326.65 12.73 59.6828 60.47
12.73 71.15 19.8488 20.11
19.083 71.15 24.827 25.16
25.38 71.15 29.8089 30.20
37.75 71.15 39.7738 40.30
49.78 71.15 49.7339 50.39
61.46 71.15 59.6888 60.48

Saleh Al Aswad Page 212
13. Appendix A6: Flat Sheet Unit Experimental Work for Osmotic Agent Sucrose andRO
Membrane
Table 13.1. Results for The System of Flat Sheet RO Membrane and Sucrose as OA
Osmotic agent Feed solution
Concentration Osmotic Pressure Flow
rate Temperature Concentration
Osmotic
Pressure Flow rate Temperature Membrane
EXP Molar bar L/min °C Molar bar L/min °C
1 0.5M - 0.8M 12.7-22 2 25 Deionised water 0 2 25 98.35% NF TFC-SR2
2 0.5M - 0.8M 12.7 2 25 170000 ppm Sucrose 12.7 2 25 98.35% NF TFC-SR2
3 0.5M - 0.8M 15 2 25 200000 ppm Sucrose 15 2 25 98.35% NF TFC-SR2
2 0.5M - 0.8M 20 2 25 275000 ppm Sucrose 20 2 25 98.35% NF TFC-SR2
5 0.5M - 0.8M 22 2 25 400000 ppm Sucrose 22 2 25 98.35% NF TFC-SR2
6 0.5M - 0.8M 12.7-22 2 25 Deionised water 0 2 25 98.35% NF TFC-SR2
7 0.5M - 0.8M 20 1.5 25 275000 ppm Sucrose 20 2 25 98.35% NF TFC-SR2
8 0.5M - 0.8M 20 1.5 25 275000 ppm Sucrose 20 2.5 25 98.35% NF TFC-SR2
9 0.5M - 0.8M 20 1.5 25 275000 ppm Sucrose 20 3 25 98.35% NF TFC-SR2
10 0.5M - 0.8M 20 1.5 25 275000 ppm Sucrose 20 3.5 15 98.35% NF TFC-SR2
11 0.5M - 0.8M 20 1.5 25 275000 ppm Sucrose 20 4 35 98.35% NF TFC-SR2
12 0.5M - 0.8M 12.7-22 2 25 Deionised water 0 1.5 25 98.35% NF TFC-SR2
13 0.5M - 0.8M 20 2 25 275000 ppm Sucrose 20 1.5 25 98.35% NF TFC-SR2
14 0.5M - 0.8M 20 2.5 25 275000 ppm Sucrose 20 1.5 25 98.35% NF TFC-SR2
15 0.5M - 0.8M 20 3 25 275000 ppm Sucrose 20 1.5 25 98.35% NF TFC-SR2
16 0.5M - 0.8M 20 3.5 25 275000 ppm Sucrose 20 1.5 25 98.35% NF TFC-SR2
17 0.5M - 0.8M 20 4 25 275000 ppm Sucrose 20 1.5 25 98.35% NF TFC-SR2
18 0.5M - 0.8M 12.7-22 2 25 Deionised water 0 1.5 25 98.35% NF TFC-SR2

Saleh Al Aswad Page 213
19 0.5M - 0.8M 15 2 20 200000ppm Sucrose 15 2 25 98.35% NF TFC-SR2
20 0.5M - 0.8M 15 2 25 200000ppm Sucrose 15 2 25 98.35% NF TFC-SR2
21 0.5M - 0.8M 15 2 30 200000ppm Sucrose 15 2 25 98.35% NF TFC-SR2
22 0.5M - 0.8M 15 2 35 200000ppm Sucrose 15 2 25 98.35% NF TFC-SR2
23 0.5M - 0.8M 12.7-22 2 25 Deionised water 0 1.5 25 98.35% NF TFC-SR2
24 0.5M - 0.8M 15 2 25 200000ppm Sucrose 15 2 20 98.35% NF TFC-SR2
25 0.5M - 0.8M 15 2 25 200000ppm Sucrose 15 2 25 98.35% NF TFC-SR2
26 0.5M - 0.8M 15 2 25 200000ppm Sucrose 15 2 30 98.35% NF TFC-SR2
27 0.5M - 0.8M 15 2 25 200000ppm Sucrose 15 2 35 98.35% NF TFC-SR2

Saleh Al Aswad Page 214
14. Appendix A7: Flat Sheet Unit Experimental Work for Osmotic Agent Glucose andRO
Membrane
Table 14.1. Results for The System of Flat Sheet RO Membrane and Glucose as OA
Osmotic agent (OA) Feed solution (FS)
Concentration Osmotic Pressure Flow rate Temperature Concentration Osmotic Pressure Flow
rate Temperature Membrane
EXP Molar bar L/min °C Molar bar L/min °C
1 0.5M - 0.8M 12.7-22 2 25 Deionised water 0 2 25 98.35% RO 90
2 0.5M - 0.8M 12.7 2 25 90000 ppm Glucose 12.7 2 25 98.35% RO 90
3 0.5M - 0.8M 15 2 25 120000 ppm
Glucose 15 2 25 98.35% RO 90
2 0.5M - 0.8M 25 2 25 180000 ppm
Sucrose 20 2 25 98.35% RO 90
5 0.5M - 0.8M 31 2 25 250000 ppm
Glucose 22 2 25 98.35% RO 90
6 0.5M - 0.8M 12.7-22 2 25 Deionised water 0 2 25 98.35% RO 90
7 0.5M - 0.8M 20 1.5 25 250000 ppm
Glucose 20 2 25 98.35% RO 90
8 0.5M - 0.8M 20 1.5 25 250000 ppm
Glucose 20 2.5 25 98.35% RO 90
9 0.5M - 0.8M 20 1.5 25 250000 ppm
Glucose 20 3 25 98.35% RO 90
10 0.5M - 0.8M 20 1.5 25 250000 ppm
Glucose 20 3.5 15 98.35% RO 90
11 0.5M - 0.8M 20 1.5 25 250000 ppm
Glucose 20 4 35 98.35% RO 90
12 0.5M - 0.8M 12.7-22 2 25 Deionised water 0 1.5 25 98.35% RO 90
13 0.5M - 0.8M 20 2 25 250000 ppm
Glucose 20 1.5 25 98.35% RO 90
14 0.5M - 0.8M 20 2.5 25 250000 ppm
Glucose 20 1.5 25 98.35% RO 90

Saleh Al Aswad Page 215
15 0.5M - 0.8M 20 3 25 250000 ppm
Glucose 20 1.5 25 98.35% RO 90
16 0.5M - 0.8M 20 3.5 25 250000 ppm
Glucose 20 1.5 25 98.35% RO 90
17 0.5M - 0.8M 20 4 25 250000 ppm
Glucose 20 1.5 25 98.35% RO 90
18 0.5M - 0.8M 12.7-22 2 25 Deionised water 0 1.5 25 98.35% RO 90
19 0.5M - 0.8M 15 2 20 250000 ppm
Glucose 15 2 25 98.35% RO 90
20 0.5M - 0.8M 15 2 25 250000 ppm
Glucose 15 2 25 98.35% RO 90
21 0.5M - 0.8M 15 2 30 250000 ppm
Glucose 15 2 25 98.35% RO 90
22 0.5M - 0.8M 15 2 35 250000 ppm
Glucose 15 2 25 98.35% RO 90
23 0.5M - 0.8M 12.7-22 2 25 Deionised water 0 1.5 25 98.35% RO 90
24 0.5M - 0.8M 15 2 25 250000 ppm
Glucose 15 2 20 98.35% RO 90
25 0.5M - 0.8M 15 2 25 250000 ppm
Glucose 15 2 25 98.35% RO 90
26 0.5M - 0.8M 15 2 25 250000 ppm
Glucose 15 2 30 98.35% RO 90
27 0.5M - 0.8M 15 2 25 250000 ppm
Glucose 15 2 35 98.35% RO 90

Saleh Al Aswad Page 216
15. Appendix A8: Flat Sheet Unit Experimental Work for Osmotic Agent Sucrose and NF
Membrane
Table 15.1. Results for The System of NF Membrane and Sucrose as OA
Osmotic agent (OA) Feed solution(FS)
Concentration Osmotic Pressure Flow
rate Temperature Concentration
Osmotic
Pressure
Flow
rate Temperature Membrane
EXP Molar bar L/min °C Molar bar L/min °C
1 0.5M - 0.8M 12.7-22 2 25 Deionised water 0 2 25 98.35% NF TFC-SR2
2 0.5M - 0.8M 12.7 2 25 170000 ppm Sucrose 12.7 2 25 98.35% NF TFC-SR2
3 0.5M - 0.8M 15 2 25 200000 ppm Sucrose 15 2 25 98.35% NF TFC-SR2
2 0.5M - 0.8M 22 2 25 275000 ppm Sucrose 20 2 25 98.35% NF TFC-SR2
5 0.5M - 0.8M 31.2 2 25 400000 ppm Sucrose 22 2 25 98.35% NF TFC-SR2
6 0.5M - 0.8M 12.7-22 2 25 Deionised water 0 2 25 98.35% NF TFC-SR2
7 0.5M - 0.8M 22 1.5 25 275000 ppm Sucrose 22 2 25 98.35% NF TFC-SR2
8 0.5M - 0.8M 22 1.5 25 275000 ppm Sucrose 22 2.5 25 98.35% NF TFC-SR2
9 0.5M - 0.8M 22 1.5 25 275000 ppm Sucrose 22 3 25 98.35% NF TFC-SR2
10 0.5M - 0.8M 22 1.5 25 275000 ppm Sucrose 22 3.5 15 98.35% NF TFC-SR2
11 0.5M - 0.8M 22 1.5 25 275000 ppm Sucrose 22 4 35 98.35% NF TFC-SR2
12 0.5M - 0.8M 12.7-22 2 25 Deionised water 0 2 25 98.35% NF TFC-SR2
13 0.5M - 0.8M 20 2 25 275000 ppm Sucrose 20 2 25 98.35% NF TFC-SR2
14 0.5M - 0.8M 20 2.5 25 275000 ppm Sucrose 20 2 25 98.35% NF TFC-SR2
15 0.5M - 0.8M 20 3 25 275000 ppm Sucrose 20 2 25 98.35% NF TFC-SR2
16 0.5M - 0.8M 20 3.5 25 275000 ppm Sucrose 20 2 25 98.35% NF TFC-SR2
17 0.5M - 0.8M 20 4 25 275000 ppm Sucrose 20 2 25 98.35% NF TFC-SR2
18 0.5M - 0.8M 12.7-22 2 25 Deionised water 0 2 25 98.35% NF TFC-SR2
19 0.5M - 0.8M 15 2 20 200000ppm Sucrose 15 2 25 98.35% NF TFC-SR2

Saleh Al Aswad Page 217
20 0.5M - 0.8M 15 2 25 200000ppm Sucrose 15 2 25 98.35% NF TFC-SR2
21 0.5M - 0.8M 15 2 30 200000ppm Sucrose 15 2 25 98.35% NF TFC-SR2
22 0.5M - 0.8M 15 2 35 200000ppm Sucrose 15 2 25 98.35% NF TFC-SR2
23 0.5M - 0.8M 12.7-22 2 25 Deionised water 0 1.5 25 98.35% NF TFC-SR2
24 0.5M - 0.8M 15 2 25 200000ppm Sucrose 15 2 20 98.35% NF TFC-SR2
25 0.5M - 0.8M 15 2 25 200000ppm Sucrose 15 2 25 98.35% NF TFC-SR2
26 0.5M - 0.8M 15 2 25 200000ppm Sucrose 15 2 30 98.35% NF TFC-SR2
27 0.5M - 0.8M 15 2 25 200000ppm Sucrose 15 2 35 98.35% NF TFC-SR2

Saleh Al Aswad Page 218
16. Appendix A9: Flat Sheet Unit Experimental Work for Osmotic Agent Glucose and NF
Membrane
Table 16.1. Results for The System of NF Membrane and Glucose as OA
Osmotic agent(OA) Feed solution(FS)
Concentration Osmotic
Pressure Flow rate Temperature Concentration
Osmotic
Pressure
Flow
rate Temperature Membrane
EXP Molar bar L/min °C Molar bar L/min °C
1 0.5M - 0.8M 12.7-22 2 25 Deionised water 0 2 25 98.35% NF TFC-SR2
2 0.5M - 0.8M 12.7 2 25 90000 ppm Glucose 12.7 2 25 98.35% NF TFC-SR2
3 0.5M - 0.8M 15 2 25 120000 ppm Glucose 15 2 25 98.35% NF TFC-SR2
2 0.5M - 0.8M 22 2 25 180000 ppm Glucose 20 2 25 98.35% NF TFC-SR2
5 0.5M - 0.8M 31.2 2 25 250000 ppm Glucose 22 2 25 98.35% NF TFC-SR2
6 0.5M - 0.8M 12.7-22 2 25 Deionised water 0 2 25 98.35% NF TFC-SR2
7 0.5M - 0.8M 31.2 1.5 25 250000 ppm Glucose 22 2 25 98.35% NF TFC-SR2
8 0.5M - 0.8M 31.2 1.5 25 250000 ppm Glucose 22 2.5 25 98.35% NF TFC-SR2
9 0.5M - 0.8M 31.2 1.5 25 250000 ppm Glucose 22 3 25 98.35% NF TFC-SR2
10 0.5M - 0.8M 31.2 1.5 25 250000 ppm Glucose 22 3.5 15 98.35% NF TFC-SR2
11 0.5M - 0.8M 31.2 1.5 25 250000 ppm Glucose 22 4 35 98.35% NF TFC-SR2
12 0.5M - 0.8M 12.7-22 2 25 Deionised water 0 2 25 98.35% NF TFC-SR2
13 0.5M - 0.8M 31.2 2 25 250000 ppm Glucose 20 2 25 98.35% NF TFC-SR2
14 0.5M - 0.8M 31.2 2.5 25 250000 ppm Glucose 20 2 25 98.35% NF TFC-SR2
15 0.5M - 0.8M 31.2 3 25 250000 ppm Glucose 20 2 25 98.35% NF TFC-SR2
16 0.5M - 0.8M 31.2 3.5 25 250000 ppm Glucose 20 2 25 98.35% NF TFC-SR2
17 0.5M - 0.8M 31.2 4 25 250000 ppm Glucose 20 2 25 98.35% NF TFC-SR2
18 0.5M - 0.8M 12.7-22 2 25 Deionised water 0 2 25 98.35% NF TFC-SR2
19 0.5M - 0.8M 31.2 2 20 250000 ppm Glucose 15 2 25 98.35% NF TFC-SR2

Saleh Al Aswad Page 219
20 0.5M - 0.8M 31.2 2 25 250000 ppm Glucose 15 2 25 98.35% NF TFC-SR2
21 0.5M - 0.8M 31.2 2 30 250000 ppm Glucose 15 2 25 98.35% NF TFC-SR2
22 0.5M - 0.8M 31.2 2 35 250000 ppm Glucose 15 2 25 98.35% NF TFC-SR2
23 0.5M - 0.8M 12.7-22 2 25 Deionised water 0 1.5 25 98.35% NF TFC-SR2
24 0.5M - 0.8M 31.2 2 25 250000 ppm Glucose 15 2 20 98.35% NF TFC-SR2
25 0.5M - 0.8M 31.2 2 25 250000 ppm Glucose 15 2 25 98.35% NF TFC-SR2
26 0.5M - 0.8M 31.2 2 25 250000 ppm Glucose 15 2 30 98.35% NF TFC-SR2
27 0.5M - 0.8M 31.2 2 25 250000 ppm Glucose 15 2 35 98.35% NF TFC-SR2

Saleh Al Aswad Page 220
17. Appendix A10: Sample Calculations for the Data Parameters (Table 4.1)
NF flat sheet membrane by using OAs GLUCOSE.
Table 16.1. Sample Calculations for the Data Parameters in Table 4.1. with Glucose OA
Draw solution concentration study Run 1 Run2 Run3 Run4
Draw solution in L/min 2 2 2 2
FW flow rate in L/min 2 2 2 2
membrane area in m2 0.0621 0.0621 0.0621 0.0621
Wt f at t=0 5.266 5.524 5.386 5.4
Wt f at t=2hr 5.24 5.507 5.375 5.392
WtDr at t=0 5.119 5.92 5.84 5.977
WtDr at t=2hr 4.684 5.485 5.463 5.787
Dr at t=0 Con 90 120 180 250
Dr at t=2hr Con 77 112.2 121.2 250
FW at t=0 Con g/L 0 0 0 0
FW at t=2 hr Con g/L 5.1 5.1 5.1 5.1
Dr at t=0 ,OP in bar 14.3 21 35 40.6
Dr att=2hr OP,in bar 11 15 20 36.5
Fw at t=0 O.P 0 0 0 0
Fw at t=2hr,O.P 0.738 0.738 0.738 0.738
NDP in bar 10.15 15.45 24.95 36
Jw in kg/hr.m2 3.5024155 3.5024155 3.0354267 1.5297907
%R FW 0.4937334 0.307748 0.2042332 0.1481481
Js g/hr.m2 2.6 2.6 2.6 2.6
Aw kg/hr.m2.bar 0.3450656 0.2 0.1216604 0.09

Saleh Al Aswad Page 221
SEC kWhr/m3 0.3 0.4 0.5 0.9
Glucose concentration study
OA glucose at 90 g/L
( )
3.5 L(m
2.hr)
OA glucose at 120 g/L
( )
3.5 L(m
2.hr)
OA glucose at 180 g/L
( )
3 L(m
2.hr)
OA glucose at 250 g/L
( )
1.5 L(m
2.hr)
Glucose Recovery Present % (Recovery Percentage)
Recovery percentage (% R) of the feed water was estimated using the following equation:
(
)

Saleh Al Aswad Page 222
: Overall volume of permeate
: Initial volume of feed solution
At the end of each experiment, the recovery of the membrane was calculated by dividing the overall volume of permeate (calculate from the total
weight decrease of the feed solution) by the initial volume of feed solution.
(
)
(
)
(
)
(
)
Salt Flux
For all Glucose concentrations (90, 120, 180, 250 g/L) and Sucrose concentrations (170,200,275,400 g/L) the Js is constant at 2.6 g (m2.hr)
(
) g (m
2.hr)
Feed water concentration at time 2 hr to 10.2 g/L
feed water volumetric flow rate at time 2 h equal to 1.9 g/L

Saleh Al Aswad Page 223
SEC Sucrose NF membrane
( )
( ) ( )
( ) kWhr/m
3
SEC for sucrose at concentration 200 g/L
( ) ( )
( ) kWhr/m
3
SEC for sucrose at concentration 275 g/L
( ) ( )
( ) kWhr/m
3
SEC for sucrose at concentration 250 g/L
( ) ( )
( ) kWhr/m
3
Net Driving Pressure
Glucose concentration 90 g/L
As the deionised water was used as feed water and its P is equal to zero, the NDP was calculated from the modified equation:

Saleh Al Aswad Page 224
( )
( )
( )
( )
( )
( )
( )
( )
( )
( )
Water Permeability
=
L (m
2.hr.bar)
=
L (m
2.hr.bar)
=
L (m
2.hr.bar)
=
L (m
2.hr.bar)

Saleh Al Aswad Page 225
NF flat sheet membrane by using OA SUCROSE:
Table 16.2. Sample Calculations for the Data Parameters in Table 4.1. with Sucrose OA
Draw solution concentration study Run 1 Run 2 Run 3 Run 4
Draw water flow rate 2L/min 2 2 2 2
FW flow rate in L/min 2 2 2 2
membrane arae in m2 0.0621 0.0621 0.0621 0.0621
Wt f at t=0 4.966 4.758 6.189 5.184
Wt f at t=2hr 4.84 4.663 6.109 5.143
WtDr at t=0 5.685 5.655 5.455 5.251
WtDr at t=2hr 5.557 5.557 5.393 5.285
Dr at t=0 Con 170 200 275 400
Dr at t=2hrCon 133 163.32 214 337
FW at t=0 Con g/l 0 0 0 0
FW at t=2 hrCon g/l 10.2 10.2 10.2 10.2
Dr at t=0 ,OP in bar 32.6 15 19 17
Dr at t=2hr OP,in bar 19.6 15 17 15.5
Fw at t=0 O.P 0 0 0 0
Fw at t=2hr,O.P 0.738 0.738 0.738 0.738
NDP in bar 21 9.9 12.9 11.15
Jw in L(/hr.m2) 1.0144928 0.7649 0.49919 0.27375
%R FW 2.5372533 0.78905 1.29262 0.7909
Js g (hr.m2) 2.6006441 1.99664 2.60064 2.60064
Aw in L(hr.m2.bar) 0.0483092 2.60064 0.0387 0.02455
SEC in kWhr/m3 1.2 1.3 2.2 3.3

Saleh Al Aswad Page 226
Sucrose concentration study
( )
1 L (m
2.hr)
( )
0.8 L (m
2.hr)
( )
0.5 L (m
2.hr)
( )
0.3 L(m
2.hr)
Sucrose Recovery percentage R%
(
)
(
)
(
)
(
)

Saleh Al Aswad Page 227
Net Driving Pressure
As the deionised water was used as feed water and its P is equal to zero, the NDP was calculated from the modified equation:
( )
( )
( )
( )
( )
( )
( )
( )
( )
( )

Saleh Al Aswad Page 228
Water Permeability
L (m
2.hr.bar)
( )
( )
( )
SEC Sucrose NF membrane
( )
Where
PDin is the absolute osmotic pressure of the draw solution (osmotic agent) entering the membrane
QDin is the volumetric flow rate (L) of draw solution (osmotic agent) entering the membrane
PFin is the pressure (bars) of the feed water entering the membrane
QFin is the volume flow rate (L) of feed water entering the membrane and
QFoutis the volume flow rate (L) of feed water leaving the membrane during the FO process.

Saleh Al Aswad Page 229
SEC for sucrose at concentration 170 g/L
( ) ( )
( )
( ) ( )
( )
( ) ( )
( )
( ) ( )
( )