investigation of internal damping in carbon fiber and
TRANSCRIPT

University of New MexicoUNM Digital Repository
Civil Engineering ETDs Engineering ETDs
7-11-2013
Investigation of internal damping in carbon fiberand steel cablesYuanzhong Qiu
Follow this and additional works at: https://digitalrepository.unm.edu/ce_etds
This Dissertation is brought to you for free and open access by the Engineering ETDs at UNM Digital Repository. It has been accepted for inclusion inCivil Engineering ETDs by an authorized administrator of UNM Digital Repository. For more information, please contact [email protected].
Recommended CitationQiu, Yuanzhong. "Investigation of internal damping in carbon fiber and steel cables." (2013). https://digitalrepository.unm.edu/ce_etds/11

i
Yuanzhong Qiu Candidate
Civil Engineering
Department
This dissertation is approved, and it is acceptable in quality and form for publication:
Approved by the Dissertation Committee:
Dr. Arup Maji , Chairperson
Dr. Walter Gerstle
Dr. Percy Ng
Dr. Ashok Ghosh

ii
INVESTIGATION OF INTERNAL DAMPING IN
CARBON FIBER AND STEEL CABLES
BY
YUANZHONG QIU
B.S., Civil Engineering, Nanchang University, 2006
M. Eng., Civil Engineering, Shanghai University, 2009
DISSERTATION
Submitted in Partial Fulfillment of the
Requirements for the Degree of
DOCTOR OF PHILOSOPHY
Engineering
The University of New Mexico
Albuquerque, New Mexico
May, 2013

iii
DEDICATION
This dissertation describes research performed at the University of New Mexico,
Civil Engineering Department between October 2009 and September 2012. It is the result
of my own work under the guidance of my advisor Dr. Arup. Maji, and does not include
any work done in collaboration, except where stated.
Yuanzhong Qiu
May, 2013

iv
ACKNOWLEDGMENTS
I heartily acknowledge Dr. Arup Maji, my advisor and dissertation chair, for
giving me the opportunity to work with him, and for his patience, technical guidance and
encouragement throughout the years of research. His guidance and professional style will
remain with me as I continue my career.
I also thank my committee members, Dr. Walter Gerstle, Dr. Percy Ng and Dr.
Ashok Ghosh, for their valuable assistance in this study. I really appreciate their time and
effort in being part of my committee.
Special thanks go to my host family, Wujin Zheng and Hali Ching, for their help
and support in many ways. To my roommate, Mekdim Teshome, thank you for the many
years of friendship and encouragement.
To my family, thank you for the advice, encouragement, support and love
throughout my life.

v
INVESTIGATION OF INTERNAL DAMPING IN CARBON FIBER AND STEEL
CABLES
By
YUANZHONG QIU
B.S., Civil Engineering, Nanchang University, 2006
M. Eng., Civil Engineering, Shanghai University, 2009
DOCTOR OF PHILOSOPHY
Engineering
ABSTRACT
The characterization of cable damping is important for the stability and
performance of structures deployed in space using cables. However, literature available
for the analysis of carbon fiber cable damping and its effect on dynamical behavior of
deployable space structure is scarce. The objective of this work is to examine the
variation of cable damping involving different cable properties and the ambient
environments through several carefully instrumented tests. An analytical model to predict
damping based on internal forces and variable cable geometry is developed and compared
with those of tests.
An experimental set-up for the measurement of cable damping is described.
Cables in different lengths (0.2032m, 0.3048m and 0.5080m), constructions
(20.71turns/m, 41.42tutns/m and 62.13turns/m), temperatures (20 and 4 ) and air

vi
pressures (normal and vacuum) are tested under five different tensile forces (111.25N,
222.50N, 333.75N, 445.00N and 578.50N). In addition, the effect of sensor mass, the
support and test apparatus on damping are investigated. The damping is identified by the
‘half-power bandwidth’ method and the ‘logarithmic decrement’ method. The results
indicate that, typically, damping decreases as the length, tension and the number of turns
of the tested cable increases. Also, temperature and air pressure contribute to the
variation of damping.
To explore the use of finite elements method (FEM) to simulate cable vibration
and damping, the COMBIN14 and MASS21 elements in ANSYS13.0 are used. The finite
element simulation results agree well with the test results on vibration frequency and time
history response. This demonstrates that the selected elements are capable of modeling
the dynamic response of cables using the Rayleigh damping constants.
Using simplified mechanistic assumptions, an analytical approach is proposed to
model cable damping. The proposed method and related issues are discussed considering
numerical examples. It is shown that this method can predict the damping variation trend
as observed in the tests of carbon fiber cables.
vii
TABLE OF CONTENTS
DEDICATION.................................................................................................................. iii
ACKNOWLEDGMENTS ............................................................................................... iv
ABSTRACT ....................................................................................................................... v
TABLE OF CONTENTS ............................................................................................... vii
LIST OF FIGURES .......................................................................................................... x
LIST OF TABLES .......................................................................................................... xv
NOMENCLATURE ....................................................................................................... xvi
1 INTRODUCTION....................................................................................................... 1
1.1 Motivation ..................................................................................................................... 1
1.2 Objective and Scope ..................................................................................................... 5
1.3 Outline of the Dissertation ............................................................................................ 5
2 LITERATURE REVIEW .......................................................................................... 7
2.1 Theoretical Investigation of Cable Damping ................................................................ 7
2.1.1 Masing Model ........................................................................................................ 9
2.1.2 Thin Rod Model ................................................................................................... 10
2.1.3 Semi-continuous Model ....................................................................................... 13
2.1.4 Other Models ........................................................................................................ 15
2.2 Experiments on Cable Vibration ................................................................................. 18
2.3 Cable Damping in Aerospace Structures .................................................................... 28
2.4 Composite Material Cable Damping .......................................................................... 33
2.5 Summary ..................................................................................................................... 36
3 EXPERIMENTAL IDENTIFICATION OF CABLE DAMPING ....................... 40
3.1 Introduction ................................................................................................................. 40
3.2 Experimental Setup ..................................................................................................... 41

viii
3.3 Test Procedures and Data Processing ......................................................................... 46
3.3.1 Test Procedures .................................................................................................... 46
3.3.2 Data Processing .................................................................................................... 47
3.4 Tests Conducted .......................................................................................................... 50
3.4.1 Effect of Cable Tension........................................................................................ 51
3.4.1.1 Carbon Fiber Cables Tested at Room Temperature ...................................... 52
3.4.1.2 Carbon Fiber Cables Tested at a Temperature of 4 ................................... 58
3.4.1.3 Carbon Fiber Cables Tested in a Vacuum Chamber ..................................... 63
3.4.1.4 Stainless Steel Cable Tested at Room Temperature ...................................... 68
3.4.1.5 Evaluation of Rayleigh Damping Constants ................................................. 69
3.4.2 Effect of Cable Length ......................................................................................... 73
3.4.2.1 Carbon Fiber Cables Tested at Room Temperature ...................................... 73
3.4.2.2 Carbon Fiber Cables Tested at a Temperature of 4 ................................... 75
3.4.2.3 Carbon Fiber Cables Tested in a Vacuum Chamber ..................................... 77
3.4.3 Effect of Cable Lay Angle ................................................................................... 79
3.4.3.1 Carbon Fiber Cables Tested at Room Temperature ...................................... 79
3.4.3.2 Carbon Fiber Cables Tested at a Temperature of 4 ................................... 82
3.4.3.3 Carbon Fiber Cables Tested in a Vacuum Chamber ..................................... 84
3.4.4 Effect of Air Pressure ........................................................................................... 86
3.4.5 Effect of Support and Test Apparatus .................................................................. 95
3.4.6 Effect of Temperature .......................................................................................... 98
3.4.7 Effect of Sensor Mass ........................................................................................ 104
3.5 Conclusions ............................................................................................................... 109
4 FINITE ELEMENT SIMULATION OF CABLE VIBRATION ....................... 111
4.1 Review of Literature in FEM Analysis of Cables ..................................................... 111
4.2 Finite Element Analysis of Cable Vibration ............................................................. 113
4.2.1 Modal Analysis .................................................................................................. 114
4.2.2 Transient Dynamic Analysis .............................................................................. 118
4. 3 Conclusions .............................................................................................................. 122
5 ANALYTICAL MODEL OF CABLE VIBRATION DAMPING ..................... 123

ix
5.1 Introduction ............................................................................................................... 123
5. 2 Description of Cable Geometry ............................................................................... 125
5. 3 Relevant Assumptions ............................................................................................. 126
5. 4 Axial Strain of Helical wires.................................................................................... 127
5.4.1 Axial Strain due to Elongation ........................................................................... 128
5.4.2 Axial Strain due to Rotation ............................................................................... 131
5. 5 Modeling Contact and Friction Forces .................................................................... 134
5. 5.1 Radius of Deformed Helical Wires Centerline ................................................. 134
5. 5.2 Interwire Contact and Friction .......................................................................... 135
5. 5.2.1 Contact Normal Load per Unit Length ....................................................... 136
5. 6 Determination of Vibration Damping ...................................................................... 139
5. 7 Results and Discussion ............................................................................................ 144
5. 8 Conclusions .............................................................................................................. 151
6 SUMMARY AND CONCLUSIONS ..................................................................... 153
6.1 Summary of the Contributions Made ........................................................................ 153
6.2 Suggestions for Future Work .................................................................................... 154
REFERENCES .............................................................................................................. 156

x
LIST OF FIGURES
Figure 1.1.1 NuSTAR (NASA) ......................................................................................................................... 2
Figure 1.1.2 AstroMesh deployable satellite reflector (Northrop Grumman Corporation) ............................... 2
Figure 2.1.1.1 Masing damping model (Gutzer et al., 1995) .......................................................................... 10
Figure 2.1.4.1 Schematic diagram of the model of cable system (Yamaguchi et al., 2001) ........................... 17
Figure 2.1.4.2 Cross-section of damping treated structural cable (a) typical prefabricated PWS cable (b)
damping treated cable (Yamaguchi and Adhikari, 1994) .................................................................... 18
Figure 2.2.1 Complete view of the static hysteresis test set-up (Yu, 1952) .................................................... 19
Figure 2.2.2 General view of the free decay test set-up (Yu, 1952) ................................................................ 20
Figure 2.2.3 Cable-structure system experimental set-up (Achkire and Preumont, 1996) .............................. 22
Figure 2.2.4 Schematic view of the testing system for overhead line cables (Barbieri, et al., 2004) .............. 23
Figure 2.2.5 Diagram of cable damping concept (Thomas, 1981) .................................................................. 25
Figure 2.2.6 Experimental setup of a cantilever cable (Zhu and Meguid, 2007) ............................................ 26
Figure 2.2.7 Experimental set-up (Casciati et al., 2008) ................................................................................. 27
Figure 2.2.8 Analytical models of cable and support (Yamaguchi and Fujino, 1988) .................................... 28
Figure 2.3.1 Pantographic deployable structure (a) fully deployed configuration (b) joint detail (Tan and
Pellegrino, 2008) ................................................................................................................................. 30
Figure 2.3.2 AFRL’s Deployable Optical Telescope (Coombs et al., 2008) ................................................... 32
Figure 2.3.3 DOT mirror petal cable paths and surrounding structure nomenclature (Coombs et al., 2008) .. 32
Figure 2.4.1 Schematic of test apparatus (El-Kady, et al., 2000) .................................................................... 34
Figure 2.4.2 Experimental setup for resonant frequency measurement at different temperatures (Wei and
Kukureka, 2000) .................................................................................................................................. 35
Figure 3.2.1 Experimental setup ..................................................................................................................... 41
Figure 3.2.2 Tension applying fixture ............................................................................................................. 42
Figure 3.2.3 Details of the clamp .................................................................................................................... 42
Figure 3.2.4 Connection between cable, accelerometers and the dynamic signal acquisition module............ 43
Figure 3.2.5 Cable ferrule and stop set ............................................................................................................ 43

xi
Figure 3.2.6 Connection between cable and load cell ..................................................................................... 43
Figure 3.2.7 PCB 352A73 accelerometer ........................................................................................................ 44
Figure 3.2.8 NI USB 9234 dynamic signal acquisition module ...................................................................... 45
Figure 3.2.9 Load Cell .................................................................................................................................... 45
Figure 3.3.1.1 IM-7 fiber tows ........................................................................................................................ 46
Figure 3.3.2.1 Half-power bandwidth method ................................................................................................ 48
Figure 3.3.2.2 Logarithmic decrement method ............................................................................................... 48
Figure 3.4.1.1 Stainless steel cable and cross section ..................................................................................... 52
Figure 3.4.1.2 Recorded time-history responses for a 0.3048m, 20.71turns/m carbon fiber cable at room
temperature and 333.75N pretension (a) at 1/5 of cable length (b) at 3/4 of cable length ................... 53
Figure 3.4.1.3 Spectral of signals for a 0.3048m, 20.71turns/m carbon fiber cable at room temperature and
333.75N pretension (a) at 1/5 of cable length (b) at 3/4 of cable length .............................................. 54
Figure 3.4.1.4 Damping versus tension for cables at room temperature (a) 20.71turns/m (b) 41.42turns/m (c)
62.13turns/m cables ............................................................................................................................. 56
Figure 3.4.1.5 Vibration frequency versus tension for cables at room temperature (a) 20.71turns/m (b)
41.42turns/m (c) 62.13turns/m cable ................................................................................................... 57
Figure 3.4.1.6 Recorded time-history responses for a 0.3048m, 20.71turns/m carbon fiber cable at a
temperature of 4 and 333.75N pretension (a) at 1/5 of cable length (b) at 3/ 4 of cable length ....... 59
Figure 3.4.1.7 Spectral of signals for a 0.3048m, 20.71turns/m carbon fiber cable at a temperature of 4 and
333.75N pretension (a) at 1/5 of cable length (b) at 3/ 4 of cable length ............................................. 60
Figure 3.4.1.8 Damping versus tension for cables at a temperature of 4 (a) 20.71turns/m (b) 41.42turns/m
(c) 62.13turns/m cables ........................................................................................................................ 61
Figure 3.4.1.9 Vibration frequency versus tension for cables at a temperature of 4 (a) 20.71turns/m (b)
41.42 turns/m (c) 62.13turns/m cables................................................................................................. 62
Figure 3.4.1.10 Recorded time-history responses for a 0.3048m, 20.71turns/m carbon fiber cable in vacuum
chamber with 333.75N pretension (a) at 1/5 of cable length (b) at 3/4 of cable length ....................... 64
Figure 3.4.11 Spectral of signals for a 0.3048m, 20.71turns/m carbon fiber cable in vacuum chamber with
333.75N pretension (a) at 1/5 of cable length (b) at 3/4 of cable length .............................................. 65

xii
Figure 3.4.1.12 Damping versus tension for cables in a vacuum chamber (a) 20.71turns/m (b) 41.42turns/m
(c) 62.13turns/m cables ........................................................................................................................ 66
Figure 3.4.1.13 Vibration frequency versus tension for cables in vacuum chamber (a) 20.71turns/m (b)
41.42turns/m (c) 62.13turns/m cables.................................................................................................. 67
Figure 3.4.1.14 Variation of damping with applied tension ............................................................................ 69
Figure 3.4.1.15 Relation curves of alpha with tension .................................................................................... 72
Figure 3.4.1.16 Relation curves of beta with tension ...................................................................................... 72
Figure 3.4.2.1 Cable damping versus length for cables at room temperature (a) 20.71turns/m (b)
41.42turns/m (c) 62.13turns/m cables................................................................................................. 74
Figure 3.4.2.2 Cable damping versus length for cables at 4 (a) 20.71turns/m (b) 41.42turns/m (c)
62.13turns/m cables ............................................................................................................................. 76
Figure 3.4.2.3 Cable damping versus length for cables in a vacuum chamber (a) 20.71turns/m (b)
41.42turns/m (c) 62.13turns/m cables.................................................................................................. 78
Figure 3.4.3.1 Cable damping versus cable construction for cables at room temperature (a) 0.2032m (b)
0.3048m (c) 0.5080m cables ................................................................................................................ 81
Figure 3.4.3.2 Cable damping versus cable construction for cables at a temperature of 4 (a) 0.2032m (b)
0.3048m (c) 0.5080m cables ................................................................................................................ 83
Figure 3.4.3.3 Cable damping versus cable construction for cables in a vacuum chamber (a) 0.2032m (b)
0.3048m (c) 0.5080m cables ................................................................................................................ 85
Figure 3.4.4.1 Pressure gauge ......................................................................................................................... 87
Figure 3.4.4.2 Air pumper ............................................................................................................................... 87
Figure 3.4.4.3 Vacuum chamber ..................................................................................................................... 88
Figure 3.4.4.4 Connection between pressure gauge and chamber ................................................................. 88
Figure 3.4.4.5 Fishing line .............................................................................................................................. 88
Figure 3.4.4.6 Foam tape ................................................................................................................................. 89
Figure 3.4.4.7 Comparison of damping for 0.2032m carbon fiber cables in air and in vacuum (a)
20.71turns/m (b) 41.42turns/m (c) 62.13turns/m cables ...................................................................... 92

xiii
Figure 3.4.4.8 Comparison of damping for 0.3048m carbon fiber cables in air and in vacuum (a)
20.71turns/m (b) 41.42turns/m (c) 62.13turns/m cables ...................................................................... 93
Figure 3.4.4.9 Comparison of damping for 0.5080m carbon fiber cables in air and in vacuum (a)
20.71turns/m (b) 41.42turns/m (c) 62.13turns/m cables ...................................................................... 94
Figure 3.4.5.1 Details of the stiffened support ................................................................................................ 95
Figure 3.4.5.2 Details of the stiffened frame corners ...................................................................................... 96
Figure 3.4.5.3 Comparison of damping for cable tested with stiffened and unstiffened setup........................ 97
Figure 3.4.5.4 Vibration frequency with tension ............................................................................................. 98
Figure 3.4.6.1 Control system of the freezer room .......................................................................................... 99
Figure 3.4.6.2 Comparison of damping for 0.2032m cables at different temperature (a) 20.71turns/m (b)
41.42turns/m (c) 62.13turns/m cables................................................................................................ 101
Figure 3.4.6.3 Comparison of damping for 0.3048m cables at different temperature (a) 20.71turns/m (b)
41.42turns/m (c) 62.13turns/m cables................................................................................................ 102
Figure 3.4.6.4 Comparison of damping for 0.5080 cables at different temperature (a) 20.71turns/m (b)
41.42turns/m (c) 62.13turns/m cables................................................................................................ 103
Figure 3.4.7.1 Comparison of damping for 0.3048m cables with one accelerometer and two accelerometers
(a) 20.71 turns/m (b) 41.42 turns/m (c) 62.13 turns/m cables............................................................ 106
Figure 3.4.7.2 Comparison of vibration frequency for 0.3048m cables with one accelerometer and two
accelerometers (a) 20.71 turns/m (b) 41.42 turns/m (c) 62.13 turns/m cables ................................... 107
Figure 3.4.7.3 Damping for a 41.42 turns/m, 0.3048m carbon fiber cable under different conditions ......... 108
Figure 4.2.1 COMBIN14 Spring-Damper (ANSYS help) ............................................................................ 114
Figure 4.2.2 MASS21 Structural Mass (ANSYS help) ................................................................................. 114
Figure 4.2.3 Finite element representation of a carbon fiber cable ............................................................... 115
Figure 4.2.1.1 Vibration frequency from different methods (0.3048m, 20.71 turns/m carbon fiber cable) .. 117
Figure 4.2.1.2 Vibration frequency from different methods (0.5080m, 20.71 turns/m carbon fiber cable) .. 117
Figure 4.2.1.3 Vibration frequency from different methods (0.2032m, 20.71 turns/m carbon fiber cable) .. 118
Figure 4.2.2.1 Finite element representation of a cable................................................................................. 118

xiv
Figure 4.2.2.2 Comparison of time history response (a) FEM result of node at 1/5 of cable length (b)
experimental result of node at 1/5 of cable length ............................................................................. 120
Figure 4.2.2.3 Comparison of time history response (a) FEM result of node at 3/4 of cable length (b)
experimental result of node at 3/4 of cable length ............................................................................. 121
Figure 5.2.1 Cable geometry ......................................................................................................................... 126
Figure 5.4.1.1 Developed view of helical wire centerline ............................................................................. 129
Figure 5.5.2.1 Distributed loads on a helical wire ......................................................................................... 137
Figure 5.5.2.2 Contact force in cable ............................................................................................................ 139
Figure 5.6.1 Analysis flow chart ................................................................................................................... 143
Figure 5.7.1 Comparison of cable damping (a) 20.71 turns/m (b) 41.42 turns/m, (c) 62.13turns/m cables .. 145
Figure 5.7.2 Cable damping versus cable construction (a) 0.2032m (b) 0.3048m (c) 0.5080m cables ......... 147
Figure 5.7.3 Cable damping versus length (a) 20.71 turns/m (b) 41.42turns/m (c) 62.13turns/m cables ...... 148
Figure 5.7.4 Comparison of damping (with and without consideration of change of lay angle) (a) 20.71
turns/m, 0.2032m (b) 20.71turns/m, 0.3048m (c) 20.71turns/m, 0.5080m cables ............................. 150
Figure 5.7.5 Cable damping versus Poisson’s ratio (20.71 turns/m, 0.2032m carbon fiber cable) ............... 151

xv
LIST OF TABLES
Table 3.3.1.1 Damping of a 0.5080m, 62.13 turns/m carbon fiber cable with 445.00N pretension .............. 49
Table 3.4.1.1 Properties of 0.3048m carbon fiber cables .............................................................................. 52
Table 3.4.1.2 Cable damping at room temperature ....................................................................................... 55
Table 3.4.1.3 Cable vibration frequency at room temperature ...................................................................... 55
Table 3.4.1.4 Cable damping at a temperature of 4 ................................................................................... 58
Table 3.4.1.5 Cable vibration frequency at a temperature of 4 .................................................................. 58
Table 3.4.1.6 Cable vibration frequency in a vacuum (-20 In. Hg) chamber ................................................ 63
Table 3.4.1.7 Cable damping in a vacuum chamber (-20 in. Hg) .................................................................. 64
Table 3.4.1.8 Alpha and beta for the tested 0.3048m cables ......................................................................... 71
Table 3.4.4.1 Damping in vacuum chamber (0.3048m, 20.71turns/m with 333.75N pretension) ................. 89
Table 3.4.4.2 Comparison of damping (0.2032m carbon fiber cables) ......................................................... 90
Table 3.4.4.3 Comparison of damping (0.3408m carbon fiber cables) ......................................................... 90
Table 3.4.4.4 Comparison of damping (0.5080m carbon fiber cables) ......................................................... 90
Table 3.4.5.1 Vibration damping comparison ............................................................................................... 96
Table 3.4.5.2 Vibration frequency comparison ............................................................................................. 97
Table 3.4.6.1 Comparison of damping for 0.2032m cables at different temperatures ................................. 100
Table.3.4.6.2 Comparison of damping for 0.3408m cables at different temperatures ................................. 100
Table.3.4.6.3 Comparison of damping for 0.5080m cables at different temperatures ................................. 100
Table 3.4.7.1 Comparison of damping for cables with one and two accelerometers .................................. 105
Table 3.4.7.2 Comparison of vibration frequency for cables with one and two accelerometers ................. 105
Table 3.4.7.3 Damping of a 41.42 turns/m, 0.3048m carbon fiber cable tested under different conditions 108
Table 4.2.1.1 Vibration frequency from different methods (0.2032m, 20.71 turns/m carbon fiber cable).. 116
Table 4.2.1.2 Vibration frequency from different methods (0.3048m, 20.71 turns/m carbon fiber cable).. 116
Table 4.2.1.3 Vibration frequency from different methods (0.5080m 20.71 turns/m carbon fiber cable)... 116
Table 5.7.1 Cable properties ........................................................................................................................ 144
Table 5.7.2 Theoretical analysis results of cable vibration damping ........................................................... 144

xvi
NOMENCLATURE
The following symbols are used in this dissertation:
Chapter 3 and 4:
, , frequencies corresponding to response peak and √ of the response peak
modal damping ratio
the logarithmic decrement
n number of vibration cycles
1 , 2 the first and the second modal damping ratio
, the vibration amplitudes at n cycles apart
[ ] damping matrix
[ ] mass matrix
[ ] stiffness matrix
, the Rayleigh damping constants
F the impulse force applied at the center of the cable
H cable pretension
l cable length
m mass per unit length of the cable
Chapter 5:
, radius of the cable core and helical wires
P, pitch length of helical wires
, lay angle of the undeformed and deformed helical wires

xvii
total strain of helical wires along tangent direction
the tangent strain of helical wires due to elongation
the tangent strain of helical wires due to rotation
initial and deformed length of the cable structure
, initial and deformed length of the helical wires
, initial and final angle that a helical wire sweeps out
V, volume of the undeformed and deformed cable structure
, radius of the undeformed and deformed helical wire centerline
change of helical wire length
change of cable lay angle
the axial strain in the cable core wire.
Poisson’s ratio
CF compaction factor
the relative rotation of the structure
mutual approach of wires
friction coefficient
ratio of the deformed and undeformed cable structure length
ratio of the deformed and undeformed helical wire length
the contact normal force between cable core and helical wires
the contact normal force between helical wires
, contact half width
E Young’s modulus
transverse modulus

xviii
contact angle
number of helical wires in a layer
, the tangential distributed force
, the tangential distributed force along helical wires
H tangential force along helical wires
loss factor
the energy dissipation per cycle
U the stored energy
, two successive vibration amplitudes
logarithmic decrement
cable modal damping ratio
relative movement
tonsorial shear strain between cable wires associated with wire axial strain
stored strain energy
vibration profile
vibration amplitude
stored energy due to tension

1
Chapter 1
Introduction
This chapter first describes the motivation of this research for the experimental and
analytical investigation of carbon fiber and steel cable damping, and then summarizes the
objective and scope of the research. At the end of this chapter, the organization of this
dissertation is presented.
1.1 Motivation
Cables, as assemblages of wires have been widely used as tension members in many
modern flexible structures, ranging from suspension bridges, electrical and signal
transmission systems to deployable space structures. As examples for cable application in
space structures, Fig. 1.1.1 shows the nuclear spectroscopic telescope array (NuSTAR)
launched by NASA in June, 2012. The NuSTAR telescope extends to achieve a 10-meter
focal length after being launched into orbit in order to improve the sensitivity of the
optics. A deployable satellite reflector from Northrop Grumman Corporation is shown in
Fig. 1.1.2. It will be used to help NASA’s Jet Propulsion Laboratory (JPL) map soil
moisture and the freezing and thawing cycles globally with unprecedented accuracy,
resolution and coverage, which aims to understand the health of the Earth’s ecology.

2
Figure 1.1.1 NuSTAR (NASA)
Figure 1.1.2 AstroMesh deployable satellite reflector (Northrop Grumman Corporation)
Cables
Cables
Optics

3
For deployable masts, deployable antennas and other aerospace structures, vibration can
be caused by launch loads, deployment, and micro-lurch (small accelerations due to
various forces) etc. Quite often these small vibrations are not desirable and may cause
malfunctions of the sensor systems. The interest lies in reducing the vibration by
dissipation of vibration energy or damping. Although characterization of cable damping
in a vibrating structure has long been an active area of research in structural dynamics,
the demands of modern engineering have led to a steady increase of interest in recent
years. Investigations of cable damping have a significant role in vibration suppression in
space structures under an environment devoid of atmospheric damping. The recent
developments in the fields of space structures have provided impetus towards developing
procedures for dealing with cable damping in the context of structural dynamics. Beside
these, in the last few decades, carbon fiber cable has become an appropriate option for
aerospace structures because of its light weight and high strength. The sophistication of
modern design methods together with the development of improved composite structural
materials instilled a trend towards lighter and larger space structures.
At the same time, there is also a constant demand for larger optics, which needs to be
deployed in orbit and has a dimensional stability much smaller than the wavelength of
light in order to obtain high quality images and other information with minimum noise
and vibration level. The increasing demand requires that the cables to play a more
appreciable role in the dynamics of space structures.
Unfortunately, these highly flexible and lightweight cables possess low damping and are
susceptible to vibration, especially in the space environment devoid of atmospheric

4
damping. Besides, the knowledge of carbon fiber cable dynamic behavior is very scarce.
Therefore, measuring cable damping and understanding its mechanisms are particularly
significant for structures deployed in space where the internal damping is critical for
structural stability. An extensive ground based test is essential to provide some
fundamental dynamic properties of carbon fiber cables in space structural applications.
The demands of lighter space structures and more sensitive space structures are
conflicting and the problem cannot be solved without proper understanding of energy
dissipation or damping behavior. In spite of a large amount of research on the
investigation of damping characterization of steel cable and transmission line conductor,
understanding of cable damping mechanisms is quite primitive, and it is a field which
still holds quite a bit of intrigue in the engineering community. This is because the
modeling of damping is very complex, and it is not in general clear which variables are
relevant to the damping values. Moreover, it seems that in a realistic situation there exist
many sources of energy dissipation: the structural joints, the material, and the fluid
damping etc. Here the difficulty lies in understanding the damping mechanisms and
providing a model to be used in predicting transient responses, decay times or other
characteristics in design and analysis where the structural performance is affected by
energy dissipation.

5
1.2 Objective and Scope
The overall objective of this work is to study the variation of damping involving different
cable parameters and environments, and to develop an analytical model for understanding
damping mechanisms and predicting damping of cables in space applications.
This work covers the tests of carbon fiber cables under different length (0.2032m,
0.3048m and 0.5080m), tension (111.25N, 222.50N, 333.75N, 444.50N and 578.50N),
configuration (20.71turns/m, 41.42turns/m and 62.13turns/m), temperature (20 and 4 )
and air pressure (normal and vacuum). Finite element simulation of carbon fiber cable
vibration is provided for comparing and establishing a relationship with experiments. A
model for predicting damping is developed based on internal forces, fiber deformation
and internal cable geometry under simplified but physically realistic assumptions.
1.3 Outline of the Dissertation
Motivated by the existing problems and gaps identified in Section 1.1, a systematic study
on determination and analysis of carbon fiber cable and steel cable damping has been
carried out in this dissertation. The dissertation is divided into six chapters.
In Chapter 2, a brief review of literature on currently available experimental and
analytical studies on damping properties of stainless steel cables and composite cables,
the effects of cable damping on dynamic behavior of cable structures and techniques for
vibration suppression is presented. Based on this literature review, some open problems
have been identified which are summarized in Chapter 2.
6
In Chapter 3, an experimental setup for measuring cable damping is provided, and several
tests of carbon fiber cables and a stainless steel cable under different conditions are
reported. The test variables included the cable length, tension, configuration, along with
the ambient temperature (20 and 4 ) and air pressure (normal and vacuum). In
addition, the effect of sensor mass, support and test apparatus on cable damping are
investigated. From the tests, some important conclusions are derived which are discussed
and analyzed in this dissertation.
In Chapter 4, attention is specially focused on the simulation of cable vibration using the
finite element method (FEM) for comparing and establishing the relationship with the
experiments. A simple and appropriate simulation of cable damping is suggested.
Chapter 5 is aimed at using the conclusions from tests to validate a theoretical model
proposed to analyze the cable vibration damping. The expression of damping is derived
under certain simplified but physically realistic assumptions. The proposed method and
several related issues are discussed by considering numerical examples.
Finally, Chapter 6 presents the conclusions emerging from the studies taken up in this
dissertation and makes a few suggestions for further research.

7
Chapter 2
Literature Review
In this chapter, previous experimental and analytical studies to understand damping
characterization and damping mechanism of stainless steel cables and composite cables
are reviewed. Also, many attempts to suppress vibrations of cable and cable structure are
described. From the literature review, several important conclusions are derived to guide
this research on the experimental and analytical investigation of carbon fiber and steel
cable damping. Additional literature review specific to the issues addressed in our
research have been provided in the relevant sections in later chapters.
2.1 Theoretical Investigation of Cable Damping
The vibrating taut string or cable was one of the first physical systems to which the
analytical tools of mechanical and mathematics were applied. The problem of cable
dynamics and the characterization of cable damping still attract a great deal of attention
from the scientific community leading to a rich technical literature. This is due to the
wide application of cables in engineering field and to their tendency to vibrate. Vibrations
can result in cable or connection failures due to fatigue (Cluni et al., 2007).
Consequently, how much energy can be dissipated by cables is of importance when
considering dynamic behavior of structures with cables.

8
In many of the earlier theoretical analyses, several simplifying assumptions have been
made to obtain analytical or closed form solutions. One of the assumptions is about the
interwire friction. Friction takes place at the interfaces of cable helical wires and is hard
to model. For simplification, most of the researchers analyzed two extreme cases: either a
no-slip friction model or a full-slip friction model. An attempt to relate the internal
friction to the damping properties of a cable was made by Vinogradov and Atatekin
(1986). A cantilever cable deformed under a transverse load applied at the free end was
investigated, the interwire slip was assumed to occur due to the twisting of helical wires.
Although it is clear that the interaction between the wires is the cause of energy losses, a
precise mechanism of interwire friction and interwire slippage in a deformed cable
remains unknown. Therefore, it is necessary to obtain a full understanding of the
interwire friction and interwire slippage within the cable to achieve realistic prediction of
cable damping.
Another important assumption is about the internal wire contact. Based on the wire
diameter and helix angle, there are three possible types of contact: (a). Wire-wire contact,
in which wires in the same layer are in contact, and no contact with adjacent layers; (b).
Core-wire contact, in which the wires in the same layer do not touch each other, and are
in contact only with the cable core; (c). Mixed (wire-wire and core-wire) contact, in
which both wire-wire and core-wire contact occur. In the previous models, one contact
mode is commonly selected as the primary contact to simplify the solution.
Depending on the type of cable geometry, the modes of loading and the contact behavior,
several theoretical models have been proposed to date which may be classified as: the

9
‘Masing’ model, in which the interwire friction was considered using the ‘JENKIN’
element; the ‘thin rod’ model, which takes bending and torsional stiffness of the
individual wires into account; and the ‘semi-continuous’ model in which each layer of
helical wires is modeled as an equivalent ‘thin cylinder’ or ‘thick cylinder’.
2.1.1 Masing Model
The ‘Masing’ model was first proposed by Masing (1923) to model the energy dissipated
per cycle in metals, and it was then used by Gutzer et al., (1995) for the investigation of
self-damped stranded steel cables. In this model, the cable was treated as a collection of
discrete and continuous systems of bonded wire layers, as shown in Fig. 2.1.1.1. Each of
the layers consists of one or more ‘JENKIN’ elements. The ‘JENKIN’ element consists
of a spring with stiffness and associated with a dry friction element described by its
maximum friction force . An inner variable ‘y’ has to be introduced for every ‘JENKIN’
element, to describe the relative position of the friction element. For a complete
knowledge of the system state the inner variables have to be known, or information has to
be given on deformation history. The damping parameters of the system were identified
using the slowly varying amplitude and phase method.
Sauter and Hagedorn (2002) further developed a hybrid approach by using the distributed
‘Masing’ model together with the beam theory to model a stock-bridge damper cable.
This model accounts for the interwire friction force by selecting an appropriate number of
‘JENKIN’ elements. They also performed experiments on a cantilever self-damped cable
to measure the ‘Masing’ components by measuring the cable response to a cyclical end
load.

10
In summary, the ‘Masing’ model provides a good way to simulate the interwire friction,
however, the ‘Masing’ components are difficult to obtain.
Figure 2.1.1.1 Masing damping model (Gutzer et al., 1995)
2.1.2 Thin Rod Model
The ‘thin rod’ model was first proposed by Owada (1952), who used the Kirchhoff’s
equation of equilibrium to calculate axial and torsional stiffness of a simple strand. In the
‘thin rod’ model, the basic element of cable is a single thin rod, the equations are
established for individual wire of strand. The wire bending and twisting is added in this
model.
Huang and Vinogradov (1991) investigated the effect of frictional force and interwire slip
on the mechanical properties of an axially loaded straight cable. The effect of interwire
slip was considered on macro-scale properties of the cable. The formula of frictional
11
energy dissipation over one axial load cycle was derived. The analysis showed that the
damping coefficient is inversely proportional to cable pretension. Huang and Vinogradov
(1992) also addressed the dynamic behavior of a cable under cyclic tension. To obtain the
load-elongation relationship, the total elongation of the cable was assumed to be
comprised by two parts, one from the slipped section, and the other from the section
without interwire slippage, where the process of cable elongation was accompanied by
micro-slippage of the cable. The analytical results demonstrated that cable axial stiffness
is slightly increased when tension increases, and that damping is inversely proportional to
cable pretension. However, the analysis might underestimate the cable elongation caused
by vibration.
For a cable subjected to uniform bending, Huang and Vinogradov (1994) showed that
losses caused by dry friction occur due to twisting and bending of individual wire, and
the energy dissipation is linearly proportional to bending curvature. Huang and
Vinogradov (1996a, 1996b) analyzed the damping of a cable under a quasi-static cyclic
loading, the cable was modeled as an equivalent rod with amplitude dependent damping,
and the interwire dry friction was considered. The formula for equivalent damping
coefficient was obtained and showed that the energy losses are proportional to the cube of
the axial tension, and inversely proportional to the interwire friction forces. In this paper,
the authors concluded that the damping in cables is caused mainly by dry friction
between wires, while a small amount of energy is dissipated through individual wires.
Other researchers also have conducted extensive research on cable interwire behavior and
energy dissipation using the ‘thin rod’ model. Huang (1978) and LeClair (1989) included

12
the interwire friction interaction in their models and analyzed single layered spiral strands,
Lanteigne (1985) investigated the problem of interlayer slippage in a multi-layered strand.
Ramsey (1990) has attempted to include interwire friction in multi-layered strands
undergoing axial loading using the ‘thin rod’ model. Sathikh et al., (1989a) showed that
the axial slip is more appropriate than twist slip. In another paper, Sathikh (1989b)
derived a more accurate expression for the minimum interwire frictional resistance and
applied this to cable vibration. Utilizing these researches, Sathikh (1989c) studied the
interwire friction effects on the transverse vibration of helically stranded taut cable with
hinged ends. Numerical analysis indicated that the wire’s axial slip force is more
predominant than the wire’s twist slip force. However, only friction between wires and
cable core was taken into account while the friction between wires was neglected. This
research was extended to obtain a general ‘thin rod’ model for the pre-slip bending
response by Sathikh et al., (2000).
Raoof and Huang (1991a) proposed a theoretical formulation for obtaining upper bounds
to single layer helical strand damping under cyclic bending to a constant radius of curva-
ture. Parametric studies show that the traditional coulomb friction model tends to grossly
overestimate cable damping for large radius of curvature. And the present model suggests
that for certain ranges of helix angle, increasing helix angle leads to decrease in cable
damping.
More complex analytical model is based on curved beam theory assumptions. Within the
framework of curved beam theory, Labrosse and Conway (2000a, 2000b) investigated the
frictional damping properties of axially loaded simple straight metallic cables. In this

13
approach, the wires were modeled as curved beams, and the changes in curvature and
twist of the wires were assumed to be negligible. In the analysis, cable core-wire contact
and a linearized pivoting friction were considered. The numerical results indicated that a
larger lay angle lead to a lower damping, and the energy dissipated by pivoting friction is
very small and negligible compared to other sources of dissipation. Marcel et al., (2010)
studied the influence of cable rigidity on free vibration modes of a suspended overhead
transmission line conductor. The ‘Euler-Bernoulli beam’ model with viscous, hysteretic
or dry internal friction damping was considered in the analysis. The authors found that
the influence of hysteretic and dry friction damping on high damping modes can be
neglected. Zhu and Meguid (2007) investigated the flexural damping of slack wire cable
by modeling cable as curved beam.
In summary, by using the ‘thin rod’ model, the frictional forces can be considered as the
external forces acting on the wires, however, the bending is considered in this model, and
it is not appropriate for a tensioned cable.
2.1.3 Semi-continuous Model
Homogenization is a well-known method in solid mechanics, and can be used for the
continuum modeling of a discrete system composed of many identical repetitive
elements. In this ‘semi-continuous’ model, each layer of wires in a strand is
mathematically represented by an orthotropic circular cylinder has ‘averaged’ mechanical
properties.

14
One of the ‘semi-continuous’ model is the ‘orthotropic sheet theory’, which was first
developed by Hobbs and Raoof (1982) for the modeling cables and was extended by
Raoof and his associates over the past three decades. In this model, the individual layer of
wires was modeled as an equivalent cylindrical thin orthotropic sheet, instead of the rod
or curved beam used in the ‘thin rod’ model, each sheet has the ‘averaged’ elastic
properties, and the whole cable is treated as a discrete of concentric orthotropic cylinders.
Using the ‘orthotropic sheet theory’, Hobbs and Raoof (1984) investigated the frictional
energy dissipation in multilayered spiral strands. The test results showed that damping is
slightly dependent on cable axial load due to the non-linear nature of the contact. It was
shown that the configuration of cable influences damping significantly. In addition, the
authors found that the lay angle is a key geometric parameter that affects cable
characteristics, and damping can be enhanced by decreasing the lay angle. This has also
been demonstrated in another paper (Raoof, 1996). The damping properties of axially
preloaded multilayered spiral strands under lateral vibration were investigated by Raoof
(1991b), and Raoof and Huang (1993a). An equivalent hysteretic damping per unit length
of cable (assumed to depend only on cable construction and cable vibration modes) was
used to derive the differential equation of cable lateral vibration. A formula for the
determination of damping on the basis of energy dissipation theory was derived.
According to the results, the overall structural damping of cable decreases significantly
with increasing cable length and with increasing tension. Raoof and Huang (1991b)
investigated the damping mechanism of axially preloaded multi-layered sheathed spiral
strand in underwater applications. The results demonstrated that the damping ratio
decreases with the mean axial strain and the length of cable. The damping ratio also

15
varied with the cable construction. Raoof and Davies (2006) conducted theoretical
parametric studies on the axial and torsional energy loss of axially preloaded spiral
strands. They pointed that the axial damping may be significantly enhanced by slight
decrement of lay angle, but the torsional damping will be reduced.
Another ‘semi-continuous’ model was developed by Blouin and Cardou (1989), and later
extended by Jolicoeur and Cardou (1994), and Cardou and Jolicoeur (1997). In this
model, the layer wires are replaced with a cylinder of orthotropic, transversely isotropic
material. The only major difference between the ‘orthotropic sheet theory’ (thin cylinder)
and the orthotropic cylinder (thick cylinder) model is that the first one is considered for
two-dimensional and the second one is for three-dimensional calculations.
In these studies, a great deal of attention has been paid to the inter-wire contact
phenomena and friction. In all, the proposed ‘orthotropic sheets theory’ gives a good
prediction of cable characteristics, the accuracy increases as the number of layers
increases. However, it is based on the homogenization of the cable layers into orthotropic
cylindrical sheets and it is not appropriate for a cable with one core and 6 helical wires
(1+6 structure).
2.1.4 Other Models
Claren and Diana (1969a) presented the analytical and experimental study on a
transmission line cable. According to their results, damping of a taut cable is independent
of tension, which is contrary to the general experience. To further understand cable
damping behavior, effect of wire slippage on the damping of axially loaded cable was

16
also explored by Claren and Diana (1969b). The results indicated a nonlinear relationship
between the slippage coefficients versus tension. In addition, the average hysteretic
damping coefficient was inversely proportional to the square of the slippage factor.
Zhong (2003) proposed a frictional bending model, where the cable was modeled as a
one dimensional continuum with varying flexural rigidity, to estimate damping due to
internal friction. This study showed that the variation of cable flexural rigidity results in
damped vibration. Knapp and Liu (2005), Liu and Knapp (2005) proposed an analytical
approach for self-damped cables, where a flexural rigidity-curvature relationship, instead
of an external damping term was included in the governing equation of motion. The
results showed that the variation of cable flexural rigidity with helical wire slip causes
friction energy dissipation in the cable. Also, the effect of variations in core radius due to
pressure from the helical layers was investigated.
All of the aforementioned investigations focus on the damping of a single cable with
small diameter. However, only the knowledge of the dynamic characteristics of
individual cables is not sufficient for the prediction of dynamic characteristics of a
structural system, and the interaction between the structural components should be
considered. Yamaguchi et al., (2001) investigated a cable system (Fig. 2.1.4.1) with two
parallel sagged cables connected by a single secondary cable, whose weight and rigidity
is much smaller than that of the main cables. Equations of motion for the cable system
were derived using a modal synthesis method with sub-structural formulation. Free and
forced vibrations of the cable system were analyzed. The results showed that the

17
secondary cable has a great contribution to the structural damping and can cause greater
damping in the case of coupled motion of the main cables and the secondary.
Figure 2.1.4.1 Schematic diagram of the model of cable system (Yamaguchi et al., 2001)
Research on cable damping demonstrated that a cable exhibits low damping, which in
itself is not enough to alleviate cable vibration. Thus, a method to enhance cable damping
by adding a visco-elastic layer was proposed (Yamaguchi and Adhikari, 1994). Fig.
2.1.4.2 shows the cross-section of the original cable and the damping treated cable in
which the author explored the axial and bending loss factor. In this analysis, the ‘Ross-
Ungar-Kerwin’ theory of damping treatment in plates/beams has been extended to a
structural cable, and the complex modulus for a visco-elastic material was introduced to
compute the axial loss factor. Also, in the analysis, it was assumed that introduction of a
visco-elastic layer does not alter the strand configuration, and only the additional
damping due to the material was considered. Moreover, the damping due to the outer

18
cover was assumed to be negligible. However, according to Raoof (1984), construction of
the cable has a significant effect on cable damping; therefore, the assumption that the
introduction of a viscoelastic material will not change the configuration of cable might
lead to an incorrect damping value for the new cable.
Figure 2.1.4.2 Cross-section of damping treated structural cable (a) typical prefabricated PWS cable (b)
damping treated cable (Yamaguchi and Adhikari, 1994)
Wu et al., (2003) investigated the non-linear vibration of loosening cables, where the
cable loosening was considered by equating the total horizontal tension force in the cable
to be zero. The governing differential equation of motion considering flexural rigidity
and damping was derived.
2.2 Experiments on Cable Vibration
Many researchers have performed laboratory and field vibration tests on cables, in
attempts to understand the damping behavior of cables and the dependence of cable
damping on tension, length, vibration amplitude, temperature, cable construction and
wear history.

19
Yu (1949, 1952) conducted the dynamic decay test and the static hysteresis test on seven-
wire and single-wire cables subjected to pure bending. Fig. 2.2.1 and Fig. 2.2.2 show the
experimental mock-up for the analogous static and the dynamic tests, respectively.
Figure 2.2.1 Complete view of the static hysteresis test set-up (Yu, 1952)
The results showed that the inter-strand dry friction is the major source of internal
damping. In addition, cable damping varies with length, number of cable wires, vibration
amplitude and cable pretension. Increment of length reduces cable damping capacity,
greater number of wires leads to higher damping value, the energy dissipated is a linear
function of vibration amplitude, the pre-stressing of stranded cable below the yield point
has no effect on cable damping, while pre-stressing over yield point considerably reduces
damping capacity. The effect of cable pre-stressing on damping is different from the
result presented by Raoof and Huang (1993b), who concluded that a higher tension

20
causes a lower damping. The disparity might because of the different loading condition
and cable configuration.
Figure 2.2.2 General view of the free decay test set-up (Yu, 1952)
Hard and Holben (1967) tested the self-damping of tensioned transmission line
conductors using vibration decay technique. The damping was evaluated using the
‘logarithmic decrement’ method. They found that cable length has no significant
influence on damping within reasonable limits, and that the effect of tension on damping
is significant. A marked decrease in damping was observed initially as tension increases,
followed by a less significant change when the load increases.
Claren and Diana (1969a) used the forced vibration method to get the energy dissipated
per cycle of a tensioned transmission line conductor by measuring the energy input per
cycle while keeping the vibration amplitude constant. From the results, they concluded

21
that the energy could be dissipated without macroscopic slippage of the strands, but by
the deformation of microscopic inter-strand asperities.
Seppa (1971) measured self-damping of tensioned cables using the forced vibration
method. The results showed that the energy dissipated is inversely proportional to tension.
It is surprising that his result presented a strong dependence of energy dissipation on
frequency, which contrasts the basic theory that the Coulomb damping is frequency
independent.
Ramberg et al., (1977) measured the logarithmic decrement of slack and taut marine
cables in air and in water. They also found that the logarithmic decrement ratio decreases
as cable tension increases. In their tests, pinned cable terminations were used and they
argued that this minimized the support losses. However, no experimental support was
provided.
Interwire friction was identified as the primary source of energy dissipation by
Vanderveldt et al., (1973). Ropes with centrally attached mass with different
constructions were tested. Experimental results showed that transverse vibration damping
decreases as the cable axial load increases. The author also cited Yu’s (1952) work, and
added that no simple model taking into account transverse damping behavior can be
assumed.
Murkowski (1988) tested the internal damping of a mine hoist cable under non-planar
transverse vibration. The results showed that the time rate of change of curvature is the
major parameter influencing cable internal damping mechanism.

22
Achkire and Preumont (1996, 1998) described a non-contact measurement technique for
the transverse vibration of small cables and strings using collocated actuator-sensor pairs,
as shown in Fig. 2.2.3. The performance of an active tendon for the control of a cable-
structure system was investigated. The result showed that active damping of 1.8% was
achieved for cables with small sag.
Figure 2.2.3 Cable-structure system experimental set-up (Achkire and Preumont, 1996)
Zheng et al., (2003) tested an inclined cable scaled down from a 143m-long prototype
cable in an actual cable structure. The internal damping properties of in-plane and out-of-
plane vibration under different tension forces were investigated. The results demonstrated
that the modal damping ratios of the out-of plane vibration and the first in-plane vibration
decrease as tension increases.

23
Novak et al., (2004) and Barbieri et.al (2004) proposed a non-contact vibration testing
set-up for transmission line cables, as shown in Fig. 2.2.4. A damping identification
procedure for the system using non-contact sensors was presented. Subsequently,
Barbieri et al., (2004a, 2004b) identified the damping of a transmission line cable system
subjected to axial load using the aforementioned procedure. Four different methods were
employed to adjust the damping matrix. The results showed a good agreement between
the experimental values and the estimated values from the four methods. Besides, the
results indicated that damping decreases length and tension increases. This linear
dynamic analysis of transmission line cables was later extended to nonlinear analysis
(Renato et al., 2008).
Figure 2.2.4 Schematic view of the testing system for overhead line cables (Barbieri, et al., 2004)

24
For cable-stayed bridges or suspended bridges, it is common to add dampers to suppress
cable vibration. In order to study the damping enhancement effect of adding oil dampers,
Xu et al., (1998, 1999) tested scaled model cables with and without oil dampers for a
cable-stayed bridge. The test results showed that a higher tension causes a lower damping.
Ko et al., (2002) and Duan et al., (2003) presented field vibration tests of a long steel stay
cable with and without magneto-rheological (MR) dampers. The in-plane equivalent
modal damping of different cable vibration modes was identified using the vibration
decay response. Damping was simulated as the combined Rayleigh and frequency
independent damping, and shows a satisfactory agreement with the experimental results.
For a cable without MR dampers, the modal damping ratio is independent of vibration
amplitude within the tested range. Kim and Jeong (2005) also investigated the effects of
tension and vibration amplitude on cable damping. The resonant vibration testing results
demonstrated that cable damping might be linearly proportional to the vibration
amplitude, and decreases as tension increases.
Thomas (1981) discussed the damping design technique of wind turbine guy cables and
demonstrated the feasibility of the design with tests. The proposed damping technique
used a damper to dissipate energy by coulomb friction, which is simply a pair of weights
that are suspended from the cable and slide on two inclined surfaces whenever the cable
moves (Fig. 2.2.5). The test results from the 17-meter Research Turbine at Sandia
National Laboratories demonstrated that the damping technique works to alleviate the
resonant vibration of the cables, and a higher tension in the cable leads to a lower
damping ratio.

25
Figure 2.2.5 Diagram of cable damping concept (Thomas, 1981)
Zhu and Meguid (2007) conducted free vibration tests of a cantilevered steel wire cable
using the experimental setup shown in Fig. 2.2.6, where the vibration was captured by the
high speed camera and the flexural damping were obtained by analyzing photogrammetry
data. The cable demonstrated a high flexural damping at zero tension and its damping
was measured to be as high as 37.7% of the critical damping. Comparison of the
experimental and the numerical results indicated that the Rayleigh damping is suitable to
model the flexural damping of slacking wire cable. Besides, the results denoted that the
flexural hysteresis influences dynamic behavior of slacking wire cable significantly.

26
Figure 2.2.6 Experimental setup of a cantilever cable (Zhu and Meguid, 2007)
Casciati et al., (2008) investigated the effect of cable vibration mitigation using shape
memory alloy (SMA). A set of laboratory tests on a suspended steel cable and several
‘steel cable-SMA wires’ systems were conducted using the experimental setup shown in
Fig. 2.2.7. The results showed that the application of pre-stressed SMA wire increases the
fundamental frequency and the damping coefficient. The enhancement of damping
capacity depends on the number of the SMA wire wrapped. However, the mechanism of
damping augmentation is not clear; it could be due to energy dissipation by the friction
between cable and the added SMA wires, or internal dissipation in the SMA itself.
27
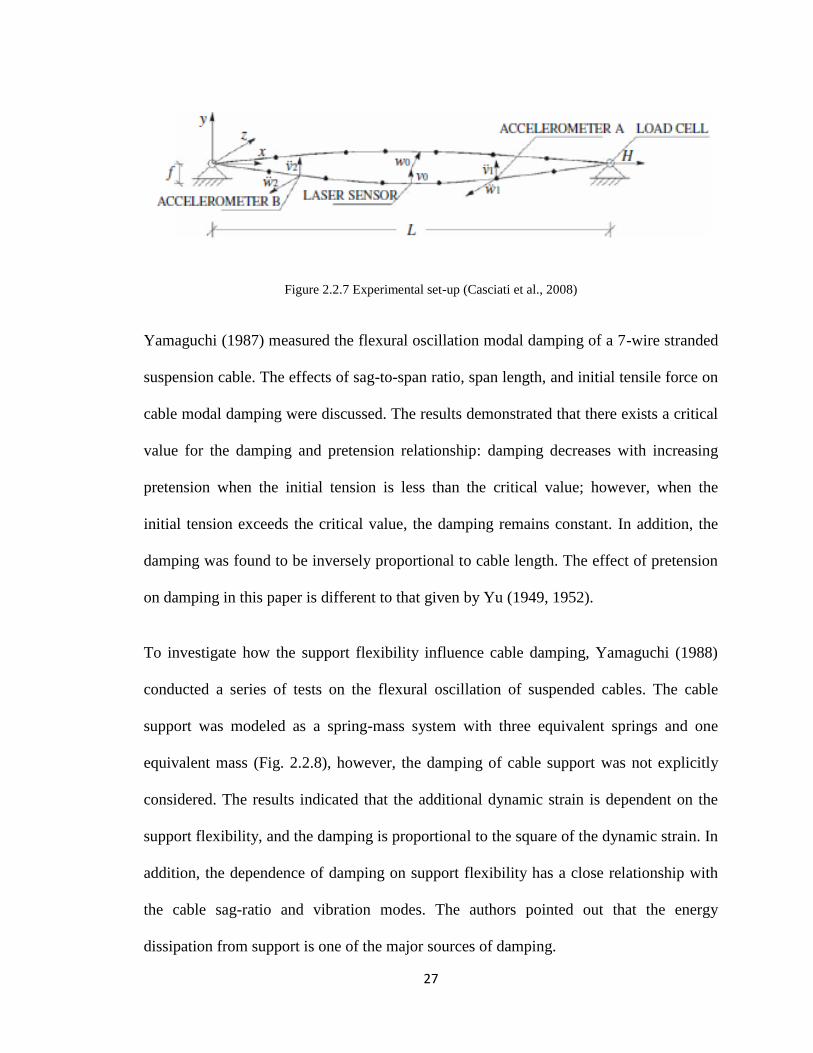
Figure 2.2.7 Experimental set-up (Casciati et al., 2008)
Yamaguchi (1987) measured the flexural oscillation modal damping of a 7-wire stranded
suspension cable. The effects of sag-to-span ratio, span length, and initial tensile force on
cable modal damping were discussed. The results demonstrated that there exists a critical
value for the damping and pretension relationship: damping decreases with increasing
pretension when the initial tension is less than the critical value; however, when the
initial tension exceeds the critical value, the damping remains constant. In addition, the
damping was found to be inversely proportional to cable length. The effect of pretension
on damping in this paper is different to that given by Yu (1949, 1952).
To investigate how the support flexibility influence cable damping, Yamaguchi (1988)
conducted a series of tests on the flexural oscillation of suspended cables. The cable
support was modeled as a spring-mass system with three equivalent springs and one
equivalent mass (Fig. 2.2.8), however, the damping of cable support was not explicitly
considered. The results indicated that the additional dynamic strain is dependent on the
support flexibility, and the damping is proportional to the square of the dynamic strain. In
addition, the dependence of damping on support flexibility has a close relationship with
the cable sag-ratio and vibration modes. The authors pointed out that the energy
dissipation from support is one of the major sources of damping.

28
Figure 2.2.8 Analytical models of cable and support (Yamaguchi and Fujino, 1988)
Raoof (1990) tested newly manufactured and well used cables to investigate the variation
of damping with service history. The results showed that the used cable has a lower
damping than a newly manufactured cable.
Experiments on a stiff cantilever cable having a concentrated mass at the free end were
conducted by Pivovarov and Vinogradov (1985) to investigate the influence of various
damping mechanisms in a cable under flexure. The results showed that at least two types
of damping mechanism exist in cyclically bending cables, the friction type damping
dominates at low frequency and viscous damping dominates at high frequencies.
2.3 Cable Damping in Aerospace Structures
Large trusses connected by tension cables are used to design large aerospace structures. It
has the advantages of being deployed and easily reconfigurable by changing the static
tension in the cables. Aerospace engineers have developed many structures which rely on

29
cable elements for crucial functions. In some deployable structures, passive cables are
applied to terminate the deployment and to increase the stiffness of the fully-deployed
structure, and the active cables are designed to control the deployment process and apply
a pre-stress in the fully deployed structure (Kwan et al., 1993). Moreover, vibration
control techniques are expected to play an increasing role in maintaining stability and
sensitivity of sensor systems. Thus, a good estimation of cable damping is significant
since it directly influences the stability of sensitivity of the structure.
Tan and Pellegrino (2008) investigated nonlinear vibration of a cable-stiffened
deployable pantographic structure, as shown in Fig. 2.3.1, which is fully pre-stressed at
the end of deployment. The modal identification test results indicated that damping of the
passive cables is inversely proportional to pretension. In addition, the research showed
that an increment of the active cable tension caused a decrement of the modal damping of
the system.

30
Figure 2.3.1 Pantographic deployable structure (a) fully deployed configuration (b) joint detail (Tan and
Pellegrino, 2008)
For a space structure, one of the major uncertainties in damping prediction is the level of
damping that would be seen in the absence of the air damping mechanism. Aiming to
throw some light on this problem, He and Powell (1990) investigated the damping of a
(a)

31
long taunted tether connecting two spacecraft by modeling it as a visco-elastic continuum
without bending stiffness. The longitudinal and the lateral vibration damping were
investigated. Three different damping models, structural damping, internal viscous
damping and external viscous damping were used to simulate the damping of the tether.
The results showed that the longitudinal vibration was primarily affected by the material
damping, and the damping ratio cannot be modeled using the three damping models. In
addition, the authors concluded that the air friction on the tether skin and the
aerodynamic drag on the end mass contributed less than 1% to the overall damping of the
optical fiber cable.
Power and signal cables are used as non-structural cables in space structures, and the
effect of these cables on damping is not understood either. Robertson et al., (2007) and
Babuska et al., (2010) described research on these cables. Simple cable and beam tests
were conducted in order to determine their influence on space structures. The results
indicated that even a small number of cables may have a significant dynamic effect, and
that a large fraction of added cable mass increased the damping.
Coombs et al., (2008) investigated the effect of cables on a space structure. The Air Force
Research Laboratory‘s Deployable Optical Telescope (DOT) were tested with different
cable configurations, as shown in Fig. 2.3.2 and Fig. 2.3.3. The results showed that
changes to the structural dynamics were dependent on the cable to base structure mass
ratio. Small mass ratio on the order of 0.5% leads no appreciable modal changes, and a
mass ratio on the order of 3% resulted in a doubling of damping at specific modes, but no
change in the natural frequencies.

32
Figure 2.3.2 AFRL’s Deployable Optical Telescope (Coombs et al., 2008)
Figure 2.3.3 DOT mirror petal cable paths and surrounding structure nomenclature (Coombs et al., 2008)

33
2.4 Composite Material Cable Damping
In common usage, a composite material is defined as a combination of two or more
materials on a macroscopically homogeneous level (e.g., fibers of one stiff material
embedded uniformly, but with directionality, in a matrix or another). In Recent years,
composite cables have been widely used in stayed-cable bridges, space structures and
other engineering fields due to the advantage of lightweight, high strength, corrosion and
fatigue resistance. However, reliable information on damping properties and damping
mechanism of composite cable is very scarce.
El-Kady et al., (2000) presented the experimental and analytical studies on the loss factor
of carbon fiber reinforced plastic (CFRP) and pre-stressing steel tendons using the test
apparatus schematic shown in Fig. 2.4.1. The cable was excited by a hydraulic shaker on
the double cantilever system. The ‘half-power bandwidth’ method and the ‘resonant
dwell’ technique were adopted to determine damping. The authors stated that the effect of
bonding material leads to a higher loss factor at the lowest modes for CFRP strands than
for steel cables, but for the higher modes, the loss factor is unchanged. In addition, cable
damping decreases as length increases. Though the results revealed the different effect of
bonding material on cable damping, the authors did not provide any exploration on the
reason for the difference.

34
Figure 2.4.1 Schematic of test apparatus (El-Kady, et al., 2000)
Wei and Kukureka (2000) employed the resonance technique to evaluate damping and
elastic properties of optical fiber cables. The ‘half-power bandwidth’ method and the
‘logarithmic decrement’ method were used to obtain cable damping. The results
demonstrated that damping first decreases as length increases, and then remains constant.
However, no theoretical or numerical results were provided to validate the experimental
results.
Using the resonance technique and the experimental setup shown in Fig. 2.4.2, Wei and
Kukureka (2003) tested the damping properties of pultruded composite rods and
telecommunication optical fiber cables at various temperatures (-22 to 266 , at a
heating rate of 1.8 ). The loss factor of tested cables was defined as the ratio of the
loss modulus to the storage modulus.

35
Figure 2.4.2 Experimental setup for resonant frequency measurement at different temperatures (Wei and
Kukureka, 2000)
Xie et al., (2008, 2010) conducted free vibration tests on carbon fiber reinforced plastics
(CFRP) cables, steel cables, CFRP wires and steel wires. The results showed that
damping is amplitude dependent: higher vibration amplitude leads to higher damping.
Moreover, the author concluded that the tension force has little influence on damping.
Du et al., (2011) investigated the damping properties and damping mechanisms of fiber
reinforced vinyl ester composites and fiber reinforced epoxy composites at different
temperatures and frequencies. The results indicated that damping of the composite
increases with frequency and declines as the ambient temperature increases. When the
matrix material is the same, carbon fiber has higher damping than glass fiber material,
and when the fiber material is the same, vinyl ester composites present higher damping.

36
In addition, the results showed that interface sliding is a key contributor to damping for
the composite material.
Wang and Wu (2011) presented a theoretical evaluation on modal damping of a hybrid
fiber reinforced polymer (FRP) cable with a smart damper. The theoretical equation of
damping was derived based on the energy principle.
2.5 Summary
From literature review of the theoretical and experimental investigations of cable
damping, the damping effect on space structures and the damping of composite cables,
summaries and conclusions are drawn as follows:
a) Several models have been developed to simulate cable damping under axial, bending
or torsional loading cases or subjected to the combination of the load cases. One of
the model is the ‘Masing’ model, which is good for the simulation of interwire
friction by assuming a ‘JENKIN’ element that consists of a spring with stiffness
and an associated dry friction element described by its maximum friction force .
However, obtaining the ‘Masing’ coefficients is difficult. The ‘thin rod’ model is
another commonly used model, which modeled the cable wire as ‘thin rod’ or ‘curved
beam’ within the framework of beam theory. The friction force can be considered as
external force acting on cable wires, however, bending is considered in this model,
and it is not appropriate for tensioned cable. Another model is the ‘semi-continuous’
model, one commly used ‘semi-continuous’ model is the ‘orthotropic sheets’ theory
proposed by Raoof (1982), which modeled the cable wire layers as several cylindrical

37
orthotropic sheets. However, the ‘orthotropic sheets’ theory is based on the
homogenization of the cable layers into orthotropic cylindrical sheets and is not
appropriate for cables with one core and six helical wires. The ‘thin rod’ model gives
much more reliable results than the ‘orthotropic sheets’ theory for seven wire cables.
In addition, several other models were proposed to simulate the cable wire slippage
and corresponding friction, such as the ‘frictional bending’ model proposed by Zhong
(2003). In summary, most of the existing models have ignored friction and interwire
contact deformation, and is not adequate to predict the actual cable damping;
b) In the aspect of interwire slippage and interwire friction, most of the research focused
on the occurrence of interwire slippage, with the assumption that the interwire friction
coefficient and the interwire normal force are constant. In addition, it assumed that
the elongation of the cable is composed of two parts (one from the cable section
without wire slippage and one with wire slippage), and superposition is applicable for
the two parts of cable elongation. However, the assumption of constant interwire
friction is not reasonable, especially when the cable interwire slippage happens. The
real behavior of the interwire slippage and interwire friction is not clear;
c) For the cable contact behavior, usually the wire-core contact or the wire-wire contact
is considered for the analysis. This could underestimate cable damping for cables
with soft core and small diameter. Because the coupling core-wire and wire-wire
contact behavior could be existed;
d) Material treatment to enhance damping was investigated by Yamaguchi (1994), but
the assumption that the added damping material will not change cable construction is
not appropriate;

38
e) Almost all of the investigations of cable damping concentrated on a single cable.
However, for the study of cable effects on the dynamic behavior of cable structure, it
is important to take into account the cable interaction behavior. The transmission of
energy from cable to cable is a crucial problem for the estimation of structural
responses;
f) A number of cable parameters that influence damping properties have been
investigated theoretically and experimentally, such as the cable pretension load, lay
angle, length, cable configuration and service history. The experimental results
showed that there is a disparity regarding the influence of cable pretension. One of
the conclusions is that the damping decreases as tensile force increases (Raoof and
Huang 1993b, Seppa 1971, Ramberg and Griffin 1977 et al.,). The second is that the
pretension has little influence on damping (Claren and Diana 1969a), while the third
conclusion is that a critical value of pre-stress corresponding to the variation of
damping exists (Yu 1949, 1952, Hard and Holben, 1967). The disparity might be the
result of energy dissipated through end termination or just the different loading cases
of the tests. Tests on cables with different construction indicated that damping
decreases as lay angle increases, and there exists a critical value corresponding to the
maximum damping. However, the effect of the change of lay angle was not included
in the analytical models. One major conclusion about the influence of cable length is
that as length increases, damping decreases, but it was also argued by some authors
that length contributes little to damping;
g) In order to get an accurate estimation of cable damping, it is important to exclude the
damping sources in the tests. For example, the effect of support conditions was

39
considered by Yamaguchi (1988). To make an accurate measurement of damping, the
control of the support motion is quite important;
h) Research of cable damping in space structure focus on the effect of the cable on the
dynamic behavior of a cable structure. Modeling the cable structure system include
modeling the cable and the host structure. It seems that no reasonable method or
mechanism is applicable to estimate the cable damping in space using ground based
test data. In addition, there is no formula to estimate the cable damping, and no
damping tested in vacuum, and very scare investigation of temperature effect on cable
damping;
i) The available investigations of composite material cable damping properties and
damping mechanism are very scarce. The existing literature focused on the testing of
damping properties under various length, ambient temperature, and different cable
constructions of CFRP cables. Though the tests achieved some basic characteristics of
composite material cable damping, the damping mechanism is not clarified.

40
Chapter 3
Experimental Identification of Cable
Damping
In this Chapter, first, an experimental setup for testing cable vibration damping is
described. Then several tests of carbon fiber cables and a stainless steel cable are
reported. From experiments, some important features of cable damping variation are
observed and discussed.
3.1 Introduction
From literature review, the problem of cable damping still attracts a great deal of
attention from the scientific community leading to extensive experiments on the
investigation of damping and vibration mitigation of cable and cable structure. However,
the reported tests appear to have concentrated on stainless-steel cables and much less
attention has been paid to the carbon fiber cables, especially for those in space structural
applications. Moreover, there is no investigation of cable damping in vacuum, and the
available study of temperature effect is very scarce. The damping mechanisms of carbon
fiber cables remains poorly understood. Therefore, the objective of this chapter is to test
several carbon fiber cables and a stainless steel cable in attempts to find out the
dependence of damping on tension, length, lay angle/construction, ambient temperature
and air pressure. The eventual goal of the tests is to propose a reasonable analytical

41
model to estimate carbon fiber cable damping, and to enhance the stability and
performance of structures by an optimal design of cables.
3.2 Experimental Setup
For the experimental setup, it is possible to vary the applied tension and cable length, and
the test apparatus can be easily modified to test cable damping in vacuum. Fig. 3.2.1
shows the full view of the experimental setup. It consists of a tension application and
measurement system, a cable clamp system, and a data collection and processing system.
Figure 3.2.1 Experimental setup
Fig. 3.2.2 shows a close-up of the fixture for applying tension. Each cable was first fixed
to the clamp at the right end of the wooden frame, which is done by screwing four bolts
to tighten the two steel plates that constitute the clamp system shown as Fig. 3.2.3. The
left end of the cable was passed through the clamp on the left (Fig. 3.2.4) which is
initially not tight. A loop, at the left end of the cable, was formed using a cable ferrule
and stop set (shown as Fig. 3.2.5), and was connected to a load cell (Fig. 3.2.6). The load
cell with digital meter provided the reading of the tension during the test. The other end

42
of the load cell was connected to an all thread stainless steel rod, which is used to adjust
cable tension by tightening the bolt at the left end of the wooden frame, shown as Fig.
3.2.2. Once the appropriate load was applied, the clamp on the left (Fig. 3.2.4) was
tightened to hold the tension during the tests.
Figure 3.2.2 Tension applying fixture
Figure 3.2.3 Details of the clamp

43
Figure 3.2.4 Connection between cable, accelerometers and the dynamic signal acquisition module
Figure 3.2.5 Cable ferrule and stop set
Figure 3.2.6 Connection between cable and load cell
right clamp left clamp

44
Two accelerometers, type PCB Model 352A73, shown as Fig. 3.2.7 were mounted to the
cable using wax at approximately three quarters and one fifth of the cable span (Fig.
3.2.4), respectively. The mass of the accelerometer is 0.3gm, and the size is
2.8mm×8.6mm×4.1mm (Height × Length × Width). These acceleration locations were
chosen to such that the first three vibration modes could be detected at either transducer
by avoiding the nodal points. In addition, having the two accelerometers located on
opposite sides of the cable span aims to minimize the torsion effects caused by small
movements of the accelerometers during the cable oscillations.
Figure 3.2.7 PCB 352A73 accelerometer
The accelerometers were connected to a NI 9234 dynamic signal acquisition (DSA)
module, as shown in Fig. 3.2.8. The NI 9234 DSA module has a built-in antialiasing filter
that automatically adjusts to the sampling rate. The DSA module was connected to a
laptop, as shown in Fig. 3.2.1.

45
Figure 3.2.8 NI USB 9234 dynamic signal acquisition module
Figure 3.2.9 Load cell
Tests were also conducted in different environmental conditions. Carbon fiber cables of
different length and different configuration were tested at room temperature (20°C) and
in a temperature controlled room (4°C) at the University of New Mexico. The test setup
described above was also sealed to test cables in vacuum condition, with an air pump to
sustain vacuum. These modifications to the test mock-up will be described in the
appropriate sections later.

46
3.3 Test Procedures and Data processing
3.3.1 Test Procedures
The tests were conducted with the following procedures:
Step 1: Fabricating a carbon fiber cable
A carbon fiber cable was made by twisting seven IM7 carbon fiber tows (HERCULES
INC, type IM7-W-12K), as shown in Fig. 3.3.1.1. First, the strands were fixed at both
ends using the cable ferrule and stop set. Then holding the untwisted strands at the left
end, and twisting the strands from the right end for a required number of turns in
clockwise direction.
Figure 3.3.1.1 IM-7 fiber tows
Step 2: Connecting the cable to the load cell, mounting the accelerometers and applying
tension

47
The left end of the newly manufactured cable was connected to the load cell using the
formed loop, as shown in Fig. 3.2.2. Then the accelerometers were mounted to the cable
using wax and connected to the dynamic signal acquisition (DSA) module. After
clamping the right end of the cable, tension force was applied by slowly tighten the bolt
at the left end of the wooden frame.
Step 3: Exciting cable vibration and collecting data for processing
The vibration of the cable was excited by tapping the cable center.
3.3.2 Data Processing
A dynamic signal acquisition (DSA) module with signal conditioning function, type NI
USB 9234, was connected to a laptop and accelerometers. It digitizes the incoming
signals to the analog output signals. Each signal was buffered, analog pre-filtered, and
digital filtered with a cutoff frequency that automatically adjust to the data rate chosen
(25k/s). The time histories of signals recorded by the two accelerometers were elaborated
to obtain the spectrum via Lab-VIEW 8.6 with the ‘Fast Fourier Transform’ (FFT). The
natural frequency of the cable vibration was obtained by recording the frequencies at
where a response peak is observed. The modal damping ratio was determined using the
‘half-power bandwidth’ method in frequency domain and the ‘logarithmic decrement’
method in time domain, respectively. Fig. 3.3.2.1 and Fig. 3.3.2.2 give a simple
illustration of the two methods. To estimate modal damping ratio using the ‘half-power
bandwidth’ method, the frequency response function (FRF) amplitude of the system is
obtained first. Corresponding to each natural frequency, there is a peak in FRF amplitude

48
( ). Corresponding to √ of the response peak are the two half point. The
frequencies corresponding to FRF amplitude peak ( ) and √ of the FRF
amplitude peak were obtained as: , and , respectively. Then the modal damping
ratio was calculated using Eq. (3-1) (Chopra, 2001):
(3-1)
Figure 3.3.2.1 Half-power bandwidth method
Figure 3.3.2.2 Logarithmic decrement method

49
To determine damping using the ‘logarithmic decrement’ method, time history response
was recorded by accelerometers, and the modal damping ratio can be determined using
Eq. (3-2) and Eq. (3-3) (Chopra, 2001).
|
|
√ (3-2)
√ (3-3)
Where is the logarithmic decrement, is the modal damping ratio, and , are the
vibration amplitudes at n cycles apart.
For each cable, seven tests were conducted, and fourteen data (from 2 accelerometers × 7
tests) were stored. By using the ‘half-power bandwidth method’ in frequency domain or
the ‘logarithmic decrement method’ in time domain, 14 damping values were obtained.
The damping for the tested cable, for example, a 0.5080m, 62.13 turn/m carbon fiber
cable with 445.00N pretension, was obtained by removing the data sets with maximum
and minimum damping values (data No.3 and 6 in Table 3.3.3.1), and averaging the
remaining ten values.
Table 3.3.1.1 Damping of a 0.5080m, 62.13 turns/m carbon fiber cable with 445.00N pretension
Data No 1 2 3 4 5 6 7
Damping estimated with data recorded by
accelerometer at 3/4 of cable length
(%)
0.36 0.36 0.36 0.36 0.36 0.35 0.35
Damping estimated with data recorded by
accelerometer at 1/5 of cable length
(%)
0.35 0.36 0.37 0.36 0.36 0.35 0.35
Damping of the tested cable 0.36
Variance 3×10⁻⁵

50
From Table 3.3.1.1, the variance of the modal damping ratio for this cable is 3×10⁻⁵
,
which shows a good repetition of the tests and the result is reliable. The vibration natural
frequency was determined in the same way.
3.4 Tests Conducted
A comprehension of damping variation with cable parameters and ambient environment
is essential to understand cable damping mechanisms and to design effective vibration
control methods. Six different configurations of tests were performed and the results were
analyzed and discussed:
a) Stainless steel cable in the length of 0.3048m and in the diameter of 0.003175m under
different tensile forces;
b) Carbon fiber cables in the length of 0.2032m, 0.3048m and 0.5080m with three
different configurations (20.71turns/m, 41.42turns/m and 62.13 turns/m) under room
temperature and room air pressure;
c) Carbon fiber cables in the length of 0.2032m, 0.3048m and 0.5080m with three
different configurations (20.71turns/m, 41.42turns/m and 62.13turns/m) at a
temperature of 4 ;
d) Carbon fiber cables in the length of 0.2032m, 0.3048m and 0.5080m with three
different configurations (20.71turns/m, 41.42turns/m and 62.13turns/m) in a vacuum
chamber (-20 in. Hg);
e) Carbon fiber cable in the length of 0.3048m with configuration of 41.42turns/m using
the stiffened wooden frame (bracing at the corners and cable supports);

51
f) Carbon fiber cables in the length of 0.3048m with three different configurations
(20.71turns/m, 41.42turns/m and 62.13turns/m) with one accelerometer mounted to
the cable.
3.4.1 Effect of Cable Tension
The test results of stainless steel cable by Yu (1949, 1952) have shown that the variation
of damping depends on cable pre-stressing and yielding. Cable pretension has no effect
on damping when cable pre-stressing below the yield point, while pre-stressing over yield
point leads to a considerable reduction of damping. The same conclusion was obtained by
Hard and Holben (1967) for a transmission line conductor. However, the experimental
results by Seppa (1971), Ramberg and Griffin (1977), Raoof (1993b), Xu et al., (1998,
1999), Kim and Jeong (2005), Zheng et al., (2003), and Barbieri et al., (2004a, 2004b)
showed that damping decreases as tension increases, while Yamaguchi (1987) concluded
that tension has no influence on damping. The disparity could be due to different
configuration and loading of the tests. In addition, almost all of these tests were
performed with stainless steel cables or transmission line cables. Thus, it is necessary to
provide some tests with carbon fiber cables to investigate the effect of tension on
damping.
The tests were carried out using the experimental setup shown in Fig. 3.2.1. The tested
stainless steel cable is made of several (7 × 7) stainless steel wires, as shown in Fig.
3.4.1.1, and the carbon fiber cable is made by twisting seven IM7 carbon fiber tows
(HERCULES INC, type IM7-W-12K). The geometric and the mechanical properties of
the 0.3048m carbon fiber cables are summarized in Table 3.4.1.1. To investigate the

52
effect of the applied tension on damping, cables were loaded with tension force of
111.25N, 222.50N, 333.75N, 445.00N and 578.50N. Results of cables tested within test
configurations (a) to (d) were used to analyze the effect of tension on damping.
Figure 3.4.1.1 Stainless steel cable and cross section
Table 3.4.1.1 Properties of 0.3048m carbon fiber cables
Cable construction
(turns/m)
Length
(m)
Mass per unit length
(kg/m)
Young’s Modulus
(Pa)
20.71 0.3048 0.00427 2.76×10¹¹
41.42 0.3048 0.00432 2.76×10¹¹
62.13 0.3048 0.00446 2.76×10¹¹
3.4.1.1 Carbon Fiber Cables Tested at Room Temperature
The time history responses and the spectrum of the signals at the two measuring points
were obtained using the recorded data from the two accelerometers located at three
quarters and one fifth of the cable span. Fig. 3.4.1.2 shows the time history responses of a
0.3048m, 20.71 turns/m carbon-fiber cable with 333.75N pretension. From Fig. 3.4.1.2, it
is noticed that the vibration decayed in about 0.08 second and 35 cycles. Fig. 3.4.1.3

53
presents the corresponding frequency domain data, where a vibration natural frequency of
458.67Hz was identified from the frequency corresponding to the response peak.
Figure 3.4.1.2 Recorded time-history responses for a 0.3048m, 20.71turns/m carbon fiber cable at room
temperature and 333.75N pretension (a) at 1/5 of cable length (b) at 3/4 of cable length
-1500
-1000
-500
0
500
1000
1500
0.60 0.62 0.64 0.66 0.68 0.70
Acc
ele
rati
on
(m
/s2 )
Time (s) (a)
-1500
-1000
-500
0
500
1000
1500
0.60 0.62 0.64 0.66 0.68 0.70
Acc
ele
rati
on
(m
/S2)
Time (s) (b)

54
Figure 3.4.1.3 Spectral of signals for a 0.3048m, 20.71turns/m carbon fiber cable at room temperature and
333.75N pretension (a) at 1/5 of cable length (b) at 3/4 of cable length
Table 3.4.1.2 and Table 3.4.1.3 list, respectively, the results of the modal damping ratio
and the identified vibration frequencies for cables tested at room temperature. In Fig.
3.4.1.4, the experimental determined modal damping ratios for different length and
0.0
0.5
1.0
1.5
2.0
2.5
3.0
3.5
4.0
0 200 400 600 800 1000
FFT
Pe
ak
Frequency (Hz) (a)
0.0
0.5
1.0
1.5
2.0
2.5
3.0
3.5
4.0
0 200 400 600 800 1000
FFT
Pe
ak
Frequency (Hz) (b)

55
construction cables are plotted against tension and Fig. 3.4.1.5 plots the variation of
vibration frequency with tension.
Table 3.4.1.2 Cable damping at room temperature
Tension
(N)
Damping for 20.71turns/m cables
(%) Damping for 41.42turns/m cables
(%) Damping for 62.13turns/m cables
(%)
0.2032
m
0.3048
m
0.5080
m
0.2032
m
0.3048
m
0.5080
m
0.2032
m
0.3048
m
0.5080
m
111.25 5.50 2.42 2.22 4.59 2.27 1.54 4.20 1.68 1.14
222.50 3.79 2.11 1.81 3.07 1.80 1.11 2.40 1.24 0.96
333.75 3.18 1.83 1.33 2.53 1.68 0.94 1.73 1.18 0.54
445.00 3.06 1.45 1.14 2.35 1.39 0.69 1.23 0.97 0.50
578.50 2.60 1.40 1.00 2.18 1.36 0.70 1.18 0.90 0.36
Table 3.4.1.3 Cable vibration frequency at room temperature
Tension
(N)
Frequency for 20.71turns/m cables
(Hz) Frequency for 41.42turns/m cables
(Hz) Frequency for 62.13turns/m cables
(Hz)
0.2032
m
0.3048
m
0.5080
m
0.2032
m
0.3048
m
0.5080
m
0.2032
m
0.3048
m
0.5080
m
111.25 365.71 309.87 159.62 360.29 280.96 117.82 352.68 266.82 114.97
222.50 515.79 392.63 225.8 2 492.74 369.02 209.3 474.18 360.33 204.54
333.75 625.85 458.67 263.45 612.20 430.00 262.28 591.53 418.68 261.46
445.00 694.65 517.74 308.86 693.57 500.49 292.50 687.77 485.62 300.93
578.50 797.60 554.68 355.53 788.08 534.65 347.72 767.40 502.50 341.27
The results presented in Fig. 3.4.1.4 show a decrease in the cable damping as tension
increases. For the 0.2032m cables, the damping presents a significant decrement when
tension is less than about 222.50N, whereas, for cables in the length of 0.3048m and
0.5080m, damping decreases at a slow tempo with the applied tension, and the significant
decrement presented in the 0.2032m cables is not observed, which suggests that a short
cable could have a greater end effects. From Fig. 3.4.1.5, it is evident that a greater
tension leads to a higher vibration frequency, and a longer cable exhibits a lower
vibration frequency.

56
Figure 3.4.1.4 Damping versus tension for cables at room temperature (a) 20.71turns/m (b) 41.42turns/m (c)
62.13turns/m cables
0.00
1.00
2.00
3.00
4.00
5.00
6.00
0 100 200 300 400 500 600
Dam
pin
g (%
)
Tension (N)
0.2032m
0.3048m
0.5080m
(a)
0.00
1.00
2.00
3.00
4.00
5.00
0 100 200 300 400 500 600
Dam
pin
g (%
)
Tension (N)
0.2032m
0.3048m
0.5080m
(b)
0.00
1.00
2.00
3.00
4.00
5.00
0 100 200 300 400 500 600
Dam
pin
g (%
)
Tension (N)
0.2032m
0.3048m
0.5080m
(c)

57
Figure 3.4.1.5 Vibration frequency versus tension for cables at room temperature (a) 20.71turns/m (b)
41.42turns/m (c) 62.13turns/m cable
0
200
400
600
800
1000
0 100 200 300 400 500 600
Fre
qu
en
cy (
Hz)
Tension (N)
0.2032m
0.3048m
0.5080m
(a)
0
200
400
600
800
1000
0 100 200 300 400 500 600
Fre
qu
en
cy (
Hz)
Tension (N)
0.2032m
0.3048m
0.5080m
(b)
0
200
400
600
800
1000
0 100 200 300 400 500 600
Fre
qu
en
cy (
Hz)
Tension (N)
0.2032m
0.3048m
0.5080m
(c)

58
3.4.1.2 Carbon Fiber Cables Tested at a Temperature of 4
For different length, different configuration carbon fiber cables tested in a cold room with
a temperature of 4 , Table 3.4.1.4 and Table 3.4.1.5 present the modal damping ratios
and vibration frequencies, respectively. The time history responses for a 0.3048m, 20.71
turns/m carbon fiber cable tested at a temperature of 4 and 333.75N pretension were
recorded by the two accelerometers and shown in Fig. 3.4.1.6. Comparing these with the
time history responses (Fig. 3.4.1.2) of the cable tested at room temperature, the time
responses in Fig. 3.4.1.6 shows a quicker logarithmic rate of decay (in 0.05 second). In
other words, a higher damping is presented for cable tested at a temperature of 4 . The
corresponding spectrum data are shown in Fig. 3.4.1.7.
Table 3.4.1.4 Cable damping at a temperature of 4
Tension
(N)
Damping for 20.71turns/m cables (%)
Damping for 41.42turns/m cables (%)
Damping for 62.13turns/m cables (%)
0.2032
m
0.3048
m
0.5080
m
0.2032
m
0.3048
m
0.5080
m
0.2032
m
0.3048
m
0.5080
m
111.25 5.95 3.53 2.58 4.92 2.58 2.35 4.37 1.88 1.58
222.50 4.25 2.70 2.26 3.69 2.25 1.89 2.46 1.55 1.32
333.75 3.57 1.98 1.92 2.74 1.89 1.65 1.72 1.23 1.13
445.00 3.12 1.63 1.51 2.36 1.60 1.38 1.43 1.09 0.95
578.50 2.71 1.55 1.45 1.95 1.46 1.07 1.30 1.03 0.81
Table 3.4.1.5 Cable vibration frequency at a temperature of 4
Tension
(N)
Frequency for 20.71turns/m cables
(Hz) Frequency for 41.42turns/m cables
(Hz) Frequency for 62.13turns/m cables
(Hz)
0.2032
m
0.3048
m
0.5080
m
0.2032
m
0.3048
m
0.5080
m
0.2032
m
0.3048
m
0.5080
m
111.25 360.53 267.38 162.64 356.08 262.27 131.68 360.49 242.03 118.04
222.50 516.70 351.89 219.34 526.42 369.34 209.35 501.18 349.19 212.79
333.75 613.04 460.92 283.06 612.85 444.31 262.32 591.01 430.68 266.96
445.00 703.35 523.54 318.79 701.78 518.47 302.10 702.81 505.73 298.65
578.50 796.57 588.25 360.05 783.16 580.32 344.19 796.47 563.62 367.58

59
Figure 3.4.1.6 Recorded time-history responses for a 0.3048m, 20.71turns/m carbon fiber cable at a
temperature of 4 and 333.75N pretension (a) at 1/5 of cable length (b) at 3/ 4 of cable length
-300
-200
-100
0
100
200
300
400
0.38 0.39 0.40 0.41 0.42 0.43 0.44 0.45 0.46 0.47 0.48
Acc
ele
rati
on
(m
/s2)
Time (s) (a)
-500
-400
-300
-200
-100
0
100
200
300
400
0.38 0.39 0.40 0.41 0.42 0.43 0.44 0.45
Acc
ele
rati
on
(m
/s2)
Time (s) (b)

60
Figure 3.4.1.7 Spectral of signals for a 0.3048m, 20.71turns/m carbon fiber cable at a temperature of 4
and 333.75N pretension (a) at 1/5 of cable length (b) at 3/ 4 of cable length
Fig. 3.4.1.8 depicts the vibration damping versus tension for cables tested at a
temperature of 4 , and Fig. 3.4.1.9 plots the variation of vibration frequency with
tension.
0.0
0.5
1.0
1.5
2.0
2.5
0 200 400 600 800 1000
FFT
Pe
ak
Frequency (Hz) (a)
0.0
0.5
1.0
1.5
2.0
2.5
0 200 400 600 800 1000
FFT
pe
ak
Frequency (Hz) (b)

61
Figure 3.4.1.8 Damping versus tension for cables at a temperature of 4 (a) 20.71turns/m (b)
41.42turns/m (c) 62.13turns/m cables
0.00
1.00
2.00
3.00
4.00
5.00
6.00
7.00
0 100 200 300 400 500 600
Dam
pin
g (%
)
Tension (N)
0.2032m
0.3048m
0.5080m
(a)
0.00
1.00
2.00
3.00
4.00
5.00
6.00
0 100 200 300 400 500 600
Dam
pin
g (%
)
Tension (N)
0.2032m
0.3048m
0.5080m
(b)
0.00
1.00
2.00
3.00
4.00
5.00
0 100 200 300 400 500 600
Dam
pin
g (%
)
Tension (N)
0.2032m
0.3048m
0.5080m
(c)

62
Figure 3.4.1.9 Vibration frequency versus tension for cables at a temperature of 4 (a) 20.71turns/m (b)
41.42 turns/m (c) 62.13turns/m cables
0
200
400
600
800
1000
0 100 200 300 400 500 600
Fre
qu
en
cy (
Hz)
Tension (N)
0.2032m
0.3048m
0.5080m
(a)
0
200
400
600
800
1000
0 100 200 300 400 500 600
Fre
qu
en
cy (
Hz)
Tension (N)
0.2032m
0.3048m
0.5080m
(b)
0
200
400
600
800
1000
0 100 200 300 400 500 600
Fre
qu
en
cy (
Hz)
Tension (N)
0.2032m
0.3048m
0.5080m
(c)

63
It is observed from Fig. 3.4.1.8 that cable damping decreases as tension increases. For
cables in the length of 0.2032m, the damping shows a fast descendant as tension
increases when tension is less than around 222.50N. For cables in the length of 0.3048m
and 0.5080m, damping decreases slowly under the applied tension, the significant
decrement observed in the 0.2032m cables was not noticed, which suggests that the end
effects on damping is greater for shorter cables. Besides, a slower damping decrement
rate was noticed for cables at a temperature of 4 compared with cables at room
temperature (20 ). The vibration frequency increases as tension increases and decreases
as length increases as indicated in Fig. 3.4.1.9.
3.4.1.3 Carbon Fiber Cables Tested in a Vacuum Chamber
As regards the carbon fiber cables tested at 20 in a vacuum chamber, the identified
cable vibration frequencies and modal damping ratios are listed in Table 3.4.1.6 and
Table 3.4.1.7, respectively. The time history responses of a 20.71 turns/m, 0.3048m
carbon fiber cable are presented in Fig. 3.4.1.10. From the figures, the time history
responses show a slower decay than the cables in air. The corresponding spectrum signals
are shown in Fig. 3.4.1.11, which gives a vibration frequency about 581.37 Hz.
Table 3.4.1.6 Cable vibration frequency in a vacuum (-20 In. Hg) chamber
Tension
(N)
Frequency for 20.71turns/m cables (Hz)
Frequency for 41.42turns/m cables (Hz)
Frequency for 62.13turns/m cables (Hz)
0.2032
m
0.3048
m
0.5080
m
0.2032
m
0.3048
m
0.5080
m
0.2032
m
0.3048
m
0.5080
m
111.25 351.90 310.35 161.25 323.18 279.29 143.24 321.7 281.76 140.81
222.50 481.72 413.36 214.78 466.96 359.82 226.24 464.29 356.29 210.82
333.75 581.37 471.12 286.02 575.97 420.68 280.82 580.89 424.31 284.33
445.00 705.72 518.26 319.62 660.10 498.45 313.83 657.14 491.28 305.97
578.50 796.83 567.86 357.24 747.26 567.72 357.80 745.16 521.81 353.93

64
Table 3.4.1.7 Cable damping in a vacuum chamber (-20 in. Hg)
Tension
(N)
Damping for 20.71turns/m cables (%)
Damping for 41.42turns/m cables (%)
Damping for 62.13turns/m cables (%)
0.2032
m
0.3048
m
0.5080
m
0.2032
m
0.3048
m
0.5080
m
0.2032
m
0.3048
m
0.5080
m
111.25 4.94 2.14 1.87 4.14 2.03 1.34 3.89 1.33 0.88
222.50 3.62 1.94 1.24 2.62 1.51 0.92 1.90 1.08 0.66
333.75 2.95 1.47 0.85 2.06 1.32 0.76 1.43 0.91 0.51
445.00 2.73 1.16 0.65 1.67 1.13 0.60 1.25 0.72 0.45
578.50 2.48 1.06 0.62 1.41 0.99 0.58 1.11 0.67 0.33
Figure 3.4.1.10 Recorded time-history responses for a 0.3048m, 20.71turns/m carbon fiber cable in vacuum
chamber with 333.75N pretension (a) at 1/5 of cable length (b) at 3/4 of cable length
-800
-600
-400
-200
0
200
400
600
800
1.95 1.97 1.99 2.01 2.03 2.05
Acc
ele
rati
on
(m
/s2)
Time (s)
-800
-600
-400
-200
0
200
400
600
800
1.95 1.97 1.99 2.01 2.03 2.05
Acc
ele
rati
on
(m
/s2)
Time (s) (b)
(a)

65
Figure 3.4.11 Spectral of signals for a 0.3048m, 20.71turns/m carbon fiber cable in vacuum chamber with
333.75N pretension (a) at 1/5 of cable length (b) at 3/4 of cable length
The results presented in Table 3.4.1.6 and Table 3.4.1.7 are plotted in Fig. 3.4.1.12 and
Fig. 3.4.1.13, respectively, where shows the trend of modal damping ratio and vibration
frequency with the various tension forces.
0.0
0.2
0.4
0.6
0.8
1.0
1.2
1.4
1.6
1.8
2.0
0 200 400 600 800 1000
FFT
Pe
ak
Frequency (Hz) (a)
0.0
0.2
0.4
0.6
0.8
1.0
1.2
1.4
1.6
1.8
2.0
0 200 400 600 800 1000
FFT
Pe
ak
Frequency (Hz) (b)

66
Figure 3.4.1.12 Damping versus tension for cables in a vacuum chamber (a) 20.71turns/m (b) 41.42turns/m
(c) 62.13turns/m cables
0.00
1.00
2.00
3.00
4.00
5.00
6.00
0 100 200 300 400 500 600
Dam
pin
g (%
)
Tension (N)
0.2032m
0.3048m
0.5080m
(a)
0.00
1.00
2.00
3.00
4.00
5.00
0 100 200 300 400 500 600
Dam
pin
g (%
)
Tension (N)
0.2032m
0.3048m
0.5080m
(b)
0.00
1.00
2.00
3.00
4.00
5.00
0 200 400 600
Dam
pin
g (%
)
Tension (N)
0.2032m
0.3048m
0.5080m
(c)

67
Figure 3.4.1.13 Vibration frequency versus tension for cables in vacuum chamber (a) 20.71turns/m (b)
41.42turns/m (c) 62.13turns/m cables
0
150
300
450
600
750
900
0 100 200 300 400 500 600
Fre
qu
en
cy (
Hz)
Tension (N)
0.2032m
0.3048m
0.5080m
(a)
0
150
300
450
600
750
900
0 100 200 300 400 500 600
Fre
qu
en
cy (
Hz)
Tension (N)
0.2032m
0.3048m
0.5080m
(b)
0
150
300
450
600
750
900
0 100 200 300 400 500 600
Fre
qu
en
cy (
Hz)
Tension (N)
0.2032m
0.3048m
0.5080m
(c)

68
As shown in Fig. 3.4.1.12, for cables tested in vacuum chamber, the vibration damping
varies in the same way as cables tested at normal atmosphere, the damping decreases as
tension increases, and a significant decrease was noticed for cables in the length of
0.2032m when the tension is less than about 225.00N. Fig. 3.4.1.13 shows that the
vibration frequency increases as cable tension increases and decreases as length increases.
3.4.1.4 Stainless Steel Cable Tested at Room Temperature
Stainless steel cables in the length of 0.3048m and in the diameter of 0.003175m were
tested under different tensile force to investigate the variation of stainless steel cable
damping with tension.
Fig. 3.4.1.14 presents the variation of stainless steel cable damping with tension. The
results showed that for the stainless steel cable, higher tension results in lower damping,
which is similar to that observed by Seppa (1971), Ramberg and Griffin (1977), Raoof
(1993b), Xu et al., (1998, 1999), Kim and Jeong (2005), Zheng et al., (2003), and
Barbieri et al., (2004a, 2004b), and demonstrates the same trend as the carbon fiber
cables.
In addition, the modal damping ratios evaluated by the ‘half-power bandwidth’ method
and the ‘logarithmic decrement’ method are shown in Fig. 3.4.1.14. From the figures, the
modal damping ratios obtained in time domain agrees well with those evaluated in
frequency domain, the difference is about 1-3%.

69
Figure 3.4.1.14 Variation of damping with applied tension
3.4.1.5 Evaluation of Rayleigh Damping Constants
Zhu and Meguid (2007) et al. concluded that Rayleigh damping is suitable to model the
cable damping. In order to evaluate the dependence of damping on the vibration mode,
the Rayleigh damping theory is introduced. For the Rayleigh damping theory, it is
0.00
0.50
1.00
1.50
2.00
2.50
3.00
100 200 300 400 500 600
Dam
pin
g in
fre
qu
en
cy d
om
ain
(%
)
Tension (N)
20.71 turns/m carbon fiber cable
41.42 turns/m carbon fiber cable
62.13 turns/m carbon fiber cable
Stainless steel cable
0.00
0.50
1.00
1.50
2.00
2.50
3.00
100 200 300 400 500 600
Dam
pin
g in
tim
e d
om
ain
(%
)
Tension (N)
20.71 turns/mcarbon fiber cable
41.42 turns/m carbon fiber cable
61.72 turns/m carbon fiber cable
Stainless steel cable
(b)
(a)

70
assumed that the damping matrix is proportional to the combination of mass and stiffness
matrices as given by the expression of Eq. (3-4) (Chopra 2001):
[ ] [ ] [ ] (3-4)
Where:
[ ] = damping matrix of the vibration system
[ ] mass matrix of the vibration system
[ ] = stiffness matrix of the vibration system
and = the Rayleigh damping constants
After orthogonal transformation and reduction to n-uncoupled equation, we can obtain
the following:
{
(3-5)
From Eq. (3-5), the following is obtained:
{
(3-6)
Where:
1 ,2 = the first and the second circular vibration frequency of the tested cable

71
1 , 2
= the first and the second modal damping ratio of the tested cable
1 and 2 can be determined from the spectrum analysis of cable vibration. 1 and 2
can be determined using the ‘half-power bandwidth’ method. Before applying those
values to Eq. (3-6), the values are smoothed by quadratic curve fitting. The values of
and for 0.3048m (20.71turns/m, 41.42turns/m and 62.13 turns/m) carbon fiber cables,
and stainless steel cable were obtained by Eq. (3-6), the results are listed in Table 3.4.1.8
and plotted in Fig. 3.4.1.15 and Fig. 3.4.1.16, respectively. From the plots, it can be
observed that initially increases as tension increases, and then decreases. In addition,
Fig.3.4.1.16 shows that decreases as tension increases for both carbon-fiber cables and
the stainless steel cable.
Table 3.4.1.8 Alpha and beta for the tested 0.3048m cables
Tension
(N)
20.71turns/m carbon
fiber cable
41.42 turns/m carbon
fiber cable
62.13 turns/m carbon
fiber cable Stainless steel cable
Alpha Beta Alpha Beta Alpha Beta Alpha Beta
111.25 -5.239 0.000027 -10.330 0.000029 -22.559 0.000028 24.252 0.000021
222.50 1.734 0.000017 1.130 0.000016 -18.438 0.000015 28.452 0.000015
333.75 5.337 0.000012 17.990 0.000009 -11.638 0.000010 29.676 0.000011
445.00 0.834 0.000009 27.292 0.000006 -6.238 0.000007 27.023 0.000008
578.50 18.208 0.000009 25.973 0.000006 -6.141 0.000007 18.784 0.000007

72
Figure 3.4.1.15 Relation curves of alpha with tension
Figure 3.4.1.16 Relation curves of beta with tension
In summary, cable damping decreases as tension increases for the range of tension forces
considered in this research. The same conclusion was derived by Seppa (1971), Ramberg
and Griffin (1977) et al. The decrease in cable damping is caused by the increased
interwire contact force, which reduces the occurrence of interwire slippage and causes
-30.00
-20.00
-10.00
0.00
10.00
20.00
30.00
40.00
0 150 300 450 600 750 900
Alp
ha
Tension (N)
20.71turns/mcarbon fibercable
41.42turns/mcarbon fibercable
62.13turns/mcarbon fibercable
steel cable
0.000000
0.000005
0.000010
0.000015
0.000020
0.000025
0.000030
0.000035
0 100 200 300 400 500 600
Beta
Tension (N)
20.71turns/m carbonfiber cable
41.42turns/m carbonfiber cable
62.13turns/m carbonfiber cable
steel cable

73
lower energy dissipation. The initial decrease in damping for short cable lengths could be
due to greater end (boundary induced) effects for short cables. Concerning with the
vibration frequency, as expected, a higher tension leads to a higher vibration frequency.
3.4.2 Effect of Cable Length
Some previously reported tests showed that damping decreases as cable length increases
(Yu 1949, 1952, Barbieri et al., 2004a, 2004b); while others indicated that length has no
significant effect on damping (Hard and Holben, 1967). This disparity may due to the
difference of cable configuration and test apparatus. It is worthwhile to conduct some
vibration tests on cables with different lengths to study the dependence of damping on
length. Tests were performed using the experimental setup shown in Fig. 3.2.1 by
modifying the location of the wooden components where the steel plates clamped. Cables
in length of 0.2032m, 0.3048m, and 0.5080m with three different configurations
(20.71turns/m, 41.42turns/m and 62.13turns/m) were tested at room temperature of 20
and 4 , and in a vacuum chamber.
3.4.2.1 Carbon Fiber Cables Tested at Room Temperature
For carbon fiber cables tested at room temperature, the damping is plotted against cable
length in Fig. 3.4.2.1. From Fig. 3.4.2.1, it is observed that damping has a significant
decrement as length increases for cables shorter than 0.3m. Beyond this length, the
decrement is small or negligible. In addition, for short cables (<0.3m), the decrement
ratio of damping for cables under a tensile force less than 111.25N is about 2-3 times the
decrement ratio for cables loading with a tensile force more than 111.25N .

74
Figure 3.4.2.1 Cable damping versus length for cables at room temperature (a) 20.71turns/m (b)
41.42turns/m (c) 62.13turns/m cables
0.00
1.00
2.00
3.00
4.00
5.00
6.00
0.2 0.25 0.3 0.35 0.4 0.45 0.5
Dam
pin
g (%
)
Length (m)
111.25N
222.50N
333.75N
445.00N
578.5N
(a)
0.00
1.00
2.00
3.00
4.00
5.00
0.2 0.25 0.3 0.35 0.4 0.45 0.5
Dam
pin
g (%
)
Length (m)
111.25N
222.50N
333.75N
445.00N
578.50N
(b)
0.00
1.00
2.00
3.00
4.00
5.00
0.2 0.25 0.3 0.35 0.4 0.45 0.5
Dam
pin
g (%
)
Length (m)
111.25N
222.50N
333.75N
445.00N
578.50N
(c)

75
3.4.2.2 Carbon Fiber Cables Tested at a Temperature of 4
For carbon fiber cables tested in a cold room with temperature set at 4 , the damping of
cables with different length and construction are plotted in Fig. 3.4.2.2. It is clear from
Fig. 3.4.2.2 that damping initially decreases as length increases, and is unaffected by
length for a longer cable. A significant decrement of cable damping is noticed for the
short cable with length less than about 0.3m.

76
Figure 3.4.2.2 Cable damping versus length for cables at 4 (a) 20.71turns/m (b) 41.42turns/m (c)
62.13turns/m cables
0.00
1.00
2.00
3.00
4.00
5.00
6.00
7.00
0.2 0.25 0.3 0.35 0.4 0.45 0.5
Dam
pin
g (%
)
Length (m)
111.25N
222.50N
333.75N
445.00N
578.50N
(a)
0.00
1.00
2.00
3.00
4.00
5.00
6.00
0.2 0.25 0.3 0.35 0.4 0.45 0.5
Dam
pin
g (%
)
Length (m)
111.25N
222.50N
333.75N
445.00N
578.50N
(b)
0.00
1.00
2.00
3.00
4.00
5.00
0.2 0.25 0.3 0.35 0.4 0.45 0.5
Dam
pin
g (%
)
Length (m)
111.25N
222.50N
333.75N
445.00N
578.50N
(c)

77
3.4.2.3 Carbon Fiber Cables Tested in a Vacuum Chamber
Fig. 3.4.2.3 presents the damping for cables tested in a vacuum chamber, with different
length and construction. From Fig.3.4.2.3, the variation of damping with length shows the
same trend as the cables tested at room temperature and at a temperature of 4 . A longer
cable has a lower damping, and a quicker decrement is presented for a shorter cables.

78
Figure 3.4.2.3 Cable damping versus length for cables in a vacuum chamber (a) 20.71turns/m (b)
41.42turns/m (c) 62.13turns/m cables
0.00
1.00
2.00
3.00
4.00
5.00
6.00
0.2 0.25 0.3 0.35 0.4 0.45 0.5
Dam
pin
g (%
)
Length (m)
111.25N
222.50N
333.75N
445.00N
578.50N
(a)
0.00
1.00
2.00
3.00
4.00
5.00
0.2 0.25 0.3 0.35 0.4 0.45 0.5
Dam
pin
g (%
)
Length (m)
111.25N
222.50N
333.75N
445.00N
578.50N
(b)
0.00
1.00
2.00
3.00
4.00
5.00
0.2 0.25 0.3 0.35 0.4 0.45 0.5
Dam
pin
g (%
)
Length (m)
111.25N
222.50N
333.75N
445.00N
578.50N
(c)
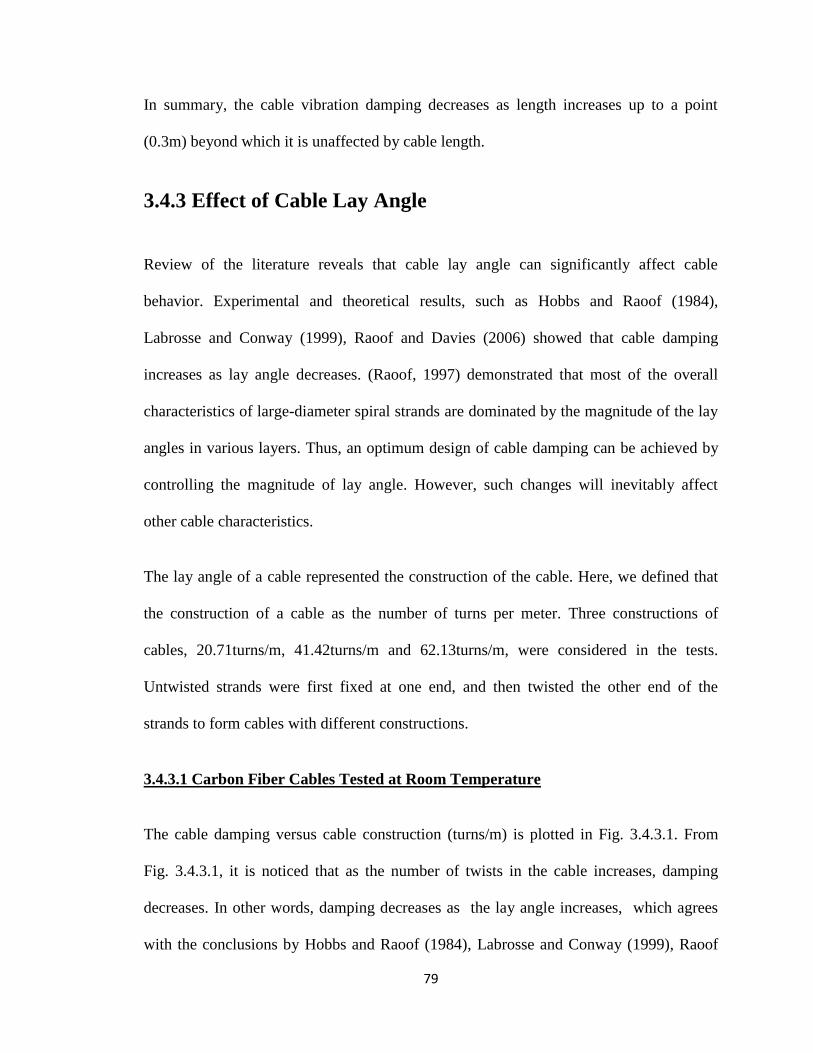
79
In summary, the cable vibration damping decreases as length increases up to a point
(0.3m) beyond which it is unaffected by cable length.
3.4.3 Effect of Cable Lay Angle
Review of the literature reveals that cable lay angle can significantly affect cable
behavior. Experimental and theoretical results, such as Hobbs and Raoof (1984),
Labrosse and Conway (1999), Raoof and Davies (2006) showed that cable damping
increases as lay angle decreases. (Raoof, 1997) demonstrated that most of the overall
characteristics of large-diameter spiral strands are dominated by the magnitude of the lay
angles in various layers. Thus, an optimum design of cable damping can be achieved by
controlling the magnitude of lay angle. However, such changes will inevitably affect
other cable characteristics.
The lay angle of a cable represented the construction of the cable. Here, we defined that
the construction of a cable as the number of turns per meter. Three constructions of
cables, 20.71turns/m, 41.42turns/m and 62.13turns/m, were considered in the tests.
Untwisted strands were first fixed at one end, and then twisted the other end of the
strands to form cables with different constructions.
3.4.3.1 Carbon Fiber Cables Tested at Room Temperature
The cable damping versus cable construction (turns/m) is plotted in Fig. 3.4.3.1. From
Fig. 3.4.3.1, it is noticed that as the number of twists in the cable increases, damping
decreases. In other words, damping decreases as the lay angle increases, which agrees
with the conclusions by Hobbs and Raoof (1984), Labrosse and Conway (1999), Raoof

80
and Davies (2006). This could be because as the number of twist increases, the cable
becomes tighter, hence reducing the movement and friction internal to the cable.

81
Figure 3.4.3.1 Cable damping versus cable construction for cables at room temperature (a) 0.2032m (b)
0.3048m (c) 0.5080m cables
0.00
1.00
2.00
3.00
4.00
5.00
6.00
20 25 30 35 40 45 50 55 60
Dam
pin
g (%
)
Construction (turns/m)
111.25N 222.50N333.75N 445.00N578.50N
(a)
0.00
0.50
1.00
1.50
2.00
2.50
3.00
20 25 30 35 40 45 50 55 60
Dam
pin
g (%
)
Construction (turns/m)
111.25N 222.50N 333.75N445.00N 578.50N
(b)
0.00
0.50
1.00
1.50
2.00
2.50
20 25 30 35 40 45 50 55 60
Dam
pin
g (%
)
Construction (turns/m)
111.25N 222.50N 333.75N
445.00N 578.50N
(c)

82
3.4.3.2 Carbon Fiber Cables Tested at a Temperature of 4
Fig. 3.4.3.2 presents the damping versus construction for cables tested at a temperature of
4 . The plots show that the damping decreases as the number of twists in the cable
increases. The cables with greater lay angle exhibit lower damping.
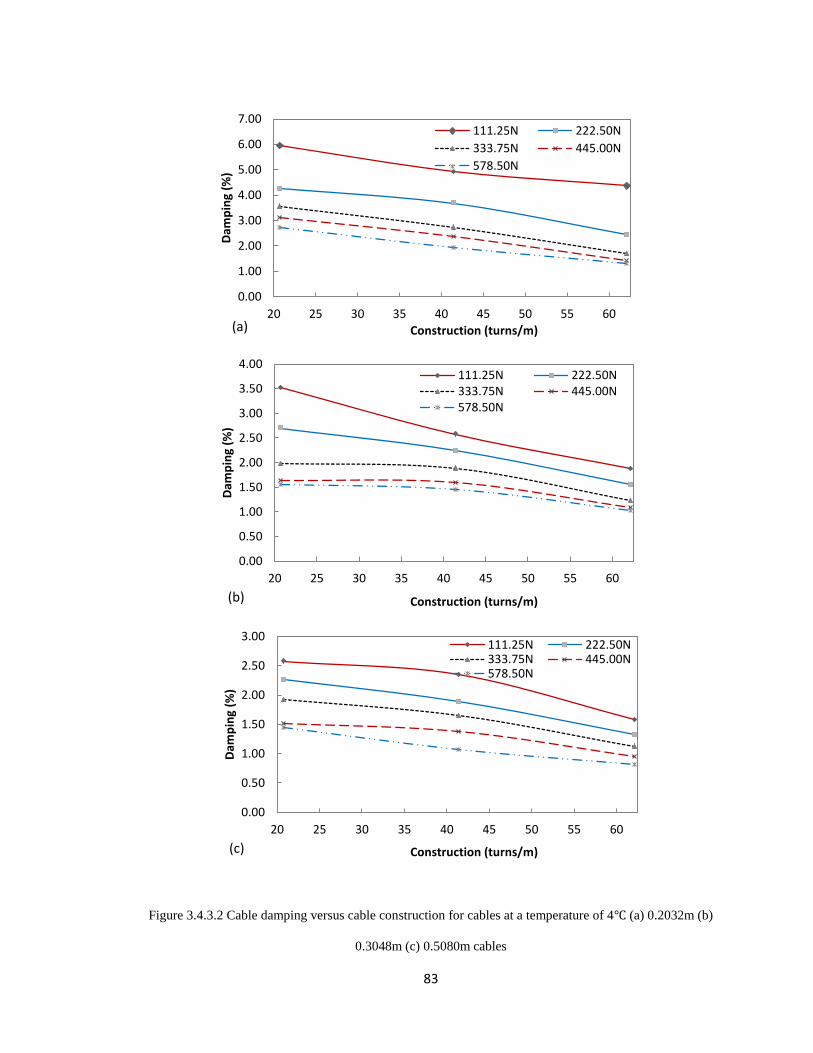
83
Figure 3.4.3.2 Cable damping versus cable construction for cables at a temperature of 4 (a) 0.2032m (b)
0.3048m (c) 0.5080m cables
0.00
1.00
2.00
3.00
4.00
5.00
6.00
7.00
20 25 30 35 40 45 50 55 60
Dam
pin
g (%
)
Construction (turns/m)
111.25N 222.50N
333.75N 445.00N
578.50N
(a)
0.00
0.50
1.00
1.50
2.00
2.50
3.00
3.50
4.00
20 25 30 35 40 45 50 55 60
Dam
pin
g (%
)
Construction (turns/m)
111.25N 222.50N333.75N 445.00N578.50N
(b)
0.00
0.50
1.00
1.50
2.00
2.50
3.00
20 25 30 35 40 45 50 55 60
Dam
pin
g (%
)
Construction (turns/m)
111.25N 222.50N333.75N 445.00N578.50N
(c)

84
3.4.3.3 Carbon Fiber Cables Tested in a Vacuum Chamber
Fig. 3.4.3.3 plots the damping versus cable configuration for cables tested in a vacuum
chamber. According to the results, the variation of cable damping with lay angle is similar
to that of cables tested at temperature of 20 and 4 , the damping decreases as the
number of twists in the cable increases.

85
Figure 3.4.3.3 Cable damping versus cable construction for cables in a vacuum chamber (a) 0.2032m (b)
0.3048m (c) 0.5080m cables
0.00
1.00
2.00
3.00
4.00
5.00
6.00
20 25 30 35 40 45 50 55 60
Dam
pin
g (%
)
Construction (turns/m)
111.25N 222.50N 333.75N
445.00N 578.50N
(a)
0.00
0.50
1.00
1.50
2.00
2.50
20 25 30 35 40 45 50 55 60
Dam
pin
g (%
)
Construction (turns/m)
111.25N 222.50N 333.75N
445.00N 578.50N
(b)
0.00
0.50
1.00
1.50
2.00
20 25 30 35 40 45 50 55 60
Dam
pin
g (%
)
Configuration (turns/m)
111.25N 222.50N 333.75N
445.00N 578.50N
(c)

86
In summary, from the tests, it is observed that cable damping increases as lay angle of the
cable increases. This could be because as the number of twist increases, the cable
becomes tighter, hence reducing the movement and friction internal to the cable.
3.4.4 Effect of Air Pressure
The fluid in which a structure is immersed can provide other damping mechanism. To
investigate the effect of air pressure on cable damping, the experimental setup shown in
Fig. 3.2.1 was modified to test the carbon fiber cable damping by excluding air from the
chamber in the test. The wooden frame in Fig. 3.2.1 was sealed using plastic plates at the
top and the bottom (Fig. 3.4.4.3). The foam tape (Fig. 3.4.4.6) was used between the
plastic plates and the wooden frame to reduce leakage. A pressure gauge (Fig. 3.4.4.1)
was connected to the chamber at the side of the chamber to measure the air pressure,
shown as Fig. 3.4.4.4. The vacuum of the chamber (-20 in Hg), was achieved by pumping
the air out of the chamber using the pump shown in Fig. 3.4.4.2.
There is a tiny hole at the bottom of the chamber which allows the finishing line (Fig.
3.4.4.5) to pass through. A weight (one pound) was connected to the cable using the
fishing line, and the cable vibration was excited by cutting off the fishing line using a
scissor and releasing the weight. The test results were compared to the modal damping
ratios of cables tested in air to analyze what is the effect of air pressure on damping.

87
Figure 3.4.4.1 Pressure gauge
Figure 3.4.4.2 Air pumper
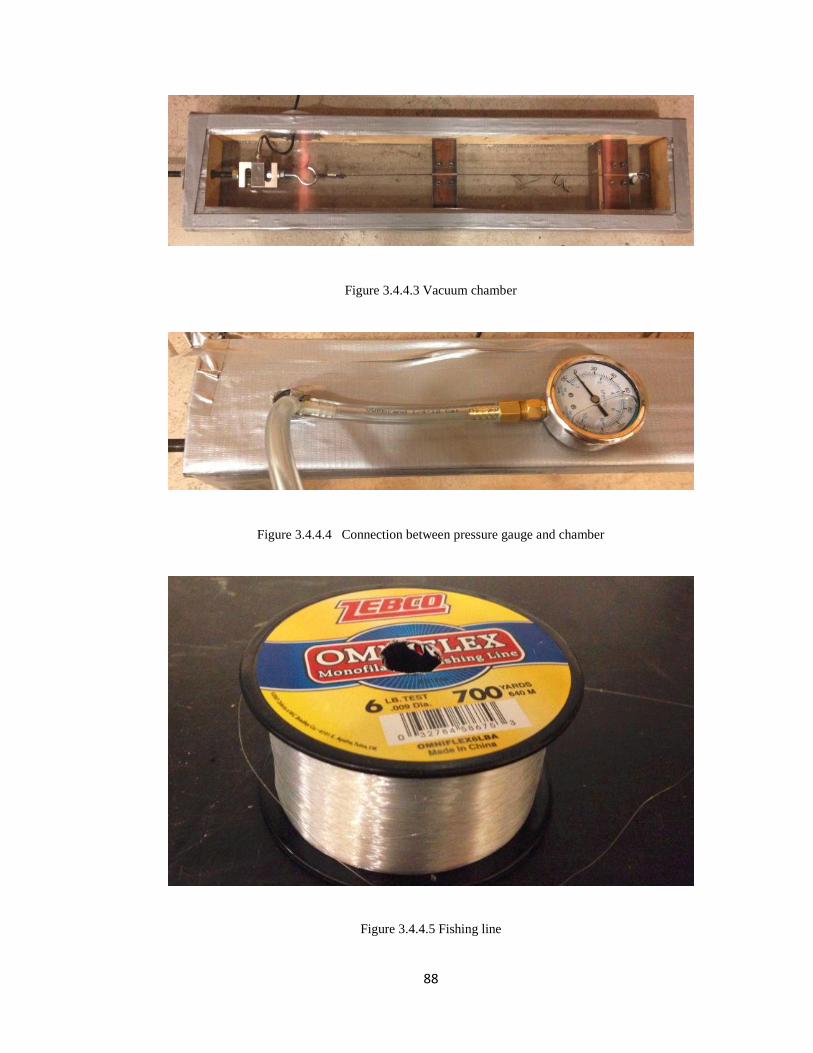
88
Figure 3.4.4.3 Vacuum chamber
Figure 3.4.4.4 Connection between pressure gauge and chamber
Figure 3.4.4.5 Fishing line

89
Figure 3.4.4.6 Foam tape
Table 3.4.4.1 lists the damping of a 0.3048m, 20.71turns/m carbon fiber cable tested in
the vacuum chamber. The variance of the results is 6.79×10⁻³
, which shows a good
repetition of the tests. The comparison of damping in air and in vacuum is shown in
Table 3.4.4.2, Table 3.4.4.3 and Table 3.4.4, for 0.2032m, 0.3048m and 0.5080m carbon
fiber cables, respectively.
Table 3.4.4.1 Damping in vacuum chamber (0.3048m, 20.71turns/m with 333.75N pretension)
Data No 1 2 3 4 5 6 7
Damping estimated with data recorded
by accelerometer at 3/4 of cable length
(%)
2.12 2.12 1.99 2.17 2.11 2.23 2.25
Damping estimated with data recorded
by accelerometer at 1/5 of cable length
(%)
2.10 2.09 1.96 2.1 2.18 2.22 2.20
Damping value of the tested cable 2.14
Variance 6.79×10⁻³

90
Table 3.4.4.2 Comparison of damping (0.2032m carbon fiber cables)
Tension
(N)
Damping for 20.71turns/m cables (%)
Damping for 41.42turns/m cables (%)
Damping for 62.13turns/m cables (%)
Normal Vacuum Decrement
rate (%) Normal Vacuum
Decrement rate (%)
Normal Vacuum Decrement
rate (%)
111.25 5.50 4.94 -10.24 4.59 4.14 -9.85 4.20 3.89 -7.43
222.50 3.79 3.62 -4.38 3.07 2.62 -14.56 2.40 1.90 -20.78
333.75 3.18 2.95 -7.23 2.53 2.06 -18.77 1.73 1.43 -17.51
445.00 3.06 2.73 -10.85 2.35 1.67 -29.02 1.23 1.25 1.46
578.50 2.60 2.48 -4.81 2.18 1.41 -35.46 1.18 1.11 -5.59
Table 3.4.4.3 Comparison of damping (0.3408m carbon fiber cables)
Tension
(N)
Damping for 20.71turns/m cables
(%) Damping for 41.42turns/m cables
(%) Damping for 62.13turns/m cables
(%)
Normal Vacuum Decrement
rate (%) Normal Vacuum
Decrement
rate (%) Normal Vacuum
Decrement
rate (%)
111.25 2.42 2.14 -11.40 2.27 2.03 -10.40 1.68 1.33 -20.71
222.50 2.11 1.94 -7.87 1.80 1.51 -16.06 1.24 1.08 -13.00
333.75 1.83 1.47 -19.51 1.68 1.32 -21.37 1.08 0.91 -15.56
445.00 1.45 1.16 -20.07 1.39 1.13 -18.88 0.97 0.72 -25.46
578.50 1.40 1.06 -24.43 1.36 0.99 -27.11 0.90 0.67 -25.14
Table 3.4.4.4 Comparison of damping (0.5080m carbon fiber cables)
Tension
(N)
Damping for 20.71turns/m cables
(%) Damping for 41.42turns/m cables
(%) Damping for 62.13turns/m cables
(%)
Normal Vacuum Decrement
rate (%) Normal Vacuum
Decrement
rate (%) Normal Vacuum
Decrement
rate (%)
111.25 2.22 1.87 -15.81 1.54 1.34 -12.79 1.14 0.88 -22.46
222.50 1.81 1.24 -31.77 1.11 0.92 -17.57 0.96 0.66 -31.35
333.75 1.38 0.85 -38.26 0.94 0.76 -19.26 0.54 0.51 -6.11
445.00 1.14 0.65 -42.87 0.69 0.60 -12.46 0.50 0.45 -9.20
578.50 1.00 0.62 -37.60 0.70 0.58 -17.29 0.36 0.33 -7.78

91
Fig. 3.4.4.7 to Fig. 3.4.4.9 showed the comparison of cable vibration damping tested in
the vacuum chamber and in air (normal) for 0.2032m, 0.3048m, 05080m carbon fiber
cables, respectively. It demonstrated that cable vibration damping decreased as air
pressure decreased. Typically, the decrement rate is about 20%, with the maximum of
75%. The damping has a greater decrement when tension is small. This is because the
void of the cable is larger when tension is smaller. In addition, the cables with small
number of turns/m have greater decrement in damping.

92
Figure 3.4.4.7 Comparison of damping for 0.2032m carbon fiber cables in air and in vacuum (a)
20.71turns/m (b) 41.42turns/m (c) 62.13turns/m cables
0.00
1.00
2.00
3.00
4.00
5.00
6.00
0 100 200 300 400 500 600
Dam
pin
g (%
)
Tension (N)
Normal
Vacuum
(a)
0.00
1.00
2.00
3.00
4.00
5.00
0 100 200 300 400 500 600
Dam
pin
g (%
)
Tension (N)
Normal
Vacuum
(b)
0.00
1.00
2.00
3.00
4.00
5.00
0 100 200 300 400 500 600
Dam
pin
g (%
)
Tension (N)
Normal
Vacuum
(c)

93
Figure 3.4.4.8 Comparison of damping for 0.3048m carbon fiber cables in air and in vacuum (a)
20.71turns/m (b) 41.42turns/m (c) 62.13turns/m cables
0.00
0.50
1.00
1.50
2.00
2.50
3.00
0 100 200 300 400 500 600
Dam
pin
g (%
)
Tension (N)
Normal
Vacuum
(a)
0.00
0.50
1.00
1.50
2.00
2.50
0 100 200 300 400 500 600
Dam
pin
g (%
)
Tension (N)
Normal
Vacuum
(b)
0.00
0.30
0.60
0.90
1.20
1.50
1.80
0 200 400 600
Dam
pin
g (%
)
Tension (N)
Normal
Vacuum
(c)

94
Figure 3.4.4.9 Comparison of damping for 0.5080m carbon fiber cables in air and in vacuum (a)
20.71turns/m (b) 41.42turns/m (c) 62.13turns/m cables
0.00
0.50
1.00
1.50
2.00
2.50
0 100 200 300 400 500 600
Dam
pin
g (%
)
Tension (N)
Normal
Vacuum
(a)
0.00
0.30
0.60
0.90
1.20
1.50
1.80
0 100 200 300 400 500 600
Dam
pin
g (%
)
Tension (N)
Normal
Vacuum
(b)
0.00
0.20
0.40
0.60
0.80
1.00
1.20
0 100 200 300 400 500 600
Dam
pin
g (%
)
Tension (N)
Normal
Vacuum
(c)

95
3.4.5 Effect of Support and Test Apparatus
Yamaguchi and Fujino (1988) investigated the effect of support flexibility on cable
damping by the free-oscillation of suspended cables under various support conditions.
The results showed that damping decreases as the support flexibility increases.
To investigate the effect of the test apparatus, including the support and the clamping
system on cable damping, the experimental setup (Fig. 3.2.1) was modified by bracing
the cable supports and the corners of the wooden frame, as shown in Fig. 3.4.5.1 and Fig.
3.4.5.2, respectively.
Figure 3.4.5.1 Details of the stiffened support

96
Figure 3.4.5.2 Details of the stiffened frame corners
A 0.3048m carbon fiber was tested with the new experimental set-up, and the damping
was compared to the damping tested using the old experimental set-up (before stiffening).
The results were compared in Fig. 3.4.5.3, which indicated that the effect of the test
apparatus and fixtures is minimal, and the difference is within 1.5% percent.
Table 3.4.5.1 Vibration damping comparison
Tension
(N)
Damping for 41.42 turns/m cables
(%)
Previous test After stiffening Before stiffening
111.25 2.27 2.23 2.30
222.50 1.80 1.74 1.77
333.75 1.68 1.62 1.64
445.00 1.39 1.45 1.42
578.50 1.36 1.34 1.38

97
Table 3.4.5.2 Vibration frequency comparison
Tension
(N)
Frequency for 41.42 turns/m cables
(Hz)
Previous test After stiffening Before stiffening
111.25 280.96 279.30 272.99
222.50 369.40 364.72 360.37
333.75 430.00 415.42 426.55
445.00 500.49 489.86 484.61
578.50 534.65 543.76 545.42
Figure 3.4.5.3 Comparison of damping for cable tested with stiffened and unstiffened setup
0.00
0.50
1.00
1.50
2.00
2.50
0 100 200 300 400 500 600
Dam
pin
g (%
)
Tension (N)
unstiffened
stiffened
previous test
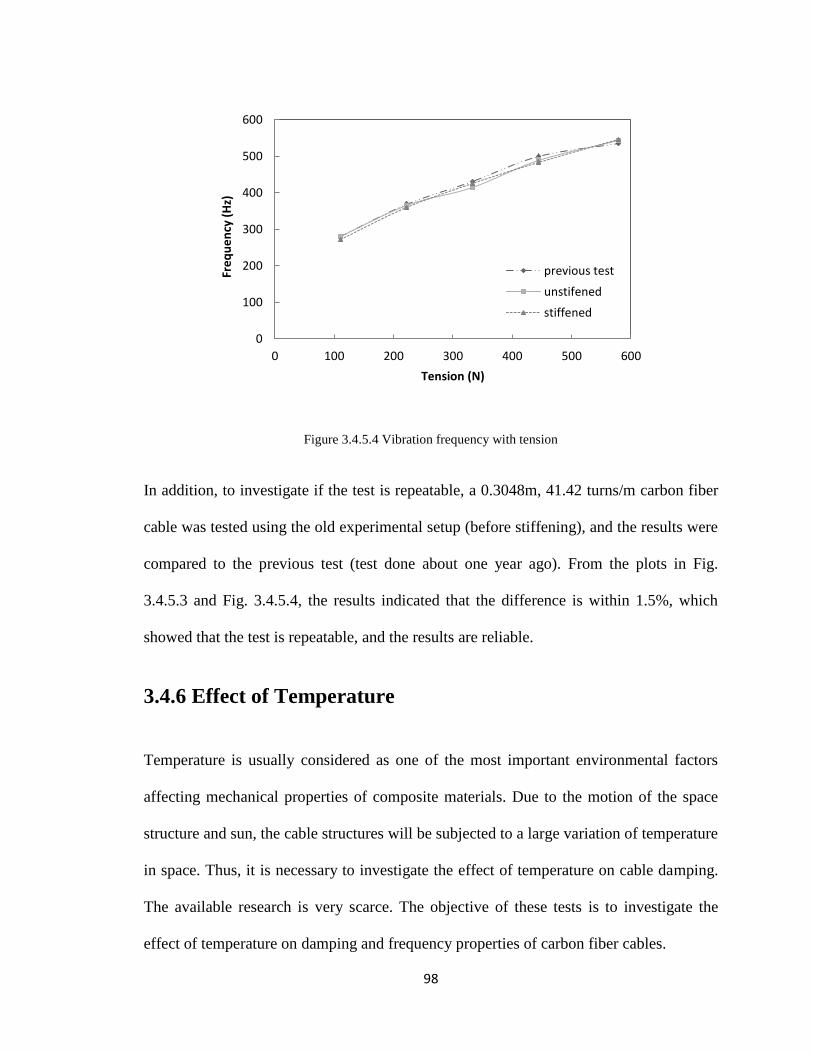
98
Figure 3.4.5.4 Vibration frequency with tension
In addition, to investigate if the test is repeatable, a 0.3048m, 41.42 turns/m carbon fiber
cable was tested using the old experimental setup (before stiffening), and the results were
compared to the previous test (test done about one year ago). From the plots in Fig.
3.4.5.3 and Fig. 3.4.5.4, the results indicated that the difference is within 1.5%, which
showed that the test is repeatable, and the results are reliable.
3.4.6 Effect of Temperature
Temperature is usually considered as one of the most important environmental factors
affecting mechanical properties of composite materials. Due to the motion of the space
structure and sun, the cable structures will be subjected to a large variation of temperature
in space. Thus, it is necessary to investigate the effect of temperature on cable damping.
The available research is very scarce. The objective of these tests is to investigate the
effect of temperature on damping and frequency properties of carbon fiber cables.
0
100
200
300
400
500
600
0 100 200 300 400 500 600
Fre
qu
en
cy (
Hz)
Tension (N)
previous test
unstifened
stiffened

99
For our experiments carbon fiber cables of different length and different configuration
were tested at room temperature (20 ) and in a freezer room at the University of New
Mexico. The temperature of the freezer room was kept at 4 . The control system for the
room temperature is shown in Fig. 3.4.6.1.
Figure 3.4.6.1 Control system of the freezer room
Table 3.4.6.1, Table 3.4.6.2 and Table 3.4.6.3 list the cable modal damping ratios at room
temperature and at a temperature of 4°C. Corresponding plots are shown in Fig. 3.4.6.2 to
Fig. 3.4.6.3. It is observed that cable damping increases as the ambient temperature
decreases, and the increment is more significant for a longer cable. Typically, for the
0.2032m long carbon fiber cables tested at 4 , the damping increment is about 1-10%
(maximum, 20.16%); and for cables in the length of 0.3048m, the damping increment is
about 10%-15% (maximum, 45.87); while the cable in length of 0.5080m, the damping

100
increment is about 30-70% ( maximum 124%). This increment could be due to the
increase of moisture of the cable.
Table 3.4.6.1 Comparison of damping for 0.2032m cables at different temperatures
Tension
(N)
Damping for 20.71turns/m cables
(%) Damping for 41.42turns/m cables
(%) Damping for 62.13turns/m cables
(%)
20 oC 4
oC 20
oC 4
oC 20
oC 4
oC
111.25 5.50 5.95 4.57 4.92 4.20 4.37
222.50 3.79 4.25 3.07 3.69 2.40 2.46
333.75 3.18 3.57 2.53 2.74 1.63 1.72
445.00 3.06 3.12 2.35 2.36 1.36 1.43
578.50 2.60 2.71 1.94 1.95 1.18 1.30
Table.3.4.6.2 Comparison of damping for 0.3408m cables at different temperatures
Tension
(N)
Damping for 20.71turns/m cables
(%) Damping for 41.42turns/m cables
(%) Damping for 62.13turns/m cables
(%)
20 oC 4
oC 20
oC 4
oC 20
oC 4
oC
111.25 2.42 3.53 2.22 2.58 1.68 1.88
222.50 2.11 2.70 1.83 2.25 1.34 1.55
333.75 1.72 1.98 1.64 1.89 1.08 1.23
445.00 1.45 1.63 1.39 1.63 0.97 1.09
578.50 1.40 1.55 1.36 1.46 0.90 1.03
Table.3.4.6.3 Comparison of damping for 0.5080m cables at different temperatures
Tension
(N)
Damping for 20.71turns/m cables
(%) Damping for 41.42turns/m cables
(%) Damping for 62.13turns/m cables
(%)
20 oC 4
oC 20
oC 4
oC 20
oC 4
oC
111.25 2.22 2.58 1.54 2.35 1.14 1.58
222.50 1.81 2.26 1.11 1.89 0.96 1.32
333.75 1.38 1.92 0.94 1.65 0.55 1.13
445.00 1.14 1.51 0.68 1.38 0.50 0.85
578.50 1.00 1.15 0.70 1.07 0.36 0.81

101
Figure 3.4.6.2 Comparison of damping for 0.2032m cables at different temperature (a) 20.71turns/m (b)
41.42turns/m (c) 62.13turns/m cables
0.00
1.00
2.00
3.00
4.00
5.00
6.00
7.00
0 100 200 300 400 500 600
Dam
pin
g (%
)
Tension (N)
20 degree
4 degree
(a)
0.00
1.00
2.00
3.00
4.00
5.00
6.00
0 100 200 300 400 500 600
Dam
pin
g (%
)
Tension (N)
20 degree
4 degree
(b)
0.00
1.00
2.00
3.00
4.00
5.00
0 100 200 300 400 500 600
Dam
pin
g (%
)
Tension (N)
20 degree
4 degree
(c)

102
Figure 3.4.6.3 Comparison of damping for 0.3048m cables at different temperature (a) 20.71turns/m (b)
41.42turns/m (c) 62.13turns/m cables
0.00
1.00
2.00
3.00
4.00
0 100 200 300 400 500 600
Dam
pin
g (%
)
Tension (N)
20 degree
4 degree
(a)
0.00
0.50
1.00
1.50
2.00
2.50
3.00
0 100 200 300 400 500 600
Dam
pin
g (%
)
Tension (N)
20 degree
4 degree
(b)
0.00
0.50
1.00
1.50
2.00
0 100 200 300 400 500 600
Dam
pin
g (%
)
Tension (N)
20 degree
4 degree
(c)

103
Figure 3.4.6.4 Comparison of damping for 0.5080 cables at different temperature (a) 20.71turns/m (b)
41.42turns/m (c) 62.13turns/m cables
0.00
0.50
1.00
1.50
2.00
2.50
3.00
0 100 200 300 400 500 600
Dam
pin
g (%
)
Tension (N)
20 degree
4 degree
(a)
0.00
0.50
1.00
1.50
2.00
2.50
0 100 200 300 400 500 600
Dam
pin
g (%
)
Tension (N)
20 degree
4 degree
(b)
0.00
0.20
0.40
0.60
0.80
1.00
1.20
1.40
1.60
1.80
0 100 200 300 400 500 600
Dam
pin
g (%
)
Tension (N)
20 degree
4 degree
(c)

104
3.4.7 Effect of Sensor Mass
The effect of sensor mass on cable damping was studied by testing cables of length
0.3048m in two different configurations, with or without the second accelerometer at 1/5
length.
The comparison of damping for cables tested in the two different configurations is
presented in Table 3.4.7.1, and the comparison of vibration frequency is presented in
Table 3.4.7.2. Fig. 3.4.7.1 shows that without the additional mass of the second
accelerometer, the damping values are slightly lower; While there is a small increase in
damping value when the second accelerometer is present, this difference (typically 1-4%
range, with a maximum of 10%) is very small compared to the large (factor of 2-4)
differences due to variation of tension, cable length, and # of turns shown in the previous
sections, which is the focus of this work. The small increment of damping due to the
additional mass could be explained as: the additional mass displays movements which are
contrary to those of the cable, and the contrary movement causes inertial forces that
compensate the cable movements by depriving the vibration energy from the system, and
lead to the increment of damping.
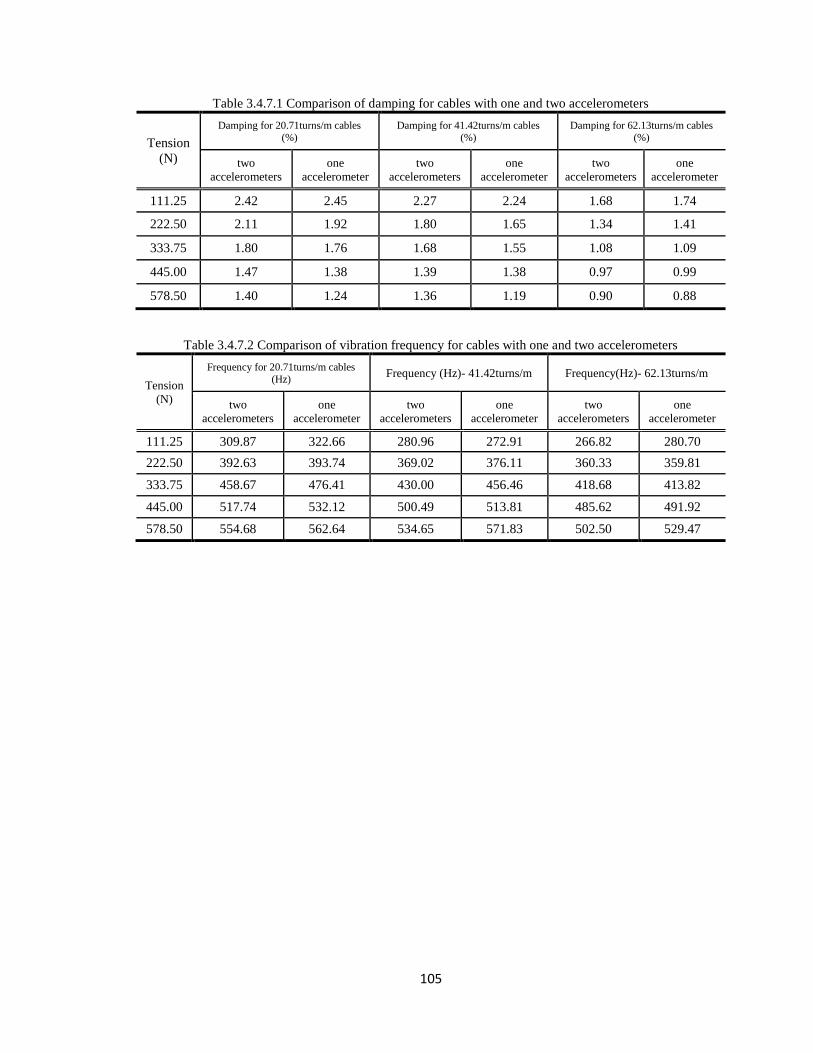
105
Table 3.4.7.1 Comparison of damping for cables with one and two accelerometers
Tension
(N)
Damping for 20.71turns/m cables (%)
Damping for 41.42turns/m cables (%)
Damping for 62.13turns/m cables (%)
two
accelerometers
one
accelerometer
two
accelerometers
one
accelerometer
two
accelerometers
one
accelerometer
111.25 2.42 2.45 2.27 2.24 1.68 1.74
222.50 2.11 1.92 1.80 1.65 1.34 1.41
333.75 1.80 1.76 1.68 1.55 1.08 1.09
445.00 1.47 1.38 1.39 1.38 0.97 0.99
578.50 1.40 1.24 1.36 1.19 0.90 0.88
Table 3.4.7.2 Comparison of vibration frequency for cables with one and two accelerometers
Tension
(N)
Frequency for 20.71turns/m cables (Hz)
Frequency (Hz)- 41.42turns/m Frequency(Hz)- 62.13turns/m
two
accelerometers
one
accelerometer
two
accelerometers
one
accelerometer
two
accelerometers
one
accelerometer
111.25 309.87 322.66 280.96 272.91 266.82 280.70
222.50 392.63 393.74 369.02 376.11 360.33 359.81
333.75 458.67 476.41 430.00 456.46 418.68 413.82
445.00 517.74 532.12 500.49 513.81 485.62 491.92
578.50 554.68 562.64 534.65 571.83 502.50 529.47

106
Figure 3.4.7.1 Comparison of damping for 0.3048m cables with one accelerometer and two accelerometers
(a) 20.71 turns/m (b) 41.42 turns/m (c) 62.13 turns/m cables
0.00
0.50
1.00
1.50
2.00
2.50
3.00
0 100 200 300 400 500 600
Dam
pin
g (%
)
Tension (N)
with two accelerometers
with one accelerometer
(a)
0.00
0.50
1.00
1.50
2.00
2.50
0 100 200 300 400 500 600
Dam
pin
g (%
)
Tension (N)
with two accelerometers
with one accelerometer
(b)
0.00
0.20
0.40
0.60
0.80
1.00
1.20
1.40
1.60
1.80
2.00
0 100 200 300 400 500 600
Dam
pin
g (%
)
Tension (N)
with two accelerometers
with one accelerometer
(c)

107
Figure 3.4.7.2 Comparison of vibration frequency for 0.3048m cables with one accelerometer and two
accelerometers (a) 20.71 turns/m (b) 41.42 turns/m (c) 62.13 turns/m cables
0
100
200
300
400
500
600
0 100 200 300 400 500 600
Fre
qu
en
cy (
Hz)
Tenison (N)
with two accelerometers
with one accelerometer
(a)
0
100
200
300
400
500
600
700
0 100 200 300 400 500 600
Fre
qu
en
cy (
Hz)
Tension (N)
with two accelerometers
with one accelerometer
(b)
0
100
200
300
400
500
600
0 100 200 300 400 500 600
Fre
qu
en
cy (
Hz)
Tension (N)
with two accelerometers
with one accelerometer
(c)

108
In addition, damping for 0.3048m, 41.42 turns/m carbon fiber cables tested at room
temperature (test 1), at temperature of 4 (test 2), in vacuum (test 3), with stiffened
experimental apparatus (test 4), with one accelerometer (test 5) was compared in Fig.
3.4.7.3. Typically, it shows that the order of decreasing effect on cable damping is: the
vacuum condition, the temperature, the additional sensor mass, and the stiffness of the
experimental setup.
Table 3.4.7.3 Damping of a 41.42 turns/m, 0.3048m carbon fiber cable tested under different conditions
Tension
(N) Test 1 Test 2 Test 3 Test 4 Test 5
(2-1)/1
(%)
(3-1)/1
(%) (4-1)/1
(5-1)/1
(%)
111.25 2.27 2.58 2.03 2.30 2.24 13.66 -10.57 1.32 -1.32
222.50 1.80 2.25 1.51 1.77 1.65 25.00 -16.11 -1.67 -8.33
333.75 1.68 1.89 1.32 1.64 1.55 12.50 -21.43 -2.38 -7.74
445.00 1.39 1.60 1.13 1.42 1.38 15.11 -18.71 2.16 -0.72
578.50 1.36 1.46 0.99 1.38 1.19 7.35 -27.21 1.47 -12.50
Figure 3.4.7.3 Damping for a 41.42 turns/m, 0.3048m carbon fiber cable under different conditions
0.00
0.50
1.00
1.50
2.00
2.50
3.00
0 100 200 300 400 500 600
Dam
pin
g (%
)
Tension (N)
Test 1
Test 2
Test 3
Test 4
Test 5

109
3.5 Conclusions
In this chapter, an experimental setup was provided to measure the cable vibration
damping. Cables in different length, different configuration, ambient temperature (20
and 4 ) and air pressure (normal and vacuum) were tested under five different cable
tensile forces. The effects of different factors on damping were analyzed and discussed,
and the following conclusions have been reached:
a) For carbon fiber and stainless steel cables tested under different tension forces
(111.25N, 222.50N, 333.75N, 445.00N and 578.50N), damping decreases as
tension increases within the tension force considered in this research. The same
conclusion was obtained by Seppa (1971), Ramberg and Griffin (1977), Raoof
(1993b), Xu et al., (1998, 1999), Kim and Jeong (2005), Zheng et al., (2003), and
Barbieri et al., (2004a, 2004b) et al.; the decrease in damping is caused by the
increased cable interwire contact force, which made the occurrence of interwire
slippage getting harder, and causes lower energy dissipation. For carbon fiber
cables in the length of 0.2032m, damping has a significant decrement as tension
increases when tension is less than a certain value (say 222.50N). But this
significant variation is not noticed for the 0.3048m and 0.5080m carbon fiber cables,
which indicates that this is attributable to the end effect for short cables;
b) Cables in three different lengths (0.2032m, 0.3048m and 0.5080m) were tested,
typically, damping decreases as length increases. A significant decrement in
damping was observed initially as length increases when length is less than about
110
0.3m, subsequently the decrement is slow or the damping has a tendency to be
unaffected by length;
c) Carbon fiber cables in three different configurations (20.71turns/m, 41.42turns/m
and 61.23turns/m) were tested, as the number of turns/m increases, damping
decreases, in other words, as lay angle of the cable increases, damping decreases.
The conclusion is the same as that of steel cables tested by Hobbs and Raoof (1984),
Labrosse and Conway (1999), Raoof and Davies (2006) et al., and this could be
because as the number of twist increases, the cable becomes tighter, and reducing
the movement and friction internal to the cable;
d) The carbon fiber cables tested in vacuum presented a typically 20% lower damping
than the cables tested in air. For cables in the length of 0.2032m, a significant
decrement of cable damping was noticed when the applied tension is less than a
certain value (say 222.5N). Typically, greater decrement for cables with small
tension and small number of turns/m was noticed;
e) The stiffness of the test apparatus and the supports were adequate and did not
significant influence the test results;
f) A lower ambient temperature gives a higher cable damping, and the variation is
more for a longer cable;
g) The additional sensor mass increases cable damping, but the effect is minimal,
comparing with the effects of tension, configuration and temperature on damping.
h) Rayleigh damping factor initially increases as tension increases, and then
decreases, and damping factor decreases as tension increases.

111
Chapter 4
Finite Element Simulation of Cable
Vibration
In this chapter, first, previous research on cable analysis using the Finite Element Method
(FEM) is reviewed. Then, vibration frequency and the time history response of carbon
fiber cable are obtained using the FEM-based modal analysis and transient analysis in
ANSYS13.0 using COMBIN14 and MSASS21 elements. The FEM analysis results are
then compared with the theoretical and experimental ones.
4.1 Review of Literature in FEM Analysis of Cables
Carlson and Kasper (1973) built a simplified model for armored cables using the finite
element method. Then, Cutchins et al. (1987) studied a cable damping isolator using the
finite element method. Yamaguchi (1992) analyzed a cable–tie system using the finite
element method. Chiang (1996) modeled a small length of single strand cable for
geometric optimization purposes, however, a large number of elements were required for
an accurate modeling, and the computational cost is too expensive. To decrease the
computational cost, Jiang et al., (1999) provided a concise finite element model by
considering the structural and loading symmetries. In this analysis, the contacts between
the core and helical wires were simulated using surface contact elements. However, while
the usage of the surface-to-surface contact can provide more accurate results, it is time
consuming. Armin and Habib (1998) applied the finite difference method to consider the

112
effect of cable tension, bending stiffness and end conditions on cable vibration. Nawrocki
and Labrosse (2000) established a finite element model of a simple straight wire rope
strand to study the interwire motions. All the possible cases of interwire contacts were
studied, and the results showed that rolling and sliding have no effect on the overall
behavior of cables in axial loading, and the cable response was governed by the interwire
pivoting. Wu et al., (2006) using cable finite elements and the Rayleigh element damping
studied the parametric vibration of stay cables of cable-stayed bridges. Casciati and
Ubertini (2007) established a nonlinear finite element model to simulate the vibration of
shallow cables and demonstrated the capability to enforce semi-active control using
tuned-mass dampers. Ghoreishi et al., (2007) determined the validity domain of analytical
models of synthetic wire rope and steel strand using 3D finite element model. Sometimes,
the accurate mechanical cable damping models which considered the flexural hysteresis
between cable strands are not useful towards large-scale engineering applications because
of the complex mathematical solution. Moreover, it is difficult to implement the
theoretical model in the finite element simulation. To address these difficulties, Zhu and
Meguid (2006) developed a framework and numerical tool using the curved beam
element to predict the dynamic response of low tension cable systems. The term ‘low
tension cable’ refers to a class of cable systems where the cable is subjected to small
and/or dynamically fluctuating tension which may vanish anywhere along the cable. Zhu
and Meguid (2007) modeled slack wire cables using curved beam element with large
displacement and rotation, and simulated the damping as homogenized Rayleigh damping
in the nonlinear finite element simulation. The finite element prediction of the cable
motion agrees well with their experimental measurement.

113
In summary, though different finite element models have been established to investigate
cable behavior, most of the available cable analysis using FEM focuses on the static
behavior of steel cable, the investigation of cable dynamic behaviors and cable damping
using FEM is very scarce. It is the objective of this work to provide a simple but effective
method to simulate the cable vibration and damping, and to compare the results against
our experiments.
4.2 Finite Element Analysis of Cable Vibration
In this dissertation, the modal analysis was implemented to compute the vibration
frequency and the transient analysis was used to determine the time history responses of
the carbon fiber cable.
In the modal analysis and the transient analysis, a simple straight carbon fiber cable was
modeled using the COMBIN14 and the MASS21 elements, as shown in Fig. 4.2.1 and
Fig. 4.2.2, respectively. The COMBIN14 element was chosen as a longitudinal spring
damper, which is a uniaxial tension-compression element with up to three degrees of
freedom at each node: translations in the nodal x, y, and z directions. No bending or
torsion is considered. Because the spring damper element has no mass, additional mass
elements are needed. The mass was added by using the MASS21 elements, which are
point elements having up to six degrees of freedom: translations in the nodal x, y, and z
directions and rotations about the nodal x, y and z axes.

114
Figure 4.2.1 COMBIN14 Spring-Damper (ANSYS help)
Figure 4.2.2 MASS21 Structural Mass (ANSYS help)
4.2.1 Modal Analysis
Modal analysis of cables was conducted to determine the natural vibration frequency.
20.71 turns/m carbon fiber cables in different length (0.2032m, 0.3048m, and 0.5080m)

115
were analyzed under different tensile force (111.25N, 222.50N, 333.75N, 445.00N and
578.50N), and the results were compared with the theoretical results and the experimental
results.
The loads in the FEM analysis were defined and applied in the same order as in the
experiments. First, the left end of the cable was constrained in all translation and rotation,
and then a tension was applied at the left end of the cable. After applying tensile force,
the right end of the cable was fixed. A 0.3048m carbon fiber cable was meshed with 60
COMBIN14 elements and 59 MASS21 elements. Fig. 4.2.3 gives a finite element
representation of the cable.
Figure 4.2.3 Finite element representation of a carbon fiber cable
Table 4.2.1.1, Table 4.2.1.2 and Table 4.2.1.3 list the vibration frequencies from the finite
element analysis, the theoretical analysis for a taut string and the tests for 0.2032m,
0.3048m and 0.580m carbon fiber cables, respectively. In the previous study (Irvine,
1981, Kashani, 1989), the first circular natural frequency of a taut string is given by Eq.
(4-1):
1H
l m
(4-1)

116
Where: l is the length of the cable, H is the tension, and m is the mass per unit length of
the cable.
Table 4.2.1.1 Vibration frequency from different methods (0.2032m, 20.71 turns/m carbon fiber cable)
Tension
(N)
Theoretical results
(Hz)
Experimental results
(Hz)
FEM Analysis results
(Hz)
111.25 375.78 365.71 396.24
225.00 534.41 517.79 560.37
333.75 650.88 625.85 686.31
445.00 751.57 694.65 792.48
578.50 856.92 797.60 903.57
Table 4.2.1.2 Vibration frequency from different methods (0.3048m, 20.71 turns/m carbon fiber cable)
Tension
(N)
Theoretical results
(Hz)
Experimental results
(Hz)
FEM Analysis results
(Hz)
111.25 264.78 309.87 275.00
225.00 374.46 392.63 375.00
333.75 458.62 458.67 460.20
445.00 529.57 517.74 525.00
578.50 603.80 554.68 600.00
Table 4.2.1.3 Vibration frequency from different methods (0.5080m 20.71 turns/m carbon fiber cable)
Tension
(N)
Theoretical results
(Hz)
Experimental results
(Hz)
FEM Analysis results
(Hz)
111.25 158.86 159.62 158.50
225.00 224.67 225.82 224.15
333.75 275.17 263.45 274.52
445.00 317.74 308.86 316.99
578.50 362.27 355.53 361.43
Fig. 4.2.1.1 to Fig. 4.2.1.3 present the cable vibration frequency versus tension, the
results show that the vibration frequency increases as tension increases, and the finite
element solution closely matches the theoretical results, and the vibration frequency
obtained from FEM analysis is about 2-4% higher than the test results. This difference

117
could come from the mass per unit length used in the FEM analysis is smaller than the
exact mass per unit length. The results demonstrated that the modeling of cable with the
COMBIN14 and MASS21 elements is applicable to obtain a good prediction of the
cable’s natural vibration frequency. For the cables with other configurations, this model
can be easily modified by replacing the appropriate parameters (density, cross-sectional
area etc.) of the model.
Figure 4.2.1.1 Vibration frequency from different methods (0.3048m, 20.71 turns/m carbon fiber cable)
Figure 4.2.1.2 Vibration frequency from different methods (0.5080m, 20.71 turns/m carbon fiber cable)
0
100
200
300
400
500
600
700
0 100 200 300 400 500 600
Fre
qu
en
cy (
Hz)
Tension (N)
Theoretical
Experimental
FEM
0
50
100
150
200
250
300
350
400
0 100 200 300 400 500 600
Fre
qu
en
cy (
Hz)
Tension (N)
Theoretical
Experimental
FEM
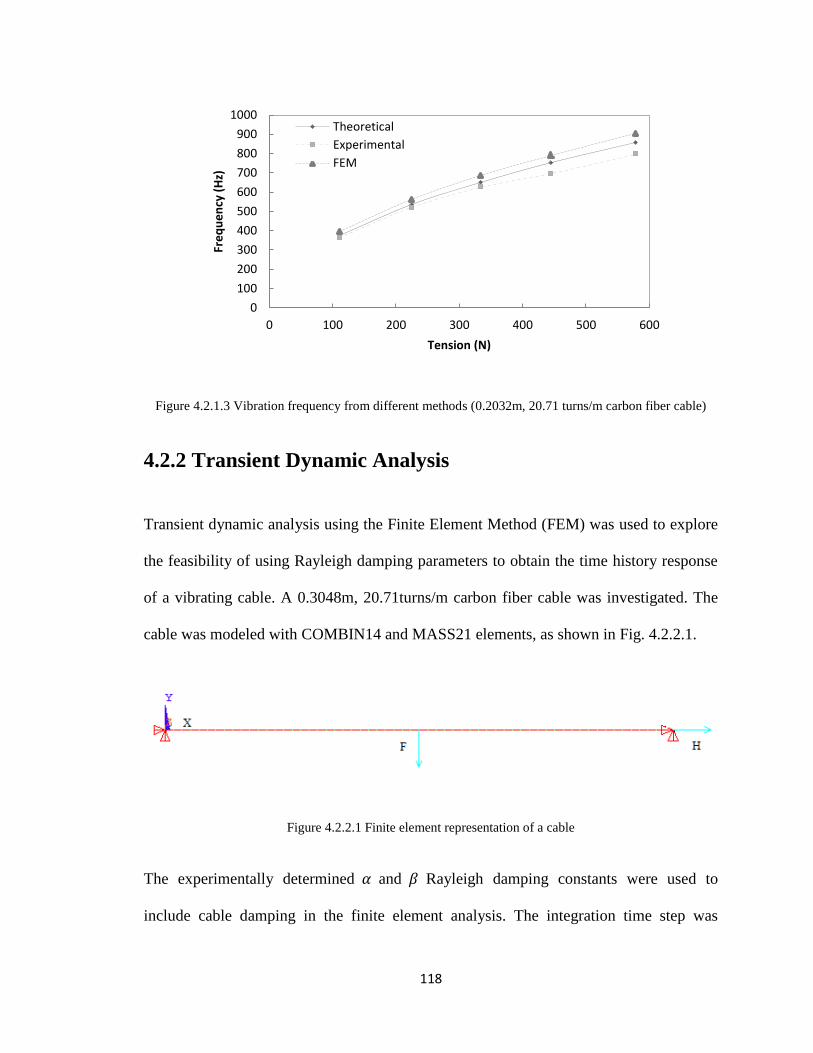
118
Figure 4.2.1.3 Vibration frequency from different methods (0.2032m, 20.71 turns/m carbon fiber cable)
4.2.2 Transient Dynamic Analysis
Transient dynamic analysis using the Finite Element Method (FEM) was used to explore
the feasibility of using Rayleigh damping parameters to obtain the time history response
of a vibrating cable. A 0.3048m, 20.71turns/m carbon fiber cable was investigated. The
cable was modeled with COMBIN14 and MASS21 elements, as shown in Fig. 4.2.2.1.
Figure 4.2.2.1 Finite element representation of a cable
The experimentally determined and Rayleigh damping constants were used to
include cable damping in the finite element analysis. The integration time step was
0
100
200
300
400
500
600
700
800
900
1000
0 100 200 300 400 500 600
Fre
qu
en
cy (
Hz)
Tension (N)
Theoretical
Experimental
FEM

119
carefully selected on the basis of ≈1/20 of the period to allow the initial step acceleration
change to be followed reasonably well and to enhance the accuracy of analysis. The
experimentally determined damping constants for this cable are α=5.377 and β=0.000012,
as listed in Table 3.4.1.8. The loads in the finite element model were applied in the same
order as the experiments. The cable was first fixed at the left end, and then a pretension
force H was applied to the right end of the cable. After applying the pretension force H,
the right end of the cable was fixed. Then an impulse load F was applied at the center of
the cable for the transient analysis.
The FEM simulated time history response and the experimental recorded time history
response of the nodes at one fifth and three quarters of the cable length are shown in Fig.
4.2.2.2 and Fig. 4.2.3, respectively, for the 0.3048m, 20.71 turns/m carbon fiber cable
tested with 333.75N pretension. Comparing the time history responses from different
methods, it can be seen that the finite element simulation and the experimental
measurements are in good agreement (has close amplitude peak and elapsed in about 35
cycles). This demonstrates that the carbon fiber cable vibration damping can be modeled
effectively with the selected elements and the Rayleigh damping.

120
Figure 4.2.2.2 Comparison of time history response (a) FEM result of node at 1/5 of cable length (b)
experimental result of node at 1/5 of cable length
-1500
-1000
-500
0
500
1000
1500
0.60 0.62 0.64 0.66 0.68 0.70
Acc
ele
rati
on
(m
/s2)
Time (s) (b)
(a)

121
Figure 4.2.2.3 Comparison of time history response (a) FEM result of node at 3/4 of cable length (b)
experimental result of node at 3/4 of cable length
-1500
-1000
-500
0
500
1000
1500
0.60 0.62 0.64 0.66 0.68 0.70
Acc
ele
rati
on
(m
/S2 )
Time (s) (a)
(b)

122
4. 3 Conclusions
A simple finite element modeling of straight carbon fiber cable using the COMBIN14
and MASS21 elements is discussed. Modal analysis and transient dynamic analysis of
carbon fiber cables show that the finite element simulation of cable vibration using the
COMBIN14 and MASS21 elements provides good estimation of natural frequency and
time history response, respectively. In addition, the Rayleigh damping is adequate for
modeling carbon fiber cable damping.
Though, the simple finite model presented can simulate the time history responses of the
carbon fiber cable adequately, the cable interwire behaviors cannot be taken into account.
Therefore, further work on the modeling of cable by considering the cable’s actual
geometry and cable interwire behaviors is needed to give a more accurate estimation of
cable vibration frequency and time history response. In addition, the effects of
temperature and air pressure on damping needed to be considered in the FEM simulation.
123
Chapter 5
Analytical Model of Cable Vibration
Damping
In this chapter, an analytical model of cable vibration damping is presented. The model is
developed using simplified but physical realistic assumptions on material constitutive
properties and geometric compatibility conditions. The proposed method and several
related issues are discussed and compared with experimental data.
5.1 Introduction
Cables are commonly used as tension members in many engineering structures, such as
the cable-stayed bridge, large span roofs, mooring systems, deployable space structures,
etc. Existing analytical models appear to have concentrated on steel cables and much less
attention has been paid to carbon fiber cables and their effects on the dynamic behavior
of space structures. Recently, researchers attempted to include interwire friction and
contact forces to their theoretical models. Some encouraging progress has been made by
Claren and Diana (1996a, 1969b), who analyzed the internal damping of axially loaded
stranded cables by introducing the slippage coefficient. However, no further work to
formulate the cable internal damping and slippage coefficient was provided. Hobbs and
Roof (1984) addressed the problem of energy dissipation in multilayered spiral strands,
but simplified their model based on homogenization of the cable layers into orthotropic
cylindrical sheets. The integration of friction forces and contact forces into the cable

124
damping mechanics remains a challenge. To simplify the problem, usually only one type
of cable contact, cable core-wire contact or wire-wire contact, is considered, and
interwire friction is neglected or assumed to be a constant. Sathikh (1989a, 1989b, 1989c),
Labrosse and Conway (2000a, 2000b), Leech (1987, 2002) studied the interwire friction
effects on seven-wire cables considering only the wire-core contact of the cable; Machida
and Durelli (1973), Chi (1974a, 1974b), Knapp (1979), Kumar and Cochran (1987)
investigated cable damping but neglected the effect of interwire friction. Huang and
Vinogradov (1992) analyzed the dynamic behavior of a structural cable under cyclic
tension using the ‘thin rod model’ and assuming constant friction. As a result, the
friction-free models and constant friction models of cables are not appropriate to simulate
the damping properties of cables. Moreover, if the strand does not have core or if the core
radius were too small, the helical wires are in contact with each other along helical lines.
Therefore, the wire-core contact or wire-wire contact model cannot correctly predict
carbon fiber cable vibration damping.
The present work aims at removing some of these assumptions and establishing a model
by including the cable interwire contact and interwire friction to predict the damping
properties of carbon fiber cables. The section is organized as follows:
Step 1: Parameters related to the geometry of the cable and relevant assumptions are
introduced.
Step 2: The relevant simplifying assumptions are identified.

125
Step 3: The axial strain of the helical wires due to cable elongation and rotation are
derived.
Step 4: The consequent contact normal forces and the cable interwire frictional forces are
thereafter included in the analytical model.
Step 5: Using the energy dissipation principle, the formula for cable internal vibration
damping is derived for the axially loaded carbon fiber cable.
5. 2 Description of Cable Geometry
The carbon fiber cables are assemblies of millions of IM7 fibers and are fabricated by
twisting. For simplification, let us consider a 1+6 cable structure, as shown in Fig. 5.2.1,
in which the cable has 1 central straight fiber core and 6 helical wires. It should be noted
that this geometry usually represents the metallic cables, and the tested carbon fiber
cables can be approximately represented by this geometry. The geometry of each helical
wire is characterized by the pitch length, P, which is the reciprocal of twist per unit
length, and the lay angle, , measured with respect to the axis of the cable (Z axis). The
helical wire centerline is then a helical curve of radius of . Let be the radius of the
helical wires, and the radius of the cable fiber core, then we have:
(5-1)
The pitch length of the cable was determined by (Costello, 1997) as:
(5-2)
Where:

126
= initial radius of helical wires centerline
= radius of cable core
= radius of helical wires
P = pitch length of helical wires
= initial lay angle of helical wires
Figure 5.2.1 Cable geometry
5. 3 Relevant Assumptions
The following assumptions were made:
a) Displacements and strains are assumed to be small;
b) The cable wires have a coupling behavior between extension and twisting, and the
helix angle variation is considered;

127
c) Although the carbon fiber cable was made with non-circular IM7 tows, the cable core
is assumed to have a circular cross-section, and the helical wires are assumed to have
elliptical cross-section due to the process of manufacture of the cables;
d) The cable is considered to be comprising of a core and six helical wires. Both core
helical wire interaction and interaction among helical wires are considered in the
analysis;
e) Effect of Poisson’s ratio and the contact deformation are considered.
5. 4 Axial Strain of Helical wires
In axial loading, with traction and torsion, the axial strain of each cable wire is assumed
to have two parts: the first part results from the elongation of the structure, whereas the
second part is due to its rotation. For small deformation, the strain of the cable wires can
be expressed as:
(5-3)
Where:
= total strain of the helical wires along the tangent direction, t designates the
tangent direction of the helical wires
= the tangential strain of the helical wires due to elongation
= the tangential strain of the helical wires due to rotation

128
5.4.1 Axial Strain due to Elongation
Let be the extension ratio of the deformed structure length to the initial structure length
measured along the cable’s axis (z-axis), and be the corresponding extension ratio for a
helical wire whose initial and final radii are and , respectively, as shown in Fig.
5.4.1.1, we have:
(5-4)
(5-5)
Where:
= initial length of the cable structure
= length of the deformed cable structure
= initial length of the helical wires
= length of the deformed helical wires
, = the initial and final angle that a helical wire sweeps out in a plane
perpendicular to the axis of the cable.

129
Figure 5.4.1.1 Developed view of helical wire centerline
As the helical wires are extended, the cable strands undergo a compaction of volume. The
ratio of the deformed and un-deformed volume of the cable is defined as the compaction
factor (CF), we have:
(5-6)
Where:
V, = the volume of the un-deformed and deformed cable
CF= compaction factor of the cable
= radius of the un-deformed and deformed helical wires
From Eq. (5-2), we have:
(5-7)

130
Therefore, the pitch length in the deformed state can be determined by:
(5-8)
From Eq. (5-7) and Eq. (5-8), the lay angle of the deformed state can be determined as:
(5-9)
The initial length of a cable helical wire with lay angle is:
(5-10)
From Eq. (5-4), the axial length corresponding to the deformed state is:
(5-11)
Hence, the corresponding helical wire length in the deformed state is:
(5-12)
Where:
=lay angle of the deformed helical wires
Using Eq. (5-5), Eq. (5-9), Eq. (5-10) and Eq. (5-12), the helical wire extension ratio can
be expressed as:
(5-13)
(5-14)

131
From Eq. (5-5) and Eq. (5-14), the axial strain of the cable wires due to tension can be
obtained as:
√
(5-15)
From Eq. (5-15), the axial strain of helical wires is a function of the initial lay angle,
initial radius of helical wires centerline and the radius of deformed cable helical wires
centerline. The lay angle can be determined from the cable construction defined in
Chapter 3 (turns/m) using Eq. (5-7). The radius of the deformed cable helical wires
centerline will be discussed in Section 5.5 by considering the contact deformation and
Poisson’s ratio.
5.4.2 Axial Strain due to Rotation
A relative rotation exists between the undeformed and deformed cable end section.
The axial strain of the helical wires due to this rotation can be expressed as:
(5-16)
Where:
(5-17)
Substituting Eq. (5-6), Eq. (5-10) and Eq. (5-17) into Eq. (5-16), the axial strain of the
helical wires due to rotation can be expressed as:

132
√
√
(5-18)
(5-19)
Where:
= the relative rotation of the helical wires
Substituting Eq. (5-19) into Eq. (5-18), the axial strain due to rotation can be rewritten as:
√
√ [
] (5-20)
Where:
= the axial strain in the cable core
Assuming small deformation:
| | (5-21)
Hence can be expressed as:
(5-22)
The axial strain of a straight cable core in Eq. (5-20) is therefore:
(5-23)

133
Substituting Eq. (5-22) into Eq. (5-23), and neglected the higher order terms, Eq. (5-22)
can now be written as:
(5-24)
From Eq. (5-9), we have:
(5-25)
√
(5-26)
Substituting Eq. (5-15), Eq. (5-20), Eq. (5-24) and Eq. (5-26) into Eq. (5-3), the total
strain of the helical wires along the tangent direction can be written as:
√
√
[ √
√
] √
(5-27)
From Eq. (5-27), the total strain of the helical wires along the tangent direction can be
determined as a function of the initial lay angle , initial radius of helical wires
centerline , radius of the helical wires centerline of the deformed cable , the
compaction factor (CF) and the change of the lay angle . Determination of and
are presented in the following section.
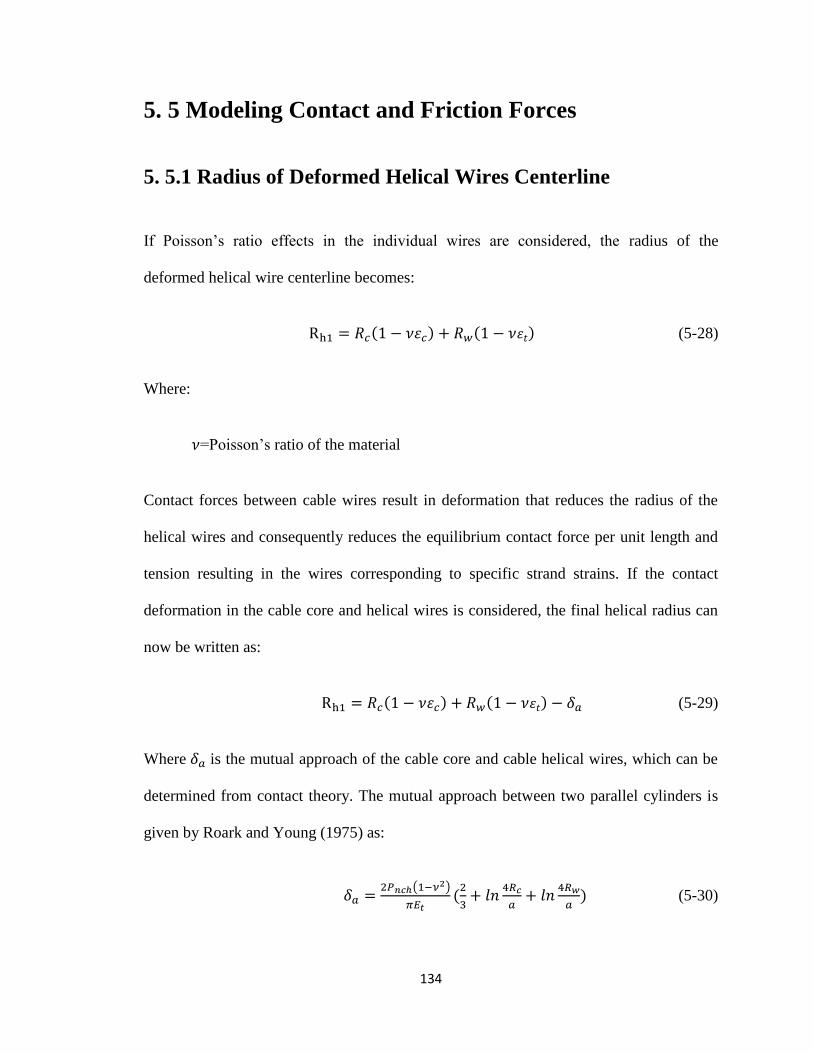
134
5. 5 Modeling Contact and Friction Forces
5. 5.1 Radius of Deformed Helical Wires Centerline
If Poisson’s ratio effects in the individual wires are considered, the radius of the
deformed helical wire centerline becomes:
(5-28)
Where:
=Poisson’s ratio of the material
Contact forces between cable wires result in deformation that reduces the radius of the
helical wires and consequently reduces the equilibrium contact force per unit length and
tension resulting in the wires corresponding to specific strand strains. If the contact
deformation in the cable core and helical wires is considered, the final helical radius can
now be written as:
(5-29)
Where is the mutual approach of the cable core and cable helical wires, which can be
determined from contact theory. The mutual approach between two parallel cylinders is
given by Roark and Young (1975) as:
( )
(5-30)

135
Therefore the final helical wire centerline radius is:
( )
(5-31)
Where:
= transverse modulus
5. 5.2 Interwire Contact and Friction
Strands in cables may subject to core-wire, wire-wire or coupled core-wire and wire-wire
contacts depending on the construction of the strand and the type of loading. The contact
models may change from one model to the other depending on the loads and the
deformation of the core and wires. Most of the literature on vibration damping analyzes
the cable strand with either the core-wire contact or wire-wire contact. In this research a
coupled core-wire and wire-wire contact is considered to understand the effect of
interfacial forces on the cable vibration damping. Furthermore, the consideration of
friction at the interface was also included in this model. In the portion where slip occurs
the helix angle will change. This increase in helix angle under loads is determined from
Eq. (5-22) to Eq. (5-24) by considering the small deformation:
(5-32)
In a simple cable, the contact zone between a helical wire and the core forms a narrow
strip whose central line is a helix. This contact can be locally approximated as the contact
between two parallel straight cylinders. Because the contact width is very small

136
compared with the wire radius, the Hertzian contact theory is applicable. The contact
half-width between a core and a helix, was determined by Labrosse and Conway
(2000a, 2000b) as follows:
√
(5-33)
Similarly, the contact half width between two helical wires is:
√
(5-34)
Where:
= the normal load per unit length between cable core and helical wires
= the contact half-width of cable core and helical wires contact
= the normal load per unit length between helical wires
= the contact half-width of helical wires contact
E = Young’s modulus of the cable material
5. 5.2.1 Contact Normal Load per Unit Length
Along the contact line between the helical wires, the normal distributed force and
the tangential distributed force and exist, as shown in Fig. 5.5.2.1. Furthermore,
along the line of contact between the cable core and a helical wire, the normal distributed
force and the tangential distributed force and Q act as shown in Fig. 5.5.2.1.

137
Figure 5.5.2.1 Distributed loads on a helical wire
Where is the contact angle, which defines the direction of the distributed contact
load , and is given by Costello and Phillips (1974) as the following:
√
(
)
√ (
) {
(
)[ (
)} (5-35)
Where:
m = the number of helical wires, equal to six for a 1+6 strand
When slip between helical wires during the extension of the cable is considered, the
tangential distributed forces between the core-wire and the wire-wire can be given by:

138
(5-36)
Where:
= friction coefficient of the material
As showed by Hobbs and Roof (1982), when the changes in helix angle and radius are
small, the interwire distributed forces in the normal direction can be represented
approximately as:
(5-37)
Where:
(5-38)
Substituting Eq. (5-38) into Eq. (5-37), the distributed contact force between the cable
core and helical wires, denoted by , (Fig. 5.5.2.2) can be rewritten as:
(5-39)
The contact force between the helical wires can be determined to be:
(5-40)

139
Figure 5.5.2.2 Contact force in cable
5. 6 Determination of Vibration Damping
An energy based method is used to evaluate the cable vibration damping. For low
damping, the energy stored at two successive peak amplitudes, and , of a freely
decay vibration is related to the loss factor by (Raoof and Huang, 1991):
(5-41)
Where:
= loss factor of the system
= the energy dissipation per cycle
U = the stored energy
, = two successive vibration amplitudes

140
The logarithmic decrement of the cable system is given as (Chopra, 2001):
(5-42)
For low damping, the following expression can be obtained:
(5-43)
Then damping ratio of the cable system is determined by:
√
√
(5-44)
Considering two adjacent helical wires of an axially preloaded carbon fiber cable, sliding
takes places while the tangential friction forces remains at . The tangential relative
displacement between central wires is estimated by Raoof (1991a), based on the
parametric studies, and is given as:
(5-45)
(5-46)
Where:
=tangential relative displacement
= shear strain between cable wires associated with wire axial strain
Then friction energy dissipation of helical wires is determined as:

141
(5-47)
Where is the contact normal force determined by Eq. (5-39), Eq. (5-40) and the
associated contact half width, and m is the number of helical wires.
The stored strain energy can be determined as:
∫
(5-48)
Assuming that the sinusoidal vibration profile is:
(5-49)
For small amplitude of vibration, axial tension can be approximated to be a constant, and
the strain energy due to the tension can be expresses as:
∫
∫
(5-50)
Where:
= initial stored energy due to the applied tension force
y = the assumed sinusoidal cable vibration profile
= vibration amplitude
The stored energy of the cable is then expressed as:
(5-51)

142
Then the damping can be determined using Eq. (5-44)-Eq. (5-51).
The above mentioned procedure is further described in the form of a flow chart (Fig.
5.6.1), the procedure was implemented using an iterative MatLab code.

143
Figure 5.6.1 Analysis flow chart
Input , , ,
Determine
Determine
Determine
Determine
Eq. (5-31)
Eq. (5-40)
Input , , ,
Assuming
Determined
Eq. (5-24)
Input
Eq. (5-32)
Determine
Eq. (5-39)
Determine damping,
END
Eq. (5-27)
Eq. (5-47), Eq. (5-51)
Eq. (5-44)
START
Input , , ,
Determine
YES
NO
Final
Eq. (5-33)
, ,

144
5. 7 Results and Discussion
The carbon fiber cables tested in the laboratory were analyzed using the proposed
approach. Table 5.7.1 shows the data pertinent to these cables. The length of cable is
0.2032m, 0.3048m, and 0.5080m, respectively, and the transverse modulus of the cable is
assumed as 6% of the longitudinal tensile modulus. The results of this analytical cable
damping model is shown in Table. 5.7.2.
Table 5.7.1 Cable properties
Cable
No
Lay angle
(rad)
Poisson's
ratio
Young's Modulus
(Gpa)
Helical centerline radius
(m)
Friction
coefficient
1 0.1207 0.3 2.76E+11 0.0004658 0.4
2 0.2332 0.3 2.76E+11 0.0004562 0.4
3 0.3328 0.3 2.76E+11 0.0004425 0.4
Table 5.7.2 Theoretical analysis results of cable vibration damping
Tension
(N)
Damping for 20.71turns/m cables
(%) Damping for 41.42turns/m cables
(%) Damping for 62.13turns/m cables
(%)
0.2032m 0.3048m 0.508m 0.2032m 0.3048m 0.508m 0.2032m 0.3048m 0.508m
111.25 6.09 4.11 2.81 5.02 3.19 1.92 4.67 3.11 1.87
222.50 3.72 2.52 1.77 2.89 1.82 1.09 2.62 1.75 1.05
333.75 2.67 1.82 1.30 2.02 1.27 0.76 1.83 1.22 0.73
445.00 2.09 1.42 1.02 1.56 0.98 0.59 1.40 0.93 0.56
578.50 1.65 1.13 0.81 1.22 0.76 0.46 1.09 0.73 0.44
Fig. 5.7.1 shows how the analytical results compare with the experimental data. The three
Figures (Fig. 5.7.1 a-c) correspond to the three different cable construction (# of turns). In
each Figure the variation of damping with applied tension and length of the cable is
presented. From the figures, the analytical model is capable of capturing the trends on the
variation of damping corresponding to each of the three independent variables (length,
applied tension and construction/lay angle).

145
Figure 5.7.1 Comparison of cable damping (a) 20.71 turns/m (b) 41.42 turns/m, (c) 62.13turns/m cables
0.00
1.00
2.00
3.00
4.00
5.00
6.00
7.00
100 200 300 400 500 600
Dam
pin
g (%
)
Tension (N)
theoretical,0.2032m
experimental,0.2032m
theoretical, 0.3048m
experimental, 0.3048m
theoretical,0.5080m
experimental, 0.5080m
(a)
0.00
1.00
2.00
3.00
4.00
5.00
6.00
100 200 300 400 500 600
Dam
pin
g (%
)
Tension (N)
theoretical,0.2032mexperimental,0.2032mtheoretical, 0.3048mexperimental, 0.3048mtheoretical,0.5080mexperimental, 0.5080m
(b)
0.00
1.00
2.00
3.00
4.00
5.00
0 100 200 300 400 500 600
Dam
pin
g (%
)
Tension (N)
theoretical,0.2032m
experimental,0.2032m
theoretical, 0.3048m
experimental, 0.3048m
theoretical,0.5080m
experimental, 0.5080m
(c)

146
Fig. 5.7.1 shows that the analytical model captures the decrease in damping as tension
increases. Typically, the cable damping is higher in the present model compared with the
experimental results for a low tension, whereas smaller damping is presented under high
tension. This could be attributed to the transverse property of the cable wires. The
modulus in the transverse direction is likely to increase as more tension is applied, which
was not included in the analyses.
The analytical damping results provided in Table 5.7.2 are presented in graphical form in
Figures 5.7.2 and 5.7.3 against with cable construction and length, respectively. The
trends compare very well with the test data presented earlier in Chapter 3.

147
Figure 5.7.2 Cable damping versus cable construction (a) 0.2032m (b) 0.3048m (c) 0.5080m cables
0.00
1.00
2.00
3.00
4.00
5.00
6.00
7.00
20 25 30 35 40 45 50 55 60
Dam
pin
g (%
)
Construction (turns/m)
111.25N 222.50N333.75N 444.5N578.50N
(a)
0.00
1.00
2.00
3.00
4.00
5.00
20 25 30 35 40 45 50 55 60
Dam
pin
g (%
)
Construction (turns/m)
111.25N 222.50N333.75N 444.5N578.50N
(b)
0.00
0.50
1.00
1.50
2.00
2.50
3.00
20 25 30 35 40 45 50 55 60
Dam
pin
g (%
)
Construction (turns/m)
111.25N 222.50N
333.75N 444.5N
578.50N
(c)

148
Figure 5.7.3 Cable damping versus length (a) 20.71 turns/m (b) 41.42turns/m (c) 62.13turns/m cables
0.00
1.00
2.00
3.00
4.00
5.00
6.00
7.00
0.2 0.3 0.4 0.5
Dam
pin
g (5
)
Length (m)
111.25N222.50N333.75N444.5N578.50N
(a)
0.00
1.00
2.00
3.00
4.00
5.00
6.00
0.2 0.25 0.3 0.35 0.4 0.45 0.5
Dam
pin
g (%
)
Length (m)
111.25N222.50N333.75N444.5N578.50N
(b)
0.00
1.00
2.00
3.00
4.00
5.00
0.2 0.25 0.3 0.35 0.4 0.45 0.5
Dam
pin
g (%
)
Length (m)
111.25N222.50N333.75N444.5N578.50N
(c)

149
To investigate if it is necessary to include the change of lay angle in the model, Fig. 5.7.4
presents the theoretical identified damping with ( and without (
consideration of the change of lay angle, and are compared with the test results. It shows
that without taking into account of the change of lay angle, the analytical model
underestimate cable damping (around 50% decrement ratio).

150
Figure 5.7.4 Comparison of damping (with and without consideration of change of lay angle) (a) 20.71
turns/m, 0.2032m (b) 20.71turns/m, 0.3048m (c) 20.71turns/m, 0.5080m cables
0.00
1.00
2.00
3.00
4.00
5.00
6.00
7.00
0 100 200 300 400 500 600
Dam
pin
g (%
)
Tension (N)
∆α=0,theoretical
∆α≠0,theoretical
test
(a)
0.00
0.50
1.00
1.50
2.00
2.50
3.00
3.50
4.00
4.50
0 100 200 300 400 500 600
Dam
pin
g (%
)
Tension (N)
∆α=0,theoretical
∆α≠0,theoretical
test
(b)
0.00
0.50
1.00
1.50
2.00
2.50
3.00
0 100 200 300 400 500 600
Dam
pin
g (%
)
Tension (N)
∆α=0,theoretical
∆α≠0,theoretical
test
(c)

151
Fig. 5.7.5 shows the sensitivity of the analytical value of cable damping to the Poisson’s
ratio. It is notable that the damping values are not very sensitive to the Poisson’s ratio for
small and reasonable assumptions (0.3 used in this analysis, typical of carbon fibers).
With a higher Poisson’s ratio, the flattening of the cable causes more contact and friction
between cable wires which leads to higher energy dissipation, as shown in Eq. (5-31).
Figure 5.7.5 Cable damping versus Poisson’s ratio (20.71 turns/m, 0.2032m carbon fiber cable)
5. 8 Conclusions
An analytical model has been developed which allows the damping of an axially loaded
carbon fiber cable to be predicted with reasonable accuracy, based on the properties of
the cable. The frictional energy dissipation is considered to be the main source of cable
damping. Information has also been provided for estimating the extensional-torsional
axial strain, the wire flattening and the contact behavior. In particular, the coupled wire-
wire contact and wire-core contact, the change of lay angle were considered in the model.
0.00
1.00
2.00
3.00
4.00
5.00
6.00
7.00
8.00
0 0.1 0.2 0.3 0.4 0.5
Dam
pin
g (%
)
Poisson's ratio
111.25N 222.50N333.75N 444.50N578.50N

152
The analytical model captured the trends on the variation of damping corresponding to
each of the three independent variables (length, applied tension and construction/lay
angle).
To this end, some straightforward formulations were presented which should prove useful
in predicting cable vibration damping. However, the accuracy and appropriateness of the
model is affected by the simplifying assumptions and is also affected by the
manufacturing process is not as controlled as the analytical derivation.

153
Chapter 6
Summary and Conclusions
The studies taken up in this dissertation have developed an experimental setup to test
cable vibration damping, and a theoretical approach for the analysis of cable damping.
Summary and detailed discussions were presented at the end of each relevant chapter.
The purpose of this chapter is to recapitulate the main findings and unify them to suggest
some further research directions.
6.1 Summary of the Contributions Made
a) Cable damping in a vibrating structure has long been an active research area, and it is
still considered as somewhat of an unknown area. Especially for the carbon fiber
cables in the space structural application, the available data is scarce. This dissertation
provides test data on the carbon fiber cable damping under different length, tension
and configuration. In particularly, a vacuum chamber was designed to test damping of
carbon fiber cables in the absence of atmosphere. Also, the effect of temperature on
damping was investigated. Some conclusions are derived from the test results, which
enrich the understanding of carbon fiber cable damping properties;
b) The finite element simulation of carbon fiber cable vibration using the COMBIN14
and MASS21 elements provides a simple but good estimation of cable vibration
natural frequency and time history response; Also, it shows that the Rayleigh
damping is adequate and effective for the modeling of cable damping;

154
c) A tensile load provokes not only extension, but also torque or rotation in cables due to
their helical geometry. This coupling extensional-torsional behavior is quite important
in the damping prediction of carbon fiber and steel cables. The strain caused by the
extension and torsion is considered in the analytical model in this dissertation;
d) The Poisson’s ratio effect, the mutual approach of cable wires and friction are
considered in the determination of cable damping in the analytical model;
e) The analytical model captured the trends on the variation of damping corresponding
to each of the three independent variables (length, applied tension and
construction/lay angle).
6.2 Suggestions for Future Work
The following recommendations are made for future work in order to improve the
accuracy of damping estimation:
a) The cable damping should be tested under a wider range of length, tension,
configuration, ambient temperature and air pressure in order to obtain more data to
analyze the effect of different factors on damping;
b) To get a better understanding of the characterizations of cable contact and interwire
slippage and their effects on damping, it is important to measure the interwire
pressure and slippage with sensors;
c) The effects of temperature and air pressure could be considered in the FEM
simulation;

155
d) The effect of the microstructure of the cable could provide a better understanding of
the frictional damping mechanism;
e) The proposed analytical solution is based on the small displacement and deformation
assumption. In order to get a better prediction of cable damping, large deformation
theory could be applied;
f) Different types of cables are applied in engineering field, therefore it is necessary to
extend the research to multilayer cables and damping treated cables, etc.;
g) The shape of wire strand section in a cable or wire rope cross-section is usually
assumed as elliptical, and the analysis of contact between strands is based upon this
assumption. This assumption is valid when the helical angle is large, and errors can
result when the helix angle is small. Thus, it is necessary to investigate the true
geometry and shape of the strand section, and understand its effect on damping;
h) Damping of carbon fiber cables in air and in vacuum shows a maximum difference of
40%, but the full contribution of air damping to the overall damping has not been
addressed. Considering the changes to void ratio could provide a way to improve the
theoretical prediction.

156
References
Achkire, Y. (1997), “Active tendon control of cable-stayed bridges”, Ph. D. thesis,
University of Brussels
Achkire, Y., and Preumont, A. (1996), “Active damping of cable structures” Proc.
Conferences on Spacecraft Structures, Material and Mechanical Testing, Grand Hotel Huis ter
Duin, Noordwijk, The Netherlands, 27-29, March, pp. 207-216
Achkire, Y., and Preumont, A. (1998), “Optical measurement of cable and string
vibration”, Shock and vibration, 5, pp.171-179
Ahid D. Nashif., David I. G. Jones., and John P. Henderson. (1985), “Vibration damping”,
John Wiley & Sons, Inc., ISBN 0-471-86772-1
Armin B. Mehrabi., and Habib Tabatabai. (1998), “Unified finite difference formulation
for free vibration of cables”, Journal of Structural Engineering, Vol. 124, No. 11, November, pp.
1313-1322
Burgess, J. J., and Triantafyllou, M. S. (1988) “The elastic frequencies of cable”, Journal
of Sound and Vibration, 120 (1), pp. 153-165
Blouin, F., and Cardou, A. (1989), “A study of helically reinforced cylinders under
axially symmetric loads mathematical modeling”, International Journal of Solids and Structures,
25 (2), pp. 189-200
Barbieri Nilson., Paulo Rogerio Novak., and Barbieri Renato. (2004), “Experimental
identification of damping”, International Journal of Solids and Structural, 41, pp. 3585-3594

157
Barbieri Nilson., Oswaldo Honorato de Souza Junior., Barbieri Renato. (2004a),
“Dynamical analysis of transmission line cables. Part 2-daming estimation”, Mechanical System
and Signal Processing, (18), pp. 671-681
Barbieri Nilson., Oswaldo Honorato de Souza Junior., and Barbieri Renato. (2004b),
“Dynamical analysis of transmission line cables Part 1-linear theory”, Mechanical System and
Signal Processing, (18) , pp. 659-669
Babuska. V. (2010), “Modeling and experimental validation of space structures with
wiring harness”, Journal of Spacecraft and Rockets, Vol. 47, No. 6, November-December, pp.
1038-1052
Claren Rodolfo., and Diana Giorgio. (1969a), “Mathematical Analysis of Transmission
Line Vibration”, IEEE Transactions on Power Apparatus and Systems, Vol. PAS-88, No. 12,
December, pp. 1741-1771
Claren Rodolfo., and Diana Giorgio. (1969b), “Dynamic strain distribution on loaded
stranded cables”, IEEE Transactions on Power Apparatus and Systems, Vol. PAS-88, No. 11,
November, pp. 1678-1690
Carlson A. D., and Kasper R. G. (1973), “A structural analysis of multi-conductor cable”
Report No. AD-767 963, Naval underwater systems center, distributed by National Technical
Information Service
Chi M. (1974), “Analysis of multi-wire strands in tension and combined tension and
Torsion”, Proc. of The seventh south-eastern conference on theoretical and applied Mechanics.
Vol.7, pp.599-639

158
Chi M. (1974), “Analysis of Multi-Wire strands in Tension and Combined Tension and
Torsion”, Proc. of VII SECTAN, Vol.7, pp.559-639
Costello G.A. and Phillips J.W. (1974), “A more exact theory for twisted wire cable”,
ASCE, J. Eng. Mech. Div., 102(EM5), pp.1096-1099
Cutchins MA., Cochran JE., Guest S., Fitz-Coy NG., and Tinker ML. (1987), “An
investigation of the damping phenomena in wire rope isolators”. Proceedings of the 1987 ASME
Design Technology Conference, vol. 5, Boston, Massachusetts, pp. 197-204
Chopra, A.K. (2001). “Dynamics of Structures: Theory and Applications to Earthquake
Engineering, Second Edition,” Prentice-Hall, Upper Saddle River, New Jersey
Chiang YJ. (1996), “Characterizing simple stranded wire cables under axial loading”,
Finite Elements in Analysis and Design, 24, pp. 49-66
Costello, G. A. (1997), “Theory of wire rope”, 2nd edition, Springer: New York, N.Y,
Cardou, A, and Jolicoeur, C. (1997), “Mechanical models of helical strands”, Applied
Mechanics Reviews, Vol. 50, No. 1, pp.1-14
Cluni, F., Gusella, V., and Ubertini, F. (2007), “A parametric investigation of wind-
induced cable fatigue”, Engineering Structures, 29(11), pp. 3094-3105
Coombs, M. Douglas., Glaese, Roger., Vit Babuska., and Robertson, M. Lawrence.
(2008), “Structural dynamic effects of cables on a sparse aperture deployable optical telescope”,
49th AIAA/ASME/ASCE/AHS/ASC Structures, Structural Dynamics, and Materials Conference ,
07-10 April 2008, Schaumburg, IL, AIAA , pp.2008-2266

159
Casciati, F., and Ubertini, F. (2007), “Nonlinear vibration of shallow cables with semi-
active tuned mass damper”, Nonlinear Dynamics Vol. 53, Issue 1-2, pp. 89-106
Casciati, F. Faravelli,L., and Fuggini. C. (2008), “Cable vibration mitigation by added
SMA wires”, Acta Mech 195, DOI 10.1007/s00707-007-0541-x, printed in The Netherlands, pp.
141-155
Charles B. Rawlins., “Flexural self-damping in overhead electrical transmission
conductors”, Journal of Sound and Vibration, 323 (2009), pp. 232 -256
Duan, Y. F. , Ni, Y. Q., J. M. KO., and Chen, Z. Q. (2003), “Amplitude-dependent
frequency and damping identification of bridge cables with MR dampers in different setups”,
Smart Structures and Materials 2003; Smart System and Nondestructive Evaluation for Civil
Infrastructures, Shih-Chi Liu, Editor, Proceedings of SPIE Vol. 5057, pp. 218-228
Du, Yanliang., Li, Jianzhi., and Sun, Baochen. (2011), “Study on Damping Properties of
Fiber Reinforced Composite for Stayed cable”, Advanced Materials Research, Vols. 163-167, pp.
288-292.
EL Kady, H. M., Arockiasamy, M., and Samaan, S. (2000), “Damping characteristics of
carbon fiber composite cable for application in cable-stayed bridges”, Cable-stayed bridges, past,
present and future, IABSE Conference. Malmo, IABSE Reports (No. 82), pp.551-558
Filipe Magalhaes., Alvaro Cunha., Elsa Caetano., and Rune Brincker. (2010), “Damping
estimation using free decay and ambient vibration tests”, Mechanical Systems and Signal
Processing, 24, pp. 1274-1290
Gutzer, Ulrich., Seemann, Wolfgang., and Hegedorn Peter. (1995), “Nonlinear structural
damping described by the Masing model and the method of slowly varying amplitude and phase”,

160
Proceeding of the 1995 Design Engineering Technical Conferences, DE-Vol. 84-1, Volume 3-
Part A ASME, pp. 773-779
Ghoreishi. S. R., Messager Tanguy., Cartraud Patrice., and Davies Peter (2007). “Validity
and limitation of linear analytical models for steel wire strands under axial loading, using a 3D
FE model”, International Journal of Mechanical Science 49, pp. 1251-1261
G. Masing (1923), “Zur Heynschen Theorie der Verfestigung der Metalle durch
verborgene elastiche Spannungen” (= On Heyn’s Theory of Stiffening of Metals by Hidden
Elastic Stress), Wissenschaftliche Veroffentlichungen asu dem Siemens-Konzern, 3
Hard, A. R., and Holben, R. D. (1967), “Application of the vibration decay test to
transmission line conductors”, IEEE Transactions on Power Application and Systems, Paper 31,
TP, 65-654, pp.189-195
Huang, N. C. (1978), “Finite extension of an elastic strand with a center core”, Journal of
Applied Mechanics ASME, Vol. 45, pp. 852-858
Hobbs, R. E., and Raoof, M (1982), “Interwire slippage and fatigue prediction in stranded
cables for TLP tethers”, Behavior of Offshore Structures, Hemisphere publishing/McGraw-Hill,
New York, Vol. 2, pp. 77-99.
Hobbs, R. E., and Raoof, M (1984), “Hysteresis in bridge strand”, Proc. Instn Civ. Engrs,
Part 2, 77, Dec., pp.445-464
He, Xiaohua., and Powell, J. David. (1990), “Tether damping in space”, Journal of
guidance, control, and dynamics, Vol. 13, No. 1, pp. 104-112

161
Hobbs, R. E., and Raoof, M. (1994), “Mechanism of fretting fatigue in steel cables”,
International Journal of Fatigue, Vol. 16, No. 4, June, pp. 273-280
Hosaka. H., Itao, K., and Kuroda, S. (1995), “Damping characteristics of beam-shaped
micro-oscillators,” Sensors and Actuators, Vol. 49, pp. 87–95
Huang Xiaolun., Vinogradov, G. O. (1992) “Interwire slip and its influence on the
dynamic properties of tension cables”, Proceedings of the Second (1992) International Offshore
and Polar Engineering Conference, San Francisco, USA, 14-19 June, pp.392-396
Huang Xiaolun., Vinogradov, G. O. (1994), “Analysis of dry friction hysteresis in a cable
under uniform bending”, Structural Engineering and Mechanics, Vol. 2, No. 1, pp. 63-80
Huang Xiaolun., Vinogradov, G. O. (1996a), “Dry friction losses in axially loaded
cables”, Structural Engineering and Mechanics, Vol. 4, No. 3, pp. 330-344
Huang Xiaolun., Vinogradov, G. O. (1996b), “Extension of a cable in the presence of dry
friction”, Structural Engineering and Mechanics, Vol.4, No. 3, pp. 313-329
Irvine H. Max (1981). “Cable Structures”. MIT ISBN 0-262-09023-6
Jolicoeur, C., and Cardou, A. (1994), “An analytical solution for bending of coaxial
orthotropic cylinders”, Journal of Engineering Mechanics, 120 (12), pp. 2556-2574
Jiang. W. G., Yao. M. S., Walton. J. M. (1999), “A concise finite element model for
simple straight wire rope strand”, International Journal of Mechanical Sciences, 41, pp. 143-161
Knapp R.H. (1979), “Derivations of a new stiffness matrix for helically armored cables
considering tension and torsion”, Int. J. Numer. Methods Eng., 14, pp.515-529

162
Kunoh, T., and Leech, C. M. (1985) “Curvature effects on contact position of wire
strands”, Int. J. Mech. Sci. Vol. 27, No. 7/8, pp. 465-470
Kumar K., and Cochran J. E. (1987) “Closed form analysis of elastic deformations of
multilayered strands”, J. Appl. Mech., 54, pp.898-903
Kashani K. A. (1989), “Vibration of Hanning Cables”, Computers & Structures. Vol.31,
No.5, pp. 699-715
Kwan, A. S. K., You, Z., and Pellegrino, S. (1993), “Active and passive cable elements
in deployable/retractable masts”, International Journal of Space Structures, Vol. 8, No. 1, Jan, pp.
29-40
KO, J. M., Zheng, G., Chen, Z. Q., and Ni, Y. Q. (2002), “Field vibration tests of bridge
stay cables incorporated with magneto-rheological (MR) dampers”, Smart Structures and
Materials 2002; Smart System for Bridges, Structures, and Highways, S.–C. Liu, Darryii J. Pines,
Editors, Proceedings of SPIE Vol. 4696, pp. 30-40
Knapp, R. H., and Xin Liu. (2005), “Cable Vibration Considering Interlayer Coulomb
Friction”, International Journal of Offshore and Polar Engineering, Vol. 15, No. 3, September, pp.
229-234
Kim Nan-Sik and Jeong Woon. (2005), “Development of cable-exciting system for
evaluating modal damping of stay cables”, Journal of Vibration and Control, 11, pp. 481-498
Leech, C. M. (1987) “Theory and numerical methods for the modeling of synthetic
ropes”, Communications in Applied Numerical Methods, Vol. 3, pp. 407-413

163
Leech, C. M. (2002) “The modeling of friction in polymer fiber ropes”, International
Journal of Mechanical Science, 44 pp. 621-643
LeClair, R. A. (1989), “Upper bound to mechanical power transmission loss in wire
rope”, Journal of Engineering Mechanics, ASCE, Vol. 115, No. 9, pp. 2011-2019
Lanteigne, J. (1985), “Theoretical estimation of the response of helically armored cables
to tension, torsion, and bending”, Journal of Applied Mechanics. ASME, Vol. 52, pp. 423-432
Labrosse. M., Nawrocki. A., and Conway. T. (2000a), “Influence of friction on the cyclic
response of simple straight wire rope strands under axial loads”, Tire Science & Technology,
TSTCA, Vol. 28, No. 4, October-December, 2000, pp.233-247
Labrosse. M., Nawrocki. A., and Conway. T. (2000b) “Frictional dissipation in axially
loaded simple straight strands”, Journal of Engineering Mechanics, Vol. 126, No. 6, June, 2000,
pp. 641-646
Liu Xin. (2004), “Cable vibration considering internal friction”, M. S. Thesis, University
of Hawaii, August
Liu Xin., and Knapp, R. H. (2005), “Cable vibration considering internal friction”,
Proceedings of the Fifth (2005) International Offshore and Polar Engineering Conference, Seoul,
Korea, June 19-24, pp. 213-219
Machida S., and Durelli A. J. (1973) “Response of a strand to axial and torsional
displacements”, J. Mech. Eng. Sci., 15(4), pp. 241-251

164
Marcel Migdalovici., Tudor Sireteanu., and Emil Matei Videa. (2010), “Rigidity
influence of suspended cable on free vibration modes”, Analele University, Eftime Murgu Resita,
ANUL, XVII, NR. 1, pp. 1453-7397
Mankowski, R. R. (1988), “Internal damping characteristics of a mine hoist cable
undergoing non-planar transverse vibration”, J. S. Afr. Inst. Min. Metall., Vol. 88. No.12. Dec, pp.
401-410
Nawrocki . A., and Labrosse. M. (2000), “A finite element model for simple straight wire
rope strands”, Computers and Structures, 77, pp. 345-359
Novak, P. R., Barbieri, Nilson., and Barbieri, Renato (2004), “Damping identification
through of non-contact sensors, Sixth International Conference on Vibration Measurement by
Laser Techniques; Advances and Application; 22-25 June, Ancona, Italy, 5503 Issue, 2004, pp.
310-319
Owada S. (1952), “Calculation of tensile and torsional stiffnesses of single lay cables”. In:
Proceedings of the 2nd Japan national congress for applied mechanics,. pp. 159-164
Pivovarov, I., and Vinogradov O. G. (1985)“The phenomenon of damping in stranded
cables”, A Collection of Technical Papers-AIAA/ASME/ASCE/AHS, 85-0660, 2, pp. 232-237
Preumont, Y. Achkire. (1996) “Active damping of cable structures”, Proc. Conference
on Spacecraft Structures, Materials & Mechanical Testing, Grand Hotel Huis ter Duin, Noordwijk,
The Netherlands, 27-29 March 1996 (ESA SP-386, June, pp. 207-216
Ramberg, E. Steven., and Griffin, M. Owen. (1969), “Free vibration of taut and slack
marine cables”, Journal of the Structures Division, Proceedings of the American Society of Civil
Engineers, 09, pp. 1968-1981

165
Ramberg, E. Steven., and Griffin, M. Owen. (1977), “Free vibration of taut can slack
marine cables”, Journal of the Structure Division, Vol. 103, No. 11, November, pp. 2072-2092
Roark, Raymond J., and Young, Warren C. (1975), “Formulas for stress and strain”, 5th
edition, ISBN 0070530319
Ramsey, H. (1990), “Analysis of interwire friction in multilayered cables under uniform
extensions and twisting”, International Journal of Mechanical Sciences, Vol. 32, No. 8, pp.709-
716
Raoof, M. (1989), “Torsional stiffness and hysteresis in spiral strands”, Proc. Instn CIV.
Engrs, Part 2, 87, Dec, pp. 501-515
Raoof, M. (1990), “Comparison between the performance of newly manufactured and
well-used spiral strands”, Proc. Instn Civ. Engrs, Part 2, Design and construction, 89, Mar,
pp.103-120
Raoof, M. (1991a), “Methods for analyzing large spiral strands”, The Journal of Strain
analysis for engineering design, Vol. 26, No. 3, 1991, pp. 165-174
Raoof, M. (1991b) “The prediction of axial damping in spiral strands”, Journal of Strain
Analysis for engineering design, Vol. 26, No. 4, pp.221-229
Raoof, M. (1996) “Behavior of large diameter wire ropes”, International Journal of
Offshore and Polar Engineering, Vol. 6, No. 3, March, pp. 119-226
Roof, M. (1997), “Effect of lay angle on various characteristic of spiral strands”,
International Journal of Offshore and Polar Engineering, Vol. 7, No. 1, March 1997, pp. 54-62

166
Raoof, M., and Huang, Y. P. (1991a), “Upper bound prediction of cable damping under
cyclic bending”, ASCE, J. Eng. Mech., 117 (12), pp. 2729-2747
Raoof, M., and Huang, Y. P. (1991b) “Free bending characteristics of sheathed spiral
strands under cyclic loading”, Journal of Strain Analysis, Vol. 27, No. 4, pp.219-226
Raoof, M., and Huang, Y. P. (1993a), “Lateral vibrations of steel cables including
structural damping”, Proc. Instn Civ. Engrs Structs & Bldgs, 99, May, pp.123-133
Raoof, M., and Huang, Y. P. (1993b), “Effect of Non-linear Structural damping on cable
lateral vibrations”, The proceedings of the Third (1993) International Offshore and Polar
Engineering Conference, 1993b, pp.435-444
Roof, M., and Kraincanic, I. (1995), “Analysis of large diameter steel ropes”, Journal of
Engineering Mechanics, Vol. 121, No.6, June, pp. 667-675
Raoof, M., and Hobbs, R. E. (1988), “Analysis of multilayered structural strands”,
Journal of Engineering Mechanics, Vol. 114, No.7, July, pp. 1166-1182
Raoof, M., and Davis, J. Timothy. (2006), “Simple determination of the maximum axial
and torsional energy dissipation in large diameter spiral strands”, Computers and Structures, 84,
pp.676-689
Robertson M. Lawrence et al. (2007), “Cable effects on the dynamics of large precision
structures”, 48th AIAA/ASME/ASCE/AHS/ASC Structures, Structural Dynamics, and Materials
Conference, 23-26 April 2007, Honolulu, Hawaii, AIAA 2007-2389, pp. 1-5

167
Renato Barbieri., Nilson Barbieri., and Oswaldo Honorato de Souza Junior. (2008),
“Dynamical analysis of transmission line cables. Part 3-nonlinear theory”, Mechanical System
and Signal Processing, 22, pp. 992-1007
SEPPA, T. O. (1971), “Self damping measurements and energy balance of ACSR Drake”,
Institute of Electrical and Electronics Engineers, Winter Power Meeting Conference Paper 71,
CP 161 PWR
Sathikh, S., and Parthasarathy, N. S. (1989), “Effect of friction on bending stiffness and
slip damping of stranded cables”, Proceedings of National Conference on Industrial Tribology-89,
Jan 19-20, 1989, India Space Research Organization (ISRO), Trivandrum, India
Sathikh, S. (1989a), “Nonlinear effect of interwire friction on natural frequency and
structural damping of wire rope and cables”, Proc. of International Conference-Noise and
Vibration, 89, Nanyang Technological Institute, Singapore, Aug 16-18
Sathikh, S. (1989b), “Bending of Helically Stranded Cable with Friction”, a paper
communicate to J. Offshore Mech. Arctic Engrg
Sathikh, S. (1989c), “Effect of interwire friction on transverse vibration of helically
stranded cable”, Structural vibration and acoustics: AMSE design technical conference-12
Biennial Conference on Mechanical Vibration and Noise, Montreal, Quebec, Canada, September
17-21, pp.147-153
Sathikh, S., Rajasekaran, Jayakumar andJebaraj, C. (2000), “General thin rod model for
preslip bending response of strand”, Journal of Engineering Mechanics, Vol. 126, No. 2, Feb, pp.
132-139

168
Sauter. D., and Hagedorn, P (2002), “On the Hysteresis of Wire Cables in
STOCKBRIDGE Dampers,” Int J Non-linear Mech, Vol 37, Issue 8 ,pp. 1453-1459
Thomas G. Carne. (1981), “Guy cable design and damping for vertical axis wind
turbines”, SAND 80-2669, Jun22
Tan, G. E. B., and Pellegrino, S. (2008). “Nonlinear vibration of cable-stiffened
pantographic deployable structures”, Journal of Sound and Vibration, 314, pp. 783-802
Vanderveldt, H. H., Chung, B. S., and Reader, W. T. (1973), “Some dynamic properties
of axially loaded wire ropes”, Experimental Mechanics, 13(1), pp. 24-30
Vinogradov, O. G., and Atatekin. I. S. (1986), “Internal friction due to twist in bent
cables”, Journal of engineering Mechanics, ASCE, 112(9), pp. 859-873
Wei, C. Y., and Kukureka, S. N. (2000), “Evaluation of damping and elastic properties of
composites and composite structures by the resonance technique”, Journal of Materials Science,
35 pp. 3785-3792
Wei, C. Y., and Kukureka, S. N. (2004), “Temperature dependence of dynamic modulus
and damping in composites and optical telecommunication cables tested by the vibration
resonance technique”, Materials Evaluation, 62(3), 2004, pp. 376-381
Wu. Q., Takahashi. K., and Nakaumura. S. (2003), “Non-linear vibrations of cables
considering loosening”, Journal of Sound and Vibration, 2 (61), pp. 385-402
Wu. Q., Takahashi. K., and Chen. B. (2006), “Using cable finite elements to analyze
parametric vibraitons of stay cables in cable-stayed bridges”, Structural Engineering and
Mechanics, Vol. 23, No. 6pp. 691-711

169
Wang Xin., and Wu Zhishen. (2011), “Modal damping evaluation of hybrid FRP cable
with smart damper for long span cable-stayed bridges”, Composite Structures, 93 , pp. 1231-1238
Xie Xu., Zhang He., and Shen Yong-gang. (2008), “Study on characteristics of modal
damping of steel and CFRP stay cables”, Engineering Mechanics, Vol. 25 No.3, pp.151-157, (In
Chinese)
Xie Xu., Zhang He., and Shen Yong-gang. (2010), “Theoretical analysis and
experimental test on damping characteristics of CFRP stay cables”, Engineering Mechanics, Vol.
27 No.3, pp.205-211, (In Chinese)
Xu Y. L., and Yu, Z. (1998), “Vibration of inclined sag cables with oil dampers in cable-
stayed bridges”, Journal of Bridge Engineering, Vol. 3, No. 4, November, PP. 194-203
Xu, Y. L et al. (1999), “Experimental study of vibration mitigation of bridge stay cables”,
Journal of Structural Engineering, Vol. 125, No. 9, September, pp. 977-986
Yu Ai-Ting (1949), “Vibration damping of stranded cable”, Dissertation for Degree of
Philosophy, Leigh University
Yu Ai-Ting (1952), “Vibration damping of stranded cable”, Proceedings of the Society
for Experimental Stress Analysis, Vol. IX, No. 2, June, pp.141-158
Yamaguchi, H., and Fujino, Yozo. (1987), “Modal damping of flexural oscillation in
suspended cables”, Structural Eng. / Earthquake Eng. Vol. 4. No.2. October pp.413s-421s
Yamaguchi, H., and Fujino, Yozo. (1988), “Effects of support flexibility on modal
damping of cables”, Structural Eng. / Earthquake Eng. Vol. 5. No.2. October , pp.303s-311s

170
Yamaguchi Hiroki., and Jayawardena Loranjana. (1992), “Analytical estimation of
structural damping in cable structures”, Journal of Wind Engineering and Industrial
Aerodynamics, 41-44, pp. 1961-1972
Yamaguchi, H., and Adhikari, R. (1994), “Loss factor of damping treated structural
cables”, Journal of Sound and Vibration, 176 (4), pp. 487-495
Yamaguchi, H., Alauddin, M., and Poovarodom, N. (2001), “Dynamic characteristics and
vibration control of a cable system with sub-structural interactions”, Engineering Structures, 23,
pp. 1348-1358
Zhong, M. (2003), “Dynamic analysis of cables with variable flexural rigidity”, M. S.
Thesis, University of Hawaii, May
Zheng, G. Ni., Y. Q., KO, J. M., and Xu.(2003), “Tension-Dependent Internal damping
of a Cable Model”, Key Engineering Materials, Vols. 24.3-244 , pp. 415-420
Zhu Z. H., and Meguid S. A. (2006) ‘Elastodynamic Analysis of Low Tension Cables
Using a New Curved Beam Element’, Int. J. of Solids and Structures, Vol.43, No. 6, pp.1490-
1504
Zhu Z. H., and Meguid S. A. (2007), “Nonlinear FE-based investigation of flexural
damping of slacking cables” International Journal of Solids and Structure, 44, pp.5122-5132