investigation of growth medium supplementation and ethanol
TRANSCRIPT
UNIVERSITY OF SOUTHERN QUEENSLAND
Investigation of Growth Medium
Supplementation and Ethanol Tolerance
of the Yeast Saccharomyces cerevisiae
Submitted by:
SAFRI ISHMAYANA
For the award of:
Master of Science (M.Sc.)
2011
ii
CERTIFICATION OF DISSERTATION
I certify that the ideas, experimental work, analyses and conclusions reported in this thesis
are entirely my own effort, except where otherwise acknowledged. I also certify that the
work is original and has not been previously submitted for any other award, except where
otherwise acknowledged.
_________________________________ ___________
Signature of Candidate Date
Safri Ishmayana
ENDORSEMENT
_________________________________ ___________
Signature of Supervisor Date
A/Prof. Robert P. Learmonth
_________________________________ ___________
Signature of Supervisor Date
Ms. Ursula Kennedy
iii
ABSTRACT
Ethanol tolerance is one of the most important properties of yeasts used for
bioethanol production, and has been correlated with plasma membrane fluidity. This study
investigates yeast membrane fluidity and ethanol tolerance, particularly in relation to
proline and inositol supplementation. Three Saccharomyces cerevisiae strains (A12, PDM
and K7) were selected, based on reported stress tolerance and ethanol productivity; an
ethanol tolerant baker’s yeast (A12), a wine yeast (PDM) and a sake yeast (K7), the latter
produce up to 17 and 17.5 %(v/v) ethanol, respectively.
To determine the feasibility of these strains and supplementation for bioethanol
production, a model system was devised using Yeast Nitrogen Base (YNB) with 18% (w/v)
sucrose. YNB was chosen for its defined and consistent composition (limiting variation)
and for its lower fluorescent background (enabling membrane fluidity assessment in situ).
However growth of all strains was inconsistent and ferments stuck at high sugar levels.
This was likely due to insufficient nitrogen or other essential nutrients, and could be
ameliorated by a complex but undefined medium but with high and inexact levels of
proline and inositol. In order to allow unequivocal discrimination of supplement effects,
experiments were continued with media similar to previous laboratory studies; YNB with
2% (w/v) glucose.
When cultured in YNB with 2% (w/v) glucose, the three strains had similar growth
rates and performance, although K7 maintained significantly higher viability. Comparison
of generalized polarization (GP) of laurdan-labelled cells indicated that PDM had the
highest membrane fluidity, followed in order by K7 and A12. Conversely A12 had the
highest ethanol tolerance, followed in order by K7 and PDM, so unlike some published
reports, higher ethanol tolerance related to lower membrane fluidity. Furthermore in
iv
comparison to 6 h cultures, 24 h cultures of all strains had lower membrane fluidity and
higher ethanol tolerance.
Two approaches were used to assess ethanol tolerance. The total plate count (TPC)
is widely used to assess ethanol tolerance, while methylene violet staining has been
proposed as a rapid alternative. Correlation analysis showed only weak correlations
between viability assessment by methylene violet staining and viability by TPC, membrane
fluidity by GP or culture age. In contrast there were strong correlations between
membrane fluidity by GP, viability by TPC and culture age.
Despite showing promise in previously published studies as a stress tolerance
enhancer, proline supplementation did not lead to any consistent significant change in
membrane fluidity or ethanol tolerance. The only significant effect was the higher GP of
the PDM strain with 0.5 g/L proline. However, no significant differences between levels of
supplementation were detected in viability reduction in ethanol-stressed cultures (either by
TPC or methylene violet staining). Therefore further study is needed to confirm this result.
The present study failed to confirm reports that inositol supplementation increases ethanol
tolerance. No significant changes of either GP or viability reduction upon ethanol stress
were found when the medium was supplemented with various levels of inositol. Further
investigation, including more variations in concentration, is needed to elucidate this
possibility.
In summary, of the three S. cerevisiae strains tested, A12 seems to be the best for
bioethanol production, followed by K7 and then PDM. Some relationships were found
between culture age, ethanol stress tolerance and membrane fluidity, although
supplementation of cultures with proline or inositol did not seem to enhance culture
performance or ethanol tolerance.

v
ACKNOWLEDGEMENTS
During my study, I was supported by a scholarship from Directorate General of
Higher Education, Ministry of National Education, Republic of Indonesia, and therefore I
am very grateful for their support. Acknowledgement is also given to USQ for the
opportunity to complete my study towards the Master of Science.
I would like to express my sincere gratitude to my supervisor, Associate Professor
Robert Learmonth and my co-supervisor Ms. Ursula Kennedy, for their guidance,
encouragement and support. This thesis would not be finished without their time and
assistance.
I would also like to thank all of the technical staff in the Department of Biological and
Physical Sciences for their valuable assistance, especially Adele Jones, Morwenna
Boddington and also Kim Larsen for assisting in HPLC analysis. I thank the Director of the
Centre for Systems Biology (CSBi) and its members for assisting me during my study
period.
I would like to acknowledge the Department of Chemistry, Faculty of Mathematics
and Natural Sciences, Universitas Padjadjaran as my home institution for allowing me to
undertake this degree and also for their support during my study.
My deepest thanks are also directed to my parents, brothers and sisters for their
valuable support during my study. I also would like to thank my friends for their support
and friendship.
vi
GLOSSARY OF ABBREVIATIONS
ANOVA Analysis of Variance
ATCC American Type Culture Collection
ATP Adenosine tri phosphate
CDP-DAG Cytidine diphospho-diacylglycerol
DLPC dilauroyl-phosphatidylcholine
DNA Deoxyribonucleic Acid
DPH 1,6-Diphenyl-1,3,5-hexatriene
EDTA Ethylenediaminetetraacetic acid
EPR Electron Paramagnetic Resonance
FAD2 Δ12-fatty acid desaturase encoding gene
FTIR Fourier Transform Infrared
G Grating correction factor
g Gravity, relative centrifugal force
GMO Genetically modified organism
GP Generalized polarization
GRAS Generally recognized as safe
HPLC High Performance Liquid Chromatography
INO1 myo-inositol-1-phosphate synthase encoding gene
IVH fluorescence emission intensity measured in the plane perpendicular to
the plane of vertically polarized excitation
IVV fluorescence emission intensity measured in the plane parallel to the
plane of vertically polarized excitation
Laurdan 6-lauroyl-2-dimethylamino naphthalene
LSD Least Significant Difference
NMR Nuclear Magnetic Resonance
OD600nm Optical density at 600 nm
OLE1 Δ9-fatty acid desaturase encoding gene
OPI1 negative regulatory factor of the INO1 structural gene encoding gene
opm Orbital per minute
P Polarization
p p-value, probability value
P5C Δ1-pyrroline-5-carboxylate
PA Phospatidic acid
PC Phosphatidylcholine
PC Personal Computer
PDA Photo Diode Array
PE Phosphatidylethanolamine
PI Phosphatidylinositol
PMMA polymethyl methacrylate
PRO1 γ-glutamyl kinase encoding gene
vii
PS Phosphatidylserine
PUT1 Proline oxidase encoding gene
PUT2 Δ1-pyrroline-5-carboxylate dehydrogenase encoding gene
r anisotropy
RID Refractive Index Detector
ROS Reactive oxygen species
SPS Ssy1-Ptr3-Ssy5 complex
Tm Melting Temperature of DNA
TPC Total plate count
VR MVS viability reduction by methylene violet staining
VR TPC viability reduction by total plate count
YEP Yeast extract peptone
YNB Yeast nitrogen base
YNBNG Yeast nitrogen base without glucose
YPD Yeast extract peptone dextrose
viii
CONTENTS CERTIFICATION OF DISSERTATION .............................................................. ii
ABSTRACT ..................................................................................................... iii
ACKNOWLEDGEMENTS ................................................................................. v
GLOSSARY OF ABBREVIATIONS ................................................................. vi
CONTENTS ................................................................................................... viii
LIST OF FIGURES ......................................................................................... xii
LIST OF TABLES .......................................................................................... xxi
CHAPTER ONE: LITERATURE REVIEW AND BACKGROUND
1.1 Introduction ....................................................................................................... 1
1.2 The Yeast Plasma Membrane ........................................................................... 4
1.2.1 Phospholipids ............................................................................................. 5
1.2.2 Sphingolipids .............................................................................................. 9
1.2.3 Fatty acyl chains ....................................................................................... 10
1.2.4 Sterols ...................................................................................................... 12
1.3 Ethanol Stress and Yeast Tolerance................................................................ 12
1.4 General Stress Protectants ............................................................................. 17
1.4.1 L-Proline ................................................................................................... 19
1.4.2 Inositol ..................................................................................................... 24
1.5 Yeast Fermentation ......................................................................................... 30
1.6 Measurement of Membrane Fluidity................................................................. 34
1.7 Membrane Fluidity and Yeast Adaptation to Environmental Stress ................... 41
1.8 Outline of Investigations in this Project ............................................................ 44
1.8.1 Objectives ................................................................................................ 45
CHAPTER TWO: MATERIALS AND METHODS
2.1 Yeast strains and maintenance ....................................................................... 47
2.2 Growth media and culture conditions ............................................................... 48
2.3 Experimental batch culture conditions and sampling ........................................ 49
2.4 Growth Rate ................................................................................................... 49
ix
2.5 Viable Cell Numbers ....................................................................................... 49
2.6 Percent Viable Cells ........................................................................................ 50
2.7 Percent Budding ............................................................................................. 50
2.8 Determination of membrane fluidity by spectrofluorometric analysis ................. 50
2.8.1 Labelling of cells ....................................................................................... 50
2.8.2 Protocol for setting up PC1 to conduct spectrofluorimetric analysis ............ 51
2.8.3 Measurement of Generalized Polarization of laurdan localized in yeast
membranes ....................................................................................................... 51
2.9 Ethanol tolerance ............................................................................................ 52
2.9.1 Sample preparation .................................................................................. 52
2.9.2 Ethanol tolerance test ............................................................................... 53
2.10 Measurement of glucose, ethanol, L-proline and inositol using HPLC ............. 54
2.10.1 Instrumentation ....................................................................................... 54
2.10.2 Column ................................................................................................... 54
2.10.3 Mobile phase .......................................................................................... 55
2.11 Determination of total sugar concentration by the phenol-sulphuric acid method 55
2.12 Statistical Analysis ........................................................................................ 56
CHAPTER THREE: INITIAL EXPERIMENTS ON FERMENTATION PERFORMANCE OF
SACCHAROMYCES CEREVISIAE IN MEDIA WITH HIGH SUGAR CONCENTRATIONS
3.1 Introduction ..................................................................................................... 57
3.1.1 General Introduction ................................................................................. 57
3.1.2 Yeast strains and culture condition ............................................................ 59
3.1.3 Specific growth conditions and experimental design .................................. 60
3.2 Results ........................................................................................................... 60
3.2.1 Growth parameters of different yeast strains grown in YNB with a high sugar
concentration .................................................................................................... 60
3.2.2 Growth of A12 in different media ............................................................... 63
3.2.3 Sugar utilization by the A12 yeast strain in different media ........................ 64
3.3 Discussion ...................................................................................................... 68
3.4 Conclusions .................................................................................................... 71
x
CHAPTER FOUR: COMPARISON OF MEMBRANE FLUIDITY AND ETHANOL
TOLERANCE OF DIFFERENT YEAST STRAINS
4.1 Introduction ..................................................................................................... 73
4.1.1 General introduction ................................................................................. 73
4.1.2 Yeast strains and culture conditions .......................................................... 74
4.1.3 Specific growth conditions and experimental design .................................. 74
4.2 Results ........................................................................................................... 75
4.2.1 Growth parameter comparisons ................................................................ 75
4.2.2 Membrane fluidity comparisons ................................................................. 79
4.2.3 Ethanol tolerance comparisons ................................................................. 81
4.2.4 Correlation between test parameters for different yeast strains .................. 83
4.3 Discussion ...................................................................................................... 88
4.3.1 Comparison of growth parameters ............................................................ 88
4.3.2 Membrane fluidity and ethanol tolerance ................................................... 89
4.4 Conclusions .................................................................................................... 94
CHAPTER FIVE: EFFECT OF PROLINE SUPPLEMENTATION ON ETHANOL
TOLERANCE
5.1 Introduction ..................................................................................................... 97
5.1.1 General Introduction ................................................................................. 97
5.1.2 Yeast strains and culture conditions .......................................................... 98
5.1.3 Specific growth conditions and experimental design .................................. 98
5.2 Results ........................................................................................................... 99
5.2.1 Generalized polarization in supplemented and unsupplemented cultures ... 99
5.2.2 Ethanol tolerance of yeast grown in supplemented and unsupplemented culture
....................................................................................................................... 102
5.3 Discussion .................................................................................................... 105
5.3.1 Effect of L-proline supplementation on membrane fluidity ........................ 105
5.3.2 Effect of L-proline supplementation on ethanol tolerance ......................... 106
5.4 Conclusions .................................................................................................. 107
xi
CHAPTER SIX: EFFECT OF INOSITOL SUPPLEMENTATION ON ETHANOL
TOLERANCE
6.1 Introduction ................................................................................................... 109
6.1.1 General Introduction ............................................................................... 109
6.1.2 Yeast strain and culture condition ........................................................... 110
6.1.3 Specific growth conditions and experimental design ................................ 111
6.2 Results ......................................................................................................... 112
6.2.1 Effect of inositol supplementation on Generalized Polarization ................ 112
6.2.2 Effect of inositol supplementation on ethanol tolerance ............................ 114
6.3 Discussion .................................................................................................... 117
6.4 Conclusions .................................................................................................. 118
CHAPTER SEVEN: GENERAL DISCUSSION AND FUTURE DIRECTIONS
7.1 Discussion .................................................................................................... 119
7.2 Conclusions and Contributions of This Study ................................................. 124
7.3 Future Directions .......................................................................................... 125
REFERENCES ..............................................................................................129
xii
LIST OF FIGURES
Figure 1.1 Phospholipids found in the plasma membrane of S.
cerevisiae.........................................................................
6
Figure 1.2 Pathways for synthesis of phospholipids in S.
cerevisiae.........................................................................
7
Figure 1.3 Major sphingolipids found in the S. cerevisiae plasma
membrane........................................................................
10
Figure 1.4 Chemical structure of ergosterol, the main sterol of
yeast plasma membranes................................................
12
Figure 1.5 General scheme illustrating the main principles of yeast
stress response to stress.................................................
13
Figure 1.6 Viability of the yeast floc populations after exposure to
20% (v/v) ethanol shock at 30°C. Different floc cell
sizes are indicated by different symbols in the
graph................................................................................
16
Figure 1.7 Effect of metal ion supplementation on cell viability after
ethanol stress (18% v/v, 1 h) of a self flocculating
yeast................................................................................
19
Figure 1.8 Biosynthesis and metabolism of L-proline in S.
cerevisiae. Genes encoding enzymes are shown in
parentheses.....................................................................
20
Figure 1.9 Relative numbers of viable cells of laboratory and sake
strains grown in SD medium without (A) or with 9% (B)
or with 18% (C) ethanol and incubated under static
conditions. The S. cerevisiae strains used were the
parent laboratory strain () and L-proline accumulating
laboratory mutant strain () and control strain () and
L-proline accumulating sake strain ()............................
22
Figure 1.10 Intracellular L-proline content of laboratory and sake
yeast strains grown in SD medium without (A) or with
(B) 9% ethanol and incubated under static conditions.
The S. cerevisiae strains used were the parent
laboratory strain () and L-proline accumulating
laboratory mutant strain () and control strain () and
L-proline accumulating sake strain ()............................
22
xiii
Figure 1.11 Changes in percentage of phospholipid species in the
yeast cells grown in the presence and absence of
inositol in the medium during fermentation. (A) 100
µg/mL added to fermentation medium (legend: PA (),
PC (), PE (▲), PI (), PS ()) or (B) no added
inositol (legend: PA (▲), PC (), PE (), PI (), PS
())..................................................................................
26
Figure 1.12 Changes in fatty acid composition during ethanol
production in the presence and absence of inositol ……
27
Figure 1.13 Effect of different levels of inositol supplementation on
cell growth and ethanol production of the yeast P.
tannophilus.....................................................................
28
Figure 1.14 Effect of different levels of inositol supplementation on
cell growth of P. tannophilus with initial ethanol
concentration as indicated in the figure legend...............
29
Figure 1.15 Scheme representing the diversity of sugar dissimilation
pathways in microorganisms, which each consist of
three levels of reactions. Numbers in circles represent
(1) the Embden-Meyerhof pathway otherwise known as
glycolysis, (2) the hexose monophosphate pathway and
(3) the Entner-Doudoroff pathway...................................
30
Figure 1.16 Scheme representing different pathways involved in
dissimilating glucose under aerobic conditions in
Crabtee-positive yeasts (represented by red arrows)
and Crabtee-negative yeasts (represented by green
arrows).............................................................................
32
Figure 1.17 Consumption of glucose (♦) and appearance of ethanol
(■) and biomass (▲) when yeast are grown in the
presence of glucose under aerobic conditions. (A) S.
cerevisiae (Crabtee-positive yeast) and (B) K. lactis
(Crabtee-negative yeast). The diauxic shift is indicated
by the green arrow in (A).................................................
34
xiv
Figure 1.18 Simplified Perrin-Jablonski energy level diagram
showing absorption (—) and emission (---) process as
well as thermalization and solvent relaxation..................
35
Figure 1.19 Absorption, excitation and emission spectrum of pyrene
sulfonic acid (pictured top right). Three excitation states
are observed for the molecule. Fluorescence occurred
when the molecule shifted from the lowest excitation
state (S1) to the ground state, resulting in a Stokes
shift......................................................................... .........
37
Figure 1.20 (A) Emission spectrum of laurdan in dilauroyl-
phosphatidylcholine (DLPC) vesicles as a function of
temperature from 0 to 60°C. (B) Colour changes of
laurdan dissolved in glycerol. The mixture of laurdan
and glycerol are frozen to -70°C (top), kept at on room
temperature (middle) and heated to 80°C
(bottom)...........................................................................
38
Figure 1.21 Diagram showing changes in membrane order when
cells are subjected to stress............................................
42
Figure 3.1
Fluorescence emission spectra of YEP and YNB,
excited at 340 nm............................................................
59
Figure 3.2 Growth parameters of PDM (♦), A12 (■) and A14 (▲)
yeast strains grown on YNB media with 16% sucrose.
(A) OD600nm (B) total cell number (C) viable cell number
(D) cell viability.................................................................
62
Figure 3.3 Sugar utilization by the three different yeast strains.
Cultures were grown in YNB medium with 16% (w/v)
glucose as carbon source under aerobic conditions at
30°C…………………………………………………………..
63
Figure 3.4 Growth parameters of the A12 yeast strain grown on
different media as indicated. Cultures were grown
under aerobic conditions at 30°C (A) OD600nm, (B) total
cell number, (C) viable cell number, (D) cell viability.…..
66
xv
Figure 3.5 Sugar utilization of A12 strain grown in different media.
Cultures were grown in different media as indicated on
figure legend. Cultures were grown under aerobic
conditions at 30°C. Cells grown in YNB16S were only
monitored for up to 96 h, as this experiment was
performed at the initial stage of experimentation, and as
a result it was decided to follow cultures for a longer
time in subsequent experiments......................................
67
Figure 4.1 Optical densities of three yeast strains during
fermentation. Cultures of the strains indicated were
grown in YNB medium with 2% (w/v) glucose as carbon
source under aerobic conditions at 30°C. Data are the
means of four independent experiments. Error bars
represent standard deviation...........................................
76
Figure 4.2 Comparison of total cell number (A), viable cell number
(B), budding rate (C) and cell viability (D) determined by
light microscopy for three different yeast strains, A12
(♦), PDM (■) and K7 (▲). Cultures were grown in YNB
medium with 2% (w/v) glucose as carbon source under
aerobic conditions at 30°C. Data are the means of four
independent experiments. Error bars represent
standard deviation.……………………………………………...
78
Figure 4.3 Glucose utilization and ethanol production by three
different yeast strains. Cultures of the yeast strain
indicated were grown in YNB medium with 2% (w/v)
glucose as carbon source under aerobic conditions at
30°C. Data are the means of four independent
experiments. Error bars represent standard
deviation...........................................................................
79
Figure 4.4 Generalized polarization of the three yeast strains at 6
and 24 hours of culture. Cultures of the yeast strain
indicated were grown under aerobic conditions in YNB
medium with 2% glucose as carbon source. Statistically
significant differences are indicated by the same letters
above the bars. Error bars represent standard
deviation……………………………………………………..
80
xvi
Figure 4.5 Viability reduction induced by ethanol stress as
determined by the total plate count (TPC) method. Cells
of the yeast strains indicated were grown in YNB
medium with 2% glucose under aerobic conditions at
30°C until the indicated time points. Then, they were
exposed to 18% v/v ethanol, and subsequently diluted
and grown on agar plates. Statistically significant
differences are indicated by the same letters above the
bars. Error bars represent standard deviation.................
81
Figure 4.6 Viability reduction induced by ethanol stress as
determined by the methylene violet staining method.
Cells of the yeast strains indicated were grown in YNB
medium with 2% glucose under anaerobic conditions at
30°C until the indicated time points. Then they were
exposed to 18% v/v ethanol. Cells were counted under
microscope (400 × magnification) after exposure to
18% v/v ethanol and staining using methylene violet in
sodium citrate solution. Statistically significant
differences are indicated by the same letters above the
bars. Error bars represent standard deviation...............
82
Figure 4.7 Scatter plot matrix correlating culture time and GP
values of three different yeast strains. Strains are
represented by different shapes and colours. Black
circles represent A12, blue triangles represent PDM
and red squares represent K7. Filled and empty shapes
represent data for 6 and 24 hours of culture,
respectively. Straight lines with corresponding colours
represent the individual linear correlation for each
strain, and the dashed line represents the total linear
correlation for all the data on the graph...........................
85
Figure 4.8 Scatter plot matrix correlating culture time and viability
reduction (as assessed by the total plate count (TPC)
method) values of three different yeast strains. Strains
are represented by different shapes and colours. Black
circles represent A12, blue triangles represent PDM
and red squares represent K7. Filled and empty shapes
represent data for 6 and 24 hours of culture,
respectively. Straight lines with corresponding colours
represent the individual linear correlation for each
strain, and the dashed line represents the total linear
correlation for all the data on the graph...........................
85
xvii
Figure 4.9 Scatter plot matrix correlating culture time and viability
reduction (as assessed by the methylene violet staining
method) values of three different yeast strains. Strains
are represented by different shapes and colours. Black
circles represent A12, blue triangles represent PDM
and red squares represent K7. Filled and empty shapes
represent data for 6 and 24 hour culture, respectively.
Straight lines with corresponding colours represent the
individual linear correlation for each strain, and the
dashed line represents the total linear correlation for all
the data on the graph.......................................................
86
Figure 4.10 Scatter plot matrix correlating GP and viability reduction
(as assessed by the total plate count (TPC) method)
values of three different yeast strains. Strains are
represented by different shapes and colours. Black
circles represent A12, blue triangles represent PDM
and red squares represent K7. Filled and empty shapes
represent data for 6 and 24 hours of culture,
respectively. Straight lines with corresponding colours
represent the individual linear correlation for each
strain, and the dashed line represents the total linear
correlation for all the data on the graph...........................
86
Figure 4.11 Scatter plot matrix correlating GP and viability reduction
(as assessed by the methylene violet staining method)
values of three different yeast strains. Strains are
represented by different shapes and colours. Black
circles represent A12, blue triangles represent PDM
and red squares represent K7. Filled and empty shapes
represent data at 6 and 24 hours of culture,
respectively. Straight lines with corresponding colours
represent the individual linear correlation for each
strain, and the dashed line represents the total linear
correlation for all the data on the graph...........................
87
xviii
Figure 4.12 Scatter plot matrix correlating viability reduction (as
assessed by TPC method) and viability reduction (as
assessed by methylene violet staining method) values
of three different yeast strains. Strains are represented
by different shapes and colours. Black circles represent
A12, blue triangles represent PDM and red squares
represent K7. Filled and empty shapes represent data
at 6 and 24 hours of culture, respectively. Straight lines
with corresponding colours represent the individual
linear correlation for each strain, and the dashed line
represents the total linear correlation for all the data on
the graph..........................................................................
87
Figure 5.1 Generalized polarization of yeast strains supplemented
with different levels of L-proline at 6 hours of culture.
Cultures were grown in YNB medium with 2% (w/v)
glucose under aerobic conditions at 30°C. Data are the
means of four independent experiments. Error bars
represent standard deviations.........................................
100
Figure 5.2 Generalized polarization of the PDM yeast strain at 6
hours of culture. Cultures were grown in YNB medium
with 2% (w/v) glucose under aerobic condition at 30°C.
Data presented on this graph are the same as Figure
5.1 for the PDM strain. Significant differences as
revealed by the Fisher LSD test are indicated by the
same letters above the bars. Data are the means of
four independent experiments with. Error bars represent
standard deviations..........................................................
101
Figure 5.3 Generalized polarization of yeast strains supplemented
with different levels of L-proline at 24 hours of culture.
Cultures were grown in YNB medium with 2% (w/v)
glucose under aerobic conditions at 30°C. Data are the
means of four independent experiments. Error bars
represent standard deviations.........................................
102
Figure 5.4 Viability reduction as determined by the total plate
count method at 6 hours of culture L-proline-
supplemented and -unsupplemented yeasts. Cultures
were grown in YNB medium with 2% (w/v) glucose
under aerobic conditions at 30°C. Data are the means
of two independent experiments. Error bars represent
standard deviation...........................................................
103
xix
Figure 5.5 Viability reduction as determined by the total plate
count method of 24 hours of culture for L-proline-
supplemented and -unsupplemented yeasts. Cultures
were grown in YNB medium with 2% (w/v) glucose
under aerobic conditions at 30°C. Data are the means
of three independent experiments. Error bars represent
standard deviation...........................................................
103
Figure 5.6 Viability reduction as determined by the methylene
violet staining method at 6 hours of culture for L-proline-
supplemented and -unsupplemented yeasts. Cultures
were grown in YNB medium with 2% (w/v) glucose
under aerobic conditions at 30°C. Data are the means
of four independent experiments. Error bars represent
standard deviation...........................................................
104
Figure 5.7 Viability reduction as determined by the methylene
violet staining method at 24 hours of culture for L-
proline-supplemented and -unsupplemented yeasts.
Cultures were grown in YNB medium with 2% (w/v)
glucose under aerobic conditions at 30°C. Data are the
means of four independent experiments. Error bars
represent standard deviation...........................................
105
Figure 6.1 Generalized polarization of yeast strains grown in
inositol-supplemented and -unsupplemented media at 6
hours of culture. Cultures were grown in YNB medium
with 2% (w/v) glucose under aerobic conditions at 30°C.
Data are the means of four independent experiments.
Error bars represent standard deviations........................
113
Figure 6.2 Generalized polarization of yeast strains grown in
inositol-supplemented and -unsupplemented media at
24 hours of culture. Cultures were grown in YNB
medium with 2% (w/v) glucose under aerobic conditions
at 30°C. Data are the means of four independent
experiments. Error bars represent standard deviations...
113
xx
Figure 6.3 Viability reduction of yeast cells grown in inositol-
supplemented and -unsupplemented media at 6 hours
of culture. Viability reduction was determined by the
TPC method after exposing yeast cells to 18% v/v
ethanol. Cultures were grown in YNB medium with 2%
(w/v) glucose under aerobic conditions at 30°C. Data
are the means of two independent experiments. Error
bars represent standard deviations.................................
114
Figure 6.4 Viability reduction of yeast cells grown in inositol-
supplemented and -unsupplemented media at 24 hours
of culture. Viability reduction was determined by the
TPC method after exposing yeast cells to 18% v/v
ethanol. Cultures were grown in YNB medium with 2%
(w/v) glucose under aerobic conditions at 30°C. Data
are the means of three independent experiments. Error
bars represent standard deviations.................................
115
Figure 6.5 Viability reduction of yeast cells grown in inositol-
supplemented or -unsupplemented media at 6 hours of
culture. Viability reduction was determined by the
methylene violet staining method after exposing yeast
cells to 18% v/v ethanol. Cultures were grown in YNB
medium with 2% (w/v) glucose under aerobic conditions
at 30°C. Data are the means of four independent
experiments. Error bars represent standard deviations...
116
Figure 6.6 Viability reduction of yeast cells grown in inositol -
supplemented and -unsupplemented media at 24 hours
of culture. Viability reduction was determined by the
methylene violet staining method after exposing yeast
cells to 18% v/v ethanol. Cultures were grown in YNB
medium with 2% (w/v) glucose under aerobic conditions
at 30°C. Data are the means of four independent
experiments. Error bars represent standard deviations...
116
xxi
LIST OF TABLES
Table 1.1 Phospholipid composition of the S. cerevisiae plasma
membrane..........................................................................
7
Table 1.2 Composition of fatty acids in S. cerevisiae plasma
membranes........................................................................
11
Table 1.3 Effect of anaerobiosis and pH on the intracellular
accumulation of L-proline...................................................
24
Table 1.4 Anisotropy values for the plasma membranes of yeast
cells subjected to ethanol shock with or without prior
culture in the presence of 10% ethanol measured using
DPH as a membrane probe...............................................
43
Table 2.1 Yeast strains used in the present study and their
properties……………………………………………………...
47
Table 4.1 Pearson correlation coefficients between time, GP,
viability reduction by TPC and viability reduction by
Methylene violet staining for all strains..............................
84
1
CHAPTER ONE: LITERATURE REVIEW AND
BACKGROUND
1.1 Introduction
Production of ethanol as a fossil fuel replacement has become more
important because of the decrease in the availability of fossil fuels, their
increasing price and also environmental issues (Bai, Anderson & Moo-Young
2008; Thomsen, Medina & Ahring 2003). Ethanol derived from plant sources is
known as bioethanol, and is mainly produced from sugar rich feedstocks such as
molasses, cellulose or starch (Thomsen, Medina & Ahring 2003). These
feedstocks are converted to bioethanol through fermentation by microorganisms,
especially baker’s yeast (Saccharomyces cerevisiae). Recently the bacterium
Zymomonas mobilis has also been exploited for the fermentation process
(Cazetta et al. 2007; Dien, Cotta & Jeffries 2003). However, S. cerevisiae is still
preferred over Z. mobilis (Bai, Anderson & Moo-Young 2008; Dien, Cotta &
Jeffries 2003). Bai, Anderson & Moo-Young (2008) summarized reasons why Z.
mobilis is not suitable for industrial application. Firstly, Z. mobilis has narrow
substrate preference, utilizing D-glucose, D-fructose and sucrose. When sucrose
is used as a substrate, formation of by products lowers ethanol productivity.
Therefore, Z. mobilis is not suitable for industrial feedstocks with complex mixture
of sugars. Secondly, even though Z. mobilis is recognized as a generally
recognized as safe (GRAS) microorganism, unlike S. cerevisiae, Z. mobilis is not
generally accepted for animal feed, and therefore it will generate problems for
utilization of biomass waste if S. cerevisiae is replaced by Z. mobilis in industrial
ethanol production. Lastly, Z. mobilis is reported to be oscillatory (cycles of
increase and decrease of metabolites during fermentation) when applied in
continuous fermentation, indicated by cycling of concentrations of either substrate
2
or product under a particular condition. This property eventually inhibits sugar
utilization and ethanol production. Therefore S. cerevisiae is still extensively used
for industrial bioethanol production (Bai, Anderson & Moo-Young 2008).
The requirement for highly efficient processes of bioethanol production has
led to the need for yeasts with capability for high levels of ethanol production.
However, high ethanol concentrations cause a problem, in that the fermentative
microorganisms have limited ethanol tolerance, which therefore limits the ethanol
produced during the fermentation process (Ingram 1986). Many efforts have been
conducted to increase the ethanol tolerance and fermentative efficiency of
yeasts, to improve their capability to produce high levels of ethanol (Chi,
Kohlwein & Paltauf 1999; Takagi et al. 2005; Xue et al. 2008).
Genetically modified yeasts have been introduced by several investigators.
Metabolic pathways of these yeasts were improved so that they can tolerate
various stresses during the fermentation process and produce higher
concentrations of ethanol. Genetic modifications of the yeast include changes to
yeast protein expression leading to increasing unsaturation index of membrane
fatty acids (Kajiwara et al. 2000; You, Rosenfield & Knipple 2003) or yeast
accumulation of specific metabolites that increase stress tolerance (Takagi et al.
2005; Terao, Nakamori & Takagi 2003).
Other investigators have modified the growth medium by adding components
that have been shown to be protective agents against various stresses. These
components include minerals (Xue et al. 2008), trehalose (Hottiger et al. 1994),
inositol (Chi, Kohlwein & Paltauf 1999; Ji et al. 2008) and proline (Takagi 2008;
Takagi et al. 2005).
A combination of both genetic modification and modification of growth
medium has also been performed (Krause et al. 2007; Takagi et al. 2000; Takagi
et al. 2005). These experiments indicated improved performance of ethanol
3
production by increasing tolerance of the yeast against various stresses, such as
heat, freezing, high osmotic pressure and high ethanol concentration. By
increasing the yeast tolerance against various stress factors, the yeast can
continue to produce ethanol in the presence of these stresses during the
fermentation. This can lead to continued conversion and to higher concentrations
of ethanol produced in the fermentation process, further decreasing the cost of
the distillation process, a very important consideration in industrial process.
The current study emphasizes the effect of growth media on the ethanol
tolerance of yeast. The two supplements investigated in this study are inositol
and L-proline. Inositol has been shown to have protective properties against
ethanol stress (Chi, Kohlwein & Paltauf 1999; Furukawa et al. 2004). Proline
supplementation has been investigated in S. cerevisiae that have disrupted
proline synthesis, but at only one concentration (Takagi 2008; Takagi et al. 2005).
Inositol supplementation has been investigated in Saccharomyces yeasts, but at
only one concentration; either 75 µM (Krause et al. 2007) or 100 µg/mL (Chi,
Kohlwein & Paltauf 1999). Inositol supplementation has been investigated at
several concentrations in a non-Saccharomyces yeast (Ji et al. 2008). Thus none
of the previous studies have investigated the influence of different concentrations
of the supplements proline or inositol on S. cerevisiae health.
L-proline has also been shown to lead to protection against various stresses,
including freezing, desiccation, oxidation, and ethanol (Takagi 2008).
Nevertheless, previous studies mainly used genetic engineering to modify the
metabolic pathway of the yeast so that it can accumulate high concentrations of
L-proline inside the cell (Takagi 2008; Takagi et al. 2000; Takagi et al. 2005). It
has been shown that S. cerevisiae has the capacity to assimilate extracellular L-
proline under aerobic conditions with limited assimilation under anaerobic
conditions (Horak & Kotyk 1986; Ingledew, Magnus & Solsuski 1987). Focussing
4
on the role of L-proline as an osmoprotectant, Thomas, Hynes & Ingledew (1994)
showed that L-proline supplementation stimulated yeast growth and improved
viability and ethanol productivity; however, they did not report effects on ethanol
tolerance per se. Thus there are no published reports which specifically address
the influence of extracellular L-proline on ethanol tolerance.
The major objective of this study was the identification of appropriate yeast
strains and culture conditions to improve the efficiency of bioethanol production,
leading to increased amounts of ethanol produced by the fermentation process.
In addition to increasing the efficiency of this phase of manufacture, increased
ethanol production will decrease the cost and energy expenditure of the
distillation phase. The ultimate goal of this study is to improve the efficiency of
bioethanol production, thereby lowering the cost, inputs and waste.
1.2 The Yeast Plasma Membrane
The plasma membrane of eukaryotic cells, including yeast, is one of the most
important constituents of the cell (Nipper 2007). The membranes are thin,
flexible, and relatively stable sheet-like structures that covers all living cells and
organisms (McKee & McKee 2003). The yeast plasma membrane is about
7.5 nm in width (van der Rest et al. 1995). It is the first barrier that separates the
cell from the environment and therefore becomes the first component to be
damaged when the cell is exposed to various environmental stresses (Learmonth
2011; Learmonth & Gratton 2002; Rodrıguez-Vargas et al. 2007). The plasma
membrane also has functions for transporting substances in to and out of the
cells, signal transduction, maintaining the shape of the cells, interaction among
cells and overall metabolism of the cells (Elliot & Elliot 1997; Nipper 2007).
Like other biological membranes, the yeast plasma and intracellular
membranes are also composed of various types of membrane lipid (Nipper
5
2007). Basically, they are lipid bilayers composed of phospholipids, sterols and
other lipid molecules, in which various proteins are inserted. Phospholipid
structures are composed of two distinctive parts that make them suitable for their
structural roles; a hydrophilic ―head‖ group and hydrophobic part composed of
two fatty acid chains (McKee & McKee 2003). The membrane proteins give
special abilities to membrane such as molecule and ion transport, energy
generation and signal transduction. The amount and type of proteins in specific
cell membranes are different, depending on the environment of the cell (McKee
& McKee 2003).
1.2.1 Phospholipids
Phospholipids are the main component of the yeast plasma membrane. Most
phospholipids are phosphoglycerides, with the sphingolipid sphingosine also
present in some membranes. A phosphoglyceride is composed of a glycerol with
sn1 and sn2 positions esterified to fatty acids, and the sn3 position attached to a
phosphate group which may then be attached to a hydrophilic molecule (Beltran
2005; Daum et al. 1998). The fatty acids may vary in length and unsaturation. A
saturated fatty acid is commonly present on the sn1 position, with the sn2
position commonly occupied by an unsaturated fatty acid (Beltran 2005). Palmitic
(16:0), stearic (18:0), palmitoleic (16:1) and oleic (18:1) acids are the most
abundant fatty acids found in the phospholipids (Beltran 2005). Minor amounts of
myristic (14:0) and C-26 fatty acid have also been found in S. cerevisiae
membranes (Daum et al. 1998).
One hydroxyl group of the phosphate can be linked to a polar molecule and
make up the hydrophilic part of the phospholipids which is responsible for certain
physical properties of the phospholipids. The head group component can be used
as a basis of classification (Daum et al. 1998). The main polar molecules
6
attached to the phosphate group of phospholipids in the yeast plasma membrane
are ethanolamine, choline, serine and inositol (Beltran 2005). The leaflet of the
lipid bilayer facing the interior of the cell is rich in phosphatidylethanolamine (PE),
phosphatidylinositol (PI) and phosphatidylserine (PS), while the external leaflet is
rich in phosphatidylcholine (PC) and sphingolipids (van der Rest et al. 1995).
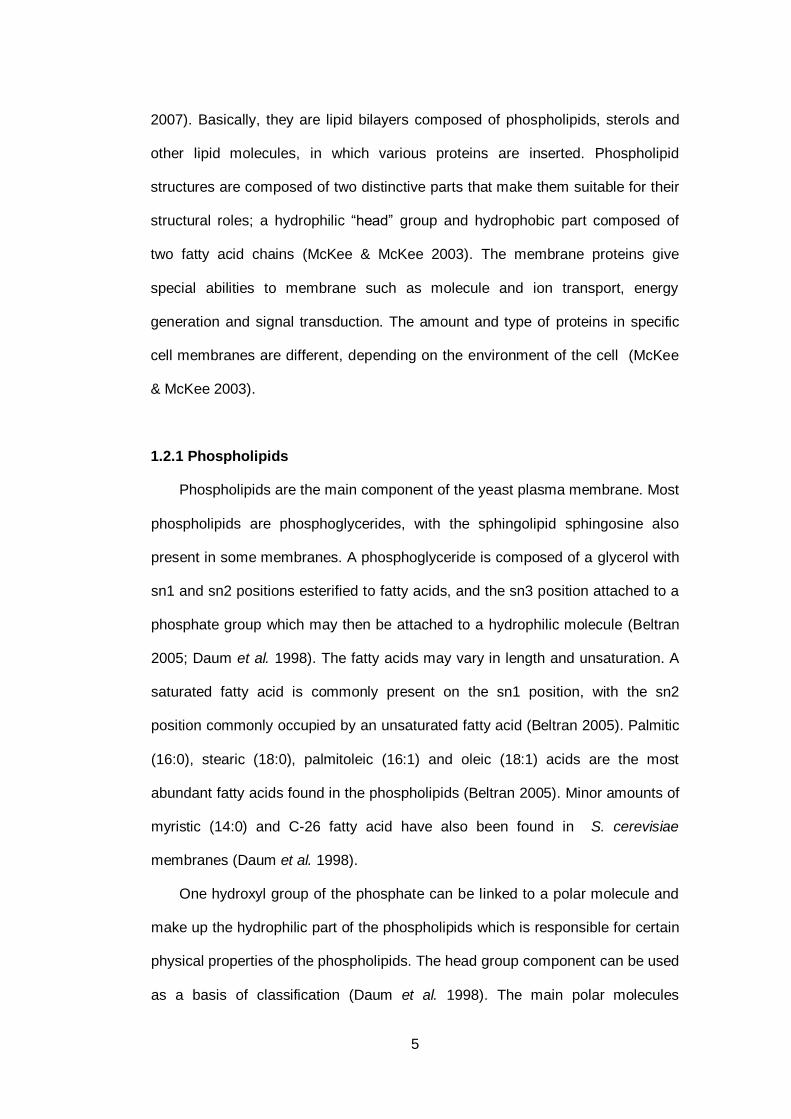
Figure 1.1 shows the main classes of phospholipids of S. cerevisiae.
Figure 1.1 Phospholipids found in the plasma membrane of S. cerevisiae (from van der
Rest et al. 1995)
Several authors have reported different compositions of S. cerevisiae plasma
membrane phospholipids. The composition of phospholipids in the plasma
membrane can be different due to differences in yeast strain, growth conditions,
lipid extraction procedures etc. (van der Rest et al. 1995). The composition of
plasma membrane phospholipids from several reports are presented in Table 1.1.
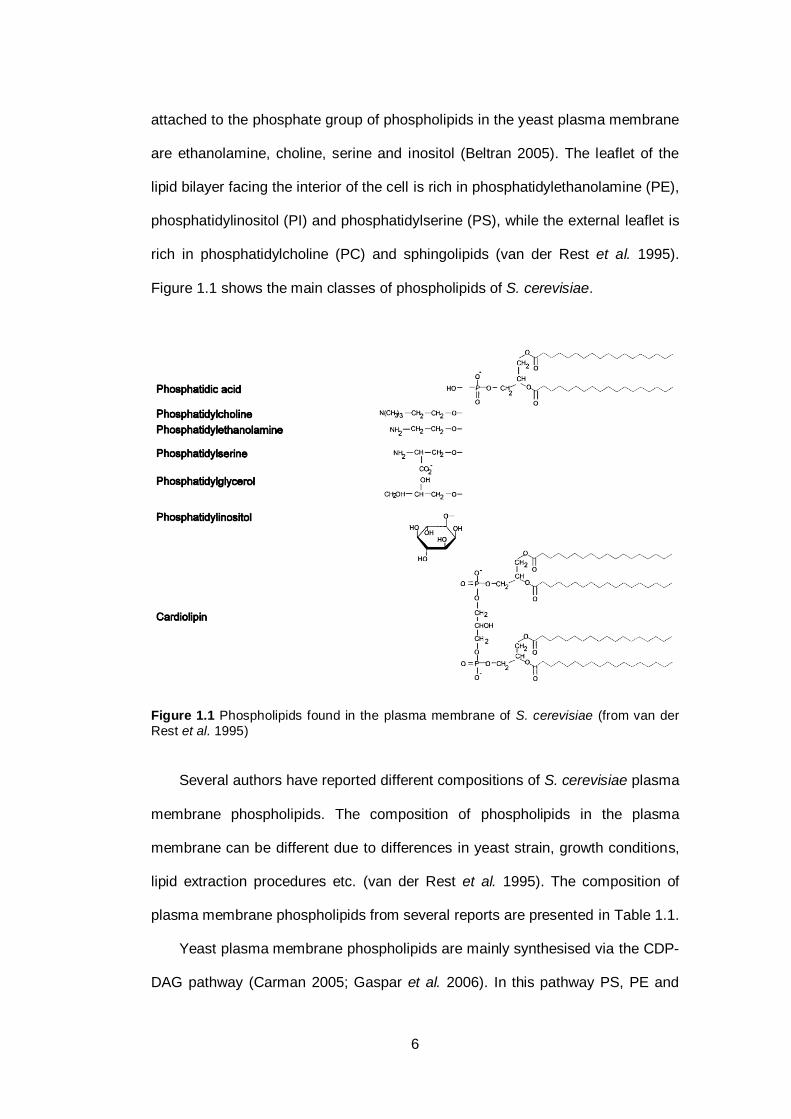
Yeast plasma membrane phospholipids are mainly synthesised via the CDP-
DAG pathway (Carman 2005; Gaspar et al. 2006). In this pathway PS, PE and
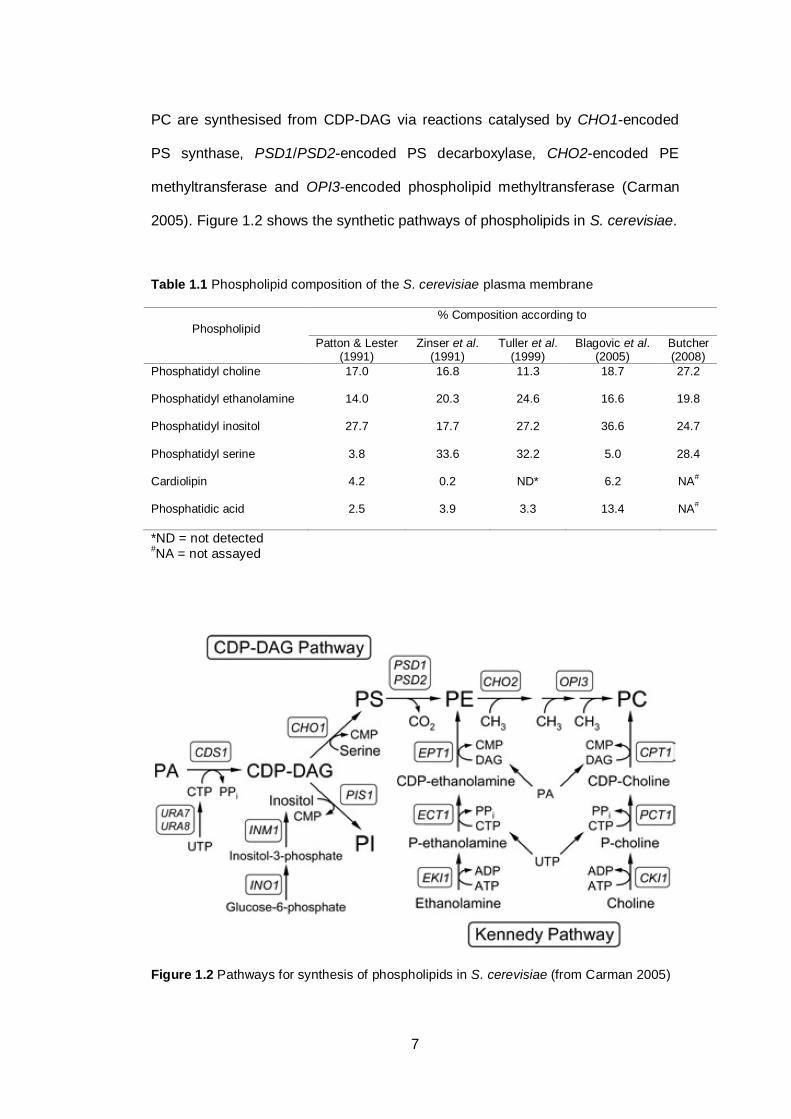
7
PC are synthesised from CDP-DAG via reactions catalysed by CHO1-encoded
PS synthase, PSD1/PSD2-encoded PS decarboxylase, CHO2-encoded PE
methyltransferase and OPI3-encoded phospholipid methyltransferase (Carman
2005). Figure 1.2 shows the synthetic pathways of phospholipids in S. cerevisiae.
Table 1.1 Phospholipid composition of the S. cerevisiae plasma membrane
Phospholipid % Composition according to
Patton & Lester (1991)
Zinser et al. (1991)
Tuller et al. (1999)
Blagovic et al. (2005)
Butcher (2008)
Phosphatidyl choline 17.0 16.8 11.3 18.7 27.2
Phosphatidyl ethanolamine 14.0 20.3 24.6 16.6 19.8
Phosphatidyl inositol 27.7 17.7 27.2 36.6 24.7
Phosphatidyl serine 3.8 33.6 32.2 5.0 28.4
Cardiolipin 4.2 0.2 ND* 6.2 NA#
Phosphatidic acid 2.5 3.9 3.3 13.4 NA#
*ND = not detected #NA = not assayed
Figure 1.2 Pathways for synthesis of phospholipids in S. cerevisiae (from Carman 2005)
8
The present study investigates the influence of inositol supplementation
on ethanol tolerance of the yeast. The presence of inositol in the growth medium
has been shown to influence the levels of PC. According to Gaspar et al. (2006),
inositol addition increases PC turnover. When the medium was supplemented by
inositol, the PI proportion increased and the PC proportion decreased, while no
significant changes were observed for other phospholipid classes. Inositol can act
as a noncompetitive inhibitor at the major pathway branch point by inhibiting PS
synthase. This inhibition occurs by lowering the amount of CDP-DAG available
for PC formation, since the same substrate is used by PIS1-encoded
phosphatidylinositol synthase to form PI (Gaspar et al. 2006). Thus the presence
of inositol in growth media will lead to a higher rate of PI synthesis and lower rate
of PS synthesis. This may affect the formation of other phospholipids, i.e. PE and
PC, since these two phospholipids are the products of the next step of PS
processing in the CDP-DAG pathways (Gaspar et al. 2006). Eventually, the
presence of inositol may alter the composition of the yeast membrane
phospholipids. Other changes in phospholipid composition have been reported
following inositol supplementation (Chi, Kohlwein & Paltauf 1999; Gaspar et al.
2006). In the presence of inositol, the PI content increased while PC and PE
levels decreased (Chi, Kohlwein & Paltauf 1999). However, Carman (2005)
suggested that it is possible to compensate for the lowered availability of PS as a
substrate by activating the Kennedy pathway. Further studies are still needed to
confirm this hypothesis (Carman 2005). Increased levels of membrane PI could
contribute to increased signalling activity by PI – based signalling pathways,
thereby contributing to enhanced stress responses.
9
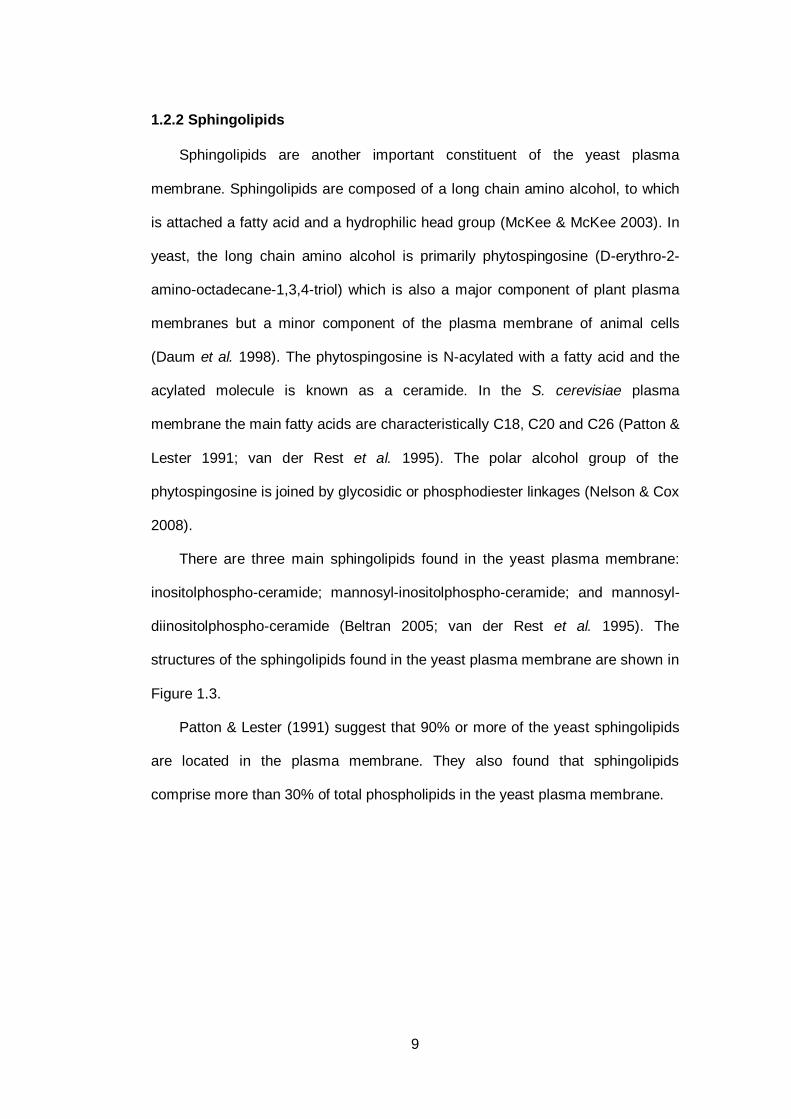
1.2.2 Sphingolipids
Sphingolipids are another important constituent of the yeast plasma
membrane. Sphingolipids are composed of a long chain amino alcohol, to which
is attached a fatty acid and a hydrophilic head group (McKee & McKee 2003). In
yeast, the long chain amino alcohol is primarily phytospingosine (D-erythro-2-
amino-octadecane-1,3,4-triol) which is also a major component of plant plasma
membranes but a minor component of the plasma membrane of animal cells
(Daum et al. 1998). The phytospingosine is N-acylated with a fatty acid and the
acylated molecule is known as a ceramide. In the S. cerevisiae plasma
membrane the main fatty acids are characteristically C18, C20 and C26 (Patton &
Lester 1991; van der Rest et al. 1995). The polar alcohol group of the
phytospingosine is joined by glycosidic or phosphodiester linkages (Nelson & Cox
2008).
There are three main sphingolipids found in the yeast plasma membrane:
inositolphospho-ceramide; mannosyl-inositolphospho-ceramide; and mannosyl-
diinositolphospho-ceramide (Beltran 2005; van der Rest et al. 1995). The
structures of the sphingolipids found in the yeast plasma membrane are shown in
Figure 1.3.
Patton & Lester (1991) suggest that 90% or more of the yeast sphingolipids
are located in the plasma membrane. They also found that sphingolipids
comprise more than 30% of total phospholipids in the yeast plasma membrane.
10
Figure 1.3 Major sphingolipids found in the S. cerevisiae plasma membrane (from van
der Rest et al. 1995)
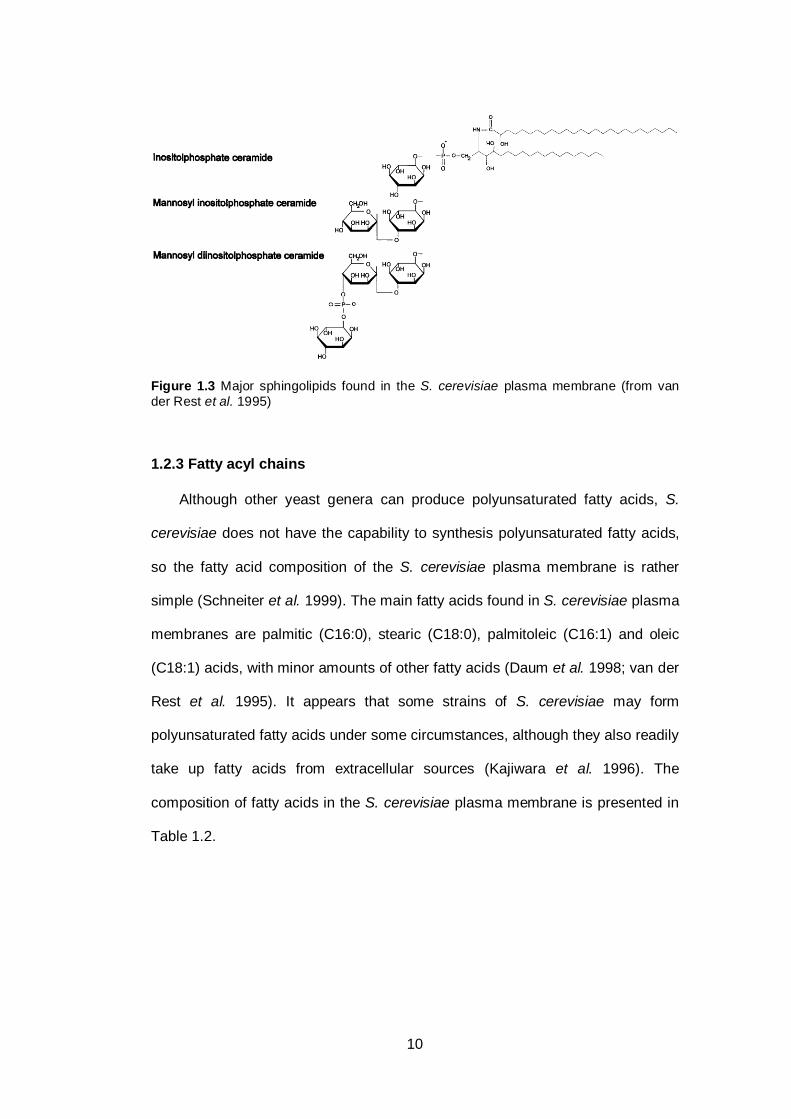
1.2.3 Fatty acyl chains
Although other yeast genera can produce polyunsaturated fatty acids, S.
cerevisiae does not have the capability to synthesis polyunsaturated fatty acids,
so the fatty acid composition of the S. cerevisiae plasma membrane is rather
simple (Schneiter et al. 1999). The main fatty acids found in S. cerevisiae plasma
membranes are palmitic (C16:0), stearic (C18:0), palmitoleic (C16:1) and oleic
(C18:1) acids, with minor amounts of other fatty acids (Daum et al. 1998; van der
Rest et al. 1995). It appears that some strains of S. cerevisiae may form
polyunsaturated fatty acids under some circumstances, although they also readily
take up fatty acids from extracellular sources (Kajiwara et al. 1996). The
composition of fatty acids in the S. cerevisiae plasma membrane is presented in
Table 1.2.
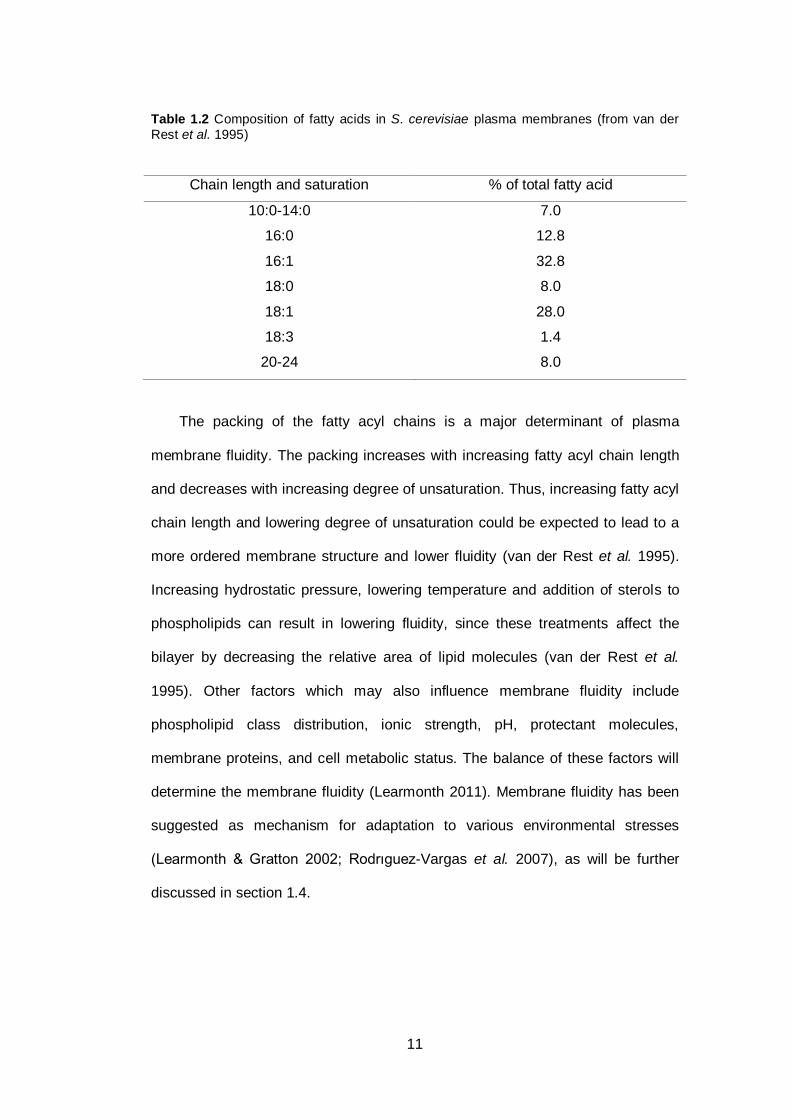
11
Table 1.2 Composition of fatty acids in S. cerevisiae plasma membranes (from van der
Rest et al. 1995)
Chain length and saturation % of total fatty acid
10:0-14:0 7.0
16:0 12.8
16:1 32.8
18:0 8.0
18:1 28.0
18:3 1.4
20-24 8.0
The packing of the fatty acyl chains is a major determinant of plasma
membrane fluidity. The packing increases with increasing fatty acyl chain length
and decreases with increasing degree of unsaturation. Thus, increasing fatty acyl
chain length and lowering degree of unsaturation could be expected to lead to a
more ordered membrane structure and lower fluidity (van der Rest et al. 1995).
Increasing hydrostatic pressure, lowering temperature and addition of sterols to
phospholipids can result in lowering fluidity, since these treatments affect the
bilayer by decreasing the relative area of lipid molecules (van der Rest et al.
1995). Other factors which may also influence membrane fluidity include
phospholipid class distribution, ionic strength, pH, protectant molecules,
membrane proteins, and cell metabolic status. The balance of these factors will
determine the membrane fluidity (Learmonth 2011). Membrane fluidity has been
suggested as mechanism for adaptation to various environmental stresses
(Learmonth & Gratton 2002; Rodrıguez-Vargas et al. 2007), as will be further
discussed in section 1.4.
12
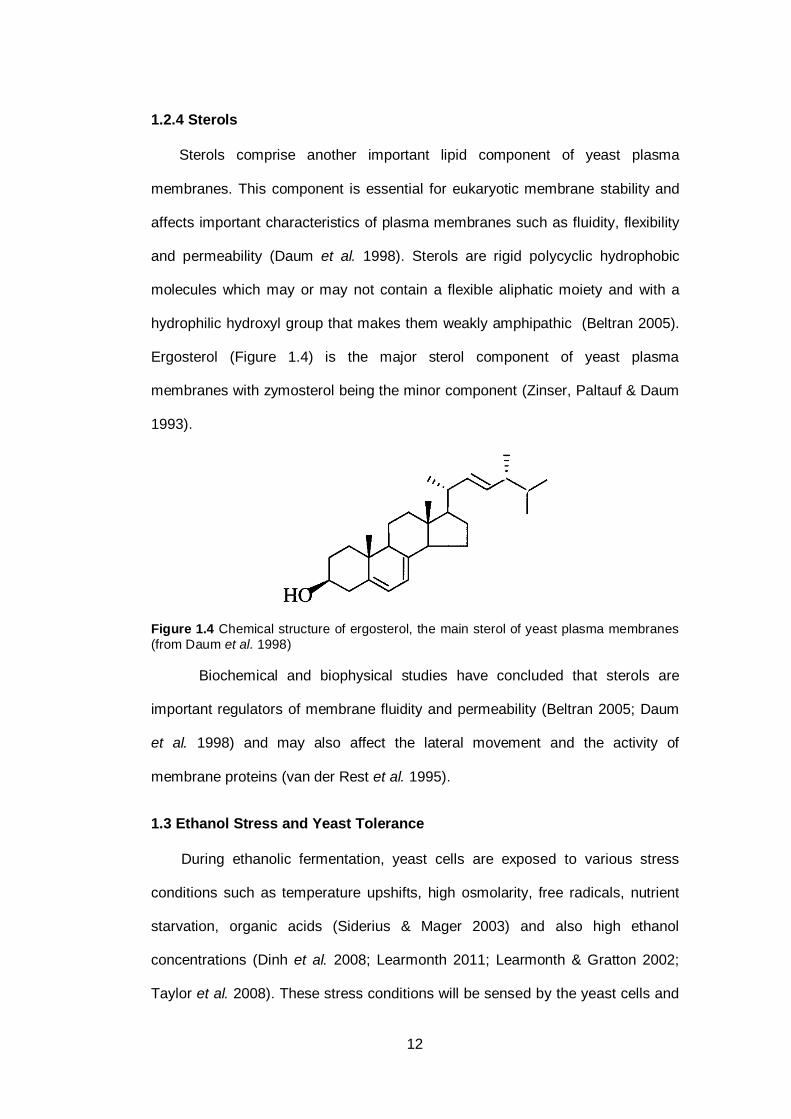
1.2.4 Sterols
Sterols comprise another important lipid component of yeast plasma
membranes. This component is essential for eukaryotic membrane stability and
affects important characteristics of plasma membranes such as fluidity, flexibility
and permeability (Daum et al. 1998). Sterols are rigid polycyclic hydrophobic
molecules which may or may not contain a flexible aliphatic moiety and with a
hydrophilic hydroxyl group that makes them weakly amphipathic (Beltran 2005).
Ergosterol (Figure 1.4) is the major sterol component of yeast plasma
membranes with zymosterol being the minor component (Zinser, Paltauf & Daum
1993).
Figure 1.4 Chemical structure of ergosterol, the main sterol of yeast plasma membranes
(from Daum et al. 1998)
Biochemical and biophysical studies have concluded that sterols are
important regulators of membrane fluidity and permeability (Beltran 2005; Daum
et al. 1998) and may also affect the lateral movement and the activity of
membrane proteins (van der Rest et al. 1995).
1.3 Ethanol Stress and Yeast Tolerance
During ethanolic fermentation, yeast cells are exposed to various stress
conditions such as temperature upshifts, high osmolarity, free radicals, nutrient
starvation, organic acids (Siderius & Mager 2003) and also high ethanol
concentrations (Dinh et al. 2008; Learmonth 2011; Learmonth & Gratton 2002;
Taylor et al. 2008). These stress conditions will be sensed by the yeast cells and
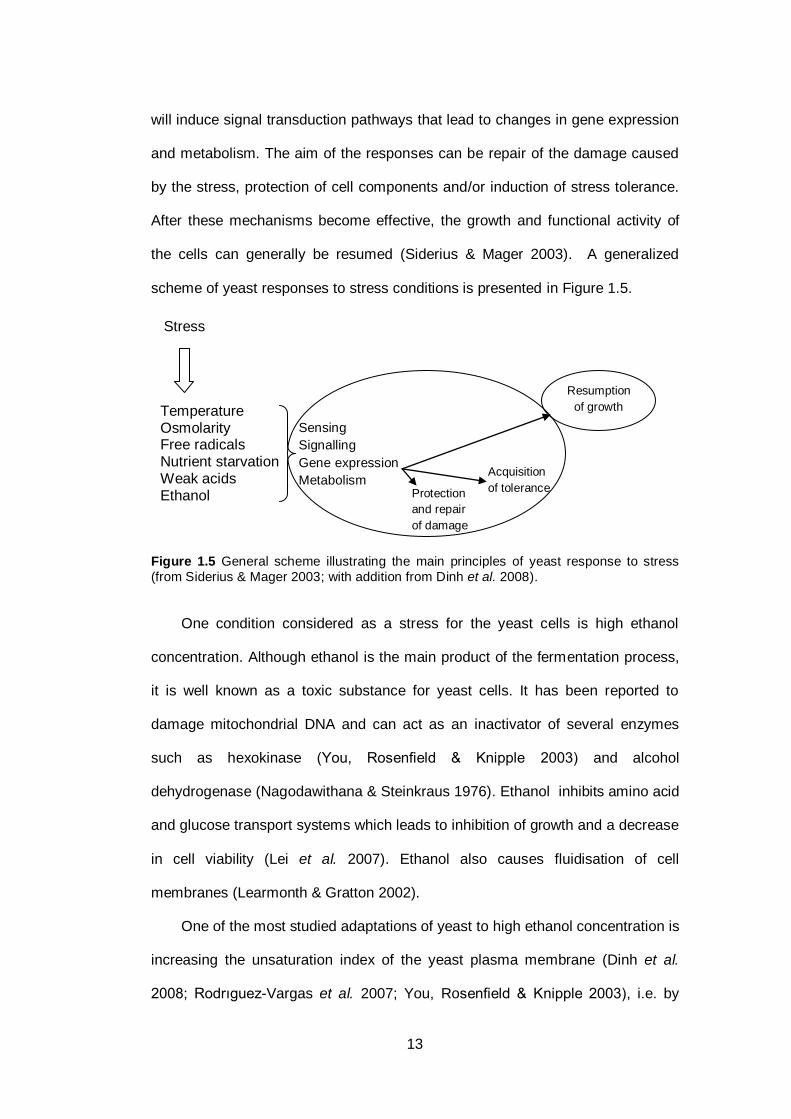
13
will induce signal transduction pathways that lead to changes in gene expression
and metabolism. The aim of the responses can be repair of the damage caused
by the stress, protection of cell components and/or induction of stress tolerance.
After these mechanisms become effective, the growth and functional activity of
the cells can generally be resumed (Siderius & Mager 2003). A generalized
scheme of yeast responses to stress conditions is presented in Figure 1.5.
Figure 1.5 General scheme illustrating the main principles of yeast response to stress
(from Siderius & Mager 2003; with addition from Dinh et al. 2008).
One condition considered as a stress for the yeast cells is high ethanol
concentration. Although ethanol is the main product of the fermentation process,
it is well known as a toxic substance for yeast cells. It has been reported to
damage mitochondrial DNA and can act as an inactivator of several enzymes
such as hexokinase (You, Rosenfield & Knipple 2003) and alcohol
dehydrogenase (Nagodawithana & Steinkraus 1976). Ethanol inhibits amino acid
and glucose transport systems which leads to inhibition of growth and a decrease
in cell viability (Lei et al. 2007). Ethanol also causes fluidisation of cell
membranes (Learmonth & Gratton 2002).
One of the most studied adaptations of yeast to high ethanol concentration is
increasing the unsaturation index of the yeast plasma membrane (Dinh et al.
2008; Rodrıguez-Vargas et al. 2007; You, Rosenfield & Knipple 2003), i.e. by
Resumption
of growth
Stress
Temperature Osmolarity Free radicals Nutrient starvation Weak acids Ethanol
Sensing
Signalling
Gene expression
Metabolism
Protection
and repair
of damage
Acquisition
of tolerance
14
increasing the proportion of unsaturated fatty acid in the yeast plasma
membrane. Since the fatty acid composition of the yeast plasma membrane is
rather simple (mainly composed of palmitic (C16:0), stearic (C18:0), palmitoleic
(C16:1) and oleic (C18:1) acids), the changes of these fatty acids in the presence
of high ethanol concentration can be simply monitored.
Increasing ethanol concentration leads to increasing the amounts of
monounsaturated fatty acids in the phospholipid component of the plasma
membrane with corresponding decreasing amounts of saturated fatty acids,
which in turn leads to a higher unsaturation index. Alexandre, Rousseaux &
Charpentier (1994) found that in the presence of high ethanol concentration, the
amount of C18:1 was increased dramatically while C16:1 did not change
significantly. This change was associated with a decrease of C16:0 and C18:0,
with the former showing the most dramatic changes. Their work showed that the
unsaturation index was increased by ~30% in the presence of ethanol.
Interestingly, while the unsaturation index went up, the average length of the fatty
acyl chains increased, with a decrease in C16:0 and increase in C18:1.
Changes in ergosterol composition of the plasma membrane have also been
observed when yeasts are grown in the presence or absence of ethanol. The
proportion of ergosterol in yeast cells increases at the expense of other sterols
when grown in the presence of ethanol. This suggests that ethanol tolerance is
highly correlated with high proportions of ergosterol. Determination of
sterol:protein and sterol:phospholipid ratios revealed that both ratios were
decreased relative to control when the yeast were grown in the presence of
ethanol. These changes combined to increase the measured fluidity of the
plasma membrane (Alexandre, Rousseaux & Charpentier 1994).
Some researchers also reported morphological differences in yeast cells
related to ethanol tolerance (Canetta, Adya & Walker 2006; Dinh et al. 2008; Lei
15
et al. 2007). These studies showed that upon exposure to stepwise increasing
ethanol concentrations, yeast adapt by increasing their size. Ethanol-adapted
strains were observed to have larger cell size than non-adapted strains. While the
shortest diameter of adapted and non-adapted cells were similar, clear
differences were seen in the longest diameter (Dinh et al. 2008). In contrast,
Canetta, Adya & Walker (2006) found that upon acute exposure to 30% ethanol
yeast cells exhibited shrinkage and cell surface roughness as detected by atomic
force microscopy.
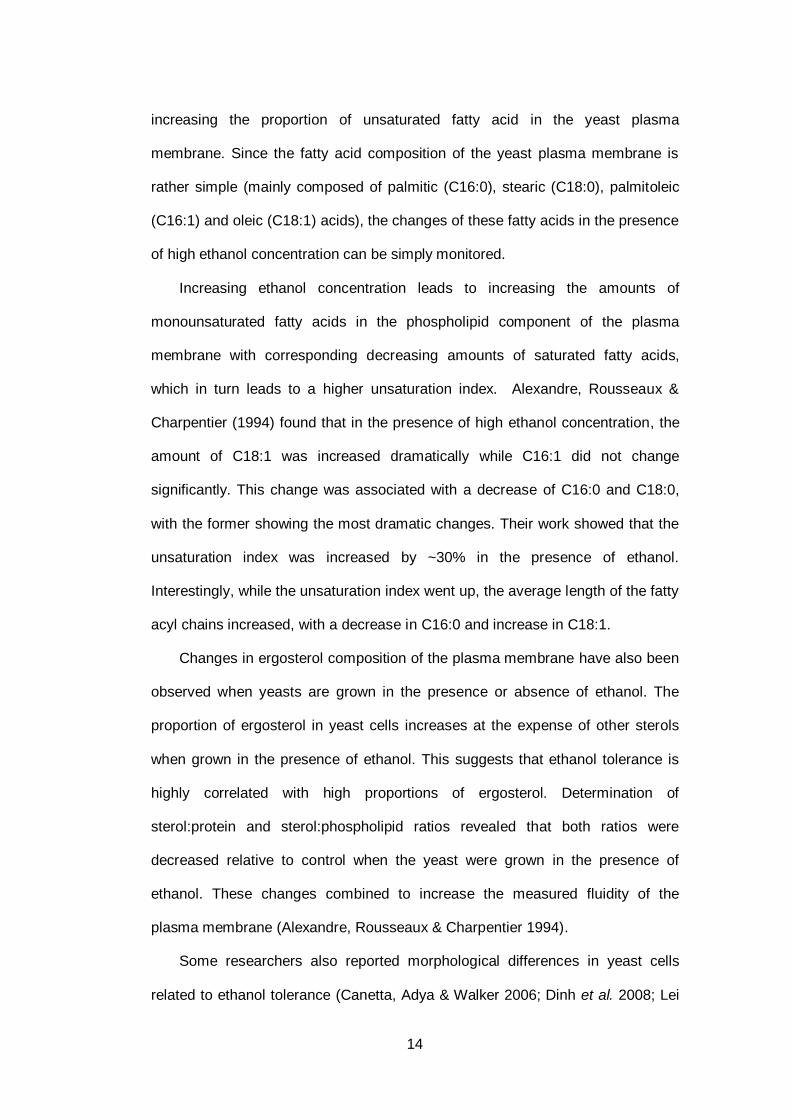
Manipulation of floculence by adjusting mechanical stirring rates in a
bioreactor resulted in different floc populations containing yeast of different size
and different ethanol tolerance. Lei et al. (2007) compared four different yeast
floc sizes (100, 200, 300 and 400 µm) and found that the floc population with the
smallest cell size showed the lowest ethanol tolerance. The ethanol tolerance
was found to increase with increasing floc cell size up to 300 µm, while further
increases in floc cell size resulted in decreasing ethanol tolerance (Lei et al.
2007). Figure 1.6 presents the influence of different yeast floc cell size on ethanol
tolerance of the yeast.
16
Figure 1.6 Viability of the yeast floc populations after exposure to 20% (v/v) ethanol
shock at 30°C. Different floc cell sizes are indicated by different symbols in the graph (from Lei et al. 2007).
The same study also confirmed a positive effect of ergosterol on ethanol
tolerance. Cell ergosterol content followed the same pattern as ethanol tolerance,
increasing in content up to the 300 µm cell size floc population, and then
decreasing in the 400 µm cell size floc population, thus increasing ethanol
tolerance was related to increasing ergosterol content (Lei et al. 2007).
Phospholipids are one of the most important components of the yeast
plasma membrane. Phospholipid composition is also affected when yeast cells
are exposed to high ethanol concentrations. By monitoring the plasma membrane
phospholipid composition during the ethanol fermentation process, Chi, Kohlwein
& Paltauf (1999) found that during ethanol production, PI increased while other
components (phospatidic acid (PA), PC, PE and PS) were decreased, especially
PC and PE which decreased rapidly, as will be detailed in section 1.4.2.
17
Relationships between phospholipid composition and yeast floc cell size
were also observed by Lei et al. (2007) in yeast cells that had adapted to high
ethanol concentration. The relationship between plasma membrane PI and PE
levels and floc cell size was similar to that between ergosterol level, floc cell size,
and ethanol tolerance. In contrast, PC showed a different relationship in that the
highest PC level was observed in the 200 µm floc cell size and PC level
decreased dramatically in the 300 µm floc cell size (where the concentration of
other phospholipids were maximal). This result is in agreement with that of
previous study by Chi, Kohlwein & Paltauf (1999) in that a more ethanol tolerant
yeast had a higher proportion of PI in the plasma membrane.
1.4 General Stress Protectants
Many researchers have found that the lethal effect of a stress condition can
be reduced by the addition of supplement(s) to the growth media (Redón et al.
2009; Xue et al. 2008), metabolic engineering of the yeast to accumulate specific
compounds that can act as protectors (Rodrıguez-Vargas et al. 2007; Takagi et
al. 2005) or a combination of both treatments (Krause et al. 2007).
Some well known supplements that can act as stress protectors include
unsaturated fatty acids (Redón et al. 2009), trehalose (Hirasawa et al. 2001),
metal ions (Birch & Walker 2000; Walker 2004; Xue et al. 2008), ergosterol
(Redón et al. 2009; Swan & Watson 1998) and inositol (Ji et al. 2008).
Addition of different types of fatty acids to growth media for anaerobic culture
of yeasts can result in modification of plasma membrane fatty acid composition
(Steels, Learmonth & Watson 1994). Yeast grown anaerobically in unsaturated
fatty acids supplemented medium incorporate the supplemented unsaturated
fatty acids, while yeasts grown aerobically typically modulate their unsaturated
fatty acids composition and do not incorporate polyunsaturated lipids like C18:2
18
and C18:3 into their membranes (Steels, Learmonth & Watson 1994). Redón et
al. (2009) studied fatty acids supplementation in wine yeast and found a slight
increase in ethanol tolerance in yeasts which incorporated a palmitoleic (C16:1)
acid supplement, but not of those which incorporated a linolenic (C18:3) acid
supplementation. Furthermore, other studies have found that oleic (C18:1) acid
gives even more significant effects on ethanol tolerance than palmitoleic (C16:1)
acid (Alexandre, Rousseaux & Charpentier 1994; You, Rosenfield & Knipple
2003).
Trehalose is another compound that can act as a stress protectant. Previous
studies suggest that trehalose can protect yeast cell against heat, ethanol,
oxidative stress, freezing, high osmotic pressure and weak acid (Lewis et al.
1997). One of the possible mechanisms of trehalose protection against stress
has been proposed to be both protection of proteins against damage (Hottiger et
al. 1994) and membrane stabilisation (Wiemken 1990).
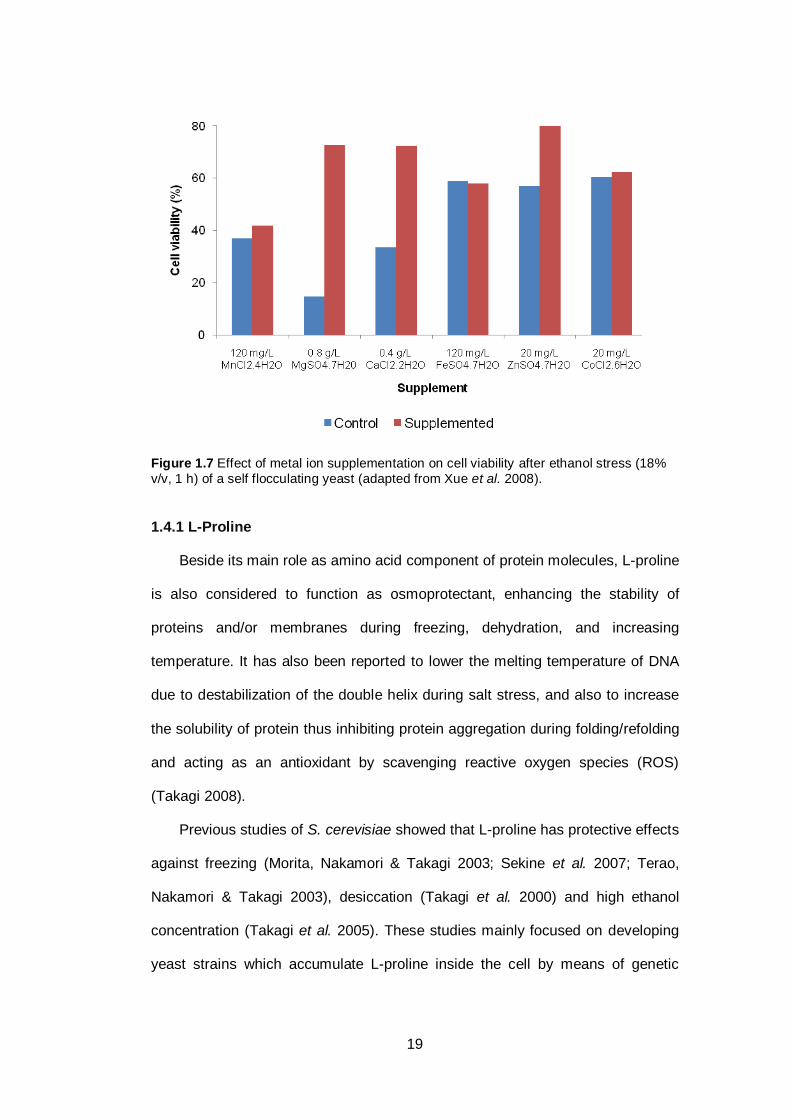
Ethanol tolerance can be affected by supplementation of the growth media
with metal ions (Birch & Walker 2000; Walker 2004; Walker et al. 2006). The
ethanol tolerance of yeast was found to be strongly affected by the addition of
zinc, magnesium and calcium (Birch & Walker 2000; Walker 2004; Xue et al.
2008) (see Figure 1.7). However, a further study suggested that excess zinc can
be toxic to the yeast cell and lead to lower viability (Xue et al. 2008). Therefore,
addition of metal ions to the growth medium needs to be optimized in order to
achieve the best results.
19
Figure 1.7 Effect of metal ion supplementation on cell viability after ethanol stress (18%
v/v, 1 h) of a self flocculating yeast (adapted from Xue et al. 2008).
1.4.1 L-Proline
Beside its main role as amino acid component of protein molecules, L-proline
is also considered to function as osmoprotectant, enhancing the stability of
proteins and/or membranes during freezing, dehydration, and increasing
temperature. It has also been reported to lower the melting temperature of DNA
due to destabilization of the double helix during salt stress, and also to increase
the solubility of protein thus inhibiting protein aggregation during folding/refolding
and acting as an antioxidant by scavenging reactive oxygen species (ROS)
(Takagi 2008).
Previous studies of S. cerevisiae showed that L-proline has protective effects
against freezing (Morita, Nakamori & Takagi 2003; Sekine et al. 2007; Terao,
Nakamori & Takagi 2003), desiccation (Takagi et al. 2000) and high ethanol
concentration (Takagi et al. 2005). These studies mainly focused on developing
yeast strains which accumulate L-proline inside the cell by means of genetic
20
manipulations. The targets of these studies were mainly the enzymes involved in
L-proline biosynthesis and metabolism as shown in Figure 1.8 (Morita, Nakamori
& Takagi 2003; Takagi et al. 2005; Terao, Nakamori & Takagi 2003).
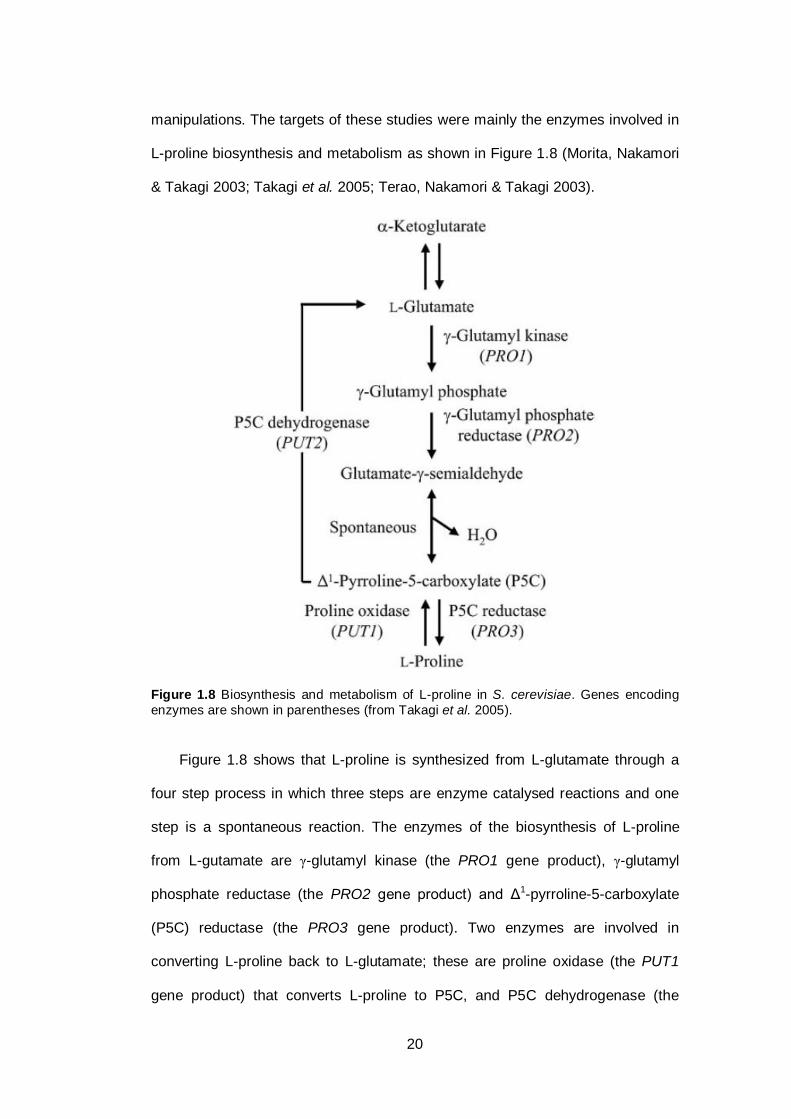
Figure 1.8 Biosynthesis and metabolism of L-proline in S. cerevisiae. Genes encoding
enzymes are shown in parentheses (from Takagi et al. 2005).
Figure 1.8 shows that L-proline is synthesized from L-glutamate through a
four step process in which three steps are enzyme catalysed reactions and one
step is a spontaneous reaction. The enzymes of the biosynthesis of L-proline
from L-gutamate are γ-glutamyl kinase (the PRO1 gene product), γ-glutamyl
phosphate reductase (the PRO2 gene product) and Δ1-pyrroline-5-carboxylate
(P5C) reductase (the PRO3 gene product). Two enzymes are involved in
converting L-proline back to L-glutamate; these are proline oxidase (the PUT1
gene product) that converts L-proline to P5C, and P5C dehydrogenase (the
21
PUT2 gene product) that converts P5C to L-glutamate, in mitochondria (Terao,
Nakamori & Takagi 2003).
Increased intracellular L-proline content of yeast can be achieved by
increasing the activity of one of the three enzymes involved in the synthesis
pathway of L-proline or decreasing the activity of one of the two enzymes that
convert L-proline in to L-glutamate.
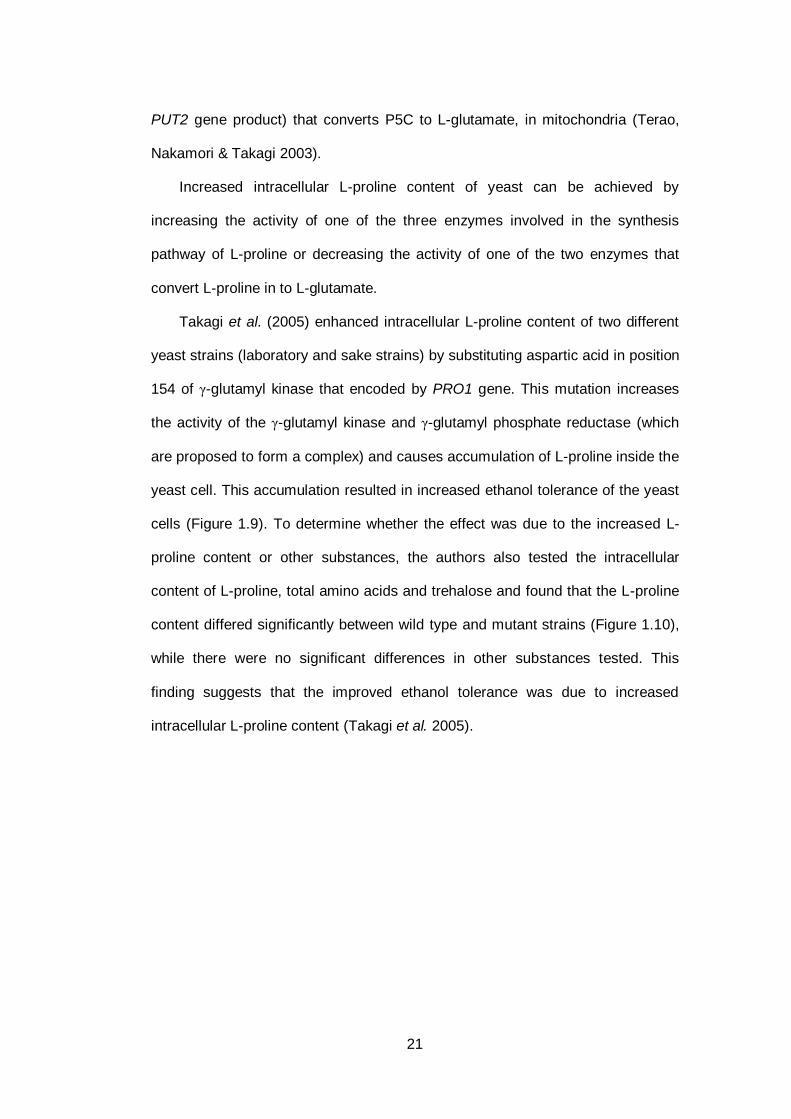
Takagi et al. (2005) enhanced intracellular L-proline content of two different
yeast strains (laboratory and sake strains) by substituting aspartic acid in position
154 of γ-glutamyl kinase that encoded by PRO1 gene. This mutation increases
the activity of the γ-glutamyl kinase and γ-glutamyl phosphate reductase (which
are proposed to form a complex) and causes accumulation of L-proline inside the
yeast cell. This accumulation resulted in increased ethanol tolerance of the yeast
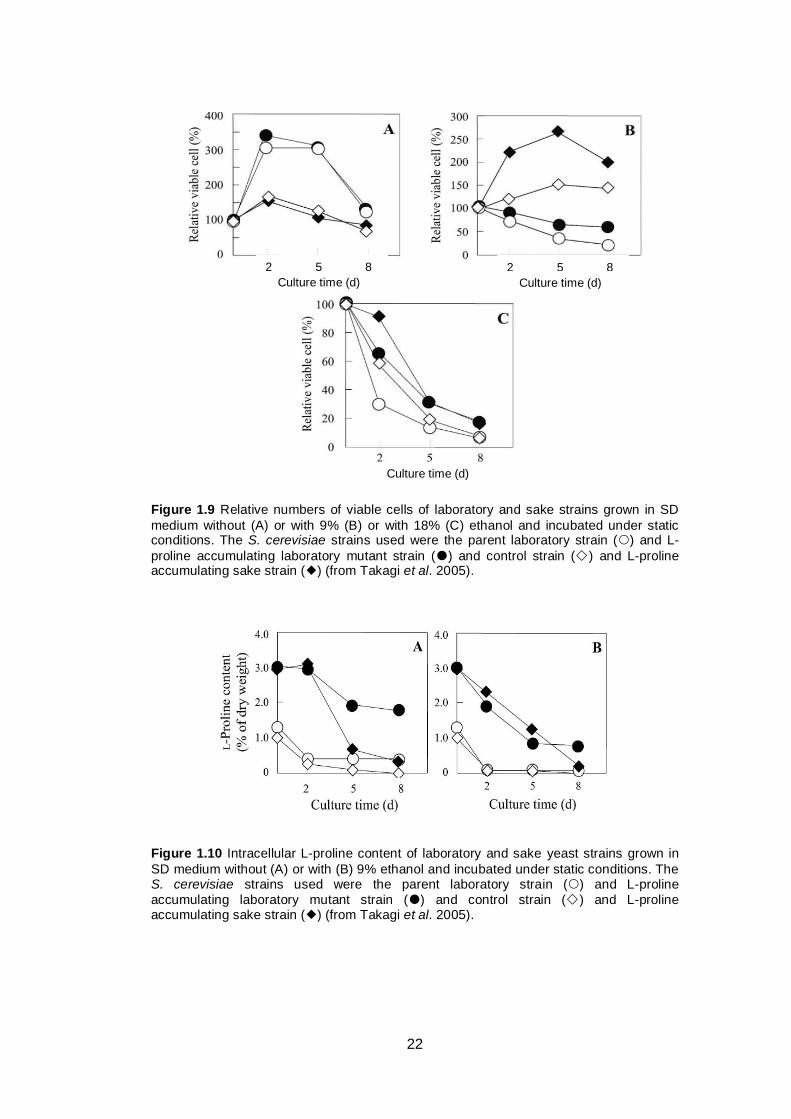
cells (Figure 1.9). To determine whether the effect was due to the increased L-
proline content or other substances, the authors also tested the intracellular
content of L-proline, total amino acids and trehalose and found that the L-proline
content differed significantly between wild type and mutant strains (Figure 1.10),
while there were no significant differences in other substances tested. This
finding suggests that the improved ethanol tolerance was due to increased
intracellular L-proline content (Takagi et al. 2005).
22
Figure 1.9 Relative numbers of viable cells of laboratory and sake strains grown in SD
medium without (A) or with 9% (B) or with 18% (C) ethanol and incubated under static conditions. The S. cerevisiae strains used were the parent laboratory strain () and L-
proline accumulating laboratory mutant strain () and control strain () and L-proline accumulating sake strain () (from Takagi et al. 2005).
Figure 1.10 Intracellular L-proline content of laboratory and sake yeast strains grown in
SD medium without (A) or with (B) 9% ethanol and incubated under static conditions. The S. cerevisiae strains used were the parent laboratory strain () and L-proline
accumulating laboratory mutant strain () and control strain () and L-proline accumulating sake strain () (from Takagi et al. 2005).
Culture time (d)
2 5 8
Culture time (d)
2 5 8
Culture time (d)
23
Other studies showed that mutant yeast strains capable of accumulating
intracellular L-proline were more tolerant to freezing (Sekine et al. 2007; Terao,
Nakamori & Takagi 2003) and desiccation (Takagi et al. 2000). Results of these
studies suggest that intracellular L-proline can act as a general stress protectant,
not only for stress induced by a high ethanol concentration. This property is
important for application of the yeast in various industries such as bread
production, brewing, winemaking and bioethanol production.
Even though previous studies of L-proline focused on engineered yeast
strains that accumulate intracellular L-proline, yeasts can also utilize extracellular
L-proline as a sole carbon source (Lasko & Brandriss 1981). Transport of L-
proline into the yeast cell is facilitated by at least four permeases, two of which
are nitrogen regulated permeases (PUT4 and GAP1 encoded proteins), and two
permeases that are regulated by the SPS (Ssy1-Ptr3-Ssy5) sensor (AGP1 and
GNP1 encoded proteins) (Andreasson, Neve & Ljungdahl 2004).
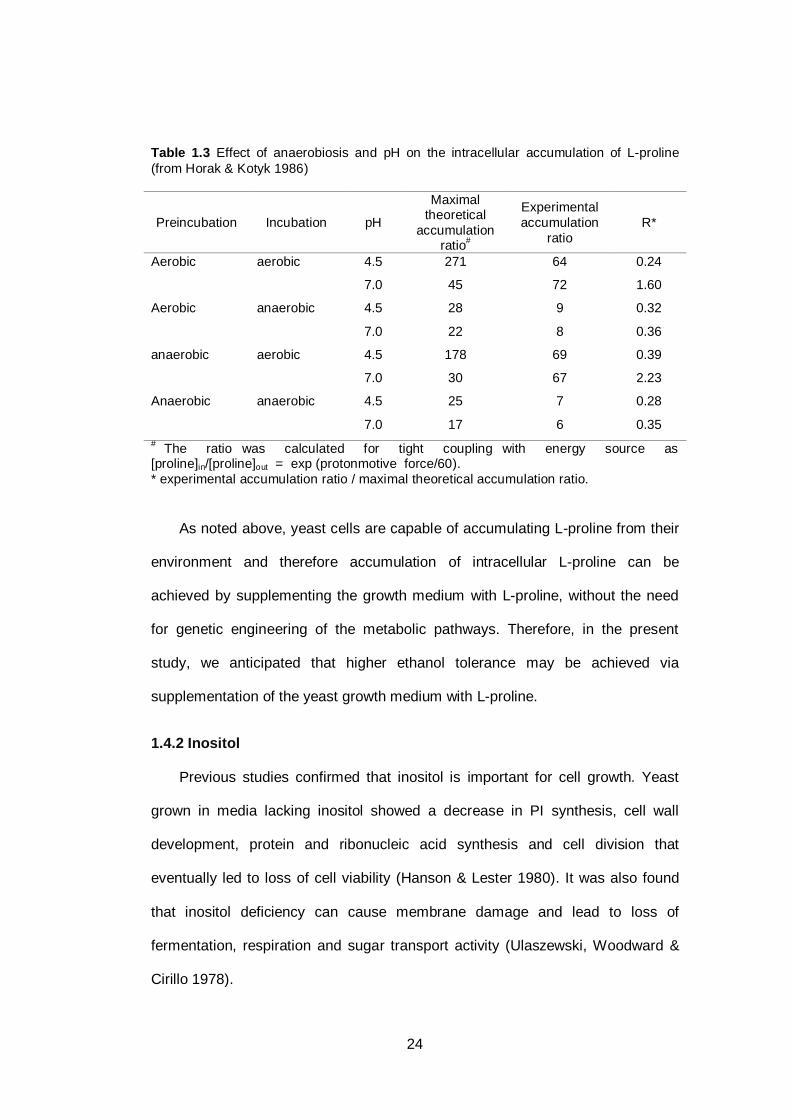
The environmental conditions under which the yeasts are grown may affect
the accumulation of extracellular L-proline in the yeast cell. Horak & Kotyk (1986)
found that yeast cells grown at different pH and preincubated under aerobic or
anaerobic conditions, followed by incubation in aerobic or anaerobic conditions
showed different degrees of L-proline accumulation. Under anaerobic conditions,
accumulation of L-proline was lower compared to yeast grown under aerobic
conditions. This result showed that oxygen availability markedly influences L-
proline uptake by yeast (see Table 1.3). Ingledew, Magnus & Solsuski (1987)
also found that proline uptake in wine must requires oxygen.
24
Table 1.3 Effect of anaerobiosis and pH on the intracellular accumulation of L-proline
(from Horak & Kotyk 1986)
Preincubation Incubation pH
Maximal theoretical
accumulation ratio
#
Experimental
accumulation
ratio
R*
Aerobic aerobic 4.5 271 64 0.24
7.0 45 72 1.60
Aerobic anaerobic 4.5 28 9 0.32
7.0 22 8 0.36
anaerobic aerobic 4.5 178 69 0.39
7.0 30 67 2.23
Anaerobic anaerobic 4.5 25 7 0.28
7.0 17 6 0.35
# The ratio was calculated for tight coupling with energy source as
[proline]in/[proline]out = exp (protonmotive force/60).
* experimental accumulation ratio / maximal theoretical accumulation ratio.
As noted above, yeast cells are capable of accumulating L-proline from their
environment and therefore accumulation of intracellular L-proline can be
achieved by supplementing the growth medium with L-proline, without the need
for genetic engineering of the metabolic pathways. Therefore, in the present
study, we anticipated that higher ethanol tolerance may be achieved via
supplementation of the yeast growth medium with L-proline.
1.4.2 Inositol
Previous studies confirmed that inositol is important for cell growth. Yeast
grown in media lacking inositol showed a decrease in PI synthesis, cell wall
development, protein and ribonucleic acid synthesis and cell division that
eventually led to loss of cell viability (Hanson & Lester 1980). It was also found
that inositol deficiency can cause membrane damage and lead to loss of
fermentation, respiration and sugar transport activity (Ulaszewski, Woodward &
Cirillo 1978).
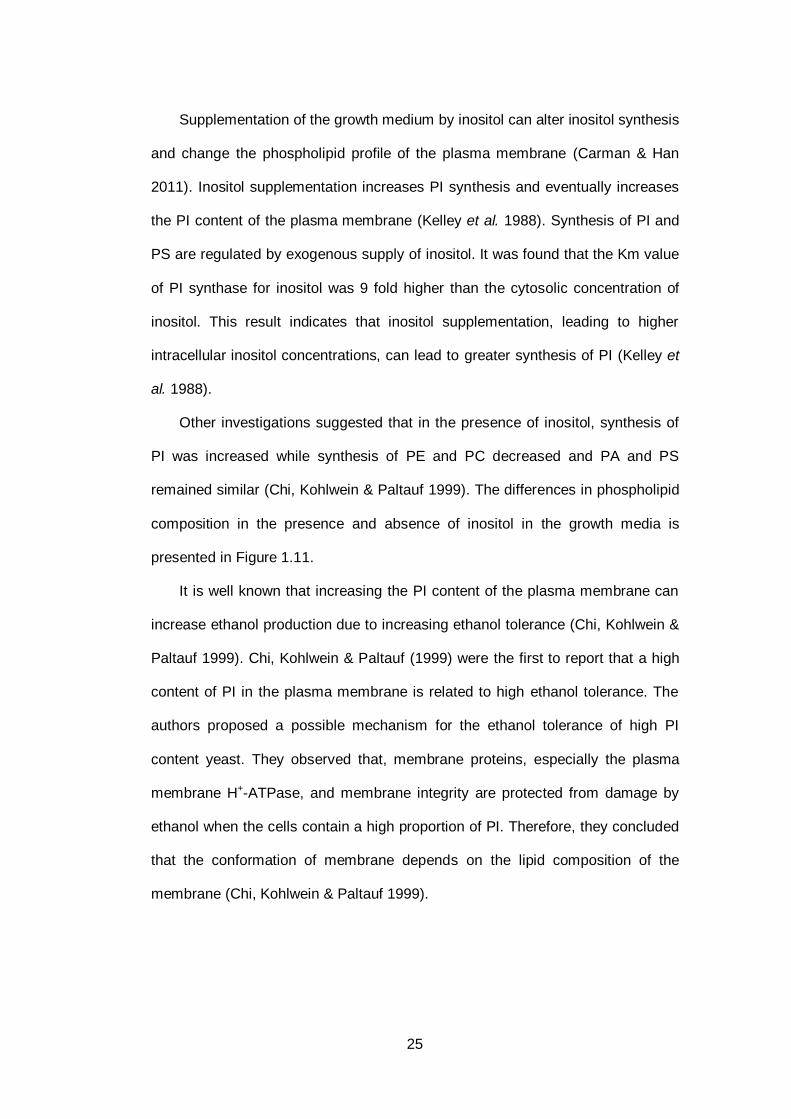
25
Supplementation of the growth medium by inositol can alter inositol synthesis
and change the phospholipid profile of the plasma membrane (Carman & Han
2011). Inositol supplementation increases PI synthesis and eventually increases
the PI content of the plasma membrane (Kelley et al. 1988). Synthesis of PI and
PS are regulated by exogenous supply of inositol. It was found that the Km value
of PI synthase for inositol was 9 fold higher than the cytosolic concentration of
inositol. This result indicates that inositol supplementation, leading to higher
intracellular inositol concentrations, can lead to greater synthesis of PI (Kelley et
al. 1988).
Other investigations suggested that in the presence of inositol, synthesis of
PI was increased while synthesis of PE and PC decreased and PA and PS
remained similar (Chi, Kohlwein & Paltauf 1999). The differences in phospholipid
composition in the presence and absence of inositol in the growth media is
presented in Figure 1.11.
It is well known that increasing the PI content of the plasma membrane can
increase ethanol production due to increasing ethanol tolerance (Chi, Kohlwein &
Paltauf 1999). Chi, Kohlwein & Paltauf (1999) were the first to report that a high
content of PI in the plasma membrane is related to high ethanol tolerance. The
authors proposed a possible mechanism for the ethanol tolerance of high PI
content yeast. They observed that, membrane proteins, especially the plasma
membrane H+-ATPase, and membrane integrity are protected from damage by
ethanol when the cells contain a high proportion of PI. Therefore, they concluded
that the conformation of membrane depends on the lipid composition of the
membrane (Chi, Kohlwein & Paltauf 1999).
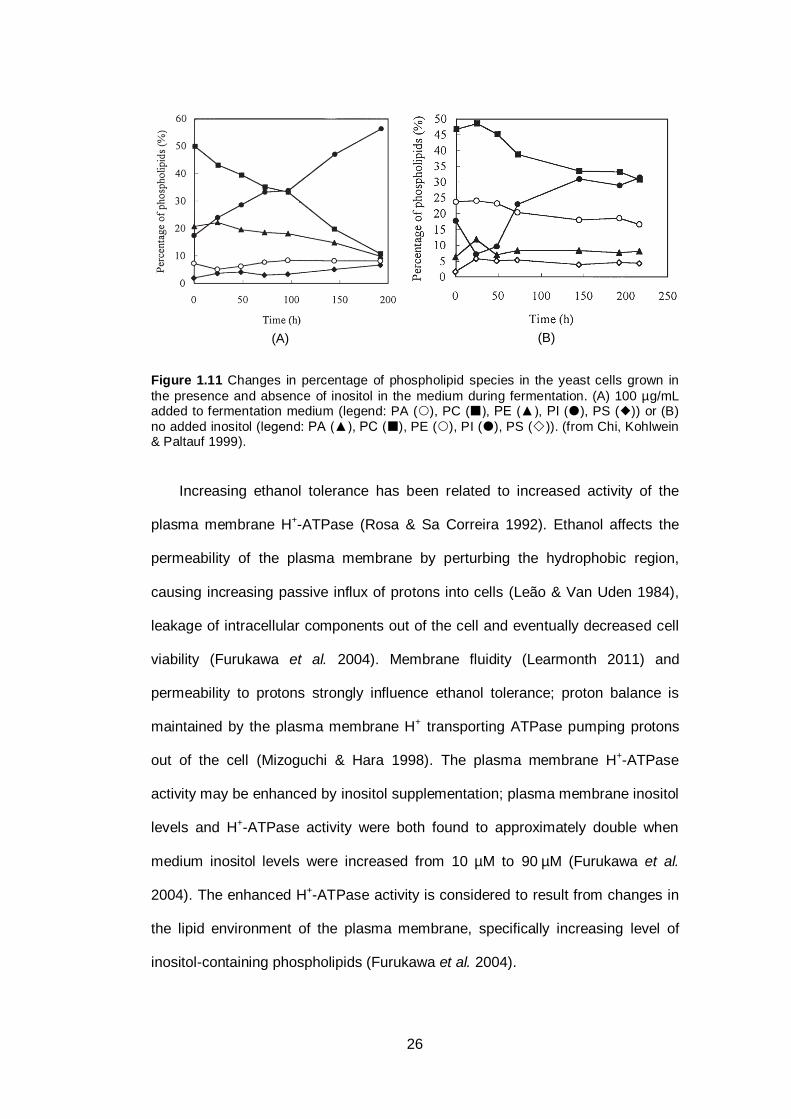
26
Figure 1.11 Changes in percentage of phospholipid species in the yeast cells grown in
the presence and absence of inositol in the medium during fermentation. (A) 100 µg/mL added to fermentation medium (legend: PA (), PC (), PE (▲), PI (), PS ()) or (B)
no added inositol (legend: PA (▲), PC (), PE (), PI (), PS ()). (from Chi, Kohlwein & Paltauf 1999).
Increasing ethanol tolerance has been related to increased activity of the
plasma membrane H+-ATPase (Rosa & Sa Correira 1992). Ethanol affects the
permeability of the plasma membrane by perturbing the hydrophobic region,
causing increasing passive influx of protons into cells (Leão & Van Uden 1984),
leakage of intracellular components out of the cell and eventually decreased cell
viability (Furukawa et al. 2004). Membrane fluidity (Learmonth 2011) and
permeability to protons strongly influence ethanol tolerance; proton balance is
maintained by the plasma membrane H+ transporting ATPase pumping protons
out of the cell (Mizoguchi & Hara 1998). The plasma membrane H+-ATPase
activity may be enhanced by inositol supplementation; plasma membrane inositol
levels and H+-ATPase activity were both found to approximately double when
medium inositol levels were increased from 10 µM to 90 µM (Furukawa et al.
2004). The enhanced H+-ATPase activity is considered to result from changes in
the lipid environment of the plasma membrane, specifically increasing level of
inositol-containing phospholipids (Furukawa et al. 2004).
(A) (B)
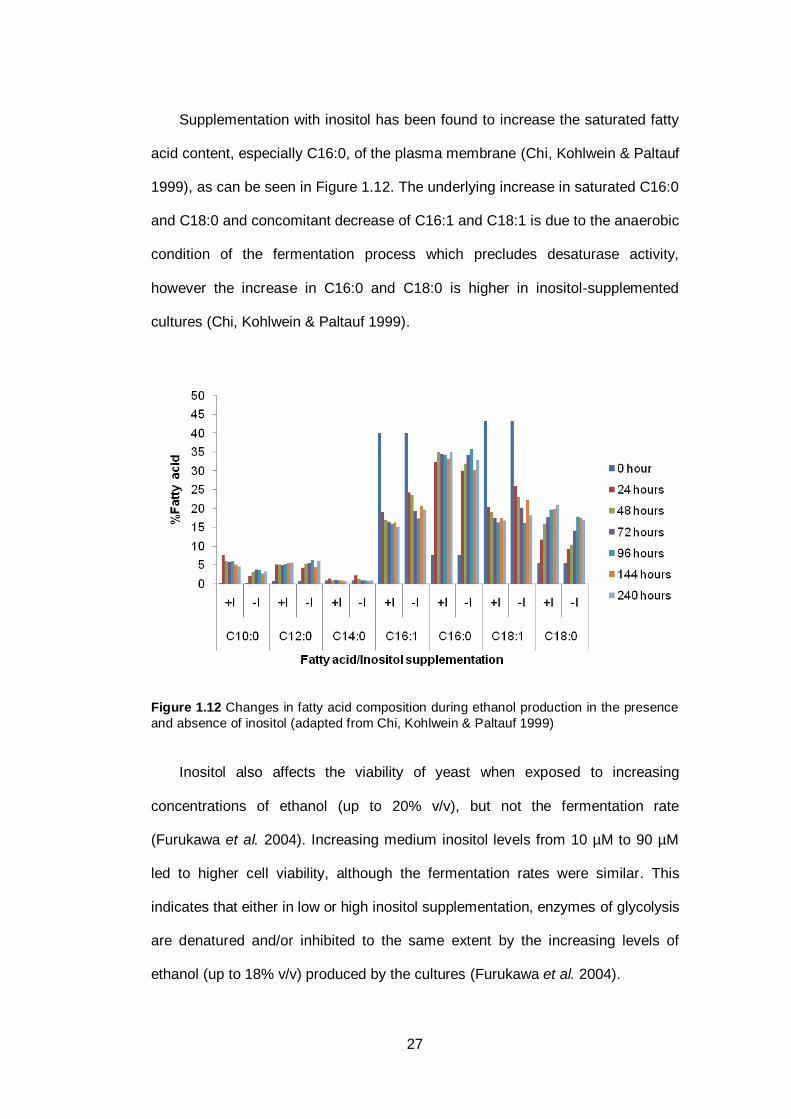
27
Supplementation with inositol has been found to increase the saturated fatty
acid content, especially C16:0, of the plasma membrane (Chi, Kohlwein & Paltauf
1999), as can be seen in Figure 1.12. The underlying increase in saturated C16:0
and C18:0 and concomitant decrease of C16:1 and C18:1 is due to the anaerobic
condition of the fermentation process which precludes desaturase activity,
however the increase in C16:0 and C18:0 is higher in inositol-supplemented
cultures (Chi, Kohlwein & Paltauf 1999).
Figure 1.12 Changes in fatty acid composition during ethanol production in the presence
and absence of inositol (adapted from Chi, Kohlwein & Paltauf 1999)
Inositol also affects the viability of yeast when exposed to increasing
concentrations of ethanol (up to 20% v/v), but not the fermentation rate
(Furukawa et al. 2004). Increasing medium inositol levels from 10 µM to 90 µM
led to higher cell viability, although the fermentation rates were similar. This
indicates that either in low or high inositol supplementation, enzymes of glycolysis
are denatured and/or inhibited to the same extent by the increasing levels of
ethanol (up to 18% v/v) produced by the cultures (Furukawa et al. 2004).
28
The viability increase upon higher inositol supplementation correlated with
decreased leakage of intracellular components e.g. nucleotide, K+ and
phosphate, leading to the conclusion that the ability of inositol to improve viability
may be via decreasing membrane permeability (Furukawa et al. 2004).
Interestingly, a more recent study on another yeast species, Pachysolen
tannophilus, showed that even though inositol supplementation can increase
ethanol production and cell growth, excess inositol can decrease the cell growth
and ethanol production of the yeast (Ji et al. 2008). Cultures showed the highest
cell density and ethanol production when the media were supplemented by 0.15
g/L and 0.1 g/L of inositol, respectively, as can be seen in Figure 1.13. The cell
growth and ethanol production were observed to start to decline when the inositol
supplementation was increased further (Ji et al. 2008).
Figure 1.13 Effect of different levels of inositol supplementation on cell growth and
ethanol production of the yeast P. tannophilus (adapted from Ji et al. 2008)
These authors also found that inositol supplementation led to increased
tolerance of P. tannophilus to high ethanol concentration stress, as can be seen
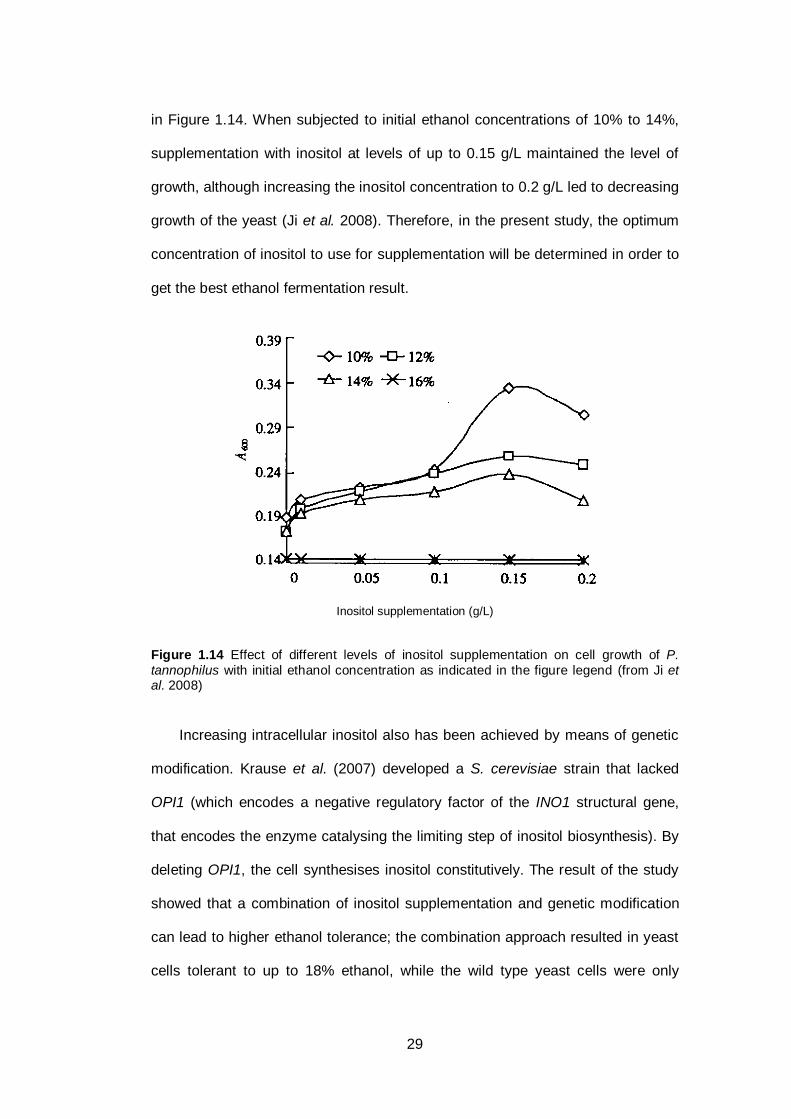
29
in Figure 1.14. When subjected to initial ethanol concentrations of 10% to 14%,
supplementation with inositol at levels of up to 0.15 g/L maintained the level of
growth, although increasing the inositol concentration to 0.2 g/L led to decreasing
growth of the yeast (Ji et al. 2008). Therefore, in the present study, the optimum
concentration of inositol to use for supplementation will be determined in order to
get the best ethanol fermentation result.
Inositol supplementation (g/L)
Figure 1.14 Effect of different levels of inositol supplementation on cell growth of P.
tannophilus with initial ethanol concentration as indicated in the figure legend (from Ji et al. 2008)
Increasing intracellular inositol also has been achieved by means of genetic
modification. Krause et al. (2007) developed a S. cerevisiae strain that lacked
OPI1 (which encodes a negative regulatory factor of the INO1 structural gene,
that encodes the enzyme catalysing the limiting step of inositol biosynthesis). By
deleting OPI1, the cell synthesises inositol constitutively. The result of the study
showed that a combination of inositol supplementation and genetic modification
can lead to higher ethanol tolerance; the combination approach resulted in yeast
cells tolerant to up to 18% ethanol, while the wild type yeast cells were only
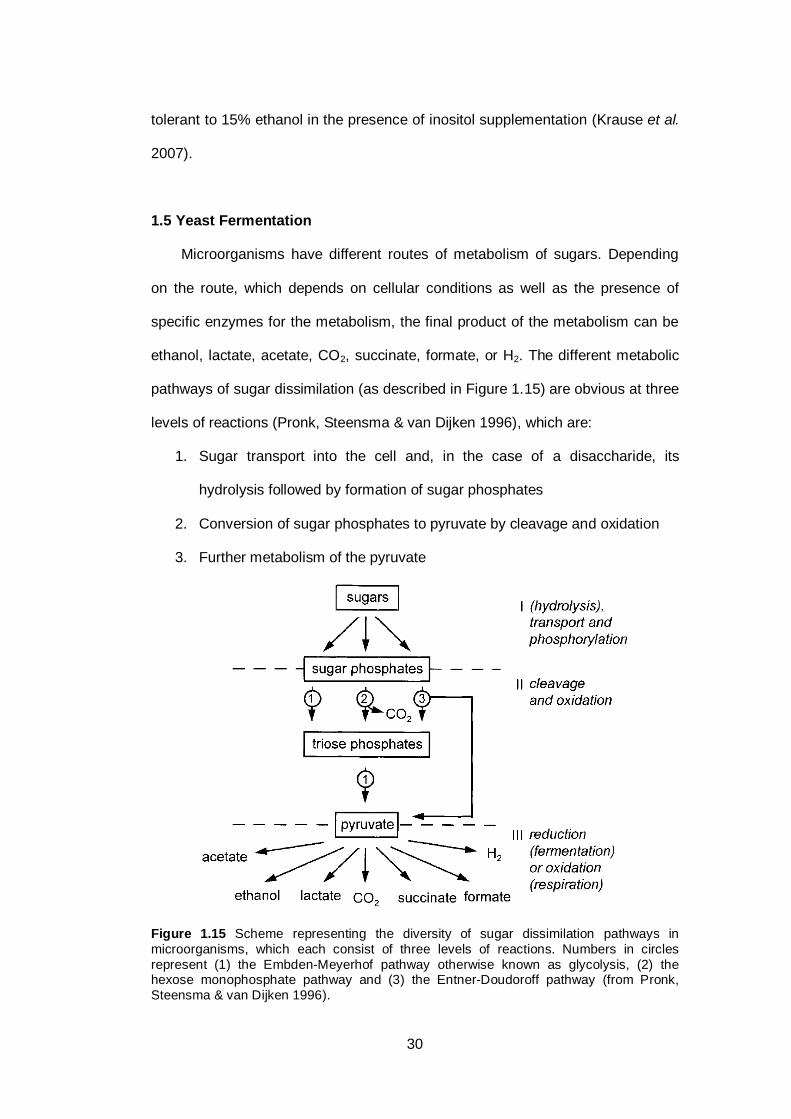
30
tolerant to 15% ethanol in the presence of inositol supplementation (Krause et al.
2007).
1.5 Yeast Fermentation
Microorganisms have different routes of metabolism of sugars. Depending
on the route, which depends on cellular conditions as well as the presence of
specific enzymes for the metabolism, the final product of the metabolism can be
ethanol, lactate, acetate, CO2, succinate, formate, or H2. The different metabolic
pathways of sugar dissimilation (as described in Figure 1.15) are obvious at three
levels of reactions (Pronk, Steensma & van Dijken 1996), which are:
1. Sugar transport into the cell and, in the case of a disaccharide, its
hydrolysis followed by formation of sugar phosphates
2. Conversion of sugar phosphates to pyruvate by cleavage and oxidation
3. Further metabolism of the pyruvate
Figure 1.15 Scheme representing the diversity of sugar dissimilation pathways in
microorganisms, which each consist of three levels of reactions. Numbers in circles
represent (1) the Embden-Meyerhof pathway otherwise known as glycolysis, (2) the hexose monophosphate pathway and (3) the Entner-Doudoroff pathway (from Pronk,
Steensma & van Dijken 1996).
31
Sugar in monosaccharide form may be transported into cells via facilitated
diffusion, active transport or group translocation. In the case of a disaccharide, it
can be directly transported into cells and hydrolysed inside the cells
(intracellularly) to form monosaccharides or, alternatively, it can be hydrolysed
outside the cell (extracellularly) and transported into the cell in the form of a
monosachharide. The transported monosaccharide is then available for further
metabolism (Pronk, Steensma & van Dijken 1996).
Even though there are three different metabolic pathways, all sugar
metabolizing microorganisms share a common pathway in the lower part of the
Embden-Meyerhof (glycolysis) pathway, which is the conversion of triose
phosphate to pyruvate. The most obvious differences among microorganisms are
in the further metabolism of pyruvate with the product as noted above (Pronk,
Steensma & van Dijken 1996).
According to their ability to produce ethanol in aerobic conditions (i.e. in the
presence of oxygen), yeast are divided into two groups; Crabtee-positive and
Crabtee-negative yeasts. The former are yeasts that are capable of accumulating
ethanol even in the presence of oxygen, while the latter only degrade sugars to
CO2 under aerobic conditions (Piskur et al. 2006; Pronk, Steensma & van Dijken
1996). S. cerevisiae belongs to the Crabtee-positive yeast type, since it has the
capability to degrade six carbon (6C) sugars, especially glucose, to two carbon
(2C) molecules, in particular ethanol, in the presence of oxygen without
completely oxidizing them to CO2. Another yeast which belongs to this group is
the fission yeast Schizosaccharomyces pombe. Other yeasts, such as
Kluyveromyces lactis and Candida albicans, are Crabtee-negative yeasts (Piskur
et al. 2006). A scheme showing possible different metabolic pathways in Crabtee-
positive and Crabtee-negative yeasts is presented in Figure 1.16.
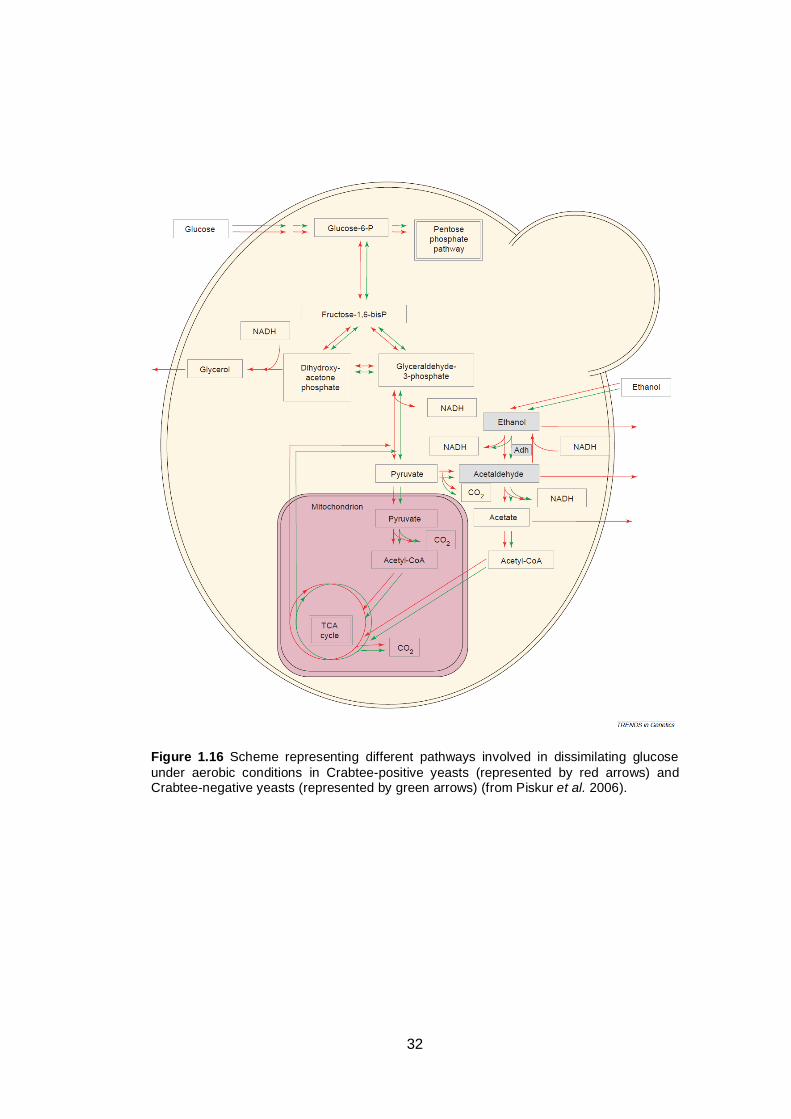
32
Figure 1.16 Scheme representing different pathways involved in dissimilating glucose
under aerobic conditions in Crabtee-positive yeasts (represented by red arrows) and Crabtee-negative yeasts (represented by green arrows) (from Piskur et al. 2006).
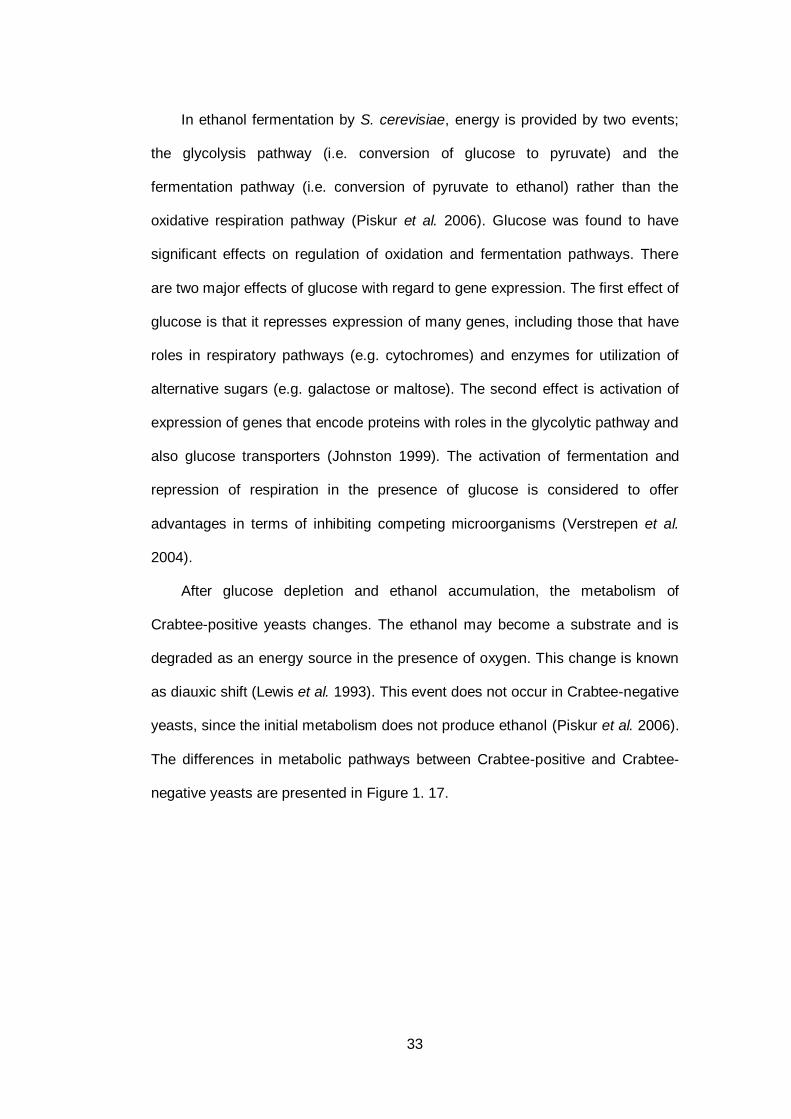
33
In ethanol fermentation by S. cerevisiae, energy is provided by two events;
the glycolysis pathway (i.e. conversion of glucose to pyruvate) and the
fermentation pathway (i.e. conversion of pyruvate to ethanol) rather than the
oxidative respiration pathway (Piskur et al. 2006). Glucose was found to have
significant effects on regulation of oxidation and fermentation pathways. There
are two major effects of glucose with regard to gene expression. The first effect of
glucose is that it represses expression of many genes, including those that have
roles in respiratory pathways (e.g. cytochromes) and enzymes for utilization of
alternative sugars (e.g. galactose or maltose). The second effect is activation of
expression of genes that encode proteins with roles in the glycolytic pathway and
also glucose transporters (Johnston 1999). The activation of fermentation and
repression of respiration in the presence of glucose is considered to offer
advantages in terms of inhibiting competing microorganisms (Verstrepen et al.
2004).
After glucose depletion and ethanol accumulation, the metabolism of
Crabtee-positive yeasts changes. The ethanol may become a substrate and is
degraded as an energy source in the presence of oxygen. This change is known
as diauxic shift (Lewis et al. 1993). This event does not occur in Crabtee-negative
yeasts, since the initial metabolism does not produce ethanol (Piskur et al. 2006).
The differences in metabolic pathways between Crabtee-positive and Crabtee-
negative yeasts are presented in Figure 1. 17.
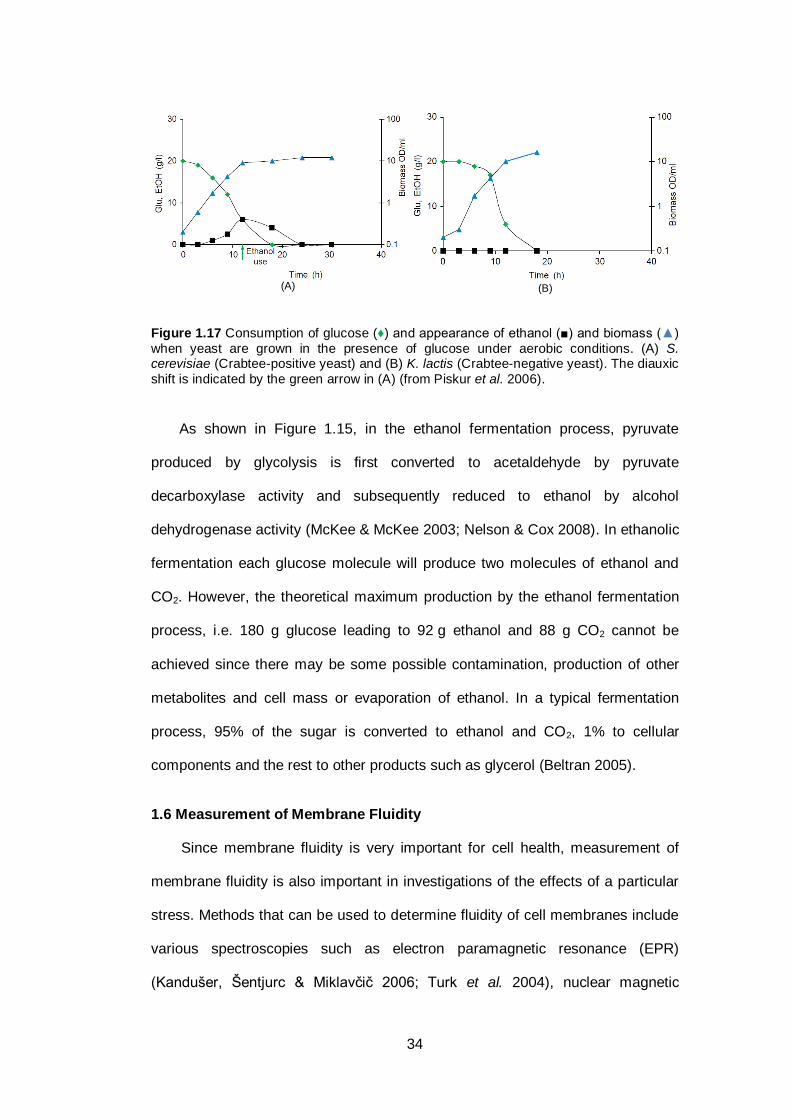
34
Figure 1.17 Consumption of glucose (♦) and appearance of ethanol (■) and biomass (▲)
when yeast are grown in the presence of glucose under aerobic conditions. (A) S. cerevisiae (Crabtee-positive yeast) and (B) K. lactis (Crabtee-negative yeast). The diauxic
shift is indicated by the green arrow in (A) (from Piskur et al. 2006).
As shown in Figure 1.15, in the ethanol fermentation process, pyruvate
produced by glycolysis is first converted to acetaldehyde by pyruvate
decarboxylase activity and subsequently reduced to ethanol by alcohol
dehydrogenase activity (McKee & McKee 2003; Nelson & Cox 2008). In ethanolic
fermentation each glucose molecule will produce two molecules of ethanol and
CO2. However, the theoretical maximum production by the ethanol fermentation
process, i.e. 180 g glucose leading to 92 g ethanol and 88 g CO2 cannot be
achieved since there may be some possible contamination, production of other
metabolites and cell mass or evaporation of ethanol. In a typical fermentation
process, 95% of the sugar is converted to ethanol and CO2, 1% to cellular
components and the rest to other products such as glycerol (Beltran 2005).
1.6 Measurement of Membrane Fluidity
Since membrane fluidity is very important for cell health, measurement of
membrane fluidity is also important in investigations of the effects of a particular
stress. Methods that can be used to determine fluidity of cell membranes include
various spectroscopies such as electron paramagnetic resonance (EPR)
(Kandušer, Šentjurc & Miklavčič 2006; Turk et al. 2004), nuclear magnetic
(A)
)
(B)
35
resonance (NMR) (Baer, Bryant & Blaschek 1989; Lee et al. 2006), Fourier
transform infrared (FTIR) (Inaba et al. 2003; Leheny & Theg 1994) and
fluorescence (Alexandre, Berlot & Charpentier 1994; Butcher 2008; Learmonth &
Gratton 2002). In the present study, membrane fluidity was measured using
fluorescence spectroscopy, more specifically by measuring the generalized
fluorescence polarization of the membrane probe laurdan.
When a molecule is exposed to electromagnetic radiation with an
appropriate frequency, the molecule can absorb a photon, causing excitation of
an electron from the ground electronic state (S0) to a higher energy electronic
state (S1, S2, etc.), termed an ―excited‖ state. This process is illustrated in Figure
1.18, which is known as a Perrin-Jablonski diagram. The absorption of
electromagnetic radiation and electron excitation take place on a time scale of
~10-15 s (Croney, Jameson & Learmonth 2001; Learmonth, Kable & Ghiggino
2009). In the excited state, the structure of the molecule is changed due to
redistribution of its electron cloud. This in turn results in altered vibrational levels,
altered dipole moment and a change in molecular shape (Learmonth, Kable &
Ghiggino 2009).
Figure 1.18 Simplified Perrin-Jablonski energy level diagram showing absorption (—) and
emission (---) process as well as thermalization and solvent relaxation (from Croney,
Jameson & Learmonth 2001)
36
The excited molecule will rapidly lose energy to the environment through non
radiative modes involving nuclear movement, and will revert to the lowest
vibrational level of the lowest excited electronic state (S1). This event is known as
thermalization. The electron can settle in the lowest vibrational level for a period
of time known as fluorescence lifetime, which can last for picoseconds to
hundreds of nanoseconds (Croney, Jameson & Learmonth 2001).
The excited state is an unstable condition and therefore, as illustrated in
Figure 1.18, it may relax back to the ground state by emitting a photon. The
emitted photon will have energy corresponding to the difference between the final
and initial energy state of the molecule. This photon emission can be seen as
fluorescence or phosphorescence (Learmonth, Kable & Ghiggino 2009; Nipper
2007). It is worth noting that the emitted fluorescence is not dependent on the
wavelength absorbed nor subsequent energy level reached in the excitation
event, i.e. fluorescence always occurs from the lowest vibrational level of the first
excited state (S1) to the ground state (S0) (Croney, Jameson & Learmonth 2001).
Emitted fluorescent light always has lower energy (longer wavelength) than
the absorbed light. The differences between absorption and emission maxima are
known as the Stokes shift, named after Sir G.G. Stokes who discovered this
phenomenon (Learmonth, Kable & Ghiggino 2009). An example of the Stokes
shift of a fluorophore is presented in Figure 1.19.
A larger fluorophore will cause a shift in absorption to a longer wavelength
(Butcher 2008), for example the maximum absorption for 1,6-diphenyl-1,3,5-
hexatriene (DPH, MW=232.32 g/mol) is at 350 nm whereas 6-lauroyl-2-
dimethylamino naphthalene (laurdan, MW=353.54 g/mol) absorbs maximally at
364 nm.
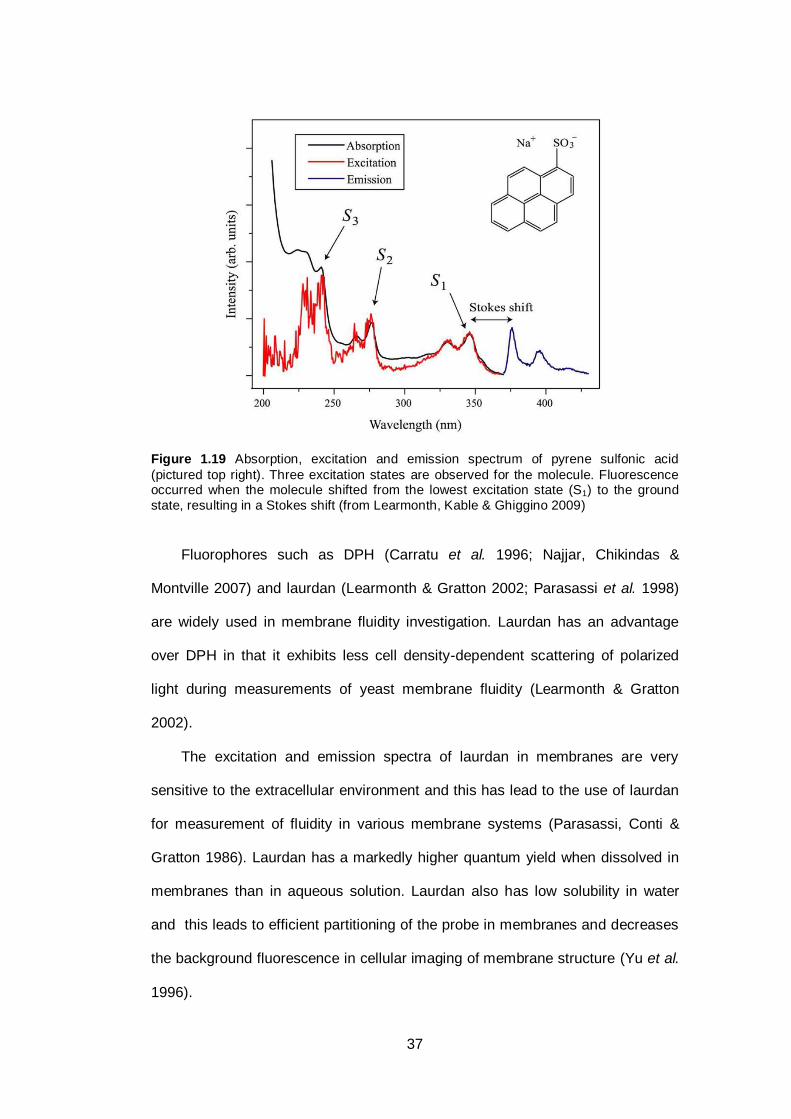
37
Figure 1.19 Absorption, excitation and emission spectrum of pyrene sulfonic acid
(pictured top right). Three excitation states are observed for the molecule. Fluorescence occurred when the molecule shifted from the lowest excitation state (S1) to the ground
state, resulting in a Stokes shift (from Learmonth, Kable & Ghiggino 2009)
Fluorophores such as DPH (Carratu et al. 1996; Najjar, Chikindas &
Montville 2007) and laurdan (Learmonth & Gratton 2002; Parasassi et al. 1998)
are widely used in membrane fluidity investigation. Laurdan has an advantage
over DPH in that it exhibits less cell density-dependent scattering of polarized
light during measurements of yeast membrane fluidity (Learmonth & Gratton
2002).
The excitation and emission spectra of laurdan in membranes are very
sensitive to the extracellular environment and this has lead to the use of laurdan
for measurement of fluidity in various membrane systems (Parasassi, Conti &
Gratton 1986). Laurdan has a markedly higher quantum yield when dissolved in
membranes than in aqueous solution. Laurdan also has low solubility in water
and this leads to efficient partitioning of the probe in membranes and decreases
the background fluorescence in cellular imaging of membrane structure (Yu et al.
1996).
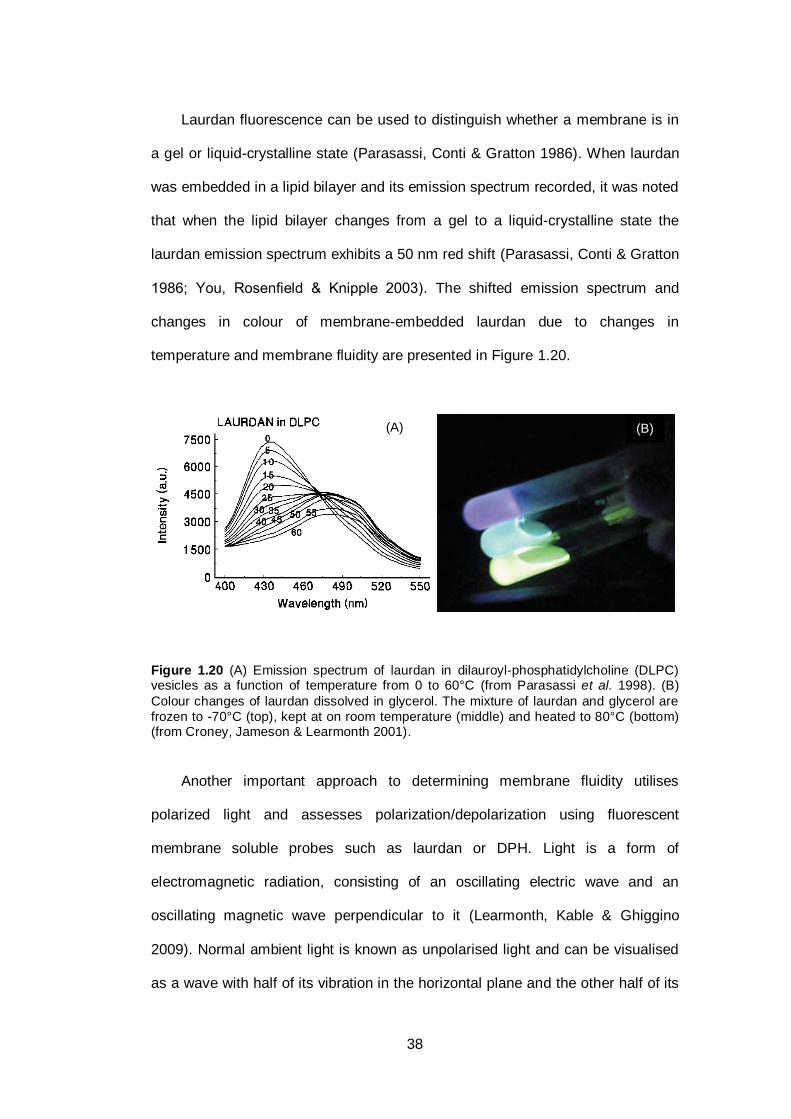
38
Laurdan fluorescence can be used to distinguish whether a membrane is in
a gel or liquid-crystalline state (Parasassi, Conti & Gratton 1986). When laurdan
was embedded in a lipid bilayer and its emission spectrum recorded, it was noted
that when the lipid bilayer changes from a gel to a liquid-crystalline state the
laurdan emission spectrum exhibits a 50 nm red shift (Parasassi, Conti & Gratton
1986; You, Rosenfield & Knipple 2003). The shifted emission spectrum and
changes in colour of membrane-embedded laurdan due to changes in
temperature and membrane fluidity are presented in Figure 1.20.
Figure 1.20 (A) Emission spectrum of laurdan in dilauroyl-phosphatidylcholine (DLPC) vesicles as a function of temperature from 0 to 60°C (from Parasassi et al. 1998). (B)
Colour changes of laurdan dissolved in glycerol. The mixture of laurdan and glycerol are
frozen to -70°C (top), kept at on room temperature (middle) and heated to 80°C (bottom) (from Croney, Jameson & Learmonth 2001).
Another important approach to determining membrane fluidity utilises
polarized light and assesses polarization/depolarization using fluorescent
membrane soluble probes such as laurdan or DPH. Light is a form of
electromagnetic radiation, consisting of an oscillating electric wave and an
oscillating magnetic wave perpendicular to it (Learmonth, Kable & Ghiggino
2009). Normal ambient light is known as unpolarised light and can be visualised
as a wave with half of its vibration in the horizontal plane and the other half of its
(A) (B)
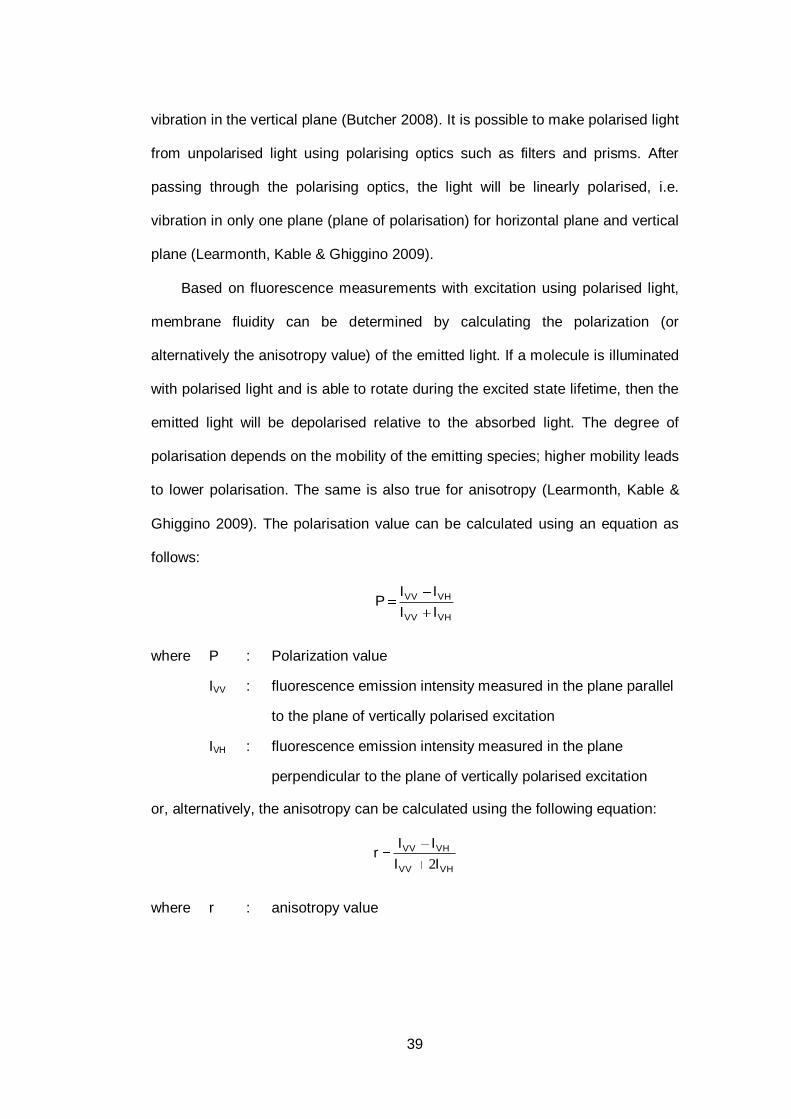
39
vibration in the vertical plane (Butcher 2008). It is possible to make polarised light
from unpolarised light using polarising optics such as filters and prisms. After
passing through the polarising optics, the light will be linearly polarised, i.e.
vibration in only one plane (plane of polarisation) for horizontal plane and vertical
plane (Learmonth, Kable & Ghiggino 2009).
Based on fluorescence measurements with excitation using polarised light,
membrane fluidity can be determined by calculating the polarization (or
alternatively the anisotropy value) of the emitted light. If a molecule is illuminated
with polarised light and is able to rotate during the excited state lifetime, then the
emitted light will be depolarised relative to the absorbed light. The degree of
polarisation depends on the mobility of the emitting species; higher mobility leads
to lower polarisation. The same is also true for anisotropy (Learmonth, Kable &
Ghiggino 2009). The polarisation value can be calculated using an equation as
follows:
VHVV
VHVV
II
IIP
where P : Polarization value
IVV : fluorescence emission intensity measured in the plane parallel
to the plane of vertically polarised excitation
IVH : fluorescence emission intensity measured in the plane
perpendicular to the plane of vertically polarised excitation
or, alternatively, the anisotropy can be calculated using the following equation:
VHVV
VHVV
II
IIr
2
where r : anisotropy value
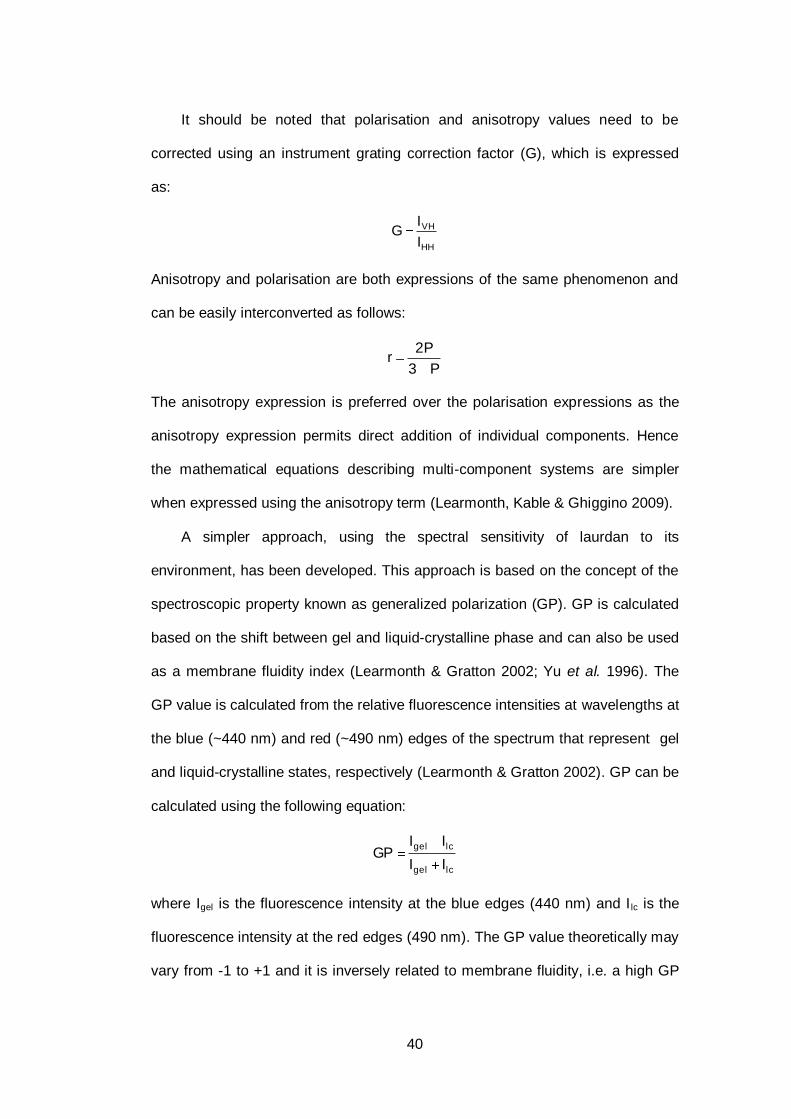
40
It should be noted that polarisation and anisotropy values need to be
corrected using an instrument grating correction factor (G), which is expressed
as:
HH
VH
I
IG
Anisotropy and polarisation are both expressions of the same phenomenon and
can be easily interconverted as follows:
P3
2Pr
The anisotropy expression is preferred over the polarisation expressions as the
anisotropy expression permits direct addition of individual components. Hence
the mathematical equations describing multi-component systems are simpler
when expressed using the anisotropy term (Learmonth, Kable & Ghiggino 2009).
A simpler approach, using the spectral sensitivity of laurdan to its
environment, has been developed. This approach is based on the concept of the
spectroscopic property known as generalized polarization (GP). GP is calculated
based on the shift between gel and liquid-crystalline phase and can also be used
as a membrane fluidity index (Learmonth & Gratton 2002; Yu et al. 1996). The
GP value is calculated from the relative fluorescence intensities at wavelengths at
the blue (~440 nm) and red (~490 nm) edges of the spectrum that represent gel
and liquid-crystalline states, respectively (Learmonth & Gratton 2002). GP can be
calculated using the following equation:
lcgel
lcgel
II
IIGP
where Igel is the fluorescence intensity at the blue edges (440 nm) and I lc is the
fluorescence intensity at the red edges (490 nm). The GP value theoretically may
vary from -1 to +1 and it is inversely related to membrane fluidity, i.e. a high GP
41
value means low fluidity (Butcher 2008; Learmonth & Gratton 2002; Yu et al.
1996). Due to the advantages noted above as well as facilitation of simpler and
more rapid measurements, laurdan GP was used as the measure of membrane
fluidity in this study.
1.7 Membrane Fluidity and Yeast Adaptation to Environmental Stress
Los & Murata (2004) defined fluidity of a membrane as the degree of
molecular disorder and molecular motion within a lipid bilayer. The fluidity of a
biological membrane has been used to explain qualitative characteristics of the
lipid bilayer. The fluidity of a membrane influences the rate of movement of
intramembrane particles in the plane of the bilayer. Movement of these particles,
such as membrane proteins, plays an intrinsic role in their function (Nipper 2007).
The lipid composition of a membrane is very important and is a major
determining factor in membrane fluidity and phase (Turk et al. 2004). Several
other factors may contribute to maintenance of membrane fluidity, as discussed
in Section 1.2.3, including temperature, phospholipid class distribution,
phospholipid fatty acyl saturation, ionic strength, pH, protectant molecules,
membrane proteins, sterols and cellular metabolic status (Learmonth 2011). Cells
must maintain their membrane fluidity in order to survive in severe conditions.
Changes in fluidity have been reported when microorganisms are subjected
to ethanol (Alexandre, Rousseaux & Charpentier 1994), hyperosmotic conditions,
salt, freezing, heat (Learmonth 2011) and organic solvents (Gutiérrez et al.
2003). Generally, when subjected to various stresses, the membrane fluidity will
decrease or increase (depending upon the particular stress), and eventually the
severity of the change may lead to disruption of the plasma membrane. For
example, at low temperatures, the membrane becomes more rigid whereas at
high temperatures, fluidization may occur. The same phenomena are also
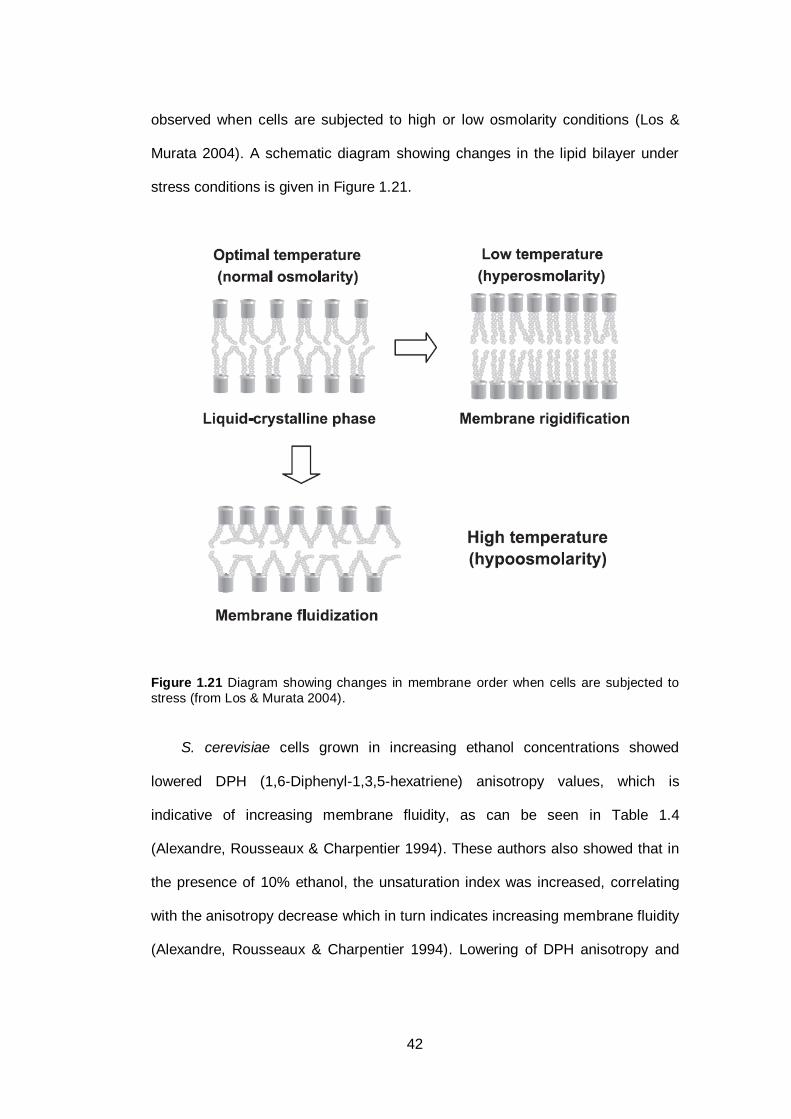
42
observed when cells are subjected to high or low osmolarity conditions (Los &
Murata 2004). A schematic diagram showing changes in the lipid bilayer under
stress conditions is given in Figure 1.21.
Figure 1.21 Diagram showing changes in membrane order when cells are subjected to
stress (from Los & Murata 2004).
S. cerevisiae cells grown in increasing ethanol concentrations showed
lowered DPH (1,6-Diphenyl-1,3,5-hexatriene) anisotropy values, which is
indicative of increasing membrane fluidity, as can be seen in Table 1.4
(Alexandre, Rousseaux & Charpentier 1994). These authors also showed that in
the presence of 10% ethanol, the unsaturation index was increased, correlating
with the anisotropy decrease which in turn indicates increasing membrane fluidity
(Alexandre, Rousseaux & Charpentier 1994). Lowering of DPH anisotropy and
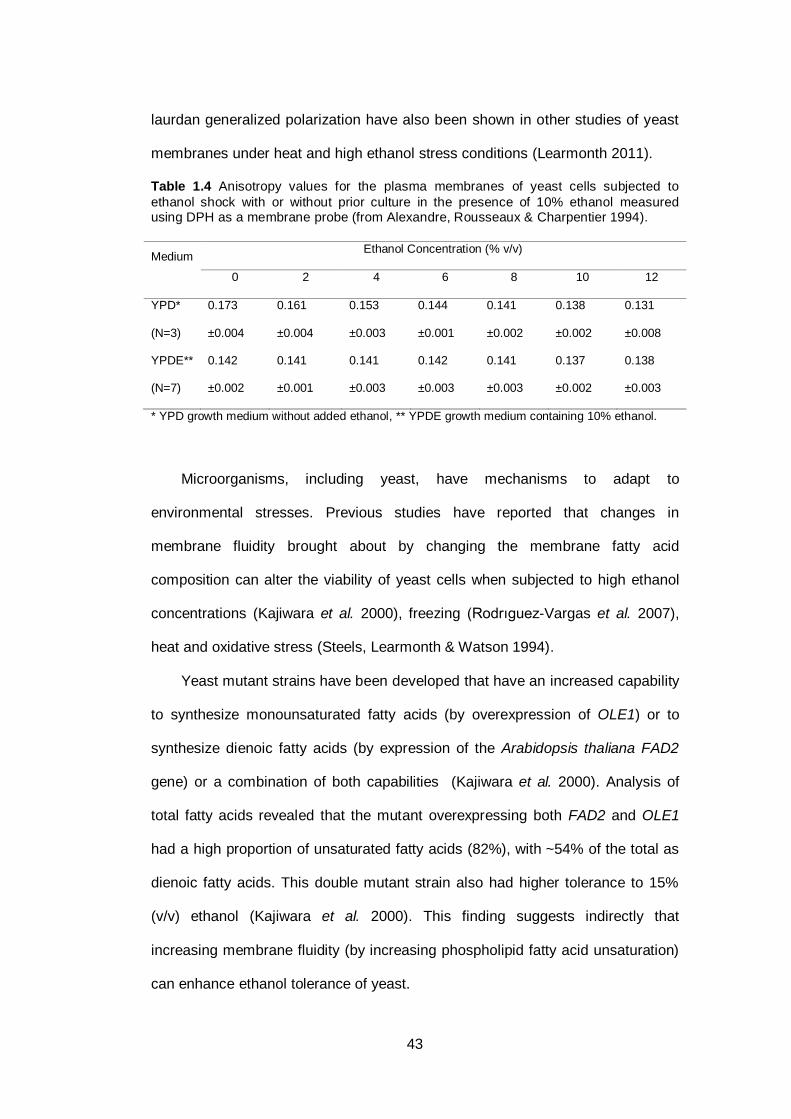
43
laurdan generalized polarization have also been shown in other studies of yeast
membranes under heat and high ethanol stress conditions (Learmonth 2011).
Table 1.4 Anisotropy values for the plasma membranes of yeast cells subjected to
ethanol shock with or without prior culture in the presence of 10% ethanol measured using DPH as a membrane probe (from Alexandre, Rousseaux & Charpentier 1994).
Medium Ethanol Concentration (% v/v)
0 2 4 6 8 10 12
YPD*
(N=3)
0.173
±0.004
0.161
±0.004
0.153
±0.003
0.144
±0.001
0.141
±0.002
0.138
±0.002
0.131
±0.008
YPDE**
(N=7)
0.142
±0.002
0.141
±0.001
0.141
±0.003
0.142
±0.003
0.141
±0.003
0.137
±0.002
0.138
±0.003
* YPD growth medium without added ethanol, ** YPDE growth medium containing 10% ethanol.
Microorganisms, including yeast, have mechanisms to adapt to
environmental stresses. Previous studies have reported that changes in
membrane fluidity brought about by changing the membrane fatty acid
composition can alter the viability of yeast cells when subjected to high ethanol
concentrations (Kajiwara et al. 2000), freezing (Rodrıguez-Vargas et al. 2007),
heat and oxidative stress (Steels, Learmonth & Watson 1994).
Yeast mutant strains have been developed that have an increased capability
to synthesize monounsaturated fatty acids (by overexpression of OLE1) or to
synthesize dienoic fatty acids (by expression of the Arabidopsis thaliana FAD2
gene) or a combination of both capabilities (Kajiwara et al. 2000). Analysis of
total fatty acids revealed that the mutant overexpressing both FAD2 and OLE1
had a high proportion of unsaturated fatty acids (82%), with ~54% of the total as
dienoic fatty acids. This double mutant strain also had higher tolerance to 15%
(v/v) ethanol (Kajiwara et al. 2000). This finding suggests indirectly that
increasing membrane fluidity (by increasing phospholipid fatty acid unsaturation)
can enhance ethanol tolerance of yeast.
44
Another study by Rodriguez-Vargas et al. (2007) investigated the influence of
membrane fluidity on the tolerance of the yeast cells. These authors developed a
mutant with the capability to synthesize dienoic fatty acids. The authors
expressed two Helianthus annuus desaturase genes, FAD2-1 and FAD2-3, in
wild type S. cerevisiae (strain W303) cells and determined the effect on
membrane fluidity and freezing tolerance. Expression of these genes increased
the unsaturation index and increased the membrane fluidity of the cells (indicated
by decreasing DPH polarization values). The mutant strains were found to have
lower polarization values, 0.116 ± 0.033 and 0.125 ± 0.020 for W303FAD2-1 and
W303FAD2-3 strains, respectively, compared to control W303 cells strain (0.160
± 0.016). The mutant strains had higher tolerance than the wild type to freezing
stress.
1.8 Outline of Investigations in this Project
Ethanol tolerance is considered to be one of the most important factors in
producing maximal amounts of ethanol and increasing efficiency in the fuel
ethanol industry, along with improving metabolic flux and fermentation rate. There
are many factors affecting yeast ethanol tolerance, including the genetic makeup
of the yeasts, culture conditions (e.g. temperature, pH) and composition of
nutrients and other beneficial molecules in the culture medium. This study was
designed to primarily investigate the latter factors and commenced with
laboratory scale investigations using defined laboratory media. Several yeast
strains with differing intrinsic ethanol tolerance were investigated. Components of
the yeast growth medium were modified in order to determine conditions that
favour the highest ethanol tolerance. In particular, following up on recent
publications, investigations focused on the effects of the sugar inositol (Chi,
Kohlwein & Paltauf 1999) and the amino acid L-proline (Takagi 2008), which
45
have shown some promise as stress tolerance enhancers. Despite this positive
role, excess of these substances in the growth medium may be detrimental to the
yeast. Therefore, it was planned to vary the inositol and L-proline content of
growth media in order to define concentrations that potentiate the highest ethanol
tolerance of the yeast. The aim was also to compare these findings to other
known tolerance-enhancing components such as unsaturated fatty acids (You,
Rosenfield & Knipple 2003) and mineral ions (Xue et al. 2008).
1.8.1 Objectives
The objectives of this research were to:
1. determine (amongst the novel yeast strains studied) the most appropriate
yeast strain and culture condition to improve the efficiency of bioethanol
production, considering ethanol tolerance and ethanol production
2. determine the most appropriate concentrations for supplementation of
growth media with L-proline or inositol to improve ethanol tolerance and/or
production.
3. investigate the effect of addition of L-proline or inositol to growth media
on membrane fluidity and to relate this to ethanol tolerance.
Chemically defined media were used in the laboratory experiments to
minimize the effect of variability of medium components that might affect the
ethanol tolerance or fermentation productivity. The experimental design included
several yeast strains with different levels of ethanol tolerance. The parameters
measured included fermentation rate, yeast cell count, cell division rate and
viability, membrane fluidity and ethanol tolerance.

46
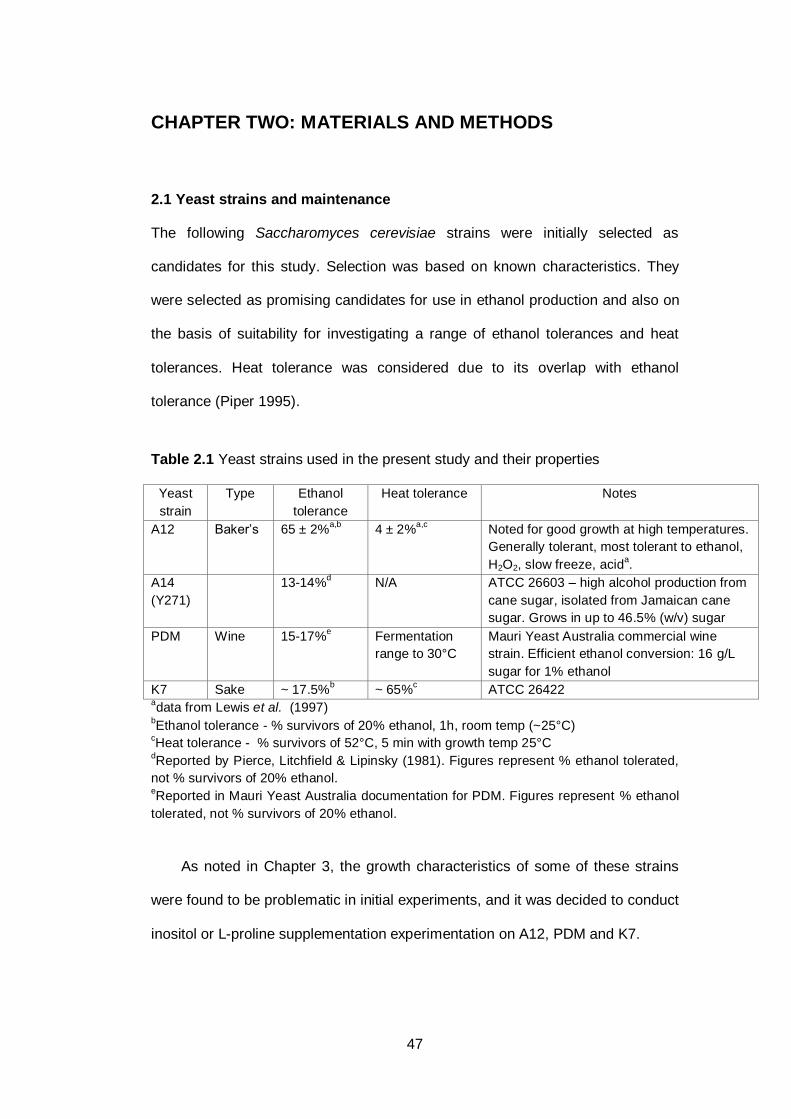
47
CHAPTER TWO: MATERIALS AND METHODS
2.1 Yeast strains and maintenance
The following Saccharomyces cerevisiae strains were initially selected as
candidates for this study. Selection was based on known characteristics. They
were selected as promising candidates for use in ethanol production and also on
the basis of suitability for investigating a range of ethanol tolerances and heat
tolerances. Heat tolerance was considered due to its overlap with ethanol
tolerance (Piper 1995).
Table 2.1 Yeast strains used in the present study and their properties
Yeast
strain
Type Ethanol
tolerance
Heat tolerance Notes
A12 Baker’s 65 ± 2%a,b
4 ± 2%a,c
Noted for good growth at high temperatures.
Generally tolerant, most tolerant to ethanol,
H2O2, slow freeze, acida.
A14
(Y271)
13-14%d
N/A ATCC 26603 – high alcohol production from
cane sugar, isolated from Jamaican cane
sugar. Grows in up to 46.5% (w/v) sugar
PDM Wine 15-17%e
Fermentation
range to 30°C
Mauri Yeast Australia commercial wine
strain. Efficient ethanol conversion: 16 g/L
sugar for 1% ethanol
K7 Sake ~ 17.5%b
~ 65%c
ATCC 26422 adata from Lewis et al. (1997)
bEthanol tolerance - % survivors of 20% ethanol, 1h, room temp (~25°C)
cHeat tolerance - % survivors of 52°C, 5 min with growth temp 25°C
dReported by Pierce, Litchfield & Lipinsky (1981). Figures represent % ethanol tolerated,
not % survivors of 20% ethanol. eReported in Mauri Yeast Australia documentation for PDM. Figures represent % ethanol
tolerated, not % survivors of 20% ethanol.
As noted in Chapter 3, the growth characteristics of some of these strains
were found to be problematic in initial experiments, and it was decided to conduct
inositol or L-proline supplementation experimentation on A12, PDM and K7.
48
Yeast strains were maintained on slopes of a complete medium, yeast
extract peptone (YEP), containing (w/v) 0.5% yeast extract, 0.5% bacteriological
peptone, 0.3% (NH4)2SO4, 0.3% KH2PO4, 1% glucose and 1.5% agar. Slopes
were stored at 4 C and sub-cultured every 6 months. Master cultures were
stored in a Sanyo –80°C freezer.
2.2 Growth media and culture conditions
Cells were grown in the defined medium YNB (Yeast Nitrogen Base) broth
containing 2% glucose and 0.67% Yeast Nitrogen Base (Difco). In initial
experiments, L-proline and inositol were added to experimental cultures with
various concentrations as follows:
L- Proline: 0, 0.1, 0.5, 1, 2, and 3 g/L
myo- Inositol : 0, 0.005, 0.05, 0.1, 0.15 and 0.2 g/L
As the YNB medium already had inositol as a component, the 0 g/L inositol
supplementation actually had about 0.002 g/L inositol.
YNB media were prepared by weighing out the required amount and
dissolving it in MilliQ grade water, filter sterilizing using 0.22 m pore size sterile
syringe filters (Sarstedt) and storing at 4 C. Sterilization via autoclaving could
not be performed, as this resulted in an increased autofluorescence which
interfered with the interpretation of steady-state fluorescence results. Media were
prepared on a monthly basis or as required. Supplements were freshly prepared
and sterilized by filtering through 0.22 m pore size sterile syringe filters.
Starter cultures were inoculated from slopes and grown overnight (~16 h) at
30 C and 180 opm in an orbital shaker (Paton). For L-proline and inositol
addition experiments, L-proline and inositol were added to the experimental
culture at a final concentration as mentioned above at a time designated as 0 h.
49
2.3 Experimental batch culture conditions and sampling
Aerobic cultures were prepared by aseptically adding YNB media to sterile
Erlenmeyer flasks, each sealed with an oxygen-permeable cotton wool bung, and
then inoculating to give an initial viable cell number of ~106
cells/mL. The ratio of
flask size to culture volume was 4:1 to ensure adequate oxygen mixing.
Samples from the cultures were aseptically removed by drawing off with a
micro pipette every 6 hours from 0 to 30 hours. Examination of the samples
included measuring growth rate by measuring optical density, viable cell
numbers, % budding and glucose and ethanol concentrations. Detailed analysis
including ethanol tolerance and membrane fluidity was performed at 6 and 24 h.
2.4 Growth Rate
Yeast growth was monitored by measuring optical density of the culture at
600 nm (OD600nm) using a Beckman DU 650 spectrophotometer, making dilutions
where necessary. Measurements were made using 1 mL (10 mm path length)
PMMA cuvettes (Sarstedt).
2.5 Viable Cell Numbers
Viable cell numbers were assessed using the methylene violet staining
method and light microscopy (400x magnification) using a Neubauer-type
haemocytometer. Methylene violet staining is proposed as a better method for
monitoring yeast cell viability compared to the traditional methylene blue staining
method (Smart et al. 1999).
An equal volume of the sample was mixed with methylene violet solution
(0.01% w/v in 2% sodium citrate solution) (Smart et al. 1999). Methylene violet
crosses the membrane of all cells but in dead cells is unable to be metabolized,
as a consequence dead yeast cells stained violet. Viable cells are able to
50
metabolize methylene violet and as a result are unstained under the microscope.
The number of viable cells in 1 mL of cultures was then calculated as follows:
The cells in 5 of the small squares in the centre 5 x 5 grids were counted
and counts averaged. Each of the 25 squares is divided into 16 sub squares.
Each of the 16 sub squares is 1/400 mm2 in area. The depth is 0.1 mm.
So, if 1 of these 25 small squares were counted:
Volume counted = 16/400 mm2 x 0.1 mm (depth)
So cells/mL = 400/16 x 10 (per mm3) x 1000 (mm3 to cm3 = mL)
i.e. cells counted x 2.5 x 10⁵ cells/mL.
So for 5 squares counted: Cells/mL = Cell count 5 x 2.5 x 105
2.6 Percent Viable Cells
When counting, both live and dead cells were recorded, to give the total cells
per mL. The number of viable cells were then divided by the total cells and
multiplied by 100 to give the percentage of viable cells.
2.7 Percent Budding
When counting, both budding and non-budding cells were recorded as an
indicator of cell growth rate. The number of budding cells was then divided by the
total number cells and multiplied by 100 to give the percentage of budding cells.
2.8 Determination of membrane fluidity by spectrofluorometric analysis
2.8.1 Labelling of cells
Membrane fluidity was assessed using steady-state fluorescence
spectroscopy, measuring generalized polarization of 6-dodecanoyl-2-
51
dimethylaminonaphthalene (laurdan) following incorporation of the probe into
yeast plasma membranes, as outlined by Learmonth (2011).
For labelling, an aliquot of washed cells was standardized by diluting with
centrifuged (8800 g) supernatant to an OD600nm of 0.4 and a volume of 3 mL in a
cuvette. Incorporation of the fluorescent probe into yeast cell membranes was
accomplished by incubating the standardized washed cell sample with a final
concentration of 5 µM laurdan [by adding 6 µL of 2.5 mM laurdan (in ethanol)] for
60 minutes. Samples were incubated at 30 C in the dark with stirring.
2.8.2 Protocol for setting up PC1 to conduct spectrofluorimetric analysis
Fluorescence measurements were taken with a PC1 photon-counting
spectrofluorometer (ISS Inc., Illinois USA). The illuminator current dial was first
turned anticlockwise to its lowest setting (10 amps) and then the instrument was
switched on. The lamp was allowed to warm up for 10 minutes, after which the
amperage was increased to 18 amps. It should be noted that it was important to
turn on the lamp 30 minutes prior to use, to allow the lamp to stabilize. The
heater/circulator button on the thermocirculator was turned on and the
temperature dial was set to the required temperature. The thermocirculator
regulates the temperature of the temperature-controlled stirrer of the cuvette
holder. The PC1 spectrofluorometer main power was then switched on and the
fan checked to make sure it was functioning. The computer was turned on and
the Vinci software started. The calibration of the instrument slits and excitation
and emission monochromators were checked prior to experimentation.
2.8.3 Measurement of Generalized Polarization of laurdan localized in yeast
membranes
In this study, the fluorescent probe laurdan was used to measure
Generalized Polarization, as described by Parasssi et al. (1990) and applied to
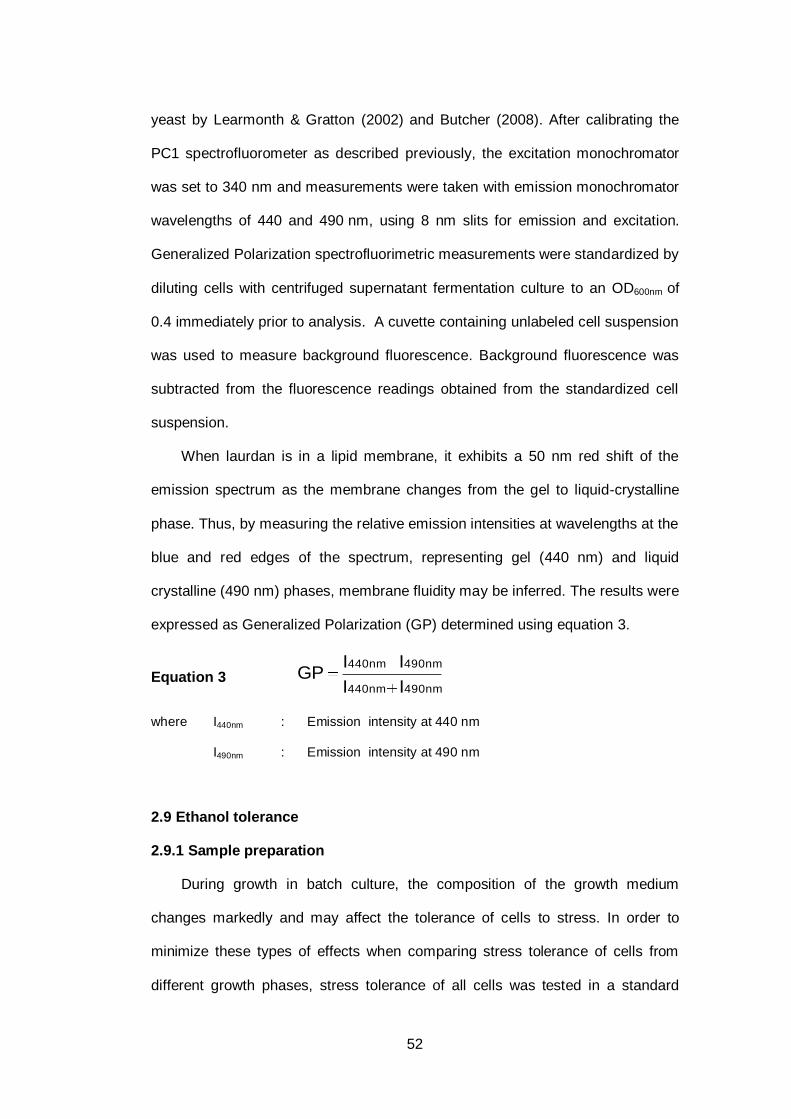
52
yeast by Learmonth & Gratton (2002) and Butcher (2008). After calibrating the
PC1 spectrofluorometer as described previously, the excitation monochromator
was set to 340 nm and measurements were taken with emission monochromator
wavelengths of 440 and 490 nm, using 8 nm slits for emission and excitation.
Generalized Polarization spectrofluorimetric measurements were standardized by
diluting cells with centrifuged supernatant fermentation culture to an OD600nm of
0.4 immediately prior to analysis. A cuvette containing unlabeled cell suspension
was used to measure background fluorescence. Background fluorescence was
subtracted from the fluorescence readings obtained from the standardized cell
suspension.
When laurdan is in a lipid membrane, it exhibits a 50 nm red shift of the
emission spectrum as the membrane changes from the gel to liquid-crystalline
phase. Thus, by measuring the relative emission intensities at wavelengths at the
blue and red edges of the spectrum, representing gel (440 nm) and liquid
crystalline (490 nm) phases, membrane fluidity may be inferred. The results were
expressed as Generalized Polarization (GP) determined using equation 3.
Equation 3 490nm440nm
490nm440nm
II
IIGP
where I440nm : Emission intensity at 440 nm
I490nm : Emission intensity at 490 nm
2.9 Ethanol tolerance
2.9.1 Sample preparation
During growth in batch culture, the composition of the growth medium
changes markedly and may affect the tolerance of cells to stress. In order to
minimize these types of effects when comparing stress tolerance of cells from
different growth phases, stress tolerance of all cells was tested in a standard
53
medium, namely yeast nitrogen base without glucose (YNBNG) (Lewis et al.
1997). Samples (1 mL) of culture were centrifuged at 1500 g for 2-3 minutes, the
supernatant growth medium was decanted and the pellet resuspended in the
original volume of YNBNG. Resuspended cells were then tested for stress
tolerance.
2.9.2 Ethanol tolerance test
The concentration of ethanol and time exposure to ethanol used in the
ethanol tolerance test were based on the work of Chi & Arneborg (2000) and
Lewis (1993) with slight modification. A 410 μL sample cells was added to a tube
containing 90 μL of absolute ethanol and the sample was mixed immediately,
exposing the cells to 18% v/v ethanol. The tube was incubated at 30°C for 60
minutes. The number of surviving cells was determined using two methods which
were methylene violet staining and total plate count.
For the methylene violet staining method, the stress was relieved by making
a five- (for 6 h culture) or ten-fold (for 24 h culture) dilution in MilliQ water. The
percentage of viable cells was then calculated as described in section 2.5. The
result of this viability calculation was then expressed as ―viability reduction‖
(referred as viability reduction by methylene violet staining (VR MVS) in this
thesis) as calculated using the following equation:
viability control - viability testVR MVS (%) = × 100%
viability control
For the total plate count method, after the stress period the samples were
diluted using YNBNG to give serial ten-fold dilutions. Then, 100 µL of each
diluted sample was spread on YEP agar plates, and incubated for about 72 hours
at room temperature before counting the resultant colonies. The result was also
expressed as ―viability reduction‖ (referred to as viability reduction by total plate
count (VR TPC) in this thesis) as calculated using the following equation:
54
total viable cell control - total viable cell testVR TPC (%) = × 100%
total viable cell control
The extra 18% dilution of the cells resulting from the addition of ethanol was
taken into account during the calculation of the viable count. The tubes with 90
μL of ethanol were prepared immediately before the experiment as the solvent
may evaporate quickly and the small volume could allow substantial changes in
the final concentration.
2.10 Measurement of glucose, ethanol, L-proline and inositol using HPLC
The amount of glucose, ethanol, L-proline and inositol was determined by
measuring the compounds in the growth media compared to the initial
concentration at the beginning of the fermentation (0 h) using HPLC.
2.10.1 Instrumentation
The HPLC system (Shimadzu) consisted of SIL-20A auto sampler, DGU
20A5 in-line degasser, LC-20AD solvent delivery module, CTO 20A column oven,
SPD M20A photo diode array detector, RID 10A refractive index detector, and
Class-VP software. The apparatus was connected to a PC with a CBM 20A
communication bus module. The spectrum was scanned for 195, 200, 210 and
220 nm using PDA (Photodiode array) detector. RID (refractive index detector)
spectrum was also recorded. After comparison of PDA and RID spectra, RID was
preferred for the present series of experiments as it produces more reliable
spectra and can detect all the desired compounds.
2.10.2 Column
A Waters Sugar-Pak I HPLC column (part no. 85118) with dimensions of 6.5
× 300 mm was used for the separation of analytes. The stationary phase of the
55
column is sulfonated styrene divinylbenzene resin in calcium form. The column
was maintained at 80°C. A guard column was used to prevent column damage.
2.10.3 Mobile phase
The mobile phase was deionized MilliQ water (resistivity ~ 18 Mohm)
containing 5 mg/L CaNa2-EDTA (Sigma Aldrich) filtered through a 0.45 µm pore
size filter. The mobile phase was passed through an in-line degasser to ensure
that the mobile phase was gas free. The flow rate was maintained at 0.6 mL/min.
Prior to the initial use, and after running about 150 samples, the column was
reconditioned by passing through a 500 mg/L CaNa2-EDTA solution at 80°C at a
0.5 mL/min flow rate for at least 2 hours in the reverse direction.
2.11 Determination of total sugar concentration by the phenol-sulphuric
acid method
While the HPLC analytical methods were being worked up, in the initial
experiments (Chapter 3) determination of glucose was performed using the
phenol-sulphuric acid method as described by Dubois et al. (1956). To prepare a
standard curve a series of glucose solutions were prepared to give final
concentrations of 0, 20, 40, 60, 80, and 100 µg/mL. A volume of 150 μL of either
standard or sample solution was then added to a reaction tube, to which 150 μL
of 5% phenol solution in water was added. When necessary, samples were
diluted to ensure experimental readings fell within the standard curve. The tubes
were then mixed and stood at room temperature for 5 minutes. Then 750 μL of
concentrated sulphuric acid was added rapidly; the tubes were then vortexed and
placed on a hot plate (100°C) for 10 minutes. After cooling to room temperature,
the absorbance of the standards and samples were read at 490 nm with a
Beckman DU650 spectrophotometer, using the reagent blank to zero the
56
spectrophotometer. A standard curve was plotted and this was used to calculate
the concentration of glucose in each of the samples.
2.12 Statistical Analysis
Raw data was initially compiled into Minitab 15® for Windows®. This software
package was then used to perform one way analysis of variance (one way
ANOVA) which compared the variance of each parameter (i.e. GP, viability
reduction) between the three strains with the variability within each replicate
experiment of the same strain. Significant differences between the data were
determined based on the p value. When p < 0.05, the null hypothesis was
rejected, which means there is a significant difference between the data. When
significant differences were detected in the one way ANOVA, the test was
followed by the Fisher’s LSD (least significant difference) test to determine which
data differed significantly.
57
CHAPTER THREE: INITIAL EXPERIMENTS ON
FERMENTATION PERFORMANCE OF Saccharomyces
cerevisiae IN MEDIA WITH HIGH SUGAR
CONCENTRATIONS
3.1 Introduction
3.1.1 General Introduction
In industrial processes, it is common to use feedstocks with high sugar
concentration. A high sugar concentration at the initial step of fermentation may
lead to higher amounts of ethanol produced at the end of the fermentation. This
will lower production costs as it will reduce the water and energy processing
requirements for distillation. However, when a high sugar concentration is initially
present in fermentation media, yeast cells are exposed to high osmotic stress.
This is not ideal for yeast cells, and the fermentation may become stuck
(Bafrncová et al. 1999). When basal media were used in fermentation
experiments, sugar was not fully utilized by yeast cells, leading to high residual
sugar at the end of the fermentation (Bafrncová et al. 1999; Reddy & Reddy
2006; Thomas, Hynes & Ingledew 1994). Cell viability, sugar uptake and ethanol
productivity have been enhanced by supplementation of media with excess
assimilable nitrogen in the form of yeast extract, casamino acids and other
supplements such as glycine, glycine betaine, proline, finger millet flour, soya
flour and yeast cell walls (Bafrncová et al. 1999; Reddy & Reddy 2006; Thomas,
Hynes & Ingledew 1994; Thomas & Ingledew 1990).
Most experiments with high sugar concentration have used complex medium
such as yeast extract, peptone, casamino acids, wheat hydrolysate or corn
hydrolysate (Bafrncová et al. 1999; Reddy & Reddy 2006; Thomas et al. 1993;
Wang et al. 2007). However, these media components include fluorophores, and
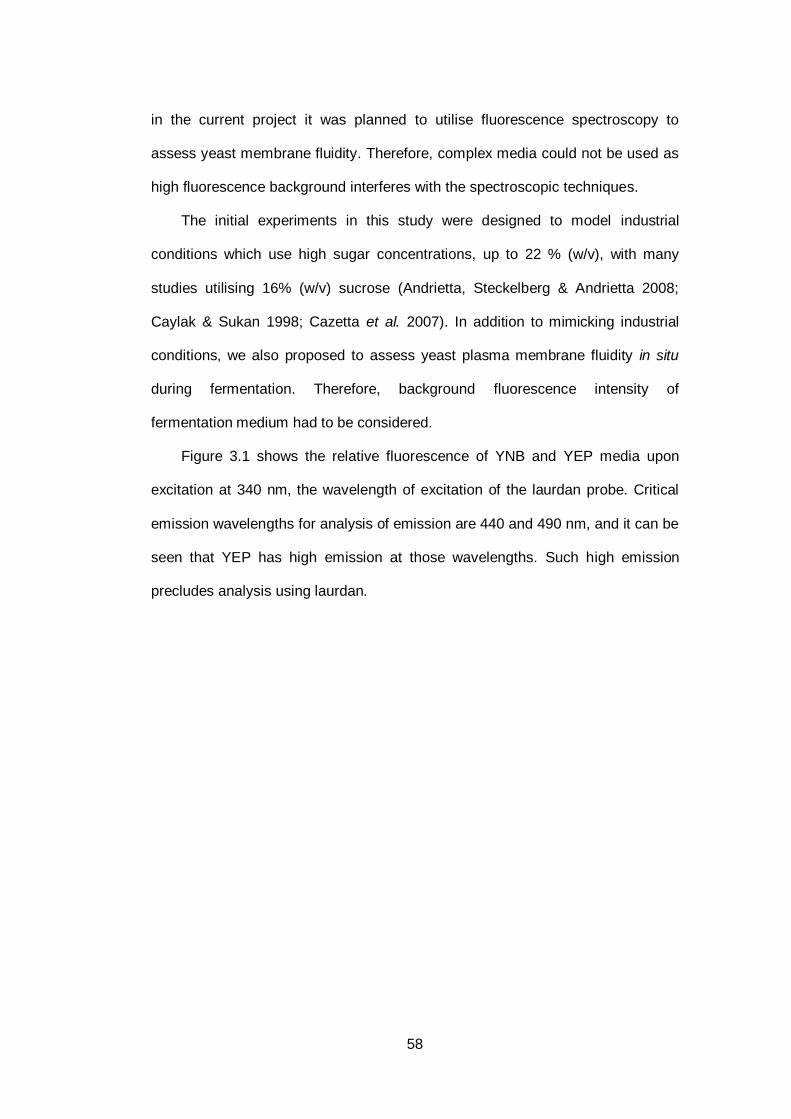
58
in the current project it was planned to utilise fluorescence spectroscopy to
assess yeast membrane fluidity. Therefore, complex media could not be used as
high fluorescence background interferes with the spectroscopic techniques.
The initial experiments in this study were designed to model industrial
conditions which use high sugar concentrations, up to 22 % (w/v), with many
studies utilising 16% (w/v) sucrose (Andrietta, Steckelberg & Andrietta 2008;
Caylak & Sukan 1998; Cazetta et al. 2007). In addition to mimicking industrial
conditions, we also proposed to assess yeast plasma membrane fluidity in situ
during fermentation. Therefore, background fluorescence intensity of
fermentation medium had to be considered.
Figure 3.1 shows the relative fluorescence of YNB and YEP media upon
excitation at 340 nm, the wavelength of excitation of the laurdan probe. Critical
emission wavelengths for analysis of emission are 440 and 490 nm, and it can be
seen that YEP has high emission at those wavelengths. Such high emission
precludes analysis using laurdan.
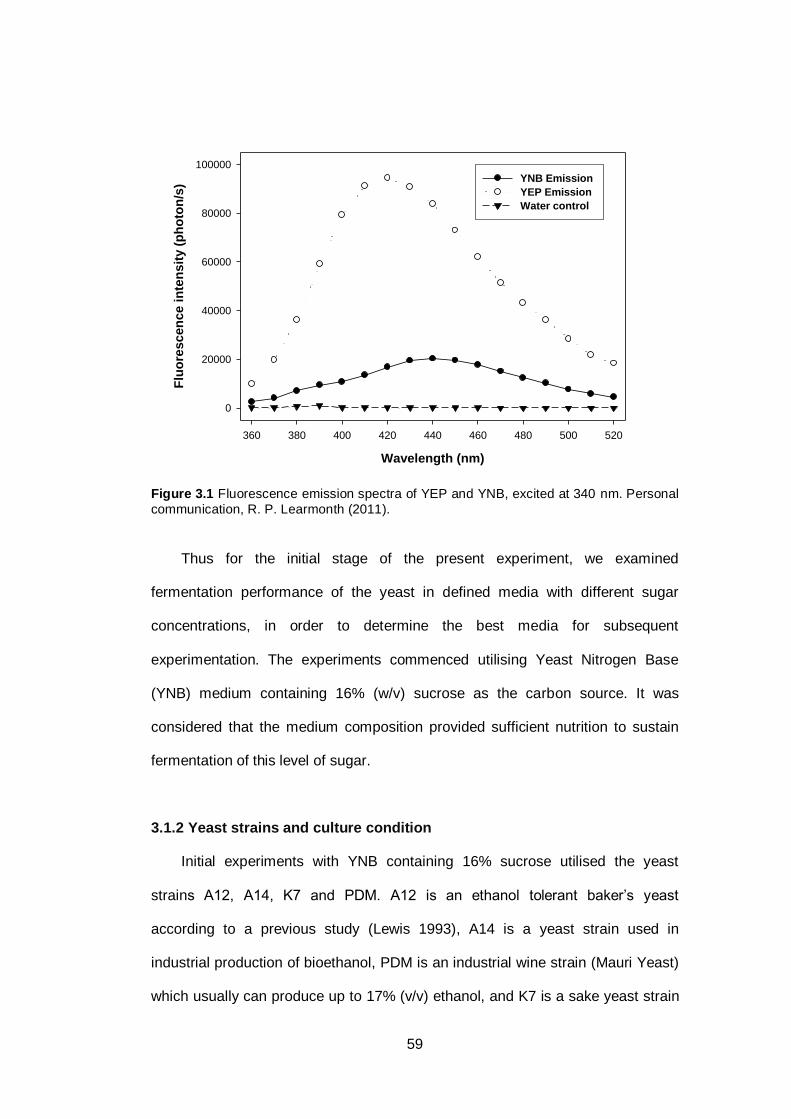
59
Wavelength (nm)
360 380 400 420 440 460 480 500 520
Flu
ore
sc
en
ce
in
ten
sit
y (
ph
oto
n/s
)
0
20000
40000
60000
80000
100000
YNB Emission
YEP Emission
Water control
Figure 3.1 Fluorescence emission spectra of YEP and YNB, excited at 340 nm. Personal
communication, R. P. Learmonth (2011).
Thus for the initial stage of the present experiment, we examined
fermentation performance of the yeast in defined media with different sugar
concentrations, in order to determine the best media for subsequent
experimentation. The experiments commenced utilising Yeast Nitrogen Base
(YNB) medium containing 16% (w/v) sucrose as the carbon source. It was
considered that the medium composition provided sufficient nutrition to sustain
fermentation of this level of sugar.
3.1.2 Yeast strains and culture condition
Initial experiments with YNB containing 16% sucrose utilised the yeast
strains A12, A14, K7 and PDM. A12 is an ethanol tolerant baker’s yeast
according to a previous study (Lewis 1993), A14 is a yeast strain used in
industrial production of bioethanol, PDM is an industrial wine strain (Mauri Yeast)
which usually can produce up to 17% (v/v) ethanol, and K7 is a sake yeast strain
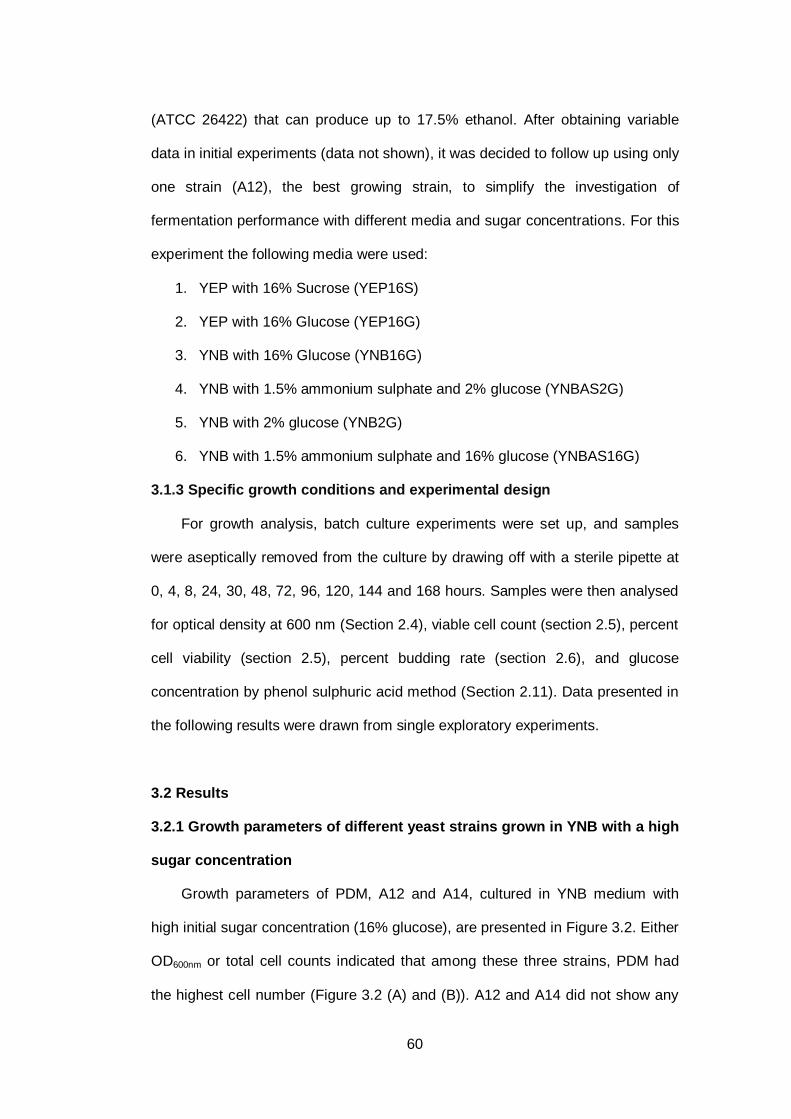
60
(ATCC 26422) that can produce up to 17.5% ethanol. After obtaining variable
data in initial experiments (data not shown), it was decided to follow up using only
one strain (A12), the best growing strain, to simplify the investigation of
fermentation performance with different media and sugar concentrations. For this
experiment the following media were used:
1. YEP with 16% Sucrose (YEP16S)
2. YEP with 16% Glucose (YEP16G)
3. YNB with 16% Glucose (YNB16G)
4. YNB with 1.5% ammonium sulphate and 2% glucose (YNBAS2G)
5. YNB with 2% glucose (YNB2G)
6. YNB with 1.5% ammonium sulphate and 16% glucose (YNBAS16G)
3.1.3 Specific growth conditions and experimental design
For growth analysis, batch culture experiments were set up, and samples
were aseptically removed from the culture by drawing off with a sterile pipette at
0, 4, 8, 24, 30, 48, 72, 96, 120, 144 and 168 hours. Samples were then analysed
for optical density at 600 nm (Section 2.4), viable cell count (section 2.5), percent
cell viability (section 2.5), percent budding rate (section 2.6), and glucose
concentration by phenol sulphuric acid method (Section 2.11). Data presented in
the following results were drawn from single exploratory experiments.
3.2 Results
3.2.1 Growth parameters of different yeast strains grown in YNB with a high
sugar concentration
Growth parameters of PDM, A12 and A14, cultured in YNB medium with
high initial sugar concentration (16% glucose), are presented in Figure 3.2. Either
OD600nm or total cell counts indicated that among these three strains, PDM had
the highest cell number (Figure 3.2 (A) and (B)). A12 and A14 did not show any
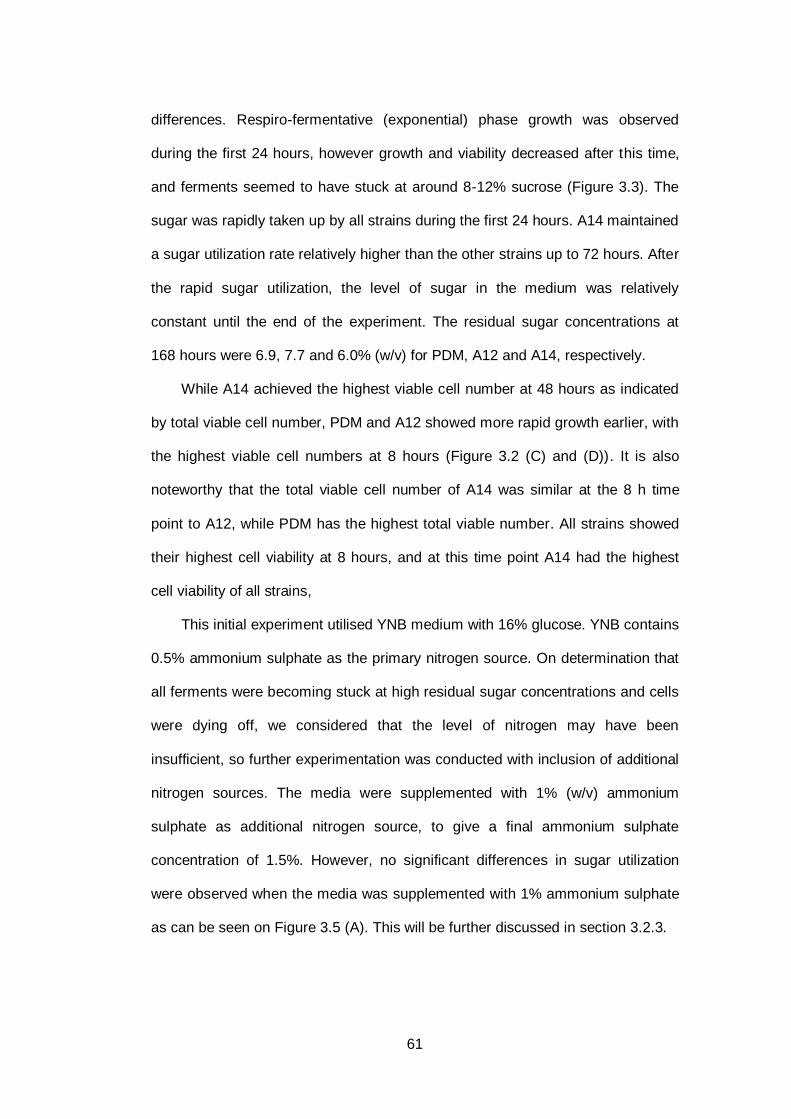
61
differences. Respiro-fermentative (exponential) phase growth was observed
during the first 24 hours, however growth and viability decreased after this time,
and ferments seemed to have stuck at around 8-12% sucrose (Figure 3.3). The
sugar was rapidly taken up by all strains during the first 24 hours. A14 maintained
a sugar utilization rate relatively higher than the other strains up to 72 hours. After
the rapid sugar utilization, the level of sugar in the medium was relatively
constant until the end of the experiment. The residual sugar concentrations at
168 hours were 6.9, 7.7 and 6.0% (w/v) for PDM, A12 and A14, respectively.
While A14 achieved the highest viable cell number at 48 hours as indicated
by total viable cell number, PDM and A12 showed more rapid growth earlier, with
the highest viable cell numbers at 8 hours (Figure 3.2 (C) and (D)). It is also
noteworthy that the total viable cell number of A14 was similar at the 8 h time
point to A12, while PDM has the highest total viable number. All strains showed
their highest cell viability at 8 hours, and at this time point A14 had the highest
cell viability of all strains,
This initial experiment utilised YNB medium with 16% glucose. YNB contains
0.5% ammonium sulphate as the primary nitrogen source. On determination that
all ferments were becoming stuck at high residual sugar concentrations and cells
were dying off, we considered that the level of nitrogen may have been
insufficient, so further experimentation was conducted with inclusion of additional
nitrogen sources. The media were supplemented with 1% (w/v) ammonium
sulphate as additional nitrogen source, to give a final ammonium sulphate
concentration of 1.5%. However, no significant differences in sugar utilization
were observed when the media was supplemented with 1% ammonium sulphate
as can be seen on Figure 3.5 (A). This will be further discussed in section 3.2.3.
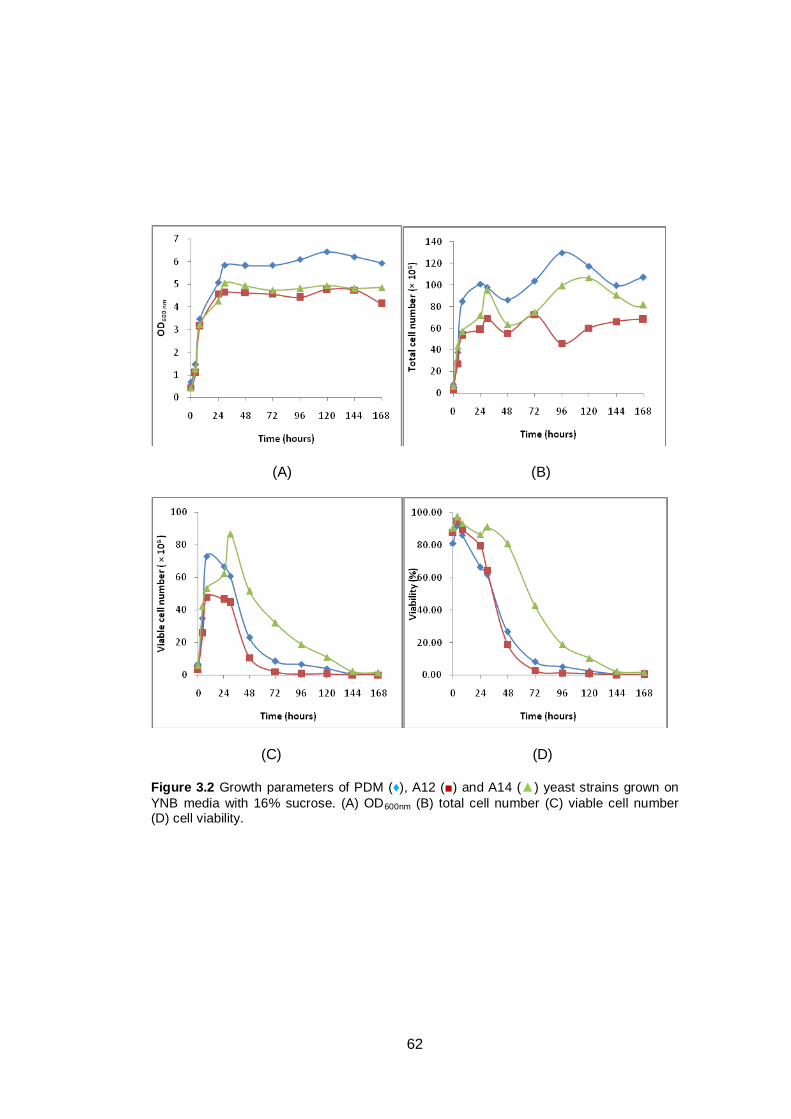
62
(A) (B)
(C) (D)
Figure 3.2 Growth parameters of PDM (♦), A12 (■) and A14 (▲) yeast strains grown on
YNB media with 16% sucrose. (A) OD600nm (B) total cell number (C) viable cell number (D) cell viability.
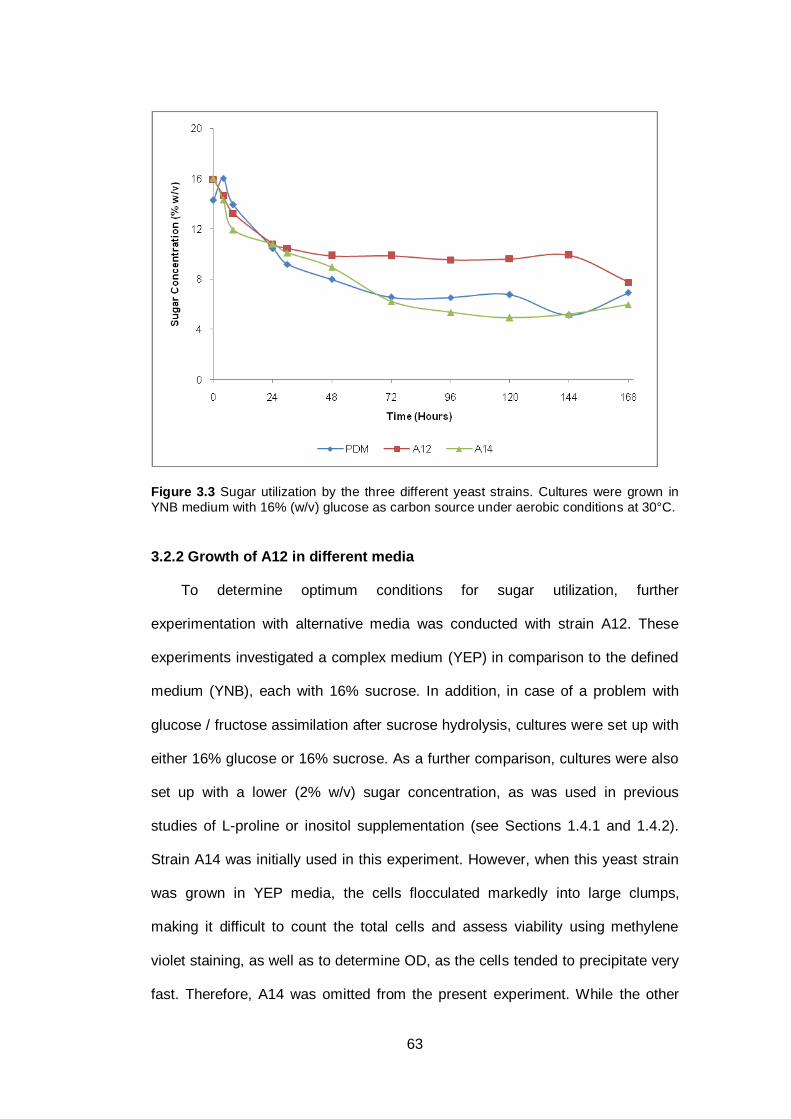
63
Figure 3.3 Sugar utilization by the three different yeast strains. Cultures were grown in
YNB medium with 16% (w/v) glucose as carbon source under aerobic conditions at 30°C.
3.2.2 Growth of A12 in different media
To determine optimum conditions for sugar utilization, further
experimentation with alternative media was conducted with strain A12. These
experiments investigated a complex medium (YEP) in comparison to the defined
medium (YNB), each with 16% sucrose. In addition, in case of a problem with
glucose / fructose assimilation after sucrose hydrolysis, cultures were set up with
either 16% glucose or 16% sucrose. As a further comparison, cultures were also
set up with a lower (2% w/v) sugar concentration, as was used in previous
studies of L-proline or inositol supplementation (see Sections 1.4.1 and 1.4.2).
Strain A14 was initially used in this experiment. However, when this yeast strain
was grown in YEP media, the cells flocculated markedly into large clumps,
making it difficult to count the total cells and assess viability using methylene
violet staining, as well as to determine OD, as the cells tended to precipitate very
fast. Therefore, A14 was omitted from the present experiment. While the other
64
strains maintained essentially unicellular cultures, A12 was considered the best
strain for further experimentation.
Based on OD data, yeast grown in YNB media, either supplemented or not
supplemented by an additional 1% ammonium sulphate, showed respiro-
fermentative (exponential) growth up to 8 hours, and started to slow at 24 hours.
In contrast, yeast grown in YEP media still showed high cell growth rates up to 96
hours. OD data clearly indicate that yeast cells grown in YEP can reach higher
cell densities. Yeast grown in YEP with glucose showed the highest OD followed
by cells grown in YEP with sucrose.
In Figure 3.4 it can be seen that yeast cells grown in YEP with glucose
showed the highest total cell number, confirming the OD data. However, the total
cell number for yeast cells grown in YEP with sucrose was not different to that of
yeast grown in YNB media. All cultures grown in YNB media showed a similar
pattern. During the first 8 hours, cells grown in YNB or YEP with sucrose showed
respiro-fermentative (exponential) growth, with growth starting to decline at 24
hours. However, cell counts of yeast grown in YEP with sucrose (or glucose, to a
lesser extent) were moderately increased again at about 120 hours, indicating a
small secondary fermentation.
Viable cell numbers and cell viability data showed similar patterns in all
medium compositions. The number of viable cells increased rapidly during the
first 8 hours. Yeast cells grown in YEP maintained a higher viable cell number
and % viability than cells grown in YNB.
3.2.3 Sugar utilization by the A12 yeast strain in different media
Sugar was rapidly assimilated during the first 24 hours of fermentation
(Figure 3.5 A) in all media (either YEP or YNB-based media, and either sucrose
or glucose as sugar source). After 24 hours, yeast grown in YNB-based media
65
seemed to stop utilizing sugar, as indicated by relatively constant sugar levels
throughout the remainder of the experiment. Supplementation of YNB containing
16% glucose with 1.5% ammonium sulphate did not ameliorate the stuck
fermentation, indicating that something additional to nitrogen nutrition was
problematic. However, yeast grown in the nutritionally rich YEP media still
assimilated the sugars up to 168 hours of fermentation and therefore the sugar
was almost completely utilized, with only 0.5% w/v sucrose or 0.3% w/v glucose
remaining at 168 hours. In contrast to the results with 16% sugar, in Figure 3.5 B
it can be seen that YNB, with or without added 1% ammonium sulphate, was
nutritionally sufficient to sustain complete utilisation of 2% glucose.
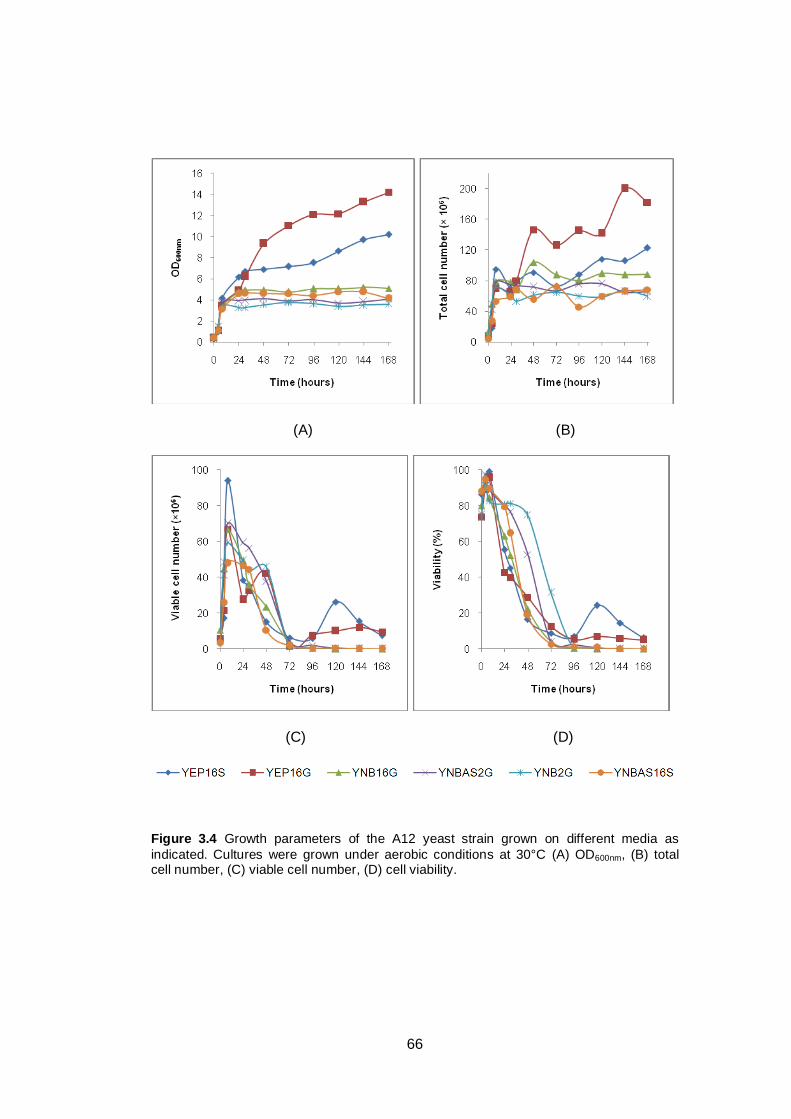
66
(A) (B)
(C) (D)
Figure 3.4 Growth parameters of the A12 yeast strain grown on different media as
indicated. Cultures were grown under aerobic conditions at 30°C (A) OD600nm, (B) total cell number, (C) viable cell number, (D) cell viability.
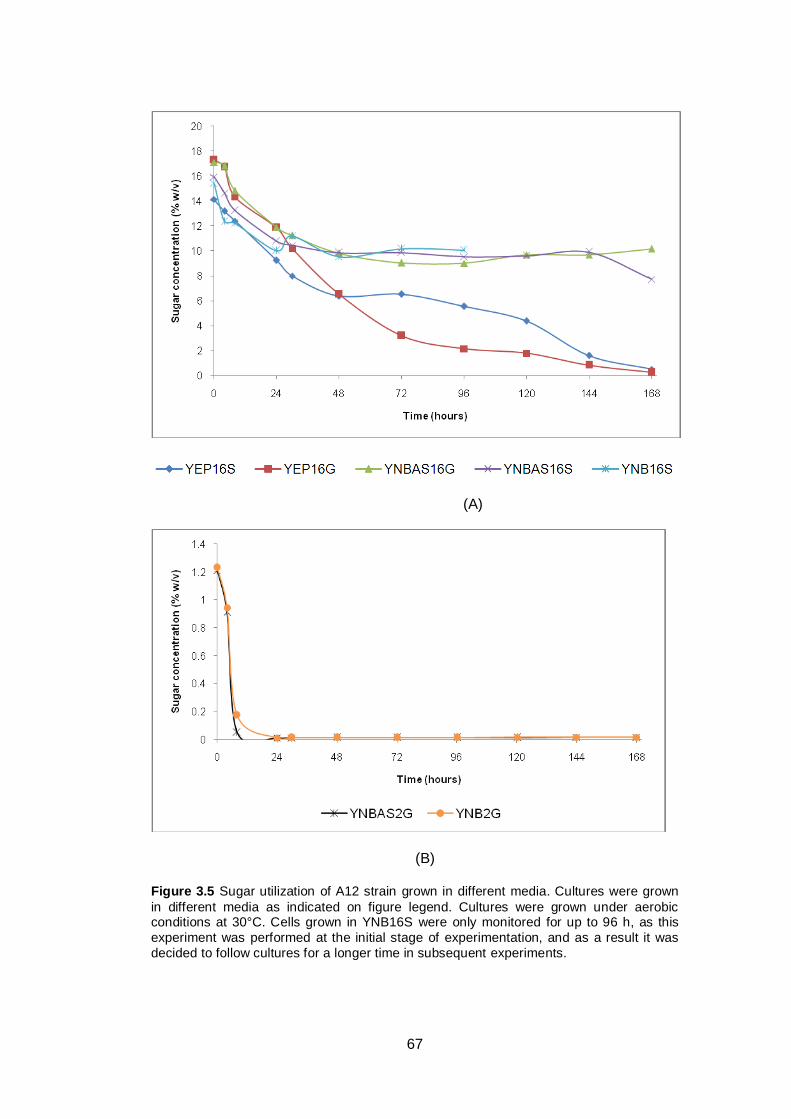
67
(A)
(B)
Figure 3.5 Sugar utilization of A12 strain grown in different media. Cultures were grown
in different media as indicated on figure legend. Cultures were grown under aerobic conditions at 30°C. Cells grown in YNB16S were only monitored for up to 96 h, as this
experiment was performed at the initial stage of experimentation, and as a result it was
decided to follow cultures for a longer time in subsequent experiments.
68
3.3 Discussion
As the initial objective of the present study was producing high quantities of
bioethanol under modelled industrial conditions, a high initial sugar concentration
was used in the initial stage of the experiments. Three yeast strains were used
initially; A12, A14 and PDM. The medium used was YNB with 16% sucrose.
Growth parameters of the three yeast strains were similar, with exponential
growth up to 24 hours and thereafter loss of cell viability. A12 showed the highest
rate of cell viability decline followed by PDM and A14. This result indicates that
even though the total cell number of A14 was lower than PDM, its viability was
better. This property is required for lengthy fermentations, as the cells maintain
their activity for a longer period. .This property might be an advantage for high
sugar concentration fermentation which requires long fermentation times. Further
investigation comparing yeast cell viability and fermentation performance of
different yeast strains is required to test this hypothesis.
When the yeast was grown in YNB with high sucrose concentration, the
growth and fermentation performance was poor. Sugar utilization was monitored
as a fermentation performance indicator. All strains showed rapid sugar utilization
during the first 24 hours, after which fermentation virtually ceased, leaving 6% to
8% (w/v) residual sugar. This could have been due to insufficient nutrition
available in the media. YNB was used as the base medium in this experiment so
that analysis of membrane fluidity by fluorescence spectroscopy of laurdan-
labelled cells would be possible in situ. This medium has been used successfully
in the past for ferments with moderate sugar levels (e.g. 2 to 5%), however its
nutritional value seems to be limited for high sugar ferments. Nitrogen
insufficiency is a common cause of stuck ferments, so we investigated whether
increasing the level of bioavailable nitrogen could resolve this problem.
Therefore, we added an additional 1% ammonium sulphate to provide a final
69
concentration of 1.5%, as has been applied in previous studies (Chi, Kohlwein &
Paltauf 1999). However, when the YNB was brought up to 1.5% ammonium
sulphate, utilisation of 16 % glucose could still not be completed and ferments still
stopped at high residual sugar levels. In order to confirm the feasibility of high
gravity (16 % sugar) ferments with the chosen yeast strains, we investigated the
nutritionally richer (although compositionally relatively undefined) YEP-based
media, as has been applied in previous studies (Thomas & Ingledew 1990).
The growth pattern of the yeast varied depending on the medium. In YEP
media the yeast grew more rapidly compared to the YNB media. The highest cell
numbers were achieved for yeast grown in YEP with glucose as the carbon
source as can be seen in Figure 3.4 (A) and (B). However, in maintaining the cell
viability, sucrose tended to give a better result as can be seen in Figure 3.4 (C)
and (D) only due to secondary ferments at later time points. In general, viability
.decreased faster with sucrose compared to glucose in YEP-based media. The
higher nutrition in YEP appeared to promote cell growth as evidenced by higher
OD and total cell numbers of cultures grown in YEP.
In the last part of the fermentation process it can be seen that the viable cell
number was increased after 72 hours for yeast cells grown in YEP medium either
with sucrose or glucose as the carbon source (Figure 3.4(C)). However, the
viable cell number dropped again after 120 and 144 hours for YEP cultures with
sucrose and glucose, respectively. Cells grown in YEP also showed better
viability at the end of fermentation. This result indicates that YEP is better for
maintaining viability of the yeast cells compared to YNB.
When the performance of cultures grown in media with only 2% sugar were
analysed, a different pattern was observed. Yeast grown in YNB tended to have
higher viability (Figure 3.4(D)). Addition of ammonium sulphate to the YNB,
70
seemed to marginally change the growth pattern, however YNB alone is sufficient
to sustain complete fermentation of 2% glucose.
The findings in this chapter indicate that for high sugar fermentation, the
nutritionally rich but relatively undefined medium YEP is preferred over the
defined medium YNB, as YEP can promote high sugar utilization and therefore
increase fermentation performance. Furthermore, YNB cannot be used as a
medium for fermentation of high levels of sugar. However, as the aim of this
study was to use spectrofluorometry for membrane fluidity determination, the
emission spectrum of the media used must be taken into consideration. YEP
shows very high emission intensity at the wavelengths used to analyse laurdan
emission. An additional aim was to measure laurdan fluorescence in situ during
fermentation experiments, thus removal of cells and resuspension in a non-
fluorescent medium was not an option to be considered. YNB has relatively low
emission at these wavelengths, and therefore for further experiments in the
present study we decided to use YNB.
Having established that YNB had to be used rather than nutritionally rich
media, the problem of stuck fermentation had to be resolved. We had hoped to
extend the previous studies on possible effects of inositol or L-proline
supplementation on ferments of media containing 16% sucrose. The previous
studies (Krause et al. 2007; Takagi et al. 2005) upon which our aims were based
used media with relatively low levels (2%) of glucose as the carbon source. At
this stage of the project we decided to continue exploratory studies with YNB
containing 2% glucose, to test any beneficial effects of supplementation with
inositol or L-proline. It was anticipated that after these confirmatory explorations
had been conducted, we would then resolve the problems noted above and could
then extend the analyses to high sugar ferments.
71
3.4 Conclusions
The present study confirmed that nutrient availability is very important for
fermentation performance. Comparison of YNB and YEP media indicates that
nutritionally insufficient media are not suitable for high sugar fermentation. When
fermentation was performed in YEP media, rapid and complete sugar utilization
was observed. Therefore, we recommend a nutritionally rich medium such as
YEP for high sugar fermentations.
However, one of our objectives in the present study was to assess the
effects of L-proline and inositol supplementation on membrane fluidity using
spectrofluorometry techniques and we considered the fluorescence background
and the undefined chemical composition of YEP media as unfavourable factors
for our further experiments. Therefore, for our present study, we chose YNB with
low sugar concentration for further study.

72
73
CHAPTER FOUR: COMPARISON OF MEMBRANE FLUIDITY
AND ETHANOL TOLERANCE OF DIFFERENT YEAST
STRAINS
4.1 Introduction
4.1.1 General introduction
Ethanol tolerance and membrane fluidity have been shown to have a strong
correlation. These properties can be different from one strain to another, and
depend upon the intrinsic properties of the particular yeast strain investigated.
Indirect determination of membrane fluidity by measuring the unsaturation
index of the yeast plasma membrane has indicated that increasing the
unsaturation index of the yeast membrane can improve the ethanol tolerance of
the yeast cell. Introduction of genes responsible for unsaturated fatty acid
synthesis reportedly improve ethanol tolerance (Kajiwara et al. 2000; You,
Rosenfield & Knipple 2003). However, membrane fluidity is not only influenced by
the fatty acid composition, but also by other component(s) of the yeast plasma
membrane, such as proteins and sterols (Alexandre, Rousseaux & Charpentier
1994; Learmonth 2011). Therefore, this finding needs more confirmation in terms
of how the unsaturation index may influence the actual plasma membrane fluidity
under physiological conditions.
Another investigation in which DPH anisotropy was measured to determine
the membrane fluidity revealed that high membrane fluidity is related to higher
ethanol tolerance (Alexandre, Rousseaux & Charpentier 1994). This conclusion
was drawn from study of two different yeast species, S. cerevisiae and Kloeckera
apiculata. Assessment of different yeast strains from the same species might
74
reveal different results. Therefore, in the present study we compared the
membrane fluidity of different strains of S. cerevisiae.
4.1.2 Yeast strains and culture conditions
Yeast strains used in this experiment were A12, PDM and K7. A12 is an
ethanol tolerant baker’s yeast according to previous studies (Lewis 1993), PDM is
an industrial wine strain (Mauri Yeast) which can produce up to 17% (v/v)
ethanol, and K7 is a sake strain (ATCC 26422) that can produce up to 17.5%
ethanol. These strains were chosen for their high ethanol production in nature.
4.1.3 Specific growth conditions and experimental design
For growth analysis, batch culture experiments were set up, and samples
were aseptically removed from the culture by drawing off with a sterile pipette
every 6 hours from 0 to 30 hours. Samples were then analysed for optical density
at 600 nm (Section 2.4), viable cell count (section 2.5), percent cell viability
(section 2.5), percent budding rate (section 2.6), and glucose and ethanol
concentration (section 2.9). Data presented in the following results were drawn
from four independent experiments.
Ethanol tolerance (section 2.8) and GP (section 2.7) were measured at 6
and 24 hours, representing respiro-fermentative (exponential) and respiratory
phases of the cell growth, respectively.
The GP data for each strain was drawn from eight replicates. Ethanol
tolerance by methylene violet staining was obtained from four independent
measurements. Ethanol tolerance by TPC at the 6 hour time point was drawn
from four independent experiments, while TPC at the 24 hour time point was
taken as average of six independent experiments.
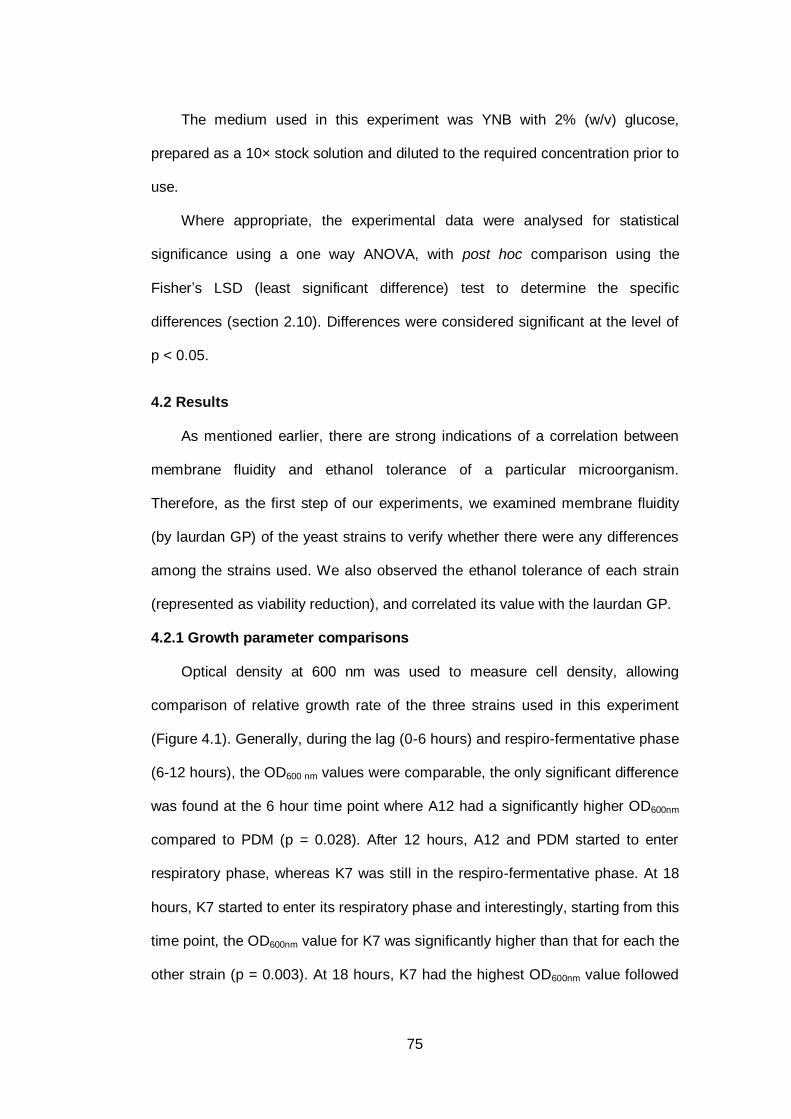
75
The medium used in this experiment was YNB with 2% (w/v) glucose,
prepared as a 10× stock solution and diluted to the required concentration prior to
use.
Where appropriate, the experimental data were analysed for statistical
significance using a one way ANOVA, with post hoc comparison using the
Fisher’s LSD (least significant difference) test to determine the specific
differences (section 2.10). Differences were considered significant at the level of
p < 0.05.
4.2 Results
As mentioned earlier, there are strong indications of a correlation between
membrane fluidity and ethanol tolerance of a particular microorganism.
Therefore, as the first step of our experiments, we examined membrane fluidity
(by laurdan GP) of the yeast strains to verify whether there were any differences
among the strains used. We also observed the ethanol tolerance of each strain
(represented as viability reduction), and correlated its value with the laurdan GP.
4.2.1 Growth parameter comparisons
Optical density at 600 nm was used to measure cell density, allowing
comparison of relative growth rate of the three strains used in this experiment
(Figure 4.1). Generally, during the lag (0-6 hours) and respiro-fermentative phase
(6-12 hours), the OD600 nm values were comparable, the only significant difference
was found at the 6 hour time point where A12 had a significantly higher OD600nm
compared to PDM (p = 0.028). After 12 hours, A12 and PDM started to enter
respiratory phase, whereas K7 was still in the respiro-fermentative phase. At 18
hours, K7 started to enter its respiratory phase and interestingly, starting from this
time point, the OD600nm value for K7 was significantly higher than that for each the
other strain (p = 0.003). At 18 hours, K7 had the highest OD600nm value followed
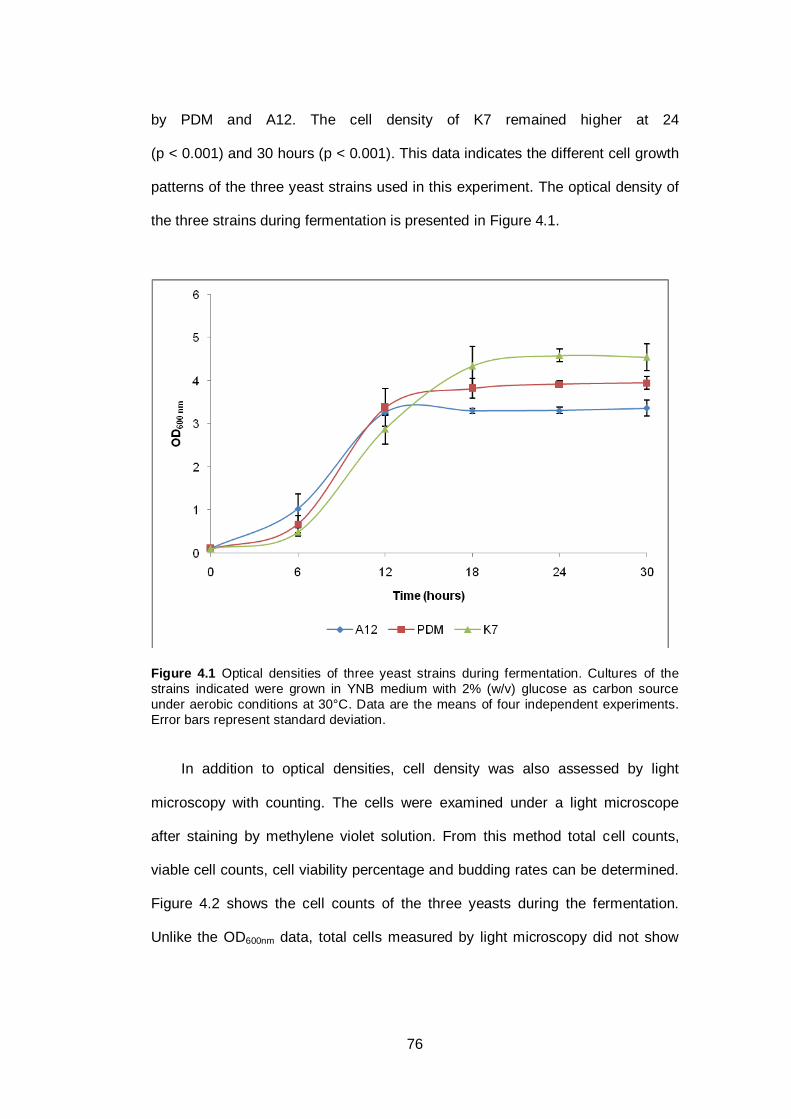
76
by PDM and A12. The cell density of K7 remained higher at 24
(p < 0.001) and 30 hours (p < 0.001). This data indicates the different cell growth
patterns of the three yeast strains used in this experiment. The optical density of
the three strains during fermentation is presented in Figure 4.1.
Figure 4.1 Optical densities of three yeast strains during fermentation. Cultures of the
strains indicated were grown in YNB medium with 2% (w/v) glucose as carbon source
under aerobic conditions at 30°C. Data are the means of four independent experiments.
Error bars represent standard deviation.
In addition to optical densities, cell density was also assessed by light
microscopy with counting. The cells were examined under a light microscope
after staining by methylene violet solution. From this method total cell counts,
viable cell counts, cell viability percentage and budding rates can be determined.
Figure 4.2 shows the cell counts of the three yeasts during the fermentation.
Unlike the OD600nm data, total cells measured by light microscopy did not show
77
any significant differences, neither did budding rate nor total viable cell counts.
However, total cell counts provided similar indications to OD600nm data.
Budding rate data indicated a trend in that the budding rates decreased
during the lag phase (0-6 hours) and reached their lowest value at 6 hours. At 12
hours the budding rate was increased and stayed more or less the same
throughout the fermentation. No significant differences were detected for these
parameters for any of the strains used in the present experiment.
Interestingly, cell viability data showed some significant differences between
the strains. At the beginning of the fermentation, K7 started with significantly
higher viability compared to the others (p = 0.022). At 6 hours, all the strains
reached their highest cell viability values, although no significant differences were
observed at this time point. At the 12 hour time point, the cell viability of A12 and
PDM were drastically reduced, while K7 maintained a significantly higher viability
(p < 0.001); this higher viability was maintained throughout the remaining
fermentation time. It seems that A12 and PDM reach the respiratory phase faster
than K7, as can be seen on Figure 4.1. While K7 started the respiratory phase at
18 h, A12 and PDM started their respiratory phase at 12 h. As we used ~18 h
culture as starter, this mean that some of A12 and PDM cells started to enter
death phase, while K7 starter cultures still had better viability.
Glucose utilization and ethanol production rates of all strains did not show
any significant differences (Figure 4.3). Generally, glucose was exhausted
between 12 and 18 hours. Even though not statistically significant, there was a
trend in which ethanol was rapidly produced after 6 hours and reached its highest
concentration at 18 hours. The highest ethanol concentration at 18 hours was
recorded for PDM with an ethanol concentration of 0.75 ± 0.24 % (v/v), however
this concentration was not significantly different from those of the other strains.
After glucose was exhausted by 18 hours, the ethanol concentration started to
78
decrease due to respiratory growth. Taken together, the growth parameters
measured indicate that the cultures were in lag phase from 0-6 hours, respiro-
fermentative phase from 6-18 hours (whereupon glucose was exhausted and
ethanol levels peaked) and thereafter in respiratory growth phase as evidenced
by declining ethanol levels.
(A) (B)
(C) (D) Figure 4.2 Comparison of total cell number (A), viable cell number (B), budding rate (C)
and cell viability (D) determined by light microscopy for three different yeast strains, A12
(♦), PDM (■) and K7 (▲). Cultures were grown in YNB medium with 2% (w/v) glucose as carbon source under aerobic conditions at 30°C. Data are the means of four independent
experiments. Error bars represent standard deviation.
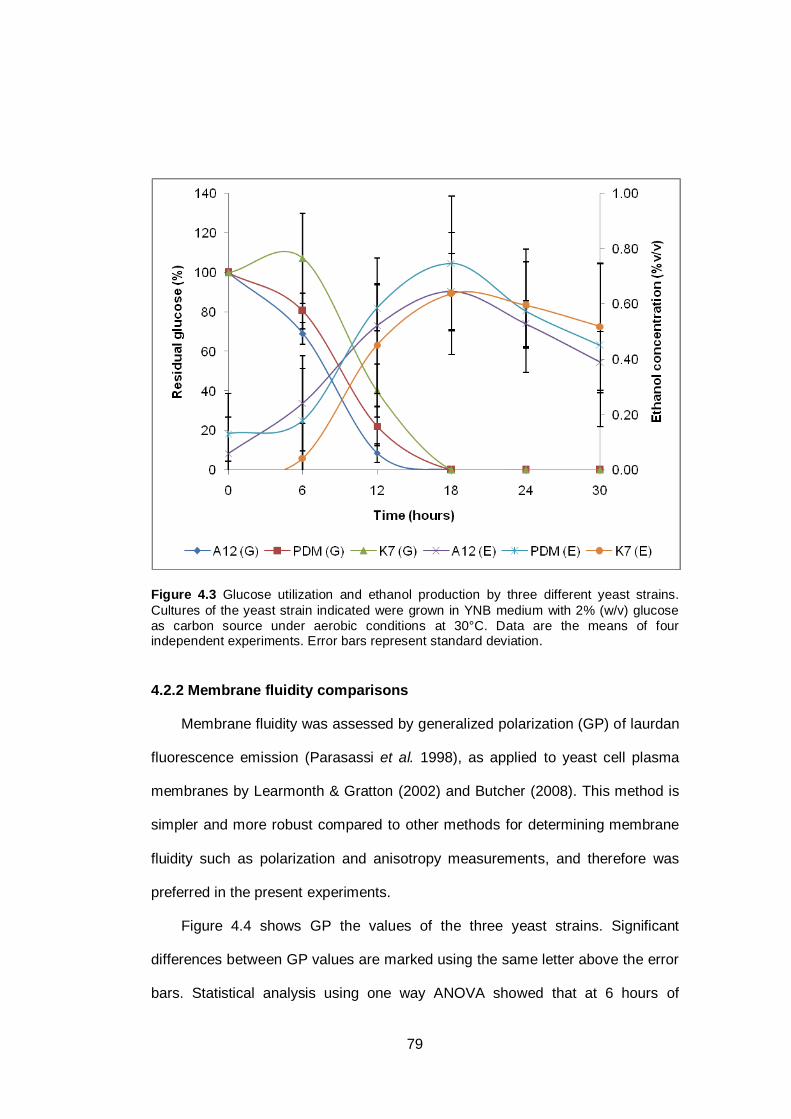
79
Figure 4.3 Glucose utilization and ethanol production by three different yeast strains.
Cultures of the yeast strain indicated were grown in YNB medium with 2% (w/v) glucose
as carbon source under aerobic conditions at 30°C. Data are the means of four independent experiments. Error bars represent standard deviation.
4.2.2 Membrane fluidity comparisons
Membrane fluidity was assessed by generalized polarization (GP) of laurdan
fluorescence emission (Parasassi et al. 1998), as applied to yeast cell plasma
membranes by Learmonth & Gratton (2002) and Butcher (2008). This method is
simpler and more robust compared to other methods for determining membrane
fluidity such as polarization and anisotropy measurements, and therefore was
preferred in the present experiments.
Figure 4.4 shows GP the values of the three yeast strains. Significant
differences between GP values are marked using the same letter above the error
bars. Statistical analysis using one way ANOVA showed that at 6 hours of
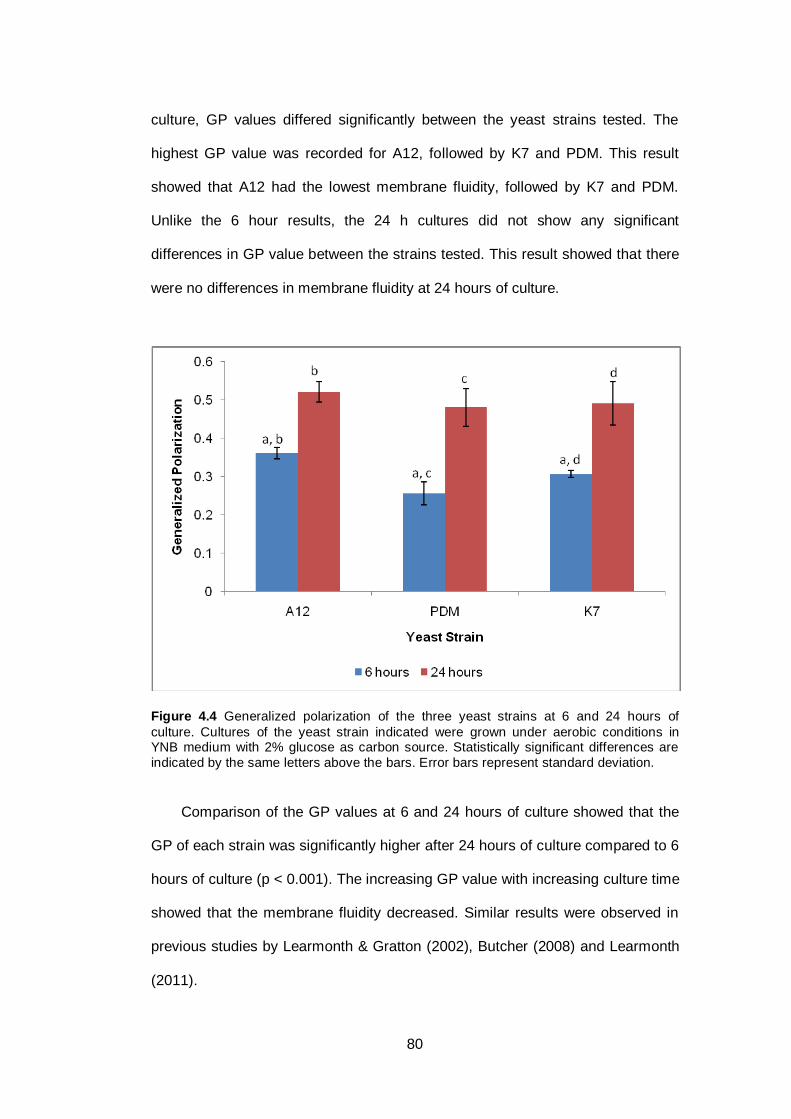
80
culture, GP values differed significantly between the yeast strains tested. The
highest GP value was recorded for A12, followed by K7 and PDM. This result
showed that A12 had the lowest membrane fluidity, followed by K7 and PDM.
Unlike the 6 hour results, the 24 h cultures did not show any significant
differences in GP value between the strains tested. This result showed that there
were no differences in membrane fluidity at 24 hours of culture.
Figure 4.4 Generalized polarization of the three yeast strains at 6 and 24 hours of
culture. Cultures of the yeast strain indicated were grown under aerobic conditions in YNB medium with 2% glucose as carbon source. Statistically significant differences are
indicated by the same letters above the bars. Error bars represent standard deviation.
Comparison of the GP values at 6 and 24 hours of culture showed that the
GP of each strain was significantly higher after 24 hours of culture compared to 6
hours of culture (p < 0.001). The increasing GP value with increasing culture time
showed that the membrane fluidity decreased. Similar results were observed in
previous studies by Learmonth & Gratton (2002), Butcher (2008) and Learmonth
(2011).
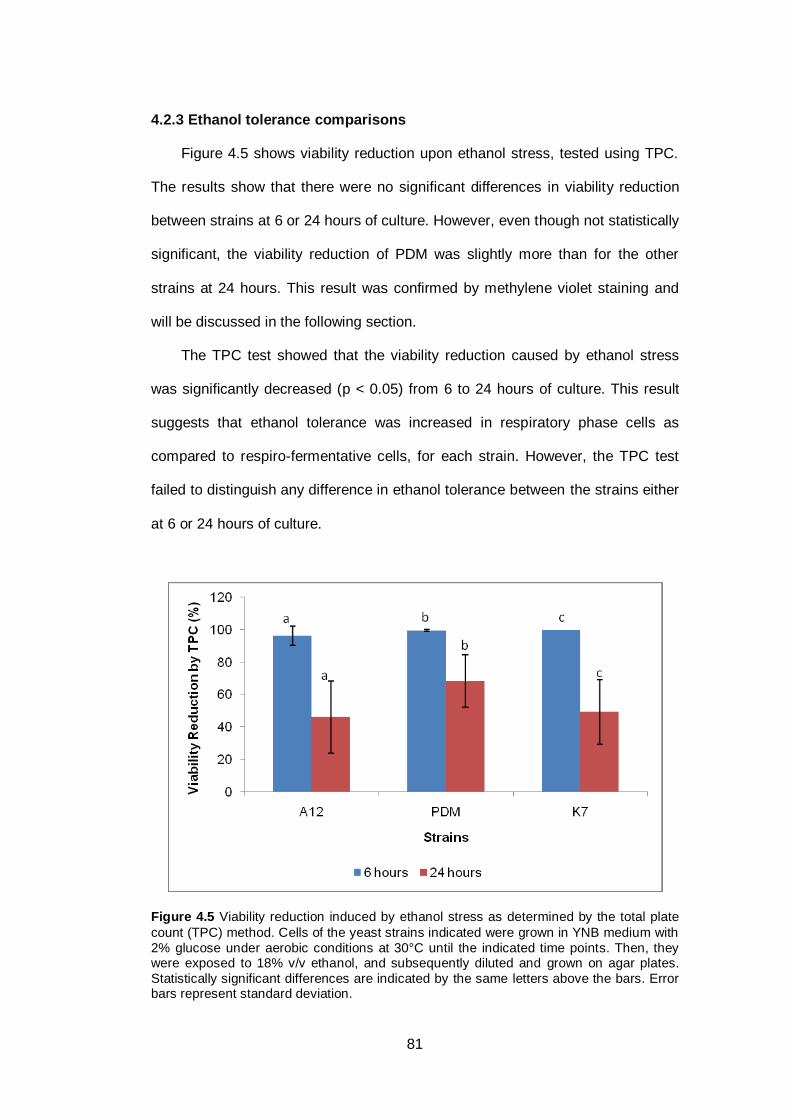
81
4.2.3 Ethanol tolerance comparisons
Figure 4.5 shows viability reduction upon ethanol stress, tested using TPC.
The results show that there were no significant differences in viability reduction
between strains at 6 or 24 hours of culture. However, even though not statistically
significant, the viability reduction of PDM was slightly more than for the other
strains at 24 hours. This result was confirmed by methylene violet staining and
will be discussed in the following section.
The TPC test showed that the viability reduction caused by ethanol stress
was significantly decreased (p < 0.05) from 6 to 24 hours of culture. This result
suggests that ethanol tolerance was increased in respiratory phase cells as
compared to respiro-fermentative cells, for each strain. However, the TPC test
failed to distinguish any difference in ethanol tolerance between the strains either
at 6 or 24 hours of culture.
Figure 4.5 Viability reduction induced by ethanol stress as determined by the total plate
count (TPC) method. Cells of the yeast strains indicated were grown in YNB medium with
2% glucose under aerobic conditions at 30°C until the indicated time points. Then, they were exposed to 18% v/v ethanol, and subsequently diluted and grown on agar plates.
Statistically significant differences are indicated by the same letters above the bars. Error bars represent standard deviation.
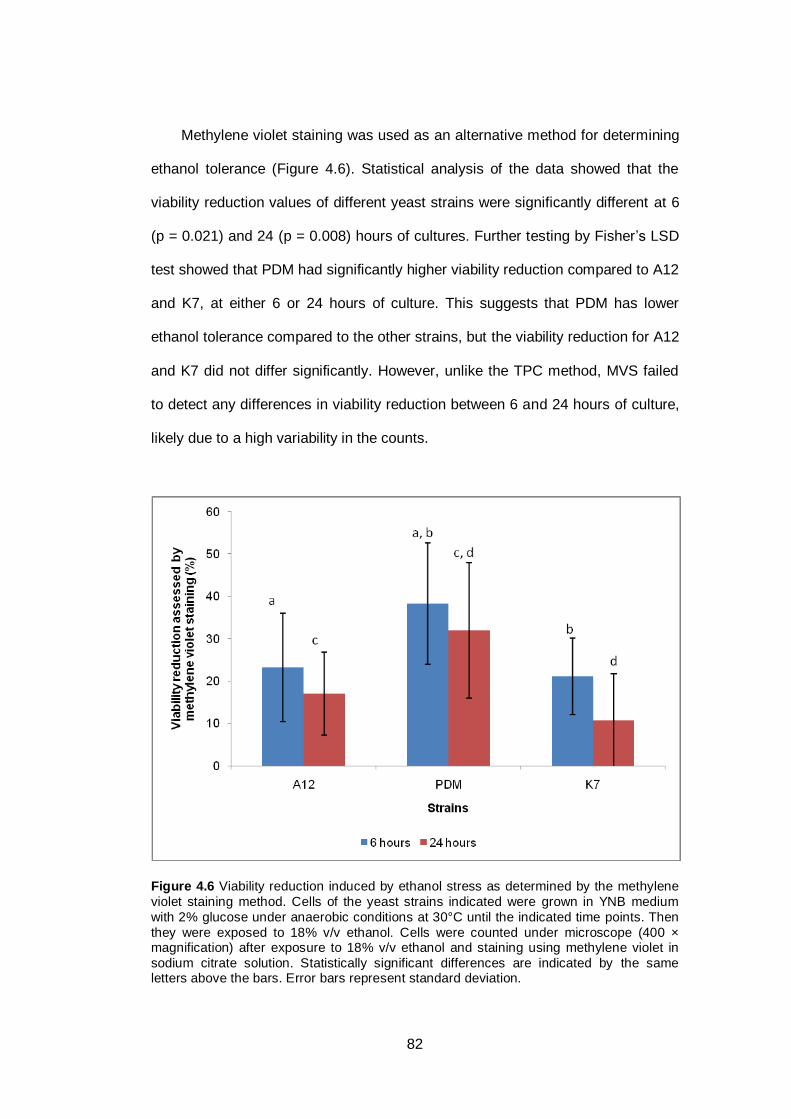
82
Methylene violet staining was used as an alternative method for determining
ethanol tolerance (Figure 4.6). Statistical analysis of the data showed that the
viability reduction values of different yeast strains were significantly different at 6
(p = 0.021) and 24 (p = 0.008) hours of cultures. Further testing by Fisher’s LSD
test showed that PDM had significantly higher viability reduction compared to A12
and K7, at either 6 or 24 hours of culture. This suggests that PDM has lower
ethanol tolerance compared to the other strains, but the viability reduction for A12
and K7 did not differ significantly. However, unlike the TPC method, MVS failed
to detect any differences in viability reduction between 6 and 24 hours of culture,
likely due to a high variability in the counts.
Figure 4.6 Viability reduction induced by ethanol stress as determined by the methylene
violet staining method. Cells of the yeast strains indicated were grown in YNB medium
with 2% glucose under anaerobic conditions at 30°C until the indicated time points. Then
they were exposed to 18% v/v ethanol. Cells were counted under microscope (400 × magnification) after exposure to 18% v/v ethanol and staining using methylene violet in
sodium citrate solution. Statistically significant differences are indicated by the same letters above the bars. Error bars represent standard deviation.
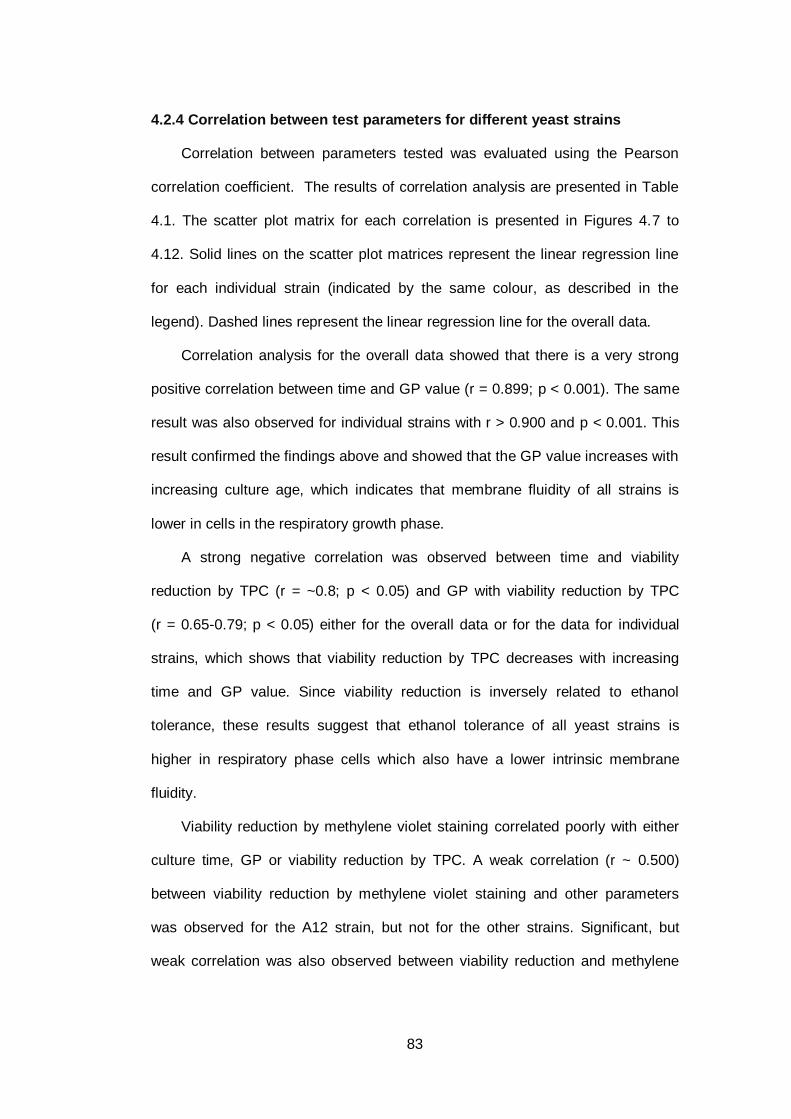
83
4.2.4 Correlation between test parameters for different yeast strains
Correlation between parameters tested was evaluated using the Pearson
correlation coefficient. The results of correlation analysis are presented in Table
4.1. The scatter plot matrix for each correlation is presented in Figures 4.7 to
4.12. Solid lines on the scatter plot matrices represent the linear regression line
for each individual strain (indicated by the same colour, as described in the
legend). Dashed lines represent the linear regression line for the overall data.
Correlation analysis for the overall data showed that there is a very strong
positive correlation between time and GP value (r = 0.899; p < 0.001). The same
result was also observed for individual strains with r > 0.900 and p < 0.001. This
result confirmed the findings above and showed that the GP value increases with
increasing culture age, which indicates that membrane fluidity of all strains is
lower in cells in the respiratory growth phase.
A strong negative correlation was observed between time and viability
reduction by TPC (r = ~0.8; p < 0.05) and GP with viability reduction by TPC
(r = 0.65-0.79; p < 0.05) either for the overall data or for the data for individual
strains, which shows that viability reduction by TPC decreases with increasing
time and GP value. Since viability reduction is inversely related to ethanol
tolerance, these results suggest that ethanol tolerance of all yeast strains is
higher in respiratory phase cells which also have a lower intrinsic membrane
fluidity.
Viability reduction by methylene violet staining correlated poorly with either
culture time, GP or viability reduction by TPC. A weak correlation (r ~ 0.500)
between viability reduction by methylene violet staining and other parameters
was observed for the A12 strain, but not for the other strains. Significant, but
weak correlation was also observed between viability reduction and methylene
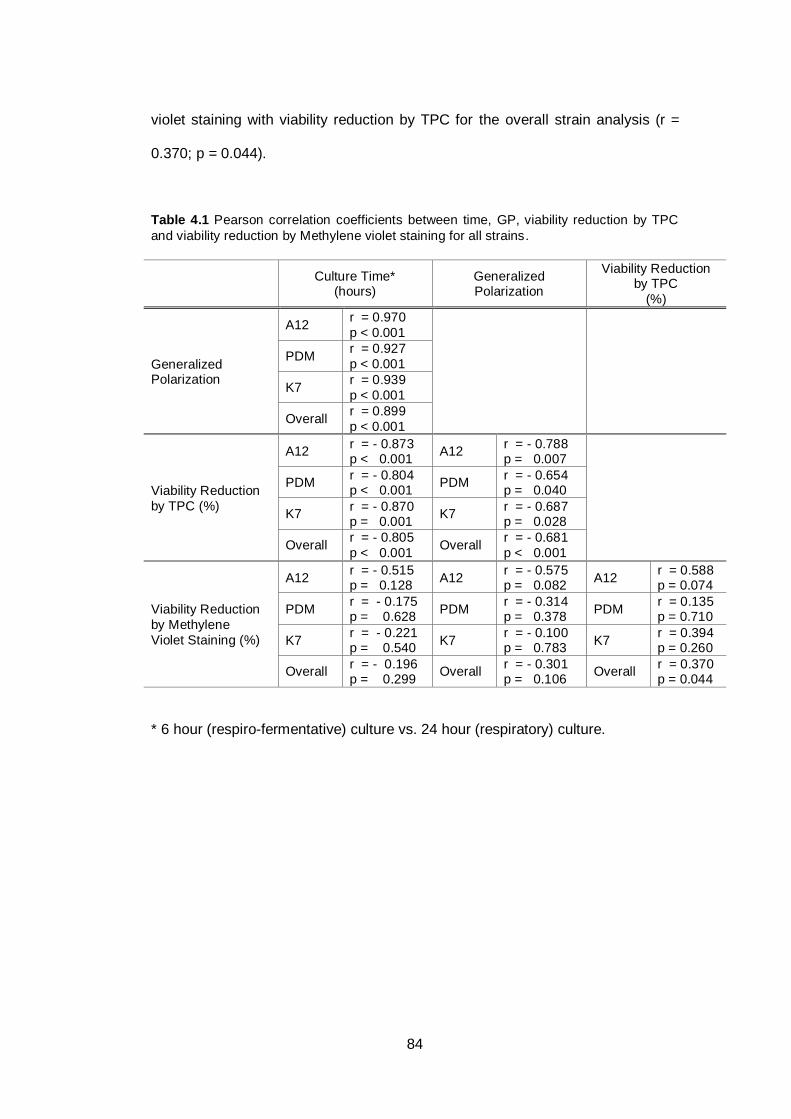
84
violet staining with viability reduction by TPC for the overall strain analysis (r =
0.370; p = 0.044).
Table 4.1 Pearson correlation coefficients between time, GP, viability reduction by TPC
and viability reduction by Methylene violet staining for all strains.
Culture Time* (hours)
Generalized Polarization
Viability Reduction by TPC
(%)
Generalized Polarization
A12 r = 0.970
p < 0.001
PDM r = 0.927
p < 0.001
K7 r = 0.939
p < 0.001
Overall r = 0.899
p < 0.001
Viability Reduction
by TPC (%)
A12 r = - 0.873 p < 0.001
A12 r = - 0.788 p = 0.007
PDM r = - 0.804 p < 0.001
PDM r = - 0.654 p = 0.040
K7 r = - 0.870 p = 0.001
K7 r = - 0.687 p = 0.028
Overall r = - 0.805
p < 0.001 Overall
r = - 0.681
p < 0.001
Viability Reduction
by Methylene
Violet Staining (%)
A12 r = - 0.515 p = 0.128
A12 r = - 0.575 p = 0.082
A12 r = 0.588 p = 0.074
PDM r = - 0.175 p = 0.628
PDM r = - 0.314 p = 0.378
PDM r = 0.135 p = 0.710
K7 r = - 0.221 p = 0.540
K7 r = - 0.100 p = 0.783
K7 r = 0.394 p = 0.260
Overall r = - 0.196 p = 0.299
Overall r = - 0.301 p = 0.106
Overall r = 0.370 p = 0.044
* 6 hour (respiro-fermentative) culture vs. 24 hour (respiratory) culture.
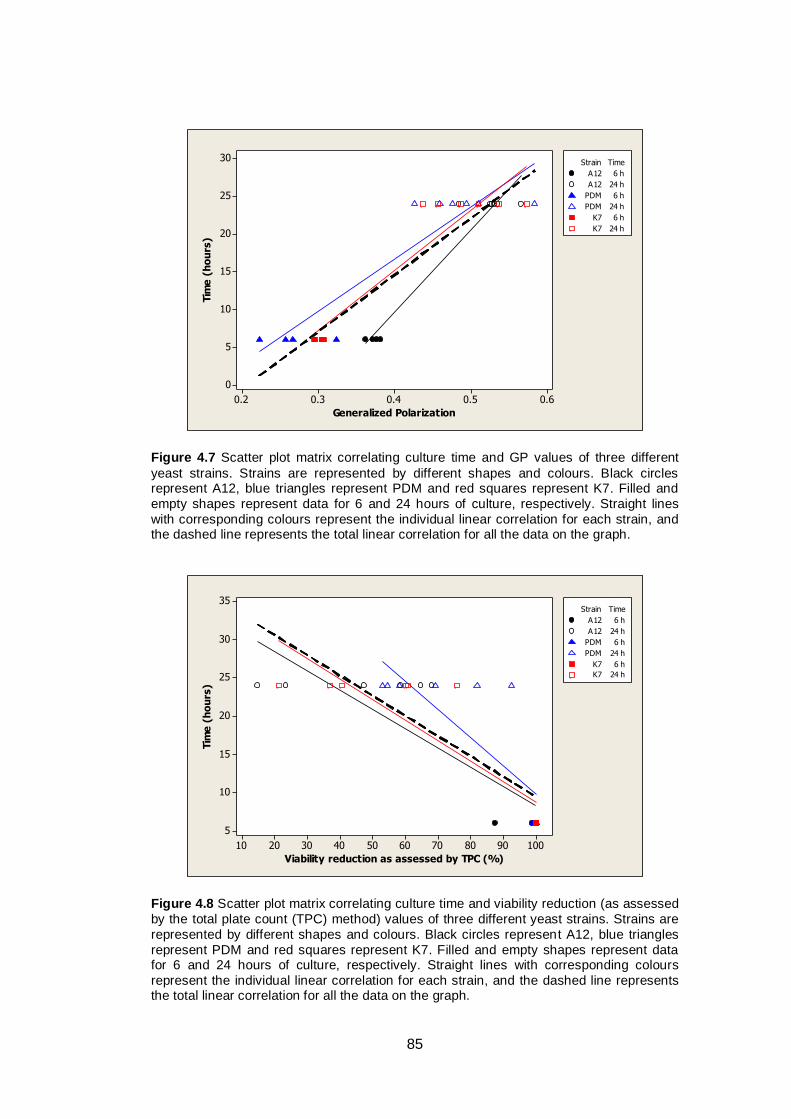
85
0.60.50.40.30.2
30
25
20
15
10
5
0
Generalized Polarization
Tim
e (
ho
urs
)
A12 6 h
A12 24 h
PDM 6 h
PDM 24 h
K7 6 h
K7 24 h
Strain Time
Figure 4.7 Scatter plot matrix correlating culture time and GP values of three different
yeast strains. Strains are represented by different shapes and colours. Black circles represent A12, blue triangles represent PDM and red squares represent K7. Filled and
empty shapes represent data for 6 and 24 hours of culture, respectively. Straight lines
with corresponding colours represent the individual linear correlation for each strain, and the dashed line represents the total linear correlation for all the data on the graph.
100908070605040302010
35
30
25
20
15
10
5
Viability reduction as assessed by TPC (%)
Tim
e (
ho
urs
)
A12 6 h
A12 24 h
PDM 6 h
PDM 24 h
K7 6 h
K7 24 h
Strain Time
Figure 4.8 Scatter plot matrix correlating culture time and viability reduction (as assessed
by the total plate count (TPC) method) values of three different yeast strains. Strains are
represented by different shapes and colours. Black circles represent A12, blue triangles
represent PDM and red squares represent K7. Filled and empty shapes represent data for 6 and 24 hours of culture, respectively. Straight lines with corresponding colours
represent the individual linear correlation for each strain, and the dashed line represents the total linear correlation for all the data on the graph.
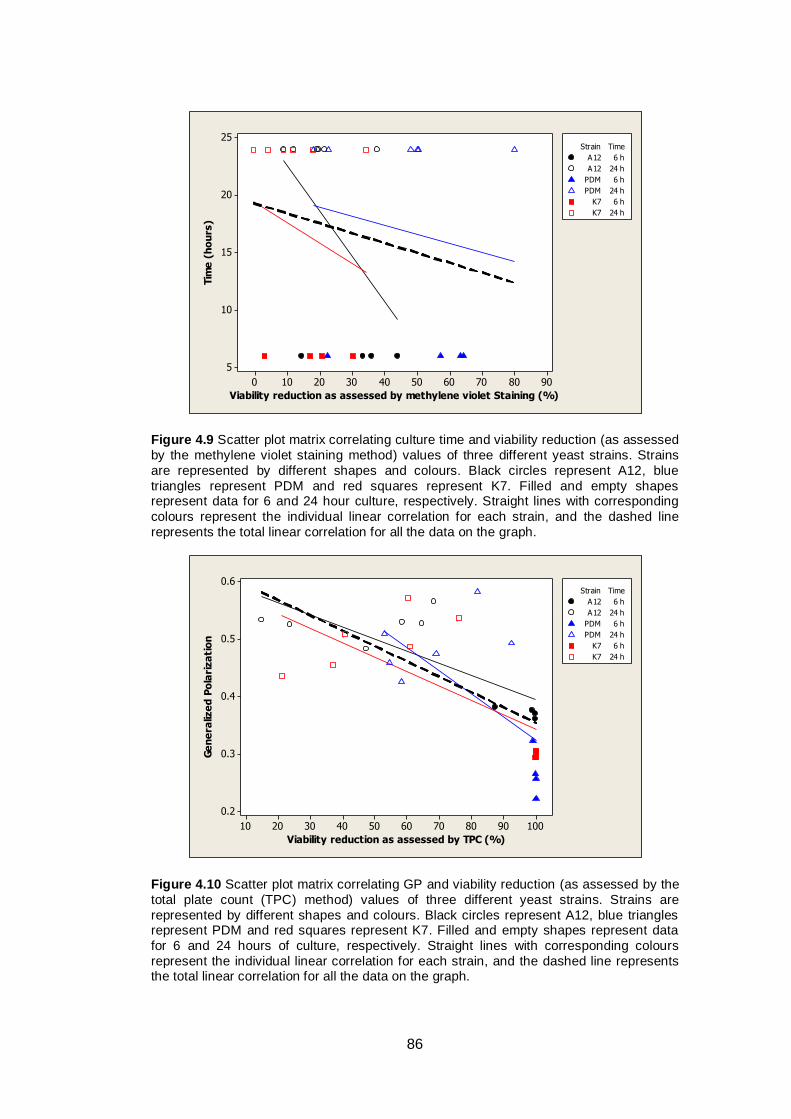
86
9080706050403020100
25
20
15
10
5
Viability reduction as assessed by methylene violet Staining (%)
Tim
e (
ho
urs
)
A12 6 h
A12 24 h
PDM 6 h
PDM 24 h
K7 6 h
K7 24 h
Strain Time
Figure 4.9 Scatter plot matrix correlating culture time and viability reduction (as assessed
by the methylene violet staining method) values of three different yeast strains. Strains
are represented by different shapes and colours. Black circles represent A12, blue
triangles represent PDM and red squares represent K7. Filled and empty shapes represent data for 6 and 24 hour culture, respectively. Straight lines with corresponding
colours represent the individual linear correlation for each strain, and the dashed line
represents the total linear correlation for all the data on the graph.
100908070605040302010
0.6
0.5
0.4
0.3
0.2
Viability reduction as assessed by TPC (%)
Ge
ne
raliz
ed
Po
lari
za
tio
n
A12 6 h
A12 24 h
PDM 6 h
PDM 24 h
K7 6 h
K7 24 h
Strain Time
Figure 4.10 Scatter plot matrix correlating GP and viability reduction (as assessed by the
total plate count (TPC) method) values of three different yeast strains. Strains are
represented by different shapes and colours. Black circles represent A12, blue triangles represent PDM and red squares represent K7. Filled and empty shapes represent data
for 6 and 24 hours of culture, respectively. Straight lines with corresponding colours
represent the individual linear correlation for each strain, and the dashed line represents the total linear correlation for all the data on the graph.
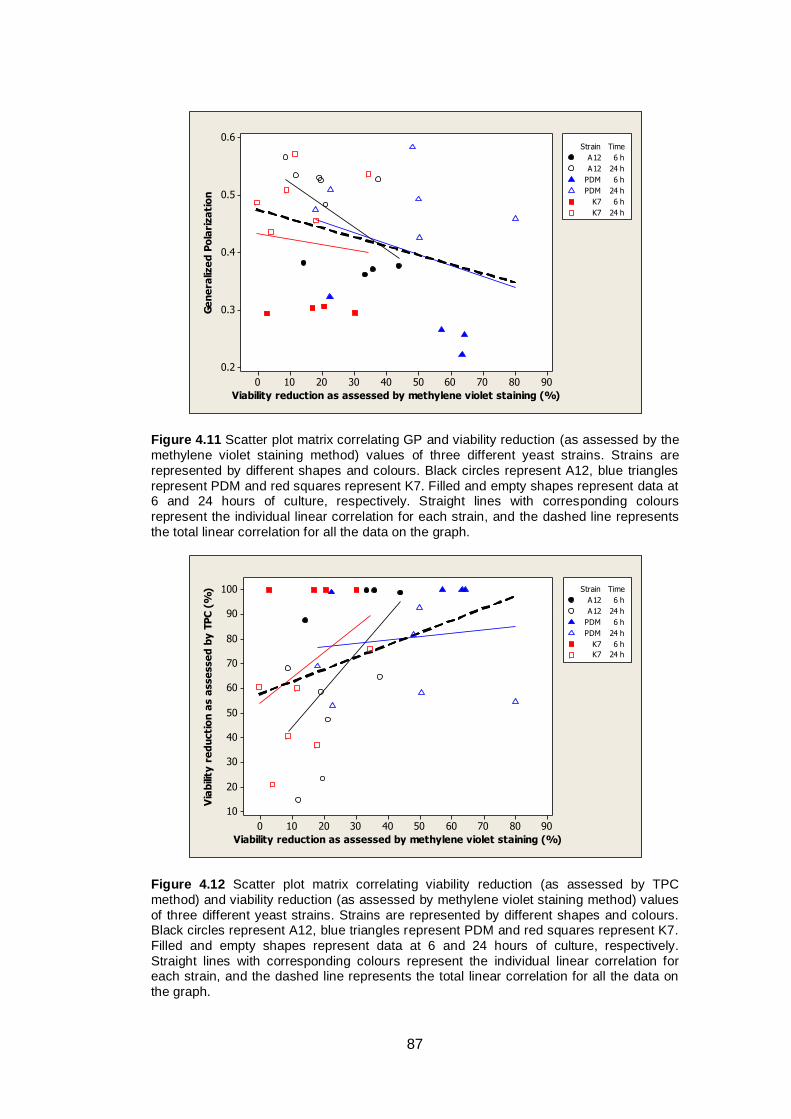
87
9080706050403020100
0.6
0.5
0.4
0.3
0.2
Viability reduction as assessed by methylene violet staining (%)
Ge
ne
raliz
ed
Po
lari
za
tio
n
A12 6 h
A12 24 h
PDM 6 h
PDM 24 h
K7 6 h
K7 24 h
Strain Time
Figure 4.11 Scatter plot matrix correlating GP and viability reduction (as assessed by the
methylene violet staining method) values of three different yeast strains. Strains are
represented by different shapes and colours. Black circles represent A12, blue triangles
represent PDM and red squares represent K7. Filled and empty shapes represent data at 6 and 24 hours of culture, respectively. Straight lines with corresponding colours
represent the individual linear correlation for each strain, and the dashed line represents
the total linear correlation for all the data on the graph.
9080706050403020100
100
90
80
70
60
50
40
30
20
10
Viability reduction as assessed by methylene violet staining (%)
Via
bili
ty r
ed
ucti
on
as a
sse
sse
d b
y T
PC
(%
)
A12 6 h
A12 24 h
PDM 6 h
PDM 24 h
K7 6 h
K7 24 h
Strain Time
Figure 4.12 Scatter plot matrix correlating viability reduction (as assessed by TPC
method) and viability reduction (as assessed by methylene violet staining method) values
of three different yeast strains. Strains are represented by different shapes and colours. Black circles represent A12, blue triangles represent PDM and red squares represent K7.
Filled and empty shapes represent data at 6 and 24 hours of culture, respectively.
Straight lines with corresponding colours represent the individual linear correlation for each strain, and the dashed line represents the total linear correlation for all the data on
the graph.
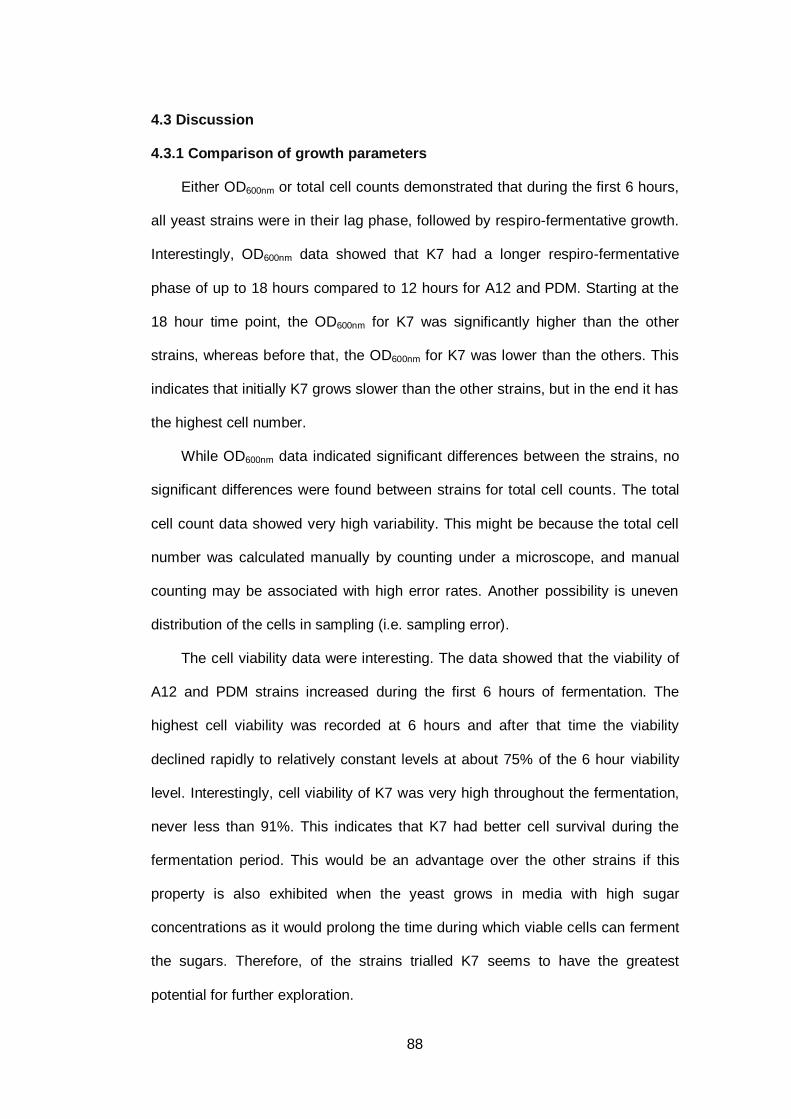
88
4.3 Discussion
4.3.1 Comparison of growth parameters
Either OD600nm or total cell counts demonstrated that during the first 6 hours,
all yeast strains were in their lag phase, followed by respiro-fermentative growth.
Interestingly, OD600nm data showed that K7 had a longer respiro-fermentative
phase of up to 18 hours compared to 12 hours for A12 and PDM. Starting at the
18 hour time point, the OD600nm for K7 was significantly higher than the other
strains, whereas before that, the OD600nm for K7 was lower than the others. This
indicates that initially K7 grows slower than the other strains, but in the end it has
the highest cell number.
While OD600nm data indicated significant differences between the strains, no
significant differences were found between strains for total cell counts. The total
cell count data showed very high variability. This might be because the total cell
number was calculated manually by counting under a microscope, and manual
counting may be associated with high error rates. Another possibility is uneven
distribution of the cells in sampling (i.e. sampling error).
The cell viability data were interesting. The data showed that the viability of
A12 and PDM strains increased during the first 6 hours of fermentation. The
highest cell viability was recorded at 6 hours and after that time the viability
declined rapidly to relatively constant levels at about 75% of the 6 hour viability
level. Interestingly, cell viability of K7 was very high throughout the fermentation,
never less than 91%. This indicates that K7 had better cell survival during the
fermentation period. This would be an advantage over the other strains if this
property is also exhibited when the yeast grows in media with high sugar
concentrations as it would prolong the time during which viable cells can ferment
the sugars. Therefore, of the strains trialled K7 seems to have the greatest
potential for further exploration.
89
There were no significant differences between the yeast strains tested in
glucose utilization during the fermentation. Ethanol production also did not differ
significantly between strains. The highest ethanol concentration was detected at
18 hours of fermentation, and ethanol levels started to decrease after that time
point, probably due to respiratory growth. Previous studies (Lewis et al. 1993)
showed that the decrease in ethanol level was due to metabolic activity and not
simply due to evaporation. Glucose was exhausted between 12-18 hours. As S.
cerevisiae belongs to the Crabtee-positive yeast group (Piskur et al. 2006), after
glucose depletion at 18 hours, the yeast start to use ethanol as a carbon source.
This can be noted from the decrease in ethanol concentration after 18 hours of
fermentation. Therefore, when fermentation is conducted with the batch method
under aerobic conditions and high ethanol concentration is desired, the
fermentation should be stopped before the yeast start to use the product. In the
present experiment, with reduced nutrition and low glucose concentration, 18
hours is the right time to stop the fermentation. Higher glucose and richer media
may change this time point. Another option would be to ensure that after they
start, the fermentations are conducted under anaerobic conditions, as oxygen is
required for the respiratory assimilation of ethanol.
4.3.2 Membrane fluidity and ethanol tolerance
Previous published works showed that the stress tolerance of yeast cells is
related to the fluidity of the yeast cell plasma membrane. Alexandre, Rousseaux
& Charpentier (1994) and Alexandre, Berlot & Charpentier (1994) compared
membrane fluidity by measuring anisotropy of two different yeast species with
different degrees of ethanol tolerance, and found that yeast species with higher
membrane fluidity had higher ethanol tolerance. However, statistically,
90
comparison of two yeast strains is not sufficient for drawing a valid conclusion,
therefore more yeast strains need to be investigated.
Modification of the cell plasma membrane by incorporating more unsaturated
fatty acids, thereby changing the unsaturation index of the plasma membrane has
also been found to increase tolerance of the yeast cell to high ethanol
concentrations (Kajiwara et al. 2000; You, Rosenfield & Knipple 2003), freezing
and also salt stress (Rodrıguez-Vargas et al. 2007). Dinh et al. (2008) also found
that yeast cells that developed tolerance to high ethanol concentrations have a
higher composition of unsaturated fatty acids, particularly oleic acid (C18:1).
However, Swan & Watson (1999) found slightly different results. They
enriched mutant yeast cells with different unsaturated fatty acids, namely oleic
(C18:1), linoleic (C18:2) and linolenic acid (C18:3). They observed that yeast
cells enriched with oleic acid are more tolerant to ethanol and heat, followed by
cells enriched with linoleic and linolenic acids (Swan & Watson 1999). These
experiments followed on from previous experiments where heat and oxidative
stress tolerance were studied in yeast cells grown under aerobic or anaerobic
conditions and then supplemented with various specific lipids (Steels et al. 1994).
In the latter experiments, unsupplemented anaerobically-grown cells with largely
saturated fatty acid profiles were more resistant to heat stress than C18:1 or
C18:3 supplemented cells. These experiments suggested that increasing fluidity
by introducing more unsaturation to fatty acyl chains leads to more susceptible
cells. However, direct measurement of membrane fluidity was not reported in
their study, and therefore we cannot compare our membrane fluidity data.
In this study ethanol tolerance of the yeast cell was monitored using two
different methods, total plate count (TPC) and methylene violet staining (MVS)
after exposing the cells to 18% ethanol. The total plate count is widely used for
ethanol tolerance determination of yeasts (Chi, Kohlwein & Paltauf 1999; Krause
91
et al. 2007), while methylene violet staining is rarely used. As these two methods
can be used to distinguish live and dead cells, we tried to apply the methylene
violet staining to calculate the viability reduction of ethanol stressed cells, and
investigate whether it can be used in an ethanol tolerance test.
In the present study, considering GP measurements and viability reduction
as assessed by methylene violet staining, we found that at 6 hours of culture,
A12 and K7 strains which have significantly higher GP values than PDM showed
lower viability reduction. This indicates that strains with lower membrane fluidity
have higher tolerance against ethanol, which acts by fluidising membranes.
However, viability reduction as assessed by TPC failed to distinguish the ethanol
tolerances of the strains at 6 hours culture. Similar phenomena were also
observed of 24 hours of culture, in which PDM, which has the lowest GP, tended
to have a higher viability reduction, either as determined by total plate count or
methylene violet staining. However, at 24 hours of culture the differences were
not statistically significant.
The results of the present study contradict most of the previously published
works which indicate that higher membrane fluidity tends to lead to higher ethanol
tolerance (Alexandre, Rousseaux & Charpentier 1994; Dinh et al. 2008; You,
Rosenfield & Knipple 2003). Previous studies used different approaches to
determine the membrane fluidity of the yeast cell. They mainly measured
increasing levels of unsaturated fatty acid, expressed as the unsaturation index
(Alexandre, Rousseaux & Charpentier 1994; Dinh et al. 2008; Rodrıguez-Vargas
et al. 2007; You, Rosenfield & Knipple 2003) or direct measurement of
membrane fluidity by measuring DPH anisotropy (Alexandre, Rousseaux &
Charpentier 1994). Studies which simply infer fluidity from lipid unsaturation data
do not account for the impacts of the many other factors that can modulate
membrane fluidity (Learmonth 2011; Learmonth & Gratton 2002).
92
Alexandre, Rousseaux & Charpentier (1994) also stressed that membrane
fluidity as deduced from unsaturation index does not always reflect the real
condition of the membrane fluidity, therefore they used DPH anisotropy to directly
measure membrane fluidity. They reported that ethanol tolerance is connected
with higher membrane fluidity. However, their data showed that S. cerevisiae
which had higher ethanol tolerance did not always show higher membrane fluidity
compared to Kloeckera apiculata which had lower ethanol tolerance. For
example, when the cells were grown in the presence of ethanol and further
exposed to 12% (v/v) ethanol, K. apiculata showed a lower anisotropy value
(0.133 ± 0.002) compared to S. cerevisiae (0.138 ± 0.003). Even though not
statistically significant, there is a possibility which indicates that K. apiculata has
higher membrane fluidity, while this yeast is more susceptible to high ethanol
concentration. This finding is consistent with the results of this study and also
with a hypothesis that lower intrinsic membrane fluidity helps to minimise the
fluidising impact of high ethanol concentrations.
While Alexandre, Rousseaux & Charpentier (1994) used anisotropy of the
fluorescent probe DPH, the present work uses a different method for
determination of membrane fluidity. We used generalized polarization of laurdan
for determining membrane fluidity. Parasassi et al. (1990) explained that laurdan
is very sensitive to the polarity of the environment, and further investigation by
the same group also revealed that the spectrum is red shifted with decreasing
membrane fluidity (Parasassi et al. 1998). The different methods used by
Alexandre, Rousseaux & Charpentier (1994) and the present experiment may
lead to different results, although in general the studies report consistent trends.
Another thing to note is that the GP significantly increased from 6 to 24
hours of culture for all strains. These results indicate that membrane fluidity is
changing during the cell growth, which means that membrane fluidity decreases
93
with time course. Specifically, membrane fluidity is relatively higher in respiro-
fermentative cells which are also less tolerant to a range of stresses (Learmonth
2011; Learmonth & Gratton 2002; Lewis, Learmonth & Watson 1993; Lewis et al.
1993). As for the ethanol tolerance, it increases with time course. This result is in
agreement with previous observations in which lower membrane fluidity led to
better ethanol tolerance (Learmonth 2011). Similar phenomena were also
observed by Swan & Watson (1999) and Steels et al. (1994) which suggested
that ethanol tolerance is related to lower membrane fluidity.
Correlation analysis for all parameters tested suggests that there are strong
correlations between culture time, viability reduction as assessed by TPC and
GP. The correlations with culture time are essentially reporting the difference
between respiro-fermentative (6 hour) and respiratory (24 hour) cells. It is well
known that the former cells are less stress tolerant and have higher membrane
fluidity (Learmonth 2011).
Poor correlation was detected for viability reduction as assessed by
methylene violet staining with other parameters. However, as described earlier,
viability reduction as assessed by methylene violet staining succeeded in
distinguishing the ethanol tolerance of different yeast cells at a particular time
point (6 hours or 24 hours of culture), which the TPC method failed to achieve. In
contrast, viability reduction as assessed by TPC can distinguish ethanol tolerance
of yeast cells from different time points of cultures, which methylene violet
staining failed to distinguish. Therefore, each method has its own limitation and
advantage, and these should be considered when using them as an ethanol
tolerance determination method. Generally, from our observations, we could use
methylene violet staining when we intended to discriminate ethanol tolerance of
different yeast strains at a particular time point and the TPC method is better for
94
discriminating ethanol tolerance of a particular yeast strain at different time
points.
The lack of correlation between viability assessment by methylene violet
staining and total plate count is particularly troubling. It is likely that the high
variability observed in the cell counts led to the lack of correlation and sampling
techniques could be further refined. In addition, the methods report different
findings, in that methylene violet staining may report live cells that have lost the
ability to replicate; only cells able to divide will be counted after growth on plates.
Additionally, the methylene violet approach was established to provide a more
reliable assessment of viability than methylene blue staining, although it may
suffer from a similar problem when used to assess the viability of highly stressed
cell populations.
4.4 Conclusions
This study provides a comparison of the membrane fluidity and ethanol
tolerance of different yeast strains. Three yeast strains were used in this
experiment and it was found that they have different properties.
Unlike most previously published studies, the present study revealed that
yeast strains with lower membrane fluidity have higher ethanol tolerance. This
conclusion is supported by two data, i.e.:
1. At 6 hours of culture, the PDM strain which had the lowest GP value, i.e.
highest membrane fluidity, showed the lowest ethanol tolerance, indicated by
the highest viability reduction compared to the A12 and K7 strains.
2. Increasing GP values from 6 to 24 hours of culture, which indicated
decreasing membrane fluidity, occurred along with significantly decreasing
viability reduction values, which shows that ethanol tolerance increases with
decreasing membrane fluidity.
95
Correlation analysis showed strong correlations between growth phase
(respiro-fermentative, 6 hours, vs. respiratory, 24 hours), membrane fluidity and
ethanol tolerance.
Even though viability reduction as assessed by methylene violet staining did
not show any strong correlation with the other parameters measured, it could be
useful in some circumstances. Therefore, we suggest that these two methods
can be used for different purposes.
Finally, among the three strains used in the present experiment, A12 and K7
had better performance than PDM in terms of ethanol tolerance. Growth
parameter comparison revealed that K7 had better properties compared to the
other strains. Therefore, of the strains tested this strain has the best potential for
further exploration.

96
97
CHAPTER FIVE: EFFECT OF PROLINE
SUPPLEMENTATION ON ETHANOL TOLERANCE
5.1 Introduction
5.1.1 General Introduction
Proline has been widely documented to have a protective effect against
various stress factors in many organisms (Chen & Dickman 2005; Graham &
Wilkinson 1992; Takagi 2008; Verbuggen & Hermans 2008; Yamada et al. 2005).
The exact mechanisms by which L-proline protects cells against stresses is not
fully understood, but many published works indicate that L-proline is accumulated
when cells are exposed to various stress factors, and that L-proline accumulation
increases tolerance to stresses (Takagi 2008). Takagi (2008) outlined that L-
proline has functions in osmoregulation, inhibition of dehydration and ice
nucleation, lowering of nucleic acid Tm, and protecting cells from oxidative stress
by acting as a scavenger for reactive oxygen species.
Yeasts with the ability to accumulate intracellular L-proline have been
developed (by genetic modification of proline metabolic pathways) and tested
against several stress factors. Enzymes which play important roles in proline
metabolism were modified; either to suppress proline degradation (Takagi et al.
2000) or to promote proline synthesis (Morita, Nakamori & Takagi 2003; Takagi
et al. 2005; Terao, Nakamori & Takagi 2003).
Proline accumulating yeast strains have been shown to have higher
tolerance compared to parent strains, to freezing (Morita, Nakamori & Takagi
2003; Takagi et al. 2000), oxidative stress (Chen et al. 2006; Terao, Nakamori &
Takagi 2003), and high ethanol concentrations (Takagi et al. 2005).
In the present study, we supplemented growth medium by L-proline, based
on the findings of Horak & Kotyk (1986) and Lasko & Brandriss (1981) that S.
98
cerevisiae has the ability to utilize and accumulate proline. The yeast accumulate
about 8 times more proline under aerobic conditions than under anaerobic
conditions (Horak & Kotyk 1986). Therefore, we used increasing concentrations
of L-proline under aerobic conditions to investigate whether extracellular L-proline
may be assimilated and lead to protective effects against high ethanol
concentrations.
5.1.2 Yeast strains and culture conditions
The yeast strains used were those investigated in Chapter 4, i.e. A12, PDM
and K7.
5.1.3 Specific growth conditions and experimental design
For growth parameter analysis, batch culture experiments were set up and
samples were aseptically removed from the culture by drawing off with a sterile
pipette every 6 hours from 0 to 30 hours. Samples were then analysed for optical
density at 600 nm (Section 2.4), viable cell count (section 2.5), percent cell
viability (section 2.5), percent budding rate (section 2.6), and glucose and ethanol
concentration (section 2.9).
Ethanol tolerance (section 2.8) and GP (section 2.7) were only measured at
two time points, 6 and 24 hours, representing respiro-fermentative and
respiratory phases of the cell growth, respectively. The medium used in this
experiment was YNB with 2% (w/v) glucose, prepared as a 10× concentration
stock solution and diluted as required prior to use. The stock solution was filtered
through a sterile 0.22 µm pore size membrane. L-proline was supplemented by
sterile addition of appropriate amounts of freshly prepared L-proline stock
solution (50 g/L) to give the desired final concentrations of 0.1, 0.5, 1.0, 2.0, and
3.0 g/L. Media without proline supplementation were used as control media.
99
Where appropriate the experimental data were analysed for statistical
significance using a one way ANOVA, with post hoc comparison using the Fisher
LSD test to determine the specific differences (section 2.10). Differences were
considered significant at the level of P < 0.05.
5.2 Results
No significant differences were found between the three strains for the
growth parameters assessed in this experiment. Generally, glucose was
exhausted after 18 hours of fermentation and the highest ethanol concentration
was detected at 18-24 hours. Similar to results presented in Chapter 4, the only
significant difference in growth parameters was for cell viability, where K7
maintained higher viability throughout fermentation, and after 12 hours, the
viability of K7 was significantly higher than the other strains (p < 0.05). L-proline
supplementation did not lead to any significant effect on the growth parameters
determined in this experiment.
5.2.1 Generalized polarization in supplemented and unsupplemented
cultures
As noted above, L-proline was supplemented to growth medium at 6
concentrations. Membrane fluidity was determined by measuring laurdan GP.
Samples were taken at 6 and 24 hours of culture for GP measurement,
representing respiro-fermentative and respiratory growth phases, respectively. .
Figure 5.1 presents GP at 6 hours of culture for yeast cells grown in L-
proline supplemented and unsupplemented media. A significant difference due to
L-proline supplementation was only detected for PDM (p = 0.040), and not for
A12 (p = 0.058) or K7 (p = 0.631). The results of a Fisher LSD test for PDM GP
values are presented in Figure 5.2. Significant differences are indicated by the
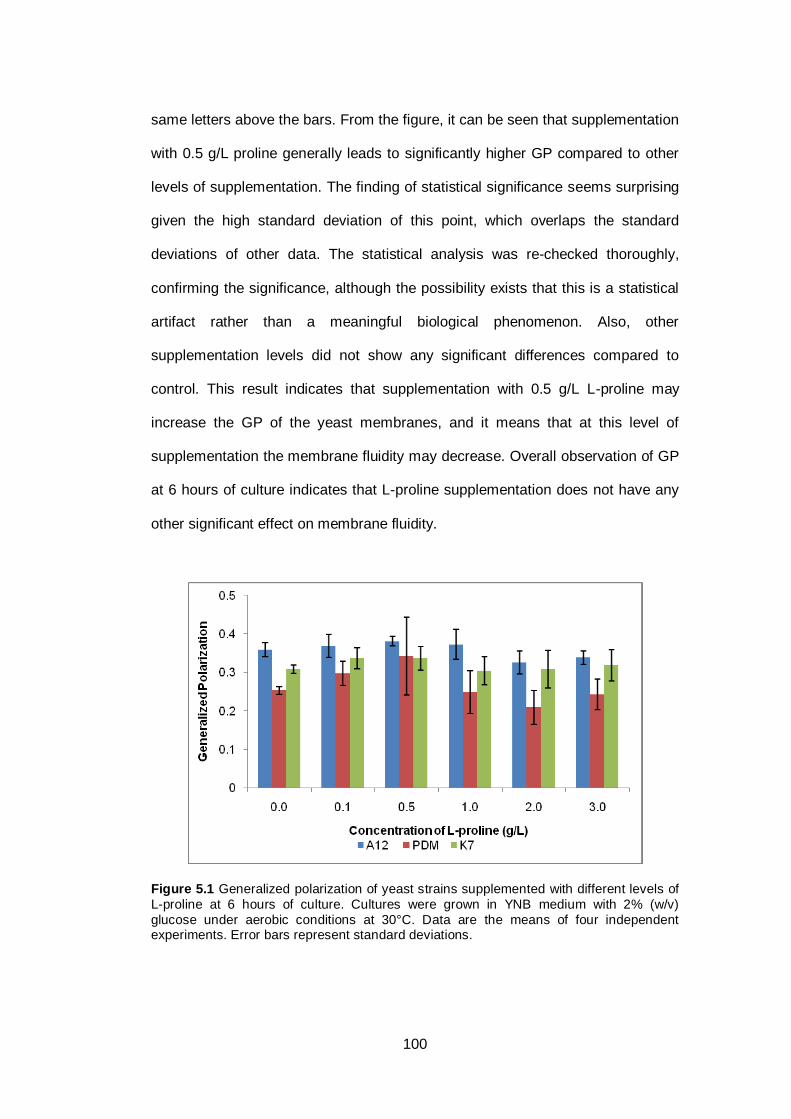
100
same letters above the bars. From the figure, it can be seen that supplementation
with 0.5 g/L proline generally leads to significantly higher GP compared to other
levels of supplementation. The finding of statistical significance seems surprising
given the high standard deviation of this point, which overlaps the standard
deviations of other data. The statistical analysis was re-checked thoroughly,
confirming the significance, although the possibility exists that this is a statistical
artifact rather than a meaningful biological phenomenon. Also, other
supplementation levels did not show any significant differences compared to
control. This result indicates that supplementation with 0.5 g/L L-proline may
increase the GP of the yeast membranes, and it means that at this level of
supplementation the membrane fluidity may decrease. Overall observation of GP
at 6 hours of culture indicates that L-proline supplementation does not have any
other significant effect on membrane fluidity.
Figure 5.1 Generalized polarization of yeast strains supplemented with different levels of
L-proline at 6 hours of culture. Cultures were grown in YNB medium with 2% (w/v)
glucose under aerobic conditions at 30°C. Data are the means of four independent experiments. Error bars represent standard deviations.
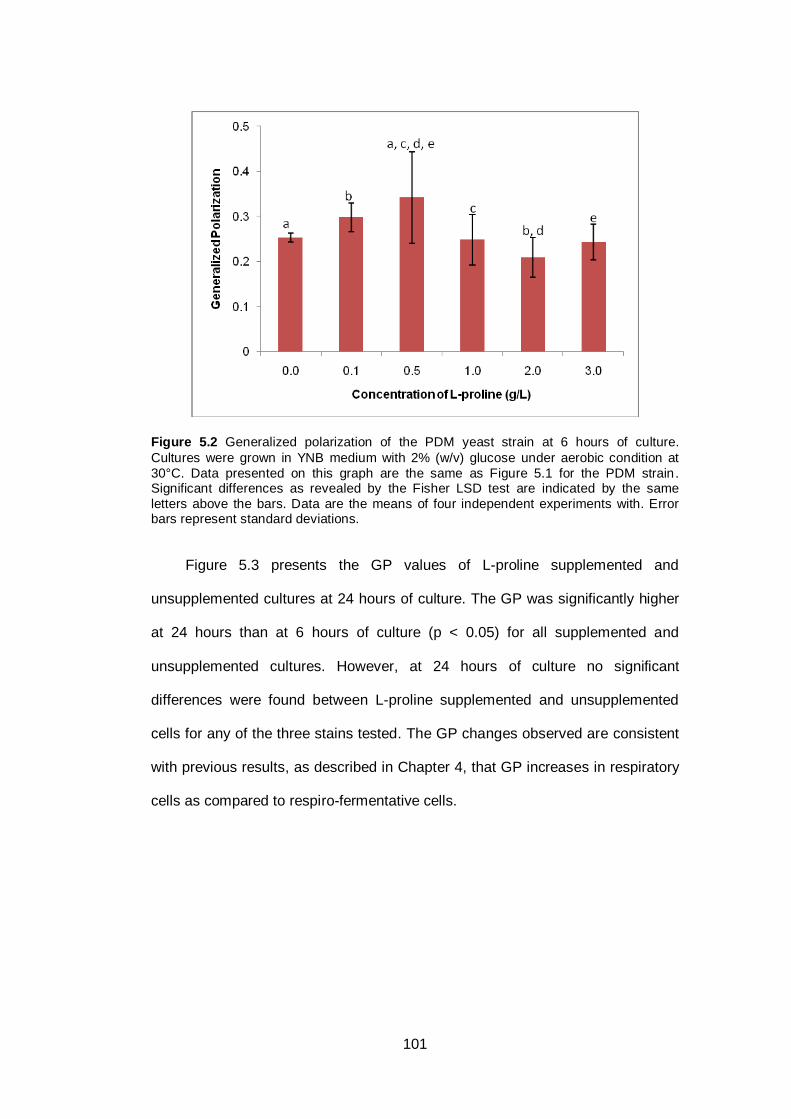
101
Figure 5.2 Generalized polarization of the PDM yeast strain at 6 hours of culture.
Cultures were grown in YNB medium with 2% (w/v) glucose under aerobic condition at
30°C. Data presented on this graph are the same as Figure 5.1 for the PDM strain. Significant differences as revealed by the Fisher LSD test are indicated by the same
letters above the bars. Data are the means of four independent experiments with. Error bars represent standard deviations.
Figure 5.3 presents the GP values of L-proline supplemented and
unsupplemented cultures at 24 hours of culture. The GP was significantly higher
at 24 hours than at 6 hours of culture (p < 0.05) for all supplemented and
unsupplemented cultures. However, at 24 hours of culture no significant
differences were found between L-proline supplemented and unsupplemented
cells for any of the three stains tested. The GP changes observed are consistent
with previous results, as described in Chapter 4, that GP increases in respiratory
cells as compared to respiro-fermentative cells.
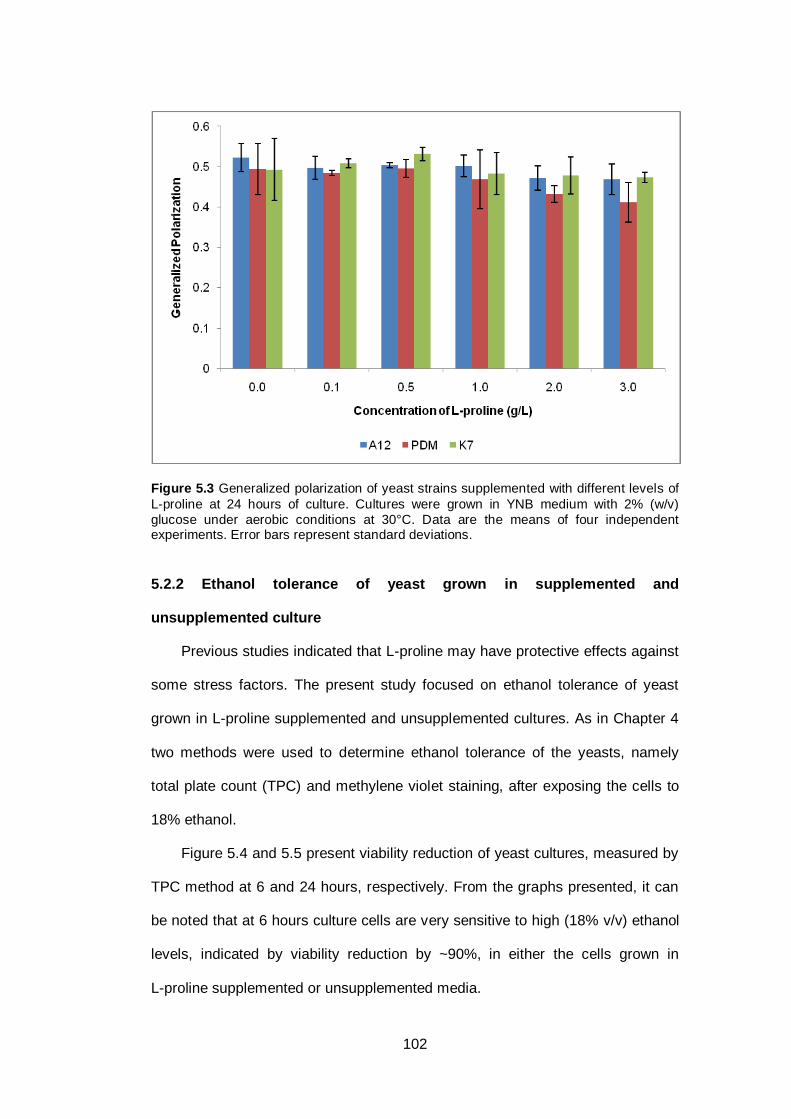
102
Figure 5.3 Generalized polarization of yeast strains supplemented with different levels of
L-proline at 24 hours of culture. Cultures were grown in YNB medium with 2% (w/v)
glucose under aerobic conditions at 30°C. Data are the means of four independent experiments. Error bars represent standard deviations.
5.2.2 Ethanol tolerance of yeast grown in supplemented and
unsupplemented culture
Previous studies indicated that L-proline may have protective effects against
some stress factors. The present study focused on ethanol tolerance of yeast
grown in L-proline supplemented and unsupplemented cultures. As in Chapter 4
two methods were used to determine ethanol tolerance of the yeasts, namely
total plate count (TPC) and methylene violet staining, after exposing the cells to
18% ethanol.
Figure 5.4 and 5.5 present viability reduction of yeast cultures, measured by
TPC method at 6 and 24 hours, respectively. From the graphs presented, it can
be noted that at 6 hours culture cells are very sensitive to high (18% v/v) ethanol
levels, indicated by viability reduction by ~90%, in either the cells grown in
L-proline supplemented or unsupplemented media.
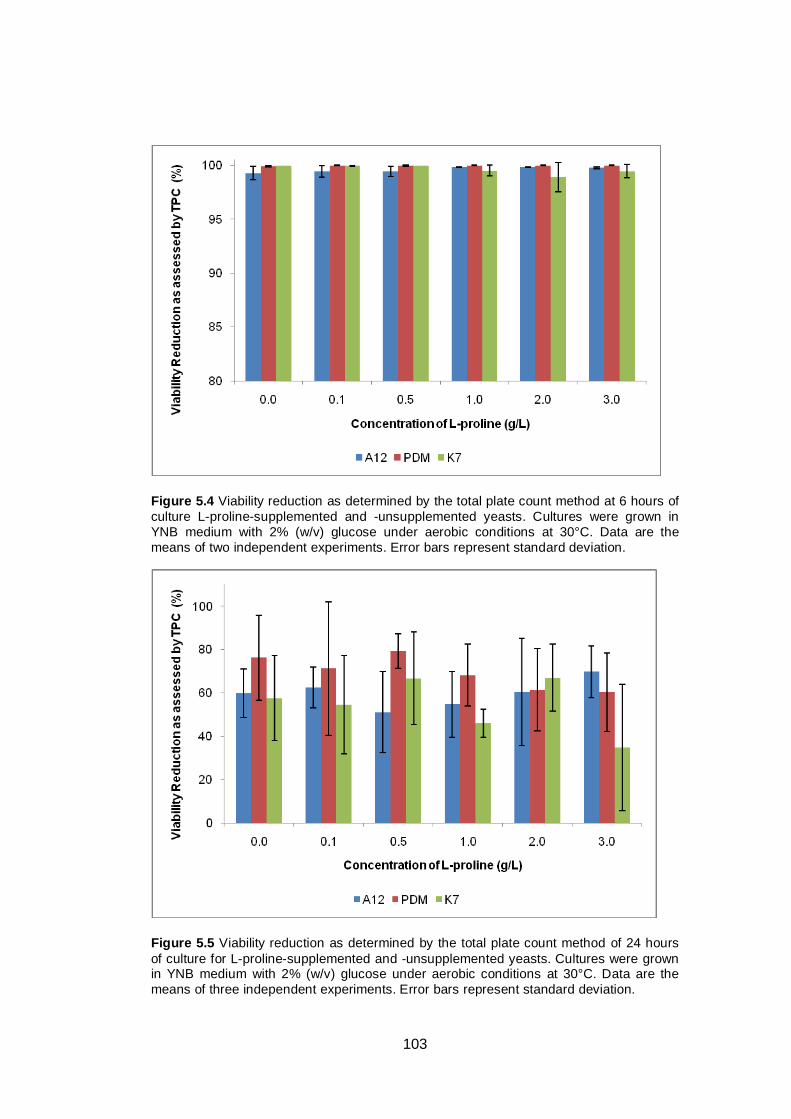
103
Figure 5.4 Viability reduction as determined by the total plate count method at 6 hours of
culture L-proline-supplemented and -unsupplemented yeasts. Cultures were grown in
YNB medium with 2% (w/v) glucose under aerobic conditions at 30°C. Data are the
means of two independent experiments. Error bars represent standard deviation.
Figure 5.5 Viability reduction as determined by the total plate count method of 24 hours
of culture for L-proline-supplemented and -unsupplemented yeasts. Cultures were grown in YNB medium with 2% (w/v) glucose under aerobic conditions at 30°C. Data are the
means of three independent experiments. Error bars represent standard deviation.
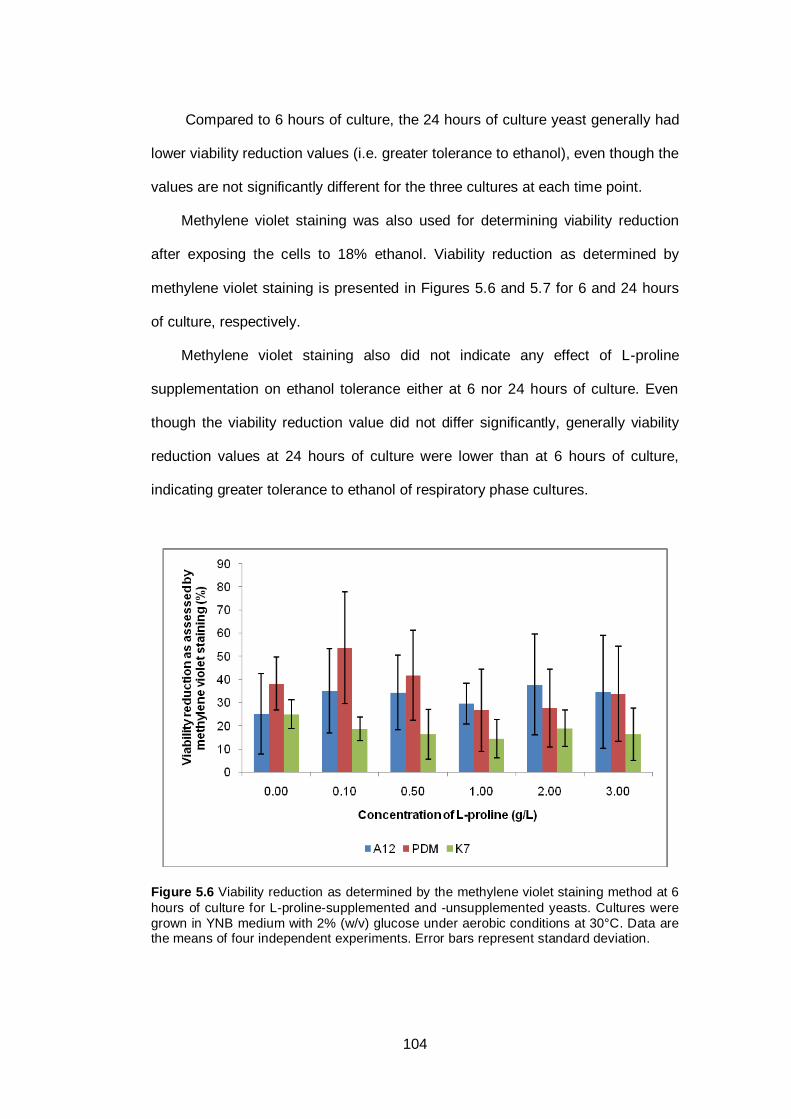
104
Compared to 6 hours of culture, the 24 hours of culture yeast generally had
lower viability reduction values (i.e. greater tolerance to ethanol), even though the
values are not significantly different for the three cultures at each time point.
Methylene violet staining was also used for determining viability reduction
after exposing the cells to 18% ethanol. Viability reduction as determined by
methylene violet staining is presented in Figures 5.6 and 5.7 for 6 and 24 hours
of culture, respectively.
Methylene violet staining also did not indicate any effect of L-proline
supplementation on ethanol tolerance either at 6 nor 24 hours of culture. Even
though the viability reduction value did not differ significantly, generally viability
reduction values at 24 hours of culture were lower than at 6 hours of culture,
indicating greater tolerance to ethanol of respiratory phase cultures.
Figure 5.6 Viability reduction as determined by the methylene violet staining method at 6
hours of culture for L-proline-supplemented and -unsupplemented yeasts. Cultures were
grown in YNB medium with 2% (w/v) glucose under aerobic conditions at 30°C. Data are the means of four independent experiments. Error bars represent standard deviation.
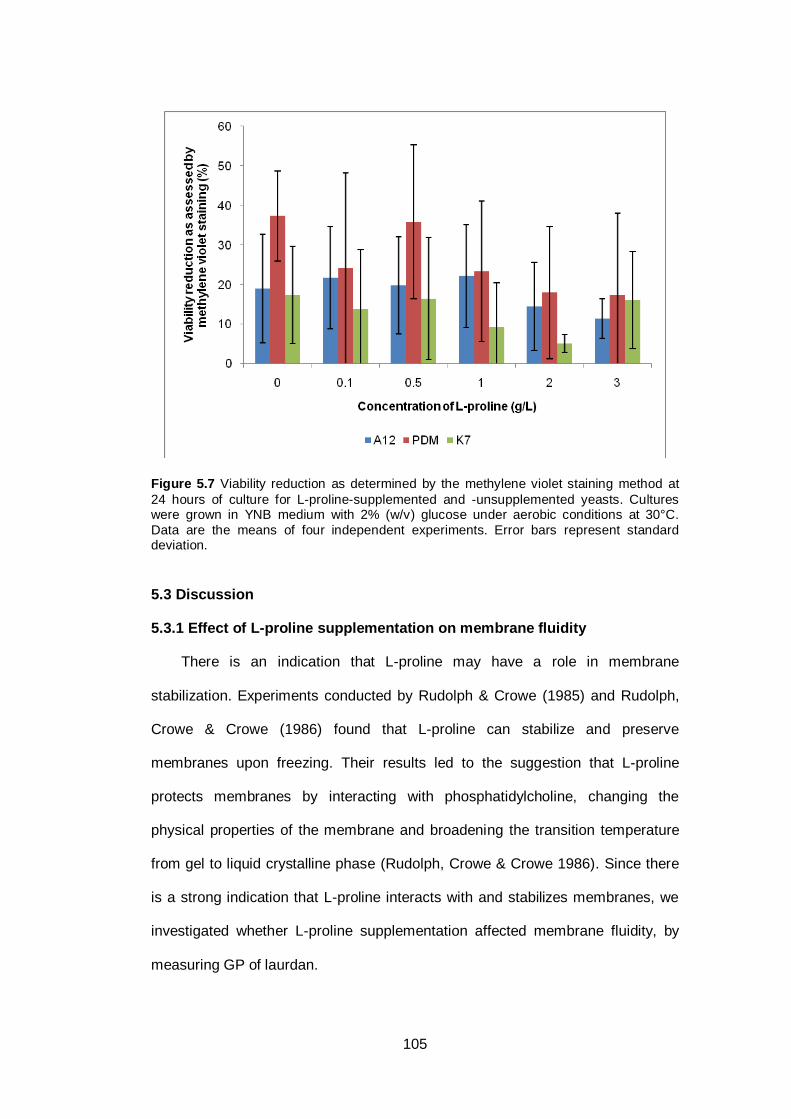
105
Figure 5.7 Viability reduction as determined by the methylene violet staining method at
24 hours of culture for L-proline-supplemented and -unsupplemented yeasts. Cultures were grown in YNB medium with 2% (w/v) glucose under aerobic conditions at 30°C.
Data are the means of four independent experiments. Error bars represent standard deviation.
5.3 Discussion
5.3.1 Effect of L-proline supplementation on membrane fluidity
There is an indication that L-proline may have a role in membrane
stabilization. Experiments conducted by Rudolph & Crowe (1985) and Rudolph,
Crowe & Crowe (1986) found that L-proline can stabilize and preserve
membranes upon freezing. Their results led to the suggestion that L-proline
protects membranes by interacting with phosphatidylcholine, changing the
physical properties of the membrane and broadening the transition temperature
from gel to liquid crystalline phase (Rudolph, Crowe & Crowe 1986). Since there
is a strong indication that L-proline interacts with and stabilizes membranes, we
investigated whether L-proline supplementation affected membrane fluidity, by
measuring GP of laurdan.
106
Our results indicated that L-proline supplementation did not have any strong
effect in terms of changing the fluidity of yeast plasma membranes. The only
significant difference was detected at 6 hours of culture for the PDM strain with
0.5 g/L L-proline supplementation, which showed a significantly higher GP value
compared to other levels of supplementation (p < 0.05). Subject to the concerns
raised above, this indicates that membrane fluidity for yeast supplemented with
0.5 g/L L-proline may be significantly lower than the other levels of
supplementation. However, this phenomenon could not be related to ethanol
tolerance; viability reduction as assessed by either TPC or methylene violet
staining failed to identify any difference in ethanol tolerance associated with the
lower membrane fluidity, as will be discussed later in this section.
Variation between GP values within the same treatment was very high as
evidenced by the large standard deviations, which ranged from about 1.3% up to
29.5%. Thus, while it was conclusively demonstrated that membrane fluidity was
lower in respiratory phase cells, no consistent differences in membrane fluidity
resulted from L-proline supplementation in either respiro-fermentative or
respiratory phase yeasts of the three strains tested.
5.3.2 Effect of L-proline supplementation on ethanol tolerance
Ethanol tolerance of the yeast cells was deduced from viability reduction
values, as determined by either TPC or methylene violet staining methods. As
expected from the Chapter 4 results, viability reduction as assessed by TPC at 6
hours of culture was very high (~99%) for both L-proline-supplemented and -
unsupplemented cultures, which showed that the cells are very sensitive to a high
ethanol concentration. However, methylene violet staining showed that some
cells were still viable after the high ethanol stress, as indicated by the lower
viability reduction compared to the TPC method. Viability reduction values as
107
assessed by methylene violet staining ranged from 53.7 ± 24.1% to 14.6 ± 8.2%
for PDM grown in 0.1 g/L and K7 grown in 1 g/L L-proline supplemented media,
respectively. However, even though the cells were not dead, they had lost the
ability to divide, as indicated by low viability as assessed by the TPC method.
Further study is required to investigate whether the viable cells detected by
methylene violet staining are still capable of fermenting sugars. If so, they could
still usefully contribute to the fermentation. Additionally, it could be determined
whether the cells became non-viable (by methylene violet staining) during the
incubation period of the agar plates or if there was an increase in clumpiness/floc.
Ethanol tolerance at 24 hours of culture was generally higher than at 6
hours of culture, even though the data did not indicate significant differences in
viability reduction value as determined by either TPC or methylene violet staining.
This result is in agreement with the results presented in Chapter 4, in which
ethanol tolerance was increased in respiratory phase cells.
As at 6 hours of culture, at 24 hours of culture the cells did not show any
significant differences in ethanol tolerance (as determined using either viability
determination method) when the media were supplemented with various
concentrations of L-proline. However, even though not statistically significant, the
PDM strain tended to be the most susceptible to ethanol.
5.4 Conclusions
The present study failed to confirm the findings of previous studies that
suggested that proline could enhance tolerance to stress (Takagi et al. 2005).
However, it should be noted that the previous studies increased intracellular
proline levels by genetic modification of cells, while our approach was to
investigate whether a non-GMO approach of supplementation of media with L-
proline could be a viable alternative strategy. However this study found that
108
supplementation with L-proline did not lead to any consistent effects in terms of
the membrane fluidity or ethanol tolerance of the yeast strains investigated.
109
CHAPTER SIX: EFFECT OF INOSITOL SUPPLEMENTATION ON ETHANOL TOLERANCE
6.1 Introduction
6.1.1 General Introduction
Inositol has been documented to have protective effects against ethanol
stress (Chi, Kohlwein & Paltauf 1999; Furukawa et al. 2004; Ji et al. 2008; Krause
et al. 2007). Supplementation of inositol was found to change phospholipid
composition by increasing the phosphatidylinositol (PI) content of the plasma
membrane, while phosphatidylcholine (PC) and phosphatidylethanolamine (PE)
levels were decreased (Chi, Kohlwein & Paltauf 1999). Another study also
revealed that inositol supplementation affects H+-ATPase activity and protects
yeast plasma membranes against leaking (Furukawa et al. 2004).
Mutant yeast strains capable of accumulating higher levels of intracellular
inositol were also found to have better tolerance against high ethanol
concentrations (Krause et al. 2007). Chi, Kohlwein & Paltauf (1999) found that
inositol supplementation, not only increased tolerance to high ethanol
concentrations, but also increased ethanol productivity. However, another study
showed that while inositol supplementation improved viability in the presence of
high ethanol concentrations, it did not affect the final ethanol production and
fermentation rate (Furukawa et al. 2004).
Previous researchers used different concentrations of inositol in the growth
media. Chi, Kohlwein & Paltauf (1999) used 0.1 g/L, Furukawa et al. (2004) used
10 mM (0.0018 g/L) and 90 mM (0.0162 g/L) and Krause et al. (2007) used 75
mM (0.0135 g/L) inositol.
110
Ji et al. (2008) investigated effect of inositol supplementation on a different
yeast cell species, Pachysolen tannophilus, and used several inositol
concentrations in their growth media. They found that inositol provided optimal
effects at 0.15 g/L for cell growth and ethanol tolerance, and 0.1 g/L for ethanol
productivity, while excessive inositol tended to have negative effects by lowering
growth rate and ethanol productivity.
To the best of our knowledge, there are no published works reporting effects
of more than two levels of inositol supplementation on cell health of S. cerevisiae.
Therefore in the present study we investigated several levels of inositol
supplementation to more closely investigate its effect on ethanol tolerance in S.
cerevisiae strains.
As described previously (Chapter 1.4.2), inositol supplementation tends to
increase PI and decrease PC and PE content of the yeast cell plasma membrane
(Chi, Kohlwein & Paltauf 1999). Fatty acid compositions are different for each
type of phospholipid component. The main fatty acid components varied from one
study to another, but as a general picture, PI is mainly composed of C18:0 and
C20:4, PE is mainly composed of C16:0, C18:0 and C20:4, PC is mainly
composed of C16:0 and PS is mainly composed of C18:0 (Christie 2010).
Therefore changes in phospholipid class composition might also change the
membrane fluidity, since different degrees of fatty acid saturation will result. This
led us to investigate the membrane fluidity in addition to the ethanol tolerance of
yeasts grown in inositol supplemented media.
6.1.2 Yeast strain and culture condition
The yeast strains used were those investigated in Chapter 4, i.e. A12, PDM
and K7.
111
6.1.3 Specific growth conditions and experimental design
For growth parameter analysis, batch culture experiments were set up, and
samples were aseptically removed from the culture by drawing off with a sterile
pipette every 6 hours from 0 to 30 hours. Samples were then analysed for optical
density at 600 nm (Section 2.4), viable cell count (section 2.5), percent cell
viability (section 2.5), percent budding rate (section 2.6), and glucose and ethanol
concentrations (section 2.9).
Ethanol tolerance (section 2.8) and GP (section 2.7) were only measured at
two time points, 6 and 24 hours, representing respiro-fermentative and
respiratory phases of the cultures, respectively. The medium used in this
experiment was YNB with 2% (w/v) glucose, prepared as a 10× concentration
stock solution and diluted as required prior to use. The stock solution was filtered
through a sterile 0.22 µm pore size membrane. Inositol was supplemented by
adding an appropriate amount of freshly prepared, sterile inositol stock solution (3
g/L) to give the desired final inositol concentration of 0.005, 0.05, 0.1, 0.15, and
0.2 g/L. Media without inositol supplementation were used as control media. As
the YNB medium formulation already contains 0.002 g/L inositol, the control
media were not at zero, but at 0.002 g/L. Calculations for inositol
supplementation considered the basal level in the media. Due to time and
financial constraints it was not possible to construct or obtain an equivalent of
YNB that lacked inositol.
Where appropriate the experimental data were analysed for statistical
significance using a one way ANOVA, with post hoc comparison using the Fisher
LSD test to determine the specific differences (section 2.10). Differences were
considered significant different at the level of p < 0.05.
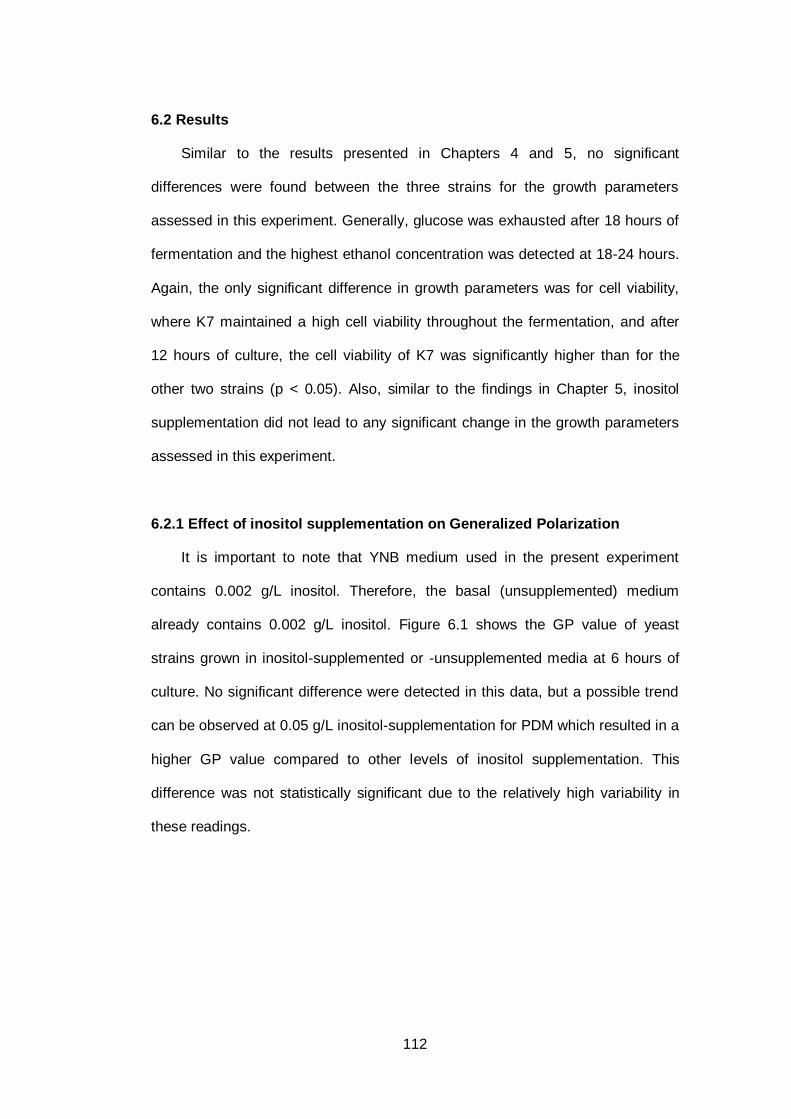
112
6.2 Results
Similar to the results presented in Chapters 4 and 5, no significant
differences were found between the three strains for the growth parameters
assessed in this experiment. Generally, glucose was exhausted after 18 hours of
fermentation and the highest ethanol concentration was detected at 18-24 hours.
Again, the only significant difference in growth parameters was for cell viability,
where K7 maintained a high cell viability throughout the fermentation, and after
12 hours of culture, the cell viability of K7 was significantly higher than for the
other two strains (p < 0.05). Also, similar to the findings in Chapter 5, inositol
supplementation did not lead to any significant change in the growth parameters
assessed in this experiment.
6.2.1 Effect of inositol supplementation on Generalized Polarization
It is important to note that YNB medium used in the present experiment
contains 0.002 g/L inositol. Therefore, the basal (unsupplemented) medium
already contains 0.002 g/L inositol. Figure 6.1 shows the GP value of yeast
strains grown in inositol-supplemented or -unsupplemented media at 6 hours of
culture. No significant difference were detected in this data, but a possible trend
can be observed at 0.05 g/L inositol-supplementation for PDM which resulted in a
higher GP value compared to other levels of inositol supplementation. This
difference was not statistically significant due to the relatively high variability in
these readings.
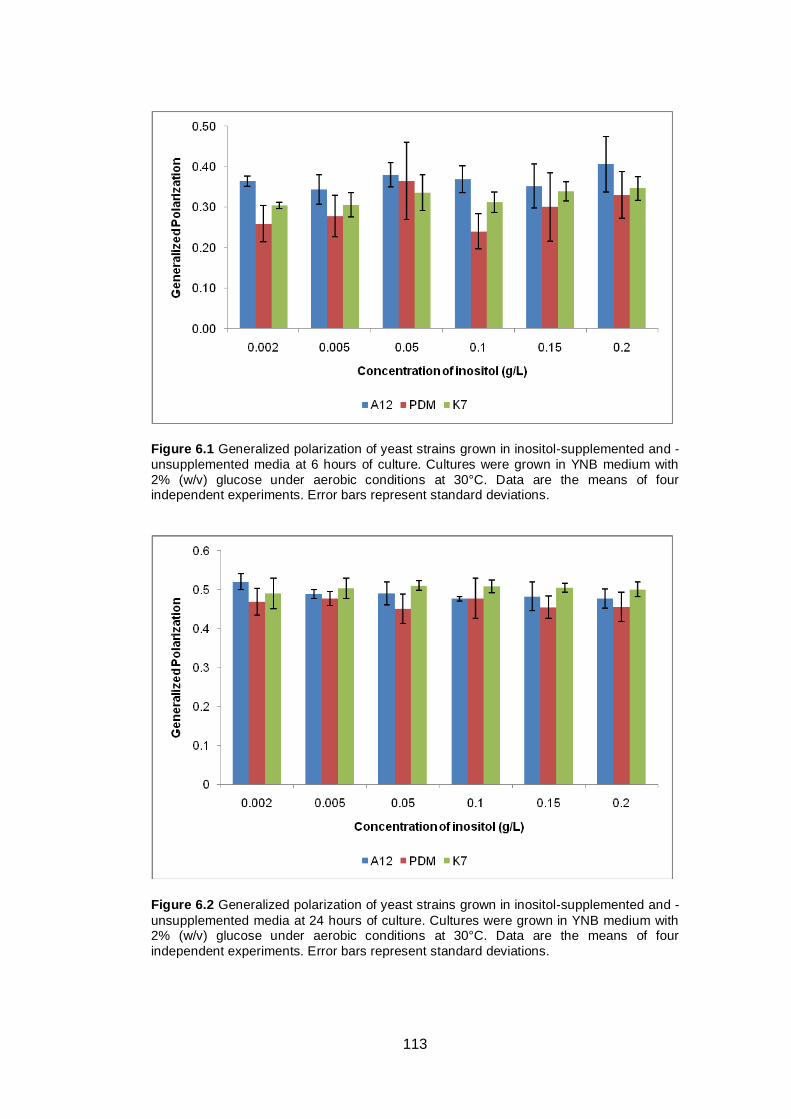
113
Figure 6.1 Generalized polarization of yeast strains grown in inositol-supplemented and -
unsupplemented media at 6 hours of culture. Cultures were grown in YNB medium with
2% (w/v) glucose under aerobic conditions at 30°C. Data are the means of four independent experiments. Error bars represent standard deviations.
Figure 6.2 Generalized polarization of yeast strains grown in inositol-supplemented and -
unsupplemented media at 24 hours of culture. Cultures were grown in YNB medium with 2% (w/v) glucose under aerobic conditions at 30°C. Data are the means of four
independent experiments. Error bars represent standard deviations.
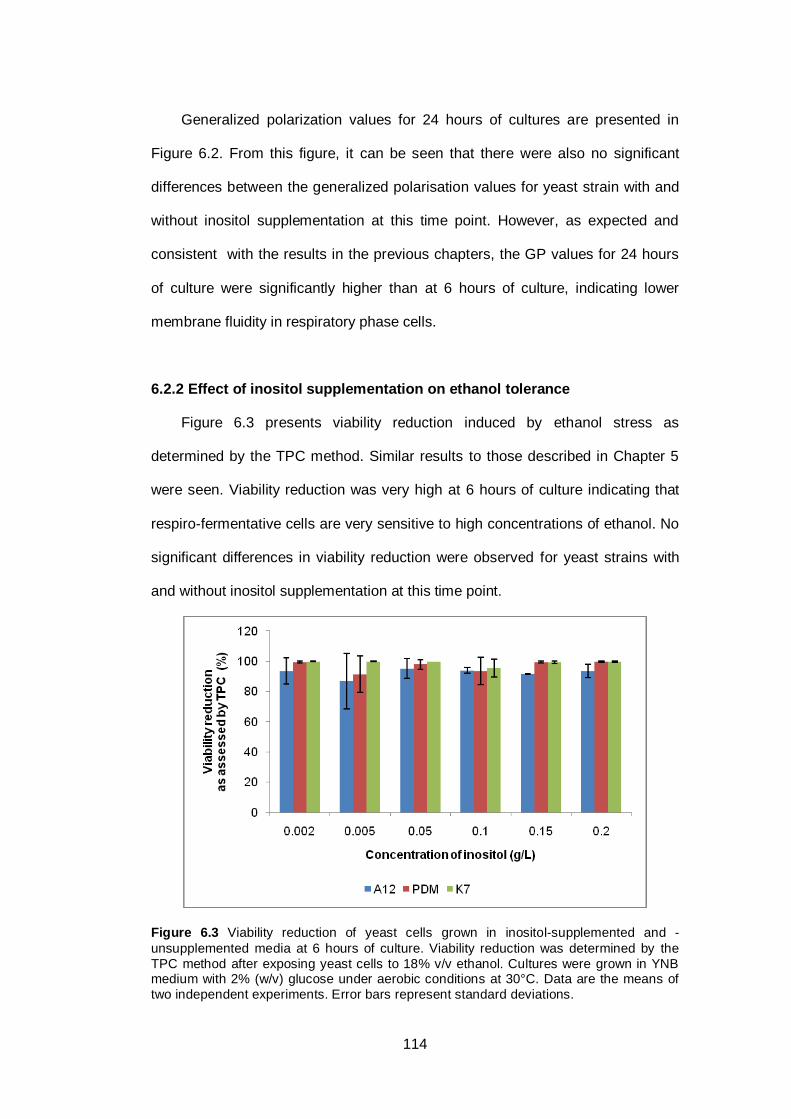
114
Generalized polarization values for 24 hours of cultures are presented in
Figure 6.2. From this figure, it can be seen that there were also no significant
differences between the generalized polarisation values for yeast strain with and
without inositol supplementation at this time point. However, as expected and
consistent with the results in the previous chapters, the GP values for 24 hours
of culture were significantly higher than at 6 hours of culture, indicating lower
membrane fluidity in respiratory phase cells.
6.2.2 Effect of inositol supplementation on ethanol tolerance
Figure 6.3 presents viability reduction induced by ethanol stress as
determined by the TPC method. Similar results to those described in Chapter 5
were seen. Viability reduction was very high at 6 hours of culture indicating that
respiro-fermentative cells are very sensitive to high concentrations of ethanol. No
significant differences in viability reduction were observed for yeast strains with
and without inositol supplementation at this time point.
Figure 6.3 Viability reduction of yeast cells grown in inositol-supplemented and -
unsupplemented media at 6 hours of culture. Viability reduction was determined by the
TPC method after exposing yeast cells to 18% v/v ethanol. Cultures were grown in YNB medium with 2% (w/v) glucose under aerobic conditions at 30°C. Data are the means of
two independent experiments. Error bars represent standard deviations.
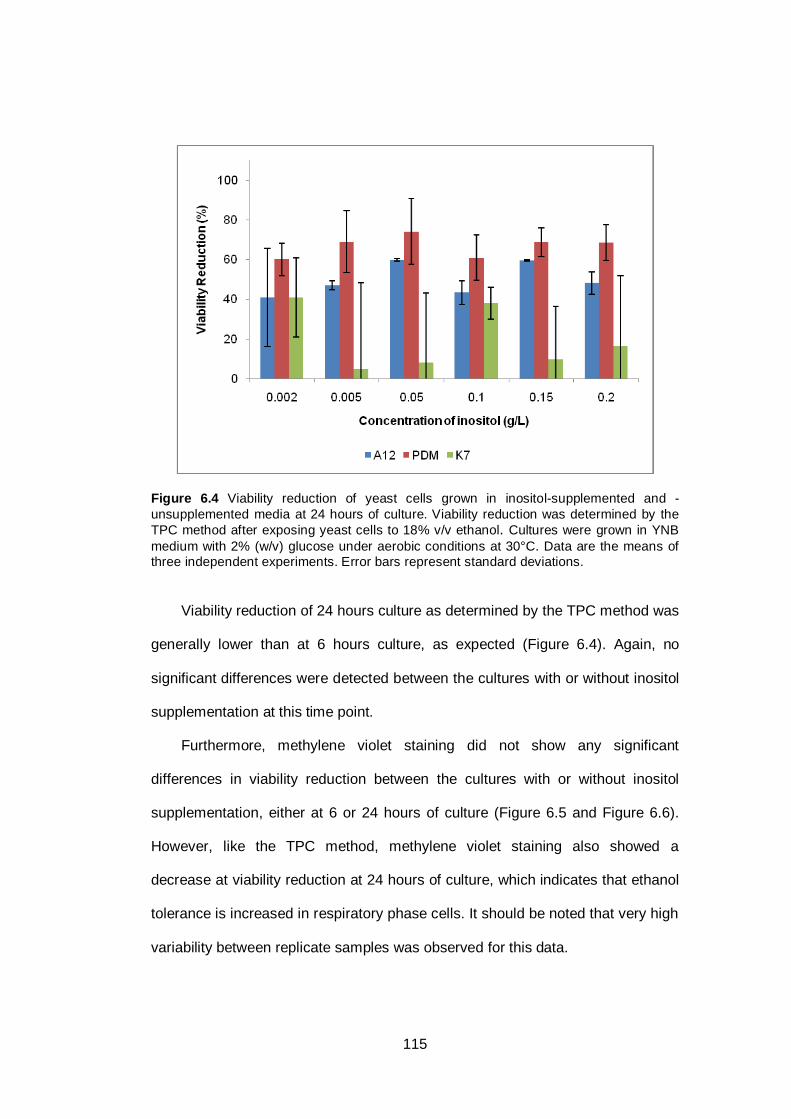
115
Figure 6.4 Viability reduction of yeast cells grown in inositol-supplemented and -
unsupplemented media at 24 hours of culture. Viability reduction was determined by the
TPC method after exposing yeast cells to 18% v/v ethanol. Cultures were grown in YNB
medium with 2% (w/v) glucose under aerobic conditions at 30°C. Data are the means of
three independent experiments. Error bars represent standard deviations. Viability reduction of 24 hours culture as determined by the TPC method was
generally lower than at 6 hours culture, as expected (Figure 6.4). Again, no
significant differences were detected between the cultures with or without inositol
supplementation at this time point.
Furthermore, methylene violet staining did not show any significant
differences in viability reduction between the cultures with or without inositol
supplementation, either at 6 or 24 hours of culture (Figure 6.5 and Figure 6.6).
However, like the TPC method, methylene violet staining also showed a
decrease at viability reduction at 24 hours of culture, which indicates that ethanol
tolerance is increased in respiratory phase cells. It should be noted that very high
variability between replicate samples was observed for this data.
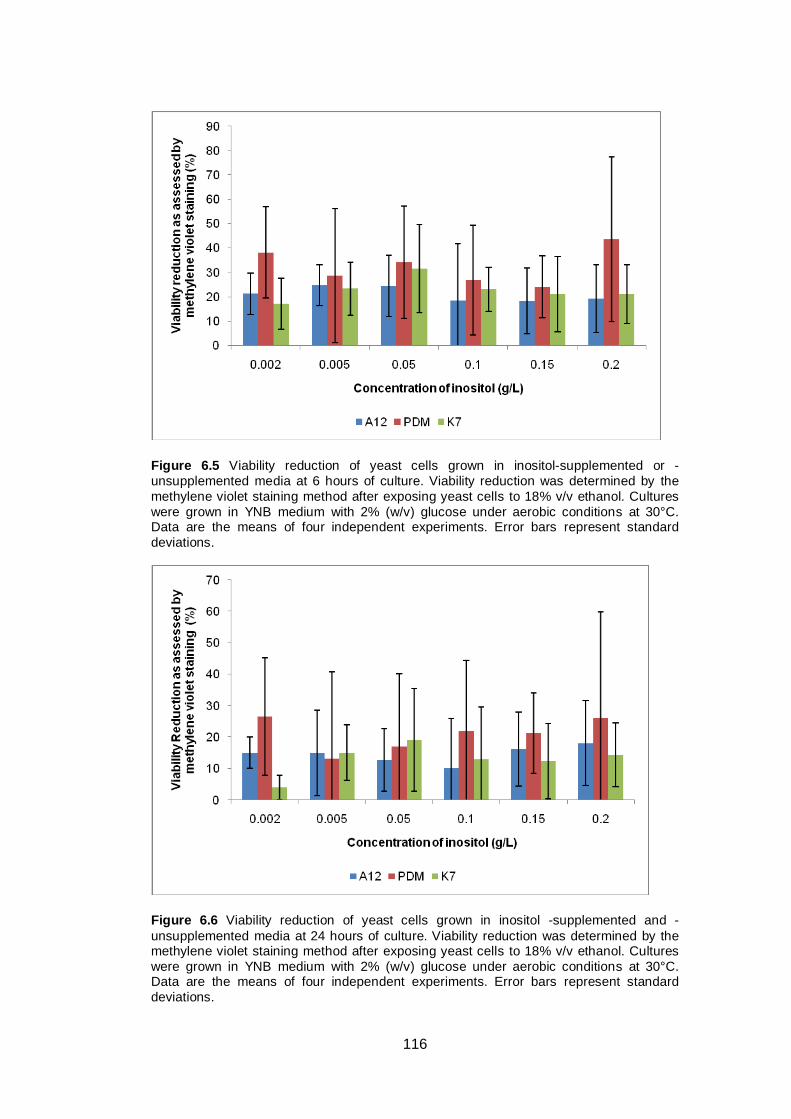
116
Figure 6.5 Viability reduction of yeast cells grown in inositol-supplemented or -
unsupplemented media at 6 hours of culture. Viability reduction was determined by the
methylene violet staining method after exposing yeast cells to 18% v/v ethanol. Cultures
were grown in YNB medium with 2% (w/v) glucose under aerobic conditions at 30°C. Data are the means of four independent experiments. Error bars represent standard
deviations.
Figure 6.6 Viability reduction of yeast cells grown in inositol -supplemented and -
unsupplemented media at 24 hours of culture. Viability reduction was determined by the methylene violet staining method after exposing yeast cells to 18% v/v ethanol. Cultures
were grown in YNB medium with 2% (w/v) glucose under aerobic conditions at 30°C. Data are the means of four independent experiments. Error bars represent standard
deviations.
117
6.3 Discussion
Generalized polarization data did not show any significant effects of inositol
supplementation on membrane fluidity. Only slightly higher GP was detected and
this was only for the PDM strain at 6 hours when supplemented with 0.05 g/L
inositol, possibly indicating lower membrane fluidity compared to the other levels
of supplementation. This result requires further study since a previous study (Chi,
Kohlwein & Paltauf 1999) indicated that phospholipid composition was altered
following inositol addition, which could lead to a changed plasma membrane
fluidity. However, in the present study, in which fluidity was determined by a
biophysical technique, any factors counterbalancing compositional changes
would be taken into account as part of the measurement. Therefore, further study
is required to investigate changes of phospholipid composition due to inositol
supplementation and its relationship to membrane fluidity.
There were no significant differences in GP between yeast grown in inositol-
supplemented and –unsupplemented media observed at 24 hours of culture.
However, GP was increased significantly (p < 0.05) compared to 6 hours of
culture, indicating significantly lower membrane fluidity. Similar results were also
observed in Chapters 4 and 5. As in previous experiments, decreasing
membrane fluidity was accompanied by increasing ethanol tolerance for all
strains, independent of the level of inositol supplementation. This result supports
previous study (Swan & Watson 1999) which indicated that ethanol tolerance is
related to lower plasma membrane fluidity.
As in previous chapters (4 and 5) and other studies, respiro-fermentative
cells, as expected, were more sensitive to ethanol.
No significant difference in viability reduction, either as measured by TPC or
methylene violet staining, was detected between yeast grown in inositol-
supplemented and -unsupplemented media. High variability between replicates of
118
viability measurements were again observed for TPC and methylene violet
staining. Therefore, exploration of other methods for ethanol tolerance
determination is required to achieve better results.
6.4 Conclusions
The present study could not confirm the results of previous studies which
indicated that inositol supplementation and accumulation improved ethanol
tolerance of yeast cells. Even though not significant, 0.05 g/L inositol might
slightly change the membrane fluidity of the PDM strain. Further study is required
to test this result. As in previous chapters of this thesis, PDM was found to be the
yeast strain most susceptible to ethanol compared to A12 and K7.
119
CHAPTER SEVEN: GENERAL DISCUSSION AND FUTURE DIRECTIONS
7.1 Discussion
Three different yeast strains were used in the present study, Saccharomyces
cerevisiae strains A12, PDM and K7. The results of this study revealed that these
three strains, besides having slightly different growth parameters, had different
intrinsic membrane fluidity and sensitivity to high ethanol concentrations. The
present study also indicated a slightly different finding compared to previous
published studies regarding the relationship between membrane fluidity and
ethanol tolerance.
Growth parameter analysis of these three yeast strains indicated that K7 has
a longer respiro-fermentative growth phase but higher total and viable cell
numbers during the respiratory phase of the fermentation process. The cell
viability of K7 was maintained at above 90% throughout the fermentation. These
features make K7 the best of the strains studied in terms of potential for industrial
high sugar fermentation, which requires cell survival throughout the entire
fermentation process.
Generalized polarization of the three yeast strains used in this experiment
showed that PDM has the highest membrane fluidity, followed by K7 and A12 has
the lowest. Previous studies indicated that yeast cells with higher membrane
fluidity are more tolerant to high ethanol concentrations (Alexandre, Berlot &
Charpentier 1994; Alexandre, Rousseaux & Charpentier 1994; Kajiwara et al.
2000). However, our results indicate the opposite. In respiro-fermentative
cultures, PDM, which has the highest membrane fluidity, was also found to be the
most susceptible to ethanol, with no significant difference between A12 and K7.
Therefore, our results lead us to report that, unlike some previous studies
120
(Alexandre, Berlot & Charpentier 1994; Alexandre, Rousseaux & Charpentier
1994; Kajiwara et al. 2000; You, Rosenfield & Knipple 2003) but similar to other
studies (Learmonth 2011; Learmonth & Gratton 2002), higher ethanol tolerance is
related to lower intrinsic membrane fluidity.
Previous studies used different approaches for determining membrane
fluidity. Determination of the unsaturation index by measuring the fatty acid
composition of the yeast plasma membrane has been widely used for indirect
estimation of membrane fluidity (Kajiwara et al. 2000; Rodrıguez-Vargas et al.
2007; Swan & Watson 1999; You, Rosenfield & Knipple 2003). These inferences
do not take into account a large number of factors that may modulate membrane
fluidity (Butcher 2008; Learmonth 2011). Direct measurement by measuring
anisotropy of DPH was also used to determine the relationship between
membrane fluidity and ethanol tolerance (Alexandre, Rousseaux & Charpentier
1994). All studies generally reported that ethanol tolerance is related to higher
membrane fluidity. To the best of our knowledge, apart from studies in this
laboratory (Butcher 2008; Learmonth 2011; Learmonth & Gratton 2002), only one
publication by Swan & Watson (1999) reported that yeast cells with higher
membrane fluidity have lower ethanol tolerance, and these authors estimated the
membrane fluidity by reporting the unsaturation index.
Our approach to membrane fluidity measurement was different in that we
used generalized polarization of laurdan. We also used two different methods for
ethanol tolerance determination; total plate count and methylene violet staining
methods. TPC is well known and widely used as a standard method for
determining yeast viability after exposing yeast cells to a particular stress factor
(Chi, Kohlwein & Paltauf 1999; Swan & Watson 1999). The methylene violet
staining method is known as an established method for discriminating viable and
nonviable cells (Smart et al. 1999).
121
The present study indicates that even though TPC and methylene violet
staining do not give results that have strong correlation, they tend to have
different applications for ethanol tolerance testing. The TPC method was useful in
discriminating differences in yeast viability at different time points, i.e. different
yeast growth phases, but failed to discriminate differences in yeast viability of
different yeast strains at the same time point. On the other hand, the methylene
violet staining method was useful in discriminating the differences in viability of
different yeast strains at the same time point, but failed to discriminate
differences in the viability of the same strain at different time points. Therefore,
we suggest that these two methods can be used for different purposes,
depending on what is required. However, further studies are required to work out
why these techniques did not, as expected, provide similar results. One major
difference between the techniques is that methylene violet staining may identify
live cells that have lost the ability to divide or grow and would therefore not be
detected by plate counts.
The aim of the present study was to improve ethanol tolerance by
supplementing growth media with L-proline and/or inositol, based on published
reports that indicated protective effects against various stress factors. L-proline
has been reported to protect cells against freezing (Sekine et al. 2007; Takagi et
al. 2000; Terao, Nakamori & Takagi 2003) and high ethanol concentrations
(Takagi et al. 2005). However, most of the published studies discussed the effect
of intracellular L-proline content on improving stress tolerance of the yeast cell.
Intracellular L-proline content was increased by means of genetic engineering of
L-proline metabolic pathways, either by disrupting L-proline degrading enzymes
(Takagi et al. 2000) or enhancing L-proline formation (Morita, Nakamori & Takagi
2003; Takagi et al. 2005; Terao, Nakamori & Takagi 2003).
122
Furthermore, there are no reports of extracellular L-proline supplementation
affecting yeast cell survival after exposure to various stress factors. It has been
shown that the yeast S. cerevisiae has the ability to assimilate L-proline from the
culture medium, more so under aerobic conditions (Horak & Kotyk 1986). There
were also some indications that excessive amounts of L-proline may have lethal
effects on yeast (Takagi 2008). Therefore, the present study aimed to investigate
the effect of extracellular L-proline supplementation and also to determine the
optimum concentration of L-proline to have a positive effect on ethanol tolerance.
L-proline effects on maintaining membrane stability have been reported
previously (Rudolph & Crowe 1985; Rudolph, Crowe & Crowe 1986; Takagi
2008). Those studies indicated that L-proline may affect the physical properties of
the membrane. However, in this study GP measurement of yeasts grown in L-
proline-supplemented and -unsupplemented media did not indicate any general
change in membrane fluidity. Only one significant difference was detected, at 0.5
g/L L-proline supplementation of the PDM strain which had a higher GP value
than other levels of supplementation. This indicates that for this strain L-proline
supplementation at 0.5 g/L may lower membrane fluidity, and according to
previous results, lower membrane fluidity should lead to better ethanol tolerance.
However, viability reduction determination failed to show any effect of L-proline
supplementation on ethanol tolerance.
In the present study, L-proline supplementation did not have any significant
effect on improving yeast tolerance to high ethanol concentrations. Further
investigation is required to confirm whether L-proline supplementation does
change the plasma membrane fluidity and affect the ethanol tolerance property of
the yeast cell.
Inositol was the second supplement used in the present experiments.
Previous reports indicated that inositol supplementation may change plasma
123
membrane phospholipid composition (Chi, Kohlwein & Paltauf 1999) and
improve the ethanol tolerance of the yeast cells (Chi, Kohlwein & Paltauf 1999;
Furukawa et al. 2004; Krause et al. 2007). However, excessive inositol was found
to have negative effects on cell growth and ethanol production (Ji et al. 2008).
Therefore, in the present study one aim was to investigate the effect of different
levels of inositol supplementation on yeast tolerance to ethanol and to determine
the optimum level of inositol supplementation.
We found that inositol supplementation did not induce significant differences
in membrane fluidity in the yeast strains studied. However, our experiment did not
determine phospholipid or fatty acid composition, and while we can confirm that
inositol supplementation did not affect the measured fluidity, we cannot fully
determine relationships between inositol supplementation, phospholipid content
and membrane fluidity. Further study to investigate this aspect is required to fully
understand yeast adaptation mechanisms, especially in relation to inositol
supplementation.
Ethanol tolerance of yeast cells was reportedly improved when the yeast
were grown in inositol-supplemented media (Chi, Kohlwein & Paltauf 1999;
Krause et al. 2007). Our results indicate that none of the inositol supplementation
levels enhanced ethanol tolerance of the yeast cells. No significant differences
were detected between yeast grown in inositol-supplemented and -
unsupplemented media. Therefore, our results could not confirm the results of
previous published studies that reported that inositol has a positive effect on
enhancing ethanol the tolerance of yeast cells.
One aim of the present study was that once effective concentrations of L-
proline and inositol were determined, then the effect of co-supplementation would
be investigated. However, given that no consistent effects were seen for either
supplement, co-supplementation experiments were not warranted. Also, due to
124
the lack of discernable effects of supplementation and also due to time
constraints it was not possible to scale back to industrial sugar concentrations.
The yeasts studied were selected as ―non-traditional‖ alternative strains with
potential for industrial bioethanol fermentation. The overall results indicated that
of the strains studied, the wine yeast (PDM) was the most susceptible when
exposed to high ethanol concentration either in media with no supplementation or
media additionally supplemented with L-proline or inositol. The susceptibility of
this strain was most likely associated with the higher membrane fluidity compared
to the other strains. Furthermore, of the strains studied, the sake strain (K7)
appeared to be the most promising, mainly due to its maintenance of higher
viability throughout the fermentation.
7.2 Conclusions and Contributions of This Study
The data acquired in this study led us to conclude some important points.
Compared to A12 and K7, PDM tended to have the highest membrane fluidity
and was the most susceptible to ethanol. Therefore, we conclude, unlike some
previous published studies, that higher ethanol tolerance is related to lower
intrinsic membrane fluidity.
This conclusion is also supported by comparison of membrane fluidity and
ethanol tolerance data from respiro-fermentative (6 hour of culture) and
respiratory (24 hour of culture) cells which indicated that respiratory yeasts had
lower membrane fluidity and higher ethanol tolerance. Correlation analysis also
showed that correlation between the viability measured by total plate count and
methylene violet staining was poor, and warrants further study. However,
individual interpretation of TPC and methylene violet staining indicate that these
two methods can be applied for different purposes. The TPC method seemed
better for discriminating viability of different growth phases, while methylene violet
125
staining seemed better for discriminating cell viability of different yeast strains at
a particular time point.
Although not statistically significant, supplementation with 0.5 g/L L-proline
seems to have a positive effect on changing membrane fluidity. Further study to
test this result is required. As for the inositol supplementation, the present study
could not confirm the results of previous published work which indicated that
inositol supplementation has a positive effect on enhancing ethanol tolerance of
the yeast cell.
Among the three strains used in the present study, K7 showed better
performance compared to the other two strains. Although the ethanol tolerance of
K7 was slightly lower than that of A12, this strain showed the best cell viability
throughout the fermentation, which is an important property for fermentation of
media with high sugar concentration. Therefore, K7 is recommended for further
exploration.
7.3 Future Directions
Enhancing ethanol tolerance of yeasts is very important in order to achieve
better ethanol productivity for bioethanol production. Higher ethanol production
will lead to lower costs for ethanol separation, and eventually this will improve the
economy of bioethanol production. Fundamental aspects of ethanol tolerance
also need to be further explored in order to understand the underlying
mechanisms, with a view to manipulation of these mechanisms to and enhance
ethanol productivity. Therefore, from the present study, there are some potential
approaches for further research:
126
1. Investigation of the relationships between membrane fluidity, plasma
membrane composition, and yeast cell susceptibility to various stress factors.
Although it is widely accepted that high membrane fluidity is related to high
unsaturation index, direct measurement of membrane fluidity may reveal
exceptions to this rule as described by Alexandre, Rousseaux & Charpentier
(1994), Butcher (2008) and Learmonth (2011). Therefore, all three parameters
need to be measured when investigating relationships between membrane fluidity
and ethanol tolerance. The present study also found that ethanol tolerance is
related to lower membrane fluidity, a finding different to that of some other
previous studies. Therefore, full elucidation of plasma membrane phospholipid
and fatty acid composition is required to fully understand the relationships
between plasma membrane composition, membrane fluidity and yeast tolerance
to various stress factors.
2. Supplementation with potential stress protectants and/or genetic modification
of yeast metabolic pathways to improve accumulation of stress protectants
and the effect on plasma membrane composition and membrane fluidity
Many published studies have used genetic engineering to improve yeast
tolerance to various stress factors. Supplementation with various stress
protectants such as unsaturated fatty acids, inositol, metal ions etc. are also
widely reported to improve tolerance to stress. However, only few of these
studies investigated the effect of the various treatments on membrane fluidity,
although the plasma membrane is the first cellular barrier to various stress
factors. Therefore, investigation of the effect of the various treatments on stress
tolerance and including plasma membrane fluidity measurements are essential to
fully understand yeast tolerance to the various stress factors.
127
In our experiments, we failed to observe any change in ethanol tolerance
following L-proline or inositol supplementation. However, our study did not assess
potential changes in plasma membrane composition due to supplementation.
Therefore, further studies are planned to investigate changes in plasma
membrane composition and fluidity after supplementation and/or genetic
modification. A further aim is to correlate these parameters to ethanol tolerance
data, to further elucidate the stress tolerance mechanisms.
3. Fermentation of high sugar concentration medium
High sugar concentrations are preferred in industrial processes, since more
ethanol can be produced. However, when high sugar concentrations are used,
yeast strains with high survival rate throughout the fermentation are required in
order to get the sugars fully converted. The present study found that K7
maintained high cell viability throughout the fermentation, and therefore this strain
has potential for fermentation of high sugar concentration media. However, when
high sugar concentrations are used, the yeast cells are exposed to high
osmolarity stress. Therefore, further study to investigate the osmotolerance of K7
is required.
4. Investigation of viability after exposure to high ethanol concentrations
An interesting observation made during the present study was that when
cells of respiro-fermentative phase were exposed to high ethanol concentrations,
methylene violet staining indicated that not all cells were dead. However, total
plate counts did not show any colonies, indicating the cells were nonviable or had
lost the ability to divide or grow. Further study is required to investigate whether
the viable cells detected by methylene violet staining may maintain their viability
and are still able to ferment sugars. If the cells can still ferment sugar, but cannot
grow, there might be potential for increasing ethanol productivity, since the sugar
will not be taken up by the yeast cells and used for growth.

128
129
REFERENCES Alexandre, H, Berlot, JP & Charpentier, C 1994, 'Effect of ethanol on membrane fluidity of proptoplast from Saccharomyces cereviseae and Kloeckera apiculata grown with or without ethanol, measured by fluorescence anisotropy ', Biotechnology Techniques, vol. 8, no. 5, pp. 295-300. Alexandre, H, Rousseaux, I & Charpentier, C 1994, 'Relationship between ethanol tolerance, lipid composition and plasma membrane fluidity in Saccharomyces cerevisiae and Kloeckera apiculata', FEMS Microbiology Letters, vol. 124, pp. 17-22. Andreasson, C, Neve, EPA & Ljungdahl, PO 2004, 'Four permeases import proline and the toxic proline analogue azetidine-2-carboxylate into yeast', Yeast, vol. 21, pp. 193-9. Andrietta, SR, Steckelberg, C & Andrietta, MdGS 2008, 'Study of flocculent yeast performance in tower reactors for bioethanol production in a continuous fermentation process with no cell recycling', Bioresource Technology, vol. 99, no. 8, pp. 3002-8. Baer, SH, Bryant, DL & Blaschek, HP 1989, 'Electron spin resonance analysis of the effect of butanol on the membrane fluidity of intact cells of Clostridium acetobutylicum', Applied and Environmental Microbiology, vol. 55, no. 10, pp. 2729-31. Bafrncová, P, Šmogrovičová, D, Sláviková, I, Pátková, J & Dömény, Z 1999, 'Improvement of very high gravity ethanol fermentation by media supplementation using Saccharomyces cerevisiae', Biotechnology Letters, vol. 21, no. 4, pp. 337-41. Bai, FW, Anderson, WA & Moo-Young, M 2008, 'Ethanol fermentation technologies from sugar and starch feedstocks', Biotechnology Advances, vol. 26, pp. 89–105. Beltran, G 2005, 'Effect of low temperature fermentation and nitrogen content on wine yeast metabolism', Universitat Rovira i Virgili. Birch, RM & Walker, GM 2000, 'Influence of magnesium ions on heat shock and ethanol stress responses of Saccharomyces cerevisiae', Enzyme and Microbial Technology, vol. 26, pp. 678-87. Butcher, BA 2008, 'Yeast adaptation mechanisms', University of Southern Queensland. Canetta, E, Adya, AK & Walker, GM 2006, 'Atomic force microscopic study of the effects of ethanol on yeast cell surface morphology', FEMS Microbiology Letters, vol. 255, pp. 308-15. Carman, GM 2005, 'Regulation of phospholipid synthesis in yeast by zinc', Biochemical Society Transactions, vol. 33, no. 5, pp. 1150-3.
130
Carman, GM & Han, G-S 2011, 'Regulation of phospholipid synthesis in the yeast Saccharomyces cerevisiae', Annual Review of Biochemistry, vol. 80, pp. 2.1-2.25. Carratu, L, Franceschelli, S, Pardini, CL, Kobayashi, GS, Horvath, I, Vigh, L & Maresca, B 1996, 'Membrane lipid perturbation modifies the set point of the temperature of heat shock response in yeast', Proceedings of the National Academy of Sciences of the United States of America, vol. 93, no. 9, pp. 3870-5. Caylak, B & Sukan, FV 1998, 'Comparison of different production processes for bioethanol', Turkish Journal of Chemistry, vol. 22, no. 4, pp. 351-9. Cazetta, ML, Celligoi, MAPC, Buzato, JB & Scarmino, IS 2007, 'Fermentation of molasses by Zymomonas mobilis: Effects of temperature and sugar concentration on ethanol production', Bioresource Technology, vol. 98, pp. 2824–8. Chen, C & Dickman, MB 2005, 'Proline suppresses apoptosis in the fungal pathogen Colletotrichum trifolii', Proceedings of the National Academy of Sciences of the United States of America, vol. 102, no. 9, pp. 3459-64. Chen, C, Wanduragala, S, Becker, DF & Dickman, MB 2006, 'Tomato QM-like protein protects Saccharomyces cerevisiae cells against oxidative stress by regulating intracellular proline levels', Applied and Environmental Microbiology, vol. 72, no. 6, pp. 4001-6. Chi, Z & Arneborg, N 2000, 'Saccharomyces cerevisiae strains with different degrees of ethanol tolerance exhibit different adaptive responses to produced ethanol', Journal of Industrial Microbiology and Biotechnology, vol. 24, no. 1, pp. 75-8. Chi, Z, Kohlwein, S & Paltauf, F 1999, 'Role of phosphatidylinositol (PI) in ethanol production and ethanol tolerance by a high ethanol producing yeast', Journal of Industrial Microbiology & Biotechnology, vol. 22, pp. 58-63. Christie, WW 2010, The lipid library: lipid chemistry, biology, technology & analysis, American Oil Chemist Society, viewed January, 2nd 2011, <http://lipidlibrary.aocs.org/index.html>. Croney, JC, Jameson, DM & Learmonth, RP 2001, 'Fluorescence spectroscopy in biochemistry: teaching basic principles with visual demonstrations', Biochemistry and Molecular Biology Education, vol. 29, no. 2, pp. 60-5. Daum, G, Lees, ND, Bard, M & Dickson, R 1998, 'Biochemistry, cell biology and molecular biology of lipids of Saccharomyces cerevisiae', Yeast, vol. 14, pp. 1471-510. Dien, BS, Cotta, MA & Jeffries, TW 2003, 'Bacteria engineered for fuel ethanol production: current status', Applied Microbiology and Biotechnology, vol. 63, no. 3, pp. 258-66.
131
Dinh, TN, Nagahisa, K, Hirasawa, T, Furusawa, C & Shimizu, H 2008, 'Adaptation of Saccharomyces cerevisiae cells to high ethanol concentration and changes in fatty acid composition of membrane and cell size', PLoS ONE, vol. 3, no. 7, p. e2623. Dubois, M, Gilles, KA, Hamilton, JK, Rebers, PA & Smith, F 1956, 'Colorimetric method for determination of sugars and related substances', Analytical Chemistry, vol. 26, no. 3, pp. 350-6. Elliot, WH & Elliot, DC 1997, Biochemistry and molecular biology, Oxford University Press, New York. Furukawa, K, Kitano, H, Mizoguchi, H & Hara, S 2004, 'Effect of cellular inositol content on ethanol tolerance of Saccharomyces cerevisiae in sake brewing', Journal of Bioscience and Bioengineering, vol. 98, no. 2, pp. 107-13. Gaspar, ML, Aregullin, MA, Jesch, SA & Henry, SA 2006, 'Inositol induces a profound alteration in the pattern and rate of synthesis and turnover of membrane lipids in Saccharomyces cerevisiae', Journal of Biological Chemistry, vol. 281, no. 32, pp. 22773-85. Graham, JE & Wilkinson, BJ 1992, 'Staphylococcus aureus osmoregulation: Roles for choline, glycine betaine, proline, and taurine', Journal of Bacteriology, vol. 174, no. 8, pp. 2711-6. Gutiérrez, T, Learmonth, RP, Nichols, PD & Couperwhite, I 2003, 'Comparative benzene-induced fatty acid changes in a Rhodococcus species and its benzene-sensitive mutant: the possible role of myristic and oleic acids in tolerance', Journal of Chemical Ecology, vol. 29, no. 10, pp. 2369-78. Hanson, BA & Lester, RL 1980, 'Effects of inositol starvation on phospholipid and glycan syntheses in Saccharomyces cerevisiae', Journal of Bacteriology, vol. 142, no. 1, pp. 79-89. Hirasawa, R, Yokoigawa, K, Isobe, Y & Kawai, H 2001, 'Improving the freeze tolerance of baker yeast by loading with trehalose', Bioscience, Biotechnology and Biochemistry, vol. 65, no. 3, pp. 522-6. Horak, J & Kotyk, A 1986, 'Energetics of L-proline uptake by Saccharomyces cerevisiae ', Biochimica et Biophysica Acta, vol. 857, pp. 173-9. Hottiger, T, De Virgilio, C, Hall, MN, Boller, T & Andres, W 1994, 'The role of trehalose synthesis for the acquisition of thermotolerance in yeast II. Physiological concentrations of trehalose increase the thermal stability of proteins in vitro ', European Journal of Biochemistry, vol. 219, pp. 187-93. Inaba, M, Suzuki, I, Szalontai, Bz, Kanesaki, Y, Los, DA, Hayashi, H & Murata, N 2003, 'Gene-engineered rigidification of membrane lipids enhances the cold inducibility of gene expression in synechocystis', Journal of Biological Chemistry, vol. 278, no. 14, pp. 12191-8.
132
Ingledew, WM, Magnus, CA & Solsuski, FW 1987, 'Influence of oxygen on proline utilization during the wine fermentation', American Journal of Enology and Viticulture, vol. 38, no. 3, pp. 246-8. Ingram, LO 1986, 'Microbial tolerance to alcohols: role of the cell membrane', Trends in Biotechnology, vol. 4, no. 2, pp. 40-4. Ji, R, Yuan, X-Z, Zeng, G-M & Liu, J 2008, 'Effect of inositol addition and sodium chloride on cell viability, ethanol production, and ethanol tolerance of Pachysolen tannophilus', Journal of Agro-Environment Science, vol. 27, no. 5, pp. 2080-5. Johnston, M 1999, 'Feasting, fasting and fermenting: glucose sensing in yeast and other cells', Trends in Genetics, vol. 15, no. 1, pp. 29-33. Kajiwara, S, Suga, K, Sone, H & Nakamura, K 2000, 'Improved ethanol tolerance of Saccharomyces cerevisiae strains by increases in fatty acid unsaturation via metabolic engineering', Biotechnology Letters, vol. 22, pp. 1839-43. Kajiwara, S, Shirai, A, Fujii, T, Toguri, T, Nakamura, K & Ohtaguchi, K 1996, 'Polyunsaturated fatty acid biosynthesis in Saccharomyces cerevisiae: expression of ethanol tolerance and the FAD2 gene from Arabidopsis thaliana', Applied and Environmental Microbiology, vol. 62, no. 12, pp. 4309-13. Kandušer, M, Šentjurc, M & Miklavčič, D 2006, 'Cell membrane fluidity related to electroporation and resealing', European Biophysics Journal, vol. 35, no. 3, pp. 196-204. Kelley, MJ, Bailis, AM, Henry, SA & Carman, GM 1988, 'Regulation of phospholipid biosynthesis in Saccharomyces cerevisiae by inositol ', Journal of Biological Chemistry, vol. 263, no. 34, pp. 18078-85. Krause, EL, Villa-Garca, MJ, Henry, SA & Walker, LP 2007, 'Determining the effects of inositol supplementation and the opi1 mutation on ethanol tolerance of Saccharomyces cerevisiae', Industrial Biotechnology, vol. 3, no. 3, pp. 260-8. Lasko, PF & Brandriss, MC 1981, 'Proline transport in Saccharomyces cerevisiae', Journal of Bacteriology, vol. 148, no. 1, pp. 241-7. Leão, C & Van Uden, N 1984, 'Effects of ethanol and other alkanols on passive proton influx in the yeast Saccharomyces cerevisiae ', Biochimica et Biophysica Acta, vol. 774, no. 1, pp. 43-8. Learmonth, RP 2011, 'Membrane fluidity in yeast adaptation – insights from fluorescence spectroscopy and microscopy', in CD Geddes (ed.), Reviews in Fluorescence 2009, Springer. Learmonth, RP & Gratton, E 2002, 'Assessment of membrane fluidity in individual yeast cells by Laurdan Generalised Polarisation and multi-photon scanning fluorescence microscopy', in R Kraayenhof, AJWG Visser & HC Gerritsen (eds), Fluorescence spectroscopy, imaging and probes: new tools in chemical, physical and life sciences, Springer-Verlag, Heidelberg, Germany, pp. 241-52.
133
Learmonth, RP, Kable, SH & Ghiggino, KP 2009, 'Basics of fluorescence', in EM Goldys (ed.), Fluorescence Application in Biotechnology and Life Sciences, John Wiley & Sons, New Jersey. Lee, JRE, Damodaran, K, Yi, S-X & Lorigan, GA 2006, 'Rapid cold-hardening increases membrane fluidity and cold tolerance of insect cells', Cryobiology, vol. 52, no. 3, pp. 459-63. Leheny, EA & Theg, SM 1994, 'Apparent inhibition of chloroplast protein import by cold temperatures is due to energetic considerations not membrane fluidity', Plant Cell, vol. 6, no. 3, pp. 427-37. Lei, J, Zhao, X, Ge, X & Bai, F 2007, 'Ethanol tolerance and the variation of plasma membrane composition of yeast floc populations with different size distribution', Journal of Biotechnology, vol. 131, pp. 270-5. Lewis, JG 1993, 'Physiological aspects of stress tolerance in baking strains of Saccharomyces cerevisiae ', University of New England. Lewis, JG, Learmonth, RP & Watson, K 1993, 'The role of growth phase and ethanol in freeze-thaw stress resistance of Saccharomyces cerevisiae', Applied and Environmental Microbiology, vol. 59, pp. 1065-71. Lewis, JG, Learmonth, R, Attfield, P & Watson, K 1997, 'Stress co-tolerance and trehalose content in baking strains of Saccharomyces cerevisiae', Journal of Industrial Microbiology & Biotechnology, vol. 18, pp. 30–6. Lewis, JG, Northcott, CJ, Learmonth, RP, Attfield, PV & Watson, K 1993, 'The need for consistent nomenclature and assessment of growth phases in diauxic cultures of Saccharomyces cerevisiae', Journal of General Microbiology, vol. 139, no. 4, pp. 835-9. Los, DA & Murata, N 2004, 'Membrane fluidity and its roles in the perception of environmental signals', Biochimica et Biophysica Acta (BBA) - Biomembranes, vol. 1666, no. 1-2, pp. 142-57. McKee, T & McKee, JR 2003, Biochemistry: the molecular basis of life, 3rd edn, McGraw-Hill, New York. Mizoguchi, H & Hara, S 1998, 'Permeability barrier of the yeast plasma membrane induced by ethanol', Journal of Bioscience and Bioengineering, vol. 85, pp. 25-9. Morita, Y, Nakamori, S & Takagi, H 2003, 'L-Proline accumulation and freeze tolerance in Saccharomyces cerevisiae are caused by a mutation in the PRO1 gene encoding g-glutamyl kinase', Applied and Environmental Microbiology, vol. 69, no. 1, pp. 212-9. Nagodawithana, TW & Steinkraus, KH 1976, 'Influence of the rate of ethanol production and accumulation on the viability of Saccharomyces cerevisiae in "rapid fermentation" ', Applied and Environmental Microbiology, vol. 31, no. 2, pp. 158-62.
134
Najjar, MB, Chikindas, M & Montville, TJ 2007, 'Changes in Listeria monocytogenes membrane fluidity in response to temperature stress', Applied and Environmental Microbiology, vol. 73, no. 20, pp. 6429-35. Nelson, DL & Cox, MM 2008, Lehninger's principles of biochemistry, 5th edn, W.H. Freeman and Company, New York. Nipper, ME 2007, 'Characterization of membrane viscosity changes with the novel molecular rotor FCVJ', University of Missouri. Parasassi, T, Conti, F & Gratton, E 1986, 'Time-resolved fluorescence spectra of laurdan in phospholipid vesicles by multifrequency phase and modulation fluorometry.' Cellular and Molecular Biology, vol. 32, pp. 103-8. Parasassi, T, De Stasio, G, d'Ubaldo, A & Gratton, E 1990, 'Phase fluctuation in phospholipid membranes revealed by Laurdan fluorescence', Biophysical Journal, vol. 57, pp. 1179-86. Parasassi, T, Krasnowska, EK, Bagatolli, L & Gratton, E 1998, 'Laurdan and prodan as polarity-sensitive fluorescent membrane probes', Journal of Fluorescence, vol. 8, no. 4, pp. 365-73. Patton, JL & Lester, RL 1991, 'The phosphoinositol sphingolipids of Saccharomyces cerevisiae are highly localized in the plasma membrane', Journal of Bacteriology, vol. 173, no. 10, pp. 3101-31-8. Pierce, GE, Litchfield, JH & Lipinsky, ES 1981, 'Evaluation of the feasibility of sequential fermentation of sugars for production of ethanol', Developments in Industrial Microbiology, vol. 22, pp. 703-10. Piper, PW 1995, 'The heat shock and ethanol stress responses of yeast exhibit extensive similarity and functional overlap', FEMS Microbiology Letters, vol. 134, pp. 121-7. Piskur, J, Rozpedowska, E, Polakova, S, Merico, A & Compagno, C 2006, 'How did Saccharomyces evolve to become a good brewer?' Trends in Genetics, vol. 22, no. 4, pp. 183-6. Pronk, JT, Steensma, HY & van Dijken, JP 1996, 'Pyruvate metabolism in Saccharomyces cerevisiae ', Yeast, vol. 12, pp. 1607-33. Reddy, LVA & Reddy, OVS 2006, 'Rapid and enhanced production of ethanol in very high gravity (VHG) sugar fermentation by Saccharomyces cerevisiae: Role of finger millet (Eleusine coracana L.) flour', Process Biochemistry, vol. 41, no. 3, pp. 726-9. Redón, M, Guillamón, JM, Mas, A & Rozès, N 2009, 'Effect of lipid supplementation upon Saccharomyces cerevisiae lipid composition and fermentation performance at low temperature', European Food Research and Technology, vol. 228, pp. 833-40.
135
Rodrıguez-Vargas, S, Sanchez-Garcıa, A, Martınez-Rivas, JM, Prieto, JA & Randez-Gil, F 2007, 'Fluidization of membrane lipids enhances the tolerance of Saccharomyces cerevisiae to freezing and salt stress', Applied and Environmental Microbiology, vol. 73, no. 1, pp. 110-6. Rosa, MF & Sa Correira, I 1992, 'Ethanol tolerance and activity of plasma membrane ATPase in Kluyveromyces marxianus and Saccharomyces cerevisiae', Enzyme and Microbial Technology, vol. 14, no. 1, pp. 23-7. Rudolph, AS & Crowe, JH 1985, 'Membrane stabilization during freezing: The role of two natural cryoprotectants, trehalose and proline', Cryobiology, vol. 22, no. 4, pp. 367-77. Rudolph, AS, Crowe, JH & Crowe, LM 1986, 'Effects of three stabilizing agents--proline, betaine, and trehalose--on membrane phospholipids', Archives of Biochemistry and Biophysics, vol. 245, no. 1, pp. 134-43. Schneiter, R, Brügger, B, Sandhoff, R, Zellnig, G, Leber, A, Lampl, M, Athenstaedt, K, Hrastnik, C, Eder, S, Daum, G, Paltauf, F, Wieland, FT & Kohlwein, SD 1999, 'Electrospray ionization tandem mass spectrometry (ESI-MS/MS) analysis of the lipid molecular species composition of yeast subcellular membranes reveals acyl chain-based sorting/remodeling of distinct molecular species en route to the plasma membrane', The Journal of Cell Biology, vol. 146, no. 4, pp. 741-54. Sekine, T, Kawaguchi, A, Hamano, Y & Takagi, H 2007, 'Desensitization of feedback inhibition of the Saccharomyces cerevisiae g-glutamyl kinase enhances proline accumulation and freezing tolerance', Applied and Environmental Microbiology, vol. 73, no. 12, pp. 4011-9. Siderius, M & Mager, WH 2003, 'Conditional response to stress in yeast', Monatshefte für Chemie, vol. 134, pp. 1433-44. Smart, KA, Chambers, KM, Lambert, I, Jenkins, C & Smart, CA 1999, 'Use of methylene violet staining procedures to determine yeast viability and vitality', Journal of the American Society of Brewing Chemists, vol. 57, no. 1, pp. 18-23. Steels, EL, Learmonth, RP & Watson, K 1994, 'Stress tolerance and membrane lipid unsaturation in Saccharomyces cerevisiae grown aerobically or anaerobically', Microbiology, vol. 140, pp. 569-76. Swan, TM & Watson, K 1998, 'Stress tolerance in a yeast sterol auxotroph: role of ergosterol, heat shock proteins and trehalose', FEMS Microbiology Letters, vol. 169 pp. 191-7. ---- 1999, 'Stress tolerance in a yeast lipid mutant: membrane lipids influence tolerance to heat and ethanol independently of heat shock proteins and trehalose', Canadian Journal of Microbiology, vol. 45, no. 6, pp. 472–9 Takagi, H 2008, 'Proline as a stress protectant in yeast: physiological functions, metabolic regulations, and biotechnological applications', Applied Microbiology and Biotechnology, vol. 81, pp. 211-23.
136
Takagi, H, Sakai, K, Morida, K & Nakamori, S 2000, 'Proline accumulation by mutation or disruption of the proline oxidase gene improves resistance to freezing and desiccation stresses in Saccharomyces cerevisiae', FEMS Microbiology Letters, vol. 184, pp. 103-8. Takagi, H, Takaoka, M, Kawaguchi, A & Kubo, Y 2005, 'Effect of L-proline on sake brewing and ethanol stress in Saccharomyces cerevisiae', Applied and Environmental Microbiology, vol. 71, no. 12, pp. 8656-62. Taylor, M, Tuffin, M, Burton, S, Eley, K & Cowan, D 2008, 'Microbial responses to solvent and alcohol stress', Biotechnology Journal, vol. 3, pp. 1388-97. Terao, Y, Nakamori, S & Takagi, H 2003, 'Gene dosage effect of L-proline biosynthetic enzymes on L-proline accumulation and freeze tolerance in Saccharomyces cerevisiae', Applied and Environmental Microbiology, vol. 69, no. 11, pp. 6527-32. Thomas, KC & Ingledew, WM 1990, 'Fuel alcohol production: effects of free amino nitrogen on fermentation of very-high-gravity wheat mashes', Applied and Environmental Microbiology, vol. 56, no. 7, pp. 2046-50. Thomas, KC, Hynes, SH & Ingledew, WM 1994, 'Effects of particulate materials and osmoprotectants on very-high-gravity ethanolic fermentation by Saccharomyces cerevisiae', Applied and Environmental Microbiology, vol. 60, no. 5, pp. 1519-24. Thomas, KC, Hynes, SH, Jones, AM & Ingledew, WM 1993, 'Production of fuel alcohol from wheat by VHG technology', Applied Biochemistry and Biotechnology, vol. 43, pp. 211-26. Thomsen, AB, Medina, C & Ahring, BK 2003, Biotechnology in ethanol production, Risø National Laboratory, Copenhagen. Turk, M, Méjanelle, L, Šentjurc, M, Grimalt, J, Gunde-Cimerman, N & Plemenitaš, A 2004, 'Salt-induced changes in lipid composition and membrane fluidity of halophilic yeast-like melanized fungi', Extremophiles, vol. 8, no. 1, pp. 53-61. Ulaszewski, S, Woodward, JR & Cirillo, VP 1978, 'Membrane damage associated with inositol-less death in Saccharomyces cerevisiae', Journal of Bacteriology, vol. 136, no. 1, pp. 49-54. van der Rest, ME, Kamminga, AH, Nakano, A, Ankaru, Y, Poolman, B & Konings, WN 1995, 'The pasma membrane of Saccharomyces cerevisiae: structure, function, and biogenesis', Microbiological Reviews, vol. 59, no. 2, pp. 304-22. Verbuggen, N & Hermans, C 2008, 'Proline accumulation in plants: a review', Amino Acid, vol. 35, pp. 753-9. Verstrepen, KJ, Iserentant, D, Malcorps, P, Derdelinckx, G, Van Dijck, P, Winderickx, J, Pretorius, IS, Thevelein, JM & Delvaux, FR 2004, 'Glucose and sucrose: hazardous fast-food for industrial yeast?' Trends in Biotechnology, vol. 22, no. 10, pp. 531-7.
137
Walker, GM 2004, 'Metals in yeast fermentation processes', in AI Laskin, JW Bennett & GM Gadd (eds), Advances in Applied Microbiology, Academic Press, vol. 54, pp. 197-229. Walker, GM, De Nicola, R, Anthony, S & Learmonth, RP 2006, 'Yeast-metal interactions: impact on brewing fermentations', paper presented to Proceedings of the Institute of Brewing & Distilling Asia Pacific Section. Wang, F-Q, Gao, C-J, Yang, C-Y & Xu, P 2007, 'Optimization of an ethanol production medium in very high gravity fermentation', Biotechnology Letters, vol. 29, pp. 233-6. Wiemken, A 1990, 'Trehalose in yeast, stress protectant rather than reserve carbohydrate', Antonie van Leeuwenhoek, vol. 58, no. 3, pp. 209-17. Xue, C, Zhao, X-Q, Yuan, W-J & Bai, F-W 2008, 'Improving ethanol tolerance of a self-flocculating yeast by optimization of medium composition', World Journal of Microbiology and Biotechnology, vol. 24, pp. 2257-61. Yamada, M, Morishita, H, Urano, K, Shiozaki, N, Yamaguchi-Shinozaki, K, Shinozaki, K & Yoshiba, Y 2005, 'Effects of free proline accumulation in petunias under drought stress', Journal of Experimental Botany, vol. 56, no. 417, pp. 1975-81. You, KM, Rosenfield, C-L & Knipple, DC 2003, 'Ethanol tolerance in the yeast Saccharomyces cerevisiae is dependent on cellular oleic acid content', Applied and Environmental Microbiology, vol. 69, no. 3, pp. 1499-503. Yu, W, So, PT, French, T & Gratton, E 1996, 'Fluorescence generalized polarization of cell membranes: a two-photon scanning microscopy approach', Biophysical Journal, vol. 70, no. 2, pp. 626-36. Zinser, E, Paltauf, F & Daum, G 1993, 'Sterol composition of yeast organelle membranes and subcellular distribution of enzymes involved in sterol metabolism', Journal of Bacteriology, vol. 175, no. 10, pp. 2853-8.

138
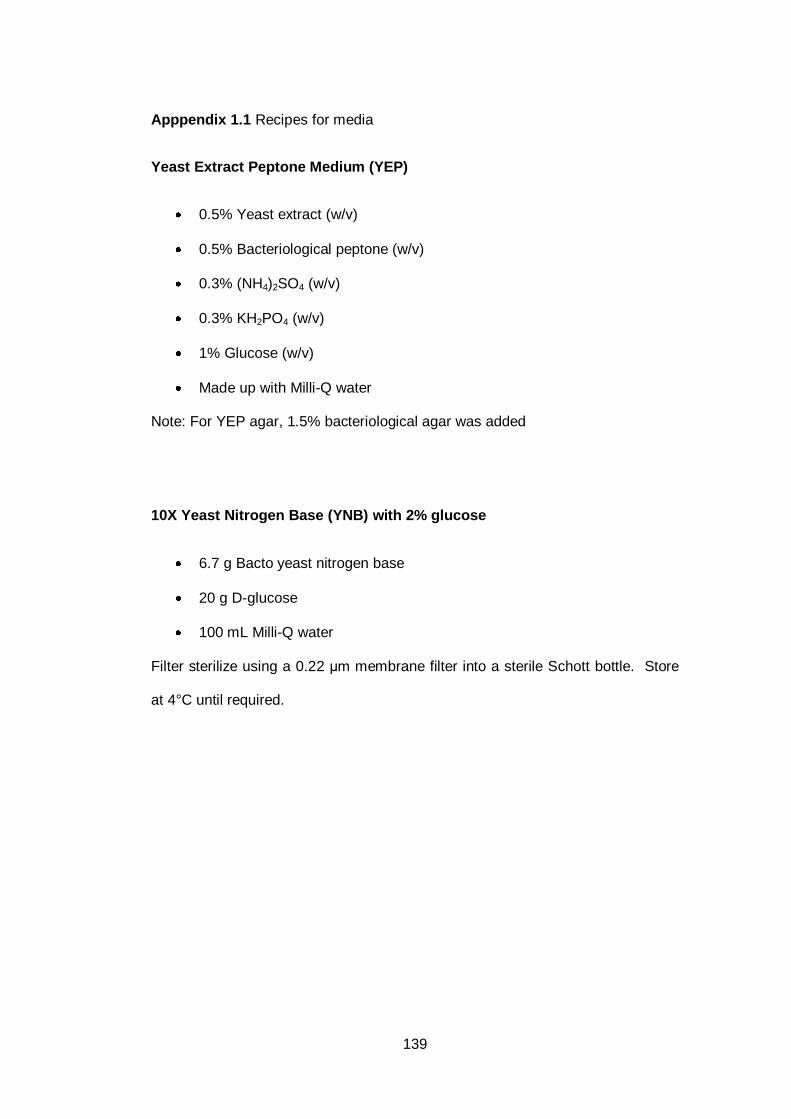
139
Apppendix 1.1 Recipes for media
Yeast Extract Peptone Medium (YEP)
0.5% Yeast extract (w/v)
0.5% Bacteriological peptone (w/v)
0.3% (NH4)2SO4 (w/v)
0.3% KH2PO4 (w/v)
1% Glucose (w/v)
Made up with Milli-Q water
Note: For YEP agar, 1.5% bacteriological agar was added
10X Yeast Nitrogen Base (YNB) with 2% glucose
6.7 g Bacto yeast nitrogen base
20 g D-glucose
100 mL Milli-Q water
Filter sterilize using a 0.22 μm membrane filter into a sterile Schott bottle. Store
at 4°C until required.
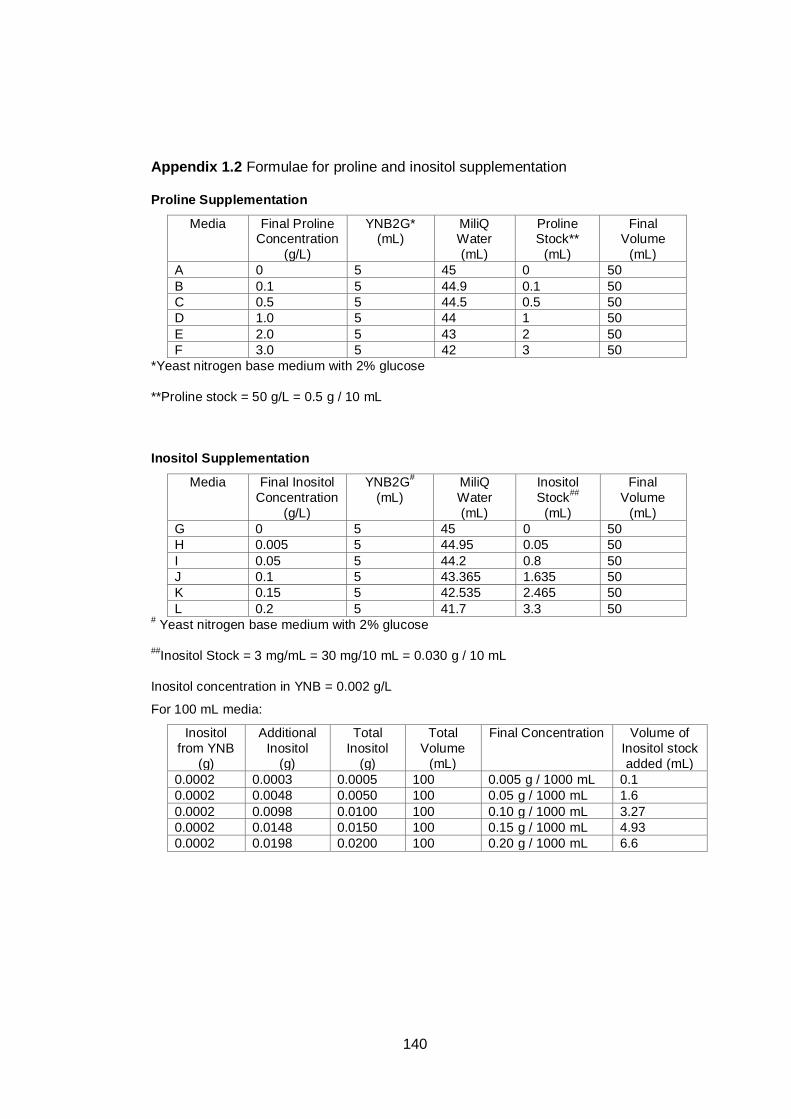
140
Appendix 1.2 Formulae for proline and inositol supplementation Proline Supplementation
Media Final Proline Concentration
(g/L)
YNB2G* (mL)
MiliQ Water
(mL)
Proline Stock**
(mL)
Final Volume
(mL)
A 0 5 45 0 50
B 0.1 5 44.9 0.1 50
C 0.5 5 44.5 0.5 50
D 1.0 5 44 1 50
E 2.0 5 43 2 50
F 3.0 5 42 3 50
*Yeast nitrogen base medium with 2% glucose
**Proline stock = 50 g/L = 0.5 g / 10 mL
Inositol Supplementation
Media Final Inositol
Concentration
(g/L)
YNB2G#
(mL)
MiliQ
Water
(mL)
Inositol
Stock##
(mL)
Final
Volume
(mL)
G 0 5 45 0 50
H 0.005 5 44.95 0.05 50
I 0.05 5 44.2 0.8 50
J 0.1 5 43.365 1.635 50
K 0.15 5 42.535 2.465 50
L 0.2 5 41.7 3.3 50 # Yeast nitrogen base medium with 2% glucose
##Inositol Stock = 3 mg/mL = 30 mg/10 mL = 0.030 g / 10 mL
Inositol concentration in YNB = 0.002 g/L
For 100 mL media:
Inositol
from YNB
(g)
Additional
Inositol
(g)
Total
Inositol
(g)
Total
Volume
(mL)
Final Concentration Volume of
Inositol stock
added (mL)
0.0002 0.0003 0.0005 100 0.005 g / 1000 mL 0.1
0.0002 0.0048 0.0050 100 0.05 g / 1000 mL 1.6
0.0002 0.0098 0.0100 100 0.10 g / 1000 mL 3.27
0.0002 0.0148 0.0150 100 0.15 g / 1000 mL 4.93
0.0002 0.0198 0.0200 100 0.20 g / 1000 mL 6.6
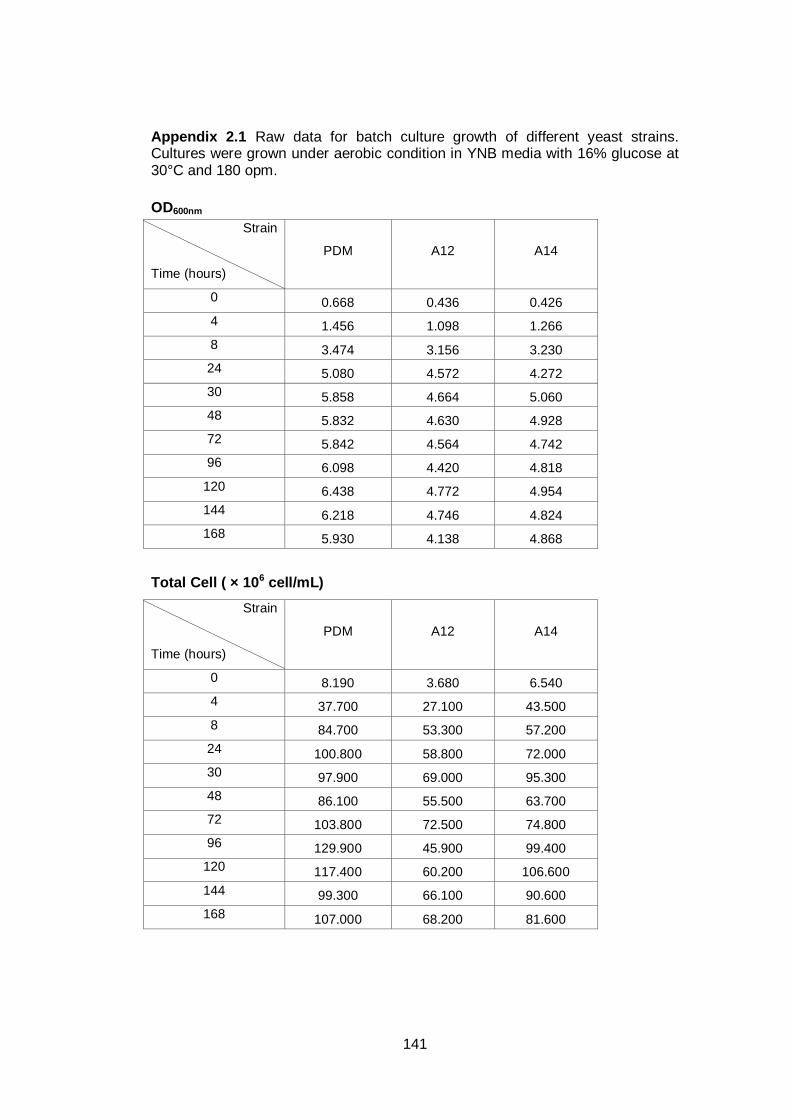
141
Appendix 2.1 Raw data for batch culture growth of different yeast strains. Cultures were grown under aerobic condition in YNB media with 16% glucose at 30°C and 180 opm.
OD600nm
Strain
Time (hours)
PDM A12 A14
0 0.668 0.436 0.426
4 1.456 1.098 1.266
8 3.474 3.156 3.230
24 5.080 4.572 4.272
30 5.858 4.664 5.060
48 5.832 4.630 4.928
72 5.842 4.564 4.742
96 6.098 4.420 4.818
120 6.438 4.772 4.954
144 6.218 4.746 4.824
168 5.930 4.138 4.868
Total Cell ( × 106 cell/mL)
Strain
Time (hours)
PDM A12 A14
0 8.190 3.680 6.540
4 37.700 27.100 43.500
8 84.700 53.300 57.200
24 100.800 58.800 72.000
30 97.900 69.000 95.300
48 86.100 55.500 63.700
72 103.800 72.500 74.800
96 129.900 45.900 99.400
120 117.400 60.200 106.600
144 99.300 66.100 90.600
168 107.000 68.200 81.600
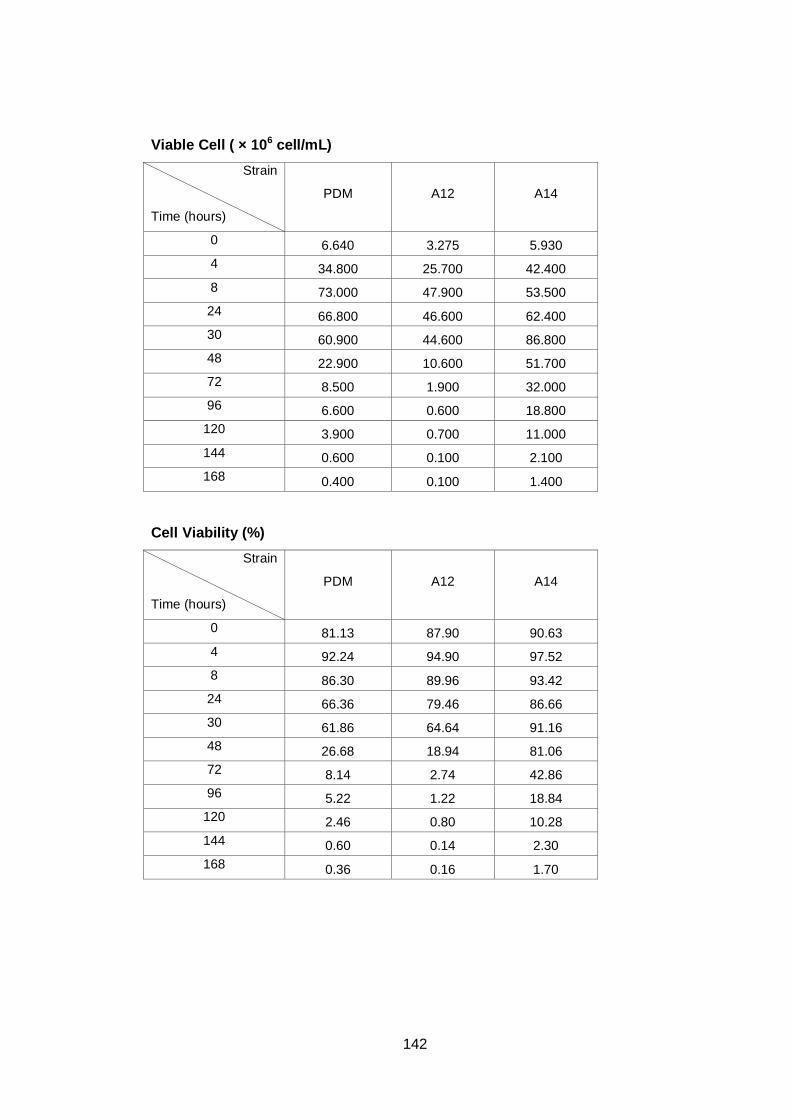
142
Viable Cell ( × 106 cell/mL)
Strain
Time (hours)
PDM A12 A14
0 6.640 3.275 5.930
4 34.800 25.700 42.400
8 73.000 47.900 53.500
24 66.800 46.600 62.400
30 60.900 44.600 86.800
48 22.900 10.600 51.700
72 8.500 1.900 32.000
96 6.600 0.600 18.800
120 3.900 0.700 11.000
144 0.600 0.100 2.100
168 0.400 0.100 1.400
Cell Viability (%)
Strain
Time (hours)
PDM A12 A14
0 81.13 87.90 90.63
4 92.24 94.90 97.52
8 86.30 89.96 93.42
24 66.36 79.46 86.66
30 61.86 64.64 91.16
48 26.68 18.94 81.06
72 8.14 2.74 42.86
96 5.22 1.22 18.84
120 2.46 0.80 10.28
144 0.60 0.14 2.30
168 0.36 0.16 1.70
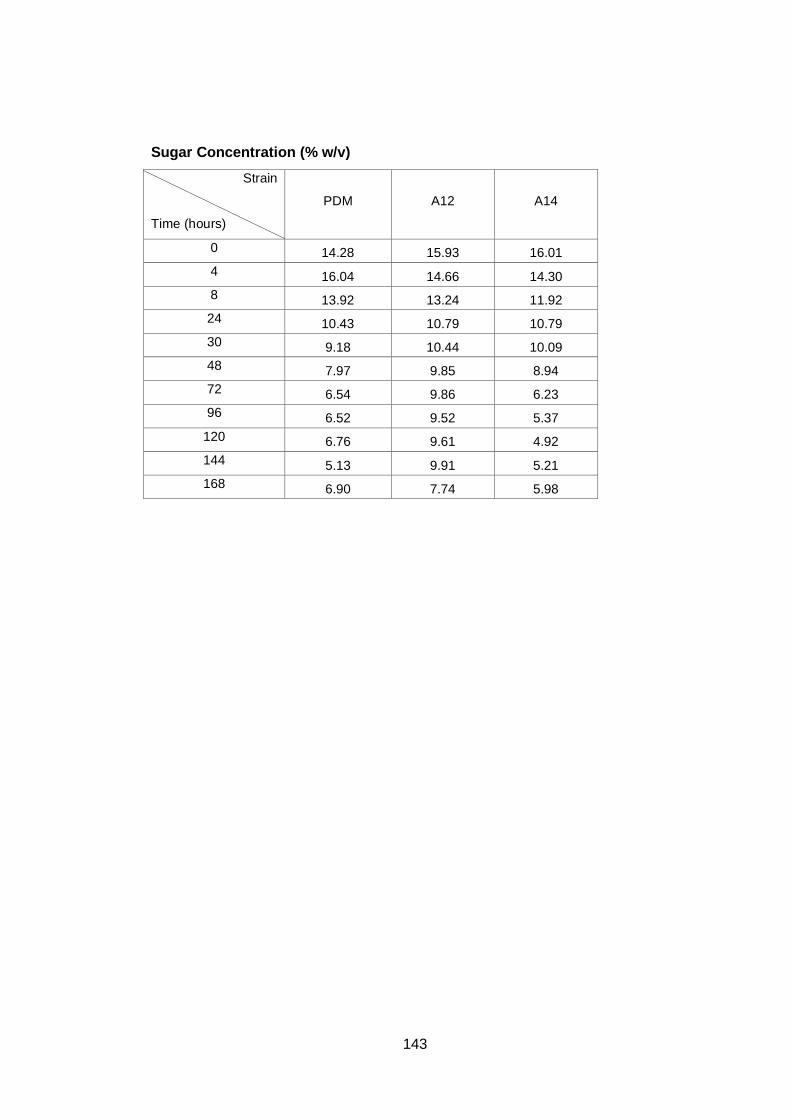
143
Sugar Concentration (% w/v)
Strain
Time (hours)
PDM A12 A14
0 14.28 15.93 16.01
4 16.04 14.66 14.30
8 13.92 13.24 11.92
24 10.43 10.79 10.79
30 9.18 10.44 10.09
48 7.97 9.85 8.94
72 6.54 9.86 6.23
96 6.52 9.52 5.37
120 6.76 9.61 4.92
144 5.13 9.91 5.21
168 6.90 7.74 5.98
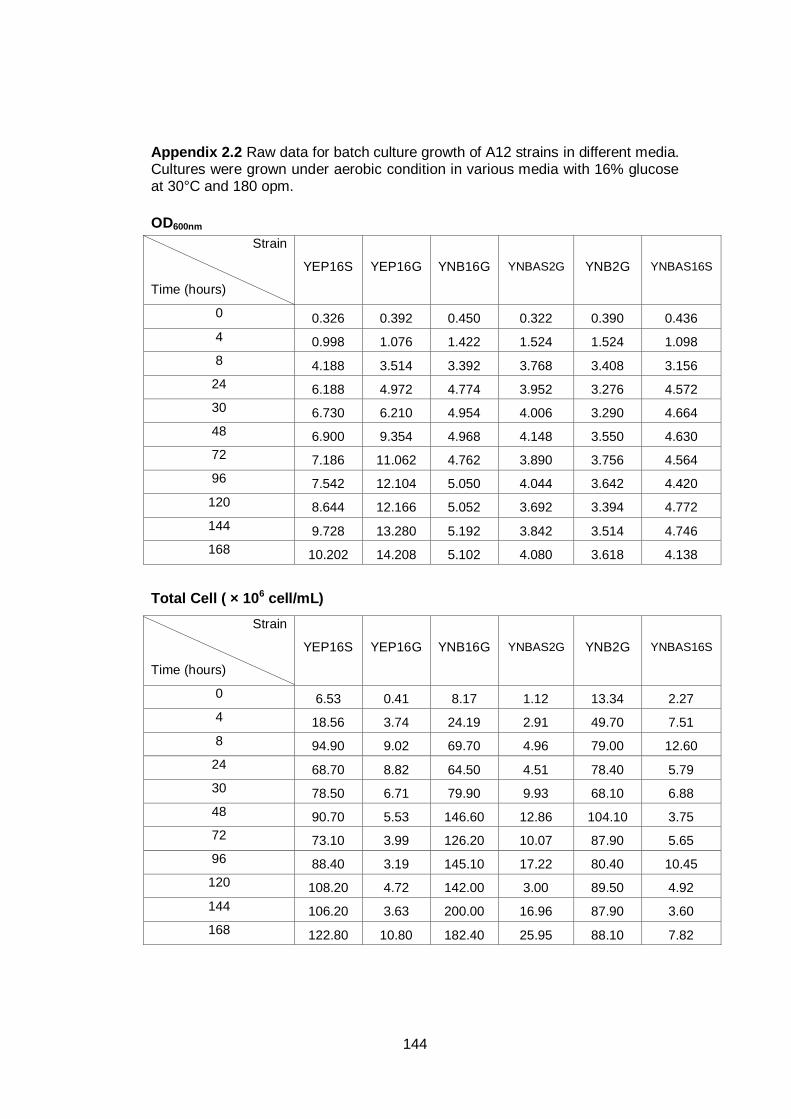
144
Appendix 2.2 Raw data for batch culture growth of A12 strains in different media. Cultures were grown under aerobic condition in various media with 16% glucose at 30°C and 180 opm.
OD600nm
Strain
Time (hours)
YEP16S YEP16G YNB16G YNBAS2G YNB2G YNBAS16S
0 0.326 0.392 0.450 0.322 0.390 0.436
4 0.998 1.076 1.422 1.524 1.524 1.098
8 4.188 3.514 3.392 3.768 3.408 3.156
24 6.188 4.972 4.774 3.952 3.276 4.572
30 6.730 6.210 4.954 4.006 3.290 4.664
48 6.900 9.354 4.968 4.148 3.550 4.630
72 7.186 11.062 4.762 3.890 3.756 4.564
96 7.542 12.104 5.050 4.044 3.642 4.420
120 8.644 12.166 5.052 3.692 3.394 4.772
144 9.728 13.280 5.192 3.842 3.514 4.746
168 10.202 14.208 5.102 4.080 3.618 4.138
Total Cell ( × 106 cell/mL)
Strain
Time (hours)
YEP16S YEP16G YNB16G YNBAS2G YNB2G YNBAS16S
0 6.53 0.41 8.17 1.12 13.34 2.27
4 18.56 3.74 24.19 2.91 49.70 7.51
8 94.90 9.02 69.70 4.96 79.00 12.60
24 68.70 8.82 64.50 4.51 78.40 5.79
30 78.50 6.71 79.90 9.93 68.10 6.88
48 90.70 5.53 146.60 12.86 104.10 3.75
72 73.10 3.99 126.20 10.07 87.90 5.65
96 88.40 3.19 145.10 17.22 80.40 10.45
120 108.20 4.72 142.00 3.00 89.50 4.92
144 106.20 3.63 200.00 16.96 87.90 3.60
168 122.80 10.80 182.40 25.95 88.10 7.82
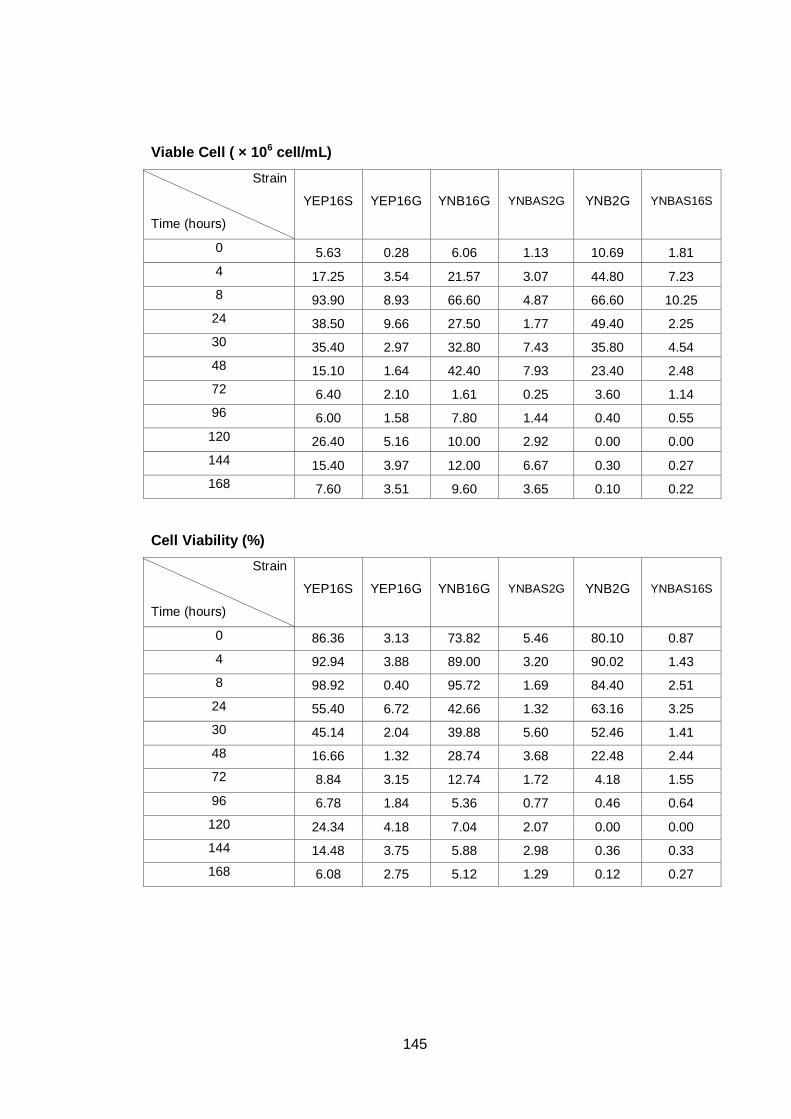
145
Viable Cell ( × 106 cell/mL)
Strain
Time (hours)
YEP16S YEP16G YNB16G YNBAS2G YNB2G YNBAS16S
0 5.63 0.28 6.06 1.13 10.69 1.81
4 17.25 3.54 21.57 3.07 44.80 7.23
8 93.90 8.93 66.60 4.87 66.60 10.25
24 38.50 9.66 27.50 1.77 49.40 2.25
30 35.40 2.97 32.80 7.43 35.80 4.54
48 15.10 1.64 42.40 7.93 23.40 2.48
72 6.40 2.10 1.61 0.25 3.60 1.14
96 6.00 1.58 7.80 1.44 0.40 0.55
120 26.40 5.16 10.00 2.92 0.00 0.00
144 15.40 3.97 12.00 6.67 0.30 0.27
168 7.60 3.51 9.60 3.65 0.10 0.22
Cell Viability (%)
Strain
Time (hours)
YEP16S YEP16G YNB16G YNBAS2G YNB2G YNBAS16S
0 86.36 3.13 73.82 5.46 80.10 0.87
4 92.94 3.88 89.00 3.20 90.02 1.43
8 98.92 0.40 95.72 1.69 84.40 2.51
24 55.40 6.72 42.66 1.32 63.16 3.25
30 45.14 2.04 39.88 5.60 52.46 1.41
48 16.66 1.32 28.74 3.68 22.48 2.44
72 8.84 3.15 12.74 1.72 4.18 1.55
96 6.78 1.84 5.36 0.77 0.46 0.64
120 24.34 4.18 7.04 2.07 0.00 0.00
144 14.48 3.75 5.88 2.98 0.36 0.33
168 6.08 2.75 5.12 1.29 0.12 0.27
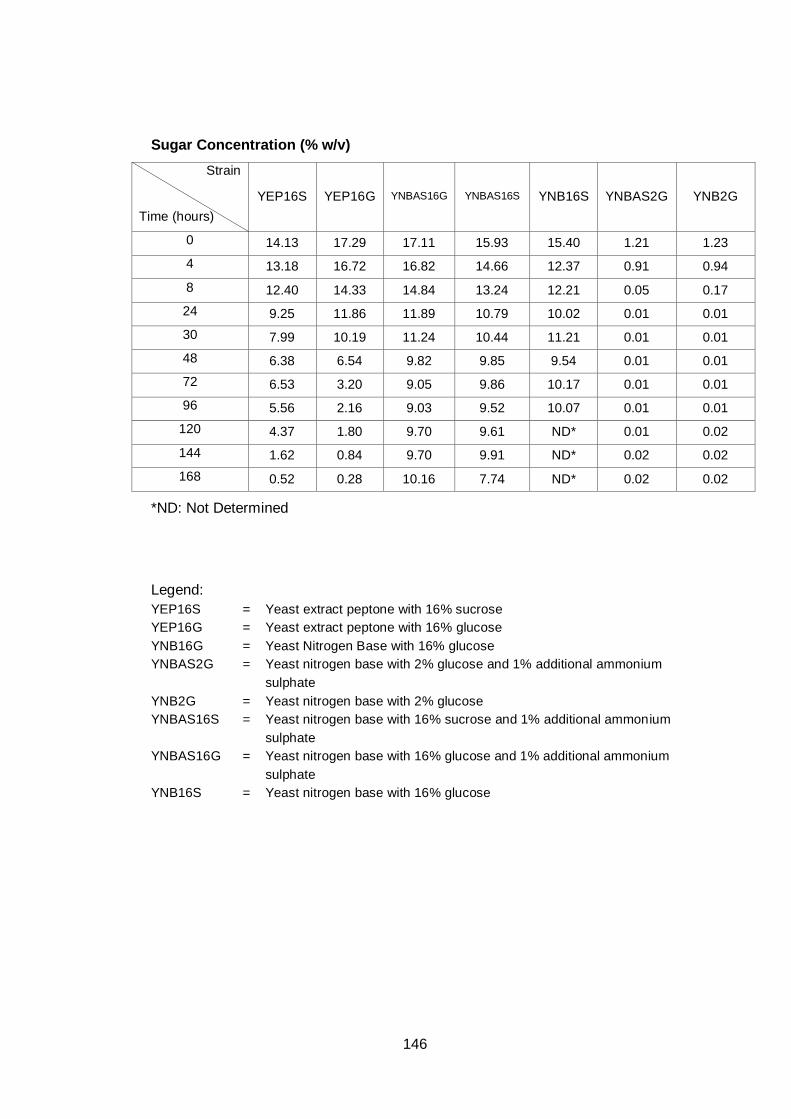
146
Sugar Concentration (% w/v)
Strain
Time (hours)
YEP16S YEP16G YNBAS16G YNBAS16S YNB16S YNBAS2G YNB2G
0 14.13 17.29 17.11 15.93 15.40 1.21 1.23
4 13.18 16.72 16.82 14.66 12.37 0.91 0.94
8 12.40 14.33 14.84 13.24 12.21 0.05 0.17
24 9.25 11.86 11.89 10.79 10.02 0.01 0.01
30 7.99 10.19 11.24 10.44 11.21 0.01 0.01
48 6.38 6.54 9.82 9.85 9.54 0.01 0.01
72 6.53 3.20 9.05 9.86 10.17 0.01 0.01
96 5.56 2.16 9.03 9.52 10.07 0.01 0.01
120 4.37 1.80 9.70 9.61 ND* 0.01 0.02
144 1.62 0.84 9.70 9.91 ND* 0.02 0.02
168 0.52 0.28 10.16 7.74 ND* 0.02 0.02
*ND: Not Determined
Legend:
YEP16S = Yeast extract peptone with 16% sucrose
YEP16G = Yeast extract peptone with 16% glucose
YNB16G = Yeast Nitrogen Base with 16% glucose
YNBAS2G = Yeast nitrogen base with 2% glucose and 1% additional ammonium
sulphate
YNB2G = Yeast nitrogen base with 2% glucose
YNBAS16S = Yeast nitrogen base with 16% sucrose and 1% additional ammonium
sulphate
YNBAS16G = Yeast nitrogen base with 16% glucose and 1% additional ammonium
sulphate
YNB16S = Yeast nitrogen base with 16% glucose
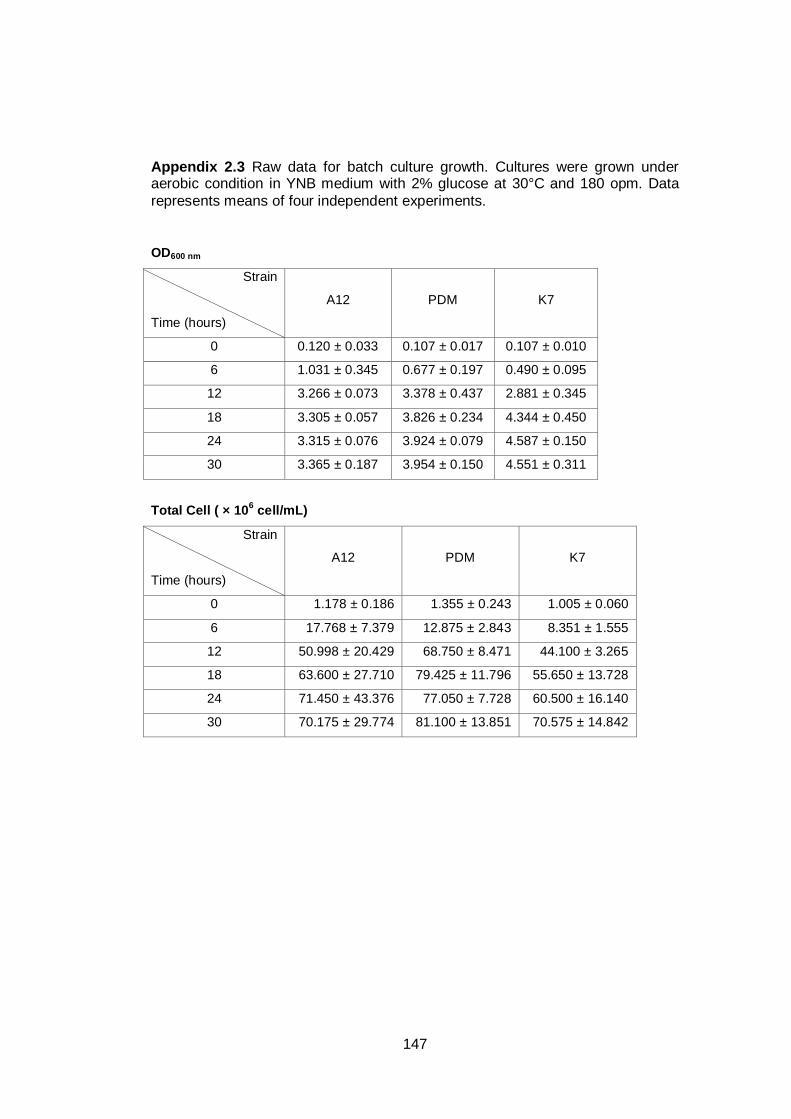
147
Appendix 2.3 Raw data for batch culture growth. Cultures were grown under aerobic condition in YNB medium with 2% glucose at 30°C and 180 opm. Data
represents means of four independent experiments.
OD600 nm
Strain
Time (hours)
A12 PDM K7
0 0.120 ± 0.033 0.107 ± 0.017 0.107 ± 0.010
6 1.031 ± 0.345 0.677 ± 0.197 0.490 ± 0.095
12 3.266 ± 0.073 3.378 ± 0.437 2.881 ± 0.345
18 3.305 ± 0.057 3.826 ± 0.234 4.344 ± 0.450
24 3.315 ± 0.076 3.924 ± 0.079 4.587 ± 0.150
30 3.365 ± 0.187 3.954 ± 0.150 4.551 ± 0.311
Total Cell ( × 106 cell/mL)
Strain
Time (hours)
A12 PDM K7
0 1.178 ± 0.186 1.355 ± 0.243 1.005 ± 0.060
6 17.768 ± 7.379 12.875 ± 2.843 8.351 ± 1.555
12 50.998 ± 20.429 68.750 ± 8.471 44.100 ± 3.265
18 63.600 ± 27.710 79.425 ± 11.796 55.650 ± 13.728
24 71.450 ± 43.376 77.050 ± 7.728 60.500 ± 16.140
30 70.175 ± 29.774 81.100 ± 13.851 70.575 ± 14.842
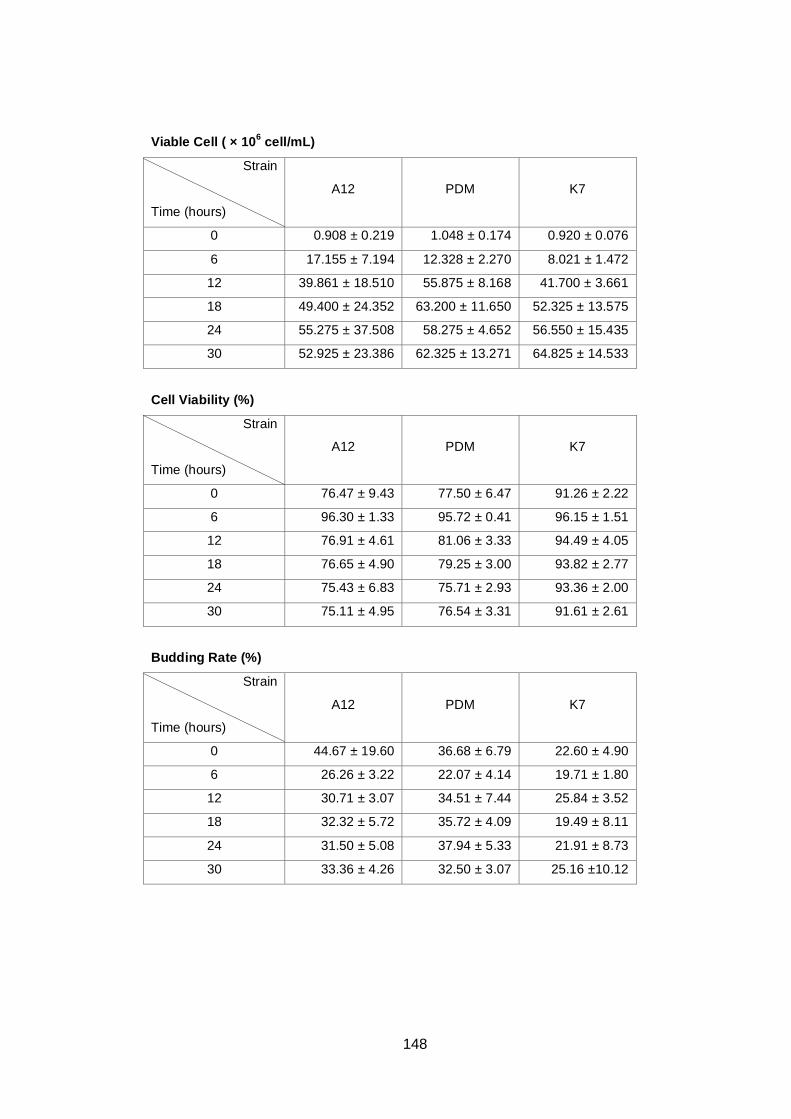
148
Viable Cell ( × 106 cell/mL)
Strain
Time (hours)
A12 PDM K7
0 0.908 ± 0.219 1.048 ± 0.174 0.920 ± 0.076
6 17.155 ± 7.194 12.328 ± 2.270 8.021 ± 1.472
12 39.861 ± 18.510 55.875 ± 8.168 41.700 ± 3.661
18 49.400 ± 24.352 63.200 ± 11.650 52.325 ± 13.575
24 55.275 ± 37.508 58.275 ± 4.652 56.550 ± 15.435
30 52.925 ± 23.386 62.325 ± 13.271 64.825 ± 14.533
Cell Viability (%)
Strain
Time (hours)
A12 PDM K7
0 76.47 ± 9.43 77.50 ± 6.47 91.26 ± 2.22
6 96.30 ± 1.33 95.72 ± 0.41 96.15 ± 1.51
12 76.91 ± 4.61 81.06 ± 3.33 94.49 ± 4.05
18 76.65 ± 4.90 79.25 ± 3.00 93.82 ± 2.77
24 75.43 ± 6.83 75.71 ± 2.93 93.36 ± 2.00
30 75.11 ± 4.95 76.54 ± 3.31 91.61 ± 2.61
Budding Rate (%)
Strain
Time (hours)
A12 PDM K7
0 44.67 ± 19.60 36.68 ± 6.79 22.60 ± 4.90
6 26.26 ± 3.22 22.07 ± 4.14 19.71 ± 1.80
12 30.71 ± 3.07 34.51 ± 7.44 25.84 ± 3.52
18 32.32 ± 5.72 35.72 ± 4.09 19.49 ± 8.11
24 31.50 ± 5.08 37.94 ± 5.33 21.91 ± 8.73
30 33.36 ± 4.26 32.50 ± 3.07 25.16 ±10.12
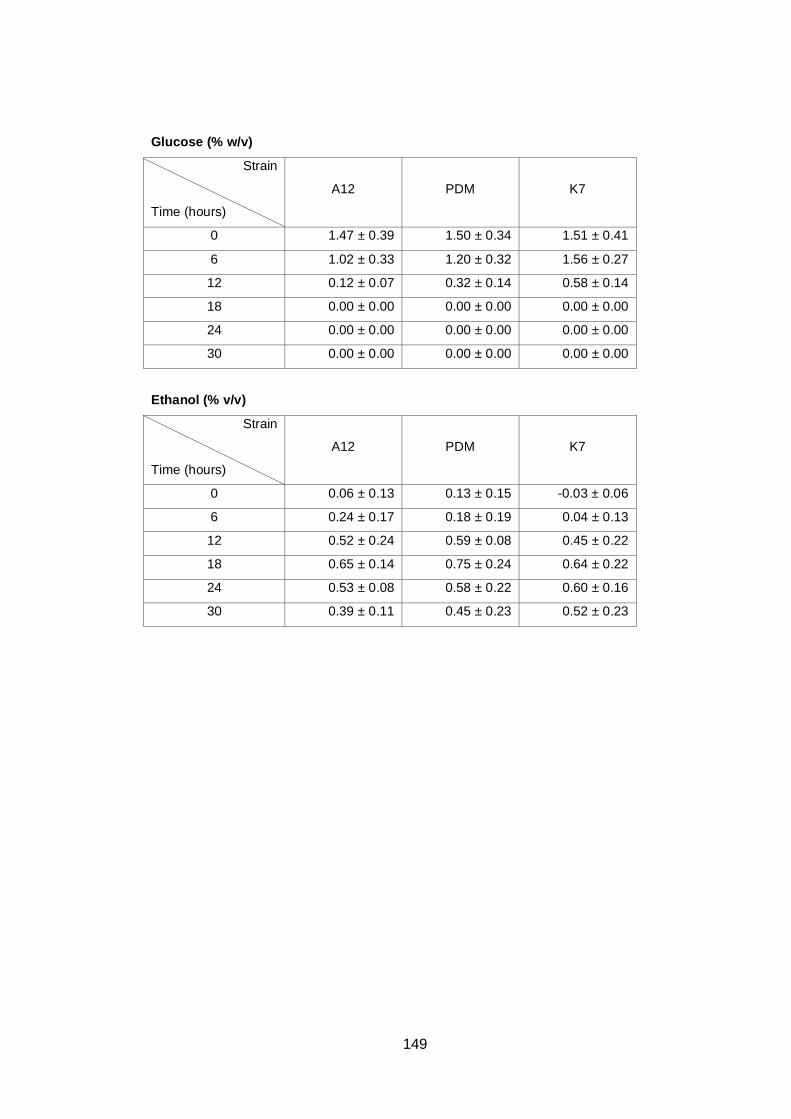
149
Glucose (% w/v)
Strain
Time (hours)
A12 PDM K7
0 1.47 ± 0.39 1.50 ± 0.34 1.51 ± 0.41
6 1.02 ± 0.33 1.20 ± 0.32 1.56 ± 0.27
12 0.12 ± 0.07 0.32 ± 0.14 0.58 ± 0.14
18 0.00 ± 0.00 0.00 ± 0.00 0.00 ± 0.00
24 0.00 ± 0.00 0.00 ± 0.00 0.00 ± 0.00
30 0.00 ± 0.00 0.00 ± 0.00 0.00 ± 0.00
Ethanol (% v/v)
Strain
Time (hours)
A12 PDM K7
0 0.06 ± 0.13 0.13 ± 0.15 -0.03 ± 0.06
6 0.24 ± 0.17 0.18 ± 0.19 0.04 ± 0.13
12 0.52 ± 0.24 0.59 ± 0.08 0.45 ± 0.22
18 0.65 ± 0.14 0.75 ± 0.24 0.64 ± 0.22
24 0.53 ± 0.08 0.58 ± 0.22 0.60 ± 0.16
30 0.39 ± 0.11 0.45 ± 0.23 0.52 ± 0.23
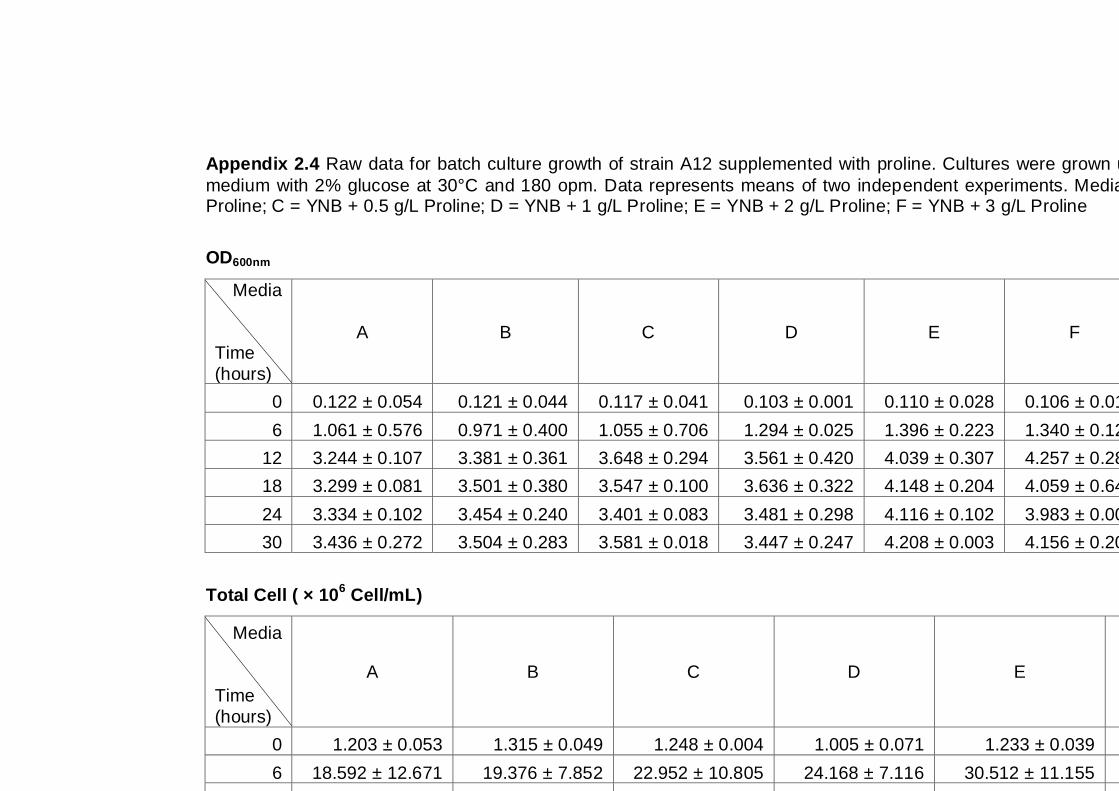
150
Appendix 2.4 Raw data for batch culture growth of strain A12 supplemented with proline. Cultures were grown under aerobic condition in YNB
medium with 2% glucose at 30°C and 180 opm. Data represents means of two independent experiments. Media: A = YNB; B = YNB + 0.1 g/L Proline; C = YNB + 0.5 g/L Proline; D = YNB + 1 g/L Proline; E = YNB + 2 g/L Proline; F = YNB + 3 g/L Proline
OD600nm
Media
Time
(hours)
A B C D E F
0 0.122 ± 0.054 0.121 ± 0.044 0.117 ± 0.041 0.103 ± 0.001 0.110 ± 0.028 0.106 ± 0.017
6 1.061 ± 0.576 0.971 ± 0.400 1.055 ± 0.706 1.294 ± 0.025 1.396 ± 0.223 1.340 ± 0.122
12 3.244 ± 0.107 3.381 ± 0.361 3.648 ± 0.294 3.561 ± 0.420 4.039 ± 0.307 4.257 ± 0.281
18 3.299 ± 0.081 3.501 ± 0.380 3.547 ± 0.100 3.636 ± 0.322 4.148 ± 0.204 4.059 ± 0.643
24 3.334 ± 0.102 3.454 ± 0.240 3.401 ± 0.083 3.481 ± 0.298 4.116 ± 0.102 3.983 ± 0.001
30 3.436 ± 0.272 3.504 ± 0.283 3.581 ± 0.018 3.447 ± 0.247 4.208 ± 0.003 4.156 ± 0.204
Total Cell ( × 106 Cell/mL)
Media
Time
(hours)
A B C D E F
0 1.203 ± 0.053 1.315 ± 0.049 1.248 ± 0.004 1.005 ± 0.071 1.233 ± 0.039 1.233 ± 0.237
6 18.592 ± 12.671 19.376 ± 7.852 22.952 ± 10.805 24.168 ± 7.116 30.512 ± 11.155 26.846 ± 0.772
12 63.650 ± 23.547 74.650 ± 19.728 67.350 ± 32.302 86.550 ± 55.225 96.600 ± 48.790 103.150 ± 13.789
18 76.350 ± 40.659 61.500 ± 19.658 60.450 ± 24.678 86.800 ± 48.932 99.950 ± 49.568 99.900 ± 2.121
24 94.700 ± 58.973 68.400 ± 25.597 74.250 ± 21.567 80.800 ± 29.274 104.750 ± 18.455 116.500 ± 21.072
30 87.950 ± 36.416 93.450 ± 24.961 83.750 ± 44.961 75.550 ± 24.395 100.100 ± 29.698 95.350 ± 33.163
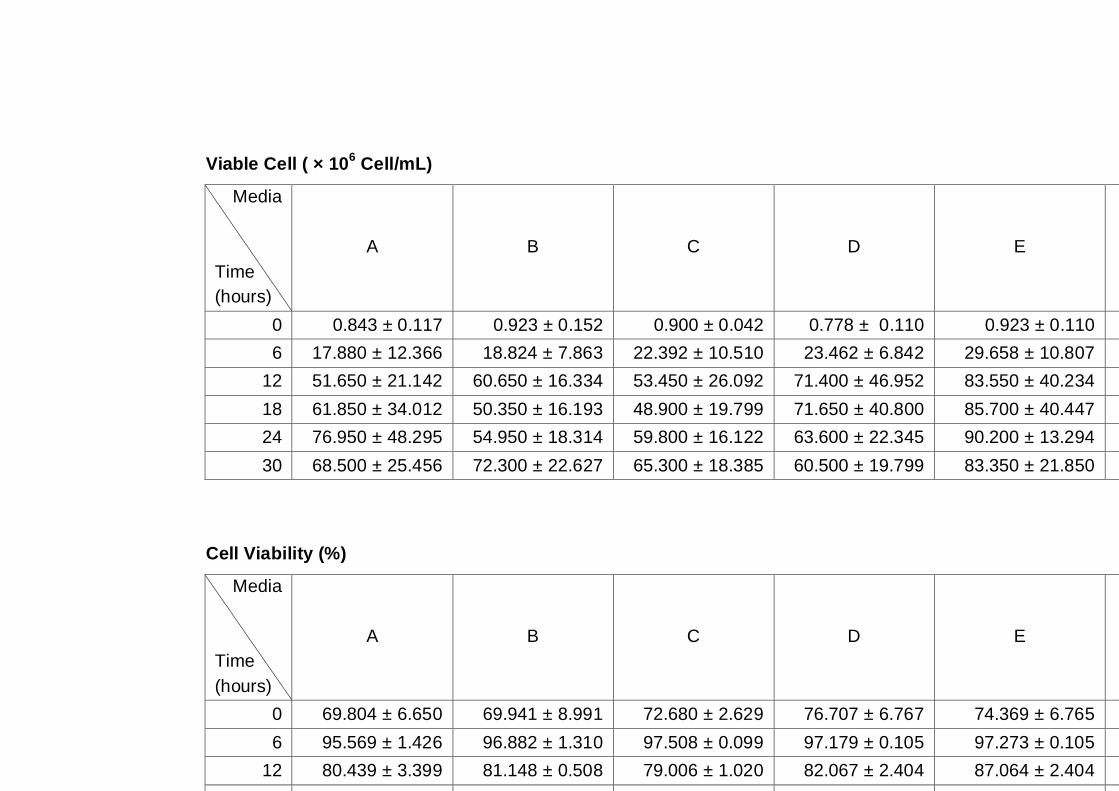
151
Viable Cell ( × 106 Cell/mL)
Media
Time
(hours)
A B C D E F
0 0.843 ± 0.117 0.923 ± 0.152 0.900 ± 0.042 0.778 ± 0.110 0.923 ± 0.110 0.863 ± 0.046
6 17.880 ± 12.366 18.824 ± 7.863 22.392 ± 10.510 23.462 ± 6.842 29.658 ± 10.807 26.410 ± 0.438
12 51.650 ± 21.142 60.650 ± 16.334 53.450 ± 26.092 71.400 ± 46.952 83.550 ± 40.234 92.000 ± 9.899
18 61.850 ± 34.012 50.350 ± 16.193 48.900 ± 19.799 71.650 ± 40.800 85.700 ± 40.447 89.250 ± 4.879
24 76.950 ± 48.295 54.950 ± 18.314 59.800 ± 16.122 63.600 ± 22.345 90.200 ± 13.294 102.700 ± 14.001
30 68.500 ± 25.456 72.300 ± 22.627 65.300 ± 18.385 60.500 ± 19.799 83.350 ± 21.850 81.900 ± 24.042
Cell Viability (%)
Media
Time
(hours)
A B C D E F
0 69.804 ± 6.650 69.941 ± 8.991 72.680 ± 2.629 76.707 ± 6.767 74.369 ± 6.765 71.800 ± 9.479
6 95.569 ± 1.426 96.882 ± 1.310 97.508 ± 0.099 97.179 ± 0.105 97.273 ± 0.105 98.406 ± 1.155
12 80.439 ± 3.399 81.148 ± 0.508 79.006 ± 1.020 82.067 ± 2.404 87.064 ± 2.404 89.319 ± 2.300
18 80.449 ± 1.741 81.908 ± 0.397 80.897 ± 0.206 82.516 ± 2.204 86.375 ± 2.204 89.314 ± 3.115
24 81.217 ± 0.269 80.796 ± 3.626 80.692 ± 1.579 78.886 ± 2.333 86.260 ± 2.333 88.495 ± 3.889
30 78.744 ± 3.751 77.521 ± 0.626 78.188 ± 1.222 79.855 ± 3.119 83.662 ± 3.119 86.748 ± 4.771
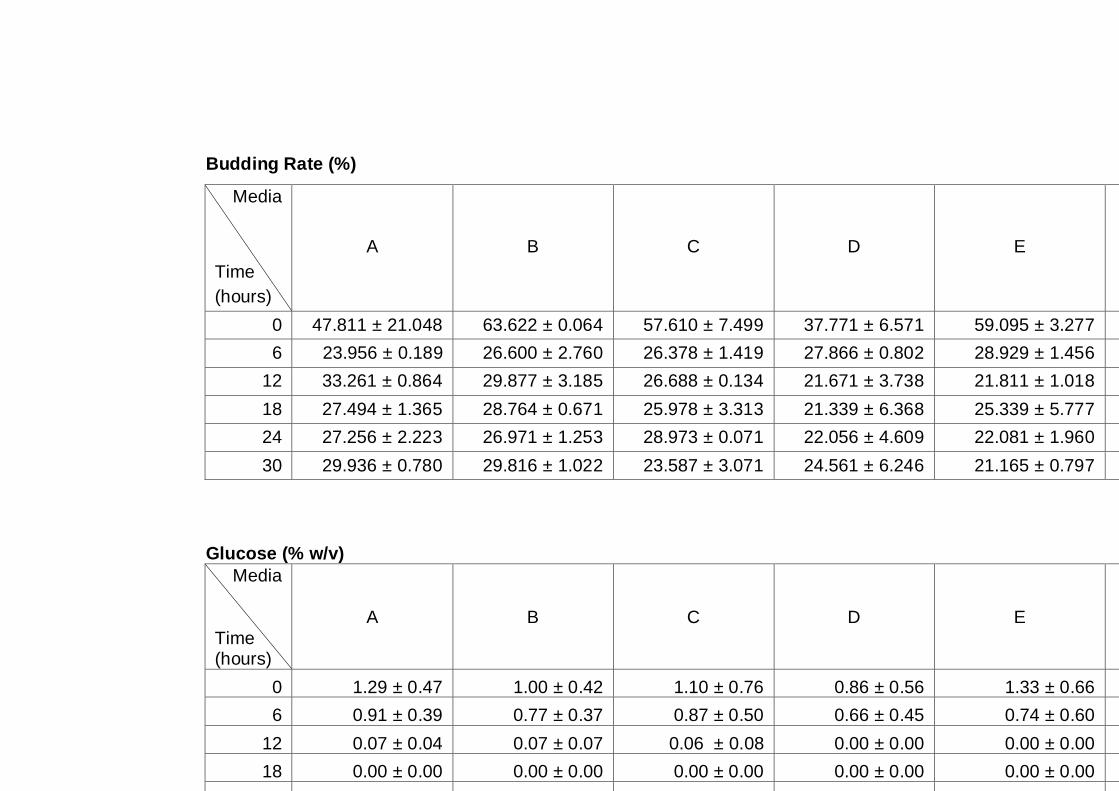
152
Budding Rate (%)
Media
Time
(hours)
A B C D E F
0 47.811 ± 21.048 63.622 ± 0.064 57.610 ± 7.499 37.771 ± 6.571 59.095 ± 3.277 55.108 ± 2.083
6 23.956 ± 0.189 26.600 ± 2.760 26.378 ± 1.419 27.866 ± 0.802 28.929 ± 1.456 28.071 ± 1.361
12 33.261 ± 0.864 29.877 ± 3.185 26.688 ± 0.134 21.671 ± 3.738 21.811 ± 1.018 20.434 ± 1.068
18 27.494 ± 1.365 28.764 ± 0.671 25.978 ± 3.313 21.339 ± 6.368 25.339 ± 5.777 20.271 ± 6.836
24 27.256 ± 2.223 26.971 ± 1.253 28.973 ± 0.071 22.056 ± 4.609 22.081 ± 1.960 21.394 ± 2.690
30 29.936 ± 0.780 29.816 ± 1.022 23.587 ± 3.071 24.561 ± 6.246 21.165 ± 0.797 19.678 ± 2.891
Glucose (% w/v)
Media
Time (hours)
A B C D E F
0 1.29 ± 0.47 1.00 ± 0.42 1.10 ± 0.76 0.86 ± 0.56 1.33 ± 0.66 1.29 ± 0.52
6 0.91 ± 0.39 0.77 ± 0.37 0.87 ± 0.50 0.66 ± 0.45 0.74 ± 0.60 0.85 ± 0.57
12 0.07 ± 0.04 0.07 ± 0.07 0.06 ± 0.08 0.00 ± 0.00 0.00 ± 0.00 0.00 ± 0.00
18 0.00 ± 0.00 0.00 ± 0.00 0.00 ± 0.00 0.00 ± 0.00 0.00 ± 0.00 0.00 ± 0.00
24 0.00 ± 0.00 0.00 ± 0.00 0.00 ± 0.00 0.00 ± 0.00 0.00 ± 0.00 0.00 ± 0.00
30 0.00 ± 0.00 0.00 ± 0.00 0.00 ± 0.00 0.00 ± 0.00 0.00 ± 0.00 0.00 ± 0.00
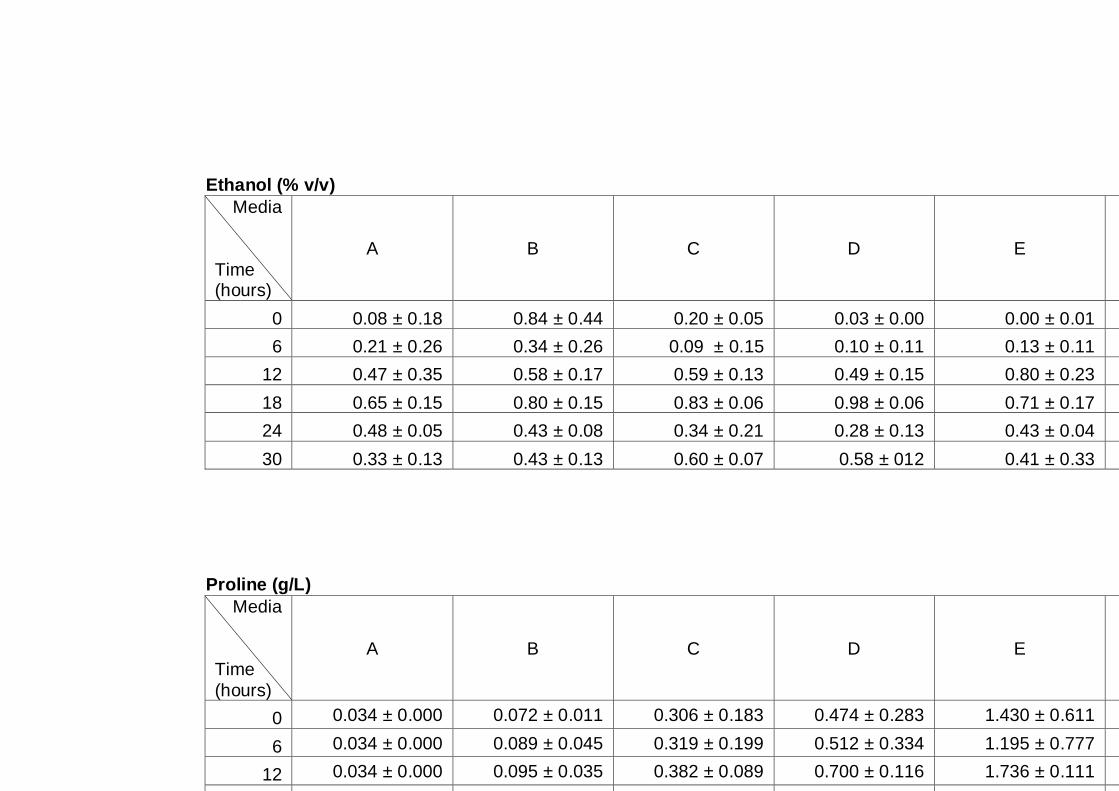
153
Ethanol (% v/v)
Media
Time (hours)
A B C D E F
0 0.08 ± 0.18 0.84 ± 0.44 0.20 ± 0.05 0.03 ± 0.00 0.00 ± 0.01 0.18 ± 0.26
6 0.21 ± 0.26 0.34 ± 0.26 0.09 ± 0.15 0.10 ± 0.11 0.13 ± 0.11 0.09 ± 0.10
12 0.47 ± 0.35 0.58 ± 0.17 0.59 ± 0.13 0.49 ± 0.15 0.80 ± 0.23 0.84 ± 0.43
18 0.65 ± 0.15 0.80 ± 0.15 0.83 ± 0.06 0.98 ± 0.06 0.71 ± 0.17 0.75 ± 0.23
24 0.48 ± 0.05 0.43 ± 0.08 0.34 ± 0.21 0.28 ± 0.13 0.43 ± 0.04 0.47 ± 0.01
30 0.33 ± 0.13 0.43 ± 0.13 0.60 ± 0.07 0.58 ± 012 0.41 ± 0.33 0.63 ± 0.44
Proline (g/L)
Media
Time
(hours)
A B C D E F
0 0.034 ± 0.000 0.072 ± 0.011 0.306 ± 0.183 0.474 ± 0.283 1.430 ± 0.611 1.925 ± 0.833
6 0.034 ± 0.000 0.089 ± 0.045 0.319 ± 0.199 0.512 ± 0.334 1.195 ± 0.777 1.689 ± 1.349
12 0.034 ± 0.000 0.095 ± 0.035 0.382 ± 0.089 0.700 ± 0.116 1.736 ± 0.111 2.420 ± 0.508
18 0.034 ± 0.000 0.115 ± 0.002 0.447 ± 0.012 0.836 ± 0.101 1.857 ± 0.309 2.523 ± 0.015
24 0.034 ± 0.000 0.096 ± 0.009 0.363 ± 0.078 0.583 ± 0.105 1.625 ± 0.072 2.351 ± 0.024
30 0.034 ± 0.000 0.098 ± 0.015 0.345 ± 0.003 0.727 ± 0.052 1.411 ± 0.224 1.667 ± 0.361
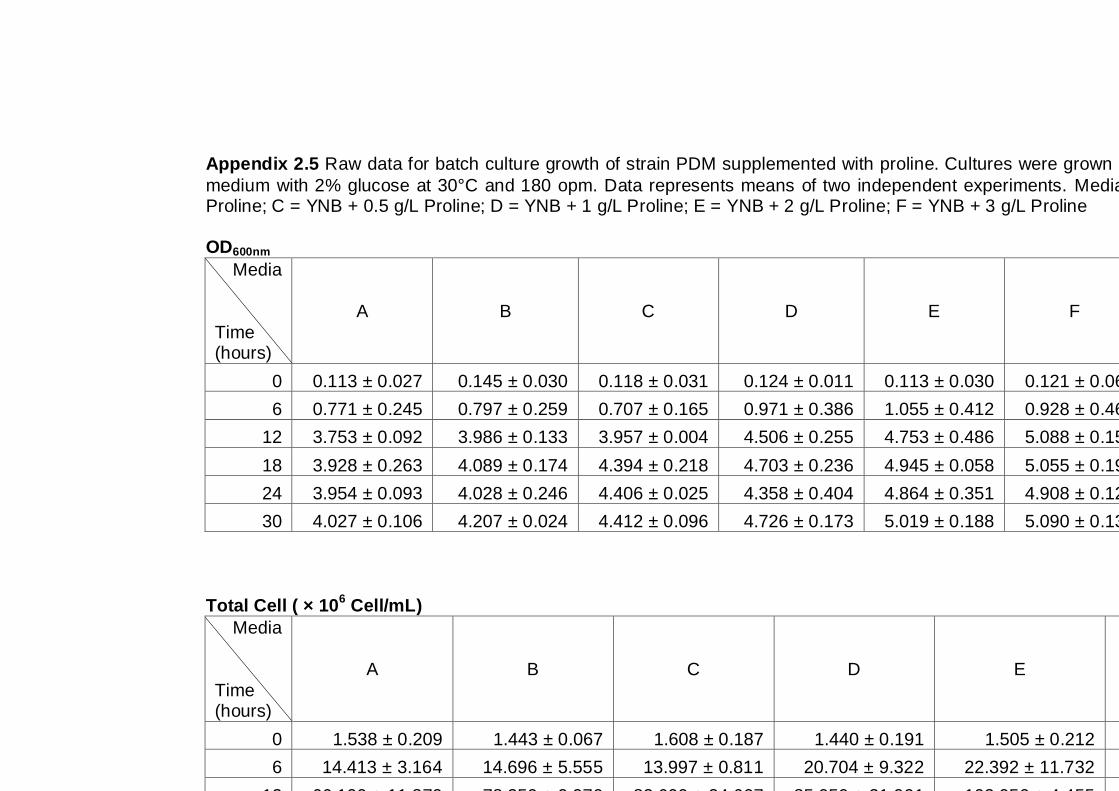
154
Appendix 2.5 Raw data for batch culture growth of strain PDM supplemented with proline. Cultures were grown under aerobic condition in YNB
medium with 2% glucose at 30°C and 180 opm. Data represents means of two independent experiments. Media: A = YNB; B = YNB + 0.1 g/L Proline; C = YNB + 0.5 g/L Proline; D = YNB + 1 g/L Proline; E = YNB + 2 g/L Proline; F = YNB + 3 g/L Proline
OD600nm
Media
Time (hours)
A B C D E F
0 0.113 ± 0.027 0.145 ± 0.030 0.118 ± 0.031 0.124 ± 0.011 0.113 ± 0.030 0.121 ± 0.064
6 0.771 ± 0.245 0.797 ± 0.259 0.707 ± 0.165 0.971 ± 0.386 1.055 ± 0.412 0.928 ± 0.464
12 3.753 ± 0.092 3.986 ± 0.133 3.957 ± 0.004 4.506 ± 0.255 4.753 ± 0.486 5.088 ± 0.153
18 3.928 ± 0.263 4.089 ± 0.174 4.394 ± 0.218 4.703 ± 0.236 4.945 ± 0.058 5.055 ± 0.194
24 3.954 ± 0.093 4.028 ± 0.246 4.406 ± 0.025 4.358 ± 0.404 4.864 ± 0.351 4.908 ± 0.122
30 4.027 ± 0.106 4.207 ± 0.024 4.412 ± 0.096 4.726 ± 0.173 5.019 ± 0.188 5.090 ± 0.133
Total Cell ( × 106 Cell/mL)
Media
Time (hours)
A B C D E F
0 1.538 ± 0.209 1.443 ± 0.067 1.608 ± 0.187 1.440 ± 0.191 1.505 ± 0.212 1.868 ± 0.357
6 14.413 ± 3.164 14.696 ± 5.555 13.997 ± 0.811 20.704 ± 9.322 22.392 ± 11.732 26.288 ± 15.952
12 66.100 ± 11.879 78.250 ± 9.970 82.600 ± 24.607 85.050 ± 21.991 102.050 ± 4.455 119.000 ± 15.274
18 85.150 ± 10.819 89.750 ± 3.182 98.300 ± 15.556 87.100 ± 24.042 94.650 ± 25.102 96.500 ± 15.981
24 78.100 ± 7.495 82.350 ± 7.283 101.250 ± 17.041 109.000 ± 0.141 111.850 ± 18.455 133.050 ± 7.849
30 88.700 ± 17.536 75.850 ± 1.061 80.300 ± 7.212 93.750 ± 8.132 103.150 ± 30.476 114.100 ± 14.991
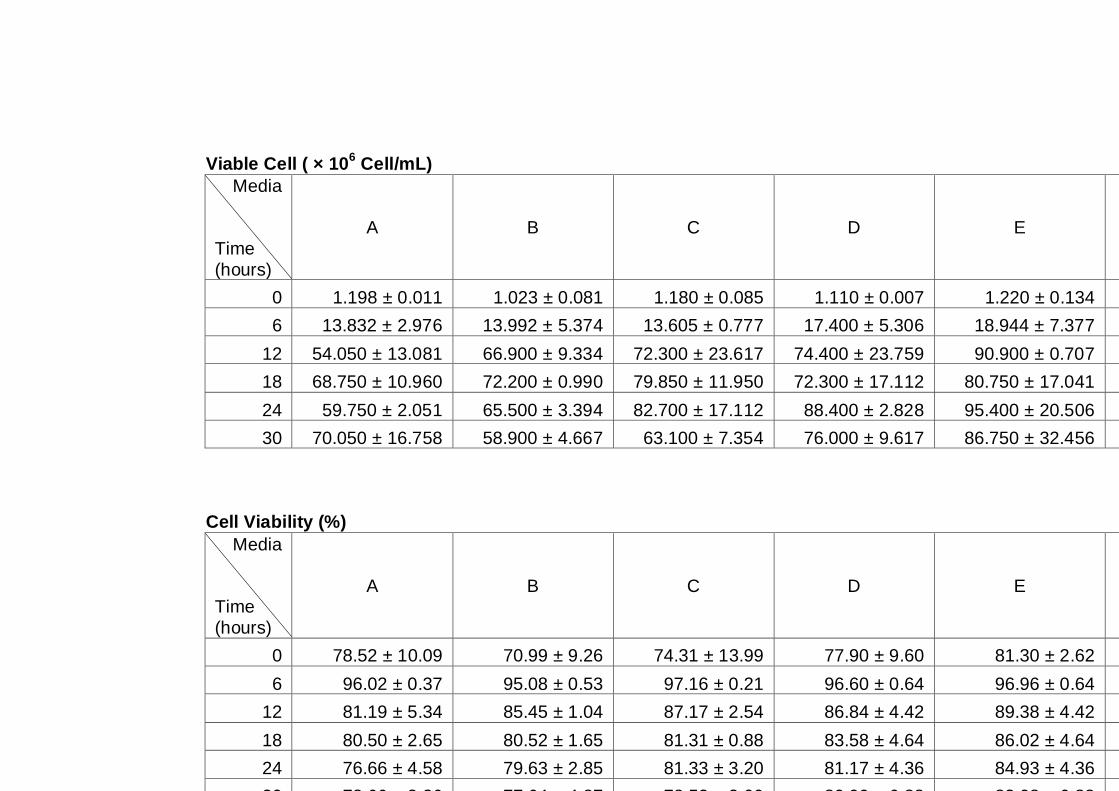
155
Viable Cell ( × 106 Cell/mL)
Media
Time
(hours)
A B C D E F
0 1.198 ± 0.011 1.023 ± 0.081 1.180 ± 0.085 1.110 ± 0.007 1.220 ± 0.134 1.430 ± 0.120
6 13.832 ± 2.976 13.992 ± 5.374 13.605 ± 0.777 17.400 ± 5.306 18.944 ± 7.377 21.344 ± 10.137
12 54.050 ± 13.081 66.900 ± 9.334 72.300 ± 23.617 74.400 ± 23.759 90.900 ± 0.707 109.850 ± 17.466
18 68.750 ± 10.960 72.200 ± 0.990 79.850 ± 11.950 72.300 ± 17.112 80.750 ± 17.041 86.650 ± 10.819
24 59.750 ± 2.051 65.500 ± 3.394 82.700 ± 17.112 88.400 ± 2.828 95.400 ± 20.506 116.500 ± 11.172
30 70.050 ± 16.758 58.900 ± 4.667 63.100 ± 7.354 76.000 ± 9.617 86.750 ± 32.456 97.900 ± 16.971
Cell Viability (%)
Media
Time
(hours)
A B C D E F
0 78.52 ± 10.09 70.99 ± 9.26 74.31 ± 13.99 77.90 ± 9.60 81.30 ± 2.62 77.45 ± 8.41
6 96.02 ± 0.37 95.08 ± 0.53 97.16 ± 0.21 96.60 ± 0.64 96.96 ± 0.64 95.58 ± 1.61
12 81.19 ± 5.34 85.45 ± 1.04 87.17 ± 2.54 86.84 ± 4.42 89.38 ± 4.42 92.16 ± 2.84
18 80.50 ± 2.65 80.52 ± 1.65 81.31 ± 0.88 83.58 ± 4.64 86.02 ± 4.64 90.19 ± 3.92
24 76.66 ± 4.58 79.63 ± 2.85 81.33 ± 3.20 81.17 ± 4.36 84.93 ± 4.36 87.48 ± 3.19
30 78.66 ± 3.26 77.64 ± 4.87 78.52 ± 2.00 80.90 ± 6.88 83.08 ± 6.88 85.58 ± 3.70
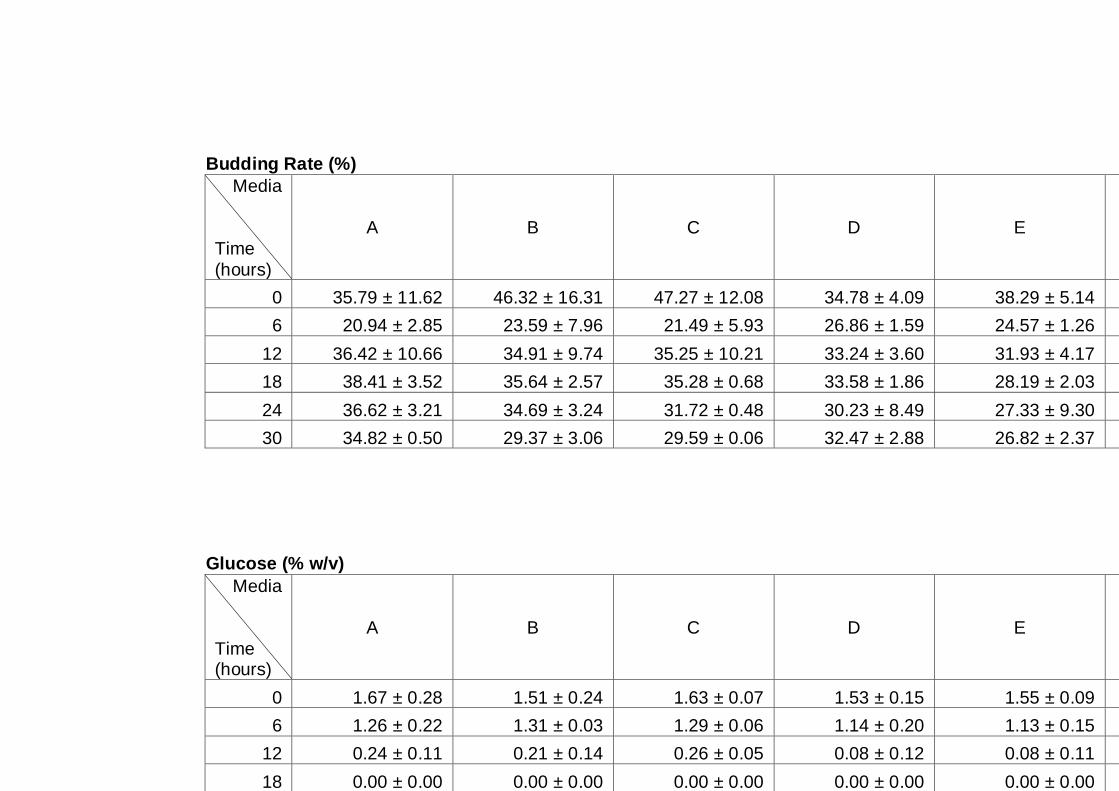
156
Budding Rate (%)
Media
Time
(hours)
A B C D E F
0 35.79 ± 11.62 46.32 ± 16.31 47.27 ± 12.08 34.78 ± 4.09 38.29 ± 5.14 42.37 ± 9.92
6 20.94 ± 2.85 23.59 ± 7.96 21.49 ± 5.93 26.86 ± 1.59 24.57 ± 1.26 26.35 ± 3.05
12 36.42 ± 10.66 34.91 ± 9.74 35.25 ± 10.21 33.24 ± 3.60 31.93 ± 4.17 32.35 ± 3.91
18 38.41 ± 3.52 35.64 ± 2.57 35.28 ± 0.68 33.58 ± 1.86 28.19 ± 2.03 25.89 ± 3.79
24 36.62 ± 3.21 34.69 ± 3.24 31.72 ± 0.48 30.23 ± 8.49 27.33 ± 9.30 26.38 ± 6.84
30 34.82 ± 0.50 29.37 ± 3.06 29.59 ± 0.06 32.47 ± 2.88 26.82 ± 2.37 23.31 ± 3.73
Glucose (% w/v)
Media
Time (hours)
A B C D E F
0 1.67 ± 0.28 1.51 ± 0.24 1.63 ± 0.07 1.53 ± 0.15 1.55 ± 0.09 1.57 ± 0.14
6 1.26 ± 0.22 1.31 ± 0.03 1.29 ± 0.06 1.14 ± 0.20 1.13 ± 0.15 1.23 ± 0.19
12 0.24 ± 0.11 0.21 ± 0.14 0.26 ± 0.05 0.08 ± 0.12 0.08 ± 0.11 0.06 ± 0.08
18 0.00 ± 0.00 0.00 ± 0.00 0.00 ± 0.00 0.00 ± 0.00 0.00 ± 0.00 0.00 ± 0.00
24 0.00 ± 0.00 0.00 ± 0.00 0.00 ± 0.00 0.00 ± 0.00 0.00 ± 0.00 0.00 ± 0.00
30 0.00 ± 0.00 0.00 ± 0.00 0.00 ± 0.00 0.00 ± 0.00 0.00 ± 0.00 0.00 ± 0.00
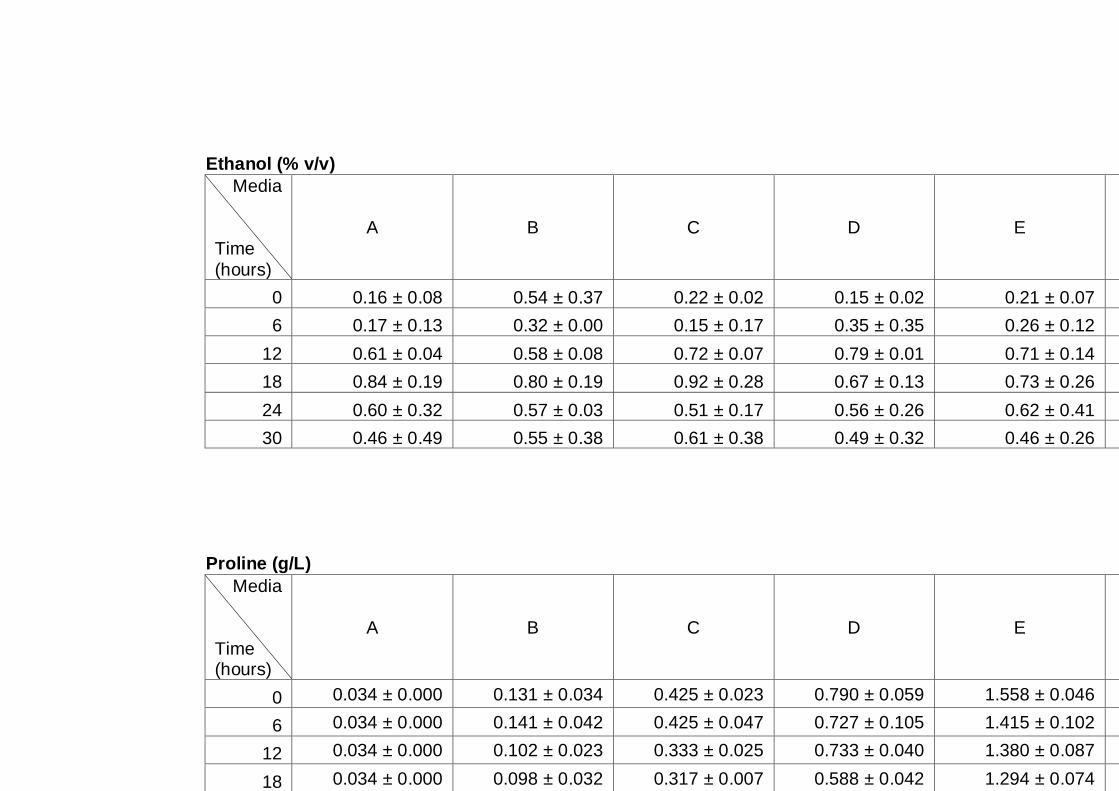
157
Ethanol (% v/v)
Media
Time
(hours)
A B C D E F
0 0.16 ± 0.08 0.54 ± 0.37 0.22 ± 0.02 0.15 ± 0.02 0.21 ± 0.07 0.25 ± 0.04
6 0.17 ± 0.13 0.32 ± 0.00 0.15 ± 0.17 0.35 ± 0.35 0.26 ± 0.12 0.21 ± 0.16
12 0.61 ± 0.04 0.58 ± 0.08 0.72 ± 0.07 0.79 ± 0.01 0.71 ± 0.14 0.68 ± 0.11
18 0.84 ± 0.19 0.80 ± 0.19 0.92 ± 0.28 0.67 ± 0.13 0.73 ± 0.26 0.85 ± 0.35
24 0.60 ± 0.32 0.57 ± 0.03 0.51 ± 0.17 0.56 ± 0.26 0.62 ± 0.41 0.56 ± 0.27
30 0.46 ± 0.49 0.55 ± 0.38 0.61 ± 0.38 0.49 ± 0.32 0.46 ± 0.26 0.44 ± 0.17
Proline (g/L)
Media
Time (hours)
A B C D E F
0 0.034 ± 0.000 0.131 ± 0.034 0.425 ± 0.023 0.790 ± 0.059 1.558 ± 0.046 2.383 ± 0.212
6 0.034 ± 0.000 0.141 ± 0.042 0.425 ± 0.047 0.727 ± 0.105 1.415 ± 0.102 2.281 ± 0.329
12 0.034 ± 0.000 0.102 ± 0.023 0.333 ± 0.025 0.733 ± 0.040 1.380 ± 0.087 2.100 ± 0.156
18 0.034 ± 0.000 0.098 ± 0.032 0.317 ± 0.007 0.588 ± 0.042 1.294 ± 0.074 2.135 ± 0.121
24 0.034 ± 0.000 0.072 ± 0.004 0.308 ± 0.045 0.612 ± 0.024 1.279 ± 0.341 2.139 ± 0.344
30 0.034 ± 0.000 0.096 ± 0.020 0.344 ± 0.081 0.599 ± 0.088 1.498 ± 0.186 1.865 ± 0.140

158
Appendix 2.6 Raw data for batch culture growth of strain K7 supplemented with proline. Cultures were grown under aerobic condition in YNB
medium with 2% glucose at 30°C and 180 opm. Data represents means of two independent experiments. Media: A = YNB; B = YNB + 0.1 g/L Proline; C = YNB + 0.5 g/L Proline; D = YNB + 1 g/L Proline; E = YNB + 2 g/L Proline; F = YNB + 3 g/L Proline
OD600nm
Media
Time (hours)
A B C D E F
0 0.108 ± 0.017 0.094 ± 0.017 0.106 ± 0.006 0.105 ± 0.007 0.113 ± 0.007 0.103 ± 0.004
6 0.458 ± 0.150 0.463 ± 0.117 0.537 ± 0.081 0.747 ± 0.180 0.710 ± 0.192 0.745 ± 0.182
12 3.022 ± 0.501 3.226 ± 0.368 3.336 ± 0.300 3.267 ± 0.049 3.616 ± 0.130 4.437 ± 0.700
18 4.058 ± 0.526 4.088 ± 0.308 4.502 ± 0.221 4.863 ± 0.324 5.170 ± 0.628 5.500 ± 0.882
24 4.517 ± 0.182 4.152 ± 0.201 5.015 ± 0.856 5.202 ± 0.724 5.666 ± 0.973 5.114 ± 0.413
30 4.301 ± 0.095 4.672 ± 0.911 5.054 ± 1.355 5.503 ± 1.184 5.379 ± 0.921 6.389 ± 1.947
Total Cell ( × 10
6 Cell/mL)
Media
Time (hours)
A B C D E F
0 1.033 ± 0.074 1.185 ± 0.424 1.030 ± 0.276 1.050 ± 0.269 1.345 ± 0.417 1.173 ± 0.456
6 7.795 ± 2.123 8.760 ± 1.392 10.552 ± 6.490 14.205 ± 6.490 12.341 ± 6.351 16.584 ± 0.532
12 42.050 ± 1.061 46.350 ± 1.909 48.850 ± 2.758 54.350 ± 2.758 61.700 ± 14.566 80.350 ± 36.840
18 62.350 ± 19.163 57.600 ± 15.556 64.000 ± 1.485 75.450 ± 1.485 75.200 ± 16.122 95.650 ± 19.587
24 67.450 ± 24.112 68.250 ± 22.123 56.000 ± 12.516 80.450 ± 12.516 74.700 ± 0.566 69.950 ± 16.051
30 79.600 ± 16.971 68.450 ± 19.870 65.650 ± 35.426 85.050 ± 35.426 79.500 ± 32.385 93.350 ± 8.839
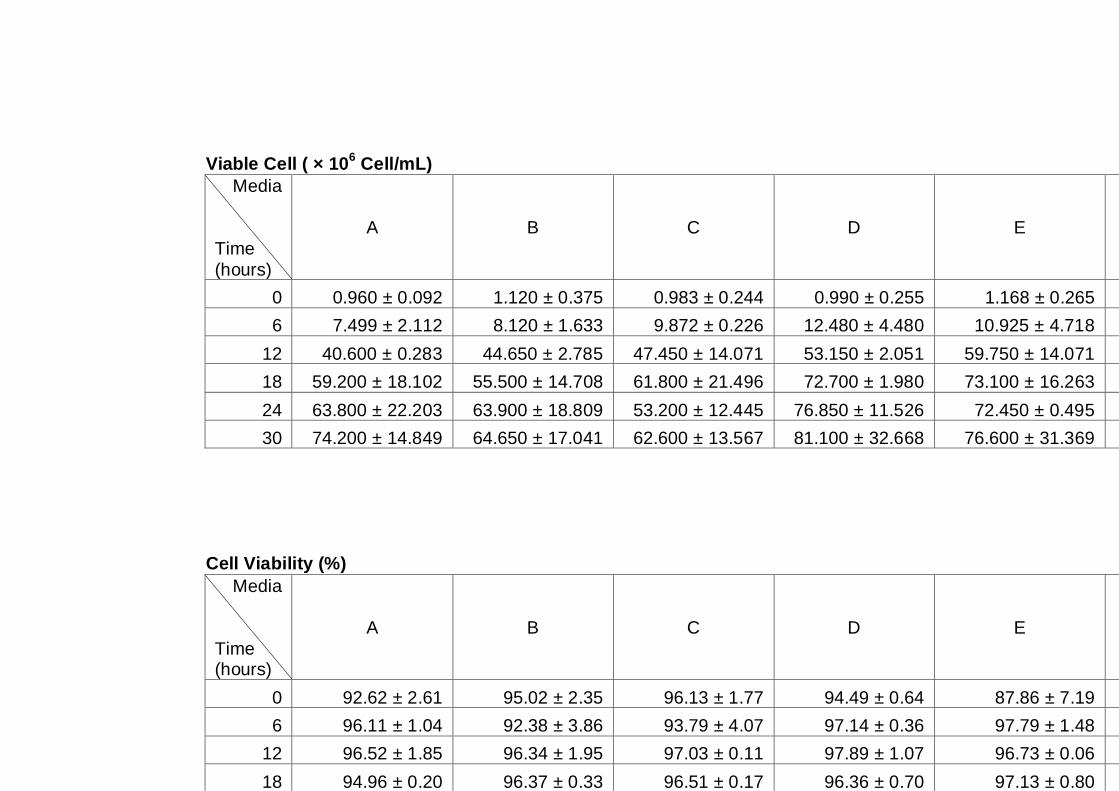
159
Viable Cell ( × 106 Cell/mL)
Media
Time
(hours)
A B C D E F
0 0.960 ± 0.092 1.120 ± 0.375 0.983 ± 0.244 0.990 ± 0.255 1.168 ± 0.265 1.095 ± 0.417
6 7.499 ± 2.112 8.120 ± 1.633 9.872 ± 0.226 12.480 ± 4.480 10.925 ± 4.718 14.581 ± 0.965
12 40.600 ± 0.283 44.650 ± 2.785 47.450 ± 14.071 53.150 ± 2.051 59.750 ± 14.071 79.350 ± 36.557
18 59.200 ± 18.102 55.500 ± 14.708 61.800 ± 21.496 72.700 ± 1.980 73.100 ± 16.263 92.900 ± 19.092
24 63.800 ± 22.203 63.900 ± 18.809 53.200 ± 12.445 76.850 ± 11.526 72.450 ± 0.495 67.850 ± 16.193
30 74.200 ± 14.849 64.650 ± 17.041 62.600 ± 13.567 81.100 ± 32.668 76.600 ± 31.369 89.550 ± 7.990
Cell Viability (%)
Media
Time (hours)
A B C D E F
0 92.62 ± 2.61 95.02 ± 2.35 96.13 ± 1.77 94.49 ± 0.64 87.86 ± 7.19 93.58 ± 0.77
6 96.11 ± 1.04 92.38 ± 3.86 93.79 ± 4.07 97.14 ± 0.36 97.79 ± 1.48 96.60 ± 3.70
12 96.52 ± 1.85 96.34 ± 1.95 97.03 ± 0.11 97.89 ± 1.07 96.73 ± 0.06 98.70 ± 0.26
18 94.96 ± 0.20 96.37 ± 0.33 96.51 ± 0.17 96.36 ± 0.70 97.13 ± 0.80 97.08 ± 0.04
24 94.77 ± 1.01 94.08 ± 2.96 95.31 ± 1.96 95.52 ± 0.58 96.99 ± 0.11 96.84 ± 0.96
30 93.34 ± 1.17 94.85 ± 2.65 95.53 ± 1.44 95.70 ± 1.46 96.28 ± 0.23 95.97 ± 0.53
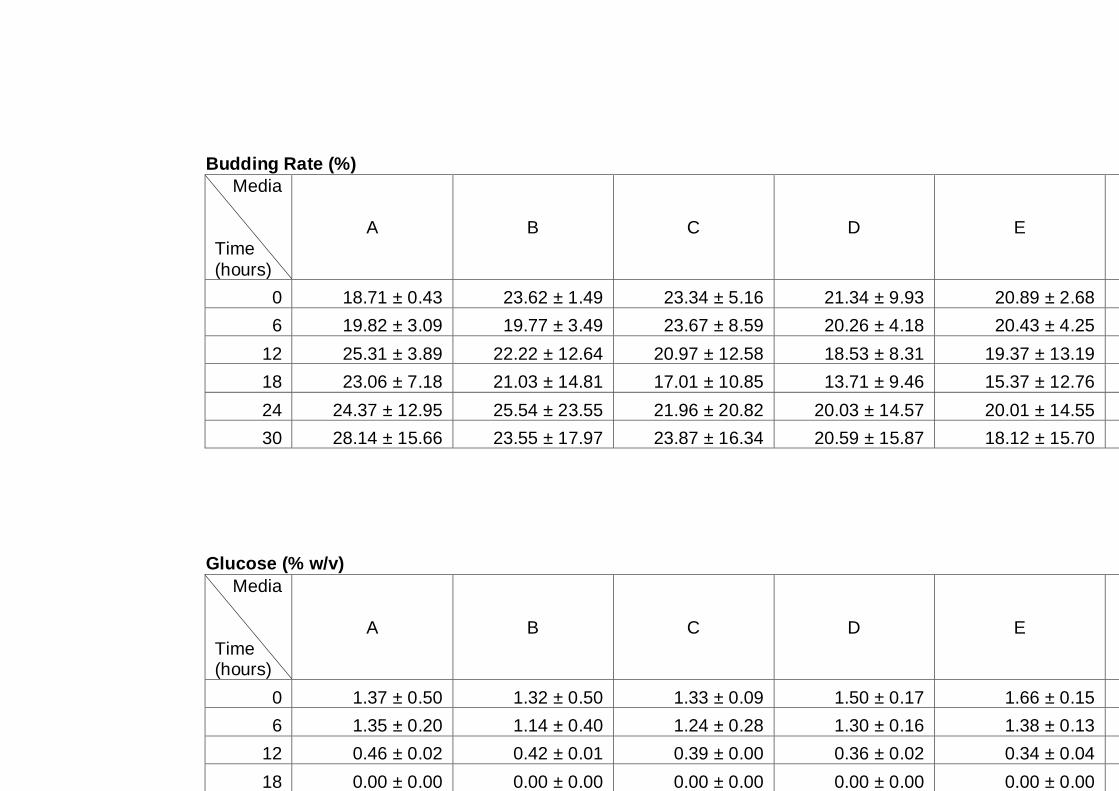
160
Budding Rate (%)
Media
Time
(hours)
A B C D E F
0 18.71 ± 0.43 23.62 ± 1.49 23.34 ± 5.16 21.34 ± 9.93 20.89 ± 2.68 17.95 ± 8.36
6 19.82 ± 3.09 19.77 ± 3.49 23.67 ± 8.59 20.26 ± 4.18 20.43 ± 4.25 21.66 ± 0.94
12 25.31 ± 3.89 22.22 ± 12.64 20.97 ± 12.58 18.53 ± 8.31 19.37 ± 13.19 17.69 ± 7.91
18 23.06 ± 7.18 21.03 ± 14.81 17.01 ± 10.85 13.71 ± 9.46 15.37 ± 12.76 16.17 ± 13.90
24 24.37 ± 12.95 25.54 ± 23.55 21.96 ± 20.82 20.03 ± 14.57 20.01 ± 14.55 16.45 ± 17.37
30 28.14 ± 15.66 23.55 ± 17.97 23.87 ± 16.34 20.59 ± 15.87 18.12 ± 15.70 17.53 ± 16.02
Glucose (% w/v)
Media
Time (hours)
A B C D E F
0 1.37 ± 0.50 1.32 ± 0.50 1.33 ± 0.09 1.50 ± 0.17 1.66 ± 0.15 1.49 ± 0.04
6 1.35 ± 0.20 1.14 ± 0.40 1.24 ± 0.28 1.30 ± 0.16 1.38 ± 0.13 1.19 ± 0.35
12 0.46 ± 0.02 0.42 ± 0.01 0.39 ± 0.00 0.36 ± 0.02 0.34 ± 0.04 0.25 ± 0.21
18 0.00 ± 0.00 0.00 ± 0.00 0.00 ± 0.00 0.00 ± 0.00 0.00 ± 0.00 0.00 ± 0.00
24 0.00 ± 0.00 0.00 ± 0.00 0.00 ± 0.00 0.00 ± 0.00 0.00 ± 0.00 0.00 ± 0.00
30 0.00 ± 0.00 0.00 ± 0.00 0.00 ± 0.00 0.00 ± 0.00 0.00 ± 0.00 0.00 ± 0.00
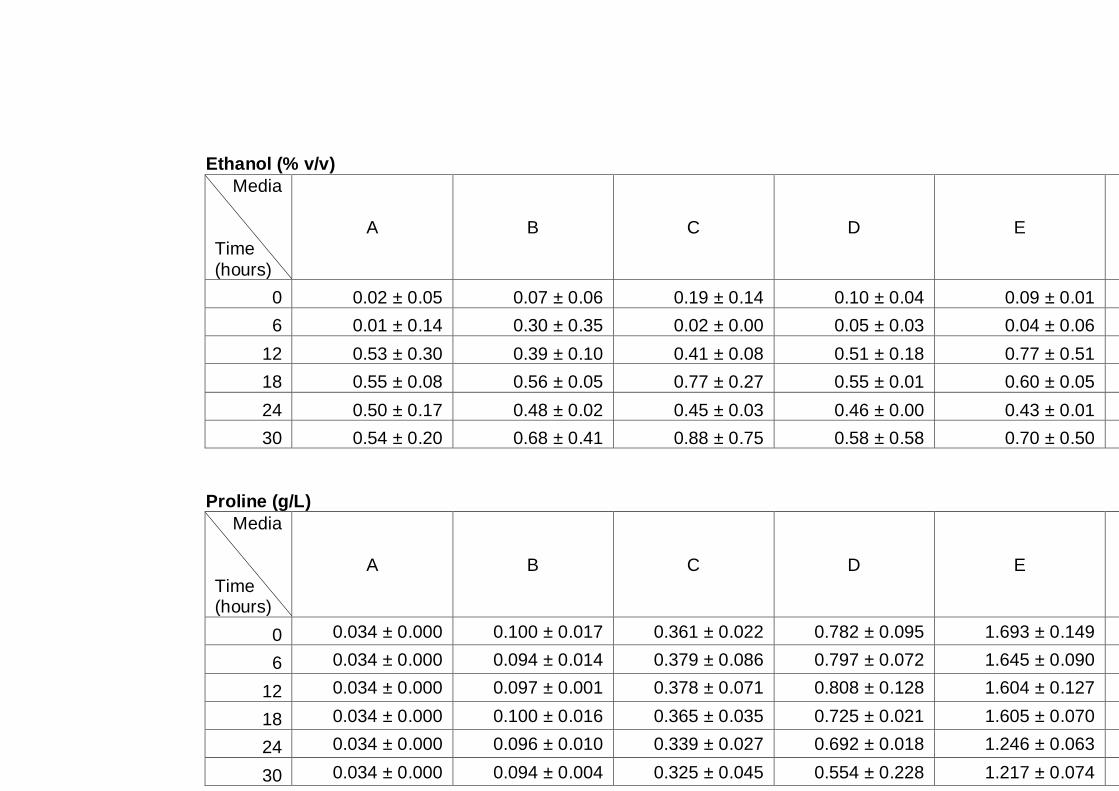
161
Ethanol (% v/v)
Media
Time
(hours)
A B C D E F
0 0.02 ± 0.05 0.07 ± 0.06 0.19 ± 0.14 0.10 ± 0.04 0.09 ± 0.01 0.10 ± 0.04
6 0.01 ± 0.14 0.30 ± 0.35 0.02 ± 0.00 0.05 ± 0.03 0.04 ± 0.06 0.05 ± 0.04
12 0.53 ± 0.30 0.39 ± 0.10 0.41 ± 0.08 0.51 ± 0.18 0.77 ± 0.51 0.82 ± 0.50
18 0.55 ± 0.08 0.56 ± 0.05 0.77 ± 0.27 0.55 ± 0.01 0.60 ± 0.05 0.59 ± 0.02
24 0.50 ± 0.17 0.48 ± 0.02 0.45 ± 0.03 0.46 ± 0.00 0.43 ± 0.01 0.38 ± 0.04
30 0.54 ± 0.20 0.68 ± 0.41 0.88 ± 0.75 0.58 ± 0.58 0.70 ± 0.50 0.61 ± 0.31
Proline (g/L)
Media
Time (hours)
A B C D E F
0 0.034 ± 0.000 0.100 ± 0.017 0.361 ± 0.022 0.782 ± 0.095 1.693 ± 0.149 2.285 ± 0.035
6 0.034 ± 0.000 0.094 ± 0.014 0.379 ± 0.086 0.797 ± 0.072 1.645 ± 0.090 2.149 ± 0.518
12 0.034 ± 0.000 0.097 ± 0.001 0.378 ± 0.071 0.808 ± 0.128 1.604 ± 0.127 2.495 ± 0.117
18 0.034 ± 0.000 0.100 ± 0.016 0.365 ± 0.035 0.725 ± 0.021 1.605 ± 0.070 2.367 ± 0.005
24 0.034 ± 0.000 0.096 ± 0.010 0.339 ± 0.027 0.692 ± 0.018 1.246 ± 0.063 1.951 ± 0.027
30 0.034 ± 0.000 0.094 ± 0.004 0.325 ± 0.045 0.554 ± 0.228 1.217 ± 0.074 2.001 ± 0.068
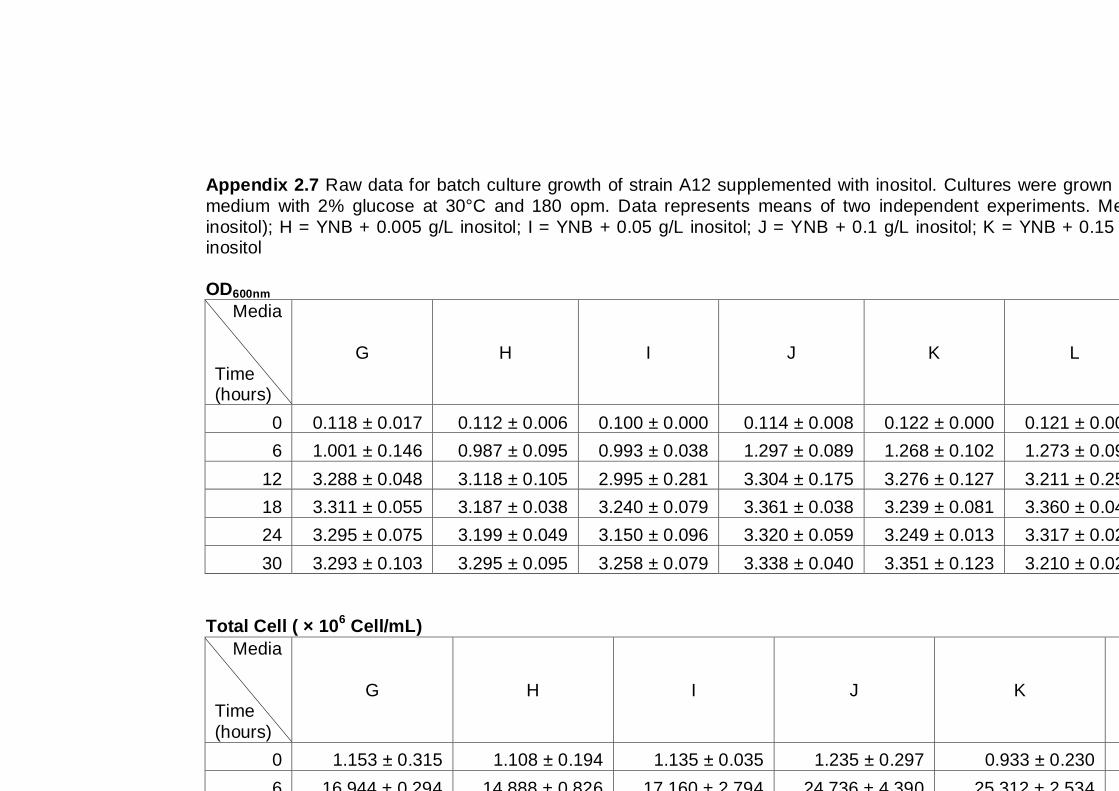
162
Appendix 2.7 Raw data for batch culture growth of strain A12 supplemented with inositol. Cultures were grown under aerobic condition in YNB
medium with 2% glucose at 30°C and 180 opm. Data represents means of two independent experiments. Media: G = YNB (with 0.002 g/L
inositol); H = YNB + 0.005 g/L inositol; I = YNB + 0.05 g/L inositol; J = YNB + 0.1 g/L inositol; K = YNB + 0.15 g/L inositol; L = YNB + 0.2 g/L inositol
OD600nm
Media
Time (hours)
G H I J K L
0 0.118 ± 0.017 0.112 ± 0.006 0.100 ± 0.000 0.114 ± 0.008 0.122 ± 0.000 0.121 ± 0.001
6 1.001 ± 0.146 0.987 ± 0.095 0.993 ± 0.038 1.297 ± 0.089 1.268 ± 0.102 1.273 ± 0.092
12 3.288 ± 0.048 3.118 ± 0.105 2.995 ± 0.281 3.304 ± 0.175 3.276 ± 0.127 3.211 ± 0.259
18 3.311 ± 0.055 3.187 ± 0.038 3.240 ± 0.079 3.361 ± 0.038 3.239 ± 0.081 3.360 ± 0.045
24 3.295 ± 0.075 3.199 ± 0.049 3.150 ± 0.096 3.320 ± 0.059 3.249 ± 0.013 3.317 ± 0.021
30 3.293 ± 0.103 3.295 ± 0.095 3.258 ± 0.079 3.338 ± 0.040 3.351 ± 0.123 3.210 ± 0.020
Total Cell ( × 10
6 Cell/mL)
Media
Time
(hours)
G H I J K L
0 1.153 ± 0.315 1.108 ± 0.194 1.135 ± 0.035 1.235 ± 0.297 0.933 ± 0.230 1.168 ± 0.081
6 16.944 ± 0.294 14.888 ± 0.826 17.160 ± 2.794 24.736 ± 4.390 25.312 ± 2.534 23.584 ± 3.982
12 38.346 ± 7.572 35.626 ± 4.630 39.594 ± 1.281 44.100 ± 0.141 42.550 ± 1.485 42.350 ± 2.333
18 50.850 ± 0.354 41.800 ± 0.990 46.950 ± 15.486 47.000 ± 6.647 42.700 ± 8.344 50.450 ± 5.303
24 48.200 ± 2.121 49.950 ± 5.445 51.550 ± 9.970 47.800 ± 2.970 43.400 ± 3.111 49.250 ± 4.596
30 52.400 ± 8.344 56.700 ± 19.092 55.150 ± 6.152 46.150 ± 2.192 44.250 ± 1.061 46.050 ± 0.495
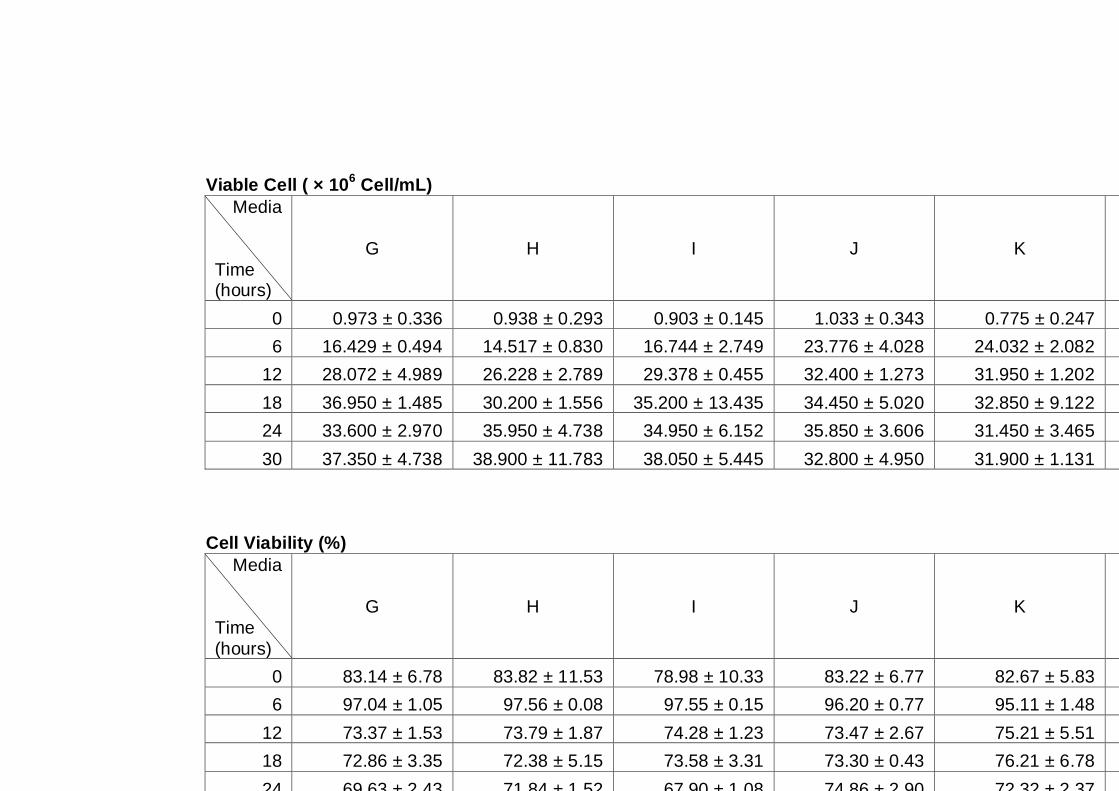
163
Viable Cell ( × 106 Cell/mL)
Media
Time (hours)
G H I J K L
0 0.973 ± 0.336 0.938 ± 0.293 0.903 ± 0.145 1.033 ± 0.343 0.775 ± 0.247 0.930 ± 0.170
6 16.429 ± 0.494 14.517 ± 0.830 16.744 ± 2.749 23.776 ± 4.028 24.032 ± 2.082 22.496 ± 3.620
12 28.072 ± 4.989 26.228 ± 2.789 29.378 ± 0.455 32.400 ± 1.273 31.950 ± 1.202 30.900 ± 2.828
18 36.950 ± 1.485 30.200 ± 1.556 35.200 ± 13.435 34.450 ± 5.020 32.850 ± 9.122 36.850 ± 7.707
24 33.600 ± 2.970 35.950 ± 4.738 34.950 ± 6.152 35.850 ± 3.606 31.450 ± 3.465 36.450 ± 4.879
30 37.350 ± 4.738 38.900 ± 11.783 38.050 ± 5.445 32.800 ± 4.950 31.900 ± 1.131 32.300 ± 3.253
Cell Viability (%)
Media
Time
(hours)
G H I J K L
0 83.14 ± 6.78 83.82 ± 11.53 78.98 ± 10.33 83.22 ± 6.77 82.67 ± 5.83 79.87 ± 9.66
6 97.04 ± 1.05 97.56 ± 0.08 97.55 ± 0.15 96.20 ± 0.77 95.11 ± 1.48 95.38 ± 0.64
12 73.37 ± 1.53 73.79 ± 1.87 74.28 ± 1.23 73.47 ± 2.67 75.21 ± 5.51 72.78 ± 2.71
18 72.86 ± 3.35 72.38 ± 5.15 73.58 ± 3.31 73.30 ± 0.43 76.21 ± 6.78 72.94 ± 8.03
24 69.63 ± 2.43 71.84 ± 1.52 67.90 ± 1.08 74.86 ± 2.90 72.32 ± 2.37 74.01 ± 2.91
30 71.48 ± 2.56 68.91 ± 2.45 68.93 ± 2.04 70.85 ± 7.71 71.93 ± 4.21 70.32 ± 6.26
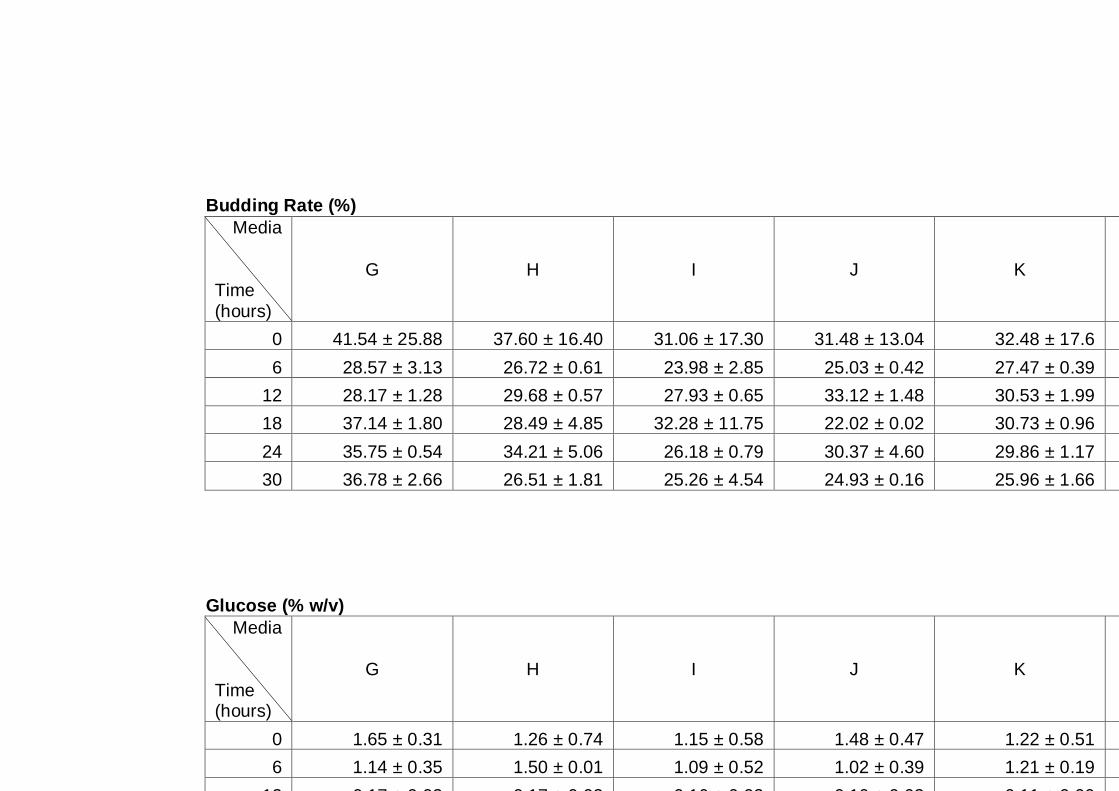
164
Budding Rate (%)
Media
Time
(hours)
G H I J K L
0 41.54 ± 25.88 37.60 ± 16.40 31.06 ± 17.30 31.48 ± 13.04 32.48 ± 17.6 31.78 ± 20.01
6 28.57 ± 3.13 26.72 ± 0.61 23.98 ± 2.85 25.03 ± 0.42 27.47 ± 0.39 25.58 ± 0.97
12 28.17 ± 1.28 29.68 ± 0.57 27.93 ± 0.65 33.12 ± 1.48 30.53 ± 1.99 29.47 ± 0.16
18 37.14 ± 1.80 28.49 ± 4.85 32.28 ± 11.75 22.02 ± 0.02 30.73 ± 0.96 26.10 ± 2.52
24 35.75 ± 0.54 34.21 ± 5.06 26.18 ± 0.79 30.37 ± 4.60 29.86 ± 1.17 25.98 ± 3.42
30 36.78 ± 2.66 26.51 ± 1.81 25.26 ± 4.54 24.93 ± 0.16 25.96 ± 1.66 24.76 ± 3.78
Glucose (% w/v)
Media
Time (hours)
G H I J K L
0 1.65 ± 0.31 1.26 ± 0.74 1.15 ± 0.58 1.48 ± 0.47 1.22 ± 0.51 1.06 ± 0.60
6 1.14 ± 0.35 1.50 ± 0.01 1.09 ± 0.52 1.02 ± 0.39 1.21 ± 0.19 0.92 ± 0.43
12 0.17 ± 0.02 0.17 ± 0.02 0.16 ± 0.02 0.10 ± 0.03 0.11 ± 0.00 0.11 ± 0.03
18 0.00 ± 0.00 0.00 ± 0.00 0.00 ± 0.00 0.00 ± 0.00 0.00 ± 0.00 0.00 ± 0.00
24 0.00 ± 0.00 0.00 ± 0.00 0.00 ± 0.00 0.00 ± 0.00 0.00 ± 0.00 0.00 ± 0.00
30 0.00 ± 0.00 0.00 ± 0.00 0.00 ± 0.00 0.00 ± 0.00 0.00 ± 0.00 0.00 ± 0.00
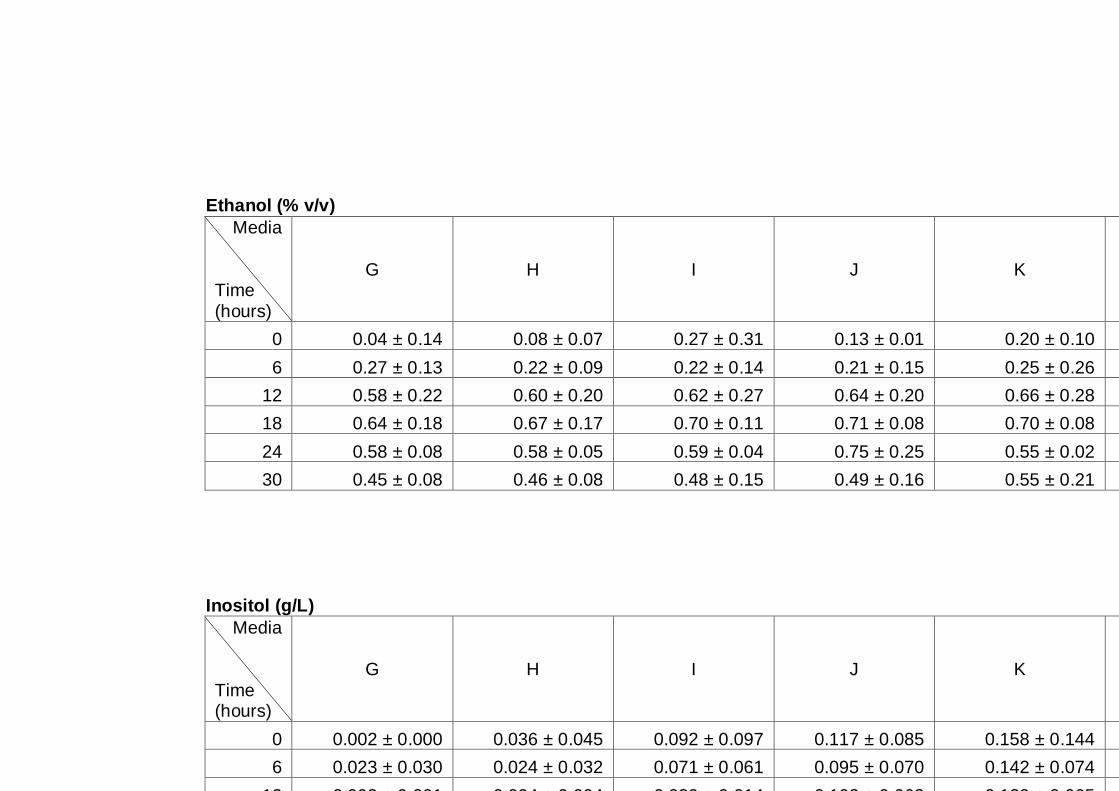
165
Ethanol (% v/v)
Media
Time
(hours)
G H I J K L
0 0.04 ± 0.14 0.08 ± 0.07 0.27 ± 0.31 0.13 ± 0.01 0.20 ± 0.10 0.26 ± 0.14
6 0.27 ± 0.13 0.22 ± 0.09 0.22 ± 0.14 0.21 ± 0.15 0.25 ± 0.26 0.16 ± 0.21
12 0.58 ± 0.22 0.60 ± 0.20 0.62 ± 0.27 0.64 ± 0.20 0.66 ± 0.28 0.60 ± 0.32
18 0.64 ± 0.18 0.67 ± 0.17 0.70 ± 0.11 0.71 ± 0.08 0.70 ± 0.08 0.67 ± 0.12
24 0.58 ± 0.08 0.58 ± 0.05 0.59 ± 0.04 0.75 ± 0.25 0.55 ± 0.02 0.53 ± 0.07
30 0.45 ± 0.08 0.46 ± 0.08 0.48 ± 0.15 0.49 ± 0.16 0.55 ± 0.21 0.51 ± 0.15
Inositol (g/L)
Media
Time (hours)
G H I J K L
0 0.002 ± 0.000 0.036 ± 0.045 0.092 ± 0.097 0.117 ± 0.085 0.158 ± 0.144 0.116 ± 0.093
6 0.023 ± 0.030 0.024 ± 0.032 0.071 ± 0.061 0.095 ± 0.070 0.142 ± 0.074 0.204 ± 0.197
12 0.003 ± 0.001 0.004 ± 0.004 0.039 ± 0.014 0.102 ± 0.062 0.129 ± 0.065 0.170 ± 0.068
18 0.002 ± 0.001 0.004 ± 0.003 0.041 ± 0.011 0.110 ± 0.063 0.166 ± 0.097 0.186 ± 0.084
24 0.003 ± 0.002 0.004 ± 0.003 0.039 ± 0.006 0.087 ± 0.029 0.143 ± 0.051 0.169 ± 0.038
30 0.002 ± 0.000 0.002 ± 0.000 0.037 ± 0.005 0.077 ± 0.002 0.141 ± 0.046 0.164 ± 0.032
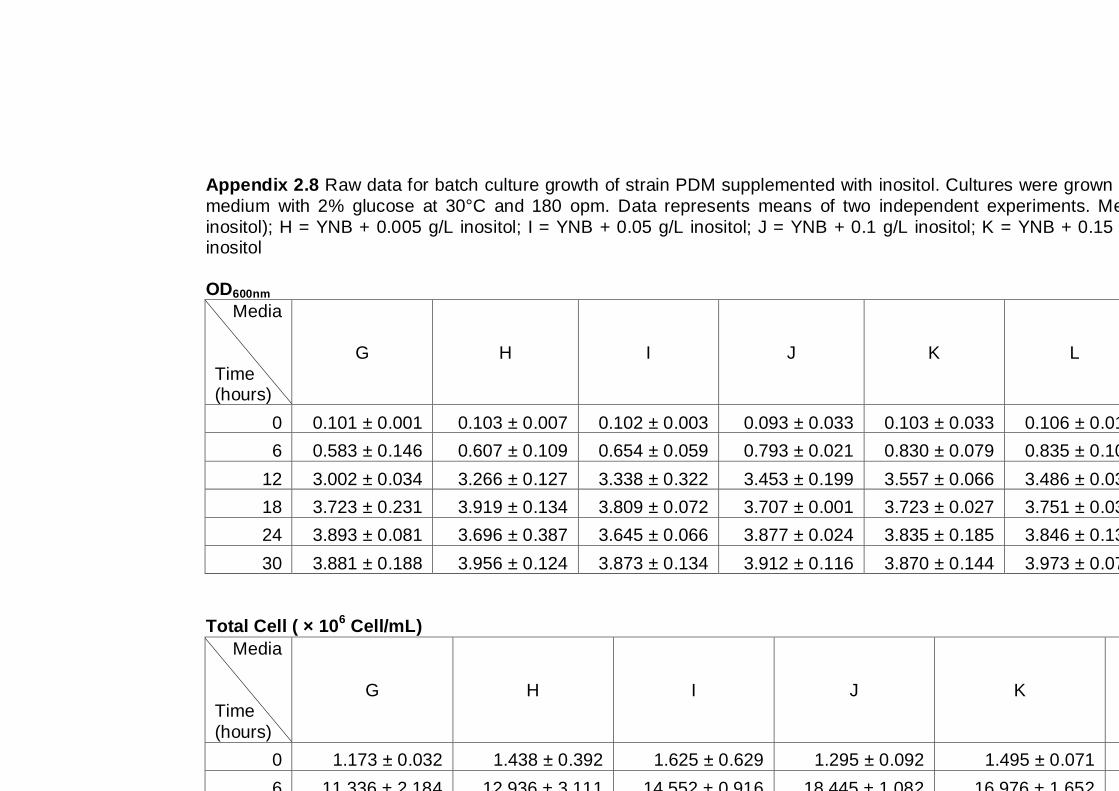
166
Appendix 2.8 Raw data for batch culture growth of strain PDM supplemented with inositol. Cultures were grown under aerobic condition in YNB
medium with 2% glucose at 30°C and 180 opm. Data represents means of two independent experiments. Media: G = YNB (with 0.002 g/L
inositol); H = YNB + 0.005 g/L inositol; I = YNB + 0.05 g/L inositol; J = YNB + 0.1 g/L inositol; K = YNB + 0.15 g/L inositol ; L = YNB + 0.2 g/L inositol
OD600nm
Media
Time (hours)
G H I J K L
0 0.101 ± 0.001 0.103 ± 0.007 0.102 ± 0.003 0.093 ± 0.033 0.103 ± 0.033 0.106 ± 0.011
6 0.583 ± 0.146 0.607 ± 0.109 0.654 ± 0.059 0.793 ± 0.021 0.830 ± 0.079 0.835 ± 0.103
12 3.002 ± 0.034 3.266 ± 0.127 3.338 ± 0.322 3.453 ± 0.199 3.557 ± 0.066 3.486 ± 0.037
18 3.723 ± 0.231 3.919 ± 0.134 3.809 ± 0.072 3.707 ± 0.001 3.723 ± 0.027 3.751 ± 0.038
24 3.893 ± 0.081 3.696 ± 0.387 3.645 ± 0.066 3.877 ± 0.024 3.835 ± 0.185 3.846 ± 0.136
30 3.881 ± 0.188 3.956 ± 0.124 3.873 ± 0.134 3.912 ± 0.116 3.870 ± 0.144 3.973 ± 0.075
Total Cell ( × 10
6 Cell/mL)
Media
Time
(hours)
G H I J K L
0 1.173 ± 0.032 1.438 ± 0.392 1.625 ± 0.629 1.295 ± 0.092 1.495 ± 0.071 1.545 ± 0.318
6 11.336 ± 2.184 12.936 ± 3.111 14.552 ± 0.916 18.445 ± 1.082 16.976 ± 1.652 21.496 ± 2.048
12 71.400 ± 6.788 63.050 ± 5.020 65.800 ± 6.364 68.600 ± 4.243 64.000 ± 5.091 60.100 ± 1.980
18 73.700 ± 13.011 76.400 ± 9.334 64.700 ± 3.253 60.200 ± 1.556 61.600 ± 2.970 62.150 ± 10.819
24 76.000 ± 10.889 85.100 ± 3.960 59.600 ± 0.849 75.750 ± 17.748 64.100 ± 1.414 65.200 ± 9.758
30 73.500 ± 6.081 87.850 ± 13.506 73.100 ± 7.071 86.000 ± 5.233 87.500 ± 16.546 85.250 ± 8.697
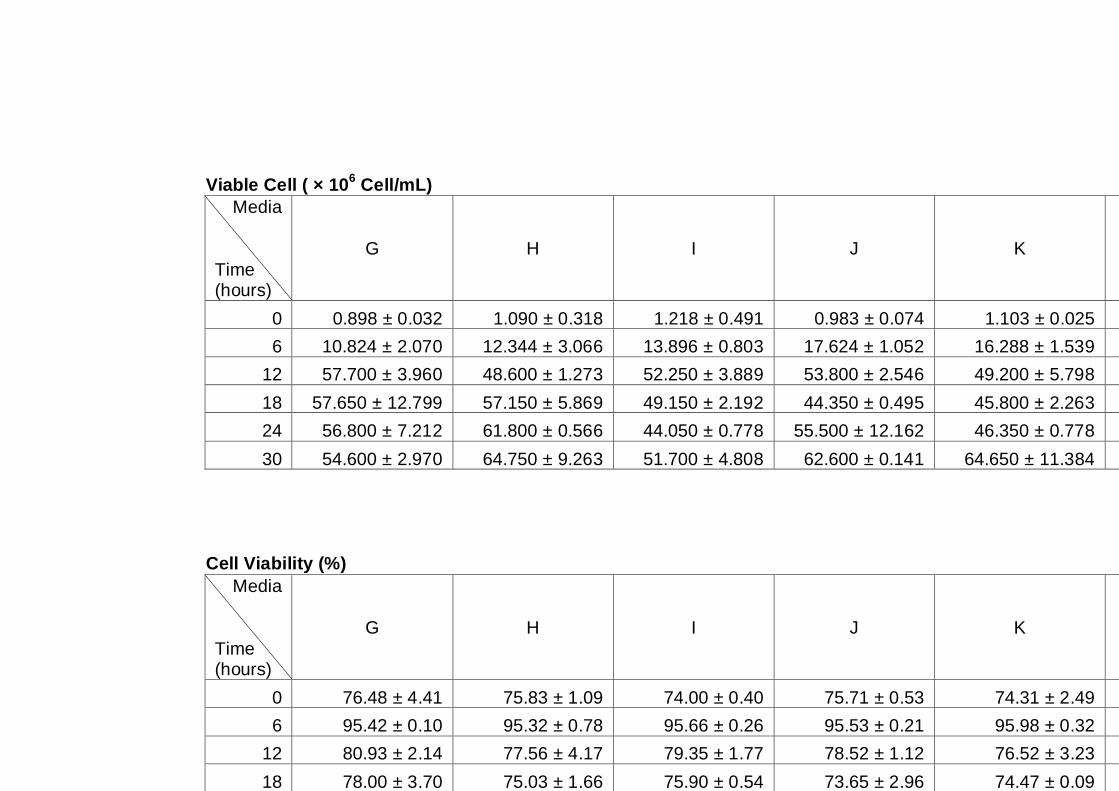
167
Viable Cell ( × 106 Cell/mL)
Media
Time (hours)
G H I J K L
0 0.898 ± 0.032 1.090 ± 0.318 1.218 ± 0.491 0.983 ± 0.074 1.103 ± 0.025 1.125 ± 0.191
6 10.824 ± 2.070 12.344 ± 3.066 13.896 ± 0.803 17.624 ± 1.052 16.288 ± 1.539 20.744 ± 2.070
12 57.700 ± 3.960 48.600 ± 1.273 52.250 ± 3.889 53.800 ± 2.546 49.200 ± 5.798 46.900 ± 1.273
18 57.650 ± 12.799 57.150 ± 5.869 49.150 ± 2.192 44.350 ± 0.495 45.800 ± 2.263 46.450 ± 6.859
24 56.800 ± 7.212 61.800 ± 0.566 44.050 ± 0.778 55.500 ± 12.162 46.350 ± 0.778 50.150 ± 9.405
30 54.600 ± 2.970 64.750 ± 9.263 51.700 ± 4.808 62.600 ± 0.141 64.650 ± 11.384 61.600 ± 7.495
Cell Viability (%)
Media
Time (hours)
G H I J K L
0 76.48 ± 4.41 75.83 ± 1.09 74.00 ± 0.40 75.71 ± 0.53 74.31 ± 2.49 73.20 ± 2.72
6 95.42 ± 0.10 95.32 ± 0.78 95.66 ± 0.26 95.53 ± 0.21 95.98 ± 0.32 96.56 ± 0.58
12 80.93 ± 2.14 77.56 ± 4.17 79.35 ± 1.77 78.52 ± 1.12 76.52 ± 3.23 78.16 ± 0.10
18 78.00 ± 3.70 75.03 ± 1.66 75.90 ± 0.54 73.65 ± 2.96 74.47 ± 0.09 75.04 ± 1.69
24 74.76 ± 1.05 72.70 ± 2.77 73.96 ± 0.07 73.39 ± 1.20 72.43 ± 2.88 76.79 ± 2.92
30 74.43 ± 2.06 73.65 ± 0.46 70.75 ± 0.29 72.89 ± 4.55 73.94 ± 0.80 72.23 ± 1.48
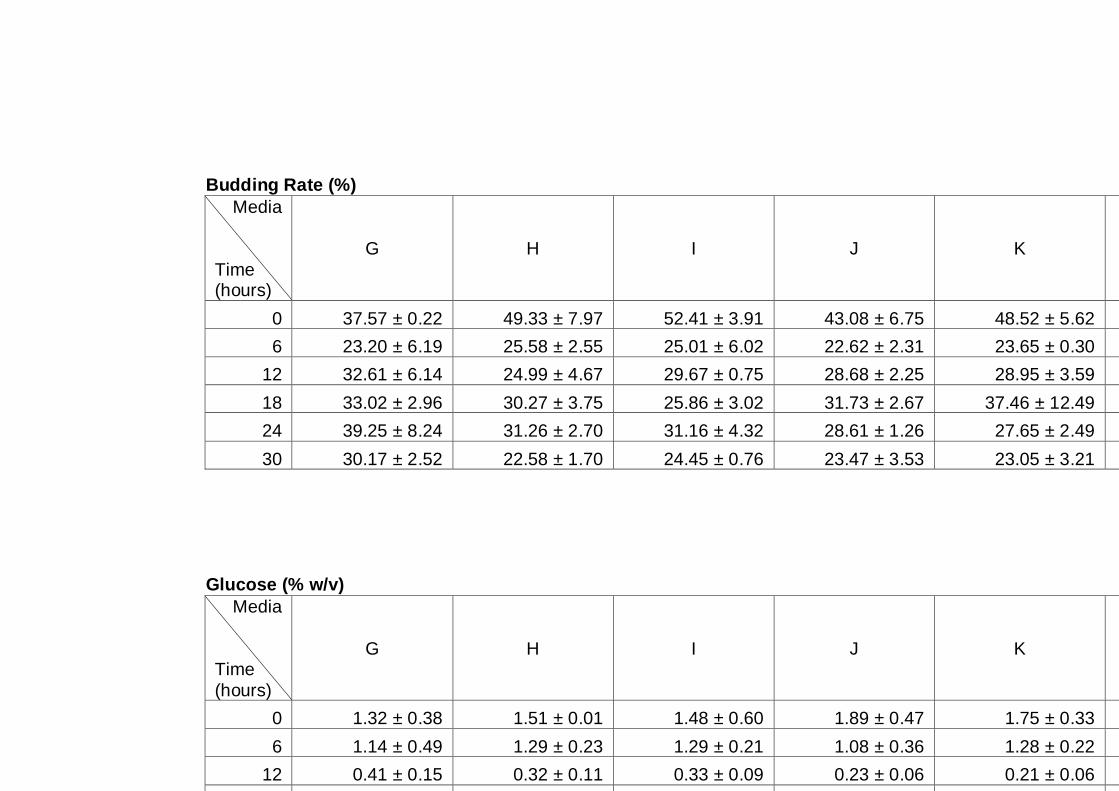
168
Budding Rate (%)
Media
Time (hours)
G H I J K L
0 37.57 ± 0.22 49.33 ± 7.97 52.41 ± 3.91 43.08 ± 6.75 48.52 ± 5.62 48.44 ± 8.30
6 23.20 ± 6.19 25.58 ± 2.55 25.01 ± 6.02 22.62 ± 2.31 23.65 ± 0.30 25.07 ± 2.46
12 32.61 ± 6.14 24.99 ± 4.67 29.67 ± 0.75 28.68 ± 2.25 28.95 ± 3.59 26.73 ± 1.89
18 33.02 ± 2.96 30.27 ± 3.75 25.86 ± 3.02 31.73 ± 2.67 37.46 ± 12.49 32.34 ± 8.39
24 39.25 ± 8.24 31.26 ± 2.70 31.16 ± 4.32 28.61 ± 1.26 27.65 ± 2.49 25.75 ± 1.22
30 30.17 ± 2.52 22.58 ± 1.70 24.45 ± 0.76 23.47 ± 3.53 23.05 ± 3.21 23.99 ± 2.45
Glucose (% w/v)
Media
Time
(hours)
G H I J K L
0 1.32 ± 0.38 1.51 ± 0.01 1.48 ± 0.60 1.89 ± 0.47 1.75 ± 0.33 1.28 ± 0.10
6 1.14 ± 0.49 1.29 ± 0.23 1.29 ± 0.21 1.08 ± 0.36 1.28 ± 0.22 1.30 ± 0.19
12 0.41 ± 0.15 0.32 ± 0.11 0.33 ± 0.09 0.23 ± 0.06 0.21 ± 0.06 0.23 ± 0.09
18 0.00 ± 0.00 0.00 ± 0.00 0.00 ± 0.00 0.00 ± 0.00 0.00 ± 0.00 0.00 ± 0.00
24 0.00 ± 0.00 0.00 ± 0.00 0.00 ± 0.00 0.00 ± 0.00 0.00 ± 0.00 0.00 ± 0.00
30 0.00 ± 0.00 0.00 ± 0.00 0.00 ± 0.00 0.00 ± 0.00 0.00 ± 0.00 0.00 ± 0.00
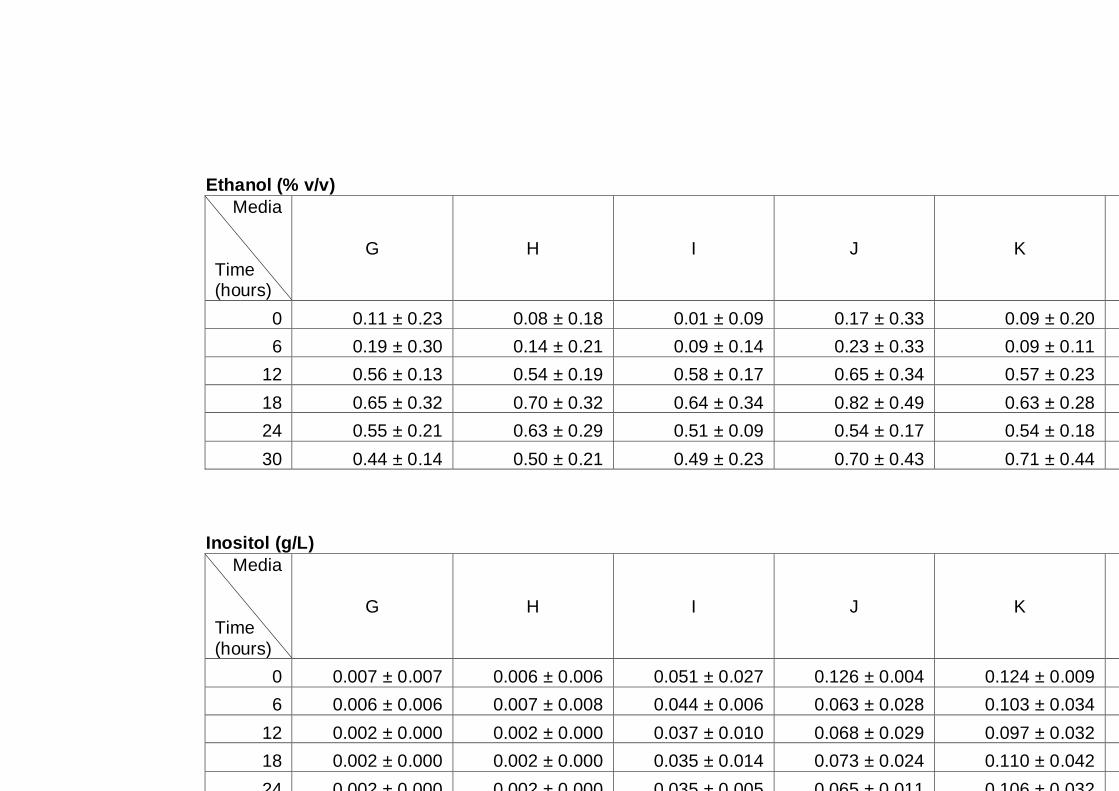
169
Ethanol (% v/v)
Media
Time (hours)
G H I J K L
0 0.11 ± 0.23 0.08 ± 0.18 0.01 ± 0.09 0.17 ± 0.33 0.09 ± 0.20 0.08 ± 0.19
6 0.19 ± 0.30 0.14 ± 0.21 0.09 ± 0.14 0.23 ± 0.33 0.09 ± 0.11 0.14 ± 0.17
12 0.56 ± 0.13 0.54 ± 0.19 0.58 ± 0.17 0.65 ± 0.34 0.57 ± 0.23 0.61 ± 0.30
18 0.65 ± 0.32 0.70 ± 0.32 0.64 ± 0.34 0.82 ± 0.49 0.63 ± 0.28 0.64 ± 0.24
24 0.55 ± 0.21 0.63 ± 0.29 0.51 ± 0.09 0.54 ± 0.17 0.54 ± 0.18 0.56 ± 0.22
30 0.44 ± 0.14 0.50 ± 0.21 0.49 ± 0.23 0.70 ± 0.43 0.71 ± 0.44 0.48 ± 0.17
Inositol (g/L)
Media
Time
(hours)
G H I J K L
0 0.007 ± 0.007 0.006 ± 0.006 0.051 ± 0.027 0.126 ± 0.004 0.124 ± 0.009 0.112 ± 0.032
6 0.006 ± 0.006 0.007 ± 0.008 0.044 ± 0.006 0.063 ± 0.028 0.103 ± 0.034 0.133 ± 0.047
12 0.002 ± 0.000 0.002 ± 0.000 0.037 ± 0.010 0.068 ± 0.029 0.097 ± 0.032 0.144 ± 0.066
18 0.002 ± 0.000 0.002 ± 0.000 0.035 ± 0.014 0.073 ± 0.024 0.110 ± 0.042 0.155 ± 0.057
24 0.002 ± 0.000 0.002 ± 0.000 0.035 ± 0.005 0.065 ± 0.011 0.106 ± 0.032 0.151 ± 0.048
30 0.002 ± 0.000 0.002 ± 0.000 0.035 ± 0.013 0.075 ± 0.024 0.111 ± 0.024 0.150 ± 0.044

170
Appendix 2.9 Raw data for batch culture growth of strain K7 supplemented with inositol. Cultures were grown under aerobic condition in YNB
medium with 2% glucose at 30°C and 180 opm. Data represents means of two independent experiments. Media: G = YNB (with 0.002 g/L
inositol); H = YNB + 0.005 g/L inositol; I = YNB + 0.05 g/L inositol; J = YNB + 0.1 g/L inositol; K = YNB + 0.15 g/L inositol ; L = YNB + 0.2 g/L inositol
OD600nm
Media
Time (hours)
G H I J K L
0 0.105 ± 0.001 0.100 ± 0.014 0.099 ± 0.013 0.104 ± 0.011 0.120 ± 0.011 0.108 ± 0.000
6 0.522 ± 0.017 0.466 ± 0.085 0.461 ± 0.134 0.570 ± 0.025 0.625 ± 0.007 0.575 ± 0.086
12 2.740 ± 0.164 2.711 ± 0.098 2.868 ± 0.088 2.952 ± 0.458 3.038 ± 0.141 3.150 ± 0.156
18 4.630 ± 0.068 4.160 ± 0.492 4.700 ± 0.311 4.634 ± 0.042 4.648 ± 0.566 4.623 ± 0.007
24 4.656 ± 0.122 4.593 ± 0.055 4.602 ± 0.359 4.945 ± 0.086 4.971 ± 0.256 4.922 ± 0.170
30 4.800 ± 0.181 4.902 ± 0.410 4.908 ± 0.105 5.133 ± 0.075 5.055 ± 0.225 4.862 ± 0.003
Total Cell ( × 10
6 Cell/mL)
Media
Time
(hours)
G H I J K L
0 0.978 ± 0.046 1.145 ± 0.141 1.243 ± 0.279 1.065 ± 0.014 1.145 ± 0.021 1.095 ± 0.424
6 8.907 ± 1.229 9.312 ± 0.996 8.630 ± 2.367 11.941 ± 1.094 12.011 ± 1.961 15.672 ± 4.582
12 46.150 ± 3.748 44.350 ± 3.041 46.200 ± 1.556 47.050 ± 12.657 37.000 ± 15.415 47.900 ± 0.990
18 48.950 ± 4.313 55.500 ± 3.111 50.950 ± 7.849 49.950 ± 2.192 53.650 ± 11.809 45.550 ± 5.303
24 53.550 ± 2.616 51.900 ± 8.627 53.400 ± 0.566 66.200 ± 5.657 60.350 ± 0.778 61.750 ± 12.516
30 61.550 ± 6.859 54.750 ± 3.323 64.100 ± 7.354 65.150 ± 6.293 63.100 ± 5.940 51.050 ± 0.919
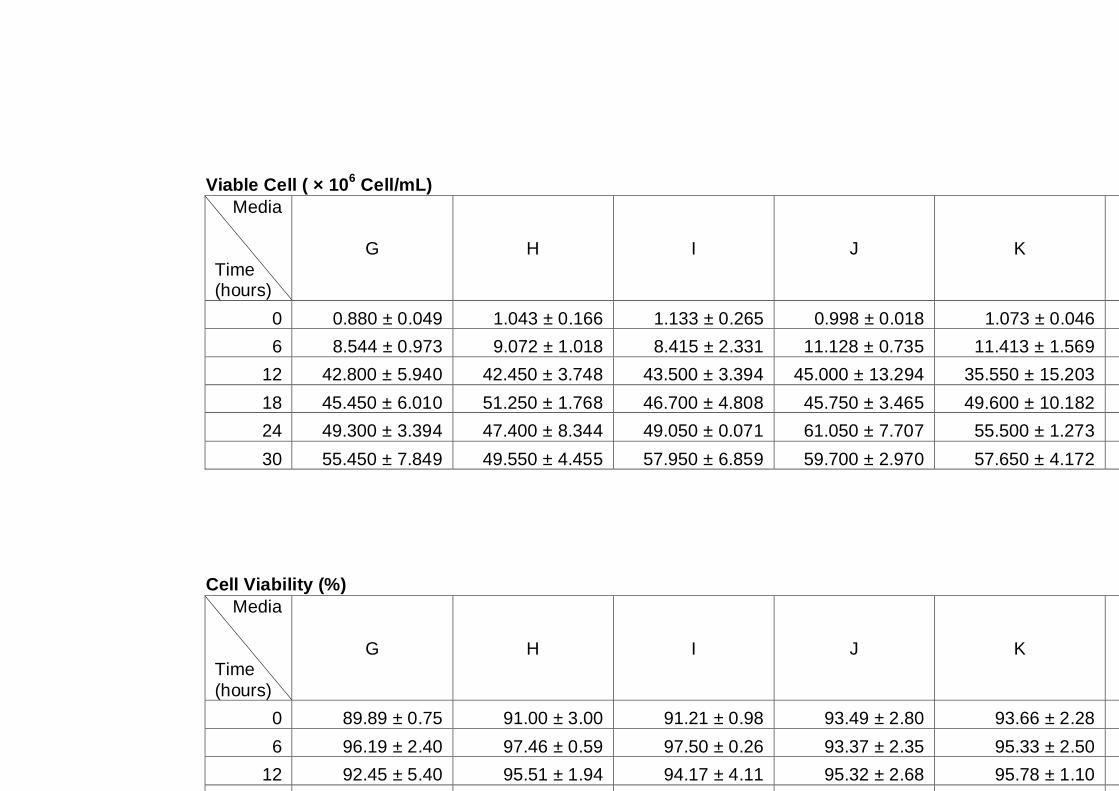
171
Viable Cell ( × 106 Cell/mL)
Media
Time (hours)
G H I J K L
0 0.880 ± 0.049 1.043 ± 0.166 1.133 ± 0.265 0.998 ± 0.018 1.073 ± 0.046 1.005 ± 0.407
6 8.544 ± 0.973 9.072 ± 1.018 8.415 ± 2.331 11.128 ± 0.735 11.413 ± 1.569 13.616 ± 2.647
12 42.800 ± 5.940 42.450 ± 3.748 43.500 ± 3.394 45.000 ± 13.294 35.550 ± 15.203 45.600 ± 1.838
18 45.450 ± 6.010 51.250 ± 1.768 46.700 ± 4.808 45.750 ± 3.465 49.600 ± 10.182 42.100 ± 5.515
24 49.300 ± 3.394 47.400 ± 8.344 49.050 ± 0.071 61.050 ± 7.707 55.500 ± 1.273 57.500 ± 13.011
30 55.450 ± 7.849 49.550 ± 4.455 57.950 ± 6.859 59.700 ± 2.970 57.650 ± 4.172 47.150 ± 0.495
Cell Viability (%)
Media
Time
(hours)
G H I J K L
0 89.89 ± 0.75 91.00 ± 3.00 91.21 ± 0.98 93.49 ± 2.80 93.66 ± 2.28 90.85 ± 3.48
6 96.19 ± 2.40 97.46 ± 0.59 97.50 ± 0.26 93.37 ± 2.35 95.33 ± 2.50 88.21 ± 8.80
12 92.45 ± 5.40 95.51 ± 1.94 94.17 ± 4.11 95.32 ± 2.68 95.78 ± 1.10 95.20 ± 1.84
18 92.68 ± 4.21 92.36 ± 2.04 92.08 ± 4.70 91.56 ± 2.98 92.71 ± 1.45 92.29 ± 1.50
24 91.94 ± 1.70 91.27 ± 1.09 91.94 ± 1.24 92.16 ± 3.65 91.94 ± 3.25 92.97 ± 2.21
30 89.87 ± 2.66 90.46 ± 2.64 90.35 ± 0.35 91.77 ± 4.41 91.43 ± 1.94 92.45 ± 2.62
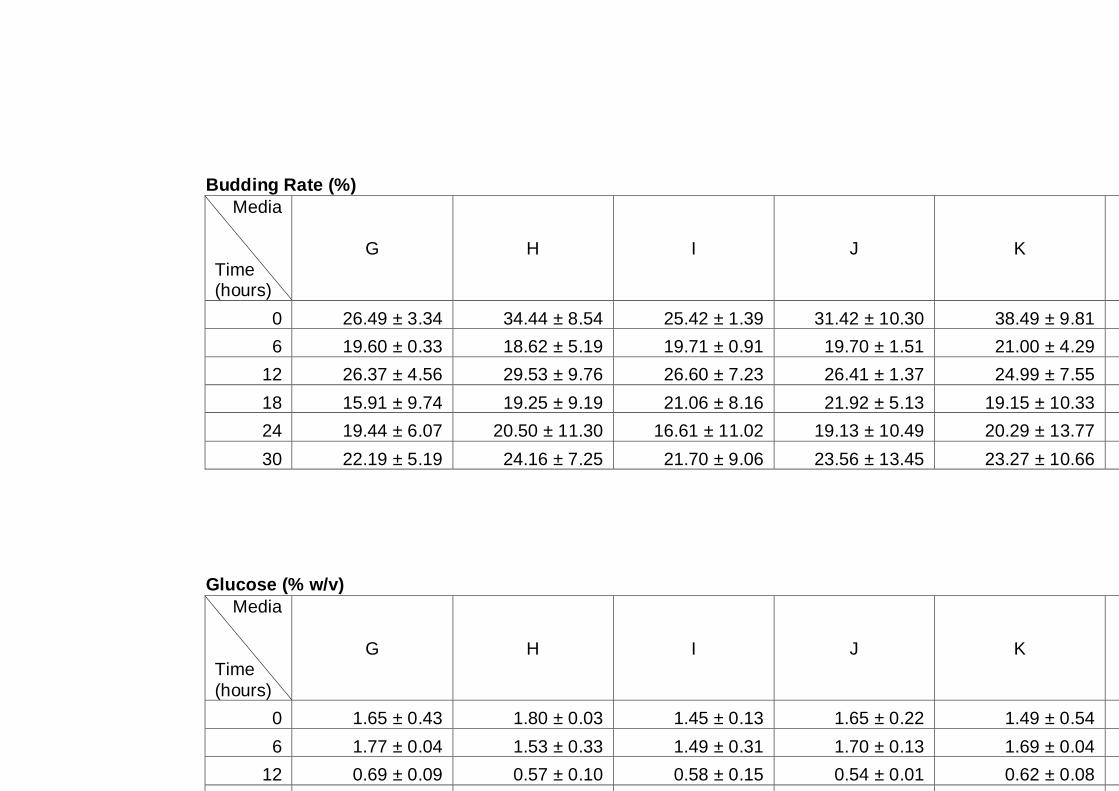
172
Budding Rate (%)
Media
Time (hours)
G H I J K L
0 26.49 ± 3.34 34.44 ± 8.54 25.42 ± 1.39 31.42 ± 10.30 38.49 ± 9.81 28.94 ± 6.66
6 19.60 ± 0.33 18.62 ± 5.19 19.71 ± 0.91 19.70 ± 1.51 21.00 ± 4.29 22.51 ± 1.36
12 26.37 ± 4.56 29.53 ± 9.76 26.60 ± 7.23 26.41 ± 1.37 24.99 ± 7.55 24.14 ± 2.78
18 15.91 ± 9.74 19.25 ± 9.19 21.06 ± 8.16 21.92 ± 5.13 19.15 ± 10.33 21.65 ± 9.39
24 19.44 ± 6.07 20.50 ± 11.30 16.61 ± 11.02 19.13 ± 10.49 20.29 ± 13.77 20.94 ± 7.28
30 22.19 ± 5.19 24.16 ± 7.25 21.70 ± 9.06 23.56 ± 13.45 23.27 ± 10.66 25.03 ± 9.08
Glucose (% w/v)
Media
Time
(hours)
G H I J K L
0 1.65 ± 0.43 1.80 ± 0.03 1.45 ± 0.13 1.65 ± 0.22 1.49 ± 0.54 1.85 ± 0.01
6 1.77 ± 0.04 1.53 ± 0.33 1.49 ± 0.31 1.70 ± 0.13 1.69 ± 0.04 1.68 ± 0.06
12 0.69 ± 0.09 0.57 ± 0.10 0.58 ± 0.15 0.54 ± 0.01 0.62 ± 0.08 0.64 ± 0.12
18 0.00 ± 0.01 0.00 ± 0.00 0.00 ± 0.00 0.00 ± 0.00 0.00 ± 0.00 0.00 ± 0.00
24 0.00 ± 0.00 0.00 ± 0.00 0.00 ± 0.00 0.00 ± 0.00 0.00 ± 0.00 0.00 ± 0.00
30 0.00 ± 0.00 0.00 ± 0.00 0.00 ± 0.00 0.00 ± 0.00 0.00 ± 0.00 0.00 ± 0.00
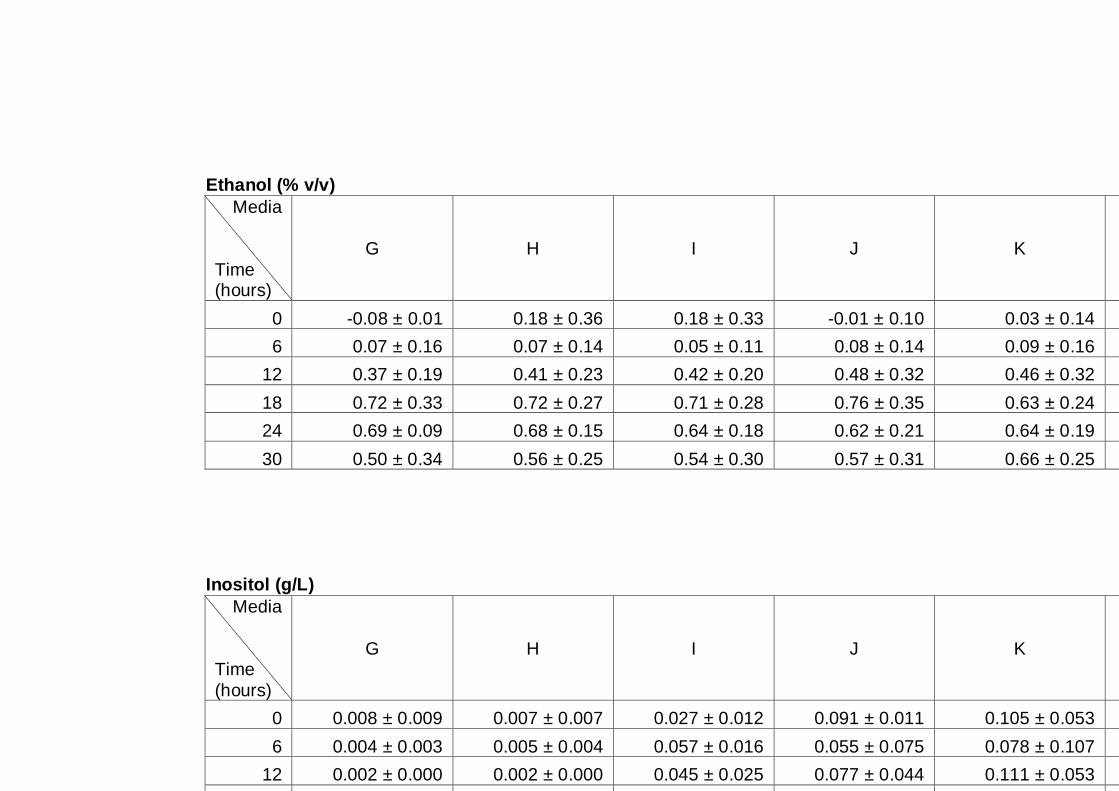
173
Ethanol (% v/v)
Media
Time (hours)
G H I J K L
0 -0.08 ± 0.01 0.18 ± 0.36 0.18 ± 0.33 -0.01 ± 0.10 0.03 ± 0.14 0.03 ± 0.18
6 0.07 ± 0.16 0.07 ± 0.14 0.05 ± 0.11 0.08 ± 0.14 0.09 ± 0.16 0.06 ± 0. 12
12 0.37 ± 0.19 0.41 ± 0.23 0.42 ± 0.20 0.48 ± 0.32 0.46 ± 0.32 0.44 ± 0.24
18 0.72 ± 0.33 0.72 ± 0.27 0.71 ± 0.28 0.76 ± 0.35 0.63 ± 0.24 0.66 ± 0.25
24 0.69 ± 0.09 0.68 ± 0.15 0.64 ± 0.18 0.62 ± 0.21 0.64 ± 0.19 0.60 ± 0.18
30 0.50 ± 0.34 0.56 ± 0.25 0.54 ± 0.30 0.57 ± 0.31 0.66 ± 0.25 0.61 ± 0.29
Inositol (g/L)
Media
Time
(hours)
G H I J K L
0 0.008 ± 0.009 0.007 ± 0.007 0.027 ± 0.012 0.091 ± 0.011 0.105 ± 0.053 0.183 ± 0.006
6 0.004 ± 0.003 0.005 ± 0.004 0.057 ± 0.016 0.055 ± 0.075 0.078 ± 0.107 0.191 ± 0.020
12 0.002 ± 0.000 0.002 ± 0.000 0.045 ± 0.025 0.077 ± 0.044 0.111 ± 0.053 0.144 ± 0.054
18 0.002 ± 0.000 0.002 ± 0.000 0.041 ± 0.019 0.079 ± 0.030 0.110 ± 0.049 0.148 ± 0.057
24 0.002 ± 0.000 0.002 ± 0.000 0.039 ± 0.015 0.073 ± 0.024 0.109 ± 0.032 0.137 ± 0.044
30 0.002 ± 0.000 0.002 ± 0.000 0.036 ± 0.021 0.069 ± 0.026 0.108 ± 0.032 0.137 ± 0.058
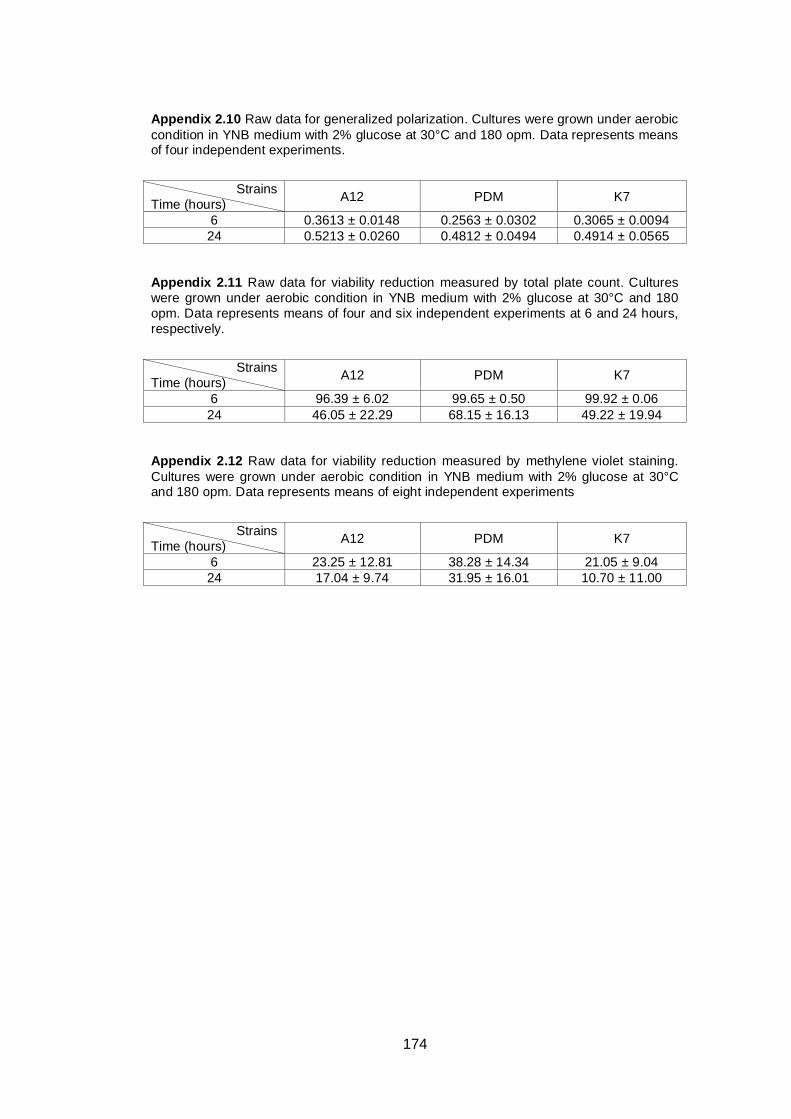
174
Appendix 2.10 Raw data for generalized polarization. Cultures were grown under aerobic
condition in YNB medium with 2% glucose at 30°C and 180 opm. Data represents means of four independent experiments.
Strains
Time (hours) A12 PDM K7
6 0.3613 ± 0.0148 0.2563 ± 0.0302 0.3065 ± 0.0094
24 0.5213 ± 0.0260 0.4812 ± 0.0494 0.4914 ± 0.0565
Appendix 2.11 Raw data for viability reduction measured by total plate count. Cultures
were grown under aerobic condition in YNB medium with 2% glucose at 30°C and 180
opm. Data represents means of four and six independent experiments at 6 and 24 hours,
respectively.
Strains
Time (hours) A12 PDM K7
6 96.39 ± 6.02 99.65 ± 0.50 99.92 ± 0.06
24 46.05 ± 22.29 68.15 ± 16.13 49.22 ± 19.94
Appendix 2.12 Raw data for viability reduction measured by methylene violet staining.
Cultures were grown under aerobic condition in YNB medium with 2% glucose at 30°C and 180 opm. Data represents means of eight independent experiments
Strains
Time (hours) A12 PDM K7
6 23.25 ± 12.81 38.28 ± 14.34 21.05 ± 9.04
24 17.04 ± 9.74 31.95 ± 16.01 10.70 ± 11.00
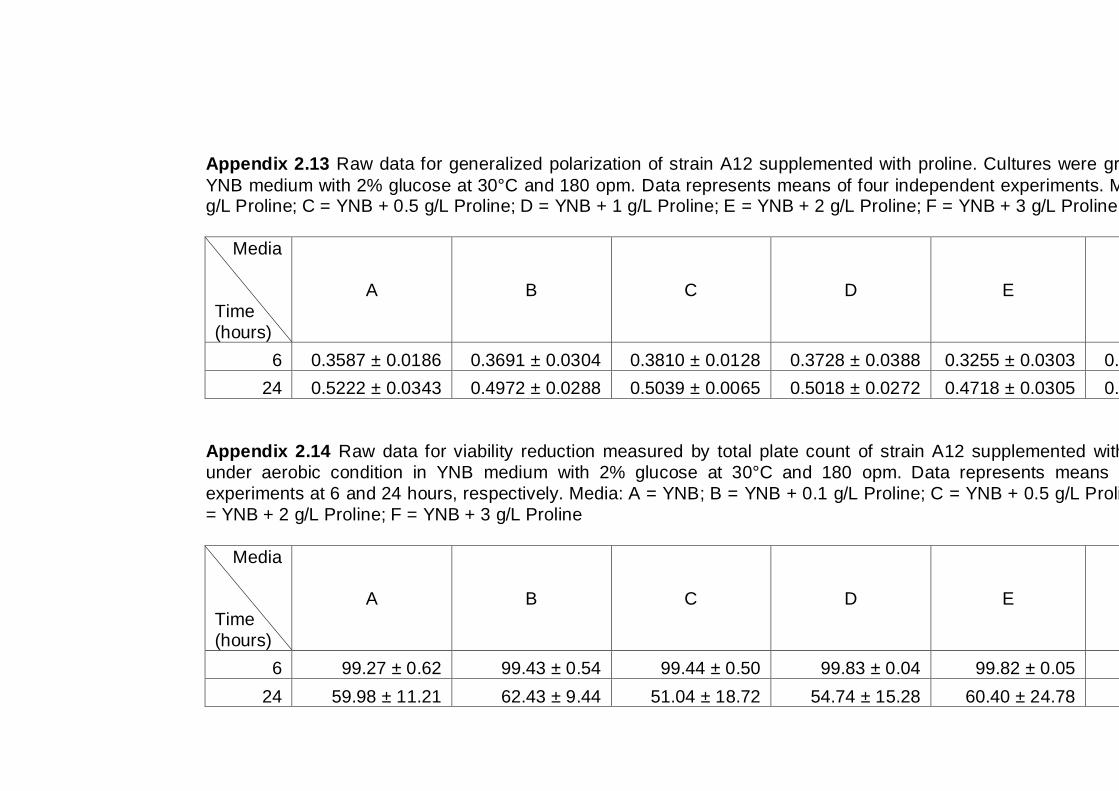
175
Appendix 2.13 Raw data for generalized polarization of strain A12 supplemented with proline. Cultures were grown under aerobic condition in
YNB medium with 2% glucose at 30°C and 180 opm. Data represents means of four independent experiments. Media: A = YNB; B = YNB + 0.1 g/L Proline; C = YNB + 0.5 g/L Proline; D = YNB + 1 g/L Proline; E = YNB + 2 g/L Proline; F = YNB + 3 g/L Proline
Media
Time
(hours)
A B C D E F
6 0.3587 ± 0.0186 0.3691 ± 0.0304 0.3810 ± 0.0128 0.3728 ± 0.0388 0.3255 ± 0.0303 0.3388 ± 0.0172
24 0.5222 ± 0.0343 0.4972 ± 0.0288 0.5039 ± 0.0065 0.5018 ± 0.0272 0.4718 ± 0.0305 0.4689 ± 0.0381
Appendix 2.14 Raw data for viability reduction measured by total plate count of strain A12 supplemented with proline. Cultures were grown
under aerobic condition in YNB medium with 2% glucose at 30°C and 180 opm. Data represents means of two and three independent
experiments at 6 and 24 hours, respectively. Media: A = YNB; B = YNB + 0.1 g/L Proline; C = YNB + 0.5 g/L Proline; D = YNB + 1 g/L Proline; E
= YNB + 2 g/L Proline; F = YNB + 3 g/L Proline
Media
Time
(hours)
A B C D E F
6 99.27 ± 0.62 99.43 ± 0.54 99.44 ± 0.50 99.83 ± 0.04 99.82 ± 0.05 99.77 ± 0.09
24 59.98 ± 11.21 62.43 ± 9.44 51.04 ± 18.72 54.74 ± 15.28 60.40 ± 24.78 69.81 ± 11.91
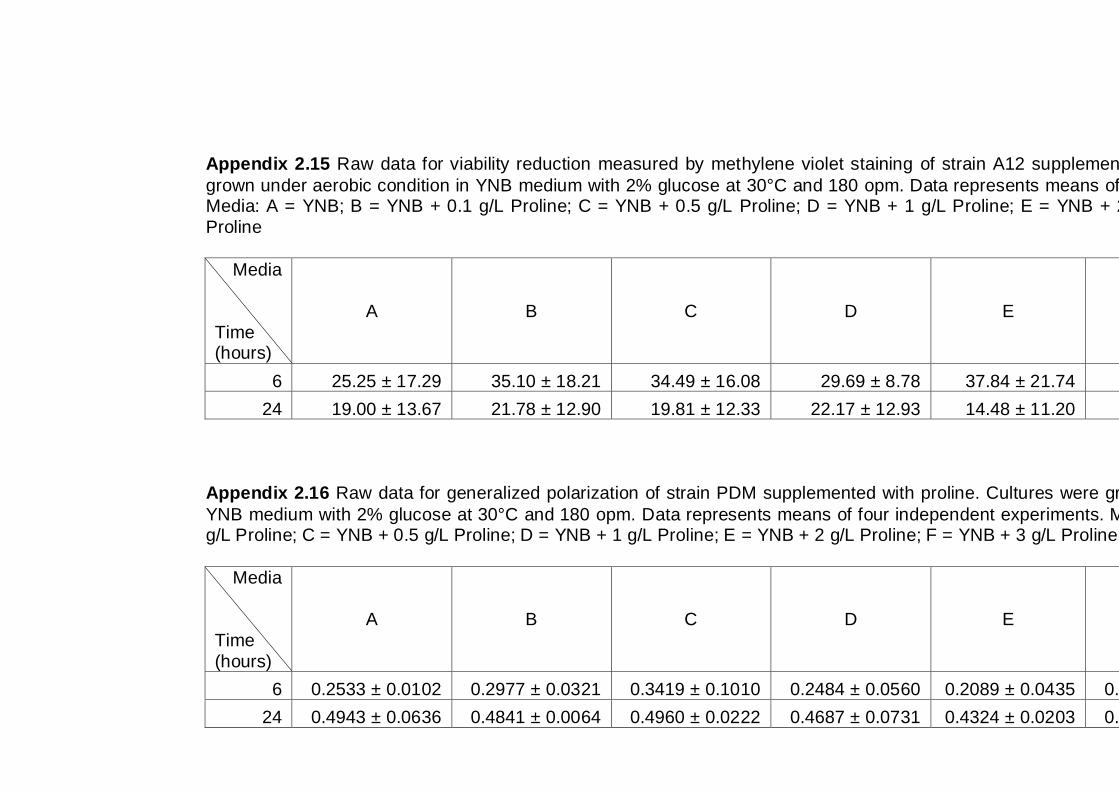
176
Appendix 2.15 Raw data for viability reduction measured by methylene violet staining of strain A12 supplemented with proline. Cultures were
grown under aerobic condition in YNB medium with 2% glucose at 30°C and 180 opm. Data represents means of four independent experiments. Media: A = YNB; B = YNB + 0.1 g/L Proline; C = YNB + 0.5 g/L Proline; D = YNB + 1 g/L Proline; E = YNB + 2 g/L Proline; F = YNB + 3 g/L
Proline
Media
Time (hours)
A B C D E F
6 25.25 ± 17.29 35.10 ± 18.21 34.49 ± 16.08 29.69 ± 8.78 37.84 ± 21.74 34.69 ± 24.42
24 19.00 ± 13.67 21.78 ± 12.90 19.81 ± 12.33 22.17 ± 12.93 14.48 ± 11.20 11.42 ± 4.93
Appendix 2.16 Raw data for generalized polarization of strain PDM supplemented with proline. Cultures were grown under aerobic condition in
YNB medium with 2% glucose at 30°C and 180 opm. Data represents means of four independent experiments. Media: A = YNB; B = YNB + 0.1 g/L Proline; C = YNB + 0.5 g/L Proline; D = YNB + 1 g/L Proline; E = YNB + 2 g/L Proline; F = YNB + 3 g/L Proline
Media
Time
(hours)
A B C D E F
6 0.2533 ± 0.0102 0.2977 ± 0.0321 0.3419 ± 0.1010 0.2484 ± 0.0560 0.2089 ± 0.0435 0.2430 ± 0.0391
24 0.4943 ± 0.0636 0.4841 ± 0.0064 0.4960 ± 0.0222 0.4687 ± 0.0731 0.4324 ± 0.0203 0.4119 ± 0.0494
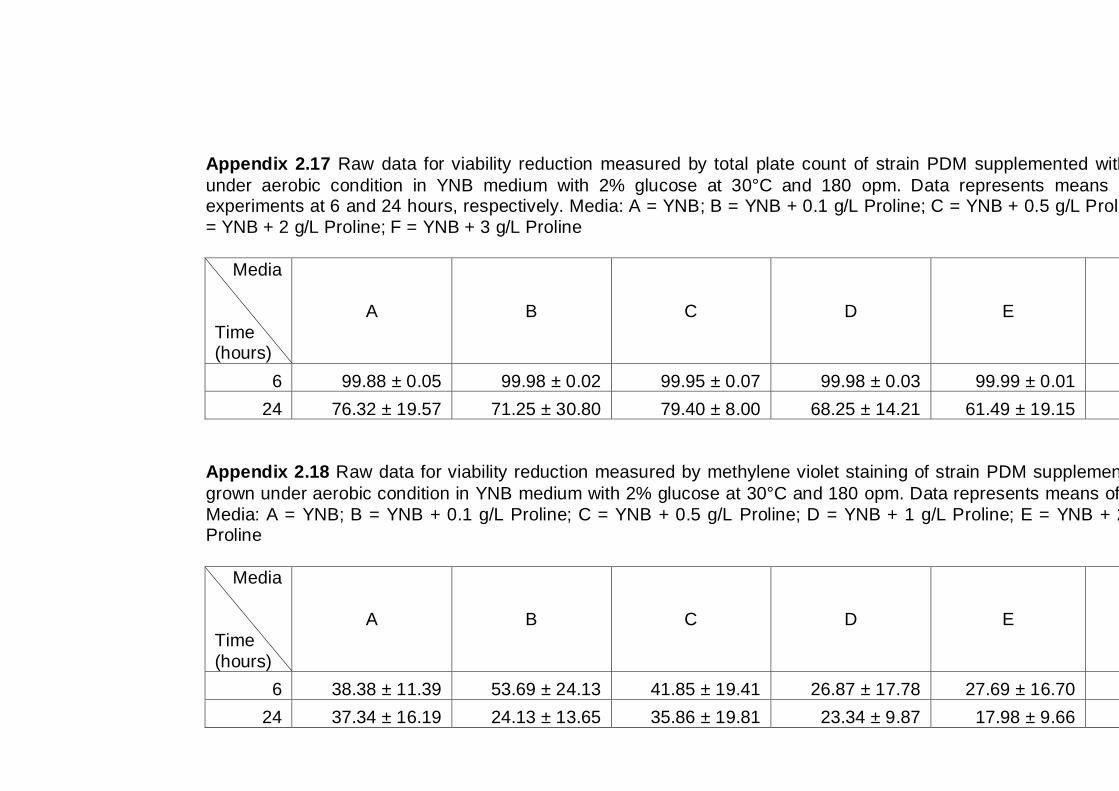
177
Appendix 2.17 Raw data for viability reduction measured by total plate count of strain PDM supplemented with proline. Cultures were grown
under aerobic condition in YNB medium with 2% glucose at 30°C and 180 opm. Data represents means of two and three independent experiments at 6 and 24 hours, respectively. Media: A = YNB; B = YNB + 0.1 g/L Proline; C = YNB + 0.5 g/L Proline; D = YNB + 1 g/L Proline; E
= YNB + 2 g/L Proline; F = YNB + 3 g/L Proline
Media
Time (hours)
A B C D E F
6 99.88 ± 0.05 99.98 ± 0.02 99.95 ± 0.07 99.98 ± 0.03 99.99 ± 0.01 99.99 ± 0.01
24 76.32 ± 19.57 71.25 ± 30.80 79.40 ± 8.00 68.25 ± 14.21 61.49 ± 19.15 60.44 ± 18.11
Appendix 2.18 Raw data for viability reduction measured by methylene violet staining of strain PDM supplemented with proline. Cultures were
grown under aerobic condition in YNB medium with 2% glucose at 30°C and 180 opm. Data represents means of four independent experiments.
Media: A = YNB; B = YNB + 0.1 g/L Proline; C = YNB + 0.5 g/L Proline; D = YNB + 1 g/L Proline; E = YNB + 2 g/L Proline; F = YNB + 3 g/L Proline
Media
Time
(hours)
A B C D E F
6 38.38 ± 11.39 53.69 ± 24.13 41.85 ± 19.41 26.87 ± 17.78 27.69 ± 16.70 33.96 ± 20.56
24 37.34 ± 16.19 24.13 ± 13.65 35.86 ± 19.81 23.34 ± 9.87 17.98 ± 9.66 17.42 ± 9.81
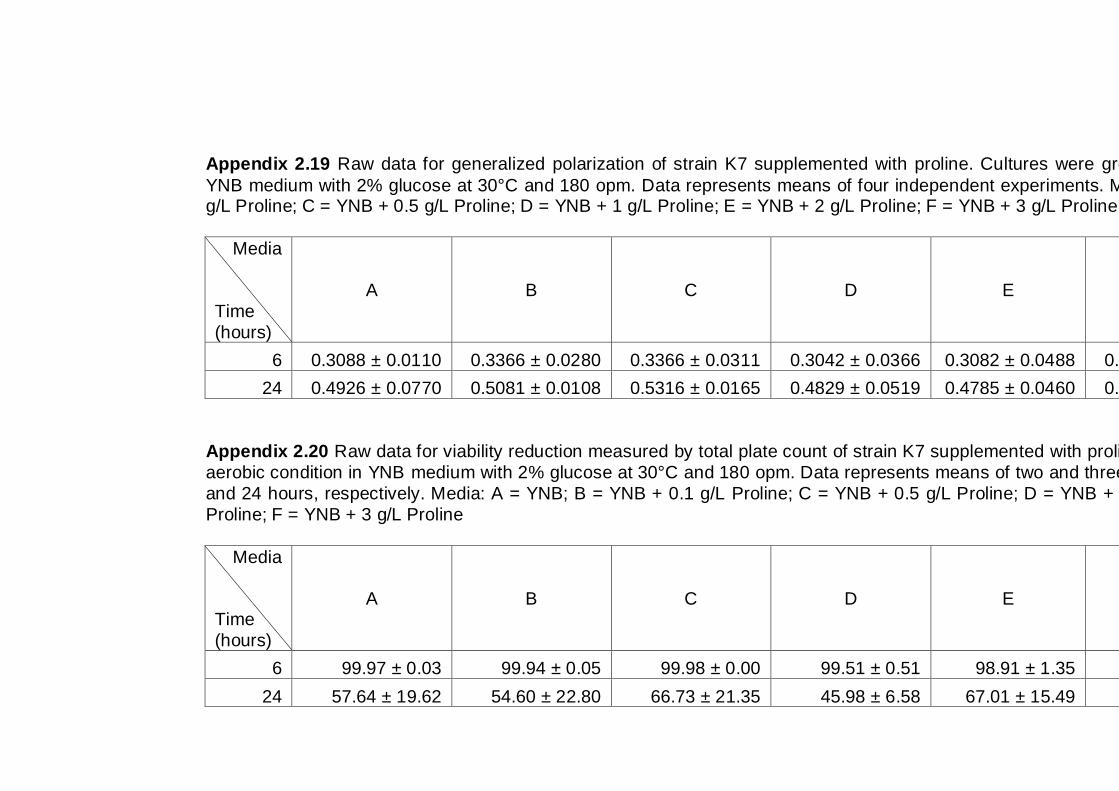
178
Appendix 2.19 Raw data for generalized polarization of strain K7 supplemented with proline. Cultures were grown under aerobic condition in
YNB medium with 2% glucose at 30°C and 180 opm. Data represents means of four independent experiments. Media: A = YNB; B = YNB + 0.1 g/L Proline; C = YNB + 0.5 g/L Proline; D = YNB + 1 g/L Proline; E = YNB + 2 g/L Proline; F = YNB + 3 g/L Proline
Media
Time
(hours)
A B C D E F
6 0.3088 ± 0.0110 0.3366 ± 0.0280 0.3366 ± 0.0311 0.3042 ± 0.0366 0.3082 ± 0.0488 0.3185 ± 0.0411
24 0.4926 ± 0.0770 0.5081 ± 0.0108 0.5316 ± 0.0165 0.4829 ± 0.0519 0.4785 ± 0.0460 0.4732 ± 0.0125
Appendix 2.20 Raw data for viability reduction measured by total plate count of strain K7 supplemented with proline. Cultures were grown under
aerobic condition in YNB medium with 2% glucose at 30°C and 180 opm. Data represents means of two and three independent experiments at 6
and 24 hours, respectively. Media: A = YNB; B = YNB + 0.1 g/L Proline; C = YNB + 0.5 g/L Proline; D = YNB + 1 g/L Proline; E = YNB + 2 g/L
Proline; F = YNB + 3 g/L Proline
Media
Time
(hours)
A B C D E F
6 99.97 ± 0.03 99.94 ± 0.05 99.98 ± 0.00 99.51 ± 0.51 98.91 ± 1.35 99.45 ± 0.62
24 57.64 ± 19.62 54.60 ± 22.80 66.73 ± 21.35 45.98 ± 6.58 67.01 ± 15.49 34.81 ± 29.12
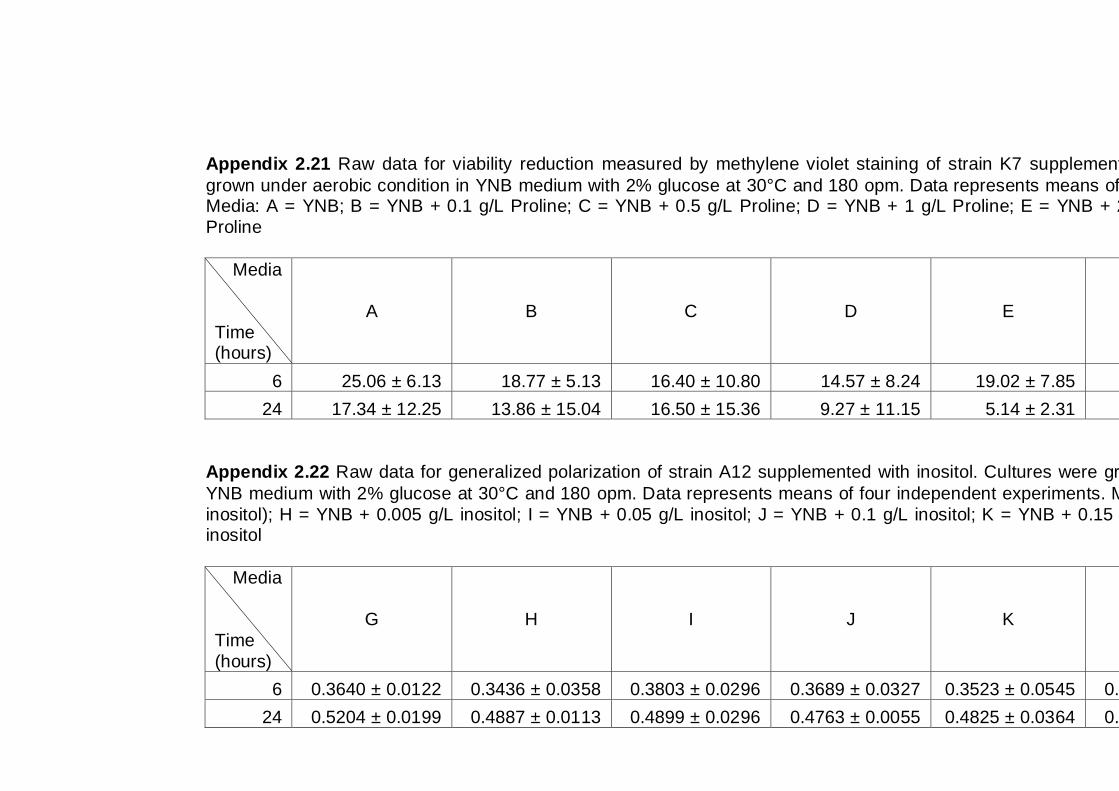
179
Appendix 2.21 Raw data for viability reduction measured by methylene violet staining of strain K7 supplemented with proline. Cultures were
grown under aerobic condition in YNB medium with 2% glucose at 30°C and 180 opm. Data represents means of four independent experiments. Media: A = YNB; B = YNB + 0.1 g/L Proline; C = YNB + 0.5 g/L Proline; D = YNB + 1 g/L Proline; E = YNB + 2 g/L Proline; F = YNB + 3 g/L
Proline
Media
Time (hours)
A B C D E F
6 25.06 ± 6.13 18.77 ± 5.13 16.40 ± 10.80 14.57 ± 8.24 19.02 ± 7.85 16.41 ± 11.43
24 17.34 ± 12.25 13.86 ± 15.04 16.50 ± 15.36 9.27 ± 11.15 5.14 ± 2.31 16.06 ± 12.29
Appendix 2.22 Raw data for generalized polarization of strain A12 supplemented with inositol. Cultures were grown under aerobic condition in
YNB medium with 2% glucose at 30°C and 180 opm. Data represents means of four independent experiments. Media: G = YNB (with 0.002 g/L
inositol); H = YNB + 0.005 g/L inositol; I = YNB + 0.05 g/L inositol; J = YNB + 0.1 g/L inositol; K = YNB + 0.15 g/L inositol ; L = YNB + 0.2 g/L inositol
Media
Time
(hours)
G H I J K L
6 0.3640 ± 0.0122 0.3436 ± 0.0358 0.3803 ± 0.0296 0.3689 ± 0.0327 0.3523 ± 0.0545 0.4066 ± 0.0684
24 0.5204 ± 0.0199 0.4887 ± 0.0113 0.4899 ± 0.0296 0.4763 ± 0.0055 0.4825 ± 0.0364 0.4770 ± 0.0248
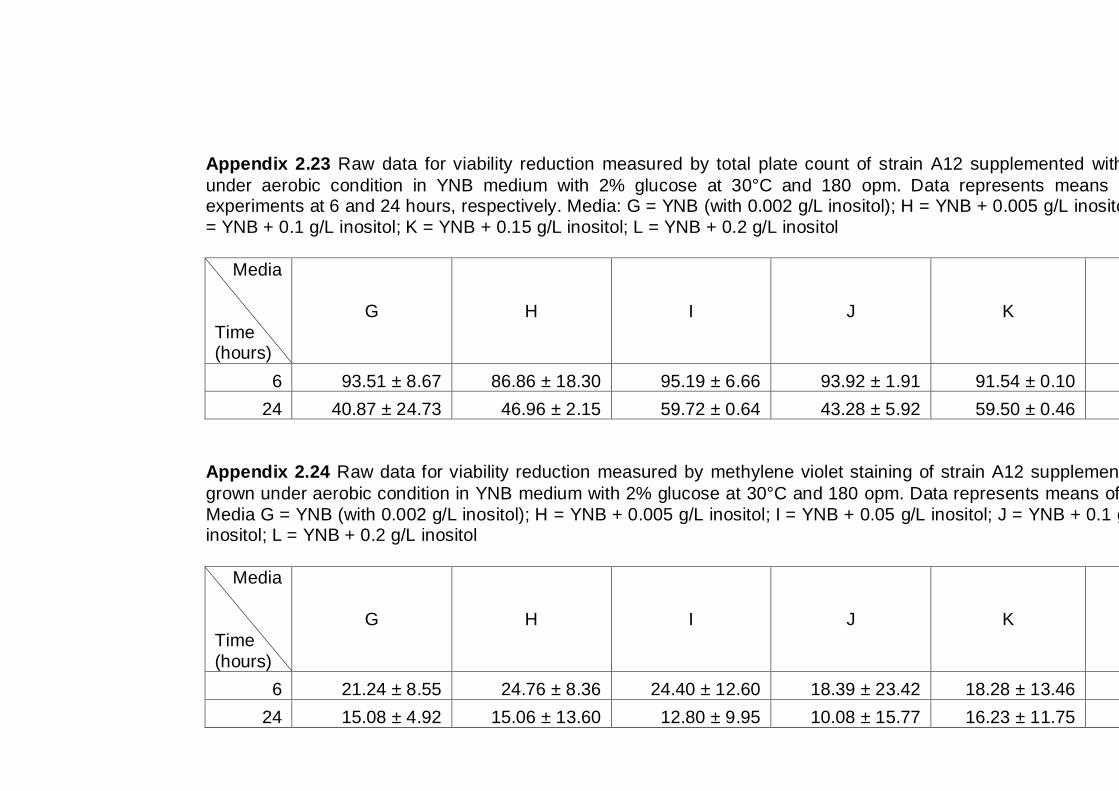
180
Appendix 2.23 Raw data for viability reduction measured by total plate count of strain A12 supplemented with inositol. Cultures were grown
under aerobic condition in YNB medium with 2% glucose at 30°C and 180 opm. Data represents means of two and three independent experiments at 6 and 24 hours, respectively. Media: G = YNB (with 0.002 g/L inositol); H = YNB + 0.005 g/L inositol; I = YNB + 0.05 g/L inositol; J
= YNB + 0.1 g/L inositol; K = YNB + 0.15 g/L inositol; L = YNB + 0.2 g/L inositol
Media
Time (hours)
G H I J K L
6 93.51 ± 8.67 86.86 ± 18.30 95.19 ± 6.66 93.92 ± 1.91 91.54 ± 0.10 93.58 ± 4.29
24 40.87 ± 24.73 46.96 ± 2.15 59.72 ± 0.64 43.28 ± 5.92 59.50 ± 0.46 48.22 ± 5.65
Appendix 2.24 Raw data for viability reduction measured by methylene violet staining of strain A12 supplemented with inositol. Cultures were
grown under aerobic condition in YNB medium with 2% glucose at 30°C and 180 opm. Data represents means of four independent experiments.
Media G = YNB (with 0.002 g/L inositol); H = YNB + 0.005 g/L inositol; I = YNB + 0.05 g/L inositol; J = YNB + 0.1 g/L inositol; K = YNB + 0.15 g/L inositol; L = YNB + 0.2 g/L inositol
Media
Time
(hours)
G H I J K L
6 21.24 ± 8.55 24.76 ± 8.36 24.40 ± 12.60 18.39 ± 23.42 18.28 ± 13.46 19.20 ± 13.91
24 15.08 ± 4.92 15.06 ± 13.60 12.80 ± 9.95 10.08 ± 15.77 16.23 ± 11.75 18.09 ± 13.54
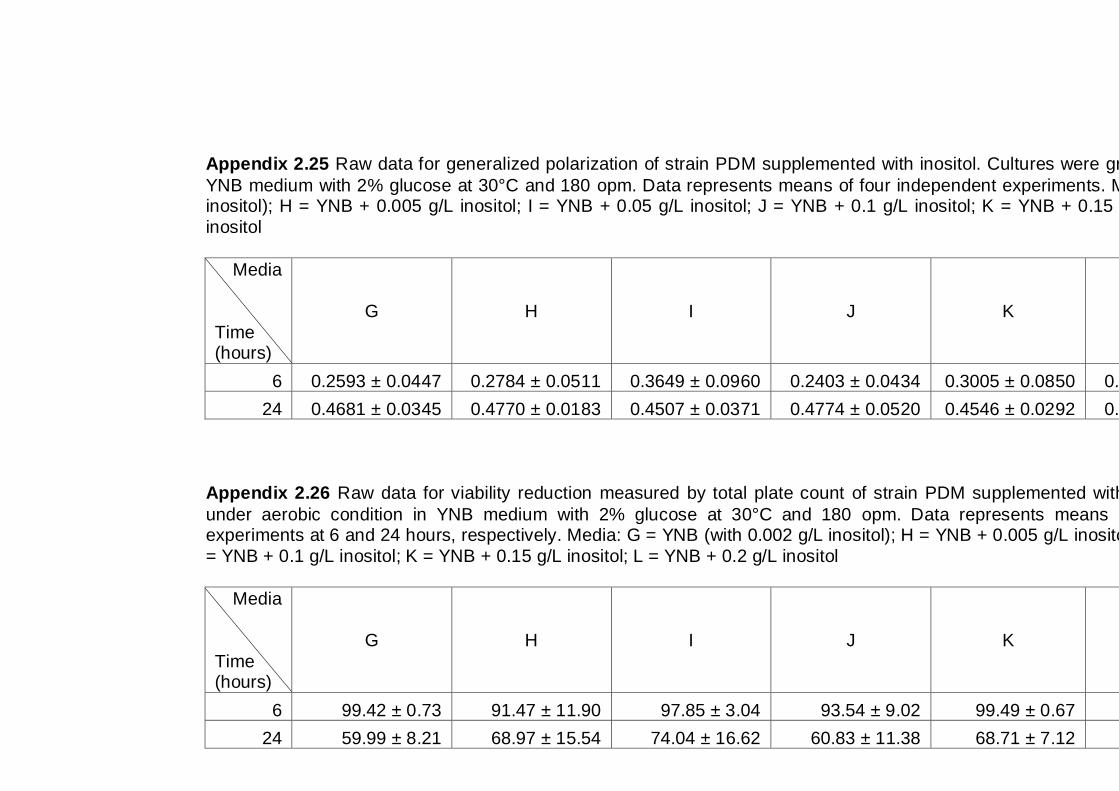
181
Appendix 2.25 Raw data for generalized polarization of strain PDM supplemented with inositol. Cultures were grown under aerobic condition in
YNB medium with 2% glucose at 30°C and 180 opm. Data represents means of four independent experiments. Media: G = YNB (with 0.002 g/L inositol); H = YNB + 0.005 g/L inositol; I = YNB + 0.05 g/L inositol; J = YNB + 0.1 g/L inositol; K = YNB + 0.15 g/L inositol ; L = YNB + 0.2 g/L
inositol
Media
Time (hours)
G H I J K L
6 0.2593 ± 0.0447 0.2784 ± 0.0511 0.3649 ± 0.0960 0.2403 ± 0.0434 0.3005 ± 0.0850 0.3302 ± 0.0575
24 0.4681 ± 0.0345 0.4770 ± 0.0183 0.4507 ± 0.0371 0.4774 ± 0.0520 0.4546 ± 0.0292 0.4552 ± 0.0379
Appendix 2.26 Raw data for viability reduction measured by total plate count of strain PDM supplemented with inositol. Cultures were grown
under aerobic condition in YNB medium with 2% glucose at 30°C and 180 opm. Data represents means of two and three independent experiments at 6 and 24 hours, respectively. Media: G = YNB (with 0.002 g/L inositol); H = YNB + 0.005 g/L inositol; I = YNB + 0.05 g/L inositol; J
= YNB + 0.1 g/L inositol; K = YNB + 0.15 g/L inositol; L = YNB + 0.2 g/L inositol
Media
Time (hours)
G H I J K L
6 99.42 ± 0.73 91.47 ± 11.90 97.85 ± 3.04 93.54 ± 9.02 99.49 ± 0.67 99.69 ± 0.41
24 59.99 ± 8.21 68.97 ± 15.54 74.04 ± 16.62 60.83 ± 11.38 68.71 ± 7.12 68.36 ± 9.01
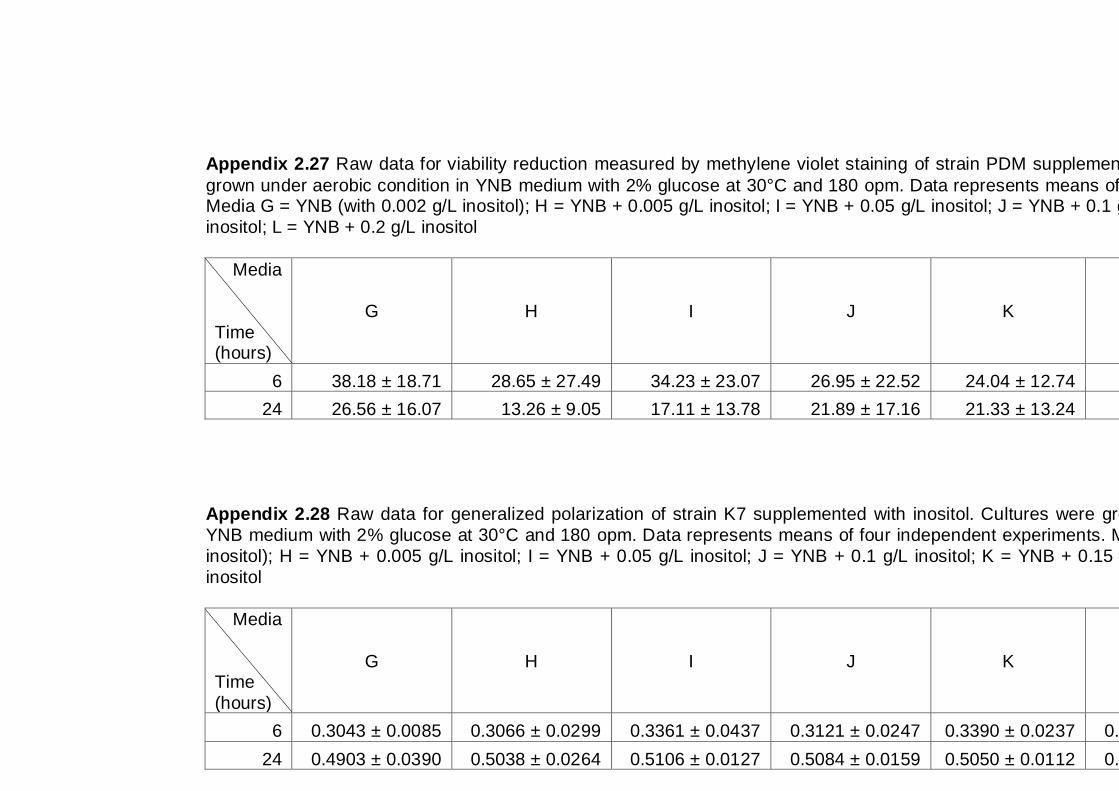
182
Appendix 2.27 Raw data for viability reduction measured by methylene violet staining of strain PDM supplemented with inositol. Cultures were
grown under aerobic condition in YNB medium with 2% glucose at 30°C and 180 opm. Data represents means of four independent experiments. Media G = YNB (with 0.002 g/L inositol); H = YNB + 0.005 g/L inositol; I = YNB + 0.05 g/L inositol; J = YNB + 0.1 g/L inositol; K = YNB + 0.15 g/L
inositol; L = YNB + 0.2 g/L inositol
Media
Time (hours)
G H I J K L
6 38.18 ± 18.71 28.65 ± 27.49 34.23 ± 23.07 26.95 ± 22.52 24.04 ± 12.74 43.63 ± 33.74
24 26.56 ± 16.07 13.26 ± 9.05 17.11 ± 13.78 21.89 ± 17.16 21.33 ± 13.24 26.15 ± 18.49
Appendix 2.28 Raw data for generalized polarization of strain K7 supplemented with inositol. Cultures were grown under aerobic condition in
YNB medium with 2% glucose at 30°C and 180 opm. Data represents means of four independent experiments. Media: G = YNB (with 0.002 g/L
inositol); H = YNB + 0.005 g/L inositol; I = YNB + 0.05 g/L inositol; J = YNB + 0.1 g/L inositol; K = YNB + 0.15 g/L inositol ; L = YNB + 0.2 g/L
inositol
Media
Time
(hours)
G H I J K L
6 0.3043 ± 0.0085 0.3066 ± 0.0299 0.3361 ± 0.0437 0.3121 ± 0.0247 0.3390 ± 0.0237 0.3466 ± 0.0292
24 0.4903 ± 0.0390 0.5038 ± 0.0264 0.5106 ± 0.0127 0.5084 ± 0.0159 0.5050 ± 0.0112 0.5006 ± 0.0194
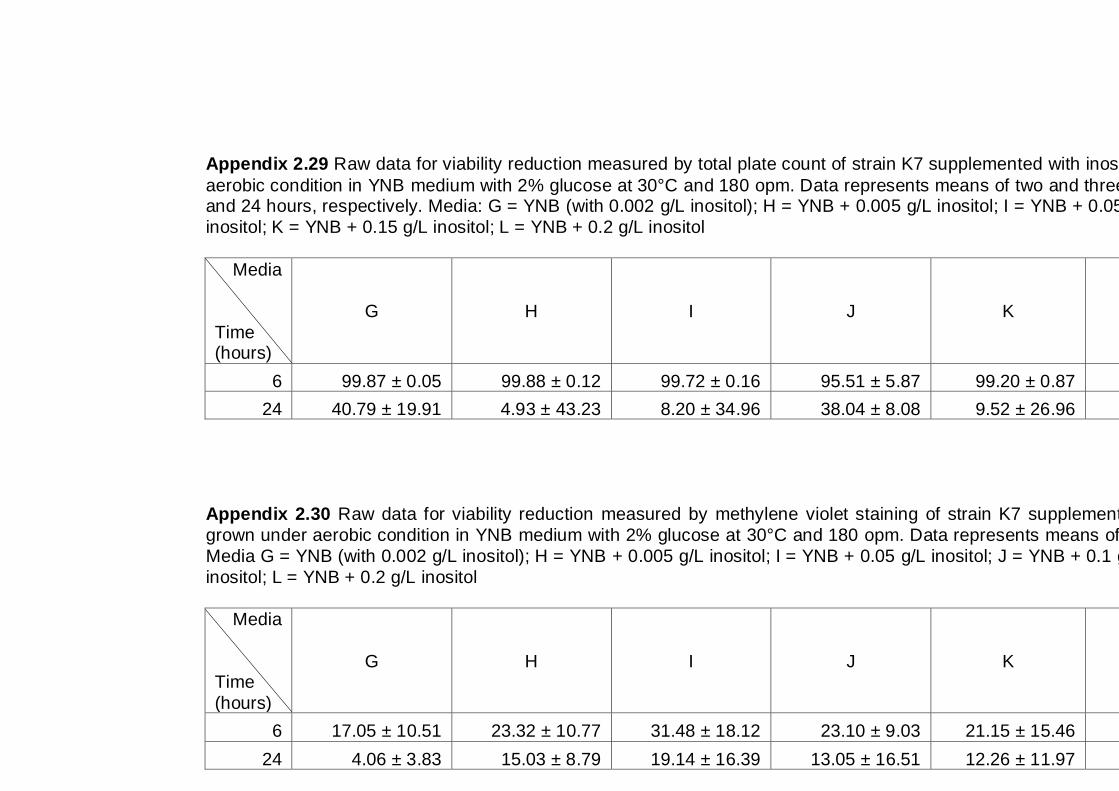
183
Appendix 2.29 Raw data for viability reduction measured by total plate count of strain K7 supplemented with inositol. Cultures were grown under
aerobic condition in YNB medium with 2% glucose at 30°C and 180 opm. Data represents means of two and three independent experiments at 6 and 24 hours, respectively. Media: G = YNB (with 0.002 g/L inositol); H = YNB + 0.005 g/L inositol; I = YNB + 0.05 g/L inositol; J = YNB + 0.1 g/L
inositol; K = YNB + 0.15 g/L inositol; L = YNB + 0.2 g/L inositol
Media
Time (hours)
G H I J K L
6 99.87 ± 0.05 99.88 ± 0.12 99.72 ± 0.16 95.51 ± 5.87 99.20 ± 0.87 99.65 ± 0.33
24 40.79 ± 19.91 4.93 ± 43.23 8.20 ± 34.96 38.04 ± 8.08 9.52 ± 26.96 16.36 ± 35.36
Appendix 2.30 Raw data for viability reduction measured by methylene violet staining of strain K7 supplemented with inositol. Cultures were
grown under aerobic condition in YNB medium with 2% glucose at 30°C and 180 opm. Data represents means of four independent experiments.
Media G = YNB (with 0.002 g/L inositol); H = YNB + 0.005 g/L inositol; I = YNB + 0.05 g/L inositol; J = YNB + 0.1 g/L inositol; K = YNB + 0.15 g/L
inositol; L = YNB + 0.2 g/L inositol
Media
Time
(hours)
G H I J K L
6 17.05 ± 10.51 23.32 ± 10.77 31.48 ± 18.12 23.10 ± 9.03 21.15 ± 15.46 21.07 ± 12.02
24 4.06 ± 3.83 15.03 ± 8.79 19.14 ± 16.39 13.05 ± 16.51 12.26 ± 11.97 14.32 ± 10.18

184
185
Statistical Analysis
Raw data was initially compiled into Minitab 15® for Windows®. This software
package was then used to perform one-way analysis of variance, which compared the
variance of each parameter (i.e. GP, viability reduction by TPC, viability reduction by
methylene violet staining, OD600nm, total cell number, viable cell number, cell viability,
budding rate, glucose concentration, ethanol concentration and supplement
concentration) between three strains with the variability within each replicate
experiment of each strain. Significant differences between the data were determined
from p-value. When p < 0.05, the null hypothesis was rejected, which means there is a
significant differences between the data.
When significant differences detected, the test was followed by Fisher’s LSD test
to determine which strain did and did not differ significantly (p<0.05) from each other.
Pairwise comparison was used to determine which value different significantly. When
an interval upper and lower limit of Fisher’s pairwise comparisons do not contain zero
(0) value, the pairs are significantly different. Negative value of lower and upper limits
indicate the value is significantly lower than the subtracted value, whereas positive
value indicate higher compared to the subtracted value.
This appendix provides examples of output from the statistical analysis.
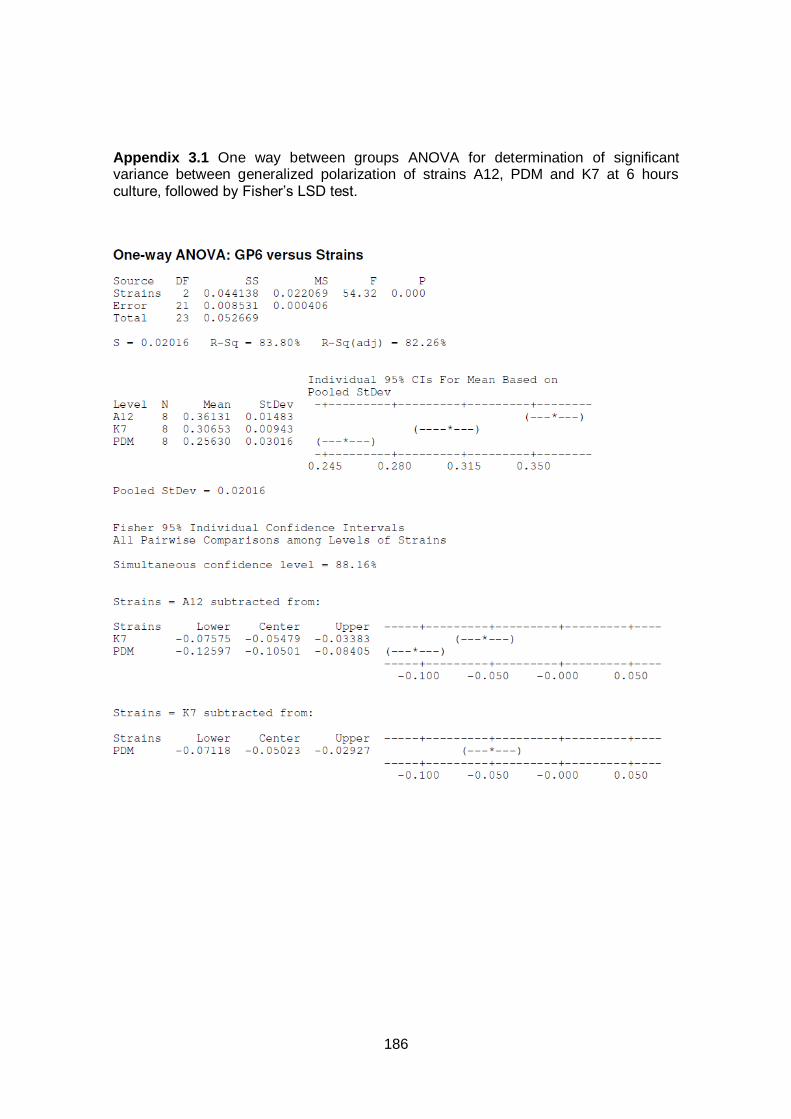
186
Appendix 3.1 One way between groups ANOVA for determination of significant variance between generalized polarization of strains A12, PDM and K7 at 6 hours culture, followed by Fisher’s LSD test.
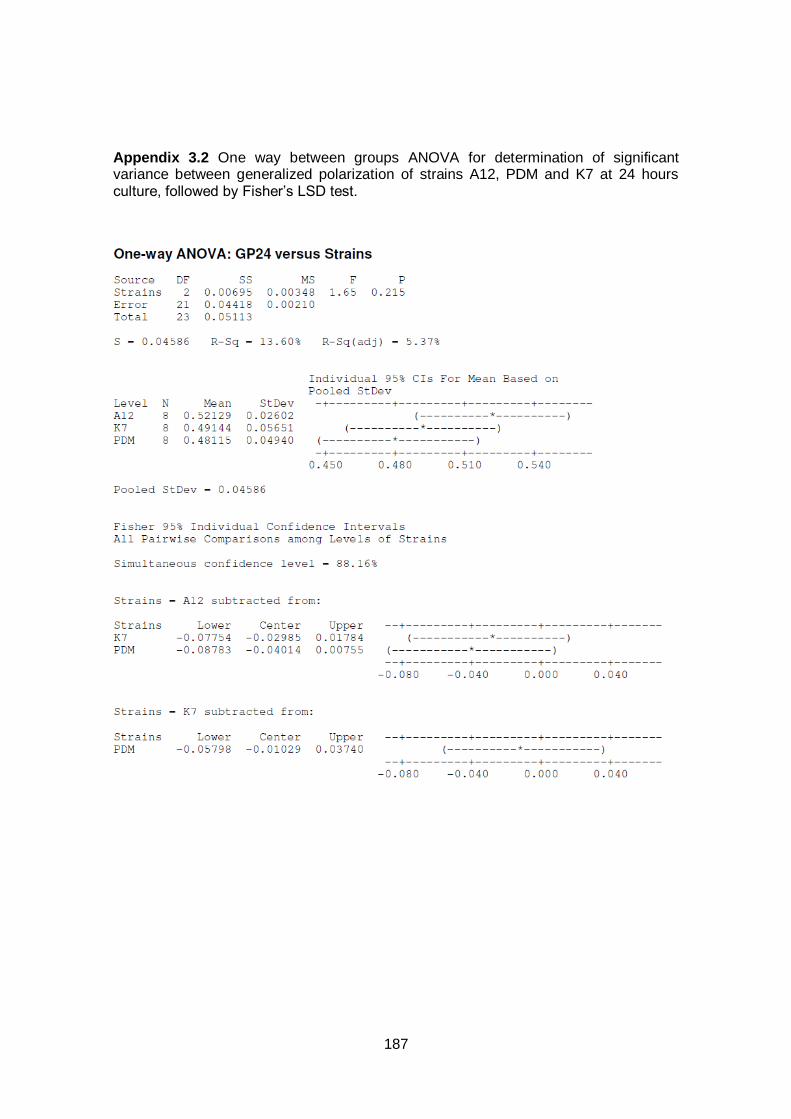
187
Appendix 3.2 One way between groups ANOVA for determination of significant variance between generalized polarization of strains A12, PDM and K7 at 24 hours culture, followed by Fisher’s LSD test.
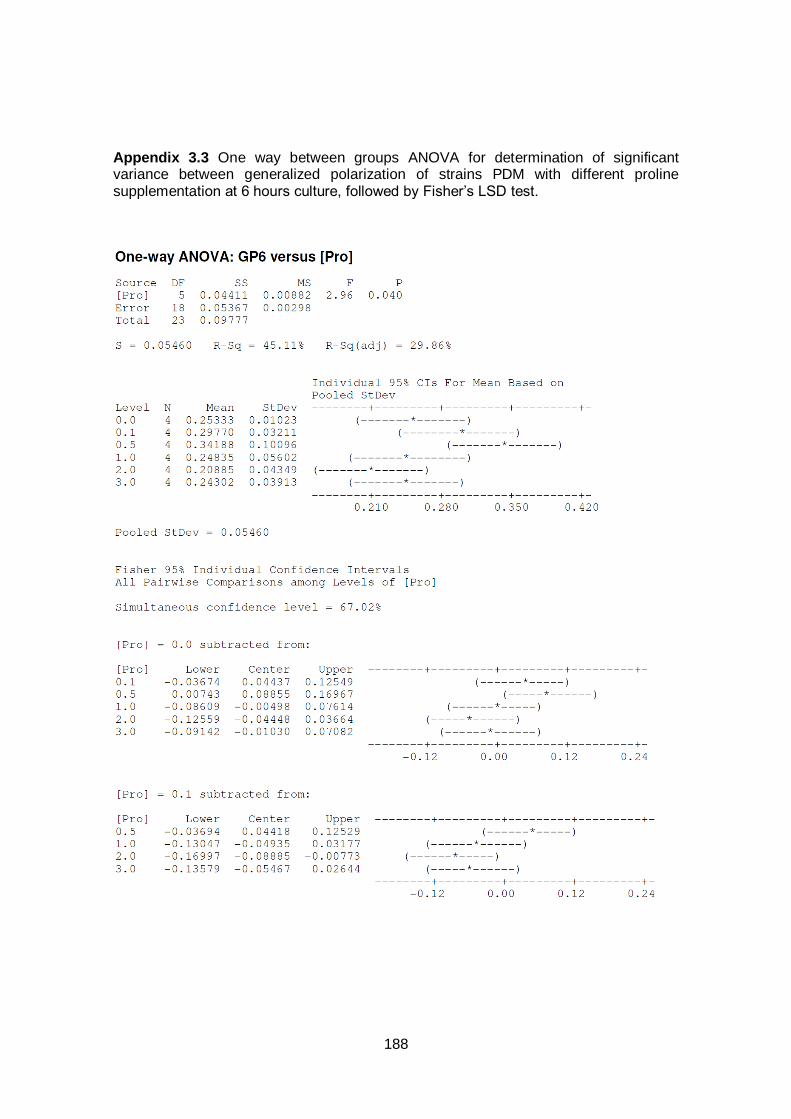
188
Appendix 3.3 One way between groups ANOVA for determination of significant variance between generalized polarization of strains PDM with different proline supplementation at 6 hours culture, followed by Fisher’s LSD test.
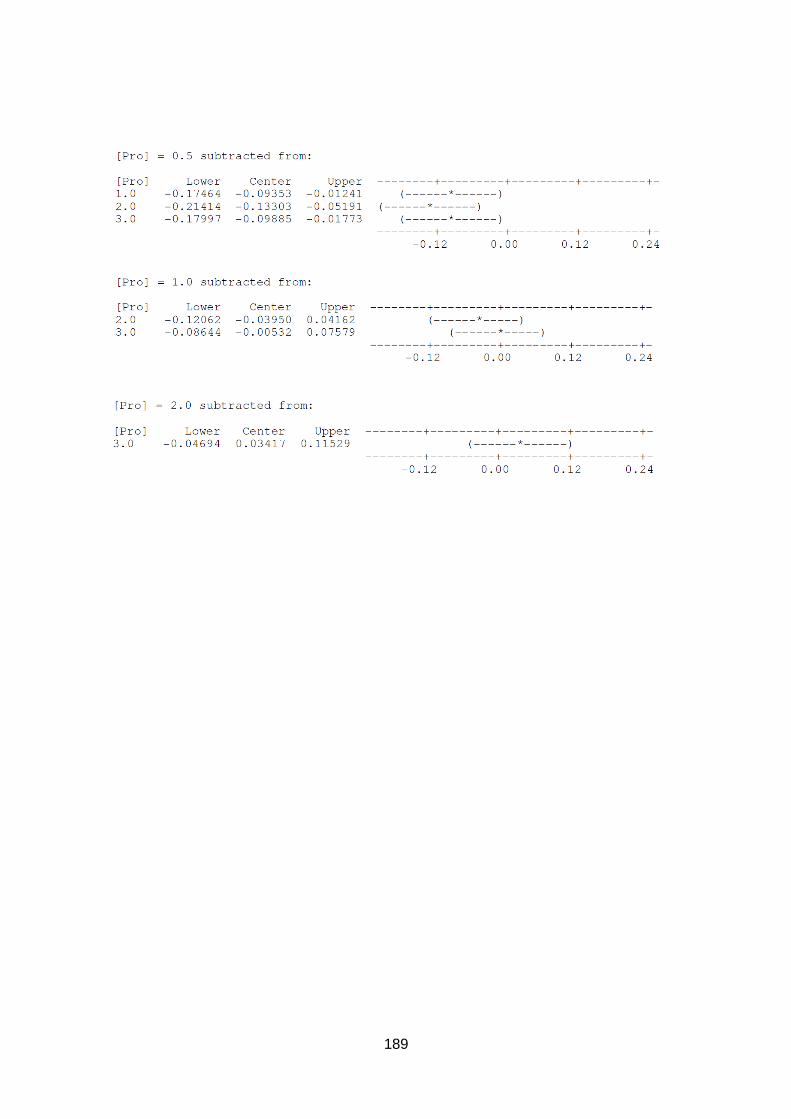
189