investigation of dry sliding wear behaviour of lm4 (al ... · pdf fileinternational research...
TRANSCRIPT

International Research Journal of Engineering and Technology (IRJET) e-ISSN: 2395 -0056
Volume: 02 Issue: 04 | July-2015 www.irjet.net p-ISSN: 2395-0072
© 2015, IRJET.NET- All Rights Reserved Page 66
Investigation of Dry Sliding Wear Behaviour of LM4 (Al - Si5Cu3)-
T6/LM6 (Al-Si12)-M using Taguchi Approach
Narayan W. Mannurkar1, Prasad U. Raikar2
1 Lecturer, Mechanical Engineering Department, Jain College of Engineering, Karnataka, India 2 Assistant Professor, Product Design & Manufacturing Department, VTU, Karnataka, India
---------------------------------------------------------------------***---------------------------------------------------------------------Abstract - The present investigation deals with
influence of wear parameters like sliding speed, load
and sliding distance on the dry sliding wear of
aluminium LM4-T6 and LM6-M alloys. The alloys were
prepared by conventional melting and casting routing
technique and LM4 alloy followed the tempering
process (T6). The Taguchi approach of design of
experiment was employed to acquire data in a
controlled manner. A pin-on-disc apparatus was used
to investigate the wear behaviour of both alloys as per
Taguchi’s standard array. An Orthogonal array,
signal-to-noise ratio, analysis of variance was
employed in investigation and further the wear rate
was optimized by using predicted Taguchi results. The
multiple regression models were used to confirm the
experimental results. Microstructure observation
before and after wear was done using optical
microscope (OM).The wear rate increased as
percentage of silicon increases in an alloy. It was also
observed that heat treatment tempering process (T6)
has significance effect on tribological characteristics.
The microstructure analysis before wear revealed that
as percentage of silicon increases as in the case of LM6-
M alloy, it leads to more degree of refinement of
eutectic silicon as silicon content increases beyond
eutectic composition.
Keywords: Wear, Orthogonal array, ANOVA, Taguchi
Approach
1. INTRODUCTION
The development of aluminum silicon alloys is very important due to their high strength to weight ratio, high wear resistance, low coefficient of thermal expansion, high thermal conductivity, high corrosion resistance, good cast performance, good weldability etc. which makes them attractive material in many tribological
applications, aerospace and other engineering sectors, where they can successfully replace ferrous components in heavy wear applications. These applications demand the study of techniques to improve the wear properties of these alloys. Al-Si alloys are mainly used in cast form in important components like pistons, engine blocks, cylinder liners, rocker arms, air conditioner compressors, brake drums riser angle brackets etc.[1]
Anirudh Biswas et al. studied wear loss analysis of 18% silicon based aluminium alloy. It was observed that in case of Al-18% Si, wear rate reaches maximum value at load of 15N and then decreases as the applied load increase to 20N. This is due to work-hardening of the matrix by plastic deformation, which helped in reduction of wear of the samples at higher loads. During wear at higher loads, the temperature increases appreciably, thus lowering the strength of materials in contact and resulting in an increase in contact area and coefficient of friction. The Silicon added to alloy Al-18% Si, changes the wear behavior at higher loads than at lower loads (5-10N) [2].
Narendra Kumar et al. investigated dry Sliding wear behavior of pure aluminium and Al-Cu alloys. Wear behavior, friction coefficient, hardness, macro and microstructures results revealed that, severe wear was observed at all loads for all alloys under study. It was also observed that the wear rate of the alloys decreased with increase in copper content. All the alloys showed the similar trend and wear rate decreased linearly with increasing sliding distance. The wear rate of pure aluminium increases much more as compared to the rest of the alloys at higher loads and longer distances. For the higher loads and longer sliding distances, the wear rate of all the Al-Cu alloys showed the marginal decreasing trend [3].
Francis Uchenna et al. worked on synthesis and study on effect of parameters on dry sliding wear characteristic of Al-Si alloys”. They investigated that wear rate increased at higher applied load, higher speed and higher sliding distance. The wear characteristic of Al-14%Si was observed superior to those of Al-7%Si and Al-12%Si due to degree of refinement of their eutectic silicon when the silicon content increased beyond eutectic composition.
International Research Journal of Engineering and Technology (IRJET) e-ISSN: 2395 -0056
Volume: 02 Issue: 04 | July-2015 www.irjet.net p-ISSN: 2395-0072
© 2015, IRJET.NET- All Rights Reserved Page 67
Hardness of the Al-Si alloy also increased with increase in amount of silicon present. Effect of load and sliding speed are more significant on the wear of the Al-Si alloy than the sliding distance [4].
2. TAGUCHI METHODOLOGY Robust design is a methodology of finding the optimum settings of the control factors to make the product or process insensitive to noise factors. Taguchi methodology is a part of robust design of making the product or process insensitive to noise factors.
Taguchi methodology emphasizes more upon the importance of the middle (parameter design) stage in the design process; a stage which is often being neglected in industrial design problems. The Taguchi methodology involves the identification of those parameters which can be controlled by the designer, and then performing a series of experiments to establish that subset of those parameters, which has the greatest influence on the performance and variation of the product or process design. This approach has been successfully used by the researchers in study of wear behaviour of aluminium alloys [5]. Taguchi defines a standard orthogonal array to conduct the experimentation and experimental results are analysed using analysis of variance to study the effect of parameters.
3. MATERIALS AND METHODS
The material selected was commercially available aluminium alloy of LM4 (Al-Si5Cu3) and LM6 (Al-Si12) .The materials were manufactured using green sand molding technique to a size of Ø 17 mm x 200 mm length fingers-6 Nos. each of alloy, by preparing a wooden pattern to the same size as that of the casted specimen. Basic steps followed in preparing casted specimen include melting, pouring, cooling, cleaning and inspection. Alloys were melted in an electric furnace and poured to a temperature of 720 ºC in a mould prepared by using pattern, and then it was allowed to cool at a room temperature. The chemical composition of the LM4 and LM6 alloys in as cast condition as per ASTM E-1251 is given in the Table 1.
Table 1: Composition of Aluminium Alloys (wt %)
Alloy Si Cu Fe Mn Zn Al
LM4 5.442 2.241 0.165 0.148 0.018 91.96
LM6 10.82 0.184 0.239 0.087 0.053 88.57
*Elements with wt% less than 0.001 are not shown
Casted samples of LM4 alloy had been subjected to heat treatment i.e., Tempering (T6) process, where components were heated for approximately 6-16 hours at 505-520°C, followed by quenching in hot water and again heated for 6-18 hours at 150-170°C and air cooled to increase the mechanical properties such as hardness and ductility.
The cast and heat treated components of LM4 (T6) alloy and casted components of LM6 alloy (M) were cut into small pieces and machined to the required size of the pin i.e. diameter 10 mm and length 100 mm for wear testing purpose. Polishing was done for all pins before wear testing with the help of emery paper of 400, 1000 and 2000 grades.
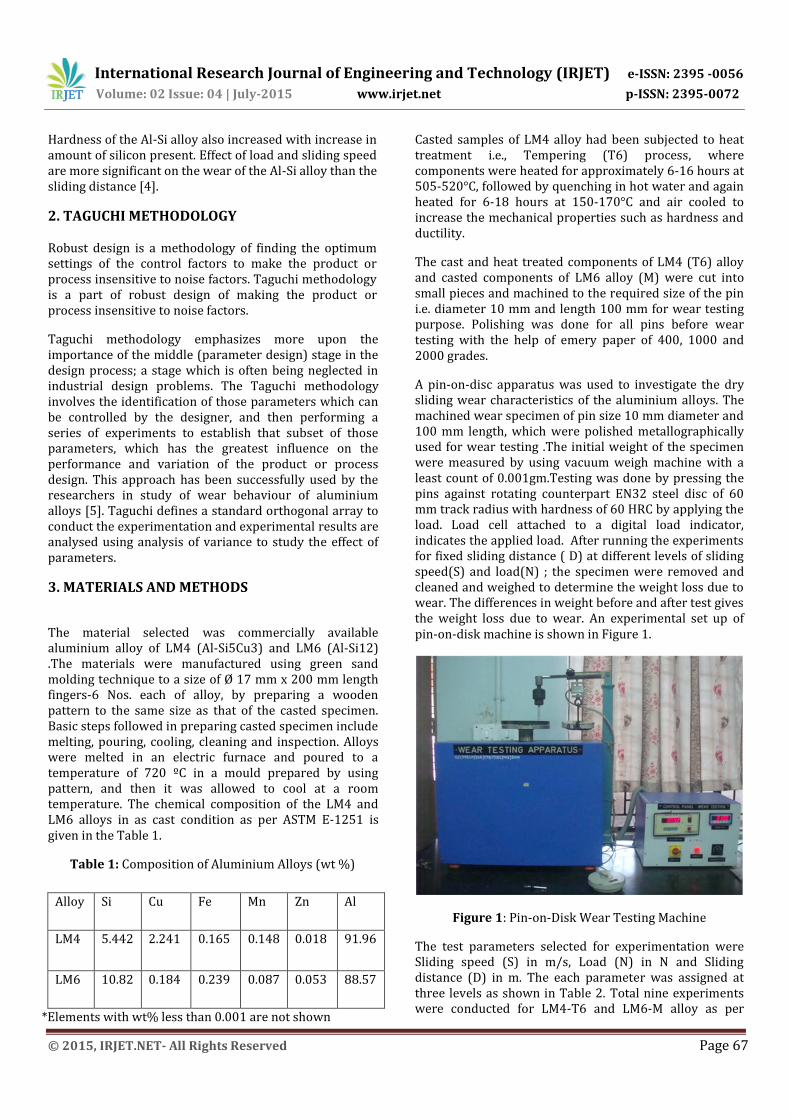
A pin-on-disc apparatus was used to investigate the dry sliding wear characteristics of the aluminium alloys. The machined wear specimen of pin size 10 mm diameter and 100 mm length, which were polished metallographically used for wear testing .The initial weight of the specimen were measured by using vacuum weigh machine with a least count of 0.001gm.Testing was done by pressing the pins against rotating counterpart EN32 steel disc of 60 mm track radius with hardness of 60 HRC by applying the load. Load cell attached to a digital load indicator, indicates the applied load. After running the experiments for fixed sliding distance ( D) at different levels of sliding speed(S) and load(N) ; the specimen were removed and cleaned and weighed to determine the weight loss due to wear. The differences in weight before and after test gives the weight loss due to wear. An experimental set up of pin-on-disk machine is shown in Figure 1.
Figure 1: Pin-on-Disk Wear Testing Machine
The test parameters selected for experimentation were Sliding speed (S) in m/s, Load (N) in N and Sliding distance (D) in m. The each parameter was assigned at three levels as shown in Table 2. Total nine experiments were conducted for LM4-T6 and LM6-M alloy as per
International Research Journal of Engineering and Technology (IRJET) e-ISSN: 2395 -0056
Volume: 02 Issue: 04 | July-2015 www.irjet.net p-ISSN: 2395-0072
© 2015, IRJET.NET- All Rights Reserved Page 68
standard L9 orthogonal array at different combination of levels of three process parameters. The first column is assigned with sliding speed, second column by load and third column by sliding distance[6].
The wear response values for each experiment were noted down as shown in Table 3. The objective of experimentation is “smaller the better type “quality characteristics, as wear rate has to be minimum.
Table 2: Process parameters with their values at three levels
Factors Level 1 Level 2 Level 3
Sliding speed (S) 1.571 2.095 2.618
Load (N) 29.43 39.24 49.05
Sliding distance (D) 600 1200 1800
Table 3: Orthogonal array (L9) of Taguchi for wear test
L9 Test
Sliding Velocity (S) m/s
Load (N) N
Sliding Distance (D) m
Wear of LM4-T6 (∆ w) gm
Wear of LM6-M (∆ w) gm
1 1.571 29.43 600 0.014 0.034
2 1.571 39.24 1200 0.016 0.023
3 1.571 49.05 1800 0.025 0.016
4 2.095 29.43 1200 0.018 0.015
5 2.095 39.24 1800 0.022 0.022
6 2.095 49.05 600 0.015 0.019
7 2.618 29.43 1800 0.023 0.019
8 2.618 39.24 600 0.014 0.016
9 2.618 49.05 1200 0.020 0.019
Following equations are used and the results are tabulated as shown in Table 4.
Sliding speed (S) =
Where, N= Speed in RPM
R = Track radius at which pin rotates (60 mm)
Volumetric loss (∆ v in mm3) =
Specific Wear rate (K)=
For LM4 alloy Density ( LM4) = 2.75 gm/cc
LM6-M alloy Density ( LM6-M) = 2.65 gm/cc
Table 4: Results of L9 Orthogonal array for LM4-T6 and
LM6-M alloy
L9 Test Volume
loss of LM4-T6
(∆ v)
mm3
Volume loss of
LM6-M (∆ v)
mm3
Specific wear rate of LM4-T6
(K)
mm3/Nm
Specific wear rate of LM6-M
(K)
mm3/Nm
1 5.09090 12.83018 0.0002883 0.0007266
2 5.81818 8.679245 0.0001236 0.0001843
3 9.09090 6.037736 0.0001030 0.0000684
4 6.54545 5.660377 0.0001853 0.0001603
5 8.00000 8.301887 0.0001133 0.0001175
6 5.45454 7.169811 0.0001853 0.0002436
7 8.36363 7.169811 0.0001579 0.0001353
8 5.09090 6.037736 0.0002162 0.0002564
9 7.27272 7.169811 0.0001236 0.0001218
4. RESULTS AND DISCUSSIONS 4.1 S/N Ratio Analysis The influence of control parameters such as, sliding speed (S), load (N) and sliding distance (D) on wear of LM4-T6 and LM6-M alloy had been investigated using S/N ratio analysis. It is evident that process parameter settings with the highest S/N ratio yield the optimum response with minimum variance [8]. The sliding wear quality characteristics selected is smaller the better type and same type of response is used for signal to noise ratio given by [9]
International Research Journal of Engineering and Technology (IRJET) e-ISSN: 2395 -0056
Volume: 02 Issue: 04 | July-2015 www.irjet.net p-ISSN: 2395-0072
© 2015, IRJET.NET- All Rights Reserved Page 69
Where, n=no. of replications, i= 1,2…….n (no. of expt.)
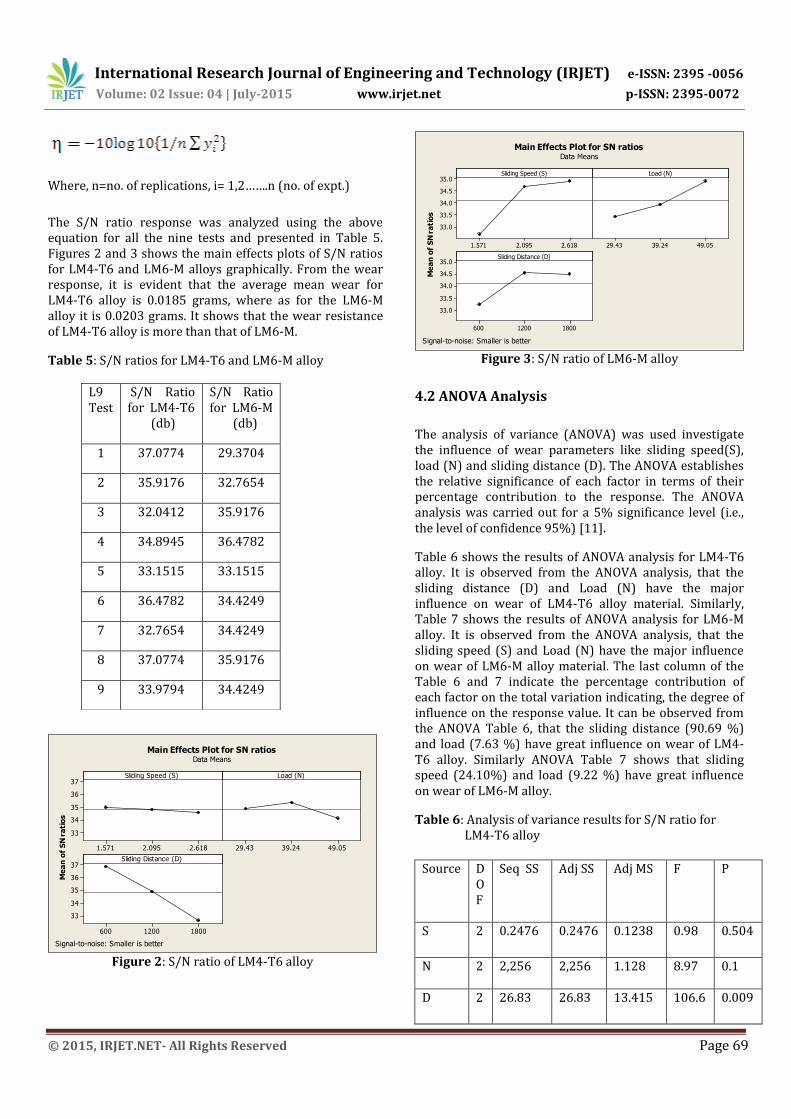
The S/N ratio response was analyzed using the above equation for all the nine tests and presented in Table 5. Figures 2 and 3 shows the main effects plots of S/N ratios for LM4-T6 and LM6-M alloys graphically. From the wear response, it is evident that the average mean wear for LM4-T6 alloy is 0.0185 grams, where as for the LM6-M alloy it is 0.0203 grams. It shows that the wear resistance of LM4-T6 alloy is more than that of LM6-M.
Table 5: S/N ratios for LM4-T6 and LM6-M alloy
2.6182.0951.571
37
36
35
34
33
49.0539.2429.43
18001200600
37
36
35
34
33
Sliding Speed (S)
Me
an
of
SN
ra
tio
s
Load (N)
Sliding Distance (D)
Main Effects Plot for SN ratiosData Means
Signal-to-noise: Smaller is better Figure 2: S/N ratio of LM4-T6 alloy
2.6182.0951.571
35.0
34.5
34.0
33.5
33.0
49.0539.2429.43
18001200600
35.0
34.5
34.0
33.5
33.0
Sliding Speed (S)
Me
an
of
SN
ra
tio
s
Load (N)
Sliding Distance (D)
Main Effects Plot for SN ratiosData Means
Signal-to-noise: Smaller is better
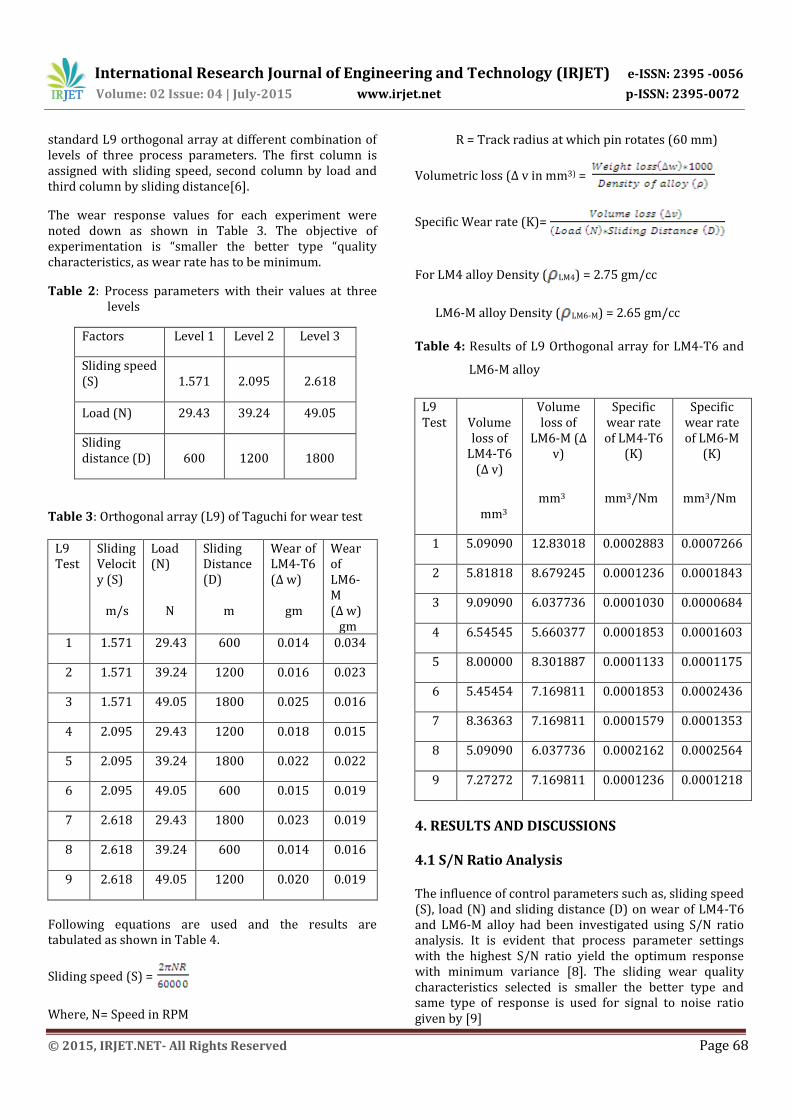
Figure 3: S/N ratio of LM6-M alloy
4.2 ANOVA Analysis
The analysis of variance (ANOVA) was used investigate the influence of wear parameters like sliding speed(S), load (N) and sliding distance (D). The ANOVA establishes the relative significance of each factor in terms of their percentage contribution to the response. The ANOVA analysis was carried out for a 5% significance level (i.e., the level of confidence 95%) [11].
Table 6 shows the results of ANOVA analysis for LM4-T6 alloy. It is observed from the ANOVA analysis, that the sliding distance (D) and Load (N) have the major influence on wear of LM4-T6 alloy material. Similarly, Table 7 shows the results of ANOVA analysis for LM6-M alloy. It is observed from the ANOVA analysis, that the sliding speed (S) and Load (N) have the major influence on wear of LM6-M alloy material. The last column of the Table 6 and 7 indicate the percentage contribution of each factor on the total variation indicating, the degree of influence on the response value. It can be observed from the ANOVA Table 6, that the sliding distance (90.69 %) and load (7.63 %) have great influence on wear of LM4-T6 alloy. Similarly ANOVA Table 7 shows that sliding speed (24.10%) and load (9.22 %) have great influence on wear of LM6-M alloy.
Table 6: Analysis of variance results for S/N ratio for LM4-T6 alloy
Source D
OF
Seq SS Adj SS Adj MS F P
S 2 0.2476 0.2476 0.1238 0.98 0.504
N 2 2,256 2,256 1.128 8.97 0.1
D 2 26.83 26.83 13.415 106.6 0.009
L9 Test
S/N Ratio for LM4-T6 (db)
S/N Ratio for LM6-M (db)
1 37.0774 29.3704
2 35.9176 32.7654
3 32.0412 35.9176
4 34.8945 36.4782
5 33.1515 33.1515
6 36.4782 34.4249
7 32.7654 34.4249
8 37.0774 35.9176
9 33.9794 34.4249
International Research Journal of Engineering and Technology (IRJET) e-ISSN: 2395 -0056
Volume: 02 Issue: 04 | July-2015 www.irjet.net p-ISSN: 2395-0072
© 2015, IRJET.NET- All Rights Reserved Page 70
Error 2 0.2516 0.2516 0.1258
Total 8 29.585 29.585
Table 7: Analysis of variance results for S/N ratio for LM6-M alloy
Source DOF
Seq SS Adj SS Adj MS F P
S 2 9.067 9.067 4.533 0.42 0.706
N 2 3.47 3.47 1.735 0.16 0.862
D 2 3.33 3.33 1.665 0.15 0.867
Error 2 21.762 21.762
10.881
Total 8 37.629
4.3 Results Optimization The response tables 8, 9 and 10, 11 shows the average of each response characteristic (S/N ratios, means) for each level of each factor for both alloys. The table indicates ranks based on Delta statistics, which compare the relative magnitude of effects of all the parameters. The Delta statistic is the highest minus the lowest average of S/N ratio and mean for each factor. Minitab 16 assigns ranks based on Delta values; rank 1 indicates highest Delta value, rank 2 second highest, and so on.
Table 8: Response Table of S/N ratio for LM4-T6 alloy Smaller is better
Level Sliding Speed
(S)
Load (N)
Sliding Distance
(D) 1 35.01 34.91 36.88 2 34.84 35.38 34.93 3 34.61 34.17 32.65
Delta 0.40 1.22 4.22 Rank 3 2 1
Table 9: Response Table of Means for LM4-T6 alloy Smaller is better
Level Sliding Speed
(S)
Load (N) Sliding Distance
(D) 1 0.01833 0.01833 0.01433 2 0.01833 0.01733 0.01800 3 0.01900 0.02000 0.02333
Delta 0.00067 0.00267 0.00900 Rank 3 2 1
Table 10: Response Table of S/N ratio for LM6-M alloy Smaller is better
Level Sliding Speed
(S)
Load (N)
Sliding Distance
(D) 1 32.68 33.42 33.24 2 34.68 33.94 34.56 3 34.92 34.92 34.50
Delta 2.24 1.50 1.32 Rank 1 2 3
Table 11: Response Table of Means for LM6-M alloy Smaller is better
Level Sliding Speed
(S)
Load (N) Sliding Distance
(D) 1 0.02433 0.02267 0.02300 2 0.01867 0.02033 0.01900 3 0.01800 0.01800 0.01900
Delta 0.00633 0.00467 0.00400 Rank 1 2 3
In this experimentation our goal was to minimize the wear of both alloys. In Taguchi experiments, we always want to maximize the S/N ratio. The S/N ratio marked with bold letters in the response tables 8 and 10 shows that the S/N ratios can be maximized at these levels and wear can be minimized at these levels in mean response table 9 and 11.
When the Sliding speed is 1.571, Load 39.24 and Sliding distance 600 for LM4-T6 alloy the wear is minimum. Similarly, when the Sliding speed is 2.618, Load 49.05 and Sliding distance 1200 for LM6-M alloy the wear is minimum. Examining the main effects plots and interaction plots confirms the above results. The table 12 summarizes the predicted optimized Taguchi results.
Table 12: Predicted Optimized Taguchi Results
Factors Levels for LM4-T6 Levels for LM6-M Sliding Speed (S)
1 3
Load (N) 2 3
Sliding Distance (D)
1 2
Predicted Optimized Results
S/N Ratio 37.6313 36.2066
Mean 0.0128889 0.0143333

International Research Journal of Engineering and Technology (IRJET) e-ISSN: 2395 -0056
Volume: 02 Issue: 04 | July-2015 www.irjet.net p-ISSN: 2395-0072
© 2015, IRJET.NET- All Rights Reserved Page 71
4.4 Multiple Linear Regression Analysis
A multiple linear regression analysis attempts to model the relationship between two or more predictor variables and a response variable by fitting, a linear equation considering the observed data [14]. In order to establish the correlation between the wear parameters sliding speed(S), load (N) and sliding distance (D) and the response variable wear (mass loss) in grams, the multiple linear regression model was used [15].
The regression equation for LM4-T6 alloy:
WLM4-T6 = 0.00489 + 0.00064 Sliding Speed (S) + 0.000085
Load (N) + 0.000008 Sliding Distance (D)
S = 0.00140637 R-Sq = 92.7% R-Sq (adj) = 88.4%
The regression equation for LMT6 alloy:
WLM6-M = 0.0463 - 0.00605 Sliding Speed (S) - 0.000238 Load (N) - 0.000003 Sliding Distance (D)
S = 0.00549793 R-Sq = 43.6% R-Sq (adj) = 9.8%
The above equations represents the regression equations for LM4-T6 and LM6-M alloy respectively. The R-Sq value indicates that the predictors explain 92.7% and 43.6% variance in wear response for LM4-T6 and LM6-M alloy respectively. The R-Sq = 92.7% and R-Sq (adj) = 88.4% for LM4-T6 alloy indicates that the model fits data well as compared to LM6-M alloy. The model provides a good explanation of relationship between the predictor variables and response for LM4-T6 alloy, since R-Sq = 92.7% is close to unity.
It can be also observed that the coefficients associated with sliding speed(S), load (N) and sliding distance (D) are negative for LM6-M alloy, which indicates that the wear for LM6-M alloy decreases with increase in parameters values. Conversely the coefficients associated with sliding speed(S), load (N) and sliding distance (D) are positive for LM4-T6 alloy, which indicates that the wear for LM6-M alloy increases with increase in parameters values.
4.5 Confirmation Test
The confirmation test was being performed for LM4-T6 and LM6-M alloy by selecting a set of parameters as shown in Table 13. The Table 14 and 15 shows the results obtained using regression equations and the experimental results. Both the results were compared and observed that the calculated error varies from 5.43 % to 6.85 % for LM4-T6 and 6.41 % to 9.5 % for LM6-M. Therefore, we can conclude that the multiple regression
equation derived as above correlate the evaluation of the wear of aluminium alloys with the reasonable degree of approximation.
Table 13: Parameters used in the confirmation wear test
Test Sliding Speed (m/s)
Load
(N)
Sliding Distance
(m) 1 1.98 19.6 1150
2 2.3 39.2 1350
Table 14: Results of confirmation tests for LM4-T6 alloy
Test Regression Model
Equation
Expt. Error %
1 0.0170 0.018 5.43
2 0.0205 0.022 6.85
Table 15: Results of confirmation tests for LM6-M alloy
Test Regression Model
Equation
Expt. Error %
1 0.0262 0.028 6.41
2 0.0190 0.021 9.50
4.6 Micrograph Analysis
After the wear test a sample specimen was rough polished and then cloth polished by applying alumina powder on a polishing machine. The images of microstructure of both the alloys were captured under optical microscope (OM) at 100 X magnification before and after wear as shown in Figure 4 and 5 for LM4-T6 alloy and Figure 6 and 7 for LM6-M alloy.
LM6 contains 10.82% of Si and LM4 contains 5.44% of Si content in as cast condition. It can be observed from the micrograph that as the silicon content increases microstructure is different for both the alloys. The micrograph reveals that LM6 has more dark networked structure of silicon particles than LM4 alloy before wear. The silicon has long rod like structure present in aluminium base and as silicon percentage increases it becomes denser as in the case of LM6 alloy. LM6 shows

International Research Journal of Engineering and Technology (IRJET) e-ISSN: 2395 -0056
Volume: 02 Issue: 04 | July-2015 www.irjet.net p-ISSN: 2395-0072
© 2015, IRJET.NET- All Rights Reserved Page 72
more degree of refinement of eutectic silicon as silicon content increased beyond eutectic composition.
Figure 4: Micrograph of LM4-T6 @100X before wear
Figure 5: Micrograph of LM4-T6 @100X after wear
Figure 6: Micrograph of LM6-M @100X before wear
Figure 7: Micrograph of LM6-M @100X after wear The micrograph after wear showed that the wear in case of LM6 alloy was more as deep grooves can be found in microstructure but in case of LM4 the grooves were not deep. The wear characteristic of LM4-T6 alloy was observed superior to those of LM6-M, since it was
tempered.
5. CONCLUSIONS The following conclusions, can be drawn from the experimental investigation made about the dry sliding wear behavior of LM4 (Al-Si5Cu3)-T6 and LM6-(Al-Si12)-M alloys under the selected ranges of sliding speed (S), load (N) and sliding distance (D)
1. The ANOVA analysis showed that the sliding distance (90.69 %) and load (7.63 %) had significant influence on wear of LM4-T6 alloy in dry condition. 2. The ANOVA analysis showed that the sliding speed (24.10%) and load (9.22 %) had significant influence on wear of LM6-M alloy in dry condition.
3. The wear resistance of LM4-T6 alloy was more than that of LM6-M alloy. The average mean wear for LM4-T6 alloy was 0.0185 grams, where as for the LM6-M alloy it was 0.0203 grams.
4. It was found that the parametric design of the Taguchi method provides a simple, systematic and efficient method under DOE of optimizing wear test parameters for LM4-T6 and LM6-M aluminium alloys.
5. The conformation test showed that the wear associated with LM4-T6 alloy varied from 5.43 to 6.85 %.
6. The conformation test showed that the wear associated with LM6-M alloy varied from 6.41 to 9.5 %.
International Research Journal of Engineering and Technology (IRJET) e-ISSN: 2395 -0056
Volume: 02 Issue: 04 | July-2015 www.irjet.net p-ISSN: 2395-0072
© 2015, IRJET.NET- All Rights Reserved Page 73
7. The microstructure analysis before wear revealed that as percentage of silicon increases as in the case of LM6-M alloy, it leads to more degree of refinement of eutectic silicon as silicon content increases beyond eutectic composition.
8. The wear rate was increased as percentage of silicon increases as in the case of LM6-M alloy than LM4-T6 alloy. This may be due to heat treatment (T6-tempering process) of LM4 alloy.
9. The heat treatment process (T6) of LM4 alloy had a significant effect on wear behavior.
10. The microstructure analysis after wear revealed that as LM6-M alloy subjected to more wear than LM4-T6 alloy as deep grooves can be found.
ACKNOWLEDGEMENT We thank PG Coordinator, Dr. A. V Shivapur, Department of PG Studies, VTU, Belagavi and Dr. R.R Malagi, HOD Department of PDM, VTU, Belagavi for their co-operation, constant encouragement and valuable suggestions throughout this research work.
REFERENCES [1] P.V Chandra Sekhar Rao, A.Satya Devi and
K.G.Basava Kumar, “Influence of melt treatments on Dry sliding wear behavior of Hypereutectic Al-15Si-4Cu cast alloys”, Jordan Journal of Mechanical and Industrial Engineering, Volume 6,Number 1,February 2012, pages 55-61.
[2] Anirudh Biswas,Neha Rastogi,Ayush Soni and Rajendra Singh , “Wear loss analysis of 18% Silicon based Aluminium alloy”, International Journal of Emerging Technology and Advanced Engineering ,Volume 4,Special Issue 1,February 2014, pages 196-202.
[3] A Narendra Kumar ,R Srinivas and J Babu Rao,”Dry sliding wear behavior of pure Aluminium and Al-Cu alloys”, Technical Sessions-Proceedings of CIST 2008 & ITS –IFT oMM ,2008 , pages 422-423.
[4] Francis Uchenna, “Synthesis and study on effect of parameters on dry sliding wear characteristic of Al-Si alloys”, Leonardo Electronic Journal of Practices and Technologies, Issue 20, January-June 2012, pages 39-48.
[5] Y.R.Kharde and Ganapat B.Jambukar, “Dry sliding wear behavior of Al-Si-Ti alloys Using Taguchi Method”, International Journal of Science and Research (IJSR), Volume 3, Issue 11, November 2014, pages 2865-2869.
[6] Jothi Sudagar, K.Venkateswarlu and Jainshe Lian, “Dry sliding wear properties of a 7075-T6 Aluminium alloy coated with Ni-P(h) in different
pretreatment conditions”, Journal of Materials Engineering and Performance, September 2009
[7] A.S Anasyida,A.R Daud and M.J Ghazali, “Dry sliding Wear behavior of Al-4Si-4Mg alloys by addition of Cerium”, International Journal of Mechanical and Materials Engineering (IJMME), Volume 4, No. 2, 2009, pages 127-130
[8] P.Shanmughasundaram,”Statistical analysis of influence of heat treatment, load and velocity on the Dry sliding wear behavior of Aluminium alloy 7075”, Material Physics and Mechanics, Issue 22, 2015, pages 118-124
[9] Veerabhadrappa Algur,V.R Kabadi,Ganechari S M , P.B Shetty and Poornima Hulipalled, “Analysis of wear behavior of a heat treated modified ZA-27 alloy by Taguchi Technique”, International Journal on Recent and Innovation Trends in Computing and Communication, Volume 2, Issue 12, December 2014, pages 4095-4104
[10] Reddappa H.N, Suresh K.R, Niranjan H.B and Satyanarayana K.G, “Dry sliding friction and wear behavior of Aluminium/Beryl composites”, International Journal of Applied Engineering Research, Dindigul, Volume 2, Issue No. 2, 2011, pages 502-511
[11] Satpal Kundu, Dr. B.K Roy and Ashok Kr Mishra, “Study of Dry sliding wear behavior of Aluminium/SiC/Al2O3/Graphite Hybrid Metal Matrix Composite using Taguchi technique”, International Journal of Scientific and Research Publications, Volume 3,Issue.8, August 2013, pages 1-8
[12] H.B. Bhaskar and Abdul Sharief , “Dry sliding wear behavior of Aluminium/Be3Al2 (SiO3)6 Composite using Taguchi method”, Journal of Minerals and Materials Characterization and Engineering, Issue 11, July 2012, pages 679-684
[13] V. Muthukumar, R.Venkatasamy, A.Sureshbabu, K.Jagan and K.Nithin,” Wear characteristic of Al alloy (LM4)-SiC Particulate Reinforced MMC”, International Journal of Production Technology and Management Research , Volume 2, Issue 1, Jan-June 2011.pages 49-54
[14] Karthik Raj K.V, M.H Annaiah, Manjunatha B,Davis P Skariah and Harendra Kumar H.V , “Dry sliding wear behavior of heat treated A2014 reinforced with Graphite”, International Journal of Innovative Research in Science,Engineering and Technology, Volume 2, Issue 5, May 2013, pages 1681-1685
[15] S.Jagatheesh Kumar, G.Santhosh, D. Nirmalkumar,A.Saravanakumar,Dr.P.Sasikumar and Dr.S.Sivasankaran, “Mechanical and Dry sliding wear behavior of Al 6063/Al2O3/Graphite Hybrid Composites”, International Journal of Innovative Research in Science, Engineering and Technology, Volume 3, Special Issue 3, March 2014, pages 1222-1228
International Research Journal of Engineering and Technology (IRJET) e-ISSN: 2395 -0056
Volume: 02 Issue: 04 | July-2015 www.irjet.net p-ISSN: 2395-0072
© 2015, IRJET.NET- All Rights Reserved Page 74
BIOGRAPHIES
Narayan W. Mannurkar received the B.E degree in Mechanical Engineering from Karnataka University, Dharwad in 1999 and holds a Post Graduate Diploma in Management studies from GIM, Goa. Currently pursuing a PG in Product Design & Manufacturing from VTU and working as a Lecturer in JCE, Belagavi, Karnataka