investigation of deflection and vibration dynamics of ...s/deflectionvibration... · investigation...
TRANSCRIPT

Investigation of Deflection andVibration Dynamics of Concrete
and Bituminous Pavements
Constructed Over Geofoam
Bernard Izevbekhai, Primary Author Office of Materials and Road ResearchMinnesota Department of Transportation
November 2010Research Project
Final Report #2011-01

All agencies, departments, divisions and units that develop, use and/or purchase written materials for distribution to the public must ensure that each document contain a statement indicating that the information is available in alternative formats to individuals with disabilities upon request. Include the following statement on each document that is distributed: To request this document in an alternative format, call Bruce Lattu at 651-366-4718 or 1-800-657-3774 (Greater Minnesota); 711 or 1-800-627-3529 (Minnesota Relay). You may also send an e-mail to [email protected]. (Please request at least one week in advance).

Technical Report Documentation Page 1. Report No. 2. 3. Recipients Accession No. MN/RC 2011-01
4. Title and Subtitle 5. Report Date
Investigation of Deflection and Vibration Dynamics of Concrete and Bituminous Pavements Constructed Over Geofoam
November 2010 6.
7. Author(s) 8. Performing Organization Report No. Bernard Izevbekhai, Nathan Pederson 9. Performing Organization Name and Address 10. Project/Task/Work Unit No. Minnesota Department of Transportation Office of Materials and Road Research 1400 Gervais Avenue Maplewood, MN 55109
11. Contract (C) or Grant (G) No.
12. Sponsoring Organization Name and Address 13. Type of Report and Period Covered Minnesota Department of Transportation Research Services Section 395 John Ireland Boulevard, MS 330 St. Paul, MN 55155
Final Report 14. Sponsoring Agency Code
15. Supplementary Notes http://www.lrrb.org/pdf/201101.pdf 16. Abstract (Limit: 250 words)
Geofoam, an XPS polystyrene with a unit weight of 1 to 3 lb/ft.3, was used as embankment fill for Minnesota Trunk Highway (TH) 100 segment 3 (SP 2735-159) in 2000. It was also used at Technology Drive in 2002 to correct a slope failure that had occurred in a large embankment near a ramp. The TH 100 segment consisted of a 10 in. dowelled jointed plain concrete pavement (JPCP) and the Technology Drive section was a 7 in. bituminous pavement. Concerns about the vibration issues during and immediately after paving led to a retrofit of the sites with multi-depth deflectometers (MDD) and a two-year study of pavement response. The authors seasonally investigated flexible and rigid pavement response to Falling Weight Deflectometer (FWD) loads, loaded and calibrated snow and ice trucks through the MDDs, and a seismograph. This study compared seasonal deflection basins, elastic moduli, and dominant frequencies of flexible and rigid pavements built with Geofoam fill to their corresponding contiguous control sections built without Geofoam fill. The 3-ft. of granular fill above the 4 in. concrete cap covering the Geofoam compounded the process of layer moduli computations. The report concludes with interesting findings, particularly that the response of Geofoam pavements may exhibit higher deflections and vibration amplitudes and they are in a time series. However, these are not resonant vibrations that would require design changes from the current practice.
17. Document Analysis/Descriptors
Geofoam, Deflectometers, Falling weight deflectometer, Multi-depth deflectometers, Deflection, Deflection Basins, Modulus of elasticity
18. Availability Statement No restrictions. Document available from: National Technical Information Services, Alexandria, Virginia 22312
19. Security Class (this report) 20. Security Class (this page) 21. No. of Pages 22. Price Unclassified Unclassified 98

Investigation of Deflection and Vibration Dynamics of Concrete and Bituminous Pavements Constructed Over
Geofoam
Final Report
Prepared by:
Bernard Izevbekhai Nathan Pederson
Office of Materials and Road Research
Minnesota Department of Transportation
November 2010
Published by:
Minnesota Department of Transportation Research Services Section
395 John Ireland Boulevard, MS 330 St. Paul, Minnesota 55155-1899
This report represents the results of research conducted by the authors and does not necessarily represent the views or policies of the Minnesota Department of Transportation. This report does not contain a standard or specified technique.
The authors and the Minnesota Department of Transportation do not endorse products or manufacturers. Any trade or manufacturers’ names that may appear herein do so solely because they are considered essential to this report.

ACKNOWLEDGEMENTS
The authors are indebted to Keith Shannon and Maureen Jensen of the Minnesota Department of Transportation Office of Materials and Road Research, for their efforts and managerial support of this initiative. We also acknowledge Blake Nelson, Andrew Eller, Ted Snyder, Beth Lauzon, and Jason Richter for their invaluable effort in capturing the seismographic and deflection data. Acknowledgements are also due to Mn/DOT Metro Division Maintenance for its assistance with lane closures, without which testing would have been impossible.
Bernard I. Izevbekhai, M.Eng, MS ISE, P.E. Research Operations Engineer Minnesota Department of Transportation Office of Materials and Roads Research 1400 Gervais Avenue Maplewood, MN 55109 Phone: 651 366 5454 Fax: 651 366 5461 [email protected] July 2010

TABLE OF CONTENTS
Chapter 1. INTRODUCTION 1 Objective ..................................................................................................................................... 1 Section Notation.......................................................................................................................... 2 Literature Review/Synthesis ....................................................................................................... 2 Report Organization .................................................................................................................... 2
Chapter 2. RESEARCH PLAN AND TESTING SCHEDULE 4 Background ................................................................................................................................. 4 Distinct Objectives ...................................................................................................................... 4 Tasks ........................................................................................................................................... 5 Research Process ......................................................................................................................... 5 Deliverables ................................................................................................................................ 7 Research Group ........................................................................................................................... 7
Investigators ............................................................................................................................ 7 Chapter 3. TESTING, MONITORING, & DATA COLLECTION 8
Description of Instrumentation, Equipment, & Tests ................................................................. 8 Data Collection ......................................................................................................................... 10
FWD Testing & FWD Sensor Response .............................................................................. 10 FWD Testing and MDD/LVDT Response ........................................................................... 11 Loaded Truck and LVDT Response ..................................................................................... 12 Loaded Truck and Geophone Response ............................................................................... 13 FWD Testing and Geophone Response ................................................................................ 14
Chapter Summary ..................................................................................................................... 15 Chapter 4. ANALYSIS & DISCUSSION OF RESULTS 16
Deflection Basins ...................................................................................................................... 16 Determination of Composite Moduli for Technology Drive .................................................... 17 Determination of Composite Moduli for Trunk Highway 100 ................................................. 23 Determination of Component Moduli for Layers, Trunk Highway 100 ................................... 29
Geofoam versus Control HMA Section ................................................................................ 31 Geofoam versus Control Concrete ........................................................................................ 35 Control Concrete versus Control Geofoam HMA ................................................................ 37 Concrete Geofoam versus HMA Geofoam ........................................................................... 40 General: Correlative and Non-Correlative Trends ................................................................ 44
Chapter Summary ..................................................................................................................... 44 Chapter 5. CONCLUSION 45
Recommendations ..................................................................................................................... 45 Appendix A. ULTIMATE RESPONSE DATA Appendix B. ADDITIONAL FIGURES Appendix C. VIBRATION MONITORING REPORT Appendix D. FALLING WEIGHT DEFLECTOMETER DEFLECTIONS
LIST OF FIGURES
Figure 1 TH 100 Geofoam Schematic Section ............................................................................... 6Figure 2 FWD Testing Device ........................................................................................................ 8Figure 3 MDD Core and Manhole .................................................................................................. 9Figure 4 Geophone Adjacent to FWD ............................................................................................ 9Figure 5 Example FWD Deflection Basin .................................................................................... 10Figure 6 LVDT Noise Data ........................................................................................................... 11Figure 7 MDD Data from TH 100 ................................................................................................ 12Figure 8 MDD Truck Loading ...................................................................................................... 13Figure 9 Maximum Truck Deflection of Geophone on TH 100 ................................................... 14Figure 10 Maximum Acceleration Recorded by Geophone ......................................................... 15Figure 11 Stresses in a Pavement due to Vertical Deflection ....................................................... 16Figure 12 Deflection Basin from Technology Drive .................................................................... 17Figure 13 Resilient Modulus of Subgrade .................................................................................... 19Figure 14 BAKFAA Example ...................................................................................................... 20Figure 15 Elastic Modulus for Technology Drive ........................................................................ 21Figure 16 Elastic Modulus for Granular Material at Technology Drive ...................................... 22Figure 17 Elastic Modulus Subgrade/Geofoam Technology Drive .............................................. 22Figure 18 AREA Calculations on TH 100 .................................................................................... 24Figure 19 Radius of Relative Stiffness Calculations .................................................................... 26Figure 20 Modulus of Subgrade Reaction TH 100 ....................................................................... 28Figure 21 Effective Elastic Modulus TH 100 ............................................................................... 29Figure 22 Elastic Modulus PCC TH 100 ...................................................................................... 30Figure 23 Elastic Modulus: Base, Geofoam, Subgrade TH 100 ................................................... 31Figure 24 Deflection Basin at Technology Drive ......................................................................... 33Figure 25 Acceleration Due to Mn/DOT Truck at Technology Drive ......................................... 34Figure 26 Frequency at Technology Drive ................................................................................... 34Figure 27 Deflection Basin at TH 100 .......................................................................................... 35Figure 28 Maximum Acceleration by Mn/DOT Truck TH 100 ................................................... 36Figure 29 Dominant Frequency TH 100 ....................................................................................... 37Figure 30 Deflection Basin TH 100 vs. Technology Drive Control Sections .............................. 38Figure 31 Maximum Acceleration by Mn/DOT Truck at Control Sections ................................. 39Figure 32 Dominant Frequency at Control Sections ..................................................................... 40Figure 33 Deflection Basin Geofoam Sections at TH 100 and Technology Drive ...................... 41Figure 34 Maximum Acceleration from FWD Geofoam Sections ............................................... 42Figure 35 Maximum Acceleration of Geofoam Sections from Mn/DOT Truck .......................... 43Figure 36 Dominant Frequency Geofoam Sections ...................................................................... 43Figure A1 ..................................................................................................................................... A1Figure A2 ..................................................................................................................................... A2Figure A3 ..................................................................................................................................... A3Figure A4 ..................................................................................................................................... A4Figure A5 ..................................................................................................................................... A5Figure A6 ..................................................................................................................................... A6Figure A7 ..................................................................................................................................... A7Figure B1 ...................................................................................................................................... B1
Figure B2 ...................................................................................................................................... B1Figure B3 ...................................................................................................................................... B2Figure B4 ...................................................................................................................................... B2Figure B5 ...................................................................................................................................... B3Figure B6 ...................................................................................................................................... B4Figure B7 ...................................................................................................................................... B4Figure B8 ...................................................................................................................................... B5Figure B9 ...................................................................................................................................... B5Figure B10 .................................................................................................................................... B6Figure B11 .................................................................................................................................... B7Figure B12 .................................................................................................................................... B8Figure B13 .................................................................................................................................... B8Figure B14 .................................................................................................................................... B9Figure B15 .................................................................................................................................. B10Figure D1 TH 100 Geofoam FWD Deflection Basin; November 8, 2005 .................................. D1Figure D2 TH 100 Control FWD Deflection Basin; November 8, 2005 ..................................... D1Figure D3 TH 100 Geofoam FWD Deflection Basin; February 2006 ......................................... D2Figure D4 TH 100 Control FWD Deflection Basin; February 2006 ........................................... D2Figure D5 TH 100 Geofoam FWD Deflection Basin; July 12, 2006 .......................................... D3Figure D6 TH 100 Control FWD Deflection Basin; July 12, 2006 ............................................. D3Figure D7 TH 100 Geofoam FWD Deflection Basin; November 5, 2006 .................................. D4Figure D8 TH 100 Control FWD Deflection Basin; November 5, 2006 ..................................... D4Figure D9 TH 100 Geofoam FWD Deflection Basin; March 8, 2007 ......................................... D5Figure D10 TH 100 Control FWD Deflection Basin; March 8, 2007 ......................................... D5Figure D11 TH 100 Geofoam FWD Deflection Basin; May 22, 2007 ........................................ D6Figure D12 TH 100 Control FWD Deflection Basin; May 22, 2007 .......................................... D6Figure D13 TH 100 Geofoam FWD Deflection Basin; July 31, 2007 ........................................ D7Figure D14 TH 100 Control FWD Deflection Basin; July 31, 2007 ........................................... D7Figure D15 TH 100 Geofoam FWD Deflection Basin; November 15, 2007 .............................. D8Figure D16 TH 100 Control FWD Deflection Basin; November 15, 2007 ................................. D8Figure D17 Technology Drive Geofoam FWD Deflection Basin; May 3, 2006 ......................... D9Figure D18 Technology Drive Control FWD Deflection Basin; May 3, 2006 ........................... D9Figure D19 Technology Drive Geofoam FWD Deflection Basin; July 13, 2006 ..................... D10Figure D20 Technology Drive Control FWD Deflection Basin; July 13, 2006 ........................ D10Figure D21 Technology Drive Geofoam FWD Deflection Basin; November 16, 2006 ........... D11Figure D22 Technology Drive Control FWD Deflection Basin; November 16, 2006 .............. D11Figure D23 Technology Drive Control FWD Deflection Basin; March 8, 2007 ...................... D12Figure D24 Technology Drive Geofoam FWD Deflection Basin; May 23, 2007 ..................... D13Figure D25 Technology Drive Control FWD Deflection Basin; May 23, 2007 ....................... D13Figure D26 Technology Drive Geofoam FWD Deflection Basin; July 31, 2007 ..................... D14Figure D27 Technology Drive Control FWD Deflection Basin; July 31, 2007 ........................ D14Figure D28 Technology Drive Geofoam FWD Deflection Basin; November 15, 2007 ........... D15Figure D29 Technology Drive Control FWD Deflection Basin; November 15, 2007 .............. D15

LIST OF TABLES
Table 1 Report Notation .................................................................................................................. 2Table 2 FAA Seed Values [5] ....................................................................................................... 18Table 3 Closed Form Constants .................................................................................................... 25

EXECUTIVE SUMMARY
Construction near deep lakes and on tall embankments present challenging soil correction solutions. When used as fill, Geofoam attenuates net effective stress on weak soils. Geofoam, an XPS polystyrene with a unit weight of 1 to 3 lb/ft..3 was used as embankment fill for Minnesota Trunk Highway (TH) 100 segment 3 (SP 2735-159) in 2000. It was also used at Technology Drive in 2002 to correct a slope failure that had occurred in a large embankment near a ramp. The TH 100 project was proximate the Twin Lakes in the cities of Crystal and Robbinsdale in Minnesota. The active aquifer through which the lake was effluent to the Mississippi river and very unsuitable soils compounded the problem. The section with Geofoam inclusion consisted of a 10 in. dowelled jointed plain concrete pavement (JPCP) built over an 8 in. granular base, over 3 ft.. of granular fill over a 4 in. concrete cap placed over the Geofoam fill. The Technology Drive section was on a tall embankment bordering a storm water pond enclosed by the ramp and Highway. After initial construction, the section encountered an embankment failure. The designers then adopted a partial Geofoam replacement of embankment fill to solve the problem. The Technology Drive design consisted of a 7 in. bituminous pavement on a 6 in. granular base built over 3 ft.. of fill underlain with a 4 in. concrete cap placed over the Geofoam fill. The Geofoam thickness ranged from 8 to 30 ft. deep in the 500 ft. length portion of the ramp. Concerns about the vibration issues during and immediately after paving led to a retrofit of the sites with Multi-Depth-Deflectometers (MDD) and a two-year study of pavement response. The authors seasonally investigated flexible and rigid pavement response to Falling Weight Deflectometer (FWD) loads, loaded and calibrated snow and ice trucks through the MDDs, and a seismograph. This study compared seasonal deflection basins, elastic moduli, and dominant frequencies of flexible and rigid pavements built with Geofoam fill to their corresponding contiguous control sections. The 3 ft. (914 mm) granular fill above a 4 in. (150 mm) concrete cap above the Geofoam compounded the process of layer moduli computations. The Geofoam sections showed spectral (time series) sinusoidal characteristics for computed composite and layer moduli. Excitation and the deflection basin were generally larger in the Geofoam sections. Results also suggested high thermal gradients across the Geofoam layers accentuating their thermal insulating properties. Vibration amplitude acceleration and deflections were within non-resonant regimes though higher than control sections. This paper investigated the load response phenomena of the concrete pavement on the TH 100 section built over Geofoam.
• Investigated the load-response phenomena of bituminous pavement on Technology Drive built over Geofoam.
• Examined seasonal variations and determined if deflections, strains, and vibration are
excessive.

• Compared the flexible pavement response to the rigid pavement response.
• Recommended either further investigation or alternate load transfer mechanisms or
vibration damping strategies to preserve the pavements. The report concludes with interesting findings, particularly that the response of Geofoam pavements may exhibit higher deflections and vibration amplitudes and they are in a time series. However, these are not resonant vibrations that would require design changes from the current practice.

1
Chapter 1. INTRODUCTION
This report describes the responses of a flexible and rigid pavement built above lightweight fill (Geofoam blocks). Two different Geofoam (XPS polystyrene) test sections were studied, a rigid and a flexible pavement. The rigid pavement was a doweled jointed plain concrete pavement (JPCP) on TH 100 near County State Aid Highway (CSAH) 81 in Crystal/Robbinsdale. The Geofoam was used adjacent to Twin Lake to minimize environmental impacts to the lake and to address the slope issues related to the depth of twin lakes and the presence of water. The second roadway studied was a flexible pavement on Technology Drive in Eden Prairie. Technology drive is located adjacent to TH 5 and intersects Prairie Center Drive just south of the interchange between TH 5 and Prairie Center Drive. The next interchange east is TH 212/I-494. The Geofoam section was placed next to an adjacent storm pond. The original contract did not call for Geofoam blocks but after a slope failure, Technology Drive was re-excavated and Geofoam blocks were installed. The concrete pavement Geofoam section consisted of 11 in. of plain concrete with doweled joints over 4 in. of class 5 base above 21 in. of granular subbase above the Geofoam blocks. The Geofoam used for this project was ASTM Type VIII Expanded Polystyrene with a unit weight of 1.25 pcf and was approximately 12 feet in depth at the test section. A 5 in. thick concrete load distribution slab was placed over the Geofoam blocks underneath the driving lanes. A non-Geofoam control section was also constructed along TH 100. The control section consisted of 10.5 in. of plain concrete with doweled joints over a 4 in. class 5 base above 4 ft. of granular fill. The control hot mix asphalt (HMA) section of Technology drive consisted of 5 in. of HMA over 3 in. of aggregate base over 4 ft. of granular fill. In the test section, Geofoam blocks were placed on a 1 ft. select granular base. The top 32 in. of the Geofoam fill had a unit weight of 2.0 pcf with the unit weight of the remaining Geofoam being 1.25 pcf. The total height of the Geofoam fill was dependant on the road profile with a minimum height of 5 ft. and a maximum height of over 15 ft.. Nailing plates were used to fasten the Geofoam blocks together and a 20 mil geomembrane blanket was used over the entire lightweight fill section. A 5 in. thick concrete load distribution slab was poured over the Geofoam under the driving lanes. Above the load distribution slab, 3 ft. of road surfacing was utilized. These three feet included: a 5 in. HMA section, a 4.5 in. aggregate base, and the remaining 26.5 in. being select granular borrow. During construction of TH 100, field personnel brought up the concern of increased vibration and buoyant effects of the Geofoam sections. After the concrete pavement set, the level of vibration was reduced but not eliminated. Due to the observations of field personnel, it was decided to further investigate the effects of vibration on a Geofoam pavement structure.
Objective
The objective of this study was to compare the response of rigid and flexible pavements built over Geofoam block fill to identical pavements built over standard bases. This was accomplished through seasonal Falling Weight Deflectometer (FWD) testing.

2
Section Notation
Notation used in this report is shown in Table 1. Tests were taken seasonally over a variety of different pavements. Data is labeled based on the season, year, pavement, and base. Therefore SU6CG would mean that the data corresponds to the summer of 2006 and that it was taken on a concrete surface of the Geofoam section.
Table 1 Report Notation
Season Abbreviation Section Abbreviation Fall F Concrete C Spring S Bituminous B Summer SU Control C Winter W Geofoam G
Literature Review/Synthesis
Geofoam has been used extensively to reduce lateral loads in foundation structures. Negussey and Sun [1] investigated and reported the lateral load reduction of Geofoam and thus recommended its’ adequacy for fill behind retaining structures. One of the critical parameters in the use of Geofoam blocks is the interface friction of the Geofoam, which according to Sheeley and Negussey [2] eliminates the need for lateral clips. Frost differential is a critical parameter when using Geofoam fill in Minnesota. This has been minimized by design of granular fill and a concrete cap over the Geofoam blocks. The fill also minimizes buoyancy effects induced on the Geofoam when the phreatic surface is high. The mechanism of stress attenuation when Geofoam is used has not been exhaustively studied as there is little published in that area. Many documents were used as reference for the backcalculating procedure:
• FHWA, Backcalculation of Layer Parameters for Long-Term Pavement Performance (LTPP) Test Sections, Volume I: Slab on Elastic Solid and Dense-Liquid Foundation Analysis of Rigid Pavements, FHWA-RD-00-086, Washington, DC: FHWA, December 2001.
• FHWA, Backcalculation of Layer Parameters for LTPP Test Sections, Volume II:
Layered Elastic Analysis for Flexible and Rigid Pavements. FHWA-RD-01-113, Washington, DC: FHWA, December 2001.
• FAA, Use of Nondestructive Testing in the Evaluation of Airport Pavements, FAA AC 150/5370-11A, Landover, Maryland: FAA, December 2004.
Report Organization
This Report is divided into five chapters. Chapter one was an introduction to the Geofoam test sections. Chapter two is the project work plan. Chapter three will explain the testing and

3
monitoring, chapter four will discuss the results of the data collection, and chapter five will summarize findings and establish recommendations.

4
Chapter 2. RESEARCH PLAN AND TESTING SCHEDULE
Investigation of vi bration dyna mics of c oncrete a nd b ituminous pa vements c onstructed ov er Geofoam. Draft proposed work plan and research matrix.
Background
Office of Materials and Road Research purchased four Multi-Depth Deflectometers (MDD) for a proposed investigation of vibration dynamics of bituminous and concrete pavements constructed over Geofoam. These deflectometers were recently installed by a research crew of Tom Burnham, Ted Snyder, Doug Lindfelser, and Robert Strommen with the assistance of CTL’s Tom Weinmann. The installations are being connected to transmit data that can be read off our mobile MEGADEC system. Drilling to the concrete cap above the Geofoam was provided by a crew from the Geotechnical section. On the 23rd and 24th of August, the Multi-Depth Deflectometers were retro-fitted at two Geofoam project sites namely TH 100 at CSAH 81 in Crystal/ Robbinsdale (Concrete Pavement) and Technology Drive in Eden Prairie (Bituminous Pavement). In each site, one unit was installed as a control in a non-Geofoam location and the second was installed over Geofoam. Though these pavements have been in service for some years very little is known about the dynamic load response of pavements built on Geofoam beyond perception of bystanders. However, in close proximity, dynamic response is perceived to be different from pavements over granular or normal weight fills. The MDDs will supply dynamic response at various depths beneath the pavement surface. According to Tom Wienmann of CTL group, this is the first time this type of investigation would be done. This research project will improve our understanding of Flexible and Rigid Pavement response in a lightweight environment and suggest if we need to modify our designs to accommodate any increased dynamic response.
Distinct Objectives
o Investigate the load response phenomena of the Concrete Pavement on TH 100 section built over Geofoam.
o Outcomes: Load response phenomena will be different from pavement built on normal weight fill. Natural frequencies may be different and may result in unpredictable excitation at lower stresses. A better understanding will help us design Geofoam sections better when rigid pavements are placed.
o Investigate the load –response phenomena of bituminous pavement on Technology drive built over Geofoam.
o Outcomes: Load response phenomena will be different from pavement built on normal weight fill. Natural frequencies may be different and may result in unpredictable excitation at lower stresses. A better understanding will help us design Geofoam sections better when flexible pavements are placed.

5
o Determine if deflections, strains and vibration as are excessive. Compare the flexible pavement response to the rigid pavement response. Based on the above, recommend either further investigation or alternate load transfer mechanisms or vibration damping strategies to preserve the pavements.
o Outcomes: Combination of information from LVDT, seismograph and FWD will elucidate performance of pavements built over Geofoam.
Tasks
1. Site selection and confirmation o Identify a Geofoam section and a proximate non-Geofoam section for reference
(Preferably to accommodate a single static lane closure for both sites) on Technology drive by as built drawings of the Project. Confirm with Ground penetrating Radar.
o Identify a Geofoam section and a proximate non-Geofoam section for reference (Preferably to accommodate a single static lane closure for both sites) on TH 100 at CSAH 81 by as built drawings of the Project. Confirm with Ground penetrating Radar.
2. Instrumentation Installation: Retrofitting Multi- depth deflectometer
o Drill to bottom of granular fill above concrete cap layer over Geofoam or to 3.5 ft. whichever is smaller, taking every precaution to forestall cracking or perforation of the concrete cap.
o Install multi-depth deflectometers (MDD) on the selected location. Each location should have an LVDT targeted at the following depths, Figure 1: Location 1: Core or bottom of the Pavement surfacing (12 in. thick concrete and 10 in. thick bituminous Pavements Location 2: Near bottom of class 5 aggregate base Location 3: mid-depth of granular fill Location 4: bottom of granular fill
Create a manhole at the roadside and run wires through joints to the manhole, raised above shoulder level to minimize storm water impacts. Test for functioning LVDTs after Installation. Grout around shell and anchor to pavement.
Research Process
Seasonal load testing shall be performed in each of the sections. Load tests are therefore scheduled for November 2005, February 2006, April/May 2006, August 2006, November 2006, February 2007, April/May 2007, and November 2007 noting the actual climatic data for the day of testing. Each seasonal load test shall comprise the following:
o Create a fully loaded truck calibrated to have front axle and rear axle to make some rounds through the pavement sections if the MnROAD Standard Truck may not be

6
available. Run a minimum off 20 trips ensuring that in each trip, the MDD is directly loaded. This may be done in a continuum for proximate Geofoam and Non-Geofoam sections if traffic control allows.
o Perform FWD test and analyze for impact on neighboring panels while noting
longitudinal and transverse joint conditions.
o Perform seismic monitoring of the traffic load vibration, recording velocities and accelerations. Determine dependently or independently the natural frequency of panel or pavement in each section.
o Confirm actual profile, using ground penetrating radar technology.
Deflection data may be obtained continuously from the LVDTs. During load testing, the deflection data shall also be recorded compared analyzed along with FWD, GPR and seismographs.
Figure 1 TH 100 Geofoam Schematic Section

7
Deliverables
o A first year report will be due in January 2007
o The 2-year Report will be due in January 2008
o Based on this study, any suggested strategy for use of Geofoam will be communicated to the Mn/DOT Pavement Design Unit and Geotechnical Section
o Seismic, FWD and LVDT records to be saved electronically in one source with a
Concrete Research Unit designated person as custodian
Research Group
Investigators
Bernard I. Izevbekhai, Mn/DOT Office of Materials and Road Research, Research Section Ted Snyder, Mn/DOT Office of Materials and Road Research, Research Section Charles Howe, Mn/DOT Office of Materials and Road Research, Geotechnical Section
8
Chapter 3. TESTING, MONITORING, & DATA COLLECTION
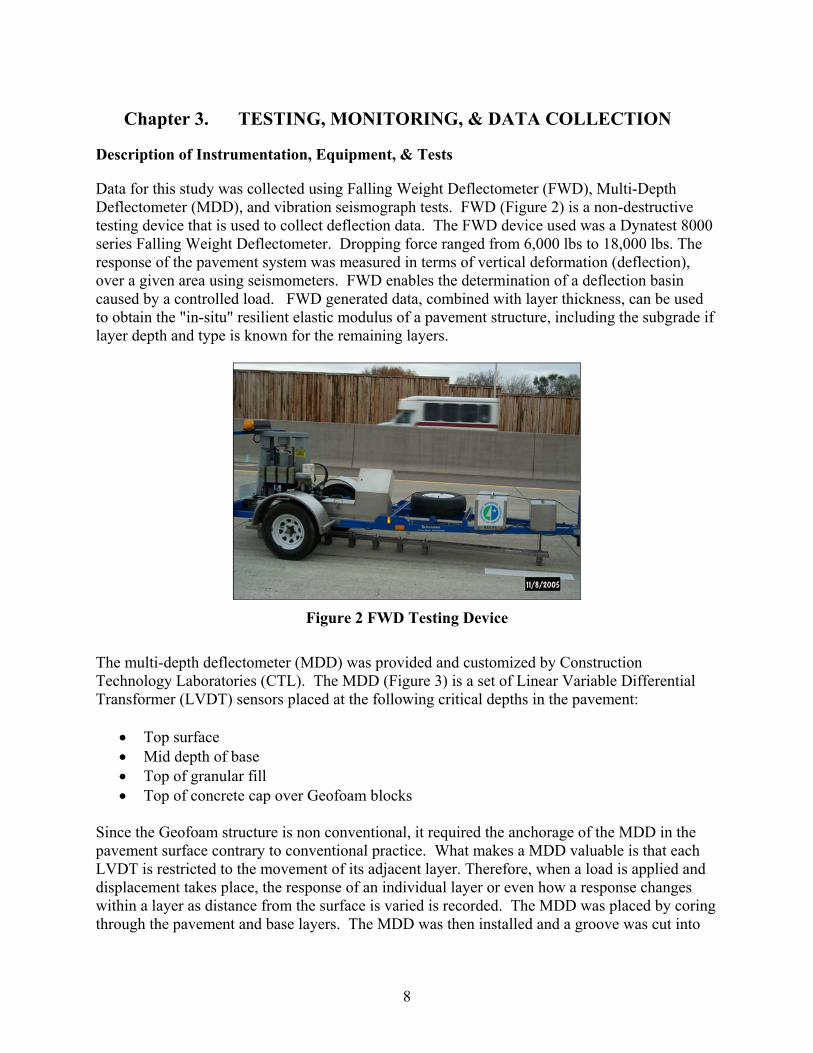
Description of Instrumentation, Equipment, & Tests
Data for this study was collected using Falling Weight Deflectometer (FWD), Multi-Depth Deflectometer (MDD), and vibration seismograph tests. FWD (Figure 2) is a non-destructive testing device that is used to collect deflection data. The FWD device used was a Dynatest 8000 series Falling Weight Deflectometer. Dropping force ranged from 6,000 lbs to 18,000 lbs. The response of the pavement system was measured in terms of vertical deformation (deflection), over a given area using seismometers. FWD enables the determination of a deflection basin caused by a controlled load. FWD generated data, combined with layer thickness, can be used to obtain the "in-situ" resilient elastic modulus of a pavement structure, including the subgrade if layer depth and type is known for the remaining layers.
Figure 2 FWD Testing Device
The multi-depth deflectometer (MDD) was provided and customized by Construction Technology Laboratories (CTL). The MDD (Figure 3) is a set of Linear Variable Differential Transformer (LVDT) sensors placed at the following critical depths in the pavement:
• Top surface • Mid depth of base • Top of granular fill • Top of concrete cap over Geofoam blocks
Since the Geofoam structure is non conventional, it required the anchorage of the MDD in the pavement surface contrary to conventional practice. What makes a MDD valuable is that each LVDT is restricted to the movement of its adjacent layer. Therefore, when a load is applied and displacement takes place, the response of an individual layer or even how a response changes within a layer as distance from the surface is varied is recorded. The MDD was placed by coring through the pavement and base layers. The MDD was then installed and a groove was cut into

9
the pavement to route the wires to the edge of the pavement. A PVC manhole was then constructed to house the connector ends of the MDD wires.
Figure 3 MDD Core and Manhole
The third tool used to collect data was an Instantel Blastmate III Vibration Seismograph, equipped with a triaxial velocity geophone (Figure 4). During our testing, this instrument measured a time history of vibration velocity in each of three mutually perpendicular directions (vertical, longitudinal, and transverse). From these three directions a peak acceleration, velocity, and displacement is measured for each vibration event. The geophone data presented in this report is from the vertical direction.
Figure 4 Geophone Adjacent to FWD

10
Data Collection
FWD Testing & FWD Sensor Response
The Falling Weight Deflectometer (FWD) was used to measure the deformation/deflection basins, trigger the MDD, and collect data using the geophone. The FWD accomplishes deflection/deformation measurements by applying a dynamic point load then the sensors, which are set at a predetermined distances from the applied force, measure deflection. The FWD device had 9 sensors spaced at 0mm (0in), 203mm (8in), 305mm (12in), 457mm (18in), 610mm (24in), 914mm (36in), 1219mm (48in), 1524mm (60in), and 1829mm (72in) from the point load. In Figure 5, the deflection is shown along the vertical axis and sensor distance from the point load is shown along the horizontal axis. The deflection basin is the distance versus deflection curve. As will be explained later, deflection at different points will give insight into what is happening at different depths within the pavement structure.
Basin Control Th 100 9K
0
20
40
60
80
100
120
140
160
180
0 500 1000 1500 2000
FWD Sensor Locations from Point of Load (mm)
Defle
ctio
n (M
icro
met
er)
W6CCF6CCF5CCSU6CC
Figure 5 Example FWD Deflection Basin
Deformation information can be used to back-calculate layer elastic moduli if the layer type and thickness is known. This report will utilize the use of a software product called BAKFAA from the Federal Aviation Agency (FAA) to calculate the elastic moduli for the different layers including the Geofoam.
11
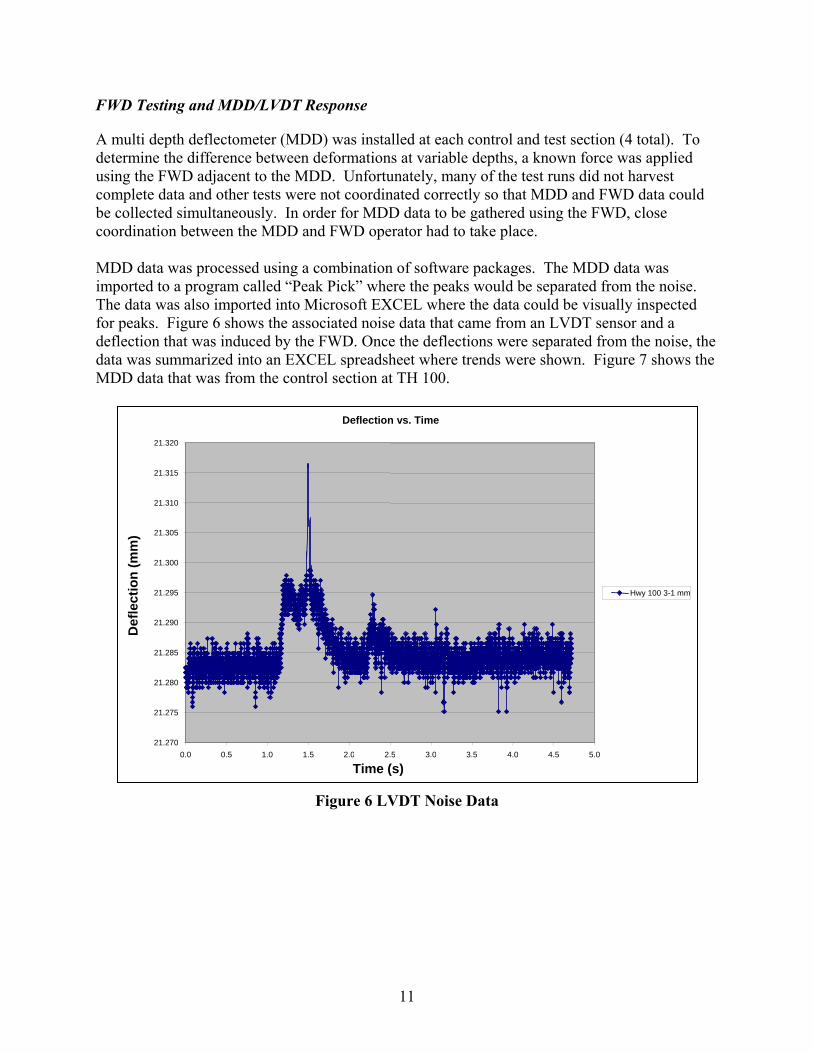
FWD Testing and MDD/LVDT Response
A multi depth deflectometer (MDD) was installed at each control and test section (4 total). To determine the difference between deformations at variable depths, a known force was applied using the FWD adjacent to the MDD. Unfortunately, many of the test runs did not harvest complete data and other tests were not coordinated correctly so that MDD and FWD data could be collected simultaneously. In order for MDD data to be gathered using the FWD, close coordination between the MDD and FWD operator had to take place. MDD data was processed using a combination of software packages. The MDD data was imported to a program called “Peak Pick” where the peaks would be separated from the noise. The data was also imported into Microsoft EXCEL where the data could be visually inspected for peaks. Figure 6 shows the associated noise data that came from an LVDT sensor and a deflection that was induced by the FWD. Once the deflections were separated from the noise, the data was summarized into an EXCEL spreadsheet where trends were shown. Figure 7 shows the MDD data that was from the control section at TH 100.
21.300
21.305
21.310
21.315
21.320
(mm
)
Figure 6 LVDT Noise Data
21.270
21.275
21.280
21.285
21.290
21.295
0.0 0.5 1.0 1.5 2.0 2.5 3.0 3.5 4.0 4.5 5.0 Time (sec)
Hwy 100 3-1 mm
Time (s)
Deflection vs. Time
Def
lect
ion

12
0.18
MDD Uppermost Sensor TH 100 Control Section
0
0.02
0.04
0.06
0.08
0.1
0.12
0.14
0.16
0 2000 4000 6000 8000 10000 12000 14000 16000 FWD Drop (lbs)
F5CC F5CG W6CG F6CC F6CG
Def
lect
ion
(mm
)
Figure 7 MDD Data from TH 100
Loaded Truck and LVDT Response
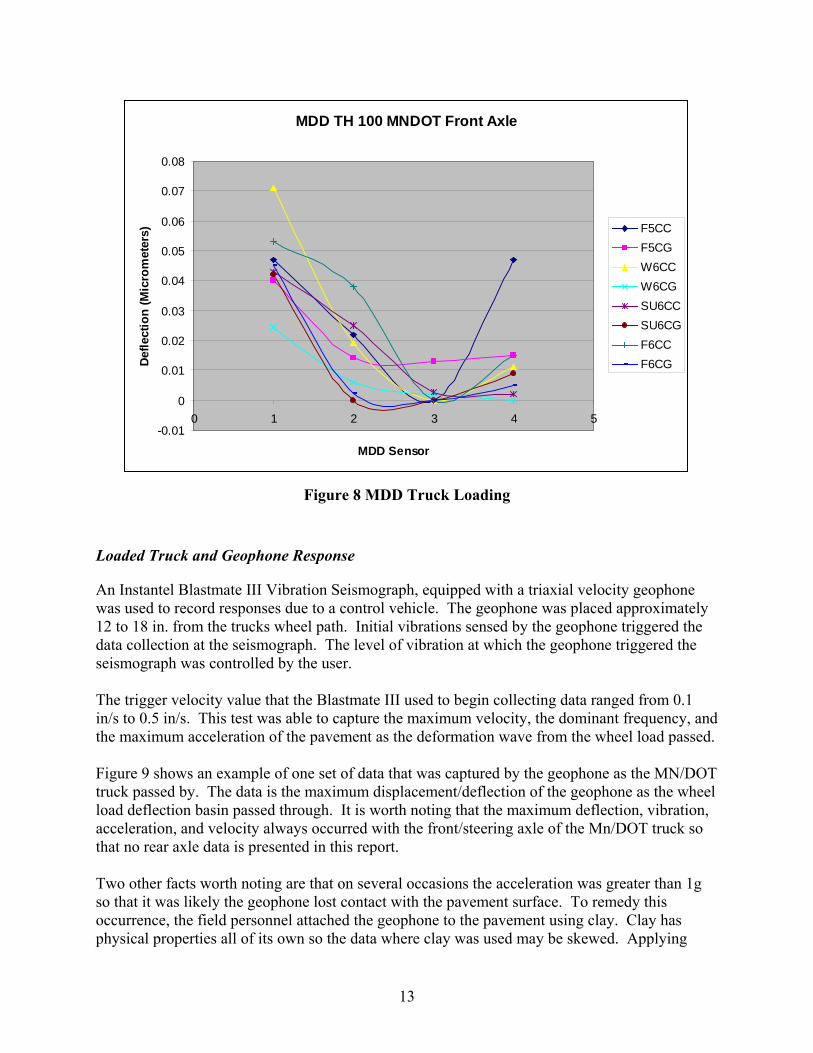
A multi depth deflectometer (MDD) was installed at each control and test section. To determine the difference between deformations at variable depths, a control vehicle (DOT Truck) was utilized. The truck was loaded with boulders and was sent to a weigh station where the axle loads were determined. The Mn/DOT truck attempted to drive directly over the MDD sensor. It should be noted that a constant speed was the goal, however, traffic control and road geometry made that goal unattainable at times. The variations in speed and wheel track did create some data variance. The truck testing of the MDD however did supply somewhat consistent tests which were trended for this report. Figure 8 shows deflection at different MDD sensors from the truck loading.
13
MDD TH 100 MNDOT Front Axle
-0.01
0
0.01
0.02
0.03
0.04
0.05
0.06
0.07
0.08
0 1 2 3 4 5
MDD Sensor
Defle
ctio
n (M
icro
met
ers) F5CC
F5CGW6CCW6CGSU6CCSU6CGF6CCF6CG
Figure 8 MDD Truck Loading
Loaded Truck and Geophone Response
An Instantel Blastmate III Vibration Seismograph, equipped with a triaxial velocity geophone was used to record responses due to a control vehicle. The geophone was placed approximately 12 to 18 in. from the trucks wheel path. Initial vibrations sensed by the geophone triggered the data collection at the seismograph. The level of vibration at which the geophone triggered the seismograph was controlled by the user. The trigger velocity value that the Blastmate III used to begin collecting data ranged from 0.1 in/s to 0.5 in/s. This test was able to capture the maximum velocity, the dominant frequency, and the maximum acceleration of the pavement as the deformation wave from the wheel load passed. Figure 9 shows an example of one set of data that was captured by the geophone as the MN/DOT truck passed by. The data is the maximum displacement/deflection of the geophone as the wheel load deflection basin passed through. It is worth noting that the maximum deflection, vibration, acceleration, and velocity always occurred with the front/steering axle of the Mn/DOT truck so that no rear axle data is presented in this report. Two other facts worth noting are that on several occasions the acceleration was greater than 1g so that it was likely the geophone lost contact with the pavement surface. To remedy this occurrence, the field personnel attached the geophone to the pavement using clay. Clay has physical properties all of its own so the data where clay was used may be skewed. Applying

14
mortar to the sensor would have been a more ideal fastener than clay. Secondly, when using a moving truck, variance in speed and distance to geophone is never constant so some variance in the data will be due to those factors. However, some very noticeable trends were identified using the collected data.
Max Deflection (in) of Geophone by MNDOT truck TH 100
F5CC
F5CG
W6CC
W6CG
SU6CC
SUCG
F6CC
F6CG
0
0.002
0.004
0.006
0.008
0.01
0.012
0.014
0.016
0.018
Def
lect
ion
(in)
F5CCF5CGW6CCW6CGSU6CCSUCGF6CCF6CG
Figure 9 Maximum Truck Deflection of Geophone on TH 100
FWD Testing and Geophone Response
An Instantel Blastmate III Vibration Seismograph, equipped with a triaxial velocity geophone was used to record responses due to a controlled force which was applied by a FWD. The geophone was placed approximately 12 to 18 in. from the FWD. The FWD would then apply force which would trigger the geophone to begin collecting data as the deflection wave progressed through the geophone. It is to be noted that on several occasions acceleration rates greater than 1g occurred and this may have skewed some of the data. Figure 10 displays one of the data types the geophone was able to capture when the FWD applied loads adjacent to the geophone. This chart displays maximum acceleration documented for a 15,000 lb load that was applied adjacent to the geophone. Even though acceleration values greater than 1g may be skewed, trends in the data are apparent.
Max Deflection of Geophone by Mn/DOT truck on TH 100

15
Maximum Acceleration 15K FWD TH 100
F5CG
W6CC
W6CG
SU6CC
SUCG
F6CC
F6CG
0
0.2
0.4
0.6
0.8
1
1.2
1.4
1.6
Acce
lera
tion
(g)
F5CGW6CCW6CGSU6CCSUCGF6CCF6CG
Figure 10 Maximum Acceleration Recorded by Geophone
Chapter Summary
Several different methods of data collection were used for this study. Data collecting instruments included a FWD, a MDD, and a seismograph with geophone. Data collection was either in response to a load applied by a FWD or in response to a control vehicle, which in this case was a Mn/DOT truck.

16
Chapter 4. ANALYSIS & DISCUSSION OF RESULTS
Deflection Basins
Deflection basin data can relate many interesting aspects of a pavement structure. The deflection/deformation basin is a tell tale of the underlying pavement strength, and when the deformation basin is used to back-calculate, the individual moduli for each layer if the layer type and thickness is known can be calculated. Deflection basin data was collected by all three instruments. However, only a magnitude of displacement is given with the seismograph and the MDD. The best basin data was collected using the FWD. The FWD gives a snap shot of a slice of the deflection basin made up of deflection values measured at sensors of predetermined distance from the center. As mentioned before, the FWD collects deflection data from the point the load is applied up to 1829 mm (72 in) away for this data collection. A two dimensional view of a deflection basin is shown in Figure 11. Barring transient phenomena and the effect of deflection hardening and other sources of error, the basin is an indicator of the composite and individual layer moduli. Instantaneous formation of a basin of deflection is analogous to a water drop impacting a larger body of water. At the moment the drop disappears into the greater mass of water there is a depression where the drop impacted and a wave propagates out from the drop impact. This phenomenon is evident on a stiffer structure, and forms the basis of the qualitative test roll process. Other examples include a heavy piece of equipment on an aggregate grade, a roller on fresh asphalt, or probably the best way to see a deflection basin over and over is to view a railroad track when a train is passing by.
Figure 11 Stresses in a Pavement due to Vertical Deflection
When data from a deflection basin is plotted (Figure 12) a very thin slice of the deflection basin is shown. If it is assumed that the deflection basin is uniform, then a complete basin picture can be built out of one thin cross section. The deflection basin can tell much about the underlying structure.

17
Sensor deflections from a FWD have a relationship to materials strength at a certain depth. The theory is that the further the sensor from the point of the applied load, the deeper that sensor is looking.
Basin 15K Geofoam Technology Drive
0
200
400
600
800
1000
1200
0 500 1000 1500 2000
FWD Sensor Locations from Point of Applied Force (mm)
Defle
ctio
n (m
icro
met
er)
S6BGSU6BGF6BG
Figure 12 Deflection Basin from Technology Drive
Determination of Composite Moduli for Technology Drive
The determination of component moduli for a flexible pavement design was accomplished using a software program called BAKFAA. BAKFAA is used by the Federal Aviation and Aeronautics department for pavement analysis. It requires FWD testing, for which the software calculates a best fit algorithm. The software attempts to calculate individual layer moduli given layer depth, FWD loading, poisson’s ratio, seed, and sensor location. An important fact to remember is that backcalculation results are not unique and are one of many possible solutions. In fact, the backcalculation moduli might very well be incorrect all together depending on the seed values entered and whether certain layers are locked in or if all layers are allowed to be calculated by BAKFAA. Engineering judgment must be used when considering backcalculation data. More information regarding BAKFAA and steps that can be taken to ascertain better results can be found in the FAA Report AC 150/5370 [5]. A seed value is simply a starting number that BAKFAA uses to determine a starting position. BAKFAA will use any seed values given and then adjust all parameters to calculate a best fit curve to most closely match the recorded FWD data. To determine a seed value for the in-situ

18
subgrade the resilient modulus of subgrade was determined. The resilient modulus of subgrade (Mr) is calculated in psi and is in accordance with the 1993 AASHTO Design Guide for HMA Pavements. It is given by:
=
rdPM
rr
24.0 (1)
where:
Mr = Resilient modulus, psi P = Applied load, pounds dr = Measured deflection at distance r from applied load, inch r = Radial distance at which the deflection is measured, inch
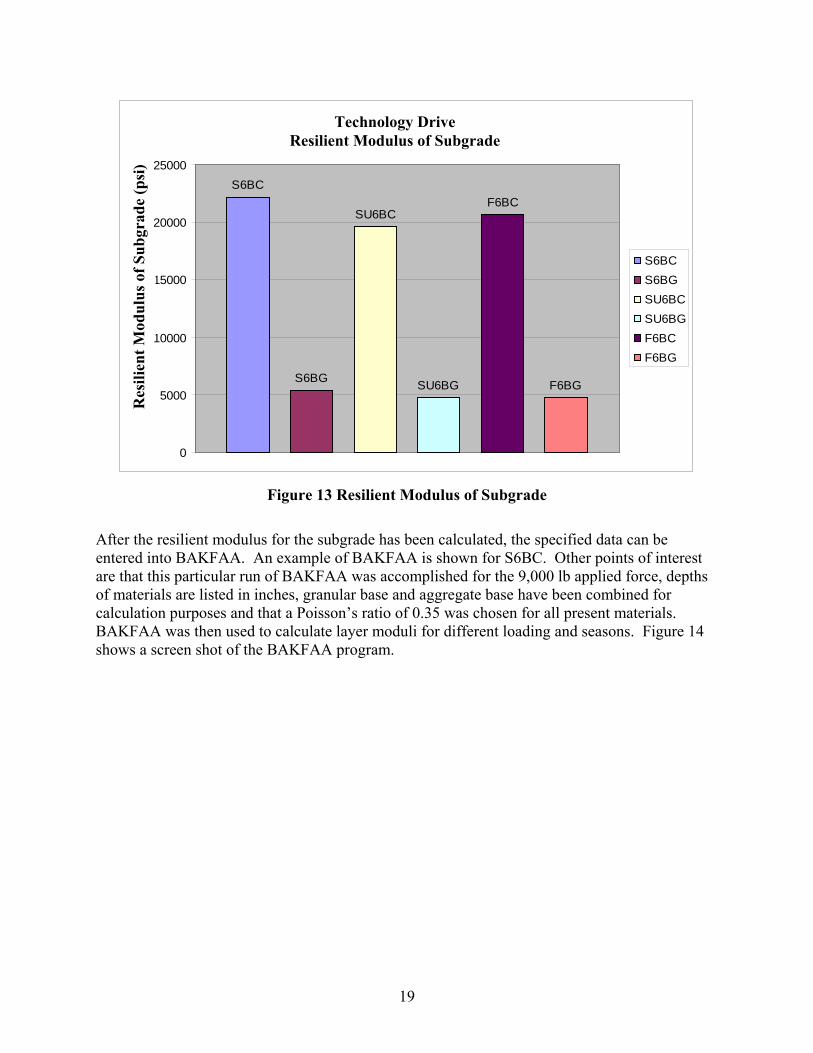
Other seed values are determined from past experience, engineering judgment, materials books, and FAA report AC 150/5370 [5]. Table 2 lists typical seed values. FAA report AC 150/5370 also gives values of expected moduli for certain materials. The following is part of Table 13 from FAA report AC 150/5370 [5]. This table can be used as a reality check for the backcalculation moduli and can also be used for seed values. Figure 13 specifies the different resilient modulus of subgrade calculated for each section of Technology drive during different times of the year. Note that the resilient subgrade is lower for the Geofoam sections, which is to be expected if the subgrade was of sufficient strength, no need for Geofoam would exists.
Table 2 FAA Seed Values [5]
Material Low Value
(psi) Typical Value
(psi) High Value
(psi) Asphalt Concrete 70,000 500,000 2,000,000 Portland Cement Concrete 1,000,000 5,000,000 9,000,000 Granular Base 10,000 30,000 50,000 Granular Subbase or Soil 5,000 15,000 30,000
19
Mr Technology Drive
5000
10000
15000
20000
25000
PSI
S6BCS6BGSU6BCSU6BGF6BCF6BG
S6BC
S6BG
SU6BC
SU6BG
F6BC
F6BG
0
Figure 13 Resilient Modulus of Subgrade
After the resilient modulus for the subgrade has been calculated, the specified data can be entered into BAKFAA. An example of BAKFAA is shown for S6BC. Other points of interest are that this particular run of BAKFAA was accomplished for the 9,000 lb applied force, depths of materials are listed in inches, granular base and aggregate base have been combined for calculation purposes and that a Poisson’s ratio of 0.35 was chosen for all present materials. BAKFAA was then used to calculate layer moduli for different loading and seasons. Figure 14 shows a screen shot of the BAKFAA program.
Technology Drive Resilient Modulus of Subgrade
R
esili
ent M
odul
us o
f Sub
grad
e (p
si)

20
Figure 14 BAKFAA Example
Seasonal variations due to temperature and moisture were prevalent. Figure 15 shows the corresponding elastic modulus for the bituminous layer at Technology Drive. The bars represent the control sections vs. the Geofoam sections and are taken during three different seasons. Fall of 2006 has two bars to represent the elastic modulus at the Geofoam section because the author does not believe the F6BG to be correct. The weather observations suggest that the surface pavement should have been frozen. Furthermore, the values for the granular base are higher then what would be expected for that material. The author believes the F6BG* bar to be most indicative of the two results. In order to get the F6BG* data, the resilient modulus of subgrade had to be fixed at the predetermined value and the seed value for bituminous had to be increased along with decreasing the seed value for the granular material. It should be noted however that the elastic modulus for bituminous was always greater in the control section then in the Geofoam section. Recall that elastic modulus is equal to a materials stress over strain and for the same material the elastic modulus should be the same. One potential reason for the differing moduli is that the BAKFAA software, or probably any other backcalculating software computes composite moduli and then spreads those moduli over all the layers according to the FWD deflection basin. The software recognizes reduced moduli for the Geofoam sections but does not distribute the moduli as it probably should. Another interesting trend to note is the moduli of the surfacing during different times of the year. Not surprisingly, the lowest moduli occurred in the summer when increased temperature makes

21
the asphalt softer. Alternatively, during the fall testing when temperatures were below freezing, the asphalt acted much stiffer and the corresponding moduli rose. In fact, it was found that variations in moduli due to weather were much greater than moduli deviations due to Geofoam. Figure 16 shows a summary of BAKFAA backcalculation results for elastic modulus, and two trends are apparent. Granular backcalculated elastic modulus differs from bituminous calculated elastic modulus in that the granular material over the Geofoam seems to have a higher modulus. This may be due to the fact that a concrete cap was poured over the Geofoam and that this concrete cap was not distinguished from the granular in the backcalculating procedure. Also note that seasonal variations are still prevalent and are apparently more influential on the granular material then the Geofoam. The last backcalculated elastic modulus from BAKFAA (Figure 17) illustrates the control subgrade (BC), the Geofoam subgrade (BG(S)), and the Geofoam (BG(G)). As stated before, the subgrade results are the most intuitive because it is expected that the subgrade beneath the Geofoam would be weaker, hence the need for Geofoam. Also, seasonal variation does not play a major role for subgrade in these test sections. An explanation of the fluctuation in layer and composite modulus was not feasible within the scope of this report. However subsequent papers will attempt to do that. It should be noted that elastic modulus is ideally only applicable for a homogenous, isotropic, and linear elastic material. A road surfacing structure is neither, but can be successfully modeled as such.
Techn
3,000,000
si)
ology Drive Elastic Modulus for Bituminous
S6BC S6BG
SU6BC SU6BG
F6BC
F6BG
F6BG*
S6BC S6BG SU6BC SU6BG F6BC F6BG F6BG*
0
500,000
1,000,000
1,500,000
2,000,000
2,500,000
PSI
Res
ilien
t Mod
ulus
of S
ubgr
ade
(p
Figure 15 Elastic Modulus for Technology Drive

22
Technology Dri
Figure 16 Elastic Modulus for Granular Material at Technology Drive
ve Elastic Modulus for Granular Material
S6BC
S6BG
SU6BC
SU6BG
F6BC
F6BG
F6BG*
0
10,000
20,000
30,000
40,000
50,000
60,000
PSI
S6BC S6BG SU6BC SU6BG F6BC F6BG F6BG*
E
last
ic M
odul
us (p
si)
Technology Drive Elastic Modulus Subgrade/Geofoam
S6BC
S6BG(G)
SU6BC
SU6BG (G)
SU6BG(S)
F6BC
F6BG(G) F6BG(S)
F6BG(G)* S6BG(S)
F6BG(S)*
0
5,000
10,000
15,000
20,000
25,000
Elas
tic M
odul
us (p
si)
S6BC S6BG(G) S6BG(S) SU6BC SU6BG (G) SU6BG(S) F6BC F6BG(G) F6BG(S) F6BG(G)* F6BG(S)*
Figure 17 Elastic Modulus Subgrade/Geofoam Technology Drive

23
Determination of Composite Moduli for Trunk Highway 100
The determination of effective moduli for rigid pavement was accomplished using calculations from the FAA report AC 150/5370-11A [5] and from methods outlined by Khazanovich et al. in the report FHWA-RD-00-086 [3]. The process of calculating the effective moduli for rigid pavement from FAA report AC 150/5370-11A and FHWA report FHWA-RD-00-086 will be explained below FAA report AC 150/5370 focuses on non destructive testing and evaluation using such data. Chapter 7 of the formerly mentioned report deals with deflection data analysis and the following steps are from that chapter. Unlike using BAKFAA for flexible pavement, the backcalculation for rigid pavement utilized in this report will give a unique answer. The method is referred to as the AREA based method, and the desired results are the subgrade reaction k and the effective pavement modulus. This report will use the FHWA report RD-00-086 and mimic the AREA calculation so that the relevant curves (3) may be used to record the radius of relative stiffness. The authors of this report then used various software products to calculate the subgrade reaction k, and the component moduli. This report however will not be concerned with calculations of various software products and will use the two methods as a comparison. The first step to calculating the composite moduli along with the subgrade reaction k, is to gather FWD data and then to determine AREA. The second step is to calculate the radius of relative stiffness, and finally to calculate the subgrade reaction k and the composite moduli. Determining AREA will be the next step since the FWD data has been gathered. AREA is not area; AREA is a one dimensional measure that has a direct relation to a specific radius of relative stiffness. AREA is calculated using the trapezoid rule and has been represented below to meet specific sensor arrangements. AREA4 (Eq. 2) is used with the Khazanovich et al. calculations, while AREA7 (Eq. 3) is used with the AC 150 calculations.
+
+
+=
0
36
0
24
0
124 612126
dd
dd
ddAREA Sensor
(2)
+
+
+
+
+=
0
60
0
36
0
24
0
12
0
87 12189564
dd
dd
dd
dd
ddAREA Sensor
(3)
where:
AREA = One dimensional, inches dx = Deflection of sensor at x inches from the applied load
AREA calculations for AREA4 and AREA7 do differ more than the author had anticipated based on the fact that both equations are stated to be based off of the trapezoid rule. Differences in AREA are magnified to be larger differences in the radius of relative stiffness and even larger differences in the composite elastic modulus.

24
A few trends can be identified from Figure 18. First, Geofoam sections always have higher AREA values than the control sections for a similar AREA calculation. Secondly, AREA7 values always have higher values than AREA4 values for this study. Also, there appears to be a trend in the summer that Geofoam sections have a lower AREA while the control sections have a higher AREA. After area has been calculated, the radius of relative stiffness can be calculated. The radius of relative stiffness can be found by using the chart created by Khazanovich et al., or it can be calculated by the FAA method in AC 150/5370. When using the chart created by Khazanovich et al., it is important to note that the AREA calculation is based off of a four sensor FWD with 12” sensor spacing. Also, the chart contains radius of relative stiffness curves for both a slab placed on an elastic solid base and dense liquid base. This report utilized the relationship between AREA and relative stiffness in regards to an elastic solid.
AREA 15K Load TH 100
25.0
30.0
35.0
40.0
45.0
50.0
55.0
Sep-05 Dec-05 Mar-06 Jul-06 Oct-06 Jan-07
In
CC A4CG A4CC A7CG A7
Figure 18 AREA Calculations on TH 100
The relationship between AREA and the radius of relative stiffness can be stated to be sensitive. The author defines this relationship as being sensitive, for a small change in one variable can lead to a considerable change it the other variable. Khazanovich et al. found the same fact to be true and stated:
A
REA
(in)

25
“As was found by Ionnides et al. (1989), an AREA-radius of relative stiffness relationship becomes almost flat for high radii of relative stiffness…. This means that small variability in a measured basin may cause significant variability in the backcalculated radius of relative stiffness [3].”
In summary, the method used to calculate the AREA can alone change greatly the radius of relative stiffness, and small errors in the FWD data gathering stage can create high variability in the calculated radius of relative stiffness. Radius of relative stiffness is calculated by the FAA method by Equation 4:
D
k CBAREAA
−
=ln
λ (4)
where:
kλ = Winkler foundation radius of relative stiffness, inch AREA = AREA as calculated (Eq. 2, 3) A, B, C, D = AREA-based constants
Constants A, B, C, and D (Table 3) are constants that are FWD and sensor spacing specific. The specific FWD used for this project is not listed in the table above; however, the FWD sensors used have been manipulated to reflect the FWD above for the area calculation. Once the constants A, B, C, and D are plugged into the above equation the radius of relative stiffness can be computed.
Table 3 Closed Form Constants
AREA Method Constant A B C D
1. SHRP 4-sensor (0 to 36 inches) 36 1812.279 -2.559 4.387
2. SHRP 7-sensor (0 to 60 inches) 60 289.078 -0.698 2.566
3. SHRP 5 outer sensors (12 to 60 inches) 48 158.408 -0.476 2.22
4. Air Force 6 outer sensors (12 to 72 inches) 60 301.8 -0.622 2.501
Figure 20 illustrates the trends in calculating the radius of relative stiffness for different methods of calculating AREA and for either the control sections or the Geofoam sections. The control sections of TH 100 are labeled CC while the Geofoam sections are labeled CG. The different methods for calculating AREA are stated as yKchart, yK4 or yK7. yKchart is the radius of

26
relative stiffness provided by the chart supplied in the report by Khazanovich et al. [3] and yK4 and yK7 are the radius of relative stiffness values calculated using either AREA4 or AREA7 from the FAA report [5].
Radius of Relative Stiffness 15K TH 100
20
30
40
50
60
70
80
Sep-05 Dec-05 Mar-06 Jul-06 Oct-06 Jan-07
CC yKchart CG yKchart CC yK4 CG yK4 CC yK7 CG yK7
Rad
ius o
f Rel
ativ
e St
iffne
ss (i
n)
Figure 19 Radius of Relative Stiffness Calculations
A few interesting trends can be stated about the radius of relative stiffness. First, the radius of relative stiffness is always greater for the same method on the Geofoam section. Secondly, the radius of relative stiffness increases with the addition of more sensors. The chart from FHWA-RD-00-0086 uses a four sensor FWD while the AREA4 also uses a 4 sensor FWD and finally the AREA7 utilizes a seven sensor FWD. The last interesting trend is that the radius of relative stiffness is greatest in the winter for the Geofoam and smallest in the summer. On the other hand, the radius of relative stiffness is greatest in the summer for the control sections and least in the winter. Once the radius of relative stiffness is known the modulus of subgrade reaction, k, and the effective elastic modulus can be calculated. The modulus of subgrade reaction k and the associated variables are calculated by Equation 5. Let it be noted that the variable d *
r will not be explained in this report and that guidance for calculating this variable can be found in the FAA report AC 150/5370-11A [5].
=
kr
r
ddP
k 2
*
**λ
(5)

27
where: k = Modulus of subgrade reaction, psi/inch P = Applied FWD load, pound
kλ = Winkler foundation radius of relative stiffness, inch d*r = Nondimensional deflection coefficient for radial distance r. dr = Measured deflection at radial distance r, inch
Figure 21 shows that the modulus of subgrade reaction was always higher for the control sections then the Geofoam sections. This fact intuitively makes sense because the Geofoam was placed over areas of weak subgrade. Another feature of Figure 21 is that k chart values are always greater than the k4 (AREA4 method) which are always greater than k7 (AREA7 method). It also appears that k4 and k7 is a better match than any other two combinations. This also can be expected considering that both k4 and k7 are derived from the methodology outlined in FAA report AC150/5370-11A [5] while the k chart values are derived from the chart created by the authors of the FHWA-RD-00-0086 [3] report. Once the modulus of subgrade reaction is calculated the effective elastic modulus can be calculated. The effective elastic modulus is calculated by Equation 6 [5]:
( )
−= 3
*22
***112
hddPE
r
rkλµ
(6)
where:
E = Effective elastic modulus, psi µ = PCC Poisson’s ratio P = Applied FWD load, pounds
kλ = Winkler foundation radius of relative stiffness, inch d*r = Nondimensional deflection coefficient for radial distance r dr = Measured deflection at radial distance r, inch h = Thickness of all bound layers above the subgrade, inch
Many interesting topics can be discussed with Figure 22. The first point of discussion that pops out is that the effective modulus for the Geofoam sections jumps up in the winter. No extreme cold weather took place over the winter and perhaps this is related to differential icing. The Geofoam could be insulating the surface material from the warmer material beneath and this could cause freezing of the surface and granular material. Secondly, there is a somewhat consistent trend within a section in that Geofoam sections peak at the same season while control sections somewhat mirror each other. Thirdly, again the AREA trend trickles down in that E7 is greater than E4 and E4 is greater than E chart for both the control sections and the Geofoam sections.

28
Modulus of Subgrade Reaction TH 100
0.0
100.0
200.0
300.0
400.0
500.0
600.0
700.0
800.0
Sep-05 Dec-05 Mar-06 Jul-06 Oct-06 Jan-07
psi/i
n
CC k chartCG k chartCC k4CG k4CC k7CG k7
Figure 20 Modulus of Subgrade Reaction TH 100

29
Effective Elastic Modulus TH 100
0
2,000,000
4,000,000
6,000,000
8,000,000
10,000,000
12,000,000
14,000,000
16,000,000
18,000,000
20,000,000
Sep-05 Dec-05 Mar-06 Jul-06 Oct-06 Jan-07
psi
CC E chartCG E chartCC E4CG E4CC E7CG E7
Figure 21 Effective Elastic Modulus TH 100
Determination of Component Moduli for Layers, Trunk Highway 100
The determination of component moduli for a rigid pavement design was accomplished using BAKFAA. To determine a seed value a statement from the FAA Report AC 150/5370-11A is used:
“If the PCC structure does not contain a stabilized base, HMA overlay, or PCC overlay, the backcalculated dynamic effective modulus is the PCC modulus of elasticity [5].”
After the seed values have been entered, the appropriate FWD data backcalculation can be done. Other points of interest are that this particular run of BAKFAA was accomplished for the 15,000 lb applied force, depths of material are listed in inches, granular base and aggregate base have been combined for calculation purposes, and that a Poisson’s ratio of 0.15 was chosen for the concrete while 0.35 was chosen for the remaining materials. BAKFAA was then used to

30
calculate layer moduli for different loading and seasons. Seasonal variations due to temperature and moisture were prevalent. Figure 23 shows the corresponding elastic modulus for the Portland Cement Concrete layer at Trunk Highway 100. The points on the chart represent the different modulus calculated by BAKFAA for the concrete layer during different seasons. The two lines represent the concrete above Geofoam (CG) and the concrete control (CC) section. The winter value for concrete was much higher for the measurement taken in February of 2006. This could potentially be due to the insulating properties of Geofoam. The month that the measurement was taken was not overly cold and did not have long spells of far below freezing temperatures. The author speculates that the Geofoam trapped subgrade heat from rising to the pavement surface and therefore the pavement surface froze, creating a stiffer section over the Geofoam section but not the control section. Secondly, the concrete over the Geofoam always had a greater modulus calculated by BAKFAA than the control section concrete calculated by BAKFAA.
Elastic Modulus PCC TH 100
0
2,000,000
4,000,000
6,000,000
8,000,000
10,000,000
12,000,000
14,000,000
16,000,000
18,000,000
Sep-05 Dec-05 Mar-06 Jul-06 Oct-06 Jan-07
psi CC PCC
CG PCC
Figure 22 Elastic Modulus PCC TH 100
As noted in the discussion on the HMA test section, the elastic modulus for the same material should be relatively similar. One potential reason for the differing moduli is that the BAKFAA software, or probably any other backcalculating software computes composite moduli and then spreads those moduli over all the layers according to the FWD deflection basin. The software recognizes reduced/increased moduli for a section but does not distribute the moduli as it probably should.

31
Figure 24 compares the granular, subgrade, and Geofoam elastic modulus and how they contrast by season. The calculated moduli for control sections are represented with squares while the calculated moduli for Geofoam sections are represented with triangles.
Elastic Modulus; Base, Geofoam, Subgrade TH 100
0
10,000
20,000
30,000
40,000
50,000
60,000
70,000
80,000
90,000
Sep-05 Dec-05 Mar-06 Jul-06 Oct-06 Jan-07
psi
CC Granular BaseCC SubgradeCG Granular BaseCG GeofoamCG Subgrade
Figure 23 Elastic Modulus: Base, Geofoam, Subgrade TH 100
The granular over Geofoam is calculated to have a higher elastic modulus then the granular at the control section. One potential reason for this is that a concrete cap was placed over the Geofoam blocks and this could increase the stiffness in the granular material. Secondly, the granular material over Geofoam has a spike in the elastic modulus over the winter testing period. This perhaps could be related to differential icing, or in this case as differential freezing. The Geofoam could be acting as a barrier to warm air rising from the subgrade allowing the granular material to freeze over the Geofoam while the granular material in the control section does not freeze. The third trend spotted is the increase in all materials elastic modulus for the winter testing. Perhaps materials are beginning to freeze or the top layer is freezing causing the composite elastic modulus to increase and then BAKFAA distributes this increase in the composite to all component layers. It should be noted that Young’s Modulus is ideally only applicable for a homogenous, isotropic, and linear elastic material. A road surfacing structure is neither, but can be successfully modeled as such.
Geofoam versus Control HMA Section
FWD deflection, MDD deflection, Geophone vibration/acceleration, and elastic modulus data will be used to compare the Geofoam section with the control section at Technology Drive. The

32
following trends were found to exist and will be explained in greater detail below. First, sections with Geofoam were found to have deeper deflection basins than the control sections. Secondly, maximum acceleration was found to be the same for both the control and the Geofoam section. Since the control section and the Geofoam section have the same maximum acceleration either maximum acceleration is happening longer at the Geofoam section or the pavement structure is accelerating longer at the Geofoam section/shorter at the control section. Longer acceleration will lead to greater velocity so it can be assumed that the Geofoam deflection is moving faster at some point then the control section. It could also be possible that the Geofoam has limited effect on the maximum acceleration and that acceleration is a variable of the surfacing or granular layers. Another supporting fact is that velocities are closer in the winter when the surface materials are stiffer, so perhaps a better way to explain acceleration and/or velocity is that the stiffer the surface material the less the underlying material affects the acceleration and or velocity of the above layers. Another possible conclusion is that since the frequency is higher for control sections and knowing that maximum accelerations are approximately the same while velocities and deflections are different is that Geofoam section deflections are deeper and broader while control sections are shallower and sharper. A potential worse case would involve a deep sharp deflection basin for that would place the maximum stress on the pavement as the deflection wave propagates with the wheel loading. Sections with Geofoam were found to deflect more than the control section at Technology Drive when the same loading was applied by the FWD, Figure 25. A correlation also existed within a season for the sensors located within 18 in. of the applied load. For example, during the summer deflection testing the Geofoam section had the greatest deflection of all the other seasons. This case was also seen for the control section for the sensors located within 24 in. of the applied load. Another trend is that Geofoam had less to do with maximum deflection then deflection at sensors beyond 24 in. The observations for this statement relate to the closeness of the control maximum deflection for a season to the same season Geofoam section compared to the closeness of those same two deflection basins beyond 24 in. from the applied load. It may be hypothesized that maximum deflection or deflection at the sensors within 24 in. of the applied load are more dependent on the surface material then that of the underlying Geofoam. However, it appears that the deflection basin as measured by sensors beyond 24 in. from the applied load are more greatly affected by underlying Geofoam then the surface material as seen by the increased gap between the control sections and the Geofoam sections. It also appears that the gap in between maximum deflections and deflections at 72 in. increase. Thus creating the appearance that the Geofoam deflection basin while deeper is broader. More testing beyond 72 in. is most likely needed and also one could fit an equation so the deflection basin and then derivate to see which slope is indeed greater.

33
Deflection Basin 9K Technology Drive
0
100
200
300
400
500
600
700
800
0 500 1000 1500 2000
FWD Sensor Locations from Point of Applied Force (mm)D
efle
ctio
n (m
icro
met
er)
S6BCS6BGSU6BCSU6BGF6BCF6BG
Figure 24 Deflection Basin at Technology Drive
Figure 26 shows the maximum acceleration caused by a Mn/DOT truck and measured by an Instantel Blastmate III Vibration Seismograph, equipped with a triaxial velocity geophone. The data is significant in that no significant trends were identified. During different seasons vibrations were measured to be higher or lower, but due to the variability in the speed of the truck, the placement of the wheel to the geophone, and that fact that the geophone could have been damaged, this author is not comfortable in identifying differences and will claim the acceleration is about equal for the different sections within a season. The last data to be observed will be the vibration data, Figure 27. The vibration data was also collected by the Instantel Blastmate III. The vibration data shows that the dominant frequency for the control section is always greater than the dominant frequency for the Geofoam section. The fall testing of 2006 was done in November and there is a possibility that the surface material had begun to freeze, so it would have been interesting to collect data on Technology drive in the winter months to see if freezing materials would cause a variance in the frequency. Since the frequency for the control is higher, the deflection waves are moving faster from crest to trough. However, the control section deflections are less than those of the Geofoam section so it is hard to say whether the control or the Geofoam section produces more stress on the pavement due to bending caused by the deflection waves.

34
Maximum Acceleration Using MnDOT Truck Technology Drive
S6BC
S6BG
SU6BCSU6BG
F6BC
F6BG
0
0.01
0.02
0.03
0.04
0.05
0.06
0.07
0.08
0.09
0.1Ac
cele
ratio
n (g
) S6BCS6BGSU6BCSU6BGF6BCF6BG
Figure 25 Acceleration Due to Mn/DOT Truck at Technology Drive
Frequency Technology Drive
S6BC
S6BG
SU6BC
SU6BG
F6BC
F6BG
0
5
10
15
20
25
30
Hz
S6BCS6BGSU6BCSU6BGF6BCF6BG
Figure 26 Frequency at Technology Drive

35
Geofoam versus Control Concrete
FWD deflection, MDD deflection, Geophone vibration/acceleration, and elastic modulus data will be used to compare the Geofoam section with the control section at Trunk Highway 100, Figure 28. The following trends were found to exist and will be explained in greater detail below. First, sections with Geofoam were found to have deeper deflection basins than the control sections. Secondly, maximum acceleration was found to be approximately the same for both the control and the Geofoam section. Since the control section and the Geofoam section have the same maximum acceleration either maximum acceleration is happening longer at the Geofoam section or the pavement structure is accelerating longer at the Geofoam section/shorter at the control section. Longer acceleration will lead to greater velocity so it can be assumed that the Geofoam deflection is moving faster at some point than the control section. It could also be possible that the Geofoam has limited effect on the maximum acceleration and that acceleration is a variable of the surfacing or granular layers. Another supporting fact is that velocities are closer in the winter when the surface materials are stiffer, so perhaps a better way to explain acceleration and/or velocity is that the stiffer the surface material the less the underlying material affects the acceleration and or velocity of the above layers. Another possible conclusion is that since the frequency is higher for control sections and knowing that maximum accelerations are approximately the same while velocities and deflections are different is that Geofoam section deflections are deeper and broader while control sections are shallower and sharper. A potential worse case would involve a deep sharp deflection basin for that would place the maximum stress on the pavement as the deflection wave propagates with the wheel loading.
Deflection Basin 9K TH 100
0
20
40
60
80
100
120
140
160
180
0 500 1000 1500 2000
FWD Sensor Locations from Point of Load (mm)
Def
lect
ion
(mic
rom
eter
s) F5CCF5CGW6CCW6CGSU6CCSU6CGF6CCF6CG
Figure 27 Deflection Basin at TH 100

36
Sections with Geofoam were found to deflect more than the control section at TH 100 when the same loading was applied by the FWD. A correlation also existed within a season. For example, during the winter testing the Geofoam section had less deflection than Geofoam sections during all other seasons, and during the summer deflection testing the Geofoam section had the greatest deflection of all the other seasons. This case is also true of the control section. Another interesting fact is that during the winter deflection testing the Geofoam section acted most like the control section. Considering the depth of Geofoam and the depth of the material below the Geofoam it is very unlikely that the Geofoam or the subgrade froze, therefore, the additional stiffness must be contributed to the upper layers, or the PCC and the granular base. Also, the warmer the temperature, or the softer the PCC/granular base the more the Geofoam affected deflection. This can be seen in that the difference in deflections from the control section to the Geofoam section is greatest in the summer time. From this observation, the stiffer the top layer, the less the underlying Geofoam effects deflection, or that the softer the top layer the greater the effect that underlying Geofoam has on deflection. Figure 29 shows the maximum acceleration caused by a Mn/DOT truck and measured by an Instantel Blastmate III Vibration Seismograph, equipped with a triaxial velocity geophone. The data is significant in that no significant trends were identified. During different seasons vibrations were measured to be higher or lower, but due to the variability in the speed of the truck, the placement of the wheel to the geophone, and that fact that the geophone could have been damaged, this author is not comfortable in identifying differences and will claim the acceleration is about equal for the different sections within a season. One noticeable trend however is the increase in acceleration in the winter testing. It appears that a pavement structure that becomes stiffer in the winter will accelerate faster. Figure 30 shows the dominate frequencies of vibration due to the Mn/DOT truck loading.
Maximum Acceleration with Moving MNDOT Truck
F5CC, 0.0464 F6CC, 0.0464
F5CG, 0.053
W6CC, 0.159 W6CG, 0.159
SU6CC, 0.0486SU6CG, 0.053
F6CG, 0.0464
0
0.02
0.04
0.06
0.08
0.1
0.12
0.14
0.16
0.18
Acce
lera
tion
(g)
F5CCF5CGW6CCW6CGSU6CCSU6CGF6CCF6CG
Figure 28 Maximum Acceleration by Mn/DOT Truck TH 100

37
Dominant Frequency
F5CC, 3.5
F5CG, 3.125
W6CC, 2.5W6CG, 2.67
SU6CC, 4.08
SU6CG, 3.5
0
0.5
1
1.5
2
2.5
3
3.5
4
4.5Fr
eque
ncy
(Hz)
F5CCF5CGW6CCW6CGSU6CCSU6CG
Figure 29 Dominant Frequency TH 100
The last data to be observed will be the vibration data. As stated previously, the vibration data was also collected by the Instantel Blastmate III. The vibration data shows that the dominant frequency for the control section is always greater than the dominant frequency for the Geofoam section. Since the frequency for the control is higher, the deflection waves are moving faster from crest to trough, or stated in another way, during any set time period, more waves occur on the control section then on the Geofoam section. However, the control section deflections are less than those of the Geofoam section so it is hard to determine whether the control or the Geofoam section produces more stress on the pavement due to bending caused by the deflection waves. The Work Plan document for this project claimed that field observations documented increased vibration over the Geofoam before the PCC surfacing was placed. From the data below, the response of the vibration frequency is little different and perhaps even less on Geofoam then on an adjacent control section. While it is noted that increased deflection takes place at the Geofoam section according to FWD data, the author has some doubts whether this difference would even be noticeable much less worth noting as a concern. If increased vibration frequency and magnitude did indeed take place, then the cap of concrete, the granular material, and the PCC surfacing must play a role in reducing the previously observed vibrations.
Control Concrete versus Control Geofoam HMA
FWD deflection, MDD deflection, Geophone vibration/acceleration, and elastic modulus data will be used to compare the PCC control section to the HMA control section The following trends were found to exist and will be explained in greater detail below. First, HMA sections at Technology Drive deflect more under a given load then the concrete sections at TH 100 for the

38
same given load, Figure 31. Secondly, temperature variations effect deflections on Technology drive to a greater extent then temperature variations on TH 100. Acceleration is greater for concrete sections in a season then for the same season of bituminous. The dominant frequency was not only higher in any one season for bituminous then concrete, but bituminous had a higher dominant frequency regardless of which season was compared.
Deflection Basin 15K
0
100
200
300
400
500
600
700
800
900
0 500 1000 1500 2000
FWD Sensor Location from Point of Applied Load (mm)
Def
lect
ion
(mic
rom
eter
)
F5CCW6CCSU6CC F6CCS6BCSU6BCF6BC
Figure 30 Deflection Basin TH 100 vs. Technology Drive Control Sections
Control sections at Technology drive were found to deflect more than control sections at Trunk Highway 100 and were affected more by changes in the weather. Technology drive deflections were much greater for the sensors within 610 millimeters (24 in.) of the applied load then sensors located more than 915 mm (36 in.). At the sensors located the furthest from the applied load, deflections are nearly identical. The reason for the larger deflection adjacent to the applied load is two fold. First, the asphalt itself deflects under load and that is the reason why when calculating AREA the sensor directly over the applied load is not used. Secondly, hot mix asphalt is a flexible pavement while portland cement concrete is a rigid pavement. A rigid pavement disperses a load over a wider area than a flexible pavement. The sensors that measure deflection on a FWD are set so that the sensors adjacent to the load measure the deflection of the surfacing while the sensors furthest from the load measure the deflection of the materials at deeper levels. Therefore the pavement at Technology Drive will have a lower elastic modulus and less load distribution then the pavement at TH 100, but since the sensors located over 1524 mm (60 in.)

39
are nearly identical it can be assumed that the roadways are built over subgrades that have similar elastic moduli. Secondly, it has been noted that changes in temperature affected the HMA at Technology Drive greater than temperature affected PCC at TH 100. It can be noted that as HMA freezes it acts more as if it were concrete. This is the case because temperature affects the flexibility of the asphalt binder in the mix. The warmer the temperature the more flexible the binder becomes, and the colder the more stiff the binder becomes. The stiffer the binder the stiffer the pavement, the stiffer the HMA the more it resembles concrete. Figure 32 shows the maximum acceleration caused by a Mn/DOT truck measured by an Instantel Blastmate III Vibration Seismograph, equipped with a triaxial velocity geophone. The acceleration is always greater for the PCC section than the HMA section. Unfortunately, only two seasons can be compared but the acceleration for 2005 and 2006 fall PCC is greater than the 2006 fall HMA. Also, the summer of 2006 has a similar comparison. A stiffer pavement structure will lead to a greater degree of acceleration for a load of similar magnitude. A more noticeable point is the increase in acceleration in the winter testing. It appears that a pavement structure that becomes stiffer in the winter will accelerate faster. Winter data at Technology Drive would have been beneficial in supporting this claim. Figure 33 shows the dominant measured frequencies at the control sections.
Maximum Acceleration from MnDOT Truck
F5CC
W6CC
SU6CC F6CC
S6BC
SU6BCF6BC
0
0.02
0.04
0.06
0.08
0.1
0.12
0.14
0.16
0.18
Acce
lera
tion
(g)
F5CCW6CCSU6CCF6CCS6BCSU6BCF6BC
Figure 31 Maximum Acceleration by Mn/DOT Truck at Control Sections

40
Dominant Frequency 15K
W6CC
SU6CCF6CC
S6BCSU6BC
F6BC
0
5
10
15
20
25
30Fr
eque
ncy
(Hz)
W6CCSU6CCF6CCS6BCSU6BCF6BC
Figure 32 Dominant Frequency at Control Sections
The vibration data was also collected by the Instantel Blastmate III. The vibration data shows that the dominant frequency for the HMA control section is always greater than the dominant frequency for the PCC section regardless of the season. Since the frequency for the HMA is higher, the deflection waves are moving faster from crest to trough, or stated in another way, during any set time period for the same applied load, more waves occur at the HMA control section then on the PCC control section. Even though the HMA section has greater deflections and deflection waves that are moving faster, it cannot be determined if more or less damage to the pavement structure is happening because of the difference in pavement response of flexible and rigid pavement.
Concrete Geofoam versus HMA Geofoam
FWD deflection, MDD deflection, Geophone vibration/acceleration, and elastic modulus data was used to compare the PCC Geofoam section to the HMA Geofoam section The following trends were found to exist and will be explained in greater detail below. First, HMA sections at Technology Drive deflect more under a given load then the concrete sections at TH 100 for the same given load. Secondly, temperature variations effect deflections on Technology drive to a greater extent than temperature variations on TH 100. Third, acceleration is greater for concrete sections in a season than for the same season of bituminous. Lastly, the dominant frequency did not have discernable trends between the concrete and asphalt section, but an outlier is worth some discussion.

41
The Geofoam section at Technology Drive were found to deflected more than Geofoam sections at Trunk Highway 100 and were affected more by changes in the weather, Figure 34. Technology Drive deflections were much greater for the sensors within 610 millimeters (24 in.) of the applied load then sensors located more than 915 mm (36 in.). At the sensors located the furthest from the applied load, deflections are similar but not nearly as similar as the control sections. The reason for the larger deflection adjacent to the applied load is twofold. First, the asphalt itself deflects under load and that is the reason why when calculating AREA the sensor directly over the applied load is not used. Secondly, hot mix asphalt is a flexible pavement while Portland cement concrete is a rigid pavement. A rigid pavement disperses a load over a wider area than a flexible pavement. The sensors that measure deflection on a FWD are set so that the sensors adjacent to the load measure the deflection of the surfacing while the sensors furthest from the load measure the deflection of the materials at deeper levels. The pavement at Technology Drive should have a lower elastic modulus and less load distribution then the pavement at TH 100. The sensors located over 1524 mm (60 in.) are in closer agreement, but still do differ. The reason could be differences in Geofoam used or perhaps differing subgrades.
Deflection Basin Gofoam Sections 15K
0
200
400
600
800
1000
1200
0 500 1000 1500 2000
FWD Sensor Location from Point of Applied Load (mm)
Defle
ctio
n (m
icro
met
er)
F5CGW6CGSU6CGF6CGS6BGSU6BGF6BG
Figure 33 Deflection Basin Geofoam Sections at TH 100 and Technology Drive
Secondly, it has been noted that changes in temperature affected the HMA at Technology Drive greater than temperature affected PCC at TH 100. As HMA freezes it acts more as if it were concrete. This is the case because temperature affects the flexibility of the asphalt binder in the mix. The warmer the temperature the more flexible the binder becomes, and the colder the more stiff the binder becomes. The stiffer the binder the stiffer the pavement, the stiffer the HMA the more it resembles concrete.

42
Figures 35 and 36 show the maximum acceleration caused by a15 kip load applied by a FWD and a Mn/DOT truck respectively. The acceleration was measured by an Instantel Blastmate III Vibration Seismograph, equipped with a triaxial velocity geophone. It is difficult to identify trends for the acceleration data obtained by using the FWD and the data collected by using the Mn/DOT truck to now agree with each other. Due to difficulties in gathering this data the author does not want to draw conclusions from the data. The vibration data was also collected by the Instantel Blastmate III, Figure 37. Except for the summer of 2006 at Technology Drive, it would appear that the dominant frequency data is slightly higher at the HMA sections than at the PCC sections. The summer of 2006 at Technology Drive however had a much lower dominant frequency than the other two seasons for the same road and the dominant frequency was much lower than the summer data for 2006 at TH 100.
Maximum Acceleration Geofoam Sections 15K
F5CG
W6CG
SU6CGF6CG
S6BC
SU6BG
F6BG
0
0.2
0.4
0.6
0.8
1
1.2
1.4
1.6
1.8
2
Acce
lera
tion
(g)
F5CGW6CGSU6CGF6CGS6BCSU6BGF6BG
Figure 34 Maximum Acceleration from FWD Geofoam Sections

43
Maximum Acceleration of Geofoam Sections from MnDOT Truck
F5CG
W6CG
SU6CGF6CG
S6BG
SU6BG F6BG
0
0.02
0.04
0.06
0.08
0.1
0.12
0.14
0.16
0.18Ac
cele
ratio
n (g
)
F5CG
W6CG
SU6CG
F6CG
S6BG
SU6BG
F6BG
Figure 35 Maximum Acceleration of Geofoam Sections from Mn/DOT Truck
Dominant Frequency Geofoam Sections 9K
F5CG
W6CG SU6CG F6CG
S6BG
SU6BG
F6BG
0
2
4
6
8
10
12
14
16
18
20
Dom
inan
t Fre
quen
cy (H
z)
F5CGW6CGSU6CGF6CGS6BGSU6BGF6BG
Figure 36 Dominant Frequency Geofoam Sections

44
General, Correlative and Non-Correlative Trends
There are many trends that were observed on TH 100 and Technology Drive. These trends included deflection, elastic modulus, acceleration, and frequency.
Chapter Summary
This chapter compared seasonal deflection basins, elastic moduli, and dominant frequencies of flexible and rigid pavements built with Geofoam fill to their corresponding contiguous control sections. The 4 in. (150mm) concrete cap beneath the 3 ft. (914-mm) granular fill above the Geofoam compounded the process of layer moduli computations. Geofoam sections showed spectral (time series) sinusoidal characteristics for computed composite and layer moduli. Excitation and the deflection basin were generally larger in the Geofoam sections. Results also suggested high thermal gradients across the Geofoam layers accentuating their thermal insulating properties. Vibration amplitudes, acceleration, and deflections were within non-resonant regimes though higher than control sections.

45
Chapter 5. CONCLUSION
The authors instrumented pavement sections that the Minnesota Department of Transportation had built over Geofoam lightweight fill and compared them to coterminous control sections of granular fill.
• Deflection basins encountered with the Geofoam sections of each pavement type were consistently higher (in terms of “AREA”) or basin coordinates than the control.
• Computed seasonal moduli based on FWD testing in the Geofoam sections follow a time
series and are seasonal. The Control section does not follow that time series.
• Seismographic monitoring accentuated higher dominant frequencies in of the bituminous pavement over Geofoam sections
• After 6-years, the Geofoam sections do not exhibit poor surface rating or lower pavement
capacity parameters than is prevalent in the corridor. An experiment beyond the present scope determining the natural frequencies of the pavement systems can expose the proximity of current vibration data mechanistically to resonance. Resonant frequencies can surely result in premature failure at incredibly low loading. This study provides an empirical assessment of the vibrations in the Geofoam sections and found no reason to change the current design existing design process of pavements over Geofoam, providing all the buoyancy effects and capping of the Geofoam are adequately considered in the design.
• The experiment validated the expected relative composite moduli and layer moduli and
reinforces the importance of choosing the right back-calculation process for the right situation.
Recommendations
Until the MDDs are removed from the pavement, it is recommended that continuous seasonal monitoring be done.
o If possible conduct the same experiment in a Geofoam pavement without the concrete cap. It can easily be analyzed by layered elastic process of by the analytical process of Khazanovich et al.

46
REFERENCES
1) Negussey, D. and Sun, M., “Reducing Lateral Pressure by Geofoam (EPS) Substitution.” International Symposium on EPS Construction Method, Tokyo, Japan, October, 1996.
2) Sheeley, M. and Negussey, D., “An Investigation of Geofoam Interface Strength
Behavior,” American Society of Civil Engineers, Geotechnical Special Publications No. 112, Proceedings of the Soft Ground Technology Conference, Noorwijkerhout, the Netherlands, 2000.
3) FHWA, Backcalculation of Layer Parameters for Long-Term Pavement Performance
(LTPP) Test Sections, Volume I: Slab on Elastic Solid and Dense-Liquid Foundation Analysis of Rigid Pavements, FHWA-RD-00-086, Washington, D.C., December, 2001.
4) FHWA, Backcalculation of Layer Parameters for LTPP Test Sections, Volume II:
Layered Elastic Analysis for Flexible and Rigid Pavements. FHWA-RD-01-113, Washington, D.C., December, 2001.
5) FAA, Use of Nondestructive Testing in the Evaluation of Airport Pavements, FAA AC
150/5370-11A, Landover, MD, December, 2004.

APPENDIX A. ULTIMATE RESPONSE DATA

A-1
PCC TH100
LVDT 6000 7000 9000 12000 15000 17000 fr. axle rear axle 6000 7000 9000 12000 15000 17000 fr. axle rear axle1 0.03 0.03 0.08 0.047 0.01 0.014 0.02 0.031 0.04 Noise2 0.014 0.025 0.048 0.022 0.013 0.008 Noise Noise 0.014 Noise3 0.015 0.018 0.017 Noise Noise Noise Noise Noise 0.013 Noise4 0.016 0.015 0.016 0.047 0.004 Noise Noise Noise 0.015 Noise
FWD Sensor1 72 105 175 129 155 2422 72 97 163 122 150 2373 69 92 156 121 148 2344 65 87 146 117 144 2295 60 81 136 114 139 2226 51 68 115 105 128 2067 42 57 95 97 118 1928 35 47 78 86 106 1759 29 39 65 78 96 157
Vibration Monitoringacc. (g)geophone 1 no data no data no data 0.0464 --- 0.53 0.698 1.5 0.053 ---acc. (g)geophone 2 no data no data no data ** ** no data no data no data ** **velocity (ips)geophone 1 no data no data no data 0.06 --- 0.553 0.742 1.177 0.143 ---velocity (ips)geophone 2 no data no data no data ** ** no data no data no data ** **Maximum Deflection (inches) no data no data no data no data no data no data 0.00271 ** no data 0.00314 0.00397 0.00633 0.00816 **dominant frequency (Hz)geophone 1 no data no data no data 3.5 --- 16.15 13.3 14.4 3.125 ---dominant frequency (Hz)geophone 2 no data no data no data ** ** no data no data no data ** ***LVDT and FWD displacement data are in microns.**Only one geophone was used for the truck vibration monitoring.---rear axle sensor response not discernable from front axle sensor response, maximum sensor response assumed to be associated with front axle."no data" means that no data was collected.
FWD Loaded Truck FWD Loaded TruckCONTROL CONCRETE PAVEMENT TH 100 GEOFOAM CONCRETE PAVEMENT TH 100CODE F5CC CODE F5CG
ULTIMATE RESPONSE DATA
Figure A1

A-2
LVDT 6000 9000 10000 12000 15000 18000 fr. axle rear axle 6000 9000 10000 12000 15000 18000 fr. axle rear axle1 Noise Noise Noise 0.071 0.045 0.031 0.088 0.157 0.0242 0.0182 Noise Noise Noise 0.019 0.007 0.011 0.014 0.019 0.006 0.00593 Noise Noise Noise Noise Noise Noise Noise Noise 0.0016 0.00114 Noise Noise Noise 0.011 0.007 0.003 0.007 0.02 Noise Noise
FWD Sensor1 41.9 73.2 121.9 54.1 80.5 133.12 39.6 68.6 114.6 52.8 79 131.13 37.6 66.3 109 52.6 77.5 128.34 34.5 61.5 101.1 51.6 75.9 125.75 32.3 57.4 94.7 50.3 73.4 123.26 27.7 49 81 48.3 69.6 115.17 23.9 42.4 68.6 45.7 65.3 108.58 20.3 35.6 58.7 44.2 60.7 100.39 17 30.5 49 41.7 56.9 95
Vibration Monitoringacc. (g)geophone 1 0.239 0.477 0.777 0.159 --- 0.406 0.636 1.22 0.159 ---acc. (g)geophone 2 no data no data no data ** ** no data no data no data ** **velocity (ips)geophone 1 0.17 0.32 0.55 0.075 --- 0.23 0.39 0.67 0.08 ---velocity (ips)geophone 2 no data no data no data ** ** no data no data no data ** **Maximum Deflection (inches) 0.00085 0.00149 0.00242 0.00214 ** 0.00127 0.00206 0.00329 0.00633 **dominant frequency (Hz)geophone 1 20.8 14.5 15.6 2.5 --- 15.3 15 16 2.67 ---dominant frequency (Hz)geophone 2 no data no data no data ** ** no data no data no data ** ***LVDT and FWD displacement data are in microns.**Only one geophone was used for the truck vibration monitoring.---rear axle sensor response not discernable from front axle sensor response, maximum sensor response assumed to be associated with front axle."no data" means that no data was collected.The second geophone was not used for this sampling event. The first geophone was placed ~12"-18" from the shot.
FWD Loaded Truck FWD Loaded TruckCONTROL CONCRETE PAVEMENT TH 100 GEOFOAM CONCRETE PAVEMENT TH 100CODE W6CC CODE W6CG
ULTIMATE RESPONSE DATA
Figure A2

A-3
HMA Technology Drive
LVDT 6000 9000 12000 15000 fr. axle rear axle 6000 9000 12000 15000 fr. axle rear axle1 no data no data no data 0.45 0.15 No Data No Data No Data 0.41 0.382 no data no data no data 0.4 0.26 No Data No Data No Data 0.004 -3 no data no data no data 0.27 0.15 No Data No Data No Data 0.3 0.224 no data no data no data 0.42 0.25 No Data No Data No Data 2 1.33
FWD Sensor1 381 490 633 523 667 8402 305 395 507 363 475 6073 262 341 437 322 424 5414 212 276 354 276 368 4705 168 219 280 241 323 4156 101 132 169 197 267 3447 65 86 109 170 235 3038 43 54 - 150 211 2729 35 45 - 133 190 246
Vibration Monitoringacc. (g)geophone 1 3.19 4.22 4.29 0.0663 --- 1.03 1.16 1.41 0.0861 ---acc. (g)geophone 2 no data no data no data ** ** no data no data no data ** **velocity (ips)geophone 1 1.43 1.69 1.93 0.08 --- 0.945 1.185 1.485 0.129 ---velocity (ips)geophone 2 no data no data no data ** ** no data no data no data ** **Maximum Displacement (Inches) 0.00591 0.00763 0.00979 0.00462 ** 0.00578 0.00742 0.00956 0.00657 **dominant frequency (Hz)geophone 1 24.5 19.5 19.8 2.5 --- 17.5 15.3 16.5 2.13 ---dominant frequency (Hz)geophone 2 no data no data no data ** ** no data no data no data ** ***LVDT and FWD displacement data are in microns.**Only one geophone was used for the truck vibration monitoring.---rear axle sensor response not discernable from front axle sensor response, maximum sensor response assumed to be associated with front axle."no data" means that no data was collected.The second geophone was not used for this sampling event. The first geophone was placed ~12"-18" from the shot.
FWD Loaded Truck FWD Loaded TruckCONTROL BIT PAVEMENT ON TECH. DRIVE GEOFOAM BIT. PAVEMENT ON TECH. DRIVE
ULTIMATE RESPONSE DATA CODE S6BC CODE S6BG
Figure A3

A-4
LVDT 6000 9000 12000 15000 fr. axle rear axle 6000 9000 12000 15000 fr. axle rear axle1 0.09 0.12 0.15 0.42 0.33 1.99 2.96 2.71 Noise Noise2 0.25 0.31 0.36 0.7 0.62 0.03 0.01 0.03 0.03 0.0273 0.5 0.51 0.47 0.64 0.45 0.5 1.05 1.2 0.35 0.324 2.57 2.94 4.12 0.21 0.1 0.11 0.15 0.21 0.32 0.29
FWD Sensor1 538 699 845 727 907 10712 398 507 605 481 611 7233 319 407 484 404 514 6074 235 300 356 332 427 5015 173 219 259 287 371 4376 93 118 139 236 309 3667 61 78 92 206 273 3238 49 62 73 183 244 2889 39 53 63 163 220 258
Vibration Monitoringacc. (g)geophone 1 0.897 1.09 1.32 0.0365 --- 0.813 0.954 1.09 0.0398 ---acc. (g)geophone 2 0.146 0.166 0.181 ** ** 0.179 0.159 0.239 ** **velocity (ips)geophone 1 0.992 1.22 1.39 0.136 --- 0.863 1.08 1.28 0.103 ---velocity (ips)geophone 2 0.123 0.15 0.178 ** ** 0.338 0.448 0.548 ** **Maximum Displacement (Inches) 0.00487 0.00604 0.00707 0.00365 ** 0.00604 0.0076 0.00963 0.00884 **dominant frequency (Hz)geophone 1 29 24 21 2.25 --- 6.5 5.5 5 4.42 ---dominant frequency (Hz)geophone 2 14.75 12 10.5 ** ** 6.5 5.5 6 ** ***LVDT and FWD displacement data are in microns.**Only one geophone was used for the truck vibration monitoring.---rear axle sensor response not discernable from front axle sensor response, maximum sensor response assumed to be associated with front axle."no data" means that no data was collected.
FWD Loaded Truck FWD Loaded TruckCONTROL BIT PAVEMENT ON TECH. DRIVE GEOFOAM BIT. PAVEMENT ON TECH. DRIVE
ULTIMATE RESPONSE DATA CODE SU6BC CODE SU6BG
Figure A4

A-5
LVDT 6000 9000 12000 15000 fr. axle rear axle 6000 9000 12000 15000 fr. axle rear axle1 Noise Noise Noise 0.17 0.15 0.03 0.17 0.27 0.9 0.72 0.02 0.1 0.165 0.25 0.2 Noise Noise Noise 0.0025 -3 3.2 3.3 3.5 0.26 0.22 0.725 0.7 0.12 0.22 0.184 0.075 0.13 2.5 0.32 0.31 0.05 0.05 0.075 0.116 0.09
FWD Sensor1 195 294 454 299 414 6572 165 245 387 232 331 5293 149 220 347 223 312 4954 128 189 298 205 287 4585 107 159 249 190 263 4266 71 106 166 161 222 3687 47 71 111 144 193 3248 32 50 78 128 170 2909 24 39 60 118 150 261
Vibration Monitoringacc. (g)geophone 1 0.526 1.05 1.75 0.0451 --- 0.749 1.1 1.88 0.0371 ---acc. (g)geophone 2 no data no data no data ** ** no data no data no data ** **velocity (ips)geophone 1 0.783 1.17 1.81 0.093 --- 0.821 1.24 1.95 0.173 ---velocity (ips)geophone 2 no data no data no data ** ** no data no data no data ** **Maximum Displacement (Inches) 0.00374 0.00545 0.00868 0.00408 ** 0.00547 0.00753 0.0118 0.0106 **dominant frequency (Hz)geophone 1 23.1 24.3 26.7 no data --- 14 15.6 6.5 no data ---dominant frequency (Hz)geophone 2 no data no data no data ** ** no data no data no data ** ***LVDT and FWD displacement data are in microns.**Only one geophone was used for the truck vibration monitoring.---rear axle sensor response not discernable from front axle sensor response, maximum sensor response assumed to be associated with front axle."no data" means that no data was collected.The second geophone was not used for this sampling event. The first geophone was placed ~12"-18" from the shot.
FWD Loaded Truck FWD Loaded TruckCONTROL BIT PAVEMENT ON TECH. DRIVE GEOFOAM BIT. PAVEMENT ON TECH. DRIVE
ULTIMATE RESPONSE DATA CODE F6BC CODE F6BG
Figure A5

A-6
LVDT* 6000 9000 12000 15000 fr. axle rear axle 6000 9000 12000 15000 fr. axle rear axle1 no data no data no data 0.043 0.029 no data no data no data 0.042 0.0242 no data no data no data 0.025 0.015 no data no data no data noise noise3 no data no data no data 0.0026 0.0015 no data no data no data noise noise4 no data no data no data 0.0022 0.0017 no data no data no data 0.009 0.0038
WD Sensor*1 108 131 150 165 204 2382 106 124 143 159 194 2233 102 121 139 159 194 2244 97 116 133 155 190 2195 92 109 125 150 184 2166 79 94 108 140 172 2027 68 80 92 129 160 1898 56 66 75 119 148 1739 45 53 61 109 135 159
Vibration Monitoringacc. (g)geophone 1 0.389 0.455 0.552 0.0486 --- 0.711 0.795 0.964 0.053 ---acc. (g)geophone 2 0.0398 0.0464 0.0663 ** ** 0.0727 0.119 0.153 ** **velocity (ips)geophone 1 0.38 0.47 0.558 0.07 --- 0.63 0.78 0.887 0.275 ---velocity (ips)geophone 2 0.0625 0.085 0.105 ** ** 0.133 0.195 0.235 ** **Maximum Deflection (inches) 0.00208 0.00258 0.00305 0.00284 ** 0.00404 0.00488 0.0057 0.0147 **dominant frequency (Hz)geophone 1 14.5 12 18 4.08 --- 14.5 11 15 3.5 ---dominant frequency (Hz)geophone 2 14.5 12 15.75 ** ** 15 13 15 ** ***LVDT and FWD displacement data are in microns.**Only one geophone was used for the truck vibration monitoring.---rear axle sensor response not discernable from front axle sensor response, maximum sensor response assumed to be associated with front axle."no data" means that no data was collected.
FWD Loaded Truck FWD Loaded TruckCONTROL CONCRETE PAVEMENT TH 100 GEOFOAM CONCRETE PAVEMENT TH 100CODE SU6CC CODE SU6CG
ULTIMATE RESPONSE DATA
Figure A6

A-7
LVDT 6000 9000 12000 15000 fr. axle rear axle 6000 9000 12000 15000 fr. axle rear axle1 0.013 0.02 0.032 0.053 0.012 0.0092 0.0148 0.028 0.045 0.0012 0.0072 0.018 0.029 0.038 0.021 noise noise noise 0.0025 0.00183 noise noise noise noise noise noise noise noise noise noise4 0.0064 0.0079 0.0118 0.0149 0.0082 noise noise noise 0.005 0.0025
FWD Sensor1 56 86 138 97 130 2032 55 81 128 95 127 1963 53 78 123 94 125 1914 50 73 115 94 125 1915 47 68 108 94 123 1896 40 59 92 83 112 1737 33 49 77 79 105 1648 28 41 64 73 97 1549 23 34 53 67 88 141
Vibration Monitoringacc. (g)geophone 1 0.256 0.384 0.665 0.0464 --- 0.32 0.493 0.837 0.0464 ---acc. (g)geophone 2 no data no data no data ** ** no data no data no data ** **velocity (ips)geophone 1 0.263 0.384 0.613 0.07 --- 0.35 0.503 0.79 0.225 ---velocity (ips)geophone 2 no data no data no data ** ** no data no data no data ** **Maximum Deflection (inches) 0.00129 0.00191 0.00305 0.00303 ** 0.00242 0.00301 0.00459 0.0157 **dominant frequency (Hz)geophone 1 15.1 14.8 16.25 no data --- 13.9 15 16.25 no data ---dominant frequency (Hz)geophone 2 no data no data no data ** ** no data no data no data ** ***LVDT and FWD displacement data are in microns.**Only one geophone was used for the truck vibration monitoring.---rear axle sensor response not discernable from front axle sensor response, maximum sensor response assumed to be associated with front axle."no data" means that no data was collected.The second geophone was not used for this sampling event. The first geophone was placed ~12"-18" from the shot.
FWD Loaded Truck FWD Loaded TruckCONTROL CONCRETE PAVEMENT TH 100 GEOFOAM CONCRETE PAVEMENT TH 100CODE F6CC CODE F6CG
ULTIMATE RESPONSE DATA
Figure A7

APPENDIX B. ADDITIONAL FIGURES

B-1
MDD Tech Drive Front Axle MNDOT Truck
-0.5
0
0.5
1
1.5
2
2.5
0 1 2 3 4 5
MDD Sensor
Defle
ctio
n (m
icro
met
ers)
S6BCS6BGSU6BGSU6BGF6BCF6BG
Figure B1
MDD Tech Drive 9K
-0.5
0
0.5
1
1.5
2
2.5
3
3.5
0 1 2 3 4 5
MDD Sensor
Defle
ctio
n (m
icro
met
er)
SU6BCSU6BGF6BCF6BG
Figure B2

B-2
MDD TH 100 MNDOT Front Axle
-0.01
0
0.01
0.02
0.03
0.04
0.05
0.06
0.07
0.08
0 1 2 3 4 5
MDD Sensor
Defle
ctio
n (M
icro
met
ers) F5CC
F5CGW6CCW6CGSU6CCSU6CGF6CCF6CG
Figure B3
MDD TH 100 6K
0
0.005
0.01
0.015
0.02
0.025
0.03
0.035
0 1 2 3 4 5
MDD Sensor
Defle
ctio
n (m
icro
met
ers)
F5CCF5CGW6CCW6CGF6CCF6CG
Figure B4
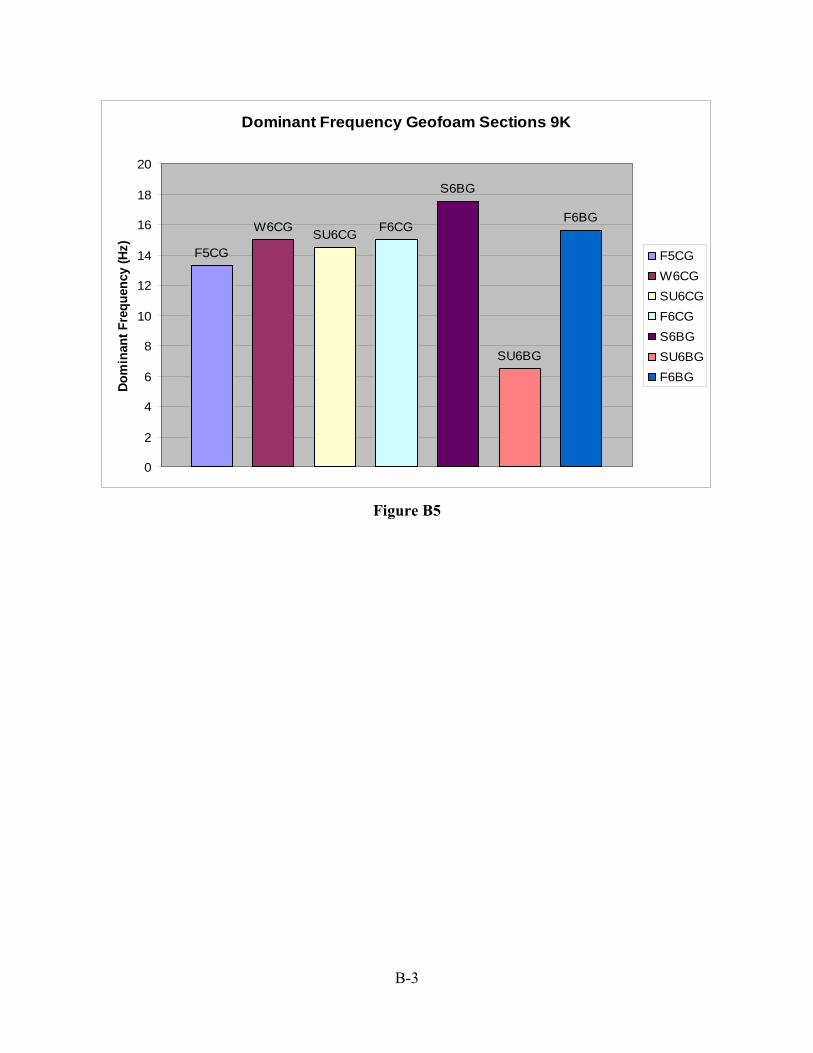
B-3
Dominant Frequency Geofoam Sections 9K
F5CG
W6CG SU6CG F6CG
S6BG
SU6BG
F6BG
0
2
4
6
8
10
12
14
16
18
20
Dom
inan
t Fre
quen
cy (H
z)
F5CGW6CGSU6CGF6CGS6BGSU6BGF6BG
Figure B5
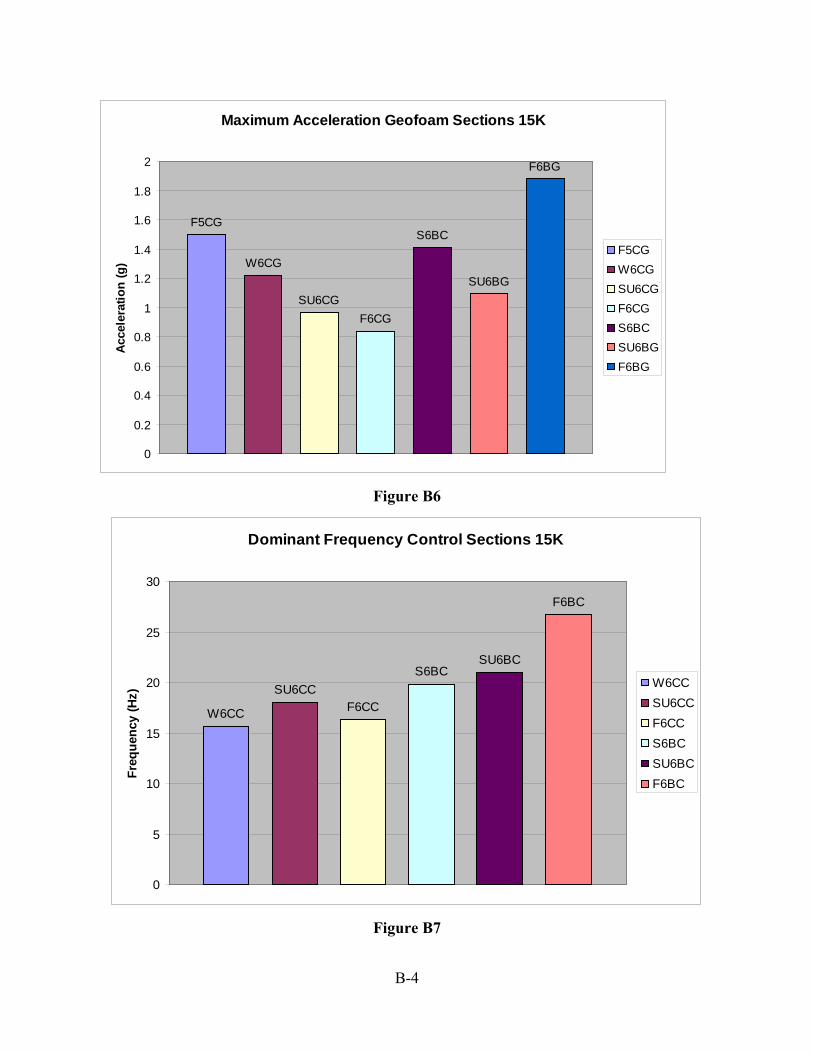
B-4
Maximum Acceleration Geofoam Sections 15K
F5CG
W6CG
SU6CGF6CG
S6BC
SU6BG
F6BG
0
0.2
0.4
0.6
0.8
1
1.2
1.4
1.6
1.8
2
Acce
lera
tion
(g)
F5CGW6CGSU6CGF6CGS6BCSU6BGF6BG
Figure B6
Dominant Frequency Control Sections 15K
W6CC
SU6CCF6CC
S6BCSU6BC
F6BC
0
5
10
15
20
25
30
Freq
uenc
y (H
z)
W6CCSU6CCF6CCS6BCSU6BCF6BC
Figure B7

B-5
Deflection Basin 15K
0
100
200
300
400
500
600
700
800
900
0 500 1000 1500 2000
FWD Sensor Location from Point of Applied Load (mm)D
efle
ctio
n (m
icro
met
er)
F5CCW6CCSU6CC F6CCS6BCSU6BCF6BC
Figure B8
Maximum Acceleration from MnDOT Truck
F5CC
W6CC
SU6CC F6CC
S6BC
SU6BCF6BC
0
0.02
0.04
0.06
0.08
0.1
0.12
0.14
0.16
0.18
Acce
lera
tion
(g)
F5CCW6CCSU6CCF6CCS6BCSU6BCF6BC
Figure B9
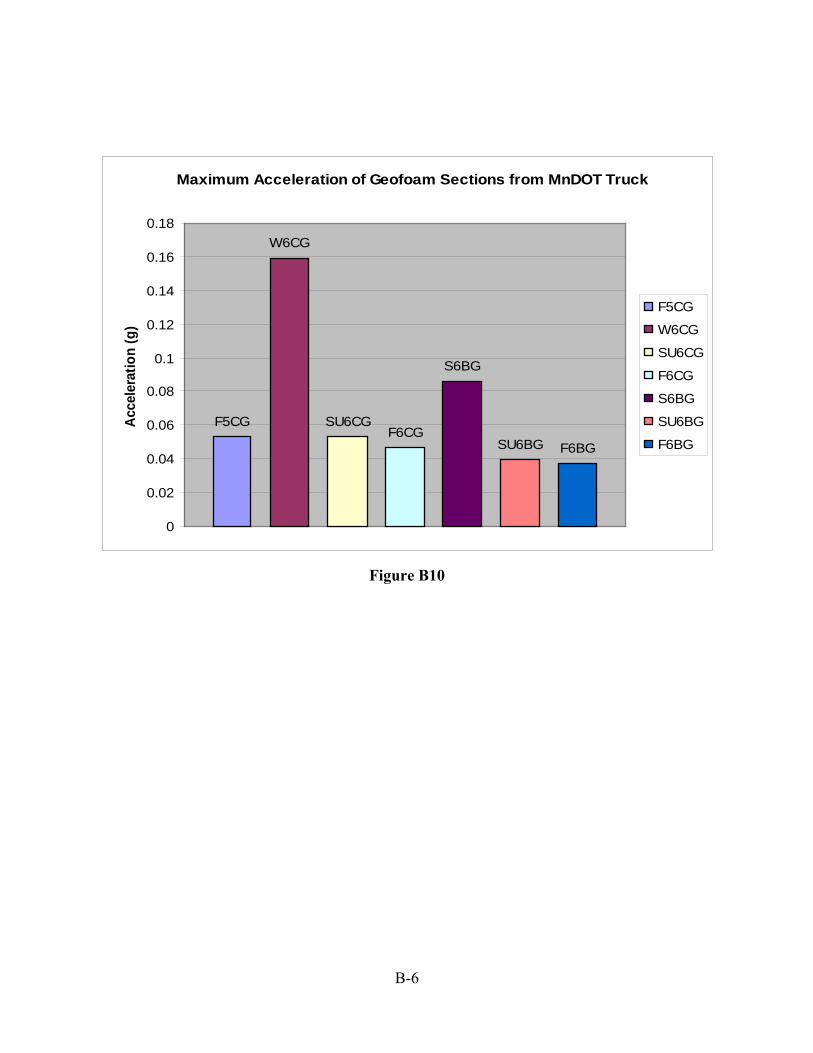
B-6
Maximum Acceleration of Geofoam Sections from MnDOT Truck
F5CG
W6CG
SU6CGF6CG
S6BG
SU6BG F6BG
0
0.02
0.04
0.06
0.08
0.1
0.12
0.14
0.16
0.18
Acce
lera
tion
(g)
F5CG
W6CG
SU6CG
F6CG
S6BG
SU6BG
F6BG
Figure B10

B-7
Dominant Frequency Geofoam Sections 15K
F6CG
W6CGSU6CG
F6CG S6BG
SU6BG
F6BG
0
2
4
6
8
10
12
14
16
18
1
Dom
inan
t Fre
quen
cy (H
z)
F6CGW6CGSU6CGF6CGS6BGSU6BGF6BG
Figure B11

B-8
Deflection Basin Geofoam Sections 15K
0
200
400
600
800
1000
1200
0 200 400 600 800 1000 1200 1400 1600 1800 2000
FWD Sensor Location from Point of Applied Load (mm)
Defle
ctio
n (m
icro
met
er)
F5CGW6CGSU6CGF6CGS6BGSU6BGF6BG
Figure B12
MDD TH 100 15K
-0.5
0
0.5
1
1.5
2
2.5
3
3.5
4
4.5
0 1 2 3 4 5
MDD Sensor
Defle
ctio
n(M
icro
met
er)
F5CCF5CGW6CCW6CGF6CCF6CG
Figure B13

B-9
MDD TH 100 15K
-0.5
0
0.5
1
1.5
2
2.5
3
3.5
4
4.5
0 1 2 3 4 5
MDD Sensor
Defle
ctio
n(M
icro
met
er)
F5CCF5CGW6CCW6CGF6CCF6CG
Figure B14

B-10
MDD Tech Drive 15K
-0.5
0
0.5
1
1.5
2
2.5
3
3.5
4
4.5
0 1 2 3 4 5
MDD Sensor
Defle
ctio
n (M
icro
met
er)
SU6BCSU6BGF6BCF6BG
Figure B15

APPENDIX C. VIBRATION MONITORING REPORT

C-1

C-2

C-3

C-4

C-5

APPENDIX D. FALLING WEIGHT DEFLECTOMETER DEFLECTIONS

D-1
Deflection-Geofoam (11-08-05) T.H. 100
0
50
100
150
200
250
300
0 200 400 600 800 1000 1200 1400 1600 1800 2000
Sensor location (mm)
Def
lect
ion
(x10
-6 m
)
453 kPa
454 kPa
453 kPa
597 kPa
601 kPa
596 kPa
1064 kPa
1050 kPa
1061 kPa
Figure D1 TH 100 Geofoam FWD Deflection Basin; November 8, 2005
Deflection-Non Geofoam (11-08-05) T.H. 100
0
20
40
60
80
100
120
140
160
180
200
0 200 400 600 800 1000 1200 1400 1600 1800 2000
Sensor location (mm)
Def
lect
ion
(x10
-6 m
)
443 kPa
446 kPa
443 kPa
586 kPa
587 kPa
585 kPa
1072 kPa
1076 kPa
1077 kPa
Figure D2 TH 100 Control FWD Deflection Basin; November 8, 2005

D-2
Deflection-Geofoam (Feb 06) T.H. 100
0
20
40
60
80
100
120
140
0 200 400 600 800 1000 1200 1400 1600 1800 2000
Sensor location(mm)
Def
lect
ion
(x10
-6m
)
399 kPa
394 kPa
392 kPa
681 kPa
685 kPa
683 kPa
1181 kPa
1180 kPa
1117 kPa
Figure D3 TH 100 Geofoam FWD Deflection Basin; February 2006
Deflection-Non Geofoam (Feb. 06) T.H. 100
0
20
40
60
80
100
120
140
0 200 400 600 800 1000 1200 1400 1600 1800 2000
Sensor Location(mm)
Def
lect
ion(
x10-
6m)
384 kPa
385 kPa
387 kPa
672 kPa
676 kPa
676 kPa
1180 kPa
1179 kPa
1178 kPa
Figure D4 TH 100 Control FWD Deflection Basin; February 2006
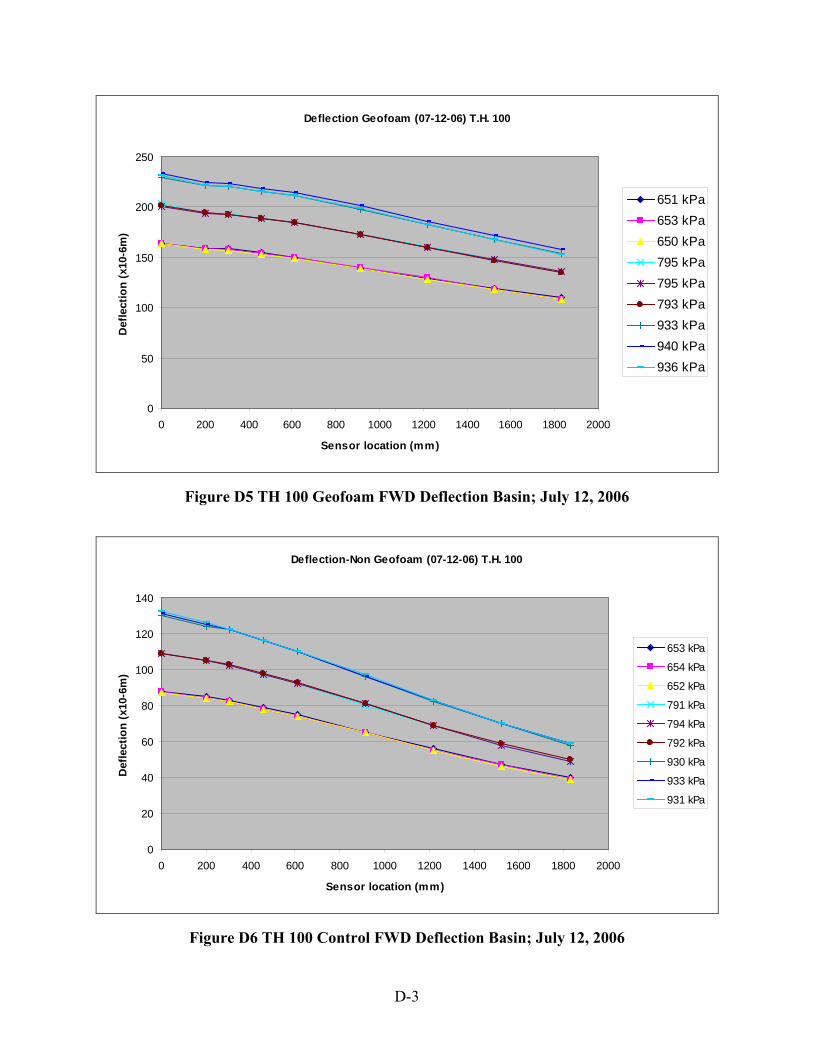
D-3
Deflection Geofoam (07-12-06) T.H. 100
0
50
100
150
200
250
0 200 400 600 800 1000 1200 1400 1600 1800 2000
Sensor location (mm)
Def
lect
ion
(x10
-6m
)
651 kPa653 kPa650 kPa795 kPa795 kPa793 kPa933 kPa940 kPa936 kPa
Figure D5 TH 100 Geofoam FWD Deflection Basin; July 12, 2006
Deflection-Non Geofoam (07-12-06) T.H. 100
0
20
40
60
80
100
120
140
0 200 400 600 800 1000 1200 1400 1600 1800 2000
Sensor location (mm)
Def
lect
ion
(x10
-6m
)
653 kPa
654 kPa
652 kPa
791 kPa
794 kPa
792 kPa
930 kPa
933 kPa
931 kPa
Figure D6 TH 100 Control FWD Deflection Basin; July 12, 2006

D-4
Deflection Geofoam (11-05-06) T.H. 100
0
50
100
150
200
250
0 200 400 600 800 1000 1200 1400 1600 1800 2000
Sensor location (mm)
Def
lect
ion
(x10
-6m
)
403 kPa
402 kPa
403 kPa
594 kPa
601 kPa
600 kPa
974 kPa
975 kPa
974 kPa
Figure D7 TH 100 Geofoam FWD Deflection Basin; November 5, 2006
Deflection-Non Geofoam (11-05-06) T.H. 100
0
20
40
60
80
100
120
140
160
0 200 400 600 800 1000 1200 1400 1600 1800 2000
Sensor location(mm)
Def
lect
ion
(x 1
0-6m
)
411 kPa
407 kPa
406 kPa
600 kPa
605 kPa
603 kPa
981 kPa
980 kPa
979 kPa
Figure D8 TH 100 Control FWD Deflection Basin; November 5, 2006

D-5
Deflection-Geofoam (03-08-07) T.H. 100
0
10
20
30
40
50
60
0 200 400 600 800 1000 1200 1400 1600 1800 2000
Sensor location (mm)
Def
lect
ion
(x10
-6m
)
361 kPa
364 kPa
367 kPa
578 kPa
583 kPa
582 kPa
935 kPa
940 kPa
939 kPa
Figure D9 TH 100 Geofoam FWD Deflection Basin; March 8, 2007
Deflection-Non Geofoam (03-08-07) T.H. 100
0
5
10
15
20
25
30
35
0 200 400 600 800 1000 1200 1400 1600 1800 2000
Sensor location (mm)
Def
lect
ion
(x10
-6m
)
366 kPa
365 kPa
369 kPa
588 kPa
588 kPa
590 kPa
949 kPa
955 kPa
954 kPa
Figure D10 TH 100 Control FWD Deflection Basin; March 8, 2007

D-6
Deflection-Geofoam 05-22-07 T.H. 100
0
50
100
150
200
250
300
0 200 400 600 800 1000 1200 1400 1600 1800 2000
Sensor location (mm)
Def
lect
ion
(x10
-6 m
)
392 kPa
394 kPa
395 kPa
607 kPa
610 kPa
607 kPa
967 kPa
970 kPa
969 kPa
Figure D11 TH 100 Geofoam FWD Deflection Basin; May 22, 2007
Deflection-Non Geofoam 05-22-07 T.H. 100
0
20
40
60
80
100
120
140
160
0 200 400 600 800 1000 1200 1400 1600 1800 2000
Sensor location (mm)
Def
lect
ion
(x10
-6 m
)
388 kPa
388 kPa
394 kPa
601 kPa
607 kPa
608 kPa
969 kPa
974 kPa
973 kPa
Figure D12 TH 100 Control FWD Deflection Basin; May 22, 2007
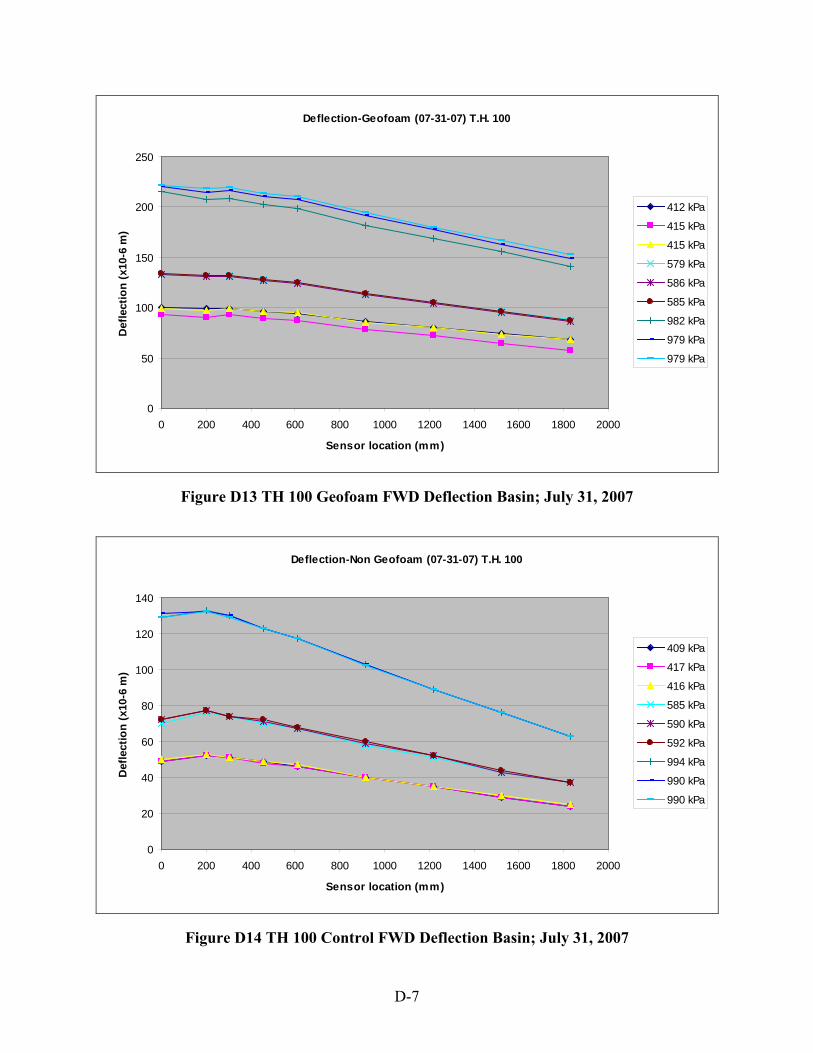
D-7
Deflection-Geofoam (07-31-07) T.H. 100
0
50
100
150
200
250
0 200 400 600 800 1000 1200 1400 1600 1800 2000
Sensor location (mm)
Def
lect
ion
(x10
-6 m
)
412 kPa
415 kPa
415 kPa
579 kPa
586 kPa
585 kPa
982 kPa
979 kPa
979 kPa
Figure D13 TH 100 Geofoam FWD Deflection Basin; July 31, 2007
Deflection-Non Geofoam (07-31-07) T.H. 100
0
20
40
60
80
100
120
140
0 200 400 600 800 1000 1200 1400 1600 1800 2000
Sensor location (mm)
Def
lect
ion
(x10
-6 m
)
409 kPa
417 kPa
416 kPa
585 kPa
590 kPa
592 kPa
994 kPa
990 kPa
990 kPa
Figure D14 TH 100 Control FWD Deflection Basin; July 31, 2007

D-8
Deflection-Geofoam (11-15-07) T.H. 100
0
50
100
150
200
250
300
0 500 1000 1500 2000
Sensor location (mm)
Def
lect
ion
(x10
-6 m
)
418 kPa417 kPa419 kPa588 kPa593 kPa591 kPa951 kPa952 kPa953 kPa
Figure D15 TH 100 Geofoam FWD Deflection Basin; November 15, 2007
Deflection-Non Geofoam (11-15-07) T.H. 100
0
20
40
60
80
100
120
140
160
180
0 500 1000 1500 2000
Sensor location (mm)
Def
lect
ion
(x10
-6 m
)
418 kPa417 kPa419 kPa588 kPa593 kPa591 kPa951 kPa952 kPa953 kPa
Figure D16 TH 100 Control FWD Deflection Basin; November 15, 2007

D-9
Deflection-Geofoam (05-03-06) Tech. Dr.
0
100
200
300
400
500
600
700
800
900
0 200 400 600 800 1000 1200 1400 1600 1800 2000
Sensor Location (mm)
Def
lect
ion
(x10
-6m
)
551 kPa
552 kPa
551 kPa
717 kPa
720 kPa
721 kPa
926 kPa
927 kPa
926 kPa
Figure D17 Technology Drive Geofoam FWD Deflection Basin; May 3, 2006
Deflection-Non Geofoam (05-03-06) Tech Dr.
0
100
200
300
400
500
600
700
0 200 400 600 800 1000 1200 1400 1600 1800 2000
Sensor location (mm)
Def
lect
ion
(x10
-6m
)
559 kPa
561 kPa
560 kPa
734 kPa
733 kPa
733 kPa
942 kPa
943 kPa
941 kPa
Figure D18 Technology Drive Control FWD Deflection Basin; May 3, 2006

D-10
Deflection-Geofoam (07-13-06) Tech. Dr.
0
200
400
600
800
1000
1200
0 200 400 600 800 1000 1200 1400 1600 1800 2000
Sensor location (mm)
Def
lect
ion
(x10
-6 m
)
602 kPa
606 kPa
605 kPa
760 kPa
759 kPa
760 kPa
904 kPa
903 kPa
900 kPa
Figure D19 Technology Drive Geofoam FWD Deflection Basin; July 13, 2006
Deflection-Non Geofoam (07-13-06) Tech. Dr.
0
100
200
300
400
500
600
700
800
900
0 200 400 600 800 1000 1200 1400 1600 1800 2000
Sensor location (mm)
Def
lect
ion
(x10
-6 m
)
621 kPa
619 kPa
619 kPa
777 kPa
782 kPa
780 kPa
920 kPa
922 kPa
924 kPa
Figure D20 Technology Drive Control FWD Deflection Basin; July 13, 2006

D-11
Deflection-Non Geofoam 11-16-06 Tech. Dr.
0
100
200
300
400
500
600
700
0 500 1000 1500 2000
Sensor location (mm)
Def
lect
ion
(x10
-6 m
)
384 kPa385 kPa382 kPa574 kPa577 kPa578 kPa957 kPa958 kPa958 kPa
Figure D21 Technology Drive Geofoam FWD Deflection Basin; November 16, 2006
Deflection-Non Geofoam 11-16-06 Tech. Dr.
0
50
100
150
200
250
300
350
400
450
500
0 200 400 600 800 1000 1200 1400 1600 1800 2000
Sensor location (mm)
Def
lect
ion
(x10
-6 m
)
404 kPa
403 kPa
405 kPa
596 kPa
600 kPa
601 kPa
985 kPa
987 kPa
985 kPa
Figure D22 Technology Drive Control FWD Deflection Basin; November 16, 2006

D-12
Deflection-Non Geofoam (03-08-07) Tech. Dr.
0
50
100
150
200
250
300
350
0 200 400 600 800 1000 1200 1400 1600 1800 2000
Sensor location (mm)
Def
lect
ion
(x10
-6m
)
356 kPa
356 kPa
356 kPa
558 kPa
561 kPa
562 kPa
903 kPa
907 kPa
904 kPa
Figure D23 Technology Drive Control FWD Deflection Basin; March 8, 2007

D-13
Deflection- Goefoam 05-23-07 Tech. Dr.
0
100
200
300
400
500
600
700
800
900
1000
0 200 400 600 800 1000 1200 1400 1600 1800 2000
Sensor location (mm)
Def
lect
ion
(x10
-6 m
)
365 kPa
371 kPa
372 kPa
572 kPa
577 kPa
574 kPa
945 kPa
949 kPa
948 kPa
Figure D24 Technology Drive Geofoam FWD Deflection Basin; May 23, 2007
Deflection- Goefoam 05-23-07 Tech. Dr.
0
100
200
300
400
500
600
700
800
900
1000
0 200 400 600 800 1000 1200 1400 1600 1800 2000
Sensor location (mm)
Def
lect
ion
(x10
-6 m
)
365 kPa
371 kPa
372 kPa
572 kPa
577 kPa
574 kPa
945 kPa
949 kPa
948 kPa
Figure D25 Technology Drive Control FWD Deflection Basin; May 23, 2007
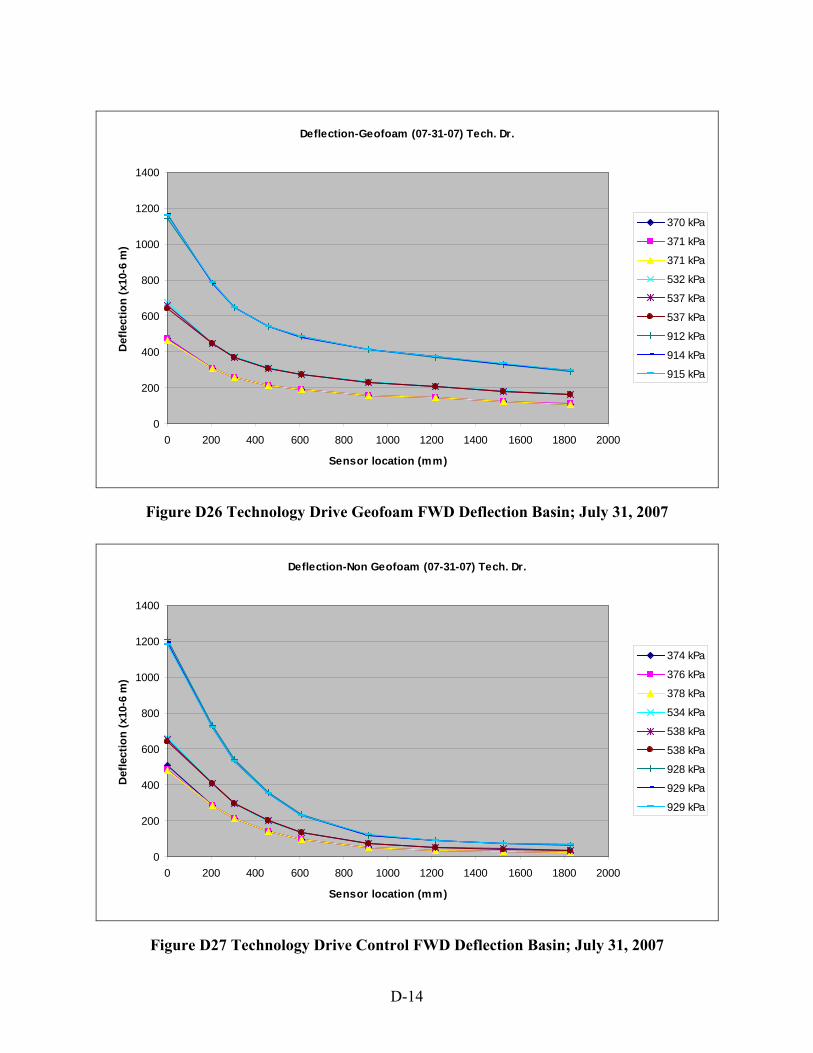
D-14
Deflection-Geofoam (07-31-07) Tech. Dr.
0
200
400
600
800
1000
1200
1400
0 200 400 600 800 1000 1200 1400 1600 1800 2000
Sensor location (mm)
Def
lect
ion
(x10
-6 m
)
370 kPa
371 kPa
371 kPa
532 kPa
537 kPa
537 kPa
912 kPa
914 kPa
915 kPa
Figure D26 Technology Drive Geofoam FWD Deflection Basin; July 31, 2007
Deflection-Non Geofoam (07-31-07) Tech. Dr.
0
200
400
600
800
1000
1200
1400
0 200 400 600 800 1000 1200 1400 1600 1800 2000
Sensor location (mm)
Def
lect
ion
(x10
-6 m
)
374 kPa
376 kPa
378 kPa
534 kPa
538 kPa
538 kPa
928 kPa
929 kPa
929 kPa
Figure D27 Technology Drive Control FWD Deflection Basin; July 31, 2007

D-15
Deflection- Geofoam (11-15-07) Tech. Dr.
0
100
200
300
400
500
600
700
800
0 500 1000 1500 2000
Sensor location (mm)
Def
lect
ion
(x10
-6 m
)
388 kPa393 kPa390 kPa554 kPa558 kPa559 kPa923 kPa923 kPa922 kPa
Figure D28 Technology Drive Geofoam FWD Deflection Basin; November 15, 2007
Deflection-Non Geofoam (11-15-07) Tech. Dr.
0
100
200
300
400
500
600
0 500 1000 1500 2000
Sensor location (mm)
Def
lect
ion
(x10
-6 m
)
406 kPa408 kPa407 kPa569 kPa572 kPa572 kPa944 kpa945 kPa944 kPa
Figure D29 Technology Drive Control FWD Deflection Basin; November 15, 2007