investigation into the p revalence of sensory...
TRANSCRIPT

Investigation into the Prevalence of Sensory Processing Difficulties in Children Identified as Having Behavioural,
Emotional or Social Difficulties at School.
Plum Hutton
This thesis is submitted in partial fulfilment of the requirements for the degree of
Doctorate in Educational Psychology
Year of Submission: 2012

Declaration This work has not been submitted in substance for any other degree or award at this
or any other university or place of learning, nor is being submitted concurrently in
candidature for any degree or other award.
Signed candidate
Date 28.12.12
STATEMENT 1
This thesis is being submitted in partial fulfilment of the requirements for the degree
of Post-Qualification Doctorate in Educational Psychology.
Signed candidate
Date 28.12.12
STATEMENT 2
This thesis is the result of my own independent work/investigation, except where
otherwise stated. Other sources are acknowledged by explicit references. The
views expressed are my own.
Signed candidate
Date 28.12.12
STATEMENT 3
I hereby give consent for my thesis, if accepted, to be available for photocopying
and for inter-library loan, and for the title and summary to be made available to
outside organisations.
Signed candidate
Date 28.12.12
1

Abstract
The incidence of sensory processing difficulties (SPDs) was investigated for pupils
(aged 4-10 years old) with behavioural, emotional or social difficulties (BESD).
Teachers provided a measure of BESD using The Strengths and Difficulties
Questionnaire. Parents completed The Short Sensory Profile (SSP) and teachers
completed The Sensory Profile, School Companion (SC). Data were analysed for
144 children. When total scores were calculated for the sensory measures, parents
and teachers rated that 55% and 44% of the sample respectively, had sensory
processing difficulties. Both parents and teachers demonstrated concerns about
difficulties with overactivity, poor listening and concentration skills. Associations
were found between SPDs and some background factors including anxiety and poor
peer relations. When individual cases were examined, it was found that children
were often rated as having difficulties at school but not at home or visa versa. The
implications of this finding are discussed in relation to previous studies that have
purely relied on the Short Sensory Profile, a brief parental measure of SPDs. It was
cautiously concluded that the data suggest that within the BESD sample it was
possible to identify a subgroup of children who may also have difficulties with
sensory processing. It is suggested that it may be helpful for there to be an
increased awareness of possible sensory difficulties for some BESD children among
educational psychologists.
2

Acknowledgements
I would like to thank all my family, friends and colleagues who have supported this
endeavour. In addition I am very grateful to the families and schools who agreed to
participate in the research.
Short Sensory Profile. Copyright (C) 1999 NCS Pearson, Inc. Used with permission. All rights reserved.
Sensory Profile School Companion. Copyright (C) 2006 NCS Pearson, Inc. Used with permission. All rights reserved.
3

Contents
Title Page List of Tables 10
List of Figures 11
Abbreviations 12
Chapter 1: Introduction
13
1.1 Sensory Processing in Typical Children 14
1.2 Sensory Processing Difficulties (SPDs) 17
1.3 Outline of the Study 18
Chapter 2: Literature Review
20
2.1 Historical Overview of Sensory Integration Theory 21
2.2 Evidence of Sensory Processing Difficulties (SPD)s 24
2.2.1 Direct Measurement of Sensory Reponses 25
2.3 Factors Associated with SPDs 28
2.3.1 Prenatal and Birth Difficulties 28
2.3.2 Institutionalisation 29
2.3.3 Attachment to Caregivers 31
2.3.4 The Need for Environmental Complexity 33
2.3.5 Genetic Influences 34
2.4 Prevalence of SPDs in Children with Specific Diagnoses 34
2.4.1 Autistic Spectrum Disorders and Fragile X Syndrome 35
2.4.2 Foetal Alcohol Syndrome 36
2.4.3 Attention Deficit Hyperactive Disorder 36
2.5 Prevalence in the General Population 38
2.6 Links between SPDs and BESD 41
2.7 Environmental Issues that may Relate to SPDs and BESD 43
2.7.1 Influence of Electronic Pastimes 43
2.7.2 Levels of Physical Activity Among Children 44
2.7.3 Family Influences 47
2.7.4 School Environment 47
4

Title Page 2.7.5 Noise Levels 48
2.8 An Overview of Behavioural Emotional and Social Difficulties in the
UK
49
2.8.1 BESD and Links to Low Socio-economic Status 53
2.9 Conclusions Drawn from the Literature Review 56
Chapter 3: Research Design and Methodology
59
3.1 Measures used for Study A 61
3.1.1 Background Information Sheets 61
3.1.2 The Strengths and Difficulties Questionnaire (SDQ) 61
3.1.3 Measures of Sensory Processing 65
3.1.3.a The Sensory Profile and Short Sensory Profile 66
3.1.3.b The Sensory Profile, School Companion 68
3.1.3.c Limitations of the Standardised Measures 70
3.2 Method 71
3.2.1 General Information 71
3.2.1.a Geographical Context 71
3.2.1.b Inclusion Criteria 72
3.2.1.c Questionnaire Packs 72
3.2.2 Recruitment Procedure 73
3.2.2.a Mainstream Schools 73
3.2.2.b The Primary Behaviour Support Team (PBST) 74
3.2.2.c Special School for Children with BESD 74
3.2.3 Distribution and Completion of Questionnaires 75
3.3 Methodological Issues Relating to the Use of Questionnaires 76
3.3.1 Participant Bias when Completing Questionnaires 77
3.4 Ethical Issues 78
3.4.1 Recruiting Parents 78
3.4.2 Consent 79
3.4.3 Managing Parent and Teacher Concerns 79
3.4.4 Management of Confidential and Anonymous Data 80
3.5 Questionnaire to Establish SENCos’ Knowledge about SPDs:
study B
81
3.5.1 Constructing the Questionnaire 81
3.6 Recording and Analysing the Data 82
5

Title Page 3.6.1 Recoding Ordinal Data into Categorical Data 83
3.6.2 Pearson’s Chi-square Test 84
3.7 Timetable of Research 86
Chapter 4: Results 89
4.1 Analysis of Participants 89
4.1.1 Gender 89
4.1.2 Age of Participants 89
4.1.3 Index of Multiple Deprivation 90
4.1.4 Occupational Therapy Assessment 91
4.1.5 Types of BESD 92
4.2 Prevalence of Sensory Processing Difficulties in Children with
BESD
93
4.2.1 Prevalence of SPDs by Demographic Categories 94
4.2.2 Prevalence of SPDs on the Sensory Profile Sections 96
4.3 Comparisons of the Sensory Scores Provided by Parents and
Those Provided by Teachers
100
4.3.1 Comparison of Responses on SSP and SC Sections 100
4.4 Associations Between SPDs, BESD and Background Factors 102
4.4.1 Background Factors with No Associations 102
4.4.2 Associations with SSP and SC Total Scores 103
4.4.3 Associations with SSP Sections 104
4.4.4 Associations with SC Sections 106
4.5 Associations between Sensory Measures and Subtypes of BESD 107
4.6 Current level of SENCo Knowledge about SPDs 110
4.7 Summary of Results 112
Chapter 5: Discussion
115
5.1 Issues of Terminology that Affect the Results 115
5.1.1 Distinction between Sensory Processing Disorder and
Sensory Processing Difficulties
115
5.2 Demographics 118
5.2.1 Gender 118
5.2.2 Age 119
5.2.3 Socioeconomic Status 120
6

5.3 Prevalence Shown by the Total SSP and SC Scores 121
5.3.1 SPDs Prevalence for BESD Children Compared with
Previous Research
121
5.4 The Pattern of Difficulties on the SSP and SC Sections 123
5.4.1 SSP Section Comparison 123
5.4.2 SC Section Comparison 124
5.4.3 Examination of the Construct Validity of the SSP & SC in light
of observed similarities between behaviours associated with SPDs
and BESD
125
5.4.4 Comparison of Patterns of Difficulties for BESD and ASD
Children on the SSP
127
5.5 Overactivity and difficulties with Listening Skills 128
5.5.1 Overactivity 129
5.5.2 Listening Skills 131
5.6 Comparison of Sensory Difficulties Reported by Parents and
Teachers
132
5.7 Associations with Background Factors 134
5.7.1 Parental Reports that the Child was a Fussy Baby 134
5.7.2 Association between reported Anxiety and SPDs 135
5.8 Association between SPDs and SDQ Measures 137
5.9 Awareness of SPDs in the Field of Education 139
5.10 Limitations 141
5.10.1 Limited Number of Participants 141
5.10.2 Heterogeneous Sample 142
5.10.3 Measures of SPDs 142
5.10.4 Identification of BESD 143
5.10.5 Change of Descriptive Terms on the Standardised
Measures
145
5.10.6 Background Factors 145
Chapter 6: Conclusions
147
6.1 The Impact of the Results on Sensory Processing Theory 147
6.2 Suggestions for Future Research 148
6.3 Practical Implications for Schools and Educational Psychology 149
References
152
7

Appendices
Page
1a The Strengths and Difficulties Questionnaire 166
1b SENCo Questionnaire 168
1c Parental Background Information Sheet 169
1d Teacher Background Information Sheet 171
2a Parent / Carer Introductory Letter 173
2b Parent / Carer Consent Form Group A 175
2c SENCo Consent for Group B 176
3a Teacher Introductory Letter 177
3b Teacher Consent for Group A 179
4 Guidance for Approaching Parents 180
5a End of study Feedback for Parents 181
5b End of Study Feedback for SENCOs 183
6 Associations with background factors that have a frequency of < 15 185
7a Frequency Tables for Comparisons of Parental and Teacher Scores
on the SSP and SC Sections
190
7b Frequency Tables for Associations between Parental Background
Factor 2 (Fussy Baby) and SSP and SC Sections
197
7c Frequency Tables for Associations between Parental Background
Factor 4 (Parental Rating of the Child’s Anxiety) and SSP and SC
Sections
215
7d Frequency Tables for Associations between Parental Background
Factor 5 (Assessed by an Occupational Therapist) and SSP and SC
Sections
233
7e Frequency Tables for Associations between Teacher Background
Factor 1 (Behaviour Difficulties) and SSP and SC Sections
251
7f Frequency Tables for Associations between Teacher Background
Factor 3 (Assessed by an Occupational Therapist) and SSP and SC
Sections
269
7g Frequency Tables for Associations between Teacher Background
Factor 4 (Teacher Rating of the Child’s Anxiety) and SSP and SC
Sections
287
7h Frequency Tables for Associations between SDQ Section
Emotional Difficulties and SSP and SC Sections
305
8

Appendices Continued
7i Frequency Tables for Associations between SDQ Section Conduct
Difficulties and SSP and SC Sections
323
7j Frequency Tables for Associations between SDQ Section
Hyperactive and SSP and SC Sections
341
7k Frequency Tables for Associations between SDQ Section Peer
Relations and SSP and SC Sections
359
7L Frequency Tables for Associations between SDQ Total Difficulties
Scores and SSP and SC Sections
377
9

List of Tables
Page
1 Measures Used in the study. 60
2 Strengths and Difficulties Questionnaire Sections. 63
3 Sections on the Short Sensory Profile. 67
4 Sections on the Sensory Profile, School Companion. 69
5 School Factors and Quadrants on the SC. 69
6 Descriptive Categories on the SDQ, SSP and SC. 84
7 Timetable of Research Activities. 87
8 Participants Arranged by Gender. 89
9 Breakdown of Participants by Schools, Ranked According to the
Index of Multiple Deprivation.
91
10 Number of Participants Reported to have been Assessed by an
Occupational Therapist.
92
11 Breakdown of Participants by Type of BESD as Measured by the
SDQ.
92
12 Prevalence of SPDs as Rated by Parents and Teachers. 93
13 Prevalence of SPDs by Gender. 94
14 The Percentage of Pupils with SPDs and BESD according to the
Index of Multiple Deprivation Score for the Pupil’s School.
95
15 Breakdown of Prevalence of SPDs by Section on the Short Sensory
Profile.
97
16 Prevalence of SPDs by Section on the Sensory Profile, School
Companion.
99
17 Analysis of Associations Between Parent and Teacher Responses
on Sensory Measures.
101
18 Background Factors Where No Associations were Found with SDQ
or Sensory Measures.
103
19 Significant Associations Between Background Factors and ‘Total
Scores’ on the SSP and SC.
104
20 Associations Between SSP Sections and Children Rated as Having
Difficulties in Background Factors.
105
21 Associations Between SC Sections and Children Rated as Having
Difficulties in Background Factors.
106
10

22 Associations Between SC School Factor Sections and Children
Rated as Having Difficulties in Background Factors.
107
23 Analysis of Association Between Parental Sensory Data (SSP) and
SDQ Categories.
108
24 Analysis of Association Between Teacher Sensory Data (SC) and
SDQ Categories.
109
25 Responses to SENCO Questionnaire, Relating to SENCo
Knowledge About Sensory Processing Difficulties.
111
26 Overview of Main Results for the Whole Sample. 113
27 Overview of Main Results for Mainstream Schools and the BESD
Special School.
114
28 Percentage of BESD pupils with difficulties on the SSP compared
to ASD pupils.
128
List of Figures Page
1 The Sub-categories included in Sensory Processing Disorder 23
2 Participants Arranged by School Year Group 89
3 Prevalence of SPDs by School Year Group using the SSP and SC
Total Scores
94
4 The Percentage of Pupils with SPDs and BESD According to the
Deprivation of the Pupil’s School
96
5 Percentage of Children with Difficulties on the Sections of the Short
Sensory Profile
98
6 Percentage of Children with Difficulties on the Sections of the
School Companion
100
11

Abbreviations Abbreviation Full Term
ADHD Attention Deficit Hyperactive Disorder
ASD Autistic Spectrum Disorders
BESD Behavioural, Emotional and Social Difficulties. NB. In the context of
this research BESD is used to refer to Behavioural, Emotional
and/or Social Difficulties.
DCD Developmental Coordination Disorders
DSM-IV Diagnostic and Statistical Manual of Mental Disorders IV
DSM-V Diagnostic and Statistical Manual of Mental Disorders V – due to be
printed in 2013
EBD Emotional and Behavioural Difficulties
EEG Electroencephalography
EP Educational Psychologist
ERP Event Related Potential
IMD Index of Multiple Deprivation
OT Occupational Therapist
PBST Primary Behaviour Support Team
SC Sensory Profile School Companion (sensory measure provided by
teachers)
SDQ Strengths and Difficulties Questionnaire
SENCo Special Needs Coordinator
SMDs Sensory Modulation Difficulties
SOR Sensory Over-responsivity
SPDs Sensory Processing Difficulties
SPM Sensory Processing Measure
SPSS Statistical Package for the Social Sciences
SSP Short Sensory Profile (sensory measure provided by parents)
VT Vagal Tone. Low baseline vagal tone is associated with SMDs.
12

Chapter 1
Introduction
An interest in sensory processing difficulties was initiated by a number of
observations made while working with children with behavioural difficulties at
school. Teachers commented that they were confounded by the behaviour of certain
children, for example when a generally anxious and withdrawn child lashed out with
no warning in the lunch queue. Similarly a generally co-operative boy was observed
to employ extreme tactics to ensure that he did not have to join the rest of the
school in the hall for assembly or lunch. During assessment he begged to be able to
use a biro rather than a pencil due to the scratching noise that the pencil made on
the paper and also asked for the batteries of the clock to be removed so that the
‘terrible ticking’ would stop. It was observed that another pupil was repeatedly
reprimanded by his mother and teacher for ruining his uniform and school
equipment. His teacher stated ‘It is disgusting the way he chews everything. Why
does he behave like a toddler when he is 8 years old? I simply don’t understand it’.
It was this last comment that confirmed the realisation that there was a need to
investigate the sensory needs of children with behavioural, emotional or social
difficulties (BESD), which in turn might lead to a better understanding of their
behaviour.
Children with BESD can cause considerable concern and, at times, frustration to
teachers as their needs may require substantial adult intervention and flexible
approaches in order to successfully support them within school (Beaman, Wheldall
& Kemp, 2007). For many BESD pupils support may be sought from an educational
psychologist (EP). Hence a clear understanding of the needs of BESD children is
directly relevant to the role of the educational psychologist.
A literature search into sensory processing difficulties demonstrated that sensory
processing theory provides a convincing theory of the behaviours listed above. It is
proposed that some children have difficulties regulating their levels of arousal and
may be either over-sensitive or under-sensitive to sensory stimuli (Dunn, 1999).
Hence an oversensitive child would be likely to find the world very intense and might
consider everyday sensory inputs, such as the noise in the school hall, intolerable
13

(Williams, & Shellenberger, 2008), whereas other children need a high level of
sensory input in order to be able to concentrate. They may become accustomed to
gaining the necessary input through habits such as chewing, rocking or fiddling
(Murray-Slutksy & Paris, 2005). This theory appears to be very relevant to certain
children with BESD, but there is no evidence relating to how many children with
BESD may experience sensory processing difficulties.
1.1 Sensory Processing in Typical Children
Before investigating sensory processing difficulties (SPDs) it is necessary to
summarise the theory of typical sensory processing. The term ‘sensory processing’
refers to the body’s ability to register a sensory input and interpret the information so
that an appropriate response is made (Mangeot et al. 2001). For example when a
child sees his mother, light enters his eyes. The child’s brain interprets the visual
information and recognises his mother smiling at him. The child responds
appropriately by smiling back.
It is proposed that humans have seven different senses (Miller, Anzalone, Lane,
Cermak & Osten, 2007) as described below. The following descriptions of the seven
senses are summarised from Dunn (1999); Dunn (2006); Kranowitz (1998); Murray-
Slutsky & Paris (2005); Williams & Shellenberger (2008); and Children’s
Development Team (2006).
a) Sight / Visual Processing: The eyes detect light which the brain interprets
to enable understanding of what is seen in the world around. Visual
information is mentally organised so that humans are able to identify
differences and similarities and remember visual pictures and patterns
through visual memory. It is suggested that a small percentage of children
are overly distracted by visual input and find it hard to concentrate in
cluttered or brightly decorated rooms (Children’s Development Team,
2006).
b) Hearing / Auditory Processing: Human ears register noise all the time.
Good auditory skills greatly aid the ability to develop speech, follow verbal
instructions and the development of phonic skills during literacy acquisition
(Murray-Slutsky & Paris, 2005). Heller (2003) comments that the current
world is much noisier than it used to be when our ears were designed
14

thousands of years ago. It is proposed that some children find it difficult to
ignore background noise to focus on what the teacher is saying. Certain
children may find particular noises unusually unpleasant or alternatively do
not ‘tune in’ to what is being said and hence do not respond to instructions
(Dunn, 2006).
c) Smell / Olfactory Processing: Smell and taste are closely linked; for
example it is more difficult to taste food when experiencing a blocked nose.
Certain children may be very sensitive to particular smells that are not
really noticed by other people (Henry, Kane-Wineland & Swindeman,
2010).
d) Taste / Oral Processing: Taste is obviously hugely important during eating
and drinking. However it should be noted that the mouth is also very
sensitive to touch. Some children are reported to be sensitive to the texture
or temperature of food. Babies use their mouths to explore the world by
chewing and licking most objects within reach. Some older children
continue to feel the need to explore the world by chewing, tasting or licking
objects (Murray-Slutsky & Paris, 2005).
e) Touch / Tactile Processing: Constant information is received through the
skin (Heller, 2003). The main function of the tactile system is to protect the
body by receiving information about pressure, vibration, temperature and
pain. It is usual for the brain to ignore irrelevant tactile stimuli. For example
most people are aware of the feel of their clothes when they first put them
on, but soon stop noticing them unless the clothes are uncomfortable.
Some individuals are more sensitive to touch than others and may for
example be overly irritated by clothing labels (Henry et al. 2010).
Unexpected light tickly touch may be perceived as threatening (for example
it could indicate an insect crawling up the arm). In contrast deep touch or
firm pressure is usually calming, for example massage (Dunn, 2006).
f) Vestibular Processing: The vestibular system consists of fluid within the
inner ear and tells the body where the head is in relation to the ground. The
system enables interpretation of information about movement and balance.
The vestibular system provides evidence about how fast the body is
moving and helps to co-ordinate the body and eye movements in relation to
the head (Williams & Shellenberger, 2008). Some children love being
thrown up in the air and whirled round and round, others are terrified when
their feet leave the ground. Children with sensitive vestibular systems are
thought to be susceptible to travel sickness (Kranowitz, 1998).
15

g) Proprioception (Kinaesthesia): This is the information that the body
receives from muscles and joints during movement. It enables the brain to
know the location of the person’s arms and legs without looking and to
have a good awareness of where the body is in relation to objects in the
environment. Proprioceptive input is thought to be calming; hence exercise
can be a good way to calm down (Henry et al., 2010). Some children do not
receive enough feedback from proprioceptive input and so appear clumsy
due to poor awareness of where their body is in relation to other objects.
Some theorists also discuss an eighth sense called interoception which is
associated with sensations of the internal organs. ‘It regulates functions such as
heart rate, hunger, thirst, digestion, body temperature, sleep, mood, and state of
arousal’ (Kranowitz, 1998, p 41).
The body receives information from these seven or eight possible sources. In order
to function effectively it is necessary to integrate information from all the senses so
that a coherent understanding of the world and how our body moves within the
world is achieved (Miller et al., 2007). This process was termed sensory integration
by Dr Jean Ayres (1963). For example, when riding a bicycle the brain registers
information about balance from the vestibular system, while receiving proprioception
from muscles and joints as the legs operate the pedals and the arms steer. At the
same time the tactile system will be aware of the feel of the person’s clothes, the
bike seat and the texture of the handle bars etc. The ears are listening for traffic and
the eyes scanning the road for dangers, which enable the cyclist to pick the best
route to avoid potholes. All these pieces of information are effectively integrated in
the brain to enable the cyclist to safely negotiate a route in a co-ordinated fashion.
A baby’s genes provide the blueprint for development, however typically developing
children also learn through experience (Sheridan, Sharam, & Cockerill, 2007).
Babies are born with an inborn desire to communicate with others and explore their
surroundings (Kinnealey & Miller, 1993). Babies will attend to their environment and
develop an awareness of a range of sensations including the feel of their clothes,
being rocked and cuddled as well as experiencing noise and light etc. The vestibular
system is stimulated when babies are picked up and rocked (Ottenbacher, 1983).
Most children find firm pressure calming, such as when cuddled by a parent (Dunn,
1999). Oral stimulation also tends to be calming, as is seen when a baby suckles or
uses a dummy. Young children rely heavily on their sense of touch to learn about
16

the world. Hence babies will grasp objects, look at them and put objects in their
mouth which is extremely sensitive to touch (Murray-Slutsky & Paris, 2005). The
brain then assimilates the information provided by the different senses to form a
picture of the object, based on how it looks, the texture, weight, taste etc.
Toddlers like to actively interact with the world. Play is the child’s work. In order to
develop a wide range of skills it is proposed that small children need to be cuddled
and rocked (Ottenbacher, 1983). They also need to crawl, climb, run, experiment,
fiddle, chew, grab, squash, watch, listen, smell etc. because brain development
benefits from a range of varied experiences (Diamond, Krech & Rosenzweig, 1964).
Even school age children may still rely heavily on their sense of touch when learning
new skills (Murray-Slutsky & Paris, 2005). It is suggested that experiencing the wide
range of sensations on offer in the world is not only typical for young children, but
actually an essential aspect of development.
1.2 Sensory Processing Difficulties (SPDs)
It is proposed that some children do not process sensory information in a typical
way (Dunn, 1999). Such children may present a wide range of troubling behaviours
depending on the nature of their sensory processing difficulties (SPDs). Dunn (1999
& 2006) proposed that children who have sensory processing difficulties tend to fall
into two camps, those that over-respond to sensations and those that under-
respond. Children with a high threshold for noticing sensations often experience
poor registration, meaning that many sensations go unnoticed, and indeed these
children may bump into furniture and engage in very rough play and yet hardly
seem to register discomfort. Certain children in this group actively seek sensation to
remain alert because they are not receiving enough information from their senses.
Sensation seekers may be observed to endlessly fiddle, chew or fidget etc. Dunn
goes on to explain that conversely, other children have a very low threshold for
sensations and so may be very sensitive to sensory input. These children may find
loud noises distressing or be particularly fussy about scratchy clothes or strong
flavoured food for example. Some children in this group go to considerable lengths
to avoid sensations which they find intolerable. Hence they may refuse to take part
in certain activities or lash out in order to escape from a situation that they feel is
unbearable. Williams & Shellenberger (2008) demonstrate how such behaviour may
be misunderstood in the following scenario.
17

‘If a child is standing in line at school and is touched from behind, however, it is not appropriate to react by hitting, running away or crying hysterically. What happens at this point? The teacher approaches and says, “You know the rules! Why did you hit another student?” the child is not able to say, “I do know the rules, but my brain perceived personal danger in response to this sensory input and decided, in error, to send messages to my autonomic nervous system to prepare my body to go into flight, fright or fight for protection” ’ (2008, p 1.10).
Understandably inappropriate behaviour may be very problematic at school. To
complicate the situation further, it is suggested that children with sensory
modulation difficulties (SMDs), (a subcategory of sensory processing difficulties),
have difficulties regulating their levels of arousal and so may fluctuate from one
extreme to another (Murray-Slutsky & Paris, 2005). This means that at one time
they may actively seek sensations but on another occasion they may become
overloaded and start avoiding sensations. As a result, understanding sensory
processing difficulties requires considerable specialist knowledge and experience
because children may display similar behaviours but for very different reasons. For
example, a restless fidgety child may be assumed to be sensory seeking and hence
need lots of sensory input. However, a very anxious oversensitive child may also
appear fidgety due to anxiety and difficulties concentrating in a noisy and busy
environment. Please see section 2.1 for further information on SMDs.
The theory of sensory processing suggests an alternative hypothesis for the cause
of a wide range of behaviours that are commonly seen in schools and may lead
children to be identified as having BESD. Challenging behaviour may interfere with
the learning of both the child with difficulties and of the other children in the class.
So investigating the possibility that some troublesome behaviour may have a
sensory cause is relevant to the role of the educational psychologist in supporting
children to effectively learn at school. However, a review of the literature suggests
that no research has investigated the prevalence of sensory processing difficulties
among children who were rated by the schools as having BESD.
1.3 Outline of the Study
A literature review was undertaken to investigate the development of theories of
sensory processing and also to examine the research evidence relating to the
theory. Research investigating the prevalence of SPDs in children with specific
18

diagnoses such as Autism Spectrum Disorders (ASD), Fragile X Syndrome and
Attention Deficit Hyperactive Disorder (ADHD) is discussed. The evidence is
reviewed, as are the two studies which have investigated the prevalence of SPDs in
the general population. The links between SPDs and behaviour difficulties are
considered before providing a general overview of BESD within the UK and how
such difficulties impact on children’s education. It is concluded in the literature
review that no study to date has examined the prevalence of SPDs in children who
are identified by schools as having BESD. Hence this study aims to investigate
whether SPDs are a concern for a substantial proportion of the BESD children in
this sample or only present in a small number of cases.
A total of 39 schools were asked to nominate pupils with BESD. Parents of the
nominated children were asked if they consented to take part in the study. If they
agreed, teachers completed The Strengths and Difficulties Questionnaire to provide
a measure of the child’s BESD. Both parents and teachers completed a sensory
questionnaire. The percentage of children found to have difficulties on the sensory
questionnaires was calculated. Considerable numbers of children with BESD in this
study were found to have SPDs. The implications of this finding for children, schools
and educational psychologists are discussed. Finally a number of suggestions for
future research are made.
It should be noted that formal diagnosis of Sensory Processing Disorder usually
requires detailed assessment by an occupational therapist. Therefore, the term
‘sensory processing difficulties’ (SPDs) is cautiously used to report results in this
study. It should be emphasised that sensory difficulties identified by the Sensory
Profile (the sensory measure used in this study) do not constitute a formal
identification of Sensory Processing Disorder. For further discussion of the use of
the terms Sensory Processing Disorder and Sensory Processing Difficulties please
see section 5.1.1.
19

Chapter 2
Literature Review
A literature search was undertaken using PsycINFO, ERIC (Educational Resources
Information Centre) and Google Scholar. The following key words and phrases were
used in different combinations: Attention Deficit Hyperactive Disorder, ADHD, ASD,
attention, auditory, Autism, Autistic, behavioural, BESD, children, defensive,
difficulties, disorder, dyslexia, dysfunction, EBD, education, efficacy, emotional,
integration, integrative, over-responsive, physical activity, prevalence, processing,
school, sensory, SIT, social, and tactile.
A literature search using the key terms listed above revealed a dearth of research
into SPDs in the field of educational psychology. No articles relating to sensory
processing were found in journals dedicated to educational psychology including
‘Educational & Child Psychology’, ‘British Journal of Educational Psychology’,
‘Educational Psychology in Practice’ and ‘Educational Psychologist’.
The only reference to sensory needs found in educational psychology literature is a
volume of Educational & Child Psychology which included seven articles on
‘Children and young people with sensory impairments’. However the editorial of this
volume clearly states that the term ‘sensory impairments’ refers to ‘impairments in
hearing and vision’ (MacKay, 2010 p5). Six of the articles are about hearing
impairment and one article discusses visual impairment. None of the articles reflect
on possible difficulties with the other senses (e.g. touch, vestibular, proprioception,
smell & taste) or possible difficulties children may have in regulating their responses
to sensory input.
Difficulties caused by sensory sensitivities are touched on by Barrett (2006) in
Educational Psychology In Practice, where he comments on an account given by a
pupil with Asperger’s Syndrome saying ‘When Kenneth, aged 11 described his
classmates’ voices as sounding like “Dynamite going off in my ears” the teachers
and teaching assistants sat up and listened’ (p 95). This clearly describes a boy who
is very sensitive to noise. However the article goes on to discuss the value of
autobiographical accounts in education and does not reflect on issues surrounding
sensory processing.
20

Hence the literature relating to sensory processing that is reviewed here comes
largely from the field of occupational therapy with some contributions from clinical
psychology and neuroscience. A summary of the key findings of the literature is
provided below.
2.1 Historical Overview of Sensory Integration Theory
Dr Jean Ayres first coined the term sensory integration dysfunction in 1963 (Ayres,
1963) due to her observations of difficulties some children seem to experience.
Ayres was trained as an occupational therapist, a psychologist and had postdoctoral
training as a neuroscientist (Miller et al., 2007). Ayres defined sensory integration as
the ability to effectively organise the sensory information that we use: ‘It is a
neurological process that enables us to make sense of our world by receiving,
registering, modulating, organizing, and interpreting information that comes to our
brains from our senses’ (Pollock, 2009, p 6).
The theory of sensory integration dysfunction was originally based on work with
children with disabilities (Kinnealey & Miller, 1993). Ayres proposed that some
children experience impairment in their ability to process sensory information which
results in difficulties being seen in a number of areas. For example, children may
experience problems with attention, organisation, regulating their emotions, learning
and participating in positive social interactions (Ayres, 1972). As stated by
Kinnealey & Miller (1993):
‘Ayres’ work provided a unique perspective and constitutes one of the major theoretical frameworks of occupational therapy. The theory reflects her background in the neurosciences, psychology, and occupational therapy. She related neurophysiological processes to functional ability and behaviour and developed postulates about the relationship between sensory input and brain development with the goal of changing the child’s neuromotor efficiency and capacity.’ (p 475)
The theory of sensory integration is based on the following five assumptions:
1. There is plasticity within the central nervous system, hence it is possible to
change the brain through interventions based on sensory integration theory;
2. The sensory integrative process occurs in a developmental sequence;
3. The brain functions as an integrated whole but is composed of systems that
are hierarchically organized;
21

4. Integration of the senses is required to produce adaptive responses and
practice in producing adaptive responses encourages the development of
sensory integration;
5. Children possess an inner drive to develop sensory integration, which is
demonstrated through participation in sensorimotor activities.
(Kinnealey & Miller, 1993).
Ayres developed tools to assess sensory integration in children. Originally the
Southern Californian Sensory Integration Test was used, but this was superseded
by the Sensory Integration and Praxis Test which was developed in 1989 and is still
used today (Kinnealey & Miller, 1993).
Ayres’ original theory has been further developed by a range of scholars particularly
in the field of occupational therapy. The further development of Ayres’ ideas has led
to some divergence in theory and practice around sensory integration. In 2007 there
was a move to trademark the term Ayres’ Sensory Integration© to distinguish Ayres’
original theory from other sensory approaches (Pollock, 2009). There was also
some confusion between the term sensory integration as used by occupational
therapists and neuroscientists. For the latter, the term sensory integration refers to a
neurophysiological cellular process where signals from two or more senses are
combined in the central nervous system (Davies & Gavin, 2007), rather than a
behavioural response to a sensory input as proposed by Ayres (Miller et al. 2007).
To establish clarity, the term Sensory Processing Disorder was proposed by Miller
et al. (2007) as a new diagnostic label in 2007 which included several sub-
categories as shown in the diagram below.
22

Figure 1:
The Sub-categories Included in Sensory Processing Disorder.
Miller et al. (2007) stated that a benefit of the proposed structure was that it
identified different diagnostic subtypes. It was noted that:
‘Diagnostic subgroups within sensory integration dysfunction encompass immense individual differences in detecting, regulating, interpreting and responding to sensory input. We propose that a diagnosis of SPD [sensory processing disorder] be made if, and only if, the sensory processing difficulties impair daily routines or roles’. Miller et al. (2007, p 136).
The new term Sensory Processing Disorder effectively distinguishes the disorder
from both sensory integration theory and interventions such as sensory integration
therapy. The main focus of this study is on sensory modulation difficulties (SMDs)
because the behaviours predominantly associated with being unable to regulate
levels of alertness are likely to be problematic in class. Also, sensory-based motor
Sensory Processing Disorder
Sensory Modulation Disorder
Sensory Over-responsivity
Sensory Under-responsivity
Sensory Seeking
Sensory-based Motor Disorder
Dyspraxia
Postural Disorders
Sensory Discrimination
Disorder
Visual
Auditory
Tactile
Vestibular
Proprioception
Taste / Smell
23

disorders require assessment and remediation of children’s physical abilities which
is outside the area of expertise for most educational psychologists.
While occupational therapists regularly refer to Sensory Processing Disorder as a
diagnostic category, it is not included in the Diagnostic and Statistical Manual of
Mental Disorders (DSM IV). However, it is possible that Sensory Processing
Disorder will be included in the updated version of the Diagnostic and Statistical
Manual of Mental Disorders (DSM V) which is due to be published in May 2013.
Sensory Processing Disorders have been included in three diagnostic classification
references: The Diagnostic Classification of Mental Health and Developmental
Disorders of Infancy and Early Childhood, Revised; The Diagnostic Manual for
Infancy and Early Childhood; and The Psychodynamic Diagnostic Manual (Miller et
al., 2007). Hence, Miller et al., argue that Sensory Processing Disorder is
increasingly gaining recognition outside the field of occupational therapy. However,
Pollock (2009) reports that some professionals question whether Sensory
Processing Disorder should be considered to be an independent diagnosis and they
suggest that difficulties with sensory processing may always be associated with
other issues such as anxiety and diagnoses such as Autistic Spectrum Disorder. It
should be noted that this study seeks to identify what proportion of a BESD sample
experiences sensory difficulties. Establishing whether observed sensory difficulties
might be the consequence of a specific, independent impairment in sensory
processing (as suggested by the term sensory processing disorder) or the product
of other issues such as anxiety is beyond the scope of this research. The literature
search demonstrates that to date the vast majority of research into SPDs has taken
place in America, Canada, Australia and South Africa. SPDs are less well
researched in the UK.
2.2 Evidence of Sensory Processing Difficulties (SPDs)
Since Ayres developed the theory of sensory integration in the 1960s there has
been a wealth of anecdotal evidence about children who have difficulties processing
sensory information. Ayres developed the Sensory Integration and Praxis Test
(Kinnealey & Miller, 1993) which provided occupational therapists with a formal way
of assessing SPDs. Other screening tools have been developed such as the
Sensory Profile developed by Dunn (1999) and more recently the Sensory
Processing Measure which was published in 2007 (Parham & Ecker, 2010). Such
24

standardised materials enable detailed sensory information to be collected about
children, which is combined with thorough observations usually by an occupational
therapist before an identification of Sensory Processing Disorder or SPDs is made.
Observations and questionnaires rely on interpreting a child’s behaviour whereas
recently research has taken place to try to establish SPDs through scientifically
measuring responses to stimuli.
2.2.1 Direct Measurement of Sensory Responses.
As shown above SPDs may include a wide range of different subgroups. Sensory
processing theory suggests that children with sensory difficulties may be either
oversensitive or under-sensitive to any of the senses (Dunn, 1999). Ayres observed
children who found certain types of touch unusually uncomfortable or unpleasant so
that they felt the need to escape the situation. She called this difficulty ‘tactile
defensiveness’ (Ayres, 1962). It is thought that the main problem with over-
responsiveness is an inability to ignore irrelevant stimuli combined with an
inappropriately large reaction to those stimuli (Schneider et al., 2008). Parush,
Sohmer, Steinberg & Kaitz (2007) studied children’s responses (by measuring
somatosensory evoked potentials) to small electrical stimuli applied to the skin on
the wrist. Three groups were tested: typically developing children (n=60); children
identified as having ADHD (n= 21); and children with ADHD who had also been
identified (via a parental questionnaire) as having tactile defensiveness (n=46). The
study found that children with tactile defensiveness could be distinguished from the
other two groups as a result of larger responses to the stimuli. The authors state
‘the present data support claims that TD [tactile defensiveness] is a discernible
entity, marked by anomalous physiological responses to somatosensory stimuli’
(Parush et al., 2007, p 557.) Hence this study provides physiological evidence of
parental observations of tactile over-responsiveness.
McIntosh, Miller, Shyu & Hagerman (1999) found that children with sensory
modulation difficulties showed greater magnitude and frequency of electrodermal
responses. Electrodermal responses are changes in the electrical conductivity of the
skin and occur when a person is startled or feels aggressive or defensive (Mangeot
et al., 2001). Similar results were found by Miller et al. (1999) when comparing
electrodermal response measurements for children with Fragile X Syndrome (see
section 2.6.1) with typical controls. Hence this also provides evidence that children
25

with SPDs over-respond and continue to respond to stimuli again and again rather
than being able to filter out irrelevant stimuli.
Davies and Gavin (2007) investigated the brain processes of 25 typically developing
children and 28 children assessed as having SPDs. The authors theorised that
children with SPDs would have different brain activity from typical children.
Electroencephalography (EEG) allows brain activity to be measured by placing
small sensors on the scalp. In addition to measuring EEG, event-related potentials
(ERP) were used to show the brain’s activity in relation to a specific event. Davies
and Gavin (2007) found that children with SPDs were less able to suppress
repeated or irrelevant stimuli than typical children (p=.04). It was noted that:
‘the decreased ability of children with SPD [sensory processing disorder] to gate out or suppress irrelevant auditory stimuli, as shown in this study, may explain certain behavioural manifestations such as distraction, impulsiveness, abnormal activity level, disorganisation, anxiety, and emotional liability, often observed in children with SPD’ (Davies & Gavin, 2007 p 186).
It was also found that typically developing children showed better abilities to
suppress irrelevant stimuli as they matured, whereas the skills of children with SPDs
did not improve with age. In addition, children with SPDs showed much more
variation in their responses to auditory stimuli, which the authors interpreted as a
demonstration of the disorganised patterns of brain activities that Ayres
hypothesised.
It was concluded that differences in brain activity correctly distinguished typically
developing children from those with SPDs with 86% accuracy. Subsequent studies
found that SPDs were identified by differences in brain activity with 96% accuracy
(Davies, Chang & Gavin, 2010), and with 79% accuracy (Gavin, Dotseth, Roush,
Smith, Spain & Davies, 2011). These data indicate that of the samples of children,
who had been identified by professionals as having SPDs as a result of the way
they behaved, a high percentage could also be identified by measuring the pattern
of their brain activity. This lends weight to the suggestion that SPDs could be
recognised as a distinct diagnosis or at least that sensory difficulties observed by
occupational therapists are also evident through direct measurement. It should be
noted that the studies only measured functioning in the cortex, whereas it is
hypothesised that much processing of sensory information takes place in the sub
cortex. Also, only responses to auditory stimuli were measured, hence data on
26

processing one type of sensory stimuli were provided, rather than measuring brain
patterns of children integrating a range of complex stimuli.
Schaaf et al. (2010) investigated whether children with sensory modulation
difficulties (n=43) could be distinguished from typical children (n=40) by their vagal
tone (a measurement of parasympathetic nervous system activity). Although the
SMDs children tended to have lower baseline vagal tone as predicted, the scores
for the SMDs group as a whole was not significantly different from the typical group.
However, it was found that children with the most severe sensory modulation
dysfunction demonstrated significantly lower parasympathetic baseline activity and
also had the poorest behavioural responses. This result possibly suggests that
either the measure of vagal tone was not sensitive enough to detect SMDs or that
there were no significant physiological effects in mild cases of SMDs. This leads to
the possibility that some of the children, who had been identified with SMDs on the
basis of their behaviour, did not actually have significant sensory difficulties.
Similarly Schoen, Miller, Brett-Green & Nielsen (2009) found differences in
sympathetic nervous system functioning for children with ASD (n=38) and SMDs
(n=31) and compared to typically developing children (n=33). It was found that ASD
children had atypical physiological arousal in that they had significantly lower
baseline arousal whereas children with SMDs had higher reactivity to the sensory
stimuli. The authors concluded that it was possible to differentiate between ‘children
with ASD and children with SMD from typically developing children on both
behavioural and physiological measures’ (Schoen et al., 2009, p 9).
Research into direct measurement of sensory processing deficits is in its infancy.
However, there is some evidence to show that children with SPDs respond
differently to stimuli compared with typical children. Direct measurement of
responses to sensory stimuli in children with an ADHD diagnosis has led to the
hypothesis that two distinct groups of children can be identified; children with ADHD
and SPDs and those with only ADHD (Parush et al., 2007 and Mangeot et al.,
2001). Hence, it is important to consider how many children are affected by sensory
difficulties and if SPDs are associated with other conditions.
27

2.3 Factors Associated with SPDs
The causes of SPDs remain unknown but it is possible that it is associated with
various factors. May-Benson, Koomar & Teasdale (2009) collected data on
children’s pre, peri, post-natal and early childhood development using a parent
report questionnaire called ‘The Developmental Sensory History’. The SPDs group
consisted of 1000 participants that had all been diagnosed as having SPDs through
clinical observations of sensory processing, postural control and motor performance
as well as through assessment using the Sensory Integration and Praxis Tests,
Southern California Sensory integration Tests or Miller Assessment for Pre-
Schoolers. Children with known disorders, such as ASD or Fragile X Syndrome
were excluded from the SPD group. Data was also collected for a second group of
467 participants diagnosed with ASD. It was found that no single factor was strongly
associated with SPDs but it was established that children identified as having SPDs
had an average of seven issues in the following categories: problems during the
mother’s pregnancy; complications during delivery; assisted delivery; birth related
injury/illness; childhood illnesses or injuries; developmental problems; and delay in
reaching developmental miles stones (May-Benson, Koomar & Teasdale, 2009).
Hence, it is clear that there are some associations between children who have been
identified as having SPDs and factors that affect child development during
pregnancy, birth and through the child’s early years.
2.3.1 Prenatal and Birth Difficulties
May-Benson et al. (2009) found high levels of maternal stress during pregnancy in
children with SPDs. Similar findings have been found in work with rhesus monkeys,
where it was found that monkeys who had been exposed to pre-natal stress (n=7)
showed ‘behavioural sensitization’ (Schneider et al. 2008, p 107). It should be
noted that only one type of sensory processing difficulty was measured (tactile
defensiveness) and the effects in this study were reported to be ‘slight’. There is
evidence that prenatal stress is associated with behavioural difficulties in children,
for example O’Connor, Heron & Glover (2002a), Bergman, Sarkar, O’Connor, Modi
& Glover (2007) and O’Connor, Heron, Golding, Beveridge & Glover (2002b).
However, further evidence is needed to further support May-Benson et al.’s (2009)
findings of specific links between SPDs and prenatal stress.
28

Another prenatal condition that has been associated with SPDs is the baby’s
exposure to alcohol during pregnancy. Again Schneider et al. (2008) found a
relatively high withdrawal rate to repeated tactile stimulation in monkeys who had
been exposed to prenatal alcohol exposure (n=9). Hyper-responsiveness to mildly
painful stimuli has also been found in rats which have experienced prenatal alcohol
exposure (Rogers, Barron & Littleton, 2004, cited in Schneider et al., 2008).
Whereas in humans prenatal alcohol exposure is associated with difficulties with
cognitive functioning, processing speed, attention, memory, motor skills and
behaviour (Schneider et al., 2008; Franklin, Deitz, Jirikowic & Astley, 2008). High
levels of SPDs have been found in children with a diagnosis of Foetal Alcohol
Syndrome (as is discussed in section 2.4.2.)
May-Benson et al. (2009) have shown that difficulties during delivery are associated
with SPDs, as children with SPDs were more likely to have experienced breech
delivery, cord wrap, assisted delivery and higher birth weight than typical children.
Most notably the incidence of jaundice was 3-4 times higher for children with SPDs
compared to typical children. Premature delivery was not associated with SPDs but
was a common factor for children with ASD (May-Benson et al., 2009).
Ben-Sasson, Carter & Briggs-Gowan (2009) suggest that low socioeconomic status
may be a risk factor for SPDs due to pregnant women from poor families being
more likely to be exposed to stress, violence and alcohol during their pregnancies.
As discussed in section 2.8.1 low socioeconomic status has been associated with
BESD (Washbrook & Waldfogel, 2011), indicating that environmental factors such
as poverty, as well as possible ‘within child’ difficulties may contribute to observed
issues such as SPDs and BESD.
2.3.2 Institutionalisation
It is theorised that children are pre-programmed to use their senses to explore the
world and hence they learn to integrate their senses through having a wide range of
experiences (Murray-Slutsky & Paris, 2005). Therefore, one would expect to see
SPDs in children who have had limited opportunities to explore and interact with the
world.
Church & Kaltenbach (1997) comment that there are critical developmental stages
during which animals and humans need appropriate levels of sensory stimulation in
29

order to achieve optimal development. For example, the first 2-3 years of life are
critical for the development of hearing and language. Church & Kaltenbach noted:
‘A hearing impairment at this age, even in an otherwise normal child is a form of sensory deprivation that can lead to permanent speech, language and intellectual deficits; cause distractibility, hyperactivity and developmental delays; and impair academic performance’ (p 495).
This observation indicates the importance of young children receiving appropriate
sensory stimulation.
Unfortunately, typical levels of stimulation do not always occur, either due to
children having impairments or due to environmental factors. It has been found that
the institutionalisation of children (for example due to living in an orphanage) is
associated with developmental delay and behavioural problems (Lin et al., 2005). In
addition, research has documented a lack of sensory stimulation and opportunities
for social interactions in orphanages (Casler, 1975 and Provence, 1989, cited in Lin
2005). Lin et al. suggest that:
… ‘institutionalized children are deprived of opportunities for sensory exploration and interaction with a variety of environments during early childhood. As a result, they may not be able to process and utilize sensory information to guide and regulate their behaviors effectively.’ (2005, p 139)
Cermak & Daunhauer (1997) studied sensory processing of 73 children who had
been adopted from Romanian orphanages compared with 72 typically developing
American children. A parental report called ‘The Developmental and Sensory
Processing Questionnaire’ was used. It was found that the Romanian children
demonstrated significantly more difficulties in sensory processing in five of the six
sensory domains that were assessed. They also showed significantly more
difficulties with levels of activity, feeding, organisation and social emotional
interactions. While this research is pertinent, it should be noted that there are
probable cultural differences between the two groups of children. Also, children who
have been placed in an orphanage and then adopted across the world to America
are likely to have suffered considerable emotional trauma and loss which may also
be detrimental to their development.
30

It has been found that children who have experienced early neglect in orphanages
show different levels of hormone production compared to typical children (Fries,
Ziegler, Kurian, Jacoris & Pollack, 2005). Even though the orphaned children in the
study (n=18) had been in adoptive families for an average of three years, children
still showed disruptive development of hormone systems compared to a control
group (n=21). The result is a reduction in the ‘calming effects that typically emerge
between young children and familiar adults who provide care and protection’ (Fries
et al. p 17239). This indicates that difficulties in social development persist long after
children have settled into caring family environments.
2.3.3 Attachment to Caregivers
Attachment theory suggests that children will only explore the world if they feel
secure (Bowlby, 1958). Hence, it is possible that the quality of attachments that
children experienced in early childhood is as important as their sensory
opportunities. It is acknowledged that in an orphanage, children are likely to have
poor opportunities for forming successful attachments as well as deprived sensory
experiences. The importance of attachment was highlighted in a study of play
behaviour in toddlers with autism. Naber et al. (2008) found that the quality of the
interaction between the toddler and the caregiver was closely linked to the child’s
development of play behaviour. It was concluded that ‘Attachment quality explained
play behaviour regardless of the clinical status of the children.’ (2008, p 863).
Children with secure attachments showed a higher level of play and spent more
time playing than those with disorganised attachments and hence had more
opportunities to sample a range of sensory experiences.
Bhreathnach (2008) discusses the links between attachment difficulties and
problems modulating responses to sensory input. Children who experience insecure
attachment may become hyper-vigilant and only attend to sensory inputs that the
child feels relate to his/her survival (Perry, 1995). Bhreathnach (2008) states that
parents have a crucial role to play in helping children to regulate their emotions. In
cases where children have not received adequate parenting, they have not been
taught to regulate their arousal levels, which affect both their emotional and sensory
responses. As stated by Bhreathnach, ‘The capacity to regulate arousal states
depends on how sensory information is processed that in turn is primarily influenced
by attachment history’ (2009, p4).
31

It is suggested that environmental factors such as socioeconomic status and
childhood trauma greatly affect child development and may impact on how the child
processes sensory information as well as on his/her behavioural, emotional and
social development (Ben-Sasson et al., 2009). Therefore, it is important to consider
the environmental issues and quality of attachment relationships in children’s lives
when trying to support their needs. As stated by Bhreathnach (2008),
‘Children with a significant history of trauma are frequently diagnosed as
having ADHD. There is a tendency to dissociate their symptoms from their
attachment history and ongoing family relationships. Their flight and fear
behaviours are often misunderstood and they may increasingly become
aggressive and oppositional if their emotional issues are not addressed’.
(p4)
Marsh (2011) comments on the benefits of positive touch and states that
psychologists have tended to focus on the senses sight and vision and have ignored
the beneficial impact of touch on children. In fact she proposes that the UK has a
‘non-contact’ culture where adult to child contact in school is restricted due to
concerns about the potential for abuse. Over 50 years ago Bowlby observed that
loving touch was instrumental in the development of secure attachment
relationships (1958). Marsh reports that there are physiological responses to
nurturing touch which stimulates, oxytocin, endorphins, dopamine, serotonin and
melatonin to be produced and have a calming effect. This suggests that positive
touch may be instrumental in helping children develop attachments, regulate their
emotions and levels of alertness, and hence relevant to both BESD children and
those with sensory modulation difficulties. The Importance of touch is also
highlighted by Gallace (2012) who presents evidence from studies that show that
‘Touch can affect our decisions, opinions and behaviour, even when we are
not fully aware of it. It contributes to our well-being and to the maintenance
of our social relationships. It also protects our body at both the physical and
psychological level’. (p899)
Gallace (2012) comments that Western society is moving towards reduced levels of
social touch which is concerning because tactile interactions are important to our
well-being. In addition he observes that despite the fact that touch affects all areas
32

of our lives and impact on our behaviour and social relationships the modality has
attracted little interest from researchers compared to vision and hearing.
Parush et al., (2007) also comment on the importance of touch in early life and the
crucial role that appropriate touch plays in development. They state ‘Recent studies
have shown that the tactile experience of nonhumans and humans early in life can
have long-term effects on neural functioning, the capacity to cope with stress, and
emotional development (attachment, emotional regulation, exploration and learning)’
(p 554). This emphasises the fact that both attachment and physical affection are
important factors in promoting optimal development in young children.
2.3.4 The Need for Environmental Complexity
The importance of a varied environment in promoting brain development has been
demonstrated by studies into early rearing of animals. For example Diamond et al.
(1964) found that greater brain growth is achieved by providing young animals with
a variety of toys and hence a varied environment. Stein, Perrault, Stanford, &
Rowland (2009) have studied the development of sensory integration using cats. It
was found that initially neurones in kittens could respond to sensory inputs
individually but were unable to integrate information in order to respond to multi-
sensory inputs. The capacity to process multi-sensory information developed over
time as a result, it is suggested, of experiencing a wide range of sensations. The
authors found that they could alter the development of sensory processing in young
cats by rearing them in the dark which provided evidence that environmental
experience in young animals shapes the neural circuits that underlie sensory
integration. Interestingly, retests at four years old showed that the adult cats no
longer experienced the deficits induced when they were young, which supports
Ayres’ assumption about the plasticity of the brain and suggests that deficits,
induced in otherwise typical infants, may be overcome with appropriate sensory
input as the child develops. However, it does not provide evidence either for or
against the assumption that the brains of children with learning difficulties also have
plasticity.
The effects of early experiences were studied by Van den Dries, Juffer, Van
Ijzendoorn, Bakermans-Kranenburg (2010) who followed up children who had been
adopted from China. One group of children had been institutionalised (n=50) and
the other group had been in foster care prior to adoption (n=42). Both groups were
33

assessed two and six months after adoption. It was found that children who had
been fostered performed significantly better on cognitive and motor skills than
institutionalised children, indicating that institutionalisation is more detrimental to
children’s development (Van den Dries et al., 2010). In general it has been found
that children demonstrate impressive catch up of skills following adoption, but that it
is likely to take two years for them to reach age appropriate skills (Cohen, Lojkasek,
Zadeh, Pugliese & Kiefer, 2008; Van Ijzendoorn & Juffer, 2006). Such findings again
provide evidence of the important of environmental influences in children’s
development and of the ability of the brain to recover after periods of early
deprivation, which suggests that children who may have developed sensory issues
as a result of deprivation have a good chance of recovery, if placed in more
favourable environmental conditions.
Lin et al. conclude that: ‘findings suggest that the presence or absence of new
learning experiences influences brain development and that a certain degree of
environmental complexity is important for optimal brain development and functional
behaviours’ (2005, p 140).
2.3.5 Genetic Influences
Although it has been suggested that a range of environmental issues are associated
with SPDs, the identification of specific genetic and or neurological processes that
underlie SPDs have thus far eluded clinicians and scientists (Stein et al, 2009).
Goldsmith, Van Hulle, Arneson, Schreiber & Gernsbacher (2006) concluded that
there is some indication that tactile defensiveness is more heritable than auditory
difficulties during a twin study. It was found that monozygotic twins were more likely
to show similar tactile difficulties than dizygotic twins. However, further research is
needed to establish genetic factors in SPDs.
2.4 Prevalence of SPDs in Children with Specific Diagnoses
Early research into SPDs had a focus on pupils with learning disabilities as it was
noted that sensorimotor development is atypical in many children with learning
disabilities (White, 1979). SPDs have been found to be common in children
diagnosed with developmental disabilities. The prevalence of SPDs within samples
with particular clinical diagnoses is explored below, in order to provide a comparison
34

of the prevalence of SPDs found in children with specific diagnoses compared with
the prevalence in non-referred populations.
The Short Sensory Profile is a brief parental questionnaire that was developed from
the Sensory Profile using 38 questions that were found to be particularly reliable
(Dunn, 1999). The SSP has become accepted as a useful tool for research and has
been used in many of the studies discussed below, such as: Mangeot et al. (2001);
Baranek, Chin, Hess, Yankee, Hatton & Hooper (2002); Baranek (2002); Rogers,
Hepburn & Wehner (2003); Tomchek & Dunn (2007); Franklin et al. (2008); and
Gavin et al. (2011). It should be noted that research often reports prevalence of
Sensory Processing Disorder on the basis of results from the SSP. The fact that the
SSP was never designed to provide evidence of a formal diagnosis of Sensory
Processing Disorder but only as a screening tool, should be considered when
deliberating the studies that rely on the SSP as a sole measure of SPDs. In addition
the SSP only briefly reports on parents views. Hence, no evidence is provided on
how the child behaves at school or whether the same pattern of difficulties is
reported by both parents and teachers.
2.4.1 Autistic Spectrum Disorders and Fragile X Syndrome
Autistic Spectrum Disorder (ASD) has become the most prevalent
neurodevelopmental diagnosis in children (Hodgetts & Hodgetts, 2007). Difficulties
with sensory processing have been well documented for pupils on the autistic
spectrum (Tomchek & Dunn, 2007; Baranek, 2002; Ermer & Dunn, 1998; Dawson &
Watling, 2000; and Watling, Deitz & White, 2001). For example, studies of older
children with ASD have reported that 42-88% of the ASD population have unusual
sensory responses (Baranek, 2002). Tomchek & Dunn (2007) studied the
prevalence and pattern of SPDs in 281 children with ASD compared with 221
typically developing peers. It was found that 83.6% of the ASD population had a
‘definite difference’ on the SSP which indicates that their scores were greater than
two standard deviations away from the mean. By comparison only 3.2% of typically
developing pupils scored with a ‘definite difference’ on the SSP (Tomchek & Dunn,
2007). The research also confirmed a pattern of sensory processing for pupils with
ASD, with significant difficulties noted in inattention / distractibility. The three
sections on the SSP where the greatest percentage of ASD children showed
difficulties were ‘Seeks Sensation’ (86% compared to 6% of typical children);
‘Auditory Filtering’ (78% compared to 3% of typical children); and ‘Tactile Sensitivity’
35

(61% compared to 9% of typical children). This study, which shows very high levels
of SPDs in children with ASD, is in line with other research studies e.g. Crane,
Goddard & Pring (2009); Kern et al. (2006); Kern et al. (2007); and Liss, Saulnier,
Fein & Kinsbourne (2006). In fact some authors (e.g. Kern et al., 2007) have
concluded that SPDs are so closely related to ASD that they ought to be considered
to be part of the disorder.
Rogers et al., (2003) also found high levels of SPDs in ASD children by using the
SSP on four groups of children: ASD (n = 26), Fragile X Syndrome (n = 20), children
with a variety of developmental disabilities (n = 32), and typically developing
children (n = 24). Both the ASD and Fragile X Syndrome groups were found to have
significantly more sensory difficulties than the control groups over all, particularly in
the areas of tactile sensitivity and auditory filtering. It was also found that children
with autism were more abnormal in responses to taste and smell than all other
groups. Similarly Baranek et al. (2002) found that 73% of children (n=15) with full
mutation Fragile X Syndrome were found to have SPDs.
2.4.2 Foetal Alcohol Syndrome Franklin et al. (2008) studied patterns of sensory processing and behaviour in 44
children with a diagnosis of Foetal Alcohol Syndrome, which occurs in
approximately 4% of children born to alcoholic women (Church & Kaltenbach,
1997). Franklin et al. (2008) found that 72.7% of the children had SPDs (as
measured by the SSP). There was a high correlation between children with SPDs
and observed behaviour difficulties with 84% of children being rated as having both
SPDs and behaviour difficulties.
2.4.3 Attention Deficit Hyperactive Disorder (ADHD)
ADHD is a well known and prevalent medical diagnosis of a behavioural condition
(Holowenko, 1999). It is characterised by ‘inattentiveness, an almost reckless
impulsiveness and, in some but not all cases, a knee-jiggling, toe-tapping
hyperactivity’ (Holowenko, 1999, p 14). ADHD is controversial due to the significant
numbers of children with a diagnosis and the common prescription of stimulant
medication to mitigate the behavioural symptoms. Some professionals have
highlighted concerning side effects of stimulant medication. For example, Breggin
36

(2002) stated that stimulant medications ‘can cause many physical problems,
including cardiovascular dysfunction, growth suppression, and tics. They can also
cause many serious psychiatric side effects such as agitation, aggression,
psychosis, mania, depression, and obsessive-compulsive disorder’, (p xv).
In America ADHD is thought to affect 3-6% of school-aged children accounting for
roughly half the paediatric referrals to mental health services (Mangeot et al., 2001).
Children with ADHD often experience significant academic and sensory difficulties
(Schilling et al., 2003). Several studies have also focused on SPDs with pupils who
have an ADHD diagnosis. For example, Mangeot et al. (2001) investigated SMDs in
children with ADHD (n=26) and typically developing children (n=30). SMDs are
apparent when children fluctuate between craving sensations and feeling the need
to avoid them. Sensation avoidance often results in explosive behaviour in school
as the child tries to escape situations that they perceive to be intolerable (Dunn,
1999). Mangeot et al. (2001) measured electrodermal responses when children
completed a Sensory Challenge Protocol, which established their reaction to five
different types of sensation. It was found that children with ADHD demonstrated
significantly greater problems with sensory processing than typically developing
children. It was also found that particular sensory symptoms were good predictors of
challenging behaviour such as aggression (as discussed in section 5.4.1). The
authors noted that there was considerable variability between individual children
with ADHD and it was hypothesised that it may be possible to identify two distinct
groups of children with ADHD: those with sensory difficulties and those without.
Examination of distinct sub groups of children with ADHD was undertaken by
Parush et al. (2007). As mentioned in section 2.2.1, Parush et al. compared
somatosensory function in three groups of boys; those with ADHD and tactile
defensiveness (n=46); boys with ADHD and no tactile defensiveness (n=21); and a
control group of 60 typically developing children. 69% of the ADHD sample was
classed as having tactile defensiveness, based on a parental measure (The Touch
Inventory for Pre-schoolers) and a Sensory Reactivity Score based on the
experimenter’s blind ratings of the children’s behaviour. It was found that both
ADHD groups differed from the typical children on most measures. The authors
conclude that the study provides evidence that tactile defensiveness is a discernible
entity that can be identified by exaggerated somatosensory evoked potential
amplitudes.
37

2.5 Prevalence in the General Population
The vast majority of literature addressing the prevalence of SPDs has focused on
children with particular diagnoses, for example learning disabilities, ASD, ADHD and
Fragile X Syndrome. Although children with these diagnoses often have BESD, a
great many children with BESD have not been diagnosed with any clinical condition.
To date, no study has been undertaken into the occurrence of SPDs in children
identified as having BESD at school. The high rates of incidence found among
samples of children with specific diagnoses suggest that there may be a high
prevalence in children with BESD and that this area was worthy of further
investigation.
Very little research has been conducted on the prevalence of SPDs within the
general population. Several studies have compared incidence or patterns of SPDs
in children with a specific diagnosis and compared this population to typically
developing children for example, Tomchek & Dunn (2007) and Rogers et al. (2003).
However, in these studies the typically developing children were selected from a
larger sample of children based on evidence that their development was normal,
which is different from establishing prevalence within a cross section of society.
Tomchek and Dunn found that for children who were classed as having no
developmental difficulties, only 3.2% (n=221) were found to have a ‘Definite
Difference’ on the SSP. Data for this control group was taken from a national study
of 1,075 children who were not receiving special education services or taking
regular medication.
Only two studies have been found that investigate prevalence within the mainstream
population. The first, conducted by Ahn, Miller, Milberger & McIntosh in 2004, asked
the parents of all incoming kindergarten children from a public school district in
America to complete the SSP. As was noted in section 2.4, the SSP was only
designed as a screening tool and so while the SSP provides an indication of
sensory difficulties it does not provide a diagnosis of sensory processing disorder
when used in isolation as is the case in Ahn et al.’s study.
Ahn et al. (2004) sent the SSP to 1,796 parents for children entering the school year
in 1999-2000. 12% of children were known to some special educational services,
hence it is assumed that a percentage of the pupils surveyed will have had special
38

educational needs. 703 surveys were returned which was a 39% rate of return. The
results showed that 96 children met the screening criteria for SPDs which was
13.7% of the sample. Due to the low response rate the authors calculated an
estimate of prevalence by assuming that all non respondents did not have concerns
about their child’s sensory processing. Hence, with the assumption that all non-
respondents would not have met the criteria for SPDs, a conservative estimate of
5.3% of kindergarten pupils with SPDs was calculated. It is probable that this
estimate under-represents the level of SPDs. It could be argued that children who
experience deprivation, neglect and behaviour problems would probably include
pupils with SPDs, but such families are less likely to respond to questionnaires than
more privileged families. So a prevalence of between 5.3% and 13.7% within
kindergarten pupils has been indicated in this sample. However, these results need
to be replicated to enable general prevalence statistics to be extrapolated with
confidence. Since 2004, this study has been cited in 86 publications and is regularly
quoted as being the only study into the prevalence of SPDs within the general
population (Ben-Sasson et al., 2009).
Since calls have been made for homogeneous populations in SPDs research, there
have been increasing numbers of studies that have focused on children with
particular diagnoses or specific types of SPDs, such as sensory defensiveness and
SMDs.
The second study into prevalence in a non-referred population was published by
Ben-Sasson et al. (2009). These authors investigated the incidence of one sub-
category of SPDs, Sensory Over-responsivity (SOR). It could be argued that this is
a particularly important area to study within education because children who
experience SOR often find it very hard to tolerate busy environments such as the
classroom or playground. Their difficulties relating to SOR may be demonstrated by
poor attention skills, difficulties with learning and disruptive behaviour due to being
unable to cope with high levels of sensory input at school (Dunn, 2006). Ben-
Sasson et al. (2009) state that SOR may be a risk factor for social and emotional
problems. Alternatively children with SOR may also experience social and emotional
problems as a separate difficulty.
Participants for the study were initially randomly selected from birth records in
Conneticut from 1995 - 1997. Children who had issues (such as low birth weight,
premature birth, and birth complications such as hypoxia) were excluded as they
39

were considered to be likely to have developmental delays. A total of 1,329 families
took part in one or two annual surveys in early childhood, where the response rate
was 89%. A follow up school survey was conducted when children were in second
to third grade at school. 17 children were excluded from this later study due to
diagnosis of significant genetic disorders or developmental delays. 1,039 families
responded to this follow up providing a retention rate of 78%. The Sensory Over-
responsivity Survey was added to the school age data and was completed by 925
families (71% of the school aged sample). This inventory includes 76 items, but only
the 41 items relating to auditory and tactile modalities were included in this study as
difficulties in these areas are most often reported. Scores on the Sensory Over-
responsivity Survey were reported to be highly correlated with comparable scores
on the SSP (Dunn, 1999). The Child Behaviour Checklist was also conducted which
measured internalising, externalising and total problem behaviours.
Ben-Sasson et al. (2009) found that 16.5% (n=148) of the sample was found to
have SOR. 76.4% of the SOR group only had elevated tactile scores; 6.8% only had
elevated scores for auditory stimuli and 16.9% had both elevated tactile and
auditory scores. The total number of children identified as having SOR in this study
is higher than those found to have SPDs in Ahn et al.’s study (2004), which is
counterintuitive as SOR is a subcategory of SPDs and so one would be expect to
see lower prevalence of SOR. In addition, in this study SOR was only measured in
the tactile and auditory domain, whereas SPDs includes possible difficulties over 8
domains.
As different assessments were used in these studies it is likely that different cut off
points have contributed to different rates of prevalence being reported. In the Ben-
Sasson et al. study, children were counted as having SOR if they were rated as
being ‘bothered’ by 4 or more sensations. It is not clear whether being ‘bothered’ by
a sensation is serious enough to interfere with a child’s functional ability on a daily
basis. As noted by Miller et al. (2007) a diagnosis of Sensory Processing Disorder
should only be made ‘…if, and only if, the sensory processing difficulties impair daily
routines or roles’ Miller et al. (2007, p 136).
It is noteworthy that such a high rate of SOR was found despite children with birth
difficulties being excluded, as antenatal problems and difficulties during delivery
have been associated with SPDs as discussed above. Children with genetic
syndromes and developmental delay were also excluded before the school aged
40

survey, which again makes the high level of reported SOR surprising as SPDs are
associated with learning disabilities.
Hence, Ahn et al. (2004) and Ben-Sasson et al. found a prevalence of between 5
and16% in their samples of children taken from the general population. Tomchek &
Dunn, 2007 found an even lower incidence of 3.2% in a control group of children
who had been screened to exclude those who were taking regular medication of
receiving special education services.
2.6 Links between SPDs and BESD A number of studies have commented on links between SPDs and behaviour
difficulties. Ben-Sasson et al. (2009) found that children with SOR were four times
as likely to have internalising behaviour scores that were of clinical concern and
three times more likely to have externalising behaviour scores that were worrying.
The authors summarise the relationship between SOR and social-emotional
development as follows:
‘SOR may play a role in the emergence of social-emotional problems by causing an individual to withdraw, and / or avoid negatively perceived sensations and become anxious in anticipation of the stressful sensory experience…Alternatively, social-emotional problems may complicate a child’s ability to cope with over-stimulation, and / or may lead parents to notice a child’s over-response’ (2009, p 713).
Although SOR is only one sub-category of SPDs, it is perhaps particularly relevant
to education and children who have been identified as having behavioural problems
in school. This is because children who are overwhelmed with sensory overload
may respond with defiance, withdrawal or attempt to be controlling in order to
manage their sensory overload (Dunn, 1999), all of which are noticeable and
problematic behaviours in a school setting.
In a study of sensory defensiveness and twins, Goldsmith et al. (2006) found that
anxiety and fearful temperament were moderately associated (p =.01) with tactile
and auditory defensiveness. Goldsmith et al. noted that ‘anxiety appears to be a
core feature of the disorders that co-occur with sensory defensiveness’ (p 394).
Similarly Rogers et al. (2003) found a significant relationship between abnormal
sensory reactivity and overall difficulties in adaptive behaviour when studying
toddlers with ASD. Likewise, Hilton, Graver & LaVesser (2007) found significant
41

associations between difficulties in social responsiveness and SPDs for 36 children
with high functioning autism.
As has already been noted in section 2.4.2, Franklin et al. (2008) found a correlation
between children with SPDs and observed behaviour difficulties (p < .05), with 84%
of children being rated as having both SPDs and behaviour difficulties. They stated
‘These findings suggest that deficits in sensory modulation and auditory processing
may result in an increased prevalence of behavioural impairments because of poor
adaptive behavioural responses’ (2008, p 271).
Some research has been undertaken into adult responses. For example, Kinnealey
& Fuiek (2006) found significant differences for anxiety and depression in sensory
defensive adults compared to typical adults (n=32). In addition, adolescents with
Developmental Co-ordination Disorder have been found to have lower self esteem
and more anxiety than peers (Barnhart, Davenport, Epps & Nordquist, 2003).
Developmental Co-ordination Disorder is thought to be closely linked to sensory
based motor disorders (Miller et al., 2007). The study examined 55 individuals;
those with Developmental Co-ordination Disorder and both Developmental Co-
ordination Disorder and ADHD were found to have more ‘criminal offenses, more
incidences of substance abuse and other psychiatric disorders, and lower levels of
schooling’ (Barnhart et al. 2003, p 725) compared to typical participants.
A number of studies discussed above have investigated SPDs in groups of children
with other diagnoses (e.g. ASD or ADHD) who commonly experience behaviour
difficulties at school. The evidence indicates that while a high percentage of pupils
with SPDs are observed to have behavioural, emotional and social difficulties (Ben-
Sasson et al., 2009; Goldsmith et al., 2006; Hilton et al., 2007; and Franklin et al.,
2008), not all children with diagnoses associated with BESD have SPDs. As
discussed in section 2.4.3, Parush et al. (2007) and Mangeot et al. (2001) identified
two distinct groups when investigating children with an ADHD diagnosis; those with
SPDs and those without. Both Parush et al. (2007) and Mangeot et al. (2001) found
considerable variability in the sensory processing of children with ADHD, leading
them to hypothesise that within the ADHD population two distinct subgroups exist,
those with SMD and those without ‘This suggests that a group of children with
ADHD may have normal physiological reactions and behavioural responses to
sensory stimuli, whereas another group may be hyperreactive and overresponsive’
(Mangeot et al., 2001, p 404).
42

Hence, while it is suggested that children with SPDs are often also observed to
have BESDs, it does not follow that all children with BESD have SPDs. This
demonstrates that although some of the behaviours observed in children with SPDs
are also common in BESD children, SPDs are a distinct entity which can be
distinguished from general behaviour difficulties (Parush et al., 2007). No research
has been found that examines the prevalence of SPDs among children who have
been identified by teachers as having difficulties in school. Hence, there is currently
no evidence to show the prevalence of SPDs among pupils struggling with BESD at
school.
2.7 Environmental Issues that may Relate to SPDs and BESD
There is a very wide range of possible environmental influences that may affect
children’s behaviour and sensory responses. Some issues associated with current
lifestyles are considered below.
2.7.1 Influence of Electronic Pastimes
It is common for the British press to comment that influences such as computer
games and television are detrimental to children’s development. However, the
research evidence is more complex than the press often implies. For example,
research conducted by Pagani, Fitzpatrick, Barnett & Dunbow (2010) in Canada,
found that pre-school children who watched high levels of television showed poorer
attention, academic achievement, took less exercise and ate more snacks than
other children. Pagani et al. (2010) argue that television watching displaced other
play-based activities and hence reduced children’s opportunities to learn through
play. Similar results were found by Christakis, Zimmerman, DiGiuseppe & McCarty
(2004) who found a decrease in attention spans at seven years old for children who
had been exposed to high levels of television at preschool. However, Wright et al.
(2001) point out that the impact of television on children depends on more than just
the total numbers of hours watched. In fact, the content of the programmes is
critical. Some programmes designed for young children were found to be beneficial,
whereas it is proposed that exposure to adult programmes is detrimental because
the content provides little engagement for the child but takes the adult’s attention
away from interacting with the child.
43

Research into children’s use of computer games also presents a complex picture.
Considerable research has focused on the effects of violent video games on
children and adolescents. Some authors such as Swing & Anderson (2007) have
concluded through meta-analysis that use of violent video games leads to increased
aggression even after a short exposure to the games. However, Ferguson (2007)
argues that there is a publication bias towards publishing research that suggests
links between violent computer games and aggressive behaviour. When the
publication bias is corrected he states that there is no evidence to support the
hypothesis that violent computer games cause increased aggression. However, he
did find evidence for positive effects on children’s visuo-spatial skills. Likewise
Griffiths suggests that online gaming can have a number of positive effects in that
the activity raises self-esteem, makes people feel psychologically better and allows
young people to experiment with risk in imaginary scenarios without the dangers of
other potentially addictive pastimes such as alcohol and drugs (2010). However,
Griffiths acknowledges that excessive gaming displaces other play activities and he
advises ‘Parents to set time limits on their children’s playing time’ (p38). Therefore,
while there is some evidence that excessive television watching or gaming may
negatively impact on children’s development, it is perhaps the impact on the quality
of interactions between adults and the child and the reduction of other play and
learning opportunities that may be detrimental rather than the viewing itself. It could
be argued that excessive exposure to television may impact on a child’s sensory
opportunities because it is a sedentary activity and television may be very
distracting if it is a regular background noise, as discussed below.
2.7.2 Levels of Physical Activity Among Children
McLaren, Edwards, Ruddick, Zabjek & McKever (2011) highlight the importance of
movement and gesture for optimal cognitive and communicative development.
McLaren et al. state that research suggests,
‘that there is a synergy between cognitive knowledge and bodily knowledge
and that children learn through movement rather than by relying solely on
their verbalisation or recollection skills’ (2011, p100-1).
Similar conclusions have been drawn by Raine, Reynolds, Venables & Mednick
(2002), who found in a longitudinal study that active children who sought out a high
level of stimulation at 3 years old showed increased academic, cognitive and
neuropsychological test performance at age 11. Hence these studies, which
44

suggest the benefits of movement on children’s development, highlight the
importance of movement activities in the classroom and indicate that excessive
sedentary activities, whether it be watching television or during long periods sitting
still in class, may be detrimental due to restricting movement opportunities.
There is evidence to show that school children are not physically active enough. For
example Cardon & De Bourdeaudhuij (2008) investigated the physical activity of 4-5
year olds (n=76) on both school days and at the weekend. It was found that the
children were on average sedentary for 9.6 hours (or 85%) of the day and that the
mean amount of moderate to vigorous physical activity was 34 minutes (5% of the
day). Only 7% of the sample engaged in the recommended level of moderate to
vigorous physical activity which is 60 minutes per day in the UK and USA (Cardon &
De Bourdeaudhuij, 2008). No significant difference was found between activity
levels on school days and at the weekend. This indicates that the children in this
sample spent on average 85% of their time engaging in sedentary activities, which
may be limiting their breadth of sensory experiences and their opportunities to learn
through movement. Tucker (2008) conducted an overview of 39 studies
(representing a total of 10,316 children) that examined the activity levels of 3-6 year
old children. She found that only 54% of the participants took the recommended
guideline of 60 minutes of physical activity per day. Tucker also reported that boys
engaged in more physical activity than girls.
Metcalf, Voss, Hosking, Jeffery & Wilkin (2008) also investigate activity levels for
boys compared with girls. They measured physical activity in 113 boys and 99 girls
in the UK and found that only 42% of the boys and 11% of the girls were taking the
recommended amounts of physical activity. Metcalf et al. noted that girls are
habitually less active than boys and suggested that either there needs to be a
concerted effort to increase girls’ levels of activity or perhaps there should be
different guidelines for boys and girls to reflect the fact that boys are generally more
active. Similar conclusions were drawn by Nettlefold, McKay, Warburton, McGuire,
Bredin & Naylor (2011) in a Canadian study, where girls were found to take less
moderate to vigorous physical activity than boys throughout the school day. For
example during recess only 15.7% of girls and 34.1% of boys achieved
recommended amounts of physical activity. Worryingly, during PE lessons only
1.8% or girls and 2.9% of boys were found to achieve recommended levels of
physical activity. Nettlefold et al. (2011) concluded that schools should compliment
PE with other opportunities for physical activity during the school day. The fact that
45

boys have been found to be more active than girls is relevant to gender issues
raised in the discussion section of this paper.
Rothon, Edwards, Kamaldeep, Viner, Taylor & Stansfeld (2010) highlight the
association between exercise and depressive symptoms in a longitudinal study of
2,093 school children in East London. It was found that most pupils took between
0.5 – 2-3 hours of physical activity a week, which is well below the UK guidelines of
1 hour of physical activity a day. There was a strong association between physical
activity and depressive symptoms (p= 0.003). The likelihood of depressive
symptoms decreased by 11% for every additional hour of physical activity
undertaken each week. Nearly a quarter of the sample was rated as being
depressed and girls were nearly twice as likely to show depressive symptoms
compared with boys. Similar links between physical activity, academic success and
mental health were found by Kantomma, Tammelin, Demakakos, Ebeling & Taanila
(2009). Trudeau & Shepherd (2008) conducted a review of research into physical
activity, academic performance and behaviour in schools. They concluded that
increased levels of physical activity were positively associated with academic
outcomes and improved classroom behaviour.
Reduced levels of physical activity among school children may be in part due to
young people’s interest in sedentary activities such as electronic entertainment.
However many other factors are also likely to be involved. For example, Fuemmeler,
Anderson, & Mâsse (2011) found links between parental and child activity levels
showing the influence of adult behaviour on children’s exercise habits. Like Metcalf
et al. (2008), Lopes, Rodrigues, Maia & Malina (2011) found in a longitudinal study
that boys engage in higher levels of physical activity than girls. In addition Lopes et
al. found that motor coordination was a predictor of activity levels and children with
good motor coordination took more exercise. For children with low or average
motor-coordination their levels of physical activity was found to decline as the
children matured from 6 – 10 years old. These findings are relevant to the theory of
sensory processing, which suggests that children learn to integrate their senses
through a wide range of sensory experiences (Dunn, 1999). Unfortunately Lopes et
al.’s findings suggest that children with motor coordination difficulties may reduce
their sensory opportunities by engaging in less physical activity than their peers.
46

2.7.3 Family Influences
Meltzer, Gatward, Goodman & Ford (2000) provide a wealth of information about
factors that influence the incidence of mental health issues in children in their survey
of 10.438 families in the UK. Meltzer et al. (2000) found that the incidence of mental
disorders was greater among children who lived: in single parent (16%) compared
with two parent families (8%); in reconstituted families (15%) rather than those with
no step-children (9%); in families with five or more children (18%) compared with
two-children (8%); if the interviewed parent had no educational qualifications (15%)
compared with a degree level or equivalent qualification (6%); in families with
neither parent working (20%) compared with both parents at work (8%); in low
income families (16%) compared with families with weekly incomes of £500 or more
(6%); whose parents are social sector tenants (17%) compared with owner
occupiers (6%). This clearly indicates that the incidence of mental difficulties such a
conduct disorders, hyperactivity, anxiety and depression is affected by a range of
environmental issues in the child’s life. It is possible that the way in which children
process sensory information may also be affected by these factors, but to date no
surveys of this magnitude have investigated sensory issues.
2.7.4 School Environment
Another factor that may be affecting children’s levels of physical activities is the risk
adverse culture which is currently prevalent in the UK as noted by Bundy, Luckett,
Tranter, Naughton, Wyver, Ragen & Spies (2009). Bundy et al. proposed that
teachers have become risk adverse in a culture of health and safety regulations and
litigation. So, as a result children’s playgrounds lack challenging opportunities.
Bundy et al. found that children’s activity levels increased when items such as tyres
and large boxes were made available in the playground. Although teachers
perceived that the risk of injury had increased (despite no injuries occurring) during
the 11 week study, they also rated that the children had become more creative,
social and resilient.
Jull (2008) comments that ‘school environments can indeed incite disruptive
behaviour as a function of a mismatch in student needs and educational provision’
(p 15). Jull lists a number of environmental factors that may impact on children’s
behaviour such as inappropriate academic requirements, autocratic or permissive
teaching style and over-stimulation or under-stimulation. The impact of
environmental factors on children’s academic success is also raised by LaRocque
47

(2008) who concludes that ‘learning environments strongly influence student
outcomes and play an important role in improving the effectiveness of learning’
(p301). Likewise Rush & Harrison (2008) state,
‘The classroom environment can make an enormous difference with regard
to the academic and personal outcomes of adolescents, particularly those
with ADHD… the most important determinants of adolescent mood and
behaviour seem to be environmental and contextual factors’ (p 208).
This highlights the way in which a child’s behaviour (and this may include sensory
behaviour) is the product of the interaction between the child and his/her
environment and hence supports the shift in thinking among educational
professionals away from a ‘within child’ view of BESD (Jones, 2003).
2.7.5 Noise Levels
Flagg-Williams, Rubin & Aquino-Russell (2011) discuss classroom soundscape,
another environmental consideration which affects children at school. Flagg-
Williams et al. state,
‘In order to be successful learners, students need to focus on important
sounds, such as speech, whilst not attending to background noise. The
classroom soundscape affects the effort students must use in order to
receive and understand all of the audible messages that are relevant to their
learning (p89).
Flagg-Williams et al. state that typical classrooms in the UK do not meet
recommended guidelines for levels of reverberation and background noise, meaning
that children have to apply considerable effort to accurately hear verbal messages
which leaves less mental capacity for processing the meaning of the information.
Flagg-Williams et al. (2011) suggest that children are particularly vulnerable to
comprehension difficulties in noisy environments compared with adults, due to their
immature language systems being less able to ‘fill in the gaps’. They go on to state
that children with deficits in learning, attention, speech language or auditory
processing are likely to find learning in noisy environments particularly challenging.
These comments about the implications of background noise may suggest some
links to research relating to excessive exposure to television (for example Wright et
48

al., 2001) and to observations relating to concerns about some children having
difficulties with auditory processing (e.g. Dunn, 2006; Heller, 2003). Flagg-Williams
et al. (2011) comment that noise involving spoken language tends to be the most
distracting, which suggests that children who routinely have to attend against the
noise of a television, radio or perhaps chatter in class may find it difficult to attend to
learning tasks. Gathercole & Alloway (2009) also comment that background verbal
noise is particularly disruptive to working memory skills. Flagg-Williams et al.,
suggest that children who are regularly exposed to noisy environments may develop
auditory issues as they loose the habit of listening.
2.8 An Overview of Behavioural Emotional and Social Difficulties in the UK
In order to be included in this study all participants had to be identified as having
behavioural, emotional or social difficulties on a teacher rating questionnaire.
Therefore it is important to provide an overview of the issues currently surrounding
BESD in schools, so that environmental factors can be considered alongside SPDs
during the discussion of the results. The term behavioural, emotional and social
difficulties covers a very wide range of potential issues and behaviours and an equal
variety of possible causes for the difficulties. It is common for adults to complain
about youth behaviour and there is currently widespread concern about poor
behaviour standards in schools (Steer, 2009). In a survey of 10,438 families,
Meltzer, Gatward, Goodman & Ford (2000) provide an indication of the prevalence
of mental disorders among children in the UK. Meltzer et al. found that 10% of
children had a mental disorder; 5% were found to have a significant conduct
disorder; 4% were assessed as having emotional disorders and only 1% of the
sample was rated as being hyperactive. Meltzer et al. (2000) also found gender
differences for mental health difficulties. For example girls were found to have a
slightly higher incidence of emotional difficulties compared with boys (4.5%
compared with 4.1%) whereas the incidence of conduct disorders (7.4% compared
with 3.2%) and hyperkinetic disorders (2.5% compared with 0.4%) was higher for
boys.
There is some evidence that behavioural and emotional difficulties are on the
increase. Green, McGinnity, Meltzer, Ford & Goodman (2005) report that the
percentage of 15/16 year olds found to experience emotional and behavioural
49

problems has shown a steady increase from 1974 to 1999 and then remained at a
high level. For example, over 20% of girls were rated as having emotional difficulties
in 1999 compared to 12.5% in 1974. In addition Beaman, Wheldall & Kemp (2007)
in a review of 14 studies into troublesome classroom behaviour concluded
‘Prevalence rates for disruptive behaviour may vary, but what is apparent from the research presented in this review is more evidence of a rising percentage of behavioural difficulties in classrooms as students move from the early years to adolescence. This suggests a pattern of increasing disruption as students move into the secondary school system’ p 51.
However more recently, Sir Alan Steer in his report ‘Learning Behaviour: Lessons
Learned. A review of behaviour standards and practices in our schools,’ (2009),
states that poor behaviour in school is at the lowest level ever recorded. Ofsted
reported that only 1% of primary and 2% of secondary schools were found to have
inadequate behaviour on inspection in 2008 (Steer, 2009).
This finding was supported by a large scale observational study of primary
classrooms involving observations in 141 UK primary classrooms conducted by
Apter, Arnold & Swinson (2010). They concluded that ‘Students in UK Primary
classrooms were observed to be more ‘on task’ and thus, in popular parlance,
‘better behaved’ than they have been previously during the last 20 years, and
probably longer’ (p 170). The study recorded that children were on task 85% of the
time. Apter et al. (2010) state that surveys have shown a steady trend towards
higher rates of ‘on task’ behaviour since Wheldall & Merrett’s data from 1987 where
69.7% of children were found to be ‘on task’ (1988).
As stated by Steer (2009), current evidence shows that the behaviour of most
children in school is generally good. Steer refers to two surveys conducted in 2008,
(by the National Union of Teachers and the National Association of
Schoolmasters/Union of Women Teachers). The results of both surveys suggest
that teachers believe that the severity of the behaviour of a minority of pupils is
increasing (Steer, 2009). However, Steer’s report concludes that the most common
troublesome behaviours were low level disruptions such as talking out of turn. Steer
goes on to note that there is a gap between the widespread perception of poor
behaviour within UK schools and survey results that indicate that school behaviour
is currently good. He suggests that this may be due to overly negative press
coverage of young people and schools (Steer, 2009).
50

So, despite some evidence of an increase in mental disorders among children
(Green et al., 2005) there is little evidence to support the common perception that
behaviour in schools has significantly deteriorated in recent years (Steer 2009).
Studies have shown that teachers perceive frequent disruptions as being the most
troublesome in class, even if the behaviour is relatively trivial (Beaman et al., 2007).
Research conducted by Wheldall & Merrett in the UK (1988) found that teachers
perceived ‘talking out of turn’ and ‘hindering other children’ as the most frequent and
troublesome behaviours in primary schools. Similar research conducted by
McDonald & Wilks 1994, (cited in Little, 2005, p 370) in Australia, found that being
‘easily distracted’ and ‘not listening to directions’ were two of the behaviour
problems most reported by teachers. Ho & Leung (2002) found similar results: the
top three troublesome behaviours (out of 15 behaviour categories) were rated as
‘talking out of turn’, ‘non-attentiveness’ and ‘forgetfulness’. Beaman et al. (2007)
conducted a review of recent research into teachers’ perceptions of troublesome
behaviour. Several of the studies reviewed took place in Australia with others in the
USA, Greece, Hong Kong, Jordan and Malta. The review supported the findings
listed above. Although cultural differences must be acknowledged, Beaman et al.’s
review indicates that Wheldall and Merrett’s (1988) research findings in the UK have
been supported by a number of other international studies.
Several studies have reported that teachers feel they spend too much time dealing
with classroom behaviour issues (e.g. Wheldall & Merrett, 1988) which would
indicate that strategies to reduce low level classroom disruptions would be valuable.
As stated by Little (2005):
‘Given that teachers perceive that they are spending too much time on issues of order and control, and that these behaviours are minor in nature, it is clear that interventions that deal specifically with these behaviours are needed’ (p 370).
A teacher’s perception that a child has BESD may lead to negative outcomes for the
child. As noted by Kokkinos, Panayiotou & Davazoglou (2004) ‘…undesirable pupil
behaviours are more likely to evoke unfavourable impressions of the pupil, and yield
negative attitudes on the teachers’ part’ (p 110). Negative teacher attitudes may
have a significant impact on learning because, as noted by Willingham (2009), one
of the key factors which enable children to learn is a good emotional bond between
the teacher and the pupil. Evidence indicates that when teachers display positive
51

emotional support, pupils report that their behaviour improves: ‘…as teachers’
display of emotional support toward students increased, students reported that they
engaged in less off-task behaviour and less teacher-directed antagonistic
behaviour.’ (Geving, 2008, p 627). Hence, it can be seen that low level disruptive
behaviours remain a concern to teachers. Behaviours may include non-
attentiveness, easily distracted, not listening to direction etc. all of which are
behaviours that may be commonly seen in children with sensory difficulties.
BESD may take many forms, from low level disruptive behaviour such as talking out
of turn, to infrequent but serious incidents such as verbal abuse within the
classroom. Little (2005) found that verbal abuse was rated by teachers as
accounting for 10% of the most disruptive behaviour in secondary classes. Whereas
only 2% of teachers rated ‘Aggression’ as being the most troublesome classroom
behaviour (Little 2005) which supports the evidence that externalising behaviours
such as aggression are infrequent (Kokkinos et al., 2004; Beaman et al., 2007). The
causes of such a range of behaviours are numerous. Some children may display
BESD due to academic failures at school. Willingham (2009) proposes that humans
are naturally curious and like to learn, but that thinking is effortful and requires
concentration. Pleasure in learning is derived when moderately challenging
problems are successfully solved. So it is unsurprising that pupils who repeatedly
experience task failure soon become unmotivated and hence disruptive
(Willingham, 2009).
The importance of effective strategies to manage pupil misbehaviour is highlighted
by research into the causes of teacher stress which is reported to be prevalent
(Geving, 2007). Pupil misbehaviour has been repeatedly identified as a cause for
teacher stress with ‘student apathy’ or ‘lack of effort’ being strongly associated with
teacher stress. It could be argued that teachers experiencing high levels of stress
will be less tolerant of disruptive classroom behaviour and less able to think of
creative ways in which to support pupils with inattentive behaviour in class. Less
experienced teachers appear to be more susceptible to stress caused by poor pupil
behaviour (Kokkinos et al., 2004) which highlights the need for behaviour
management techniques and underlying causes of poor pupil behaviour to be
emphasised on teacher training courses.
Some professionals have highlighted the importance of social competence when
considering children’s challenging behaviour in school. For example, in a study of
52

teachers’ perceptions of emotional & behavioural difficulties Poulou (2005)
concludes that teachers observed that children who are socially competent are
‘less engaged in problem behaviour, are better at making friends, have more
effective ways of dealing with authority, and are more able in conflict
resolution and at problem solving than their more disruptive peers.’ p49
Likewise Hartnell (2010) stresses the importance of social skills in preventing
permanent exclusions, as it was found that one of the factors that reduced
permanent exclusion was the offer a flexible and differentiated curriculum with an
emphasis on personal and social development.
The recent shift to include children with a diverse range of special educational
needs in mainstream schools has created additional challenges for teachers. It is
now expected that children with a range of physical, cognitive, sensory and
behavioural needs will be managed within mainstream classrooms. In order for this
to be successful, teachers are required to provide highly differentiated work to suit
children with a wide range of abilities (Beaman et al., 2007). Additional equipment
and support staff may also be present within classrooms and need to be effectively
managed. Although the policy of inclusion is laudable, it is suggested that an
unintended outcome has been an increase in distractions and challenges within
mainstream classrooms (Beaman et al, 2007). This may impact on teacher stress
levels and on the number of children in mainstream classrooms who have some
level of behaviour, emotional or social difficulty. As stated by Beaman et al. (2007):
‘…the inclusion of students with disabilities within regular classrooms requires teachers to have high-level classroom management skills, as well as the necessary skills to program effectively for all students in the class. Teachers engaged in such a complex instructional mission need highly effective behaviour management techniques in order to meet with needs of all the students in their classrooms’ (p 45).
2.8.1 BESD and Links to Low Socioeconomic Status
Washbrook & Waldfogel (2011) reported on data collected for the Millennium Cohort
Study, a nationally representative UK sample of around 15,000 children who were
aged five in 2006. The data showed that children from the families with the lowest
incomes were on average 14 months behind their more affluent peers on a measure
53

of vocabulary and also had significantly more behavioural difficulties at the age of 5
years old. While genetic causes for this difference have to be considered, the report
concludes that environmental factors have huge impact on children’s social and
emotional development:
‘Aspects of children’s environment such as their exposure to learning opportunities, parents’ approach to parenting and mothers’ psychosocial and physical well-being all have a strong influence on the cognitive and socio-emotional development of children. Where parents are squeezed for resources of both time and money there is a risk that the resulting stress translates into less conscientious or sensitive parenting’ (Washbrook & Waldfogel, 2011, p 15).
Such research supports evidence that environmental factors may have a significant
impact on the BESD that teachers observe in schools. Links between low
socioeconomic status and mental health disorders in children were also found by
Meltzer et al. (2000) as discussed in section 2.7.3.
In 2007 the UNICEF report ‘Child poverty in perspective: An overview of child well-
being in rich countries’ presented sobering results showing that on six measures of
child wellbeing the UK scored in the bottom third of 21 countries for five out of the
six measures. In fact the UK scored below all other countries for ‘Family and Peer
Relations’, ‘Behaviour and Risks’ and ‘Subjective Wellbeing’ (UNICEF, 2007).
Layard and Dunn (2009) speculate that these poor outcomes for children in the UK
have a risen due to factors such as excessive individualisation, family breakdown,
greater income inequality and relative poverty.
Griggs & Walker (2008) comment on the links between child poverty and BESD, in a
review of evidence of the impact of child poverty in industrial countries. They state:
‘An association between childhood poverty and behavioural outcomes is evident from an early age. Those growing up in low-income households have a greater likelihood of parent reported behaviour problems than their more affluent counterparts. They are also more likely to be excluded from school. Later outcomes include risk-taking behaviour, aggression, involvement in crime, poor health-related behaviours and suicide’ (p 5).
Griggs & Walker (2008) also found links between child poverty and social and
emotional development. They explain that it has been found that low-income
families have fewer opportunities to develop relationships due to a lack of
54

accessible and safe places to meet. In addition lack of finances is often a limiting
factor on socialising. This conclusion is supported by Goodman & Gregg (2010)
who reviewed data from four large scale longitudinal studies. They concluded that
evidence clearly showed that children from poorer backgrounds achieved lower
educational attainments. In addition ‘children from poor families typically display
many more behavioural problems, at all ages, than children from better-off
backgrounds’ (Goodman & Gregg, 2010, p 51).
Similar results have been found in other industrialised countries. Ross & Roberts
(1999) examined parental ratings for a number of factors compared to the family
income in Canada. It was found that where the family income was less than $20,000
children were rated as having higher rates of difficulties compared to wealthier
peers in many different areas including the following: indirect aggression; emotional
difficulties; hyperactivity and inattention; delinquent behaviour; delayed vocabulary;
and they were more likely to not be in training education or employment as a
teenager.
Pickett and Wilkinson (2007) found similar results in an international cross sectional
study of child wellbeing. It was found that child wellbeing was significantly worse in
countries with a high level of relative child poverty. So, although a country as a
whole might be wealthy, there were high rates of concern about child wellbeing for
countries with a high level of wealth inequality. Although these data do not
specifically comment on BESD in schools it does clearly show links between relative
poverty and poor outcomes for children.
Low socioeconomic status is also associated with higher levels of abuse (Cawson,
Walton, Brooker & Kelly, 2000). The NSPCC conducted a survey of 2,869 young
people. Cawson et al. report that 6% of the sample experienced serious lack of
care, 7% were seriously abused through parental violence and 6% rated themselves
as having been seriously sexually abused (2000). These data indicate that many
schools are likely to contain children who have experienced some level of abuse.
Such trauma may cause some children to display BESD. Dyregrov (2004) states
that the effects of trauma and loss may persist for months or even years after a
tragic event, by which time school staff may expect children to have come to terms
with the tragedy. Or course, in many cases of abuse, school staff may be
completely unaware of the difficulties that the child has experienced.
55

It is suggested that environmental factors such as socioeconomic status and
childhood trauma greatly affect child development and may impact on how the child
processes sensory information as well as on his/her behavioural, emotional and
social development (Ben-Sasson et al., 2009). Therefore, it is important to consider
the environmental issues in children’s lives when trying to support their needs.
2.9 Conclusions drawn from the Literature Review
The review of literature surrounding sensory processing difficulties indicates that
there is continued debate about the use of the term sensory processing disorder as
an independent diagnosis and the resolution of this issue is beyond the scope of
this study. However, there is evidence that indicates that certain children experience
difficulties with sensory processing compared with typical children (Parush et al.,
2007; McIntosh et al., 1999; Davies & Gavin, 2007; Tomchek & Dunn, 2007;
Baranek, 2002; Ermer & Dunn, 1998; Dawson & Watling, 2000; Watling, Deitz &
White, 2001; Franklin et al., 2008; Mangeot et al. 2001; Rogers et al., 2003; Ahn et
al., 2004; and Ben-Sasson et al., 2009)
A number of studies have found links between SPDs and behavioural difficulties
(Ben-Sasson et al., 2009; Roger et al., 2003; and Franklin et al., 2008). However,
no study to date has attempted to establish the prevalence of SPDs in a sample of
children identified by teachers as having BESD, which is the main purpose of this
research. The majority of studies into the prevalence of SPDs have used the SSP
as their sole measure of sensory processing for example: Mangeot et al. (2001);
Baranek et al. (2002); Baranek (2002); Rogers et al. (2003); Tomcheck & Dunn
(2007); Franklin et al. (2008); and Gavin et al. (2011). Using the SSP alone provides
no data about children’s sensory behaviour in school or about whether individual
children are observed to have sensory difficulties both at home and school. Hence,
it was ascertained that there is a need to investigate comparisons between parental
and teacher ratings of children’s sensory behaviour. Collecting sensory data from
two sources could also result in a more robust measure of SPDs.
The literature review has revealed that SPDs are associated with a number of other
factors such as difficulties at birth (May-Benson et al., 2009), attachment difficulties
(Naber et al., 2008), ASD (Tomchek & Dunn, 2007) and ADHD (Mangeot et al.,
56

2001). Many of these factors are also associated with BESD. Hence, it was decided
to investigate whether the same associations were evident in this study.
No attempt is made in this study to formally diagnose sensory processing disorder,
due to the issues that surround the use of the term as a discrete diagnosis and the
specialist training, time and expertise that would be required to make a formal
diagnosis of such a disorder. Also the term sensory processing disorder carries an
implication of a within child deficit, whereas the literature review has highlighted a
number of environmental factors that may influence sensory processing. Hence, two
screening questionnaires are used to provide an indication of whether children had
difficulties with the way in which they process sensory information compared with
typical children. The limitations presented by the use of screening questionnaires to
identify sensory difficulties are discussed in section 3.1.3.c and 5.10.3.
The research summarised in the Steer Report (2009) indicates that the overall level
of BESD may be at an all time low. However, surveys indicate that teachers still
have concerns about the behaviour, emotional and social difficulties of a number of
children in their schools (Steer, 2009) and there is some evidence of a rising
percentage of BESD as children progress towards secondary school (Beaman et
al., 2007) . Understanding the sensory needs of these children may help to alter
adults’ perceptions of challenging individuals and enhance the methods used by
teachers and psychologists to support children with BESD. No prior research has
indicated the level of teachers’ understanding of SPDs. Therefore, it may be
beneficial to collect data to show the current level of understanding about SPDs in a
sample of British primary schools.
The review of the literature surrounding SPDs has lead to the conclusion that the
following research questions are likely to illuminate the nature and prevalence of
SPDs and the relationship between SPDs and BESD.
Question 1: What is the prevalence of sensory processing difficulties (SPDs) in
children who have been identified as having behavioural, emotional
or social difficulties (BESD) at school?
Question 2: Is there an association between the sensory scores provided by
parents and those provided by teachers?
57

Question 3: Do the data collected in this research indicate an association
between SPDs and other factors? For example:
• attachment difficulties / anxiety;
• premature delivery / birth trauma;
• learning difficulties / other conditions that affect development.
Question 4: What is the current level of knowledge of Special Needs Co-
ordinators (SENCos) about SPDs in schools?
58

Chapter 3
Research Design & Methodology
The main aim of this research is to provide an indication of the prevalence of
SPDs for children who are identified as having behavioural, emotional or social
difficulties (BESD) at school. Hence, it was necessary for schools to identify children
who had BESD and then for a measure of sensory processing to be collected for
each child. A major criticism of previous research into SPDs has been the very
small number of participants in many studies. In order to avoid this pitfall, a
methodology had to be chosen that would provide data on at least 100 participants
and yet remain within the financial and time limitations of the study. The use of
questionnaires was decided to be the most cost effective and time efficient method
for acquiring BESD and sensory data on a large number of children. Research
Questions 1, 2 and 3 all refer to the main study (Study A) which involved collecting
sensory data for pupils with BESD. Research Question 4 is answered through a
separate line of investigation (Study B) and required a brief questionnaire to be sent
to all SENCos across one local authority in the UK. A timetable of the research is
included at the end of this chapter.
It was decided that the measures described in Table 1 below would be used.
Copies of the Short Sensory Profile and Sensory Profile School Companion are
available from Pearson Assessments because it has not been possible for them to
be reproduced due to copyright. Copies of the other measures used are provided in
Appendix 1.
59

Table 1:
Measures Used in the study
Questionnaire completed by:
Questionnaire Used & Number of Questions
How the measure contributes to answering the research questions.
Study A
Parent Parental
Background 11
Allows investigation of the association
between sensory difficulties and other
background factors (Q3).
Parent Short Sensory
Profile (SSP) 38
Provides a parental measure of the
child’s sensory processing difficulties
(Q 1, 2 & 3).
Teacher Teacher
Background 10
Allows investigation of the association
between sensory difficulties and other
background factors (Q3).
Teacher
Strengths and
Difficulties
Questionnaire
(SDQ)
25
Provides a measure of the child’s BESD.
Children must have difficulties in at least
1 of the 5 Sections on the SDQ to be
included in the study.
Teacher
Sensory Profile
School
Companion (SC)
62
Provides a teacher measure of the child’s
sensory processing difficulties (Q 1, 2 &
3).
Study B
SENCos Questionnaire
for SENCos 9
Provides information about the current
level of knowledge that SENCos have
about SPDs (Q4).
A number of previous studies have only used the SSP as the measure of SPDs
(e.g. Ahn et al., 2004; Baranek, 2002; Baranek et al., 2002; Franklin et al., 2008;
Gavin et al. 2011; Mangeot et al. 2001; Rogers et al. 2003; and Tomchek & Dunn,
2007). In this study, sensory processing data were collected from both parents and
teachers. This is for two reasons. Firstly, it meant that more detailed sensory data
could be collected because in addition to the 38-question Short Sensory Profile
completed by parents, teachers also answered 62 questions on the child’s sensory
processing at school. Secondly, collection of sensory data from both parents and
teachers enables investigation into whether children are reported to have the same
sensory difficulties both at home and at school (Research Question 2). If SPDs are
60

observed for a child in both settings it provides more robust evidence of the child’s
sensory needs than a brief parental report does in isolation. Where reports of a
child’s sensory behaviours differ between home and school, questions need to be
asked about whether parents’ and teachers’ constructions of sensory behaviours
differ, or perhaps whether the Sensory Profile Questionnaires provide an effective
measurement of SPDs.
3.1 Measures Used for Study A
3.1.1 Background Information Sheets
Parental and Teacher Background Information Sheets were designed (see
Appendices 1a & 1b). The data provided on the background information sheets
enabled the links between SPDs and other factors to be examined (Research
Question 3). For example, whether the child has other diagnoses, was born
prematurely or has academic difficulties at school. Questions were chosen for
inclusion on the Background Information Sheets due to the results of previous
research suggesting links between SPDs and particular factors. The intention was
to investigate whether the link was also evident in this research sample. For
example, research has provided evidence of associations between SPDs and
Autistic Spectrum Disorders (e.g. Tomchek & Dunn, 2007 and Ermer & Dunn 1998)
and between SPDs and complications during the baby’s delivery (May-Benson et
al., 2009) etc. Justification for why each question has been included is provided on
the reverse side of the Background Information Sheets so that participants were
clear about why the information was needed.
The Background Information Sheets were piloted with five parents of school-aged
children and five primary school teachers. No issues were raised during the pilot so
no alterations were made.
3.1.2 The Strengths and Difficulties Questionnaire (SDQ)
A measure of each child’s BESD was sought from the school to ensure that only
children with BESD were included in the study. The Strengths and Difficulties
Questionnaire (SDQ) was chosen for this purpose. Any children who were rated as
not having BESD were excluded from the study.
61

The SDQ is a brief behavioural screening questionnaire for 4-16 year olds. In 1999
the SDQ was used in a large national survey of child and adolescent mental health
carried out by The Office for National Statistics and funded by the Department of
Health. This representative British sample included 10,438 individuals aged
between 5 and 15 years old (Meltzer, Gatward, Goodman & Ford, 2000). The SDQ
is widely used. Currently it is available in 75 different languages and can be
downloaded free of charge from the internet.
The psychometric properties of the SDQ were evaluated by Goodman (2001) who
concluded that the SDQ’s reliability and validity meant that it was a helpful brief
measure of children’s behavioural, emotional and social states. Mathai, Anderson &
Bourne (2002) assessed the SDQ for the purpose of use as a screening tool for
children admitted to the Child and Adolescent Mental Health Service. Mathai et al.
concluded that the SDQ was a sensitive and useful screening tool. Goodman et al.
(2000) also assessed the SDQ’s value as a screening tool for psychiatric disorders.
It was found that the SDQ successfully identified over 70% of children with
hyperactivity, conduct disorders, depression and some anxiety disorders. However,
the SDQ identified less than 50% of children with specific phobias, separation
anxiety and eating disorders. Difficulties in identifying specific phobias, separation
anxiety and eating disorders are foreseeable because the SDQ is a brief
questionnaire and these difficulties are very specific and so are unlikely to be
identified by a brief general questionnaire about behavioural emotional and social
issues.
Goodman, Ford, Simmons, Gatward & Meltzer (2000) found that SDQs provided by
only one respondent were significantly less sensitive than SDQs provided by multi-
respondents (e.g. both parents and teachers). This point is noteworthy in relation to
the design of this current research because only teachers were asked to complete
the SDQ. While it is likely that the SDQ would have provided more sensitive data if
both teachers and parents had been asked to complete the questionnaires, parents
were not asked to complete an SDQ for two reasons. Firstly, the inclusion criteria for
this study involved the children being rated as having BESD in school, and parents
were not well placed to comment on their child’s behaviour while at school because
parents rarely actually observe their child in class. Secondly, it was felt that parents
would be reluctant to take part if the time required to complete the questionnaires
was lengthy. As stated by Robson ‘When a self-completion questionnaire is used,
62

its complexity has to be kept to a minimum’ (2002, p 238). Hence the research
design aimed to minimise the time required for parents to complete the forms.
Goodman and Scott (1999) compared the SDQ to the Child Behavior Checklist and
found that scores from the two measures were highly correlated. Both measures
were similarly able to discriminate between children who had been drawn from
psychiatric clinics opposed to children from a dental clinic. Goodman & Scott
concluded that the SDQ was as effective as the Child Behavior Checklist in
identifying internalising and externalising difficulties and that the SDQ was
significantly better at recognising hyperactivity and attention problems.
Hence, while it is acknowledged that the SDQ is a brief questionnaire it is widely
used and research indicates that it is useful as a screening questionnaire for
behavioural emotional and social difficulties.
The SDQ provides information about five aspects of a child’s behaviour as well as a
total score as follows:
Table 2:
Strengths and Difficulties Questionnaire Sections
Description of the five scales contained in the SDQ BESD area measured
1 Emotional Symptoms: E.g. Is the child clingy, nervous,
unhappy, has many worries etc. Emotional
2
Conduct Problems: E.g. Does the child have problems
with temper tantrums, fighting, doing what they are told to
do etc.
Behavioural
3 Hyperactivity: E.g. Is the child over active, restless, easily
distracted, impulsive etc. Behavioural
4 Peer Problems: E.g. Does the child have difficulties with
friendships, tends to play alone etc. Social
5 Pro-Social: E.g. Is the child considerate, able to share,
helpful etc. Social
6 Total Difficulties: The sum of sub scales 1-4 Total BESD
Score
63

Each of the five Sections results in possible scores ranging from 0-10. For Sections
1-4 a high score indicates difficulties and the Total Difficulties Score is the sum of
Sections 1-4. Section 5 is scored in the opposite direction, so that a low score
indicates difficulties. The Total Difficulties score ranges from 0 – 40. All scores can
be categorised into three descriptors, ‘Normal’, ‘Borderline’ and ‘Abnormal’.
In this research the SDQ provided a standardised measure of the child’s
behavioural difficulties based on teachers’ perceptions. It gave an indication of the
areas of need for each child and also the severity of their behaviour in school. This
single questionnaire provides measures for all three areas of BESD as shown in the
table above. The questionnaire is quick to complete (approximately five minutes),
which is essential considering that participation in the research presented an extra
burden for busy school staff. In order to be included in the research the child must
be rated as having difficulties in at least one of the five areas on the SDQ. It is
acknowledged that including participants with only one area of difficulty on the SDQ
may not provide a robust measure of BESD. However, it has enabled children with
specific difficulties (e.g. social skills, emotional skills or hyperactivity) to be
investigated as well as those children with difficulties in a number of areas.
Difficulties in only one area (e.g. hyperactivity) may have a major impact on the
child’s ability to function effectively at school.
The SDQ does present certain drawbacks. For instance, it is a brief questionnaire
(25 questions) where teachers are only able to state whether statements are
‘Certainly True’, ‘Somewhat True’ or ‘Not True’. This results in a fairly crude
measure of the child’s behaviour. The cut-off scores for the ‘Abnormal’ category on
the SDQ encompass the top 10% of the standardisation sample. This is more liberal
than the other standardised measures used in this research and so the SDQ
‘Abnormal’ category may include more false positives that the other measures. The
data provided by the SDQ are only a rating of the teacher’s opinion about the child
and hence is a subjective measure. The teacher’s opinion may be affected by their
current relationship with that child. However, the teacher usually knows the child
well and so has an overview of the child’s behaviour over time and is well placed to
consider how the child’s behaviour compares to other children of the same age. The
SDQ allows individuals’ behaviour to be described in a standard way that permits
comparison to be drawn between the pattern of concerning behaviour and also the
severity of the concern. Due to the numbers of pupils involved in this study it was
64

not practical for the researcher to personally collect behavioural data on all the
pupils through observations.
The subjective nature of the questionnaire was evident when viewing responses
from schools in different catchment areas. Some schools had very few pupils with
BESD and so fairly minor behaviours may be rated as being of significant concern,
whereas other schools with a high number of challenging children considered some
level of BESD to be typical and hence less noteworthy. Therefore, the results should
be considered with caution because behaviour that may be seen as severely
disruptive in one setting may not present the same level of concern in another.
3.1.3 Measures of Sensory Processing
Sensory processing difficulties have been measured in a number of ways.
Standardised questionnaires exist where adults (who know the child well) provide a
rating of a variety of sensory behaviours. The final scores can be compared to
expected scores of sensory processing for typical children. The Short Sensory
Profile is an example of such a questionnaire and was chosen for use in this study.
SPDs may be recorded by measuring a child’s physical response to their
environment. However, direct measures of sensory processing deficits (such as
electrodermal responses or event related potentials) are not yet regularly used to
identify SPDs due to the equipment and expertise required to make such
measurements. These methods are certainly not available to schools. While such
methods provide a direct scientific measure of a child’s response they require
measuring equipment and skills that were not available within the limitations of this
research project.
Franklin et al.’s (2008) observations that many children with SPDs are also
observed to have behaviour difficulties indicates that it is essential that the
measures of sensory processing actually record sensory difficulties and not just
behaviours common in BESD children that may stem from a variety of causes. The
Sensory Profile does not directly measure a sensory deficit. However, research has
shown a close correlation between SPDs identified through observations of
children’s behaviour and direct sensory deficits measured in a laboratory (Davies &
Gavin, 2007), which indicates that information gathered from observations of
children’s behaviour may be pertinent. Davies & Gavin concluded that differences in
65

brain activity correctly distinguished typically developing children from those with an
identification of SPDs (made through behavioural observations) with 86% accuracy.
SPDs may also be investigated through individual assessment by an occupational
therapist. However employing an occupational therapist to assess over 100 children
would not have been practical. Detailed individual assessment to establish a formal
diagnosis of Sensory Processing Disorder was beyond the scope of this study.
Instead, data were gathered through the medium of screening questionnaires.
3.1.3.a The Sensory Profile and Short Sensory Profile
As has been noted above, SPDs may be assessed by a number of different
methods, but it was decided that the most practical method was to obtain ratings of
the child’s observed sensory behaviour. To establish prevalence of SPDs two
standardised screening questionnaires, the Short Sensory Profile (SSP) and
Sensory Profile, School Companion (SC), were used.
The Sensory Profile is a 125-question caregiver questionnaire which was developed
between 1993 and 1999 by Winnie Dunn, occupational therapist. ‘The Sensory
Profile provides a standard method for professionals to measure a child’s sensory
processing abilities and to profile the effect of sensory processing on functional
performance in the daily life of the child’ (Dunn, 1999, p 1). The sensory profile was
standardised using a sample of 1,037 children in America without disabilities. From
the Sensory Profile, the SSP was developed which is a 38-question caregiver
questionnaire which has become accepted as an appropriate tool for screening and
research (Tomchek & Dunn, 2007). The reliability and validity of the SSP are
reported to be excellent (Ahn et al., 2004). Examination of the internal validity of the
SSP indicated that the different sections of the SSP ‘tap relatively unique
constructions’ (Dunn, 1999, p69). Of particular relevance to this study is the fact
that, during the development of the SSP, all the items relating to social and
emotional behaviours were removed ‘because although these behaviors are related
to sensory processing, they are products of the sensory modulation process rather
than direct sensory events.’ (Dunn, 1999, p 59). Examination of individual items on
the SDQ and SSP indicates that only one item has similar content on both
questionnaires, which indicates that the SSP is not duplicating BESD information
gathered in the SDQ.
66

It has been found that children who have been identified as having SPDs through
OT assessment can be effectively distinguished from children without SPDs through
directly measuring their physical responses to sensory stimuli (Parush et al., 2007;
McIntosh et al, 1999; Miller et al., 1999; and Davies & Gavin, 2007). Dunn (1999)
reports that children who are found to have abnormal electrodermal responses
score significantly lower on the SSP, which is evidence for the construct validity of
the SSP, i.e. that it actually measures the underlying construct that it claims to
measure. Dunn (1999) also found that the SSP effectively discriminated between
typical children and those identified as having SMDs through OT assessment, as
children with SMDs had significantly lower mean scores on all sections. This lends
weight to the argument that the SSP does provide an effective measure of SPDs
and does not simply measure behaviours common in children with BESD. It also
shows that the sensory profile has been validated against more detailed methods of
identifying SPDs. It is acknowledged that use of a screening questionnaire does not
provide in depth knowledge in the way that a detailed individual assessment with
each child could do. Hence, the results of this study should be reported with caution.
The limitations of the Sensory Profile Questionnaires are discussed in Section
3.1.3c and 5.10.3.
The SSP is designed to be used with pupils between the ages of 5 and 10 years
old. Hence, to be included in the study, children needed to be in this age range at
the time that the questionnaire was completed.
The SSP provides scores for the following areas:
Table 3:
Sections on the Short Sensory Profile
SSP Section.
1 Tactile Sensitivity (Touch)
2 Taste or Smell Sensitivity
3 Movement Sensitivity
4 Under-responsive to sensory input or Seeks Sensation
5 Auditory Filtering (Listening skills)
6 Low Energy or Weak
7 Visual or Auditory Sensitivity
8 Total Score
67

From this point onwards SSP Section 4, ‘Under-responsive / seeks sensation’ will
be referred to as ‘Seeks Sensation,’ for ease of reading. For each item parents
rated whether their child ‘Always’, ‘Frequently’, ‘Occasionally’, ‘Seldom’ or ‘Never’
responds in the manner described in the statement. The responses are given a
score (Always = 1 through to Never = 5). Scores for all items on each Section are
summed to create the Section scores.
On the SSP, low scores indicate difficulties whereas high scores are typical. Like
the SDQ all scores can be allocated to three categories:
• ‘Typical Performance’ Scores in this range are usual for most children.
• ‘Probable Difference’: Scores in this range indicate that the child’s sensory
processing is probably different from typical children (between 1-2 standard
deviations away from the mean).
• ‘Definite Difference’: Scores in this range indicate that the child’s sensory
processing is definitely different from what would be expected for typical
children (more than 2 standard deviations away from the mean).
The cut-off for the ‘Definite Difference’ category only includes 2% of the
standardisation sample, which is a stricter cut-off than for the ‘Abnormal’ category
on the SDQ. This suggests that the SSP is less likely to produce false positives than
the SDQ, indeed due to the stringent cut-offs suggested by the SSP’s author, it is
possible that the SSP may produce some false negative results. It is suggested that
the chance of false positive and false negative results occurring would be reduced if
it had been possible to thoroughly individually assess each child.
3.1.3.b The Sensory Profile School Companion
In 2006 the Sensory Profile School Companion (SC) was developed, which is a 62-
question teacher questionnaire, again developed from the Sensory Profile. The SC
was standardised using a sample of over 700 children from across the USA in 2005-
6. 118 teachers completed the rating scales and the sample included children with
and without disabilities (Dunn, 2006). Dunn (2006) found moderate correlations
between the Sensory Profile and the SC. As Dunn explains ‘It was expected that
there would be small to moderate correlations between the ratings from the parent
and teacher because the home and school are two different contexts’ (p 89). Unlike
the SSP, no study to date has examined the SC to establish a correlation between
abnormal electrodermal responses and low scores on the SC. This means that the
68

SC has been less rigorously validated against direct measurements of SPDs, which
limits the conclusions that can be safely drawn during the interpretation of the
results. The SC is designed to be completed by teachers and used with pupils from
3-11 years old. Individual items on the SC are added to provide scores for the
following areas:
Table 4:
Sections on the Sensory Profile, School Companion
Sensory Processing Sections
1 Auditory (Hearing)
2 Visual
3 Movement
4 Touch (Tactile)
5 Behaviour
Like the SSP, low scores on the SC indicate difficulties. Again, all scores can be
allocated to three descriptive categories, ‘Typical’, ‘Probable Difference’ and
‘Definite Difference’. The individual items on the SC can be added in a different way
to provide Quadrant Scores and School Factor Scores. Hence, for example all the
items that relate to ‘Tolerance for Sensory Input’ are summed regardless of whether
they refer to auditory, visual or movement skills etc. In this way scores for the
following areas are also provided:
Table 5:
School Factors and Quadrants on the SC
School Factor Sections Quadrant Sections
6 Sensory Seeking & Registering Sensory
Inputs
10 Registration of Sensory Inputs
7 Awareness & Attention 11 Sensory Seeking
8 Tolerance for Sensory Input 12 Sensitivity
9 Availability for Learning 13 Avoiding
Scores for these sections can also be categorised into the same three descriptors
as all the other sensory processing scores. Due to the large number of sections on
the SC it was decided not to analyse the Quadrant Scores. This was because there
is considerable overlap between the School Factor Sections and topics of the
69

Quadrant Sections and so little detail was lost by reducing the number of SC factors
that were included in the final data analysis.
3.1.3.c Limitations of the Standardised Measures All the standardised measures in this study (the SDQ, SSP & SC) were designed to
be screening questionnaires. Therefore, the data cannot be seen as providing a
formal diagnosis of sensory processing disorder or any BESD diagnosis such as
conduct disorder, as these should ideally be identified through individual
assessment. Brief questionnaires can not provide the same level of rigour as data
that is collected through direct individual assessment of each child. However, the
SDQ and SSP have been validated against samples where children have been
diagnosed through individual assessment (e.g. Goodman & Scott, 1999; Dunn,
1999 and Davies & Gavin, 2007). In addition the SSP has been validated against
the direct measurement of sensory responses (e.g. Dunn, 1999). As described in
section 3.1.2 the SDQ has been found to be a useful screening tool (Goodman &
Scott, 1999) which was successful in identifying 70% of children with hyperactivity,
conduct disorders, depression and some anxiety disorders (Mathai et al., 2002).
While Mathai et al.’s research demonstrates the SDQ’s use as a screening tool, it
does suggest that approximately 30% of children in a sample may not be correctly
identified by the SDQ. Hence, it is possible that a few children may have been
incorrectly identified as having BESD on the SDQ and hence included in this study
without actually having significant BESD.
Similar concerns apply to the SSP and SC, which are also screening materials. The
SSP’s construct validity has been found to be good (Ahn et al. 2004; Dunn, 1999)
for example when compared with identification of SPDs through direct measurement
of sensory responses (Dunn, 1999), however no equivalent study has been done in
relation to the SC meaning that the construct validity of the SC has been less
rigorously validated. Therefore, it should be assumed that the teacher sensory
results generated by the SC may be less reliable than the parental responses on the
SSP.
The results are subject to issues common to all research using questionnaires such
as response bias and prestige bias as discussed in section 3.3.
All the standardised measures were brief, meaning that the complexity of individual
children’s difficulties may not be reflected in the results. Although the SSP is an
70

accepted tool for research (Tomchek & Dunn, 2007 and Ahn et al., 2004), it only
includes 38 questions compared to the full Sensory Profile which has 125 questions.
Therefore, the data provided by the SSP are not as comprehensive as the full
Sensory Profile. It was decided that the full sensory profile would not be appropriate
due to the time required to complete the profile. Such a lengthy questionnaire would
be likely to discourage parents from taking part, particularly as the schools reported
that some parents who participated in the study had limited literacy skills. It is
acknowledged that the Sensory Profile only provides the adult’s views, based on
their perceptions of the child’s behaviour. The resulting data represent parental and
teacher subjective perceptions, but these individuals are in the privileged position of
having observed a child’s behaviour over time and in many different situations.
Lastly it should be noted that both the SSP and the SC were standardised in the
USA and not in the UK. In addition, the SSP was standardised between 1993 and
1999; hence is at least 12 years old. The SC standardisation is 5-6 years old. It
would have been ideal if this assessment had been recently standardised on a UK
sample, however at the time of writing no UK standardised measure of sensory
processing difficulties was available.
3.2 Method
Prior to recruiting participants a research proposal was presented to the Cardiff
University School of Psychology Ethics Committee. The Ethics Committee
suggested a number of amendments which were made. The project was approved
by the ethics committee on 14th September 2010. Specific ethical considerations are
discussed in point 3.4.
3.2.1 General information
3.2.1.a Geographical Context
The research took place in a small local authority in central England which was
comprised of an urban area with only a few outlying villages. It contained a total of
65 schools catering for children of primary age (4-11 years old). Of the 65 schools, 3
were special schools, one for children with severe and profound learning difficulties,
one for children with significant social interaction and communication difficulties and
one for children with persistent BESD.
71

3.2.1.b Inclusion Criteria
In order to take part in the research, pupils had to meet the following criteria:
• The child had to be between 5 years 0 months and 10 years 11 months at
the time that the questionnaire was completed;
• Written parental consent had to be granted for each child;
• Teacher consent had to be granted prior to completing the teacher
questionnaire;
• Only children who had been observed to have BESD at school could be
nominated;
• The nature of the child’s BESD was then measured using the SDQ. Only
children who were rated as having at least one score in the ‘abnormal’
category on the 6 measures on the SDQ were included in the results.
3.2.1.c Questionnaire Packs
Approximately 200 questionnaire packs were initially made up ready to be
distributed to parents. The Parental Questionnaire Pack included:
• A Parent / Carer Introductory Letter (Appendix 2a);
• Parent / Carer Consent Form (Appendix 2b);
• Parental Background Information Sheet (Appendix 1c);
• The Short Sensory Profile.
Teacher Questionnaire Packs were made up for specific children, for whom parental
consent had been provided. The Teacher pack included:
• Teacher Introductory Letter (Appendix 3a);
• Teacher Consent Form (Appendix 3b);
• Teacher Background Information Sheet (Appendix 1d);
• Strengths and Difficulties Questionnaire (Appendix 1a);
• Sensory Profile School Companion.
All questionnaires were marked with a unique identification number and a sticker
was applied requesting that participants did not write the child’s name on the
questionnaire.
72

3.2.2 Recruitment Procedure
Participants were recruited for the study through three types of organisations as
described below. The researcher was available to support professionals involved in
recruitment, if parents required any further clarification or if professionals were
concerned about approaching particular parents.
The final deadline for returning questionnaires was 1st June 2011 and no
questionnaires were accepted after this date.
3.2.2.a Mainstream Schools
The researcher approached the special needs coordinators (SENCos) and head
teachers of 10 schools where she was known professionally. The research was
explained and all the schools agreed to take part in the study. The researcher
offered to attend a staff meeting to explain the project to all school staff, but only 4
schools felt that this was necessary.
SENCos were asked to liaise with class teachers to identify pupils who were
considered to have BESD. Care was taken to ensure that class teachers selected
the pupils that they thought had BESD prior to being told that the research was
investigating SPDs. This was to prevent teachers inadvertently selecting children
who demonstrated sensory behaviours rather than BESD. The number of children
identified in each school varied considerably depending on the size of the school
and the number of children within the school who were identified as experiencing
BESD. SENCos were given as many parental questionnaire packs as they
estimated were required. Any unused questionnaires were returned and more packs
could be requested if needed.
The exact method of distribution varied between schools. In the majority of schools
SENCos personally handed over the questionnaires when the parents visited the
school, for example during a parent / teacher evening. Taking the time to explain the
research individually with parents was found to the most effective way of achieving
informed consent. In cases where parents had little direct contact with the school
the packs were sent home by post. Schools were asked to ensure that all
questionnaires had been distributed between September 2010 and May 2011.
73

In order to ensure that enough participants took part, the study was gradually
extended to include other schools in the local authority throughout 2011. Care was
taken to ensure that pupils were selected from a variety of schools ranging from the
most affluent to those that covered the most deprived catchment areas. The level of
deprivation for each school was taken from the Index of Multiple Deprivation figures
provided by the local authority. Data were collected on pupils from 39 primary
schools. 33 of the schools were mainstream schools and five were mainstream
schools that also contained provision for a small number of pupils with significant
special educational needs. One school was a special school for BESD. No
participants were included from the special school for social communication and
interaction difficulties or the special school for severe and profound learning
difficulties.
3.2.2.b The Primary Behaviour Support Team (PBST)
The recruitment of participants was supported by the PBST who suggested the
inclusion of all new referrals to their service. The PBST consisted of two teachers
and approximately eight teaching assistants who were available to support all
primary schools across the local authority. The PBST received referrals directly from
schools when it was felt that they needed specialist support with individual BESD
pupils. The researcher attended a PBST team meeting to explain the research. It
was agreed that members of the PBST would ask the parents of all children referred
to them (between September 2010 and April 2011) to take part in the research. The
PBST professionals discussed the research with the parent and handed out a
parental questionnaire pack to parents who were prepared to take part. Once
parental consent had been gained, the PBST member handed out teacher
questionnaire packs to the child’s class teacher. Complete data was received for 29
participants from the PBST.
3.2.2.c Special School for Children with BESD
Within the borough there was one special school for pupils with persistent BESD;
the researcher worked closely with the SENCo of this school. All parents of children
in the correct age range were invited to take part in the study. The SENCo
personally approached all the parents and asked them to come into school to
consider the forms and complete the questionnaires, if they consented to take part.
Once parental consent had been gained the SENCo asked the child’s class teacher
to complete the teacher questionnaire pack. Complete data was received for 20
74

pupils from the BESD special school, however data for only 18 pupils were included
in the analysis because two pupils were rated as not having BESD.
3.2.3 Distribution and Completion of Questionnaires
During the distribution and completion of questionnaires the following steps were
taken.
• The purpose of the research was explained to parents in person and/or
through the covering letter.
• If parents did not consent to take part, no further action was taken.
• If parents provided written consent, they were asked to complete and return
the Parental Background Information and the Short Sensory Profile.
• If parents failed to respond within 7-10 days a verbal reminder was given
and duplicate forms provided if requested. If parents did not respond to the
verbal reminder, it was assumed that they did not want to take part.
• Schools returned the signed consent forms and parental questionnaires to
the researcher. On receipt, a confidential record was made of the child’s
name, School and Year group (taken from the consent form) and unique
identification number (written on the questionnaires).
• The consent forms were separated from the questionnaires and filed
separately.
• The list of the children’s names and identity numbers was stored
electronically so that a teacher questionnaire pack with the corresponding
identification number could be made up and sent out for each child.
• Once a teacher pack had been made up, a letter of thanks was sent to the
parents and the child’s details were deleted from the confidential list.
• SENCos gave the teacher pack to the member of staff within the school who
knew the child best. Again the purpose of the study was explained in the
covering letter.
• The teacher signed the consent form if he / she was happy to take part and
then completed the questionnaires.
All completed questionnaires were returned to the child’s school, where they were
usually personally collected by the researcher. Addressed envelopes were provided
to all schools so that any stray responses could be returned by internal mail.
75

3.3. Methodological Issues Relating to the Use of Questionnaires
Questionnaires provide an effective method to investigate the views of large
numbers of people at low cost. However, they present a number of drawbacks as a
method of collecting data. A common criticism of the use of questionnaires is that
often there is a very poor response rate (Thomas, 2009), which means that results
may only represent the views of a small percentage of the population and hence
does not provide an accurate account of the situation. As stated by Robson (2002)
every effort should be made to obtain as high a response rate as possible.
The following precautions were planned to try to maximise the questionnaire
response rate:
• Where possible questionnaires were personally given to parents when
they were visiting the school. Parents who were happy to take part were
encouraged to complete the questionnaires promptly.
• Parents and teachers who had not returned the questionnaire within 7-10
days were given a verbal reminder. Duplicate forms were provided if
requested.
• Participants who preferred not to take part were asked to return blank
questionnaires so that the SSP could be used by other families.
• Training on SPDs was offered so that staff had further understanding
about the issues raised in the study. Also the offer of free training presented
an incentive for schools to take part.
• After the parental questionnaire packs had been distributed in 4 schools,
it was noted that the response rate was significantly higher for the schools
which had nominated less than 20 pupils to take part. SENCos reported that
nomination of fewer pupils enabled them to be more personally involved in
the distribution of the questionnaires. Hence, it was decided to encourage
schools to nominate only a moderate number of pupils and to widen the data
collection to include more schools.
76

3.3.1 Participant Bias when Completing Questionnaires
It is known that questionnaires are subject to response bias (Robson, 2009) and
‘prestige bias’ (Thomas, 2002). Response bias refers to the fact that some types of
participant are more likely to respond to the questionnaire than others. In this survey
it was noted that parents who had a good relationship and regular contact with the
school were much more likely to complete the questionnaires. This is because
parents tended to respond more positively to the suggestion of taking part in a
research project if they had a positive relationship with the professional introducing
the research (usually the school SENCo). Also, parents with a poor relationship with
the school rarely visited the school for meetings and hence the questionnaires often
had to be sent home rather than given out personally. In many cases, parents of the
most challenging children did not view the school in a positive light and so were not
receptive to taking part in the research. Another issue was poor levels of literacy of
a number of parents. Where schools were aware of poor literacy levels they
endeavoured to support the parents in completing the questionnaires. However,
parents may have been reluctant to admit their literacy difficulties to schools and in
these cases they would have found it difficult to effectively complete the
questionnaires.
Children were nominated to be included in the research by the child’s class teacher.
It is acknowledged that teachers may have been biased when nominating certain
pupils. For example, they may focus on children who are overtly challenging in
school and pay less attention to withdrawn children with emotional or social needs.
Also, some parents were not approached because the relationship between the
parents and the school was so fragile. As a result of all the factors mentioned
above, some of the most vulnerable families with poor literacy levels were less likely
to take part. Hence, the sample included in this research is likely to favour children
with only moderate BESD and those whose parents who have a reasonable
relationship with the school.
‘Prestige bias’ addresses the issues surrounding the way participants respond to
individual questions, in that participants may veer towards giving answers that
portray them in a positive light, rather than providing an accurate account. In this
study it is possible that some participants may have been reluctant to provide
answers that they felt might portray a negative image of their family. Alternatively,
concerned parents may over-emphasise a child’s difficulties or try to provide the
77

answers that they think are pertinent to the outcomes for their child, such as the
level of support that the child receives at school. Collecting sensory data from both
parents and schools was hoped to enable a more balanced view of a child to be
collected, than might have occurred if data had only been provided by one party.
3.4. Ethical Issues
The following ethical issues were considered when planning the research design.
3.4.1 Recruiting Parents
Mainstream schools were sensitive about initially approaching parents, because the
study only involved children who were regarded by the school as having BESD.
Schools did not ask parents to take part in the research unless they had previously
discussed with the parents the school’s concern about the child’s behavioural,
emotional or social difficulties. Schools were clear about why they felt that the
research was relevant for each child, for instance in some cases there were no
behavioural difficulties, but the school was concerned about the child’s social skills.
Guidance was written to support schools in approaching parents (Appendix 4) and
the researcher offered to directly support schools if required. Only one parent
expressed concerns and requested to speak to the researcher directly. After further
explanation of the aims of the study he chose to consent to take part.
Many schools raised a number of children with fairly severe BESD who they felt
should be included in the study. However, in some cases it was acknowledged that
the relationship between the family and the school was very fragile and that it would
not be prudent to complicate the situation by requesting parental participation in a
research project.
Additional care was taken to be considerate of families’ personal situations which
may have affected their ability to respond. If a family was known to be under
particular stress (for example due to bereavement or the result of family break up)
they were not asked to take part in the research.
Although it was found that personally explaining the research to parents was the
most effective way to achieve their agreement to take part in the study, all SENCos
78

were instructed to be very careful to avoid parents feeling that they had been
pressurised to take part. It was emphasised that taking part in the research was
entirely voluntary and if parents preferred not to take part, their decision would not
affect the support given to their child in school. If a parent was unsure about how to
proceed, it was suggested that they took the questionnaire pack home to consider it,
in case the parent felt awkward about saying ‘No’ to school staff in a face to face
meeting.
3.4.2 Consent
• Parents were asked to provide written consent before any questionnaires
were completed. Where parents indicated that they did not want to take part,
no further action was taken. If parents did not respond, only one verbal
reminder was given and then it was assumed that they did not want to take
part in the study.
• Teacher packs were only distributed when parental consent for the child in
question had been received.
• Teacher questionnaires were only marked if written teacher consent had
been provided.
• Care was taken to ensure that consent was properly informed, particularly
for parents who were known to have learning difficulties or poor literacy
skills. In such cases, school staff carefully described the research and acted
as a reader and scribe if necessary when completing the questionnaires.
3.4.3 Managing Parent and Teacher Concerns
The researcher was available if parents or teachers had concerns about taking part
in the study. All SENCos supporting the study were given access to general training
sessions on sensory processing in typical children and how to recognise and
support children with SPDs. This gave teachers confidence in understanding SPDs
and in how to manage enquiries from other staff and parents. In addition, the
training provided opportunities for informal question and answer sessions and for
SENCos to share experiences with other schools.
SENCos were only allowed to attend training once the list of participants from their
school had been decided in order to ensure that their attendance on the training did
79

not influence the class teachers prior completing the questionnaires. Class teachers
who showed an interest in SPDs as a result of the study were welcome to attend
training, but only after they had returned all their completed questionnaires so as to
prevent the training affecting their responses. Five training sessions were offered in
total and training delivered to 38 SENCos, seven teachers and six members of the
PBST.
3.4.4 Management of Confidential and Anonymous Data
Parental Questionnaire Packs were distributed by SENCos to the parents of
children nominated by the school to take part. Parents signed and wrote the child’s
name on the consent forms. No names were written on the questionnaires. Instead,
they were marked with a unique identification number. Once the pack was returned,
the researcher immediately recorded, on a confidential electronic list, the child’s
name, school, year group and identification number. The consent forms were then
filed separately to the questionnaires. Hence, information provided in the
questionnaires was anonymous unless the viewer had access to the confidential list
of names and unique numbers. This confidential list was kept (completely separate
from the questionnaire data) on the educational psychology server at the local
authority educational psychology service. The list was password protected so that
only the researcher had access to pupils’ personal details.
The confidential list of all participants was retained by the researcher until the End
of Study Feedback Letter (Appendix 5a) was sent out to parents, at which point the
child’s details were deleted from the list, so that it was not possible to trace the data
back to individual participants.
All completed questionnaires were taken from the school to the researcher’s home
and stored in a lockable filing cabinet. Questionnaire data were entered into a
database using SPSS within one week of receipt by the researcher. The
anonymous data were stored on the researcher’s personal computer and password
protected.
80

3.5 Questionnaire to Establish SENCos’ Knowledge about SPDs: study B
In order to answer Research Question 4, all SENCos across the borough were
asked to complete a brief questionnaire about their understanding of SPDs
(Appendix 1b). This was distributed by local authority educational psychologists at
their annual school planning meetings in September and October 2010 before the
start of study A and hence before any training had been delivered. A total of 65
SENCo questionnaires were distributed. A return envelope was provided.
The consent form for SENCos indicated that by completing the questionnaire they
were consenting to take part in the study. Assumed consent was acceptable
because this questionnaire was very brief and totally anonymous. Insisting on
written consent would have complicated the study unnecessarily. Anonymity was
important for this questionnaire because SENCos may have been reluctant to admit
to lack of knowledge if the data could have been traced back to them.
3.5.1 Constructing the Questionnaire
The questionnaire was arranged in the manner of a 5 point Likert Scale, where
participants could state to what extent they agreed or disagreed with the statement.
The first five statements investigated SENCos’ understanding of the following
specific terminology:
• Sensory Processing Disorder (also known as Sensory Integrative
Dysfunction);
• Sensory Modulation Disorder;
• The Vestibular Sense;
• The Proprioceptive Sense;
• Tactile Defensiveness.
All the terms chosen are central to understanding theories of sensory processing
and yet unlikely to be known in common parlance. The last four statements were
intended to investigate whether SENCos and other school staff had appropriate
knowledge and resources to support SPDs.
81

The questionnaire was piloted with 3 SENCos from outside the local authority. No
issues were raised with it, hence no amendments made. The End of Study
Feedback for SENCos Letter (Appendix 5b) was sent out approximately four weeks
after the SENCo questionnaires were distributed.
3.6 Recording and Analysing the Data
The data were entered into Statistical Package for the Social Sciences 18 (SPSS).
Data were collected for a total of 184 children. Data for 26 children were excluded
because the school questionnaires were either incomplete or had not been returned
and so no measure of BESD was provided. Without this measure it was not possible
to ascertain whether the children had BESD or not and hence whether they met the
research inclusion criteria. 14 pupils were excluded because all their scores on the
SDQ fell into the ‘Normal’ or ‘Borderline Range’, meaning that they did not meet the
inclusion criteria for the study. For a further 12 pupils the parental data were
incomplete. However, if all the required questions for an SSP Section had been
completed, the Section total was included in the analysis. For this reason, the total
number of participants on each of the parental measures varied from 131 to 135.
Individual question scores on the SDQ, SSP and SC were totalled so that a score
for each Section could be calculated. All three assessments allow for the child’s
score to be allocated to one of three categories. The SDQ describes scores as
being ‘Normal’, ‘Borderline’ (Approximately the top 10-20% of scores on the
standardisation sample) or ‘Abnormal’ (Approximately the top 10% of scores on the
standardisation sample). The SSP and SC describe scores as being ‘Typical’,
‘Probable Difference’ (1-2 standard deviations from the mean, 2nd to the 16th
percentile) or ‘Definite Difference’ (>2 standard deviations from the mean, 1st to 2nd
percentile).
Six measures of BESD were calculated including a total BESD score. The SSP
provided eight measures including a total sensory difficulties score and the SC
provided nine measures of sensory processing. The SC did not provide a total
sensory processing score and hence it was not possible to directly compare the
teacher and parental overall scores for sensory processing. It was decided that a
total teacher sensory processing score would be helpful. This was calculated in the
same way as the SSP Total Score by adding the five scores relating to the different
82

senses (Auditory, Visual, Movement, Touch and Classroom Behaviours). The
standard deviation for each scale was also summed and cut-off scores set for
‘Probable Difference’ and ‘Definite Difference’ by summing the cut-off scores for the
individual Sections. In line with all the other sensory scores the ‘Probable
Difference’ range was between 1-2 standard deviations from the mean and ‘Definite
Difference’ was calculated to be more than 2 standard deviations from the mean.
Hence a 10th measure was created for the SC, which allowed comparison of the
total sensory scores provided by parents and schools. While a Total SC score is
useful to provide an idea of how the percentage of children with total difficulties on
the SSP compares with total difficulties on the SC, it is acknowledged that the Total
SC score provides a summary of a range of sensory issues and hence presents a
construct that is multi-dimensional. If the concepts measured by the individual
Sections were not conceptually linked in Dunn’s model of sensory processing, the
creation of a total measure that provides a summary of the Sections would not be
meaningful. However, sensory processing theory proposes that children may
present with a variety of difficulties in different sensory areas (Miller, 2007). The fact
that the difficulties measured on the individual Sections of the SSP are summed to
create an overall summary of the child’s sensory issues suggests that it is not
conceptually problematic to also calculate a total summary score for the SC.
3.6.1 Recoding Ordinal Data into Categorical Data
The main aim of this research was to establish how many pupils with BESD have
sensory difficulties. Hence, it was necessary to establish how many children fell into
the category of having a ‘definite difference’ on their sensory processing score. The
‘definite difference’ category was adopted from the Sensory Profile and only
includes children whose standardised scores were over 2 standard deviations from
the mean. This means that in the general population, only 2% of children would be
expected to score as having a ‘definite difference’. This cut off has also been used
in other research involving the SSP such as Tomchek & Dunn (2007) and Ahn et al.
(2004).
In order to establish the categories that children’s scores fell into, all the scores
were recoded into three categories indicating whether the score was ‘typical’,
indicated ‘probable difficulties’ or ‘difficulties’. The three questionnaires were
designed to produce scores with the descriptors shown in Table 6 below:
83

Table 6:
Descriptive Categories on the SDQ, SSP and SC
SDQ Normal Borderline Abnormal
SSP Typical Probable Difference Definite difference
SC Typical Probable Difference Definite difference
It was decided that for the sake of clarity and ease of description of the results that
the following descriptors would be used for all questionnaires.
New descriptor
after recode Typical Probable Difficulties Difficulties
While use of the same descriptors for all three questionnaires improves the ease of
reading in the results and discussion of this study, it is acknowledged that use of the
same terms masks the differences between the cut-offs set for the different
questionnaires. It should be remembered that the SDQ has a more liberal
categorisation of children with difficulties (approx. 10%) whereas the SSP and SC
have more stringent cut-offs (2%). This means that the descriptor ‘Difficulties’ for the
SDQ is more likely to have produced false positives than the SSP and SC. In
addition possible inaccuracies in how the results are perceived may have been
introduced due to readers perceiving the term ‘Difficulties’ slightly differently from
what was intended by the original terms ‘Abnormal’ and ‘Definite Difference’.
Frequency distribution tables were then calculated so that the number and
percentage of pupils falling into each category could be calculated. Hence, the
prevalence of SPDs for children with BESD could be calculated by working out the
percentage of participants that fell into the ‘definite difficulties’ category.
3.6.2 Pearson’s Chi-square Test
In order to see if there was an association between children with SPDs and other
factors, both sensory and BESD data were recoded into binary categories of
‘Typical or Probable Difficulties’ and ‘Difficulties’. Although recoding into binary
categories was necessary for analysis, it is acknowledged that the process results in
some loss of detail in the data. Pearson’s chi-square test was used to analyse
whether there was an association between the sensory scores provided by parents
84

and those provided by teachers. The chi-square test was also used to ascertain
whether there was a significant association between SPDs and other background
factors. The process of recoding the data into categories altered the data from
ordinal to nominal data, hence only statistics designed to analyse nominal data
could be used.
Pearson’s chi-square test investigates whether there is a relationship between two
categorical variables. Field (2009) states ‘This is an extremely elegant statistic
based on the simple idea of comparing the frequencies you observed in certain
categories to the frequencies you might expect to get in those categories by chance’
(p 688). The multi-dimensional chi-square tests allow investigation of whether
nominal variables are independent of each other, through use of the null hypothesis
which assumes that there is no relationship between the two variables (Brace,
Kemp & Snelgar, 2009). A level of significance is then calculated, which indicates
the probability of the results occurring by chance (Mulhern & Greer, 2011). It is
generally accepted that a probability score of 0.05 is an acceptable cut-off for
significance (Field, 2009; Brace et al. 2009; and Mulhern & Greer, 2011), indicating
that there is a probability of less than 5% that the results occurred by chance.
In order to use the chi-square test it is important the following criteria are met. Data
must be nominal so that the frequency in which each category appears can be
recorded; the categories must be mutually exclusive and every observation must be
independent of other observations. Hence, the chi-square test is not appropriate for
designs including repeated measures (Brace, et al., 2009). It should also be noted
that although the chi-square test provides information about the association
between variables, it does not indicate a causal relationship (Brace, et al., 2009).
The chi-square test has been criticised for producing significance values that are too
small when a 2x2 contingency table is used (Field, 2009). Yates’s Continuity
Correction was devised to rectify this. However, Field states that Yates’s continuity
correction tends to overcorrect and hence does not present a useful improvement
on the chi-square test.
The chi-square test is appropriate for analysing associations between most of the
variables in this study. However Research Question 3 seeks to establish
associations between children found to have SPDs and other background factors
such as a diagnosis of Autistic Spectrum Disorder. For many of these factors only a
85
very small number of children were rated as having a background difficulty. This
meant that in several cases more than 25% of the expected frequency counts on
the chi-square test were below 5. The chi-square test is not considered to be
accurate for very small numbers (Dancey & Reidy, 2011). As explained by Field
(2009) the chi-square test produces an approximate chi-square distribution:
‘in small samples, the approximation is not good enough, making the significance tests of the chi-square distribution inaccurate…When the expected frequencies are greater than 5, the sampling distribution is probably close enough to a perfect chi-square distribution for us not to worry’ (p 690).
When more than 25% of the expected frequency counts on the chi-square test were
below 5, Fisher’s Exact Test was used to analyse the results. This is because it
uses a method that computes the exact probability of the chi-square statistic that is
precise even when sample sizes are small (Field, 2009). Hence, this test is more
accurate than the chi-square for very small sample sizes.
3.7 Timetable of Research
An overview of the timetable of the research is provided below. Approval for the
study was granted by Cardiff University Ethics committee on 14.09.10.
Distribution of the Questionnaires were organised into four groups with
approximately 10 schools in each group. This ensured that the time consuming
parts of the process (such as meeting with schools, processing the completed
parental questionnaires and making up school questionnaire packs) were spread
throughout the year (2010-2011).
86

Table 7:
Timetable of Research Activities
Group 1 Schools Group 2 Schools Groups 3 Schools Group 4 Schools PBST & other
activities
16 Sept SENCo
Questionnaire
(Study B) sent to
Grp 1 schools.
16 Sept SENCo
Questionnaire
(Study B) was
given to EPs to be
delivered to all
schools during
Sept & Oct.
22 Sept – 16 Oct
Researcher met
SENCos to discuss
the research.
22 Sept – 22 Oct
Class teachers
made list of BESD
pupils. Parental
forms sent out for
all pupils on the list
19 Nov
Researcher met
PBST to discuss
the research.
PBST gradually
distributed parental
and school forms
for children
referred to their
service between 1
Sept 2010 and 30
April 2011.
1 Nov – 30 Dec
Parental forms
returned & school
forms delivered.
1 Nov – 1 Dec
Researcher met
SENCos to discuss
the research.
13 Dec
All Grp 1 school
forms returned.
1 Nov – 12 Dec
Class teachers
made list of BESD
pupils. Parental
forms sent out for
all pupils on the list
14 Dec
Training delivered
to Grp 1 SENCos
& PBST members.
13 Dec - 28 Jan
Parental forms
returned & school
forms delivered.
28 Jan – 21 Feb
Researcher met
SENCos to discuss
the research.
87

Table 7 continued:
Timetable of Research Activities
Group 1 Schools Group 2 Schools Groups 3 Schools Group 4 Schools PBST & other
activities
15 Feb
All Grp 2 school
forms returned.
28 Jan – 4 Mar
Class teachers
made list of BESD
pupils. Parental
forms sent out for
all pupils on the list
16 Feb
Training delivered
to Grp 2 SENCos,
a Grp 1 teacher &
2 PBST members
4 Mar – 28 Mar
Parental forms
returned & school
forms delivered.
11 Mar – 1 April
Researcher met
SENCos to discuss
the research.
4 May
All Grp 3 school
forms returned.
11 Mar – 6 May
Class teachers
made list of BESD
pupils. Parental
forms sent out for
all pupils on the list
5 May
Training delivered
to Grp 3 SENCos
26 April – 16 May
Parental forms
returned & school
forms delivered.
1st June
All Grp 4 school
forms returned.
14 June
Training delivered
to Grp 4 SENCos
& any other school
staff who wanted to
attend.
28 June
Final training
session delivered
for school staff that
had not been free
to attend previous
sessions.
PSBT = Primary Behaviour Support Team
88
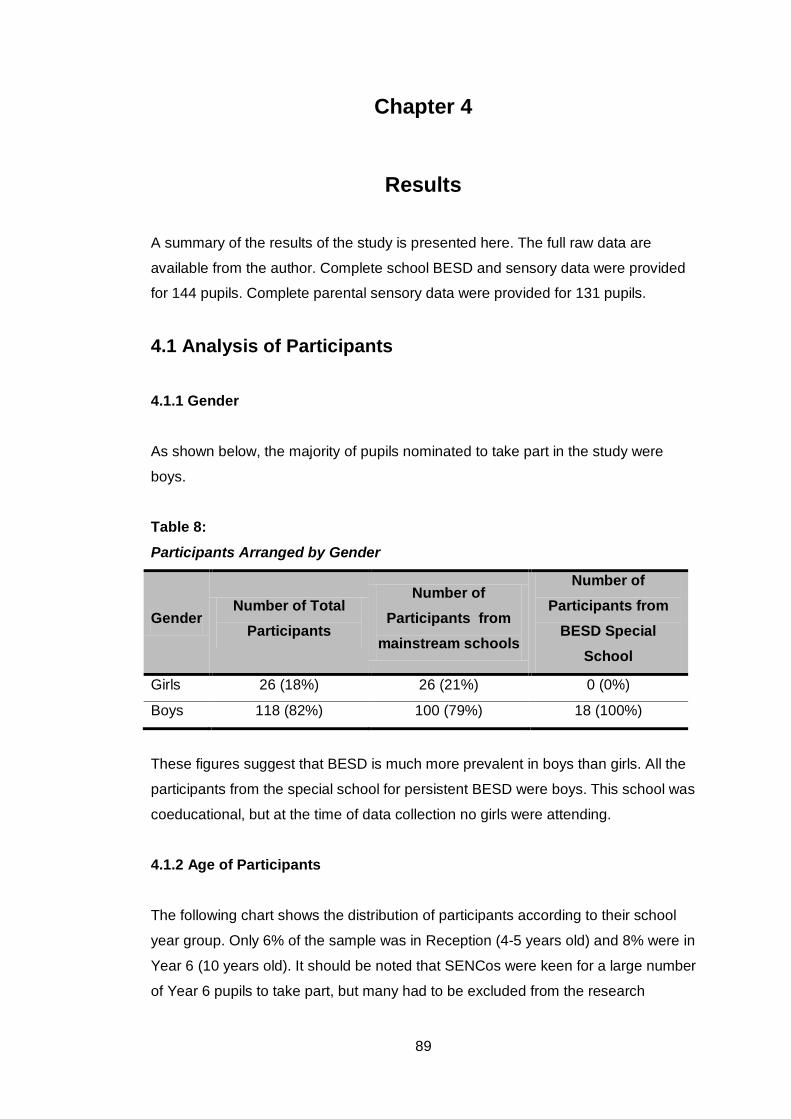
Chapter 4
Results
A summary of the results of the study is presented here. The full raw data are
available from the author. Complete school BESD and sensory data were provided
for 144 pupils. Complete parental sensory data were provided for 131 pupils.
4.1 Analysis of Participants
4.1.1 Gender
As shown below, the majority of pupils nominated to take part in the study were
boys.
Table 8:
Participants Arranged by Gender
Gender Number of Total
Participants
Number of Participants from
mainstream schools
Number of Participants from
BESD Special School
Girls 26 (18%) 26 (21%) 0 (0%)
Boys 118 (82%) 100 (79%) 18 (100%)
These figures suggest that BESD is much more prevalent in boys than girls. All the
participants from the special school for persistent BESD were boys. This school was
coeducational, but at the time of data collection no girls were attending.
4.1.2 Age of Participants
The following chart shows the distribution of participants according to their school
year group. Only 6% of the sample was in Reception (4-5 years old) and 8% were in
Year 6 (10 years old). It should be noted that SENCos were keen for a large number
of Year 6 pupils to take part, but many had to be excluded from the research
89

because they had turned 11 years old, which is too old for the standardisation on
the SSP.
Figure 2:
4.1.3 Index of Multiple Deprivation Participants were drawn from 39 of a total of 65 primary schools across the local
authority. The local authority provided data for the relative deprivation of all schools
within the borough. Deprivation was measured by the borough’s Index of Multiple
Deprivation (IMD). The IMD used a number of deprivation indicators, chosen to
cover a range of economic, social and housing issues and combined into a single
deprivation score for each postcode. The postcode for each pupil in the local
authority (as of January 2011) was used to calculate a mean deprivation score per
school. Schools were ranked and divided into quartiles according to their IMD score
and the number of participants that fell into each quartile was recorded. Table 9,
below, shows how many participants were drawn from schools in each quartile.
90

Table 9:
Breakdown of Participants by Schools, Ranked According to the Index of Multiple Deprivation
Quartile Percentage of Participants
Number of Participants
1st Quartile, Most Affluent Schools 29% 41
2nd Quartile 13% 19
3rd Quartile 31% 45
4th Quartile, Most Deprived Schools. 27% 39
Total 100% 144
Although these data do not provide information about the personal socioeconomic
status of individual children, they provide an indication that the sample represented
a fairly equal proportion of children from schools in all types of catchment areas
ranging from the most deprived to the most prosperous.
Local authority data showed that in the special school for BESD, 86% of the children
were eligible for free school meals whereas the highest free school meal figure in
the mainstream schools was 48%. Of the 62 mainstream primary schools in the
local authority, only 3 schools had more than 32% of children entitled to free school
meals. Only children of low income families are eligible for free school meals, hence
the data from the BESD special school would indicate a close link between children
with severe BESD and low income families.
4.1.4 Occupational Therapy Assessment
Sensory Processing difficulties are most commonly identified by occupational
therapists. Hence it was relevant to ascertain the number of BESD pupils who had
been assessed by an occupational therapist, as shown in the table below.
91

Table 10:
Number of Participants Reported to have been Assessed by an Occupational Therapist (n=144)
Assessed by an occupational therapist
% of participants Number of participants
Parental Response 23% 33
Teacher Response 14% 20
These scores may be slight underestimates because a number of respondents
indicated that they were ‘Not sure’ about the answer to this question. Parents stated
that more children had seen an occupational therapist than schools. This is not
surprising because children may have been assessed prior to starting school or
during the holidays and hence the school would not have been aware of the
occupational therapist’s involvement. For 3 pupils, schools stated that they had
been assessed by an occupational therapist, whereas the parent was ‘Not Sure’. A
likely explanation for this discrepancy is that when children are known to numerous
professionals, some parents may find it difficult to remember the role of everyone
who has worked with their child.
4.1.5 Types of BESD The SDQ is made up of five Sections and a total BESD score. A summary of the
number of participants rated as having difficulties in each SDQ Section is shown
below.
Table 11:
Breakdown of Participants by Type of BESD as Measured by the SDQ (n=144)
SDQ Sub Scales & Total. % of participants with
difficulties Number of participants
with difficulties
Emotional 27% 39
Peer Problems 41% 59
Pro-social Behaviour 47% 68
Conduct Difficulties 51% 74
Hyperactivity 74% 107
Total Difficulties 67% 97
92

Only 27% of children were rated as having emotional difficulties, whereas the most
common BESD was rated as being hyperactivity, in which 74% of participants were
felt to have difficulties. Only 67% of participants had overall difficulties with BESD,
indicating that 33% of participants were rated as having specific difficulties in one or
more of the five SDQ Sections, but their needs were not severe enough to be rated
as having overall BESD.
4.2 Prevalence of Sensory Processing Difficulties in Children with BESD The percentage of children who were rated as having SPDs on the Total Scores for
the SSP and SC are shown below.
Table 12:
Prevalence of SPDs as Rated by Parents and Teachers
Percentage of Children in Each Sensory Category
N - Total
Number of
children Difficulties Probable
Difficulties Typical
Short Sensory Profile,
Total Scores
(Parent Rating)
55% 14% 31% 131
Sensory Profile School
Companion, Total Score
(Teacher Rating)
44% 39% 16% 144
The figures show that parents rated 55% of participants as having SPDs and
teachers rated 44% as having SPDs. Teachers rated that a further 39% of
participants had probable SPDs.
93

4.2.1 Prevalence of SPDs by Demographic Categories Table 13:
Prevalence of SPDs by gender
Pupils with difficulties on the Total SSP Score
(girls: n=25 boys: n=106)
Pupils with difficulties on the Total SC Score
(girls: n=26 boys: n=118)
% Number % Number
Girls 48% 12 27% 7
Boys 57% 60 48% 57
As shown in table 13, no significant association was found between the prevalence
of SPDs according to gender on the Total SSP Score. However, teachers rated that
boys were significantly more likely than girls to have SPDs on the SC, χ²= 3.95 (1)
p=.047, sig <0.05.
Figure 3 shows that the percentage of children rated as having SPDs varies
between year groups and depending on whether the data was provided by parents
or teachers. No pattern of SPDs is apparent based on the participant’s age.
Figure: 3
Prevalence of SPDs by School Year Group using the SSP and SC Total Scores
94

The scores for total SPDs on the SSP and SC were calculated for the school Index
of Multiple Deprivation (IMD) for each pupil as shown below. The total measure for
BESD was also compared to the IMD.
Table 14:
The Percentage of Pupils with SPDs and BESD according to the Index of Multiple Deprivation Score for the Pupil’s School
Quartile N pupils in each quartile
% with SPDs on the Total SSP Score
% with SPDs on the Total
SC Score
% with BESD on the Total SDQ Score
1st Quartile, Most
Affluent Schools 41 51% 39% 63%
2nd Quartile 19 52% 42% 74%
3rd Quartile 45 46% 37% 58%
4th Quartile, Most
Deprived Schools 39 65% 59% 80%
Although the most deprived quartile has the highest percentage of difficulties on all
three measures, there is no obvious trend of BESD or sensory difficulties being less
prevalent in participants from affluent schools as is shown in the graph below.
95

Figure 4:
The Percentage of Pupils with SPDs and BESD According to the Deprivation of the Pupil’s School
4.2.2 Prevalence of SPDs on the Sensory Profile Sections
The SSP and SC are composed of a number of Sections. The percentage of
participants rated as having SPDs varied considerably for each Section as shown
below.
96

Table 15:
Breakdown of Prevalence of SPDs by Section on the Short Sensory Profile
Short Sensory Profile Sections (Parental Rating)
Number of Children in Each Category
N - Total
Number of
children Difficulties Probable
Difficulties Typical
Visual / Auditory
Sensitivity 30 (23%) 24 (18%) 79 (59%) 133
Movement Sensitivity 33 (24%) 14 (10%) 88 (65%) 135
Taste / Smell Sensitivity 40 (30%) 7 (5%) 87 (65%) 134
Low Energy / Weak 40 (30%) 13 (10%) 80 (60%) 133
Tactile Sensitivity 40 (30%) 34 (25%) 60 (45%) 134
Auditory Filtering
(Listening Skills) 92 (69%) 23 (17%) 18 (14%) 133
Seeks Sensation 94 (70%) 22 (16%) 19 (14%) 135
Short Sensory Profile
Total Score 72 (55%) 18 (14%) 41 (31%) 131
These figures show that between 23-30% of pupils are rated as having difficulties
on five of the seven Sections on the SSP. However, a much higher percentage was
found for the ‘Auditory Filtering’ and ‘Seeks Sensation’ Sections as is demonstrated
by the following graph.
97

Figure 5:
A summary of the proportion of children found to have difficulties on the SC
Sections is shown in Table 16 below.
55
70
69
30
30
30
24
23
0 20 40 60 80
Total Score
Seeks Sensation
Auditory Filtering
Tactile Sensitivity
Low Energy or Weak
Taste / Smell Sensitivity
Movement Sensitivity
Visual or Auditory Sensitivity
Percentage of Children Shor
t Sen
sory
Pro
file
Sub
Scal
es
Percentage of Children with Difficulties on the Sub Scales of the Short Sensory Profile (Parent Rating)
98

Table 16:
Prevalence of SPDs by Section on the Sensory Profile, School Companion
Sensory Profile School Companion Sections
(Teacher Rating)
Number of Children in Each Category
N - Total
Number of
children Difficulties
Probable
Difficulties Typical
Visual 36 (25%) 56 (39%) 52(36%) 144
Auditory 52 (36%) 56 (39%) 36 (25%) 144
Touch 75 (52%) 37 (26%) 32 (22%) 144
Sensory Behaviour 80 (56%) 39 (27%) 25 (17%) 144
Movement 85 (59%) 32 (22%) 27 (19%) 144
Total Score 64 (44%) 57 (39%) 23 (16%) 144
School Factors
Attention & Awareness 23 (16%) 58 (40%) 63 (44%) 144
Availability for Learning 46 (32%) 37 (26%) 61 (42%) 144
Sensory Seeking &
Registration 75 (52%) 39 (27%) 30 (21%) 144
Tolerance for Sensory Input 76 (53%) 38 (26%) 30 (21%) 144
Like the SSP, the percentage of participants with difficulties according to the SC
(teacher rating) varies between Sections. ‘Movement’ was rated as the Section with
the highest number of children showing difficulties. This contrasts with the SSP
results where ‘Movement’ was the Section with the second lowest score. The SC
Section scores are given in Figure 6 below.
99

Figure 6:
4.3 Comparison of the Sensory Scores Provided by Parents and those Provided by Teachers
In this study sensory data on individual children were collected from both parents
and teachers. The following section investigates whether there is agreement
between the responses provided by parents and teachers.
4.3.1 Comparison of Responses on SSP and SC Sections
The headings on the SSP and SC suggest that there are six sensory measures that
are common to the SSP and SC that could be directly compared. The comparable
Sections were Tactile, Auditory, Visual, Movement, Seeks Sensation and Total
Score. Close examination of the Movement and Visual sections on the SSP and SC,
led to concern about whether a direct comparison between the SSP and SC
measures was appropriate. For instance, the SSP ‘Movement’ section primarily
investigates vestibular insecurity where as the SC ‘Movement’ section mainly
investigates activity levels and participation in group activities. Likewise the SSP
visual section investigates visual and auditory sensitivity, whereas the SC visual
section only includes visual information. These issues relating to SSP and SC
comparisons are discussed in Chapter 5.
44
59
56
53
52
52
36
32
25
16
0 20 40 60 80
Total ScoreMovement
Classroom BehavioursTolerance for Input
Seeking & RegistrationTouch
AuditoryAvailability for Learning
VisualAttention & Awareness
Percentage of Children Scho
ol C
ompa
nion
Sub
Sca
les
Percentage of Children with Difficulties on the Sections of the School Companion (Teacher Rating)
100

Table 17:
Analysis of Associations between Parent and Teacher Responses on Sensory Measures
Notes: ns = non-significant. Non-significant results are shaded. Results were reported as significant if p<.05. For all calculations, degrees of freedom = 1.
It is noteworthy that while significant associations have been found in four of the six
comparable sensory areas, there are many individual cases where parents and
teachers did not agree in their rating of the child’s sensory difficulties. For example,
parents rated 40 children and teachers rated 75 children as having tactile difficulties.
However, there were only 26 cases where both the parent and teacher rated the
same child as having tactile difficulties. Hence, 14 children were rated as having
tactile difficulties at home but not at school and 49 children were rated as having
tactile difficulties at school but not at home. Possible reasons for these
discrepancies will be discussed in the next chapter.
Although there were considerable discrepancies between parental and teacher
ratings on the sensory sections, a pattern was evident when responses to individual
questions were analysed. The items on which 50% or more of children were rated
as ‘Always’ or ‘Frequently’ seen to display the named behaviour were examined. It
is not possible quote individual items in order to comply with copyright restrictions.
However, examination of the responses shows that two clear areas of concern were
apparent: overactivity and difficulties with attention. These two themes were clearly
evident for both parent and teacher responses.
Parent and Teacher
comparison
Total
N
% of pupils rated as having
sensory difficulties by Association of parent &
teacher rating scores Teacher &
Parent %
Parent
%
Teacher
% x² p Sig
Total Sensory Score 131 32% 55% 44% 11.42 .001 <.005
Auditory 133 32% 69% 39% 6.74 .009 <.01
Seeks sensation 135 42% 70% 48% 8.04 .005 <.01
Tactile 134 19% 30% 56% 4.17 .041 <.05
Movement 135 18% 24% 63% 3.28 .070 ns
Visual 133 8% 23% 27% 0.77 .380 ns
101

4.4 Associations between SPDs, BESD and Background Factors
This section investigates associations between SPDs and types of BESD in cases
where children have been recorded as having a background factor / difficulty. A
large number of children were rated as having difficulties on some background
factors, such as the parental rating for the child being anxious (n= 62), however nine
background factors had an incidence of 15 or less and so the results should be
treated with caution due to the relatively small number of participants involved.
Analysis of the factors with a frequency of less than 15 is presented in Appendix 6.
Frequency tables and p values for the analysis of background and SDQ factors with
significant associations (and a frequency of more than 15) can be found in Appendix
7.
In 68 of the 70 instances where an association was found, the existence of a
background factor or SDQ difficulty was related to a higher prevalence of sensory
difficulties. Two associations with SDQ Sections were counterintuitive. The
existence of difficulties in SDQ ‘Hyperactivity’ and SDQ ‘Conduct Difficulties’ were
associated with not having difficulties on the SC Availability for Learning Section.
4.4.1 Background Factors with No Associations
No association was found between any of the 18 sensory measures and the
following factors shown in Table 18.
102

Table 18:
Background Factors Where No Associations were Found with SDQ or Sensory Measures.
Background Factor/Difficulty Rated by
Teacher or Parent
N children rated as having the background
factor or difficulty
Difficulties with learning Teacher 95
Pro-social behaviour (measured by the
SDQ) Teacher
62
Difficulties during birth or labour Parent 52
All the scores on the Chi-square test for these factors were non-significant.
4.4.2 Associations with SSP and SC Total Scores
Table 19 shows all the background factors where a significant association was
found with The Total Score on the SSP and/or the Total Score on the SC.
103

Table 19:
Significant Associations Between Background Factors and ‘Total Scores’ on the SSP and SC
Background Factor N % of
Total x²
SSP Total (Parent)
SC Total (School)
N with difficulties on
SSP or SC Total
72 64
Gender 118
(boys) 82
x² 0.61 3.95
p ns <.05
Anxiety (Parent) 62 47 x² 15.02 2.85
p <.001 ns
Fussy baby (Parent)
43 32
x² 7.19 0.33
p <.01 ns
Other Diagnoses
(Parent) 34 27
x² 5.36 0.50
p <.05 ns
Assessed by an OT
(Parent) 32 25
x² 7.03 1.50
p <.01 ns
Assessed by an OT
(Teacher) 15 12
x² 5.78 3.98
p <.05 <.05
Note: ns = non-significant. Non-significant results are shaded. For all calculations, degrees of freedom = 1. Results were reported as significant if p<.05.
Only one background factor, ‘Assessed by an OT (Teacher)’ showed significant
associations with the Total Score on both the parent and teacher sensory
measures. Only 15 participants were rated as being in this category, hence the
results should be interpreted with caution.
4.4.3 Associations with SSP Sections Several significant associations were found between SSP Sections and background
factors as is shown in Table 20.
104

Table 20:
Associations Between SSP Sections and Children Rated as Having Difficulties in Background Factors
Back-ground Factor
N SSP Seeks Sensation
SSP Auditory
SSP Tactile
SSP Taste
SSP Low
Energy/ Weak
SSP Move-ment
SSP Visual & Auditory
N 94 92 40 40 40 33 30
Anxiety
(Parent) 62
x² 1.24 12.64 18.06 5.15 6.43 6.79 12.08
p = ns <.001 <.001 <.05 <.001 <.01 <.005
Fussy
baby
(Parent)
42 x² 5.61 6.00 15.42 12.93 4.24 1.52 8.90
p <.05 <.05 <.001 <.001 <.05 =ns <.005
Other
difficulties
(Parent)
34 x² 0.11 1.33 4.09 0.25 10.29 7.52 1.71
p =ns =ns <.05 =ns <.005 <.01 =ns
Assessed
by an OT
(Parent)
32 x² 0.02 1.84 0.21 0.05 7.36 4.27 6.74
p =ns =ns =ns =ns <.01 <.05 <.01
Other
difficulties
(Teacher)
24 x² 0.01 0.70 4.03 2.63 6.49 2.59 2.75
p =ns =ns <.05 =ns <.05 =ns =ns
Assessed
by an OT
(Teacher)
15 x² 2.177 0.96 0.58 4.39 1.21 0.00 0.20
p =ns =ns =ns <.05 =ns =ns =ns
Note: ns = non-significant. Non-significant results are shaded. Results were reported as significant if p<.05. For all calculations, degrees of freedom = 1.
Significant associations were found between ‘Anxiety’ (Parent) and ‘Fussy Baby’
and six of the seven SSP Section scores. For example, 50% of ‘fussy children’
were rated by parents as having tactile difficulties, compared to only 17% of ‘not
fussy children’. (χ² = 15.420, (1), p< .001.) However, no association was evident
between ‘fussy children’ and any sensory measures at school. There was only one
significant association for ‘anxiety (Parent)’ on the SC.
105

Although parents rated that a large number of children had difficulties with ‘Seeks
Sensation’ and ‘Auditory Filtering’ there were only three significant associations
between these sensory scores and any of the background factors that have often
been linked to SPDs in other research. By comparison, four of the other SSP
Sections had links with five or six different background factors.
It is notable that the SSP Section Low energy / weak has associations with five
factors, which is counterintuitive considering that such a high number of participants
were rated as being hyperactive. However, this may be an indication that the activity
levels of a number of participants fluctuate, as is thought to be the case with SMDs.
4.4.4 Associations with SC Sections There were few significant associations between the SC Sections and background
factors as shown in Table 21 below.
Table 21:
Associations Between SC Sections and Children Rated as Having Difficulties in Background Factors.
Background Factor
N x² SC
Movement
SC Classroom Behaviour
SC Touch
SC Auditory
SC Visual
N 85 80 75 52 36
Anxiety (Parent) 62 x² 0.00 1.36 0.82 0.51 5.78
p ns ns ns ns <.05
Anxiety (Teacher) 58 x² 0.08 5.11 0.05 3.67 3.13
p ns <.05 ns ns ns
Assessed by an
OT (Parent) 32
x² 0.36 0.15 0.65 0.42 6.06
p ns ns ns ns <.05
Other diagnosis
(Teacher) 24
x² 1.35 0.38 0.77 0.85 8.13
p ns ns ns ns <.005
Assessed by an
OT (Teacher) 15
x² 1.00 0.46 5.04 0.02 2.89
p ns ns <.05 ns ns
Note: ns = non-significant. Non-significant results are shaded. Results were reported as significant if p<.05. For all calculations, degrees of freedom = 1.
106

The visual Section, which was the one rated as having the least number of children
with difficulties, showed three significant associations (Anxiety (Parent), Assessed
by an OT (Parent) and Other diagnosis (Teacher)). No other SC Section showed
more than one.
Table 22:
Associations between SC School Factor Sections and Children Rated as Having Difficulties in Background Factors
Background Factor
N x²
School Companion School Factors
Tolerance for
sensory input
Sensory seeking /
Registration
Availability for
learning
Attention & Awareness
N 76 75 46 23
Behaviour
(Teacher) 105
x² 1.97 5.12 1.35 0.06
p ns <.05 ns ns
Anxiety (Parent) 62 x² 2.07 0.09 2.56 4.77
p ns ns ns <.05
Anxiety (Teacher) 58 x² 12.16 0.01 14.85 1.67
p <.001 ns <.001 ns
Assessed by an
OT (Teacher) 15
x² 0.03 4.44 0.05 0.27
p ns <.05 ns ns
Note: ns = non-significant. Non-significant results are shaded. Results were reported as significant if p<.05. For all calculations, degrees of freedom = 1.
Like the analysis of other SC Sections and background factors there is no clear
pattern of association. It is notable that there are highly significant associations
between ‘Anxiety’ (Teacher) and ‘Tolerance for sensory input’ (p<.001) and
‘Availability for Learning’ (p<.001).
4.5 Associations between Sensory Measures and Subtypes of BESD
Associations were analysed between measures of sensory processing and the
different types of behavioural emotional and social difficulties (measured by the
107

SDQ) using Pearson’s chi-square test. The results are shown in Table 23 of any
significant relationships that were found.
Table 23: Analysis of Association Between Parental Sensory Data (SSP) and SDQ Categories
Short Sensory Profile Sections (Parent Rating)
N SDQ
Hyper-activity
SDQ Conduct Problems
SDQ Peer
Relations
SDQ Emotional
SDQ Total
N 100 68 54 37 90
SSP Tactile 40 x² 0.13 0.41 5.12 0.68 0.73
p ns ns <.05 ns ns
SSP Movement 33 x² 0.10 0.73 9.48 2.73 4.12
p ns ns <.005 ns <.05
SSP Seeks
Sensation 94
x² 3.48 4.92 4.72 0.10 2.10
p ns <.05 <.05 ns ns
SSP Low Energy /
Weak 40
x² 0.28 1.70 0.63 4.22 2.89
p ns ns ns <.05 ns
SSP Full Total 72 x² 0.97 0.06 11.43 3.31 0.19
p ns ns = .001 ns ns
Note: ns = non-significant. Non-significant results are shaded. Results were reported as significant if p<.05. For all calculations, degrees of freedom = 1.
There were few significant associations between sensory data provided by parents
and the BESD measures provided by teachers, except for the SDQ measure ‘Peer
Relations’ which has significant scores for four SSP Sections. ‘Peer Relations’ is
also significantly associated with seven of the SC Sections as is shown in Table 24.
108

Table 24:
Analysis of Association Between Teacher Sensory Data (SC) and SDQ Categories
SC Section (Teacher rating)
N pupils with
SPDs on the SC
SDQ Emotional
SDQ Conduct
SDQ Hyper-activity
SDQ Peer
Relations
SDQ Total
N - pupils with
BESD on SDQ
39 74 107 59 68
SC Movement 85 x² 0.00 0.62 9.25 7.93 9.98
p ns ns <.005 = .005 <.005
SC Classroom
Behaviours 80
x² 5.71 7.01 0.88 7.86 6.47
p < .05 <.01 ns = .005 <.05
SC Tolerance for
Sensory Input 76
x² 10.00 0.97 0.03 3.96 5.87
p <.005 ns ns <.05 <.05
SC Tactile 75 x² 0.07 4.65 2.66 12.14 11.37
p ns <.05 ns <.001 = .001
SC Sensory
Seeking &
Registration
75 x² 0.07 4.65 9.97 9.89 13.90
p ns = .05 <.005 <.005 <.001
SC Auditory 52 x² 7.292 0.06 0.29 9.41 3.39
p <.01 ns ns <.005 ns
SC Availability
for Learning 46
x² 21.547 9.543 6.391 6.757 0.589
p <.001 <.01 <.05 <.01 ns
SC Visual 36 x² 3.39 0.33 2.05 1.62 5.57
p ns ns ns ns <.05
SC Attention &
Awareness 23
x² 0.01 5.56 2.30 0.43 0.06
p ns <.05 ns ns ns
SC Total 64 x² 4.57 2.94 1.75 18.99 10.11
p <.05 ns ns <.001 = .001
Note: ns = non-significant. Non-significant results are shaded. Results were reported as significant if p<.05. For all calculations, degrees of freedom = 1.
There were significant associations between a wide range of BESD Sections and
Sections on the SC. The behaviour Section with the most associations with sensory
109
difficulties is ‘Peer Relations’. There was a significant relationship between children
with difficulties in peer relations and 12 of the 18 sensory measures. For example,
69.5% of children with difficulties with peer relationships were found to have
difficulties with touch at school whereas, of the children without difficulties with peer
relations, only 40% had tactile difficulties. Analysis indicates that this is a significant
relationship (χ²= 12.137, p <.001).
The largest Chi-square score was for SDQ emotional difficulties and SC Availability
for learning (χ²=21.54 p<.001). ‘Classroom Behaviour’, ‘Sensory Seeking /
Registration’ and ‘Availability for Learning’ all had significant associations with four
of the five SDQ measures.
4.6 Current Level of SENCo Knowledge about SPDs
SENCos from 45 of a total of 65 schools responded to the questions listed below.
This is a response rate of 69%. The teachers who disagreed with the statements
indicated that they have a poor understanding of knowledge about SPDs as is
shown in Table 25 below.
110

Table 25:
Responses to SENCO Questionnaire, Relating to SENCo Knowledge about Sensory Processing Difficulties
Questions on the SENCo Questionnaire % of SENCos that agreed or
disagreed with the statement.
I have a good understanding of the following: %
Agree %
Neither %
Disagree
• sensory processing disorder (also known as sensory integrative dysfunction)
18 24 58
• sensory modulation disorder 7 9 84
• the vestibular sense 18 11 71
• the proprioceptive sense 18 9 73
• tactile defensiveness 18 18 64
%
Agree %
Neither %
Disagree
• I am confident I can identify behaviour that might have a sensory cause.
29 33 38
• I am familiar with strategies and resources to support children with sensory processing difficulties
18 31 51
• I know where to find strategies and resources to support children with sensory processing difficulties
36 20 44
• Teachers and TAs in my school know how to identify and support sensory processing difficulties
7 22 71
The data show that a substantial number of SENCos rated themselves as not
having a good understanding of sensory processing difficulties. Given that the data
from this research indicate that 44% of children with BESD have sensory difficulties
(teacher rating) the SENCo data suggest a need for improving the understanding of
SPDs in schools so that BESD children are appropriately supported.
111

4.7 Summary of Results
The results show that 82% of the participants (n = 144) were boys and 18 of those
attended a special school for children with BESD. Parents rated on the SSP Total
score that 55% of the sample had sensory difficulties, whereas teachers rated on
the SC that 44% of the sample had sensory difficulties on the SC Total Score. The
percentage of children found to have difficulties on the SSP Sections varied from
23% to 70% with the greatest level of difficulties being found for ‘Auditory Filtering’
(69%) and ‘Seeks Sensation’ (70%). The percentage of children found to have
difficulties on the SC varied from 25% for ‘Visual’ to 59% for ‘Movement’. Significant
associations between parent and teacher response on the sensory measures were
only found on four of the six comparable sections.
An overview of the results for the whole sample and for the mainstream and special
school samples is provided below in Table 26 and Table 27.
112

Table 26:
Overview of Main Results for the Whole Sample
SDQ: Strengths and Difficulties Questionnaire (Teacher measure of BESD) SSP: Short Sensory Profile (Parental sensory measure) SC: Sensory Profile, School Companion (Teacher sensory measure)
SDQ, SSP & SC Sections Numbers of Children in Each
Category % of children with Probable
or Definite Difficulties
N Total
Typical Probable
Difficulties Definite
Difficulties
SDQ Emotional 144 91(63 %) 14 (10%) 39 (27%) 37%
SDQ Conduct 144 56 (39%) 14 (10%) 74 (51%) 61%
SDQ Hyperactive 144 27 (19%) 10 (7%) 107 (74%) 81%
SDQ Peer Relations 144 70 (49%) 15 (10%) 59 (41%) 51%
SDQ Pro-social 144 47 (33%) 29 (20%) 68 (47%) 67%
SDQ Total 144 10 (7%) 37 (26%) 97 (67%) 93%
SSP Tactile 134 60 (45%) 34 (25%) 40 (30%) 55%
SSP Taste 134 87 (65%) 7 (5%) 40 (30%) 35%
SSP Movement 135 88 (65%) 14 (10%) 33 (24%) 35%
SSP Seeks Sensation 135 19 (14%) 22 (16%) 94 (70%) 86%
SSP Auditory 133 18 (14%) 23 (17%) 92 (69%) 86%
SSP Low Energy 133 80 (60%) 13 (10%) 40 (30%) 40%
SSP Visual / Auditory 133 79 (59%) 24 (18%) 30 (23%) 41%
SSP Total Score 131 41 (31%) 18 (14%) 72 (55%) 69%
SC Auditory 144 36 (25%) 56 (39%) 52 (36%) 75%
SC Visual 144 52 (36%) 56 (39%) 36 (25%) 64%
SC Movement 144 27 (19%) 32 (22%) 85 (59%) 81%
SC Touch 144 32 (22%) 37 (26%) 75 (52%) 78%
SC Sensory Behaviour 144 25 (17%) 39 (27%) 80 (56%) 83%
SC Total Score 144 23 (16%) 57 (39%) 64 (44%) 83%
SC Sensory Seeking &
Registration 144 30 (21%) 39 (27%) 75 (52%) 79%
SC Attention & Awareness 144 63 (44%) 58 (40%) 23 (16%) 56%
SC Tolerance for Sensory
Input 144 30 (21%) 38 (26%) 76 (53%) 79%
SC Availability for Learning 144 61 (42%) 37 (26%) 46 (32%) 58%
113

Table 27: Overview of Main Results for Mainstream Schools and the BESD Special School
SDQ, SSP & SC Sections
Mainstream Schools: Numbers of Children in Each Category
Special BESD School: Numbers of Children in Each Category
N Total
Typical Probable Difficulty
Definite Difficulty
N Total
Typical Probable Difficulty
Definite Difficulty
SDQ Emotional 126 81 (64%) 12 (10%) 33 (26%) 18 10 (56%) 2 (1%) 6 (33%) SDQ Conduct 126 49 (39%) 10 (8%) 67 (53%) 18 7 (39%) 4 (22%) 7 (39%) SDQ Hyperactive 126 21 (17%) 9 (7%) 96 (76%) 18 6 (33%) 1 (6%) 11 (61%) SDQ Peer Relations 126 66 (52%) 13 (10%) 47 (37%) 18 4 (22%) 2 (11%) 12 (67%) SDQ Pro-social 126 40 (32%) 27 (21%) 59 (47%) 18 7 (39%) 2 (11%) 9 (50%) SDQ Total 126 9 (7%) 33 (26%) 84 (67%) 18 1 (6%) 4 (22%) 13 (72%) SSP Tactile 116 57 (49%) 28 (24%) 31 (27%) 18 3 (17%) 6 (33%) 9 (50%) SSP Taste 116 79 (68%) 7 (6%) 30 (26%) 18 8 (44%) 0 (0%) 10 (56%) SSP Movement 117 79 (68%) 10 (9%) 28 (24%) 18 9 (50%) 4 (22%) 5 (28%) SSP Seeks Sensation 117 18 (15%) 20 (17%) 79 (68%) 18 1 (6%) 2 (11%) 15 (83%) SSP Auditory 115 17 (15%) 20 (17%) 78 (68%) 18 1 (6%) 3 (17%) 14 (78) SSP Low Energy 115 71 (62%) 11 (10%) 33 (29%) 18 9 (50%) 2 (11%) 7 (39%) SSP Visual / Auditory 115 73 (63%) 21 (18%) 21 (18%) 18 6 (33%) 3 (17%) 9 (50%) SSP Total Score 113 38 (34%) 16 (14%) 59 (52%) 18 3 (17%) 2 (11%) 13 (72%) SC Auditory 126 31 (25%) 51(40%) 44 (35%) 18 5 (28%) 5 (28%) 8 (44%) SC Visual 126 44 (35%) 52 (41%) 30 (24%) 18 8 (44%) 4 (22%) 6 (33%) SC Movement 126 23 (18%) 27(21%) 76 (60%) 18 4 (22%) 5 (28%) 9 (50%) SC Touch 126 29 (23%) 33 (26%) 64 (51%) 18 3 (17%) 4 (22%) 11 (61%) SC Sensory
Behaviour 126 25 (20%) 35 (28%) 66 (52%) 18 0 (0%) 4 (22%) 14 (68%)
SC Total Score 126 21 (17%) 52 (41%) 53 (42%) 18 2 (11%) 5 (27%) 11 (61%) SC Sensory Seeking
& Registration 126 27 (21%) 32 (25%) 67 (53%) 18 3 (17%) 7 (39%) 8 (44%)
SC Attention &
Awareness 126 56 (44%) 50 (40%) 20 (16%) 18 7 (39%) 8 (44%) 3 (17%)
SC Tolerance for
Sensory Input 126 30 (24%) 32 (25%) 64 (51%) 18 0 (0%) 6 (33%) 12 (67%)
SC Availability for
Learning 126 56 (44%) 29 (23%) 41 (33%) 18 5 (28%) 8 (44%) 5 (28%)
114

Chapter 5
Discussion 5.1 Issues of Terminology that Affect the Results
Before discussing specific areas of the results it is important that general issues
which relate to the interpretation of the results are highlighted and the terms used to
discuss sensory difficulties are clarified.
5.1.1 Distinction between Sensory Processing Disorder and Sensory Processing Difficulties.
Within the field of occupational therapy there is a prominent school of thought that
suggests that some children can be clearly identified as having a sensory
processing disorder either as part of or, in some cases, independently of any other
diagnoses (Miller, 2007). Outside the field of occupational therapy the identification
of sensory processing disorder as a stand alone diagnosis remains controversial
(Pollock, 2009). It is proposed that educational psychologists are unlikely to be
routinely instrumental in diagnosing children with a sensory processing disorder,
and so debates surrounding the existence of sensory processing disorder as an
independent diagnosis and the efficacy of sensory integration therapy are not the
focus of this study.
However, there is evidence to show that certain children experience difficulties in
the way that they process sensory information compared to typical children for
example, Parush et al., 2007; McIntosh et al., 1999; Davies & Gavin, 2007;
Tomchek & Dunn, 2007; Baranek, 2002; Ermer & Dunn, 1998; Dawson & Watling,
2000; Watling, Deitz & White, 2001; Franklin et al., 2008; Mangeot et al. 2001;
Rogers et al., 2003; Ahn et al., 2004; and Ben-Sasson et al., 2009. In addition
sensory difficulties are so well recognised in relation to Autistic Spectrum Disorders
(e.g. Tomchek & Dunn, 2007; Branek, 2002; Ermer & Dunn, 1998; Dawson &
Watling, 2000; and Watling, Deitz & White, 2001) that sensory sensitivities were
included as a diagnostic feature of ASD in the draft version of DSM V. The draft
version has now been withdrawn prior to DSM V being published in May 2013.
115

This study has attempted to add to the presently limited evidence base relating to
sensory processing difficulties and to raise awareness of sensory issues within the
field of educational psychology where they have been neglected in peer reviewed
literature. In addition the intention has been to move beyond the known links
between sensory processing difficulties and diagnoses such as ASD to see whether
an awareness of sensory processing difficulties may be relevant when supporting
certain children with BESD. This research has focused on sensory issues that were
observed in BESD children at the time of data collection. No attempt has been
made to formally label any children with sensory processing disorder on the basis of
data collected in this study.
The distinction between the terms sensory processing disorder and sensory
processing difficulties is critical to this research for a number of reasons as follows.
The existence of sensory processing disorder as a discrete diagnosis remains
controversial (Pollock, 2009), whereas observations that a proportion of children
experience sensory difficulties is increasingly well documented (for example Parush
et al., 2007; McIntosh et al., 1999; Davies & Gavin, 2007; Tomchek & Dunn, 2007;
Baranek, 2002; Ermer & Dunn, 1998; Dawson & Watling, 2000; Watling, Deitz &
White, 2001; Franklin et al., 2008; Mangeot et al. 2001; Rogers et al., 2003; Ahn et
al., 2004; and Ben-Sasson et al., 2009) Sensory processing disorder is usually
identified by occupational therapists with specialist training in sensory integration
(Dunn, 1999; Kinnealey & Miller, 1993) and training in the use of assessments such
as the Sensory Integration and Praxis Test. According to Miller (2007) the
overarching term sensory processing disorder includes sensory based motor
disorders. It is suggested that detailed assessment and diagnosis of motor disorders
and sensory processing disorders are usually beyond the expertise of educational
psychologists. As stated by Dunn (2006),
‘Occupational therapists have expertise in sensory processing as part of
their professional preparation. Other professionals such as speech-language
pathologists, psychologists, or educators can acquire this expertise through
post-professional education’ (p4).
The researcher undertook additional training in order to have the necessary
expertise to interpret the results of the sensory measures in this study. Hence, it is
proposed that with training and through the use of structured screening
questionnaires (such as the Sensory Profile or the Sensory Processing Measure) it
116

is possible for educational psychologists to develop awareness that there may be a
sensory basis to some children’s behaviour and to identify that a child may be
displaying some sensory difficulties. In particular, difficulties in sensory modulation
(where children find it hard to regulate their levels of alertness and their responses
to sensations) might be considered of particular interest to psychologists. This is
due to the suggested links between sensory and emotional regulation, which may
affect children’s behaviour, attention and social skills (Bhreathnach, 2008; Ben-
Sasson, et al. 2009). Hence, the focus of this study has been on sensory
modulation rather than more physical difficulties such as sensory motor problems. If
a psychologist were to find that a child’s sensory difficulties were significant and
interfering with the child’s daily functioning, then it is suggested that an outcome of
the educational psychologist’s involvement might be to engage the occupational
therapy service for further support and assessment.
The term sensory processing disorder is also deliberately not used to discuss the
data collected in this study, because it implies that the child has a life long, within
child deficiency, which may be the case for some children. However, it does not
take into account the many environmental factors that may impact on the way that
children respond to sensory stimuli. It has been found that BESD is affected by a
range of environmental factors (Jull, 2008; Rush & Harrison, 2008; Meltzer et al.,
2000). It is tentatively proposed that it is possible for some children to have acquired
temporary sensory difficulties. For example, a child in a heightened state of anxiety
due to emotional distress, may display lack of tolerance for sensory input and be
easily overwhelmed in highly stimulating environments. It is suggested that in such
situations, labelling the child with a sensory processing disorder would not be
helpful, but recognising that he/she is experiencing some difficulties tolerating
particular sensory inputs due to high anxiety, may help teachers to make the child’s
environment more tolerable until his/her emotional issues have resolved.
Another reason why a clear distinction between sensory processing disorder and
sensory processing difficulties has been made is due to the use of screening
questionnaires such as the Short Sensory Profile in research investigating sensory
processing disorder. A number of research studies have exclusively used the short
sensory profile as a measure of sensory processing disorder. It seems bold to use
data generated by a screening questionnaire as evidence of sensory processing
disorders and so throughout this study, research that relies on screening
questionnaires for diagnosis is more cautiously discussed as providing evidence of
117

sensory processing difficulties rather than evidence of a formal diagnosis. However,
due to evidence supporting the construct validity of the Short Sensory Profile (Dunn,
1999; Davies & Gavin, 2007) it seems reasonable to suggest that the Short Sensory
Profile is a useful tool in identifying children who have been rated as having sensory
difficulties compared with typical children. Please see sections 3.1.3a and 5.4.3 for
further information.
5.2 Demographics 5.2.1 Gender It is immediately striking that 82% of the participants were boys, which is a clear
indication that teachers consider many more boys to have BESD than girls. It has
been suggested that boys display more externalising behaviours whereas girls are
more prone to internalising behaviours (Layard & Dunn, 2009; Rothon et al., 2010)
which are less apparent in the classroom. The behaviours displayed by many boys
(e.g. aggression, defiance, overactivity) are very troublesome to teachers, disruptive
to the class and hence immediately obvious. Therefore, it is possible that BESD in
girls is underreported due to boys’ difficulties being much more apparent. This may
explain why only 27% of the sample was rated as having ‘Emotional Difficulties’
whereas 51% were rated as having ‘Conduct Difficulties’ and 74% as having
‘Hyperactivity’; both of which tend to disrupt classes with the result that such
difficulties are immediately evident to teachers.
Although there was no significant difference between SPDs for boys and girls on the
parental rating, teachers rated that boys (48%) were significantly more likely to have
SPDs than girls (27%). These figures may indicate that SPDs are more prevalent in
boys compared to girls in this sample. Alternatively, incidence of SPDs may be
similar as indicated by parental reports, but teachers have tended to focus more on
the disruptive behaviours that are seen more commonly in boys.
On the other hand, it should be considered that the education system may provide
particular challenges for a significant number of boys, who find it difficult to manage
their behaviour in school. For example, several studies have found that many
children are not engaging in the minimum recommended requirement for physical
activity in school (e.g. Cardon & De Bourdeaudhuij, 2008; Tucker, 2008; Metcalf et
118

al., 2008 and Nettlefold, 2011). Although physical activity levels for children have
been found to be low, boys have been found to be more active than girls (e.g.
Nettlefold et al., 2011; Rothon et al., 2010, Lopes et al., 2011 & Metcalf et al., 2008).
Perhaps girls are better at coping in a society with fewer physical demands as
suggested by Metcalf et al. (2008). Children have been found to spend up to 85% of
their day engaged in sedentary activities (Cardon & De Bourdeaudhuij, 2008) and it
is possible that some boys find it difficult to manage their behaviour in such
sedentary conditions. There is some evidence to show that increased levels of
physical activity is associated with a reduction in mental health issues (Rothon et
al., 2010 and Lopes et al., 2011) and with improved behaviour and academic
achievement (Trudeau & Shepherd, 2008) which suggests that an awareness of
children’s physiological needs may be relevant when supporting BESD in schools.
Due to the predominance of boys in this sample it has been decided to refer to
children as ‘he’ rather than ‘he/she’ for ease of reading in this discussion.
5.2.2 Age
Considering that this study involved relatively small numbers of participants it is
possible that the differences in numbers of children nominated from each year
group occurred by chance; however a possible pattern is discernible. It may be that
few children were nominated in Reception because teachers felt that they did not
know the children well enough to judge whether they had persistent BESD or
whether they just needed time to adjust to school education. However, by Year 1
schools may be more likely to have identified which individuals demonstrated more
persistent difficulties. In addition the curriculum becomes more formal and many
children who had coped with the high level of play activities in Reception may find it
more difficult to conform with the more formal teaching style frequently adopted in
Year 1. This may account for the high levels of referrals (n= 29) in Year 1. Referrals
for BESD were steady for Years 2, 3 and 4 but increased in Year 5 (n= 34). Only 12
children in year 6 were included in the research but this was due to the age
restrictions of the SSP, which meant that any Year 6 pupils who had turned 11
years were not eligible to take part. SENCos repeatedly requested that 11 year old
pupils be included in the research; indicating that, if they could have participated,
there would have probably been a bulge of referrals in Year 5 & 6. This may reflect
a trend towards certain behavioural difficulties becoming more entrenched and more
prevalent as children move towards adolescence as found by Beaman et al. (2007).
119

Research has found that the ability to respond appropriately to sensory stimuli in
typical children seems to improve with age (Davies & Gavin, 2007). However, this
was not found to be the case for children with SPDs. Similar results were found in
this study, in that the prevalence of SPDs was not found to be lower in older
children.
5.2.3 Socioeconomic Status
The results show that participants were drawn from a variety of schools with 29%
attending the most affluent schools and 27% attending the most deprived. However,
no data were collected about the socioeconomic status of each child because
recruiting parents to the study was a sensitive task and it was felt that questions
about a family’s financial situation may have deterred parental participation. As a
result, it is not possible to know whether the sample was representative of ‘typical’
BESD children. There is considerable evidence that BESD is associated with low
socioeconomic status (Washbrook & Waldfogel, 2011; Griggs & Walker, 2008;
Goodman & Greg, 2010). Hence, it is reasonable to assume that a significant
proportion of children in this study were from lower income groups. This assumption
is supported by the fact that in the special school for BESD, 86% of the children
were eligible for free school meals. This suggests that it is likely that many of the
participants are from low income households. SPDs have been associated with
severe deprivation (Cermak & Daunhauer, 1997; and Fries et al., 2005). Ben-
Sasson et al. (2009) present several suggestions for why SOR may be more
prevalent in children from low income households,
‘One possibility is that a low socioeconomic environment may consist of cluttered, intense and uncontrolled input (e.g. more people in a smaller space, loud noises), thus a child with a predisposition for SOR may be more challenged by such an environment. Another possibility is that the impact of the environment on the presentation of SOR occurs prenatally…It is also possible that parents of lower SES [socioeconomic status] report more sensations that bother their child due to their own elevated stress’ (p 714).
Ben-Sasson et al. (2009) suggest that mothers from low income families are more
likely to experience stress in pregnancy, abuse alcohol / drugs and experience
violence than other mothers, which may in turn affect the sensory processing of the
baby.
120

5.3 Prevalence Shown by the Total SSP & SC Scores
Limitations with the sample have been noted in Chapter 3, as has the use of a
screening questionnaire to identify SPDs rather than detailed assessment by an
occupational therapist. In addition the total score for the SC has been created for
this study through summing the scores of the individual sections. The Total Score
for the SC was not tested for reliability and validity during the development of the
SC and so the results referring to the Total SC Score should be treated with caution.
The results of the Total Scores on the SSP and SC show that parents rated that
55% of BESD children had sensory difficulties and schools rated that 44% showed
sensory difficulties in school. On initial examination, it appears that these results
clearly indicate that SPDs are relevant to approximately half the children in this
BESD sample. In addition teachers rated that another 39% of the sample had
‘probable’ SPDs, hence 83% of the sample were rated as having SPDs or probable
SPDs by teachers. These results suggest that it may be important for school staff to
be aware of the potential sensory source of some behaviour in schools. It is
acknowledged that for many pupils with BESDs sensory issues may not be relevant,
but it is proposed that routine screening or assessment for sensory issues may be
beneficial when planning interventions for BESD children. Considering the number
of participants who have been rated as having sensory difficulties in this study, in
addition to evidence demonstrating sensory difficulties for children with diagnoses
such as ASD (eg. Tomchek & Dunn, 2007; Dawson & Watling, 2000 and Baranek,
2002) and Foetal Alcohol Syndrome (Franklin et al., 2008), it is also reasonable to
suggest that it may be helpful to raise awareness of sensory processing among
teachers. This is emphasised by the responses to the SENCo questionnaire, where
71% of SENCos felt that teachers and teaching assistants did not know how to
identify and support sensory processing difficulties.
5.3.1 SPDs Prevalence for BESD Children Compared with Previous Research
The results for prevalence of SPDs among pupils with BESD are significantly higher
than has been found within the general population. There is a low prevalence for
children who have been screened for other developmental difficulties as shown by
Tomchek & Dunn (2007) where only 3.2% of children were found to have a ‘definite
difference’ on the SSP. Similarly, Ahn et al. (2004) found that from 5-13% of
121

children entering school had SPDs and Ben-Sasson et al. (2009) found that a
slightly higher level of 16% of children experienced SOR. The parental score on the
SSP in this study shows that 55% of BESD pupils were rated as having SPDs,
which is considerably higher than has been found in the general population.
The rate of SPDs in this BESD sample is lower than has been found for children
with clinical diagnoses. For example, the following percentages of children have
been found to have SPD: 86% of ASD pupils (Tomchek & Dunn, 2007); 73% with
Fragile X Syndrome (Baranek et al., 2002); 73% of children with Foetal Alcohol
Syndrome (Franklin et al., 2008); and 69% of ADHD children were found to have
tactile defensiveness (Parush et al., 2007). It is probable that SPDs are particularly
associated with the diagnoses listed above. A few children in the current study had
other diagnoses, but the numbers were small. For example 9-10 participants had an
ASD diagnosis; 8-9 had an ADHD diagnosis and 4 children had a diagnosis of DCD.
Hence, the majority of the participants did not have diagnoses that are commonly
associated with SPDs. This indicates that this research may have identified a
sizable group of pupils with possible sensory difficulties that has until now been
largely overlooked. It is likely that several participants had developmental difficulties
that were undiagnosed at the time of data collection. Indeed seven participants
indicated that the child was thought to be on the autistic spectrum, but was awaiting
diagnosis. This is predictable as the local authority had long waiting lists for formal
assessment of ASD.
The data indicate that SPDs may be impacting on the behaviour of approximately
half the children in this study. It is possible that some children have been identified
as having BESD due to their sensory needs, which makes it difficult for the child to
attend, sit still and tolerate the school environment. Alternatively, some children may
have significant emotional, social or conduct difficulties which have led to them
developing unusual ways of responding to the world. It is not possible to predict
causality from these data, although a number of studies have reported behavioural
difficulties in children with SPDs (e.g. Ben-Sasson et al., 2009; Barnhart et al., 2003;
and Franklin et al., 2008). Equally there is evidence that children who have suffered
trauma and severe emotional neglect may develop SPDs (Cermak & Daunhauer,
1997; and Fries et al, 2005).
122

5.4 The Pattern of Difficulties on the SSP and SC Sections
5.4.1 SSP Section Comparison
While the total scores for the SSP and the SC seem to present a clear picture of the
situation, it should be noted that the Total Scores include information taken from a
number of different sensory Sections. The number of participants rated as having
difficulties in each area varied significantly. Parents rated that between 24-30% of
children had difficulties in five of the seven SSP Sections. However, 69% of children
were rated as having difficulties with ‘Auditory Filtering’ and 70% as having
difficulties with ‘Seeks Sensation’. Analysis of the responses to individual questions
on these two sections indicates common themes of poor attention skills, high activity
levels and children who are prone to distractions. Very similar themes were found
when teacher responses to individual questions were analysed. This high level of
parental ratings for difficulties with attention and overactivity may reflect parents’
feelings that their children do not listen to them or do as they are told. This may be
an accurate observation of their children’s behaviour or their views may be
influenced by the common perception that children’s current behaviour is worse
than it used to be (Steer, 2009).
Similar patterns of difficulty were found using the SSP by Ashburner, Ziviani &
Rodger (2008) who investigated SPDs and educational outcomes for ASD children.
The authors concluded that children who had difficulties with auditory filtering and
sensory seeking were more likely to underachieve academically. These sensory
difficulties were commonly observed in the BESD sample. Hence, it would be
interesting to extend the current research to investigate whether BESD children with
these difficulties are also observed to underachieve at school.
Mangeot et al. (2001) reported some relevant correlations when investigating
sensory modulation difficulties in ADHD children. It was found that aggressive
behaviour was highly correlated with children who had difficulties on the ‘Seeks
Sensation’ and ‘Tactile’ Sections on the SSP. The ‘Seeks Sensation’ subtest was
also found to highly correlate with measures of delinquent behaviour. The results of
this study also showed a significant relationship between ‘Conduct Problems’ on the
SDQ and ‘Seeks Sensations’ on the SSP. This is persuasive evidence that
difficulties with sensory seeking are a common difficulty among BESD children in
123

this study and that these children’s sensory needs should be considered when
supporting their behaviour in school. Mangeot et al. (2001) state:
‘As there are numerous behavioural similarities between symptoms of ADHD and SMD, we hypothesized that a subgroup of children with ADHD has a disabling sensitivity to sensory stimuli, not previously discussed in the literature. This finding could have implications for treatment of such a subgroup of children with ADHD’ (p 403).
For educational professionals who may have reservations about the medication of
children viewed as being hyperactive in school, sensory strategies may present a
promising alternative.
5.4.2 SC Section Comparison
Like the SSP, similar variety was found between different Sections on the SC. For
example only 25% of children were rated as having visual difficulties whereas over
50% were rated as having difficulties with touch, movement and sensory behaviour.
On the School Factors over 50% of children were rated as having difficulties with
sensory seeking and with tolerating sensory input, whereas only 16% had difficulties
with attention and awareness. These results indicate that a large number of children
have been rated as ‘frequently’ or ‘always’ displaying certain behaviours on the
sensory profile measures. However it is possible that some of the difficulties
recorded on the sensory profiles reflect the behavioural difficulties that the child is
having rather than being the result of a sensory cause. For example, 56% of
children were rated as having difficulties with the ‘Classroom Behaviors’ Section on
the SC. Teachers’ responses on the SC indicated that some of the most common
difficulties included inefficiency, frustration, lack of cooperation, inflexibility and
problems coping with changes in routine. Such observations would be
commonplace for some BESD pupils, which raises the question whether the SC
‘Classroom Behaviors’ section is effectively measuring SPDs or whether children
were rated as having sensory difficulties due to certain questions that relate to their
BESD. Of course it could be argued that the observed behaviours in many of these
children are the result of sensory needs. Alternatively behaviours such as fidgeting,
stubbornness and frustration may stem from a number of other causes such as
boredom emotional distress, lack of respect for authority or poor motivation.
124

5.4.3 Examination of the Construct Validity of the SSP & SC in light of observed similarities between behaviours associated with SPDs and BESD.
As mentioned above there may be considerable overlap between behaviours that
stem from sensory difficulties and behaviours commonly seen in BESD children who
do not necessarily have sensory difficulties. Hence, one has to ask whether the
SSP and SC are actually measuring a distinct difficulty or simply describing
behaviours common in children with BESD.
The title of the SC ‘Classroom Behaviors’ section could give rise to an assumption
that there is considerable overlap between this section and the SDQ, the measure
for BESD in this study. However, there is only one item on the SDQ Conduct scale
that has similar content to an item on the SC behaviour scale. No SSP or SC items
overlap with the content of the SDQ Emotional, Peer Problems or Pro-Social scales.
The only area of commonality is found on the SDQ hyperactivity scale where one
question has similar content to an SC item and one question has similar content to a
question contained in both the SC and SSP. Hence, examination of the individual
statements included in the SDQ, SC and SSP indicates only a small overlap in the
content of the BESD and sensory measures. This adds weight to the suggestion
that it is unlikely that the sensory measures are simply providing a measure of
BESD. Although there is considerable overlap between behaviours seen in BESD
children and those with SPDs, the SSP and SC focus on examining ‘direct sensory
events’ (Dunn, 1999, p 59) rather than reporting behaviour that may be a
consequence of SPDs or indeed may have a number of other causes.
The SSP is reported to have excellent reliability and validity (Ahn et al., 2004),
which indicates that it’s scores are consistent and that there is evidence that the
questionnaire measures the constructs that it purports to measure. Of particular
relevance to this study is the fact that, during the development of the SSP, all the
items relating to social and emotional behaviours were removed in order to ensure
that the SSP reported on ‘direct sensory events’ (Dunn, 1999, p 59) rather than on
behaviours that are a product of sensory modulation difficulties. Hence, in the
current study 55% of parents rated their children had difficulties on the SSP, despite
the fact that the questionnaire does not include any questions relating directly to
social and emotional behaviours. This indicates that it is unlikely that the SSP is
simply measuring behaviours associated with BESD.
125

Indeed, if the SSP and SC simply provided a measure of BESD it would be
expected that nearly all the children rated as having difficulties on the SDQ would
also be rated as having difficulties on the SC and SSP. However, this has not been
the case as, of the children who were rated as having total difficulties on the SDQ,
only 50% were rated as having difficulties on the SSP and 53% were rated as
having difficulties on the SC. This implies that there may be two distinct groups
within this BESD sample, those with and those without SPDs. This is in line with
other research findings. For example, Parush et al. (2007) found that 69% of a
sample of boys with ADHD also met the criteria for tactile defensiveness, which is a
sub category of sensory modulation difficulties. The tactile defensive children were
distinguishable from both the control group and the ADHD children (who were not
tactile defensive) by higher central somatosensory evoked potential amplitudes,
which is a direct measure of the child’s physiological reaction to small electrical
stimuli. Hence, Parush et al.’s findings suggest that a large percentage of children
with ADHD may have sensory issues. In addition, Parush et al. (2007)
demonstrated that abnormal sensory responses are evident and can be directly
measured in children who have been identified as having sensory modulation
difficulties through rating scales and individual assessment.
Similar results were found by Mangeot et al. (2001) who found that children with
ADHD displayed larger abnormalities in sensory modulation than controls both on
the SSP and on measures of electrodermal reactivity, indicating that the SSP is
effective in identifying sensory difficulties that are evident through direct
measurement of the child’s sensory responses. Like Parush et al. (2007), Mangeot
et al. (2001) found considerable variability in the sensory processing of children in
the ADHD group leading them to hypothesise that within the ADHD population two
distinct subgroups exist, those with sensory modulation difficulties and those without
‘This suggests that a group of children with ADHD may have normal physiological
reactions and behavioural responses to sensory stimuli, whereas another group
may be hyperreactive and overresponsive’ (Mangeot et al., 2001, p 404). The
current study tentatively supports the hypothesis that within the BESD population
there may be two distinct groups of children; those with SPDs and those without. If
this is the case, an understanding of SPDs would be valuable in ensuring
appropriate strategies are implemented to remediate the difficulties that the child is
experiencing at school.
126

It has been found that children who have been identified as having SPDs through
OT assessment can be effectively distinguished from children without SPDs through
directly measuring their physical responses to sensory stimuli (Parush et al., 2007;
McIntosh et al., 1999; Miller et al., 1999; and Davies & Gavin, 2007). Dunn reports
that it has been found that children who are found to have abnormal EDR
measurements scored significantly lower on the SSP which is strong evidence for
the construct validity of the SSP, i.e. that it actually measures the underlying
construct that it claims to measure. Dunn (1999) also found that the SSP could
effectively discriminate between typical children and those identified as having
sensory modulation difficulties through OT assessment, as children with sensory
modulation difficulties had significantly lower mean scores on all sections. This
supports the argument that the SSP does provide an effective measure of SPDs
and is not simply measuring behavioural difficulties. Unfortunately to date, no study
has examined the SC to establish a correlation between abnormal EDR
measurements and low scores on the SC.
Hence although it is acknowledged that the SSP and SC are imperfect measures of
SPDs, there is evidence that difficulties observed on the SSP are also evident
through direct measurement of children’s sensory responses to stimuli. This
suggests that the SSP is effective in identifying sensory difficulties and is not just
describing behaviours common in BESD children.
5.4.4 Comparison of Patterns of Difficulties for BESD and ASD children on the SSP
The data provided by the SSP on this study show a pattern of very similar difficulties
with the group of 281 ASD pupils assessed on the SSP by Tomchek & Dunn (2007).
The areas with the greatest reported difficulties were ‘Seeks Sensation’ followed by
‘Auditory Filtering’ for both the BESD pupils and ASD pupils in Tomchek & Dunn’s
study. Likewise on both studies, the greatest number of children was reported to
have difficulties in the same three areas; overactivity, attention and listening skills.
The table below shows that there are some differences between the two samples,
for example more ASD pupils are rated as having a higher level of difficulties on five
of the Sections and 84% are rated as having total difficulties compared with only
55% of the BESD population.
127

Table 28:
Percentage of BESD pupils with difficulties on the SSP in this study compared to ASD pupils in Tomchek & Dunn’s study (2007).
SSP Sections % of BESD pupils
with difficulties
(This study)
% of ASD pupils with
difficulties
(Tomcheck & Dunn)
Visual / Auditory Sensitivity 23% 44%
Movement Sensitivity 24% 23%
Taste / Smell Sensitivity 30% 54%
Low Energy / Weak 30% 23%
Tactile Sensitivity 30% 61%
Auditory Filtering
(Listening Skills) 69% 78%
Seeks Sensation 70% 86%
Short Sensory Profile Total Score 55% 84%
Hence although the data indicate that in general ASD pupils have more severe
sensory needs than BESD pupils, the most prevalent themes for both ASD & BESD
pupils are difficulties with attention, poor listening skills and overactivity.
5.5 Overactivity and Difficulties with Listening Skills
One thing that is clear from the results of this research is that the most common
BESD recorded in this sample was hyperactivity and large numbers of children were
observed on the sensory profile to have difficulties with overactivity and attention
problems. These difficulties were recurrent themes reported by Washbrook &
Waldfogel (2011) in a recent survey of school readiness, which concluded that
increasing numbers of infants are joining schools without the underlying attention
and concentration skills to enable effective learning.
128

5.5.1 Overactivity
A key concern rated by parents and teachers in this study is a high rate of
overactivity in BESD children. Overactivity is the most common behaviour difficulty
recorded on the SDQ for participants in this sample. 107 pupils were rated as
having difficulties with hyperactivity, although teachers recorded that only eight of
those pupils had an ADHD diagnosis. Concerns about hyperactivity in children have
flourished in recent decades as can be seen by the regular diagnosis of ADHD and
prescription of stimulant medication (Breggin, 2002). However, it is interesting to
note that overactivity is rated as being the most common difficulty on the SDQ in
this sample, whereas Meltzer et al.’s survey (2000), reported that only 1% of
children in the general population had hyperkinesis, whereas conduct and emotional
difficulties were found to be more prevalent. This possibly suggests that either
teachers particularly focus on over activity in the classroom, or perhaps there is
something specific about the school environment that creates overactivity in some
pupils.
It is possible that overactivity is a within-child problem that needs to be treated, but
there are several other possible explanations, such as high anxiety levels causing
restlessness. In this study 47 of the 107 children that were rated as being
hyperactive were also rated by teachers as being generally anxious. Associations
between SPDs and anxiety are discussed in section 5.7.2.
Some children may be rated as being hyperactive in school simply because their
current lifestyle does not meet their physiological requirements as energetic young
people. For example, as already discussed, many children are not receiving the
daily recommended amounts of physical activity (Cardon & De Bourdeaudhuij,
2008; Tucker, 2008; Metcalf et al., 2008 and Nettlefold, 2011). Hence, difficulties
with attention and overactivity may be partly a result of living in a technological age
(Palmer, 2006), in which children are rarely required to take any exercise for daily
survival needs and choose to spend a large percentage of their spare time (on
average in one sample 85%) enjoying sedentary pastimes (Cardon & De
Bourdeaudhuij, 2008). In addition, Bundy et al. (2009) suggest that in the current
climate of litigation and health and safety regulations, teachers have become risk
adverse and as a result children’s physical activities may lack challenge, which may
be contributing to the low levels of moderate to vigorous physical activity observed
for example by Nettlefold et al. (2011) during P.E. and playtime. McLaren et al.
129

(2011) indicate that low levels of physical activity are a cause for concern because
movement is important for optimal cognitive and communicative development.
Raine et al. (2002) found that children who sought out high levels of stimulation at 3
years old showed increased academic performance at 11 years old. If children are
not routinely engaging in challenging physical activity each day, it is perhaps
unsurprising that some individuals are restless and perceived to be hyperactive
when required to sit and attend in class. Lack of challenging physical activities also
suggests reduced sensory experiences and hence limited opportunities to develop
sensory integration, motor coordination and the ability to learn to regulate the body’s
levels of alertness (Dunn, 1999; Murray-Slutsky & Paris, 2005). This is particularly
concerning for children with low to moderate motor coordination because Lopes et
al. (2011) found that their levels of physical activity declined between the ages of 6-
10 years, indicating that the opportunities for challenging physical experiences for
children with moderate to poor motor coordination become even more limited at
they mature. So in this cultural context, teacher and parent observations that
children have difficulties with overactivity and attention are perhaps unsurprising.
It is possible that children have not become increasingly overactive, but that
society’s assumptions about what is typical in relation to activity levels have shifted
in recent years. It has been observed in the course of this study that categories
such as BESD are relative, depending on the school context and the same may be
true of overactivity. Children living in cramped surroundings present considerable
problems if they are very active (Ben-Sasson, 2009). A similar child living on a farm
would not only have regular opportunities for outdoor play, but his parents may
value high activity levels if he is needed to help with strenuous activities on the farm.
Hence, it is possible that parental concerns about overactivity in this study have
been emphasised because data collection took place in an urban environment with
several areas of deprivation.
Yet another explanation for some children is that they may be bored by education
and so their excessive movement may be a work avoidance strategy.
All these possible explanations for hyperactivity in school show that a number of
within child and environmental factors may contribute to observations of
hyperactivity in school. The results of this study indicate that for a proportion of
children in this sample, SPDs may be one of a number of factors that contribute to
the high levels of overactive behaviour.
130

5.5.2 Listening Skills
Parental observations about children’s hyperactivity and poor listening skills could
be due, for example, to poor boundary setting, irregular routines, or within-child
behaviour or sensory problems. On the other hand difficulties with listening skills
may be the consequence of the high levels of noise generated in urban
environments by traffic, music, television and busy schools etc. (Heller, 2003).
Flagg-Williams et al. (2011) propose that children find it particularly difficult to attend
in noisy environments because their language systems are immature and hence
they have more difficulty filling in the gaps in their understanding when part of an
utterance has not been clearly heard.
Wright et al., (2001) comment on the detrimental effect of television if children are
regularly exposed to programmes that are intended for adults. Such programmes
are unlikely to hold the interest of a young child, but may present considerable
background noise which may affect the child’s ability to attend to other activities
(Wright et al., 2001). It is also proposed that background noise involving language is
particularly distracting (Flagg-Williams et al., 2011) and very disruptive to working
memory (Gathercole & Alloway, 2009).
Flagg-Williams et al. (2011) also state that typical classrooms in the UK do not meet
recommended guidelines for background noise. This means that children have to
make considerable effort to accurately comprehend verbal information delivered in
class. The results of the current study suggest that 36% of the sample were rated as
having auditory difficulties at school and 69% were rated as having auditory
difficulties at home. Some of these children may have a within child difficulty relating
to the way in which they process auditory information as suggested by Dunn (1999).
However, Flag-Williams et al.’s observations suggest that children may acquire
problems with listening skills as a result of environmental influences. For example,
children who have to habitually struggle to attend against background noise may be
unable to sustain their attention and so become accustomed to ‘tuning out’.
131

5.6 Comparison of Sensory Difficulties Reported by Parents and Teachers
If a child has significant sensory problems it is expected that difficulties would be
evident in different settings (Murray-Slutsky & Paris, 2005). The results of this study
do indicate an association between parental ratings and school ratings, for example
there is a significant association between the Total Score on the SSP and Total
Score on the SC (χ²= 11.42 (1) p=.001) and significant associations between four of
the six comparable Sections on the SSP and SC. But there are many individual
cases where parents and schools have not concurred. There are a number of
possible reasons for this observation. Firstly, although many of the headings on
SSP and SC sections would indicate that a direct comparison could be drawn
between the two data sets, parents and teachers were asked different questions.
This is largely because the questionnaire was modified so as to be appropriate for
the different settings, as there are activities that would be routinely observed at
home but not at school and visa versa. The difference in the type of questions
between the SSP and the SC is most evident on the Movement section where the
SSP section focuses on vestibular sensitivity. However, the SC Movement section
investigates activity levels, clumsiness and the child’s participation in group games.
Unsurprisingly, there is no significant association between the SSP and SC
movement sections scores because they cover subtly different areas of concern.
Similar issues are found on the Visual sections which have only one question in
common between the two questionnaires. In addition the SSP does not have a
purely visual section but instead has a measure of visual and auditory sensitivity,
hence two of the five questions on the section relate to responses to auditory
stimuli. Again it is unsurprising that no association was found between the SSP and
SC Visual sections because different questions were asked on each questionnaire.
An alternative explanation for the discrepancy between parental and school scores
for individual children is that the child may be perceived to be behaving differently in
the two settings, as was proposed by Dunn (2006) when only moderate correlations
were found between the SC and the Sensory Profile. The reasons for this are likely
to vary for different cases, however it has been suggested (Murray-Slutsky & Paris,
2005; and Dunn, 2006) that often sensory difficulties become apparent when the
child starts school due to the additional demands of the school environment. It is
suggested that compared to most home environments, children in school are
132

expected to sit and attend quietly for long periods in order to do challenging
academic work. They have to work in very close proximity to a large number of
other children and have little choice about what they do and when, throughout the
school day. Some children cope well in a more fluid quiet home environment with
few other children to encounter (Dunn, 1999). Alternatively, some families are
chaotic and may live in bustling cramped accommodation where children are
endlessly in competition with siblings for attention and resources. In such situations
children’s sensory difficulties may come to the fore at home, whereas school may
present a more ordered and hence more tolerable environment for the child (Ben-
Sasson et al. (2009).
As has been noted with the SDQ in this study, rating questionnaires can be highly
subjective and disagreements between parents and schools may be due to different
perceptions of what is acceptable or problematic behaviour, which may result in
different ratings being provided for individual children. It cannot be ruled out that
parents or teachers may have had an agenda when completing the questionnaires,
which might have caused their responses to be an inaccurate representation of the
situation. For example, participants may exaggerate the child’s difficulties in the
hope that they might be provided with more support in managing the child.
Conversely, families may downplay a child’s needs because they may feel that
admitting to difficulties might reflect badly on the family.
The fact that there are numerous discrepancies between the results of individual
cases on the SSP and SC reinforces the fact that assessment of a child’s needs is a
complex business. It has been shown that parental observations are often not in line
with teacher’s observations in schools. This raises questions about the robustness
of data about the prevalence of SPDs for the many studies that have only used the
SSP as the measure of SPD, (Ahn et al., 2004; Baranek, 2002; Baranek et al.,
2002; Franklin et al., 2008; Gavin et al., 2011; Mangeot et al., 2001; Rogers et al.,
2003; and Tomchek & Dunn, 2007).
A strength of the current study is that the school data add weight to the parental
findings. Although the correlation between parental and school scores for individual
children was far from perfect, both school and parental data show prevalent themes
of concerns about listening skills, attention and overactivity for the sample as a
whole. The difficulties with overactivity are clearly evident on the SDQ scores where
74% of the sample were rated a being hyperactive and 59% of pupils were also
133

rated as having difficulties with Movement on the SC, showing that these concerns
are evident both at home and school.
5.7 Associations with Background Factors
The research aimed to see if there were associations between the prevalence of
SPDs and background factors that had been linked with SPDs in other research
such as ASD diagnosis (e.g. Tomchek & Dunn, 2007; Baranek, 2002; Ermer &
Dunn, 1998; Dawson & Watling, 2000; Watling et al., 2001), ADHD diagnosis (e.g.
Mangeot et al., 2001; Schilling et al., 2003; and Parush et al., 2007) and difficulties
during labour and delivery (May-Benson et al., 2009).
Only a few pupils with specific diagnoses were nominated for the research; hence, it
is not possible to extrapolate meaningful conclusions about associations when data
are only available for a handful of children. A significant relationship was found
between parental ASD diagnosis (n=10) and six sensory measures and also
between teacher ASD (n = 9) rating and 11 sensory measures (see Appendix 6).
This is in line with numerous other studies which have found a high level of sensory
difficulties in children with an ASD diagnosis (e.g. Crane et al., 2009; Kern et al.,
2006; Kern et al., 2007; and Liss et al., 2006), but no firm conclusions can be drawn
with such a small sample.
5.7.1 Parental Reports that the Child was a Fussy Baby 43 parents stated that their child was a ‘Fussy Baby’. There was a significant
relationship between the ‘Fussy Baby’ rating and seven of the eight parental
sensory measures; however only a few associations were evident on the SC. The
associations between SDPs and reports of children being ‘fussy’ babies are
important because they provide an indication that the sensory difficulties were likely
to have been present since birth. Although, it is possible that parents who are
currently struggling with a child’s behaviour may be prone to remembering the more
negative aspects of a child’s infancy and hence these parents may be more likely to
recall the child as being a fussy baby.
In cases where babies are seriously irritable, sensory processing theory suggests
that the link between SPDs and attachment difficulties may occur due to two
134

possible scenarios. In the first case, children who are born with SPDs may find
physical sensations provided by caregivers distressing and hence become upset
when handled. This in turn is disturbing for parents who may feel inadequate and
start to withdraw from the child. As a consequence, the parents and infant may not
form a secure bond (Bhreathnach, 2008). In such a scenario the child’s sensory
difficulties are exacerbated by the child’s dislike of sensory stimuli which leads him
to seek less engagement in the world and hence reduces the sensory and social
opportunities available to him (Murray-Slutsky & Paris, 2005). Alternatively, sensory
difficulties may be a consequence for children who have not experienced a secure
and loving attachment with a caregiver, possibly due to parental mental illness,
neglect, bereavement etc. In such situations it is proposed that lack of affection and
lack of general sensory stimulation combined with high levels of anxiety may cause
SPDs (Lin et al., 2005) due to children failing to learn to effectively regulate their
emotions and make appropriate responses to sensory inputs (Bhreathnach, 2008).
Encouragingly, there is evidence that severely neglected children often recover well
when placed in loving foster homes (Van den Dries et al., 2010).
5.7.2 Association between Reported Anxiety and SPDs
62 parents rated their child as being generally anxious. There was a significant
relationship between parental anxiety ratings and seven of the eight parental
sensory measures. However, like the findings for the ‘Fussy Baby’ category only a
few associations were evident on the SC.
The significant relationship found between anxiety and SPDs in this sample is
pertinent because high levels of anxiety can cause inappropriate fright, fight or flight
responses (Dunn, 1999; Gavin et al., 2011) and also interrupts the child’s ability to
concentrate on learning (Aronen, Vuontela, Steenari, Salmi & Carlson, 2005).
Children who are over-responsive or who have difficulties regulating their sensory
responses may perceive the world to be very intense and overwhelming and may
find sensations threatening that are usually considered to be innocuous by others
(Ben-Sasson et al., 2009). Such experiences lead to high levels of anxiety which in
turn may be translated into a range of problematic behaviour in school.
135
Children who are anxious may find it difficult to settle to tasks requiring high levels
of concentration, which may make them appear to be hyperactive (Schoen et al.,
(2009). Reports of high levels of hyperactivity in this sample have been discussed in
relation to children seeking high levels of sensory input. However, 40-47% of the
sample was rated as being anxious. It is suggested that some children in the
sample may appear overactive due to anxiety, which may cause them to perceive
everyday sensations as threatening (Gavin et al., 2011). It should be noted that
according to this argument it follows that some sensory difficulties (particularly
sensory over-responsivity) may be induced by environmental influences, rather than
stemming from a sensory dysfunction evident from birth.
Hence, observations of overactivity provide an example of how, according to
sensory processing theory, the same behaviour may be the consequence of very
different issues. It is suggested that a sensory seeking child may benefit from
increased levels of sensations for example through increased levels of physical
activity (Dunn, 1999). Whereas a highly anxious child may be experiencing sensory
overload and need to withdraw to a quieter environment (Ben-Sasson, 2009). It is
for this reason that it is proposed that for this sample an awareness of the child’s
possible sensory needs could be informative when supporting their behavioural
issues in school.
While the child’s anxiety (rated by the parent) was associated with many sensory
measures on the SSP, significant associations were only found on two of the
possible 9 sensory measures on the SC, indicating that teachers had often not
noted sensory difficulties in children who have been rated as anxious by their
parents. There was a significant association between the parental anxiety rating and
the teacher anxiety rating (p=.006) with parents and teachers agreeing on their
rating of 81 children. So, although many children were rated as being anxious both
at home and school, 49 children were only rated as being anxious in only one
setting. This suggests that for this sample there may be factors connected with
anxiety that are specific to a particular setting, for example, a noisy crowded
environment at school or perhaps a difficult relationship with a relative at home. It is
also possible that some children may endeavour to hide their anxiety from certain
adults and so apprehension may remain undetected. There was a close association
between the teacher anxiety rating and ‘Tolerance for Sensory Input’ (p<.001) and
‘Availability for Learning’ (p<.001), which are both School Factors on the SC. It is
important for schools to comprehend that this study tentatively indicates that some
136

anxious children may experience sensory overload at school which may lead to
outbursts or other unexpected behaviour as the child either panics or tries to
withdraw from a situation (Ben-Sasson, 2009). In addition the results of this study
suggest that some anxious children in this sample may not be able to focus on
learning because they are distracted by other worries, which may lead to task
failures in class and possible reprimands from school staff (Gathercole & Alloway,
2009).
5.8 Associations between SPDs and SDQ measures
The data were analysed to see if there was an association between the sensory
measures and the sub types of BESD as measured by the SDQ. Most notably there
was a significant association between difficulties in ‘Peer Relations’ and four SSP
measures and eight SC measures. The significance of difficulties with ‘Peer
Relations’ and Total measures on the SSP and SC was p<.001. This association is
surprising considering that the other social measure on the SDQ, ‘Pro-social
Behaviour’, had no significant associations with any of the sensory measures. This
indicates that there is a group of children in this sample who have been noted to be
typically helpful and kind in school but who have specific difficulties with peer
relations and many pupils in this group have also been rated as having sensory
difficulties both at home and at school. Links have also been drawn between social
competence and BESD (e.g. Hartnell, 2010 and Poulou, 2005) but this data also
suggests possible links with SDPs. Difficulties with social understanding and hence
peer relations are a common difficulty in children who experience ASD (Baranek,
2002). Hence, it is possible that this result further supports the evidence that a
number of previous studies have identified between ASD and SPDs.
The associations between poor peer relations and SPDs have been noted in other
studies for example Hilton et al. (2010) and Schaaf et al. (2010). Hilton et al. (2010)
found correlations between sensory responsiveness and severity of social
difficulties in children with high functioning autism. This indicates that the more
severe the child’s SPDs the greater the observed social difficulties. Interestingly
difficulties with taste / smell and touch were the most closely associated with social
difficulties (Hilton et al., 2010). The current study showed a significant association
for touch but not taste / smell, which may reflect the different pattern of difficulties
seen in ASD pupils compared to BESD pupils in this sample as discussed in section
137

5.4.4. It is easy to imagine how a person who is oversensitive to smell or touch
would prefer to avoid close contact with other people and hence would miss out on
a range of social opportunities. Such children may also be actively distressed by
unexpected touch arising from crowded situations and may overreact (Dunn, 1999),
which in turn will be confusing and possibly irritating to their peers. It should be
noted that 7% of children (n=9-10) in the current study were reported to have an
ASD diagnosis as well as BESD. So for these children difficulties with peer relations
and sensory difficulties would be expected.
The importance of good sensory modulation in enabling children to respond
appropriately during interactions is highlighted by Ben-Sasson et al. (2009) as
follows:
‘Taking a friend’s perspective, cooperating during a problem solving task,
and considering others’ emotional states are examples of adaptive social
behaviors. Regulated sensory responsivity is particularly important for
adaptive social behaviors as (1) social interaction requires a flexible
response to multiple, simultaneous, on going, and unpredictable input, and
(2) adequate sensory responsivity allows one to notice social cues and
respond positively to the input involved in social interactions (e.g. light touch,
loud voices) (p 707-8).
The SC measure ‘Availability for Learning’ showed significant associations with four
of the SDQ measures and a particularly significant association with emotional
difficulties (X² = 21.54 (1) p<.001). This may be because, as noted by Dyregrov
(2004), children who experience emotional difficulties are often preoccupied by their
worries and hence appear distracted in class and have difficulties focusing on
learning.
There were significant relationships between many of the SDQ measures and the
SC sensory processing measures. In particular children who were rated as having
overall BESD on the SDQ Total Score had a significant relationship on seven SC
sensory measures, indicating that children with more severe BESD were more likely
to be rated as also having sensory difficulties. Interestingly the only association
between total SDQ scores and SSP sensory measures was with the Movement
measure on the SSP (X² = 4.12 (1) p<.05), which indicates that sensory and Total
SDQ score associations for this sample were not observed at home.
138

5.9 Awareness of SPDs in the Field of Education
It is proposed that many BESD children have complex needs and their BESDs may
be caused by a variety of factors (Jull, 2008). There is no doubt that behaviour
management techniques such as firm boundaries & routines and consistent rewards
& sanctions may prove to be effective in supporting many children with BESD. The
SSP and SC are only able to measure sensory difficulties based on adults’
observations of the child’s behaviour and this is a subjective measure.
SPDs are most commonly assessed by occupational therapists. The data showed
that only 14-23% of participants had been assessed by an occupational therapist,
which is concerning considering between 44-55% of the pupils were rated as having
SPDs in this survey. The data indicate that it may be beneficial for occupational
therapists to have more involvement with the BESD children in this sample and to
liaise with school staff about supporting the needs of these children. However, in a
time of NHS and local authority cuts it may not be possible for occupational
therapists to further extend their services to include more children with BESD. As a
result, it is suggested that it would be pertinent to raise awareness of SPDs among
school staff so that teachers can consider a possible sensory basis for some of the
troublesome behaviours. This may help staff to perceive certain BESD children in a
more positive light rather than possibly concluding that the child is being deliberately
difficult. This is relevant because undesirable behaviour has been seen to generate
negative teacher attitudes towards the child (Kokkinos et al., 2004), which in turn
may impact on the child’s success at school (Willingham, 2009). Good emotional
bonds between teacher and pupil have been found to have an important impact on
the child’s motivation and success at school (Geving, 2008).
SPDs can be directly measured by Somatosensory Evoked Potentials and
Electroencephalography etc. but this requires considerable expertise and
sophisticated equipment that is not available to schools. Hence, while it is
acknowledged that the sensory profile has its limitations and was only intended as a
screening questionnaire it does provide a structure for supporting schools in starting
to consider possible sensory difficulties when planning how to assist children with
BESD. In the absence of other means of assessing children’s sensory needs it is
suggested that sensory questionnaires are useful. This study was not designed to
139

establish a causal link to indicate whether sensory issues are responsible for all or
part of a child’s BESD and it has been found that BESD children exhibit many
behaviours seen in children with SPDs. This indicates that challenging behaviours in
some children may stem from SPDs, whereas other children’s behaviours may have
a very different foundation. In order to successfully hypothesise about the cause of
particular children’s behaviour, professionals need to work closely with the child’s
family and school to collect background information and make detailed observations
about exactly which behaviours are considered problematic and how the child has
responded to intervention.
Sensory processing is a complex area because children may have difficulties in a
variety of sensory areas. Hence, two children with sensory difficulties may present
with very different concerns, for example if one child is over-sensitive to noise and
another is under-sensitive to touch and proprioception. In addition, sensory
processing theory suggests that children with sensory modulation difficulties
fluctuate in the way that they respond to sensory inputs (Dunn, 1999). This can
present a very complex pattern of behaviour for teachers to interpret as the child
may appear to be very overactive in some situations and sluggish at other times.
Hence, considerable specialist knowledge is required to assess and remediate
SPDs and it perhaps would not be reasonable to expect many class teachers to
acquire such knowledge. However a basic awareness of sensory issues would
enable class teachers to question whether a troublesome behaviour might have a
sensory cause and if appropriate request more specialist support from the school
SENCo, occupational therapist or educational psychologist.
The SENCo questionnaire provided brief information about SENCo’s level of
knowledge about SPDs. The results indicate that a large number of SENCos have a
poor understanding of terms associated with sensory processing, such as ‘Tactile
Defensiveness’ and the ‘Vestibular Sense’ (between 64-84% depending on the
terminology.) 38% of SENCOs in this sample felt that they could not confidently
identify behaviour that might have a sensory cause and 71% rated that teachers
and teaching assistants in their school did not know how to identify and support
pupils with sensory processing disorders. These scores indicate that SPDs are
poorly understood in the primary schools where the research took place. As a result,
it is cautiously suggested that certain members of school staff (e.g. SENCos) might
benefit from training on typical sensory processing, the associations between SPDs
140

and diagnoses such as ASD and foetal alcohol syndrome and also the potential link
for some children between sensory difficulties and BESDs.
It is proposed that it may be helpful to raise awareness among educational
psychologists about possible sensory difficulties that may impact on children’s
behaviour. This study suggests that an awareness of sensory difficulties may be
relevant to 44-55% of the BESD children in this sample. However, research
suggests (e.g. Ermer & Dunn, 1998 and Mangeot et al., 2001) that knowledge of
sensory difficulties would also aid educational psychologists who are supporting
children with a range of other difficulties such as ASD and ADHD. The lack of
research into sensory difficulties in the field of educational psychology and lack of
discussion of sensory processing difficulties in educational psychology peer
reviewed journals indicates that the evidence surrounding these issues is currently
being overlooked by the profession. Appropriately trained educational psychologists
would be well placed to support school staff in supporting children with SPDs,
ideally also in conjunction with occupational therapists. In this way it is hoped that
knowledge of SPDs (based on peer-reviewed research rather than on well marketed
interventions) may gradually penetrate further into the realm of education.
5.10 Limitations
The research design does not allow any conclusions to be drawn about the causes
of either the children’s sensory needs or their BESD. A number of other possible
limitations are discussed below.
5.10.1 Limited Number of Participants
Although every effort was made to include a large number of pupils in this study,
complete data was only achieved for 131 pupils. Considering the challenges in
engaging parents of BESD children, the number of participants should in some
respects be celebrated. The size of the study is certainly an improvement on some
of the very small scale studies that have explored sensory processing difficulties
(e.g. Schilling et al., 2003; and Schneider et al., 2008). However, considerably less
data were obtained for this study than other studies of prevalence in non-clinical
populations. For example, Ahn et al. (2004) obtained data from 703 parents and
1,039 families responded to Ben-Sasson et al.’s (2009) survey into the prevalence
141

of SOR. Hence, any generalisation of these results to other BESD children must be
undertaken with considerable caution.
5.10.2 Heterogeneous Sample
A common criticism of much SPDs research is that the samples are heterogeneous
groups of pupils with a wide range of difficulties and so it is difficult to draw
conclusions about patterns of need or effectiveness of interventions. It is
acknowledged that the inclusion criteria of this study resulted in a very disparate
sample with children displaying varied sensory needs but also a very wide range of
behavioural emotional and social difficulties, which may have stemmed from a large
combination of factors. However, a number of studies have investigated SPDs
within populations with specific diagnoses, whereas this research sought to examine
SPDs in pupils who had been observed as having BESDs in school despite not
necessarily having a diagnosis of any kind. While the research is unable to claim
causal links or make recommendations for individual children it has succeeded in
demonstrating that SPDs may be applicable to 44-55% of the BESD sample.
5.10.3 Measures of SPDs
It has been acknowledged that the SSP and SC are only brief screening
questionnaires and that a more thorough assessment of each child’s sensory needs
would have been desirable. As stated by Dunn (2006) the sensory profile
questionnaires were intended to be combined with other ‘evaluations, observations
and reports’ (p1) to form a comprehensive assessment of a student’s needs. Hence
the use of screening questionnaire’s to identify a difficulty may result in inaccuracies
in the identification of sensory difficulties in some children, compared to an
individual assessment. However, as has been discussed in section 3.1.3.a and
5.4.3 the SSP has been validated against samples where SPDs have been
identified by individual assessment and direct measures of sensory responses,
which suggests good construct validity and that the data provided by the SSP does
provide an indication of the prevalence of sensory processing difficulties in this
sample. However, no studies have validated the SC against direct measures of
sensory responses or against samples where SPDs were measured by individual
assessment. This means that the data provided by the SC may be less valid than
those provided by the SSP, although there is currently no published data that would
enable a comparison between the validity of the SSP and SC to be drawn.
142

Conversely, an advantage of the SC is that it was standardised more recently than
the other questionnaires meaning that the standardisation may be a more accurate
representation of current children compared to the SSP and SDQ which were
standardised on samples 12 or more years ago. Dunn (2006) reports that the SC
only shows moderate correlations with results from the full Sensory Profile
Caregiver Questionnaire (a longer version of the SSP). She states that a moderate
correlation is to be expected because children’s sensory responses will vary for
environmental reasons in different settings. While the suggestion that environmental
influences may affect the way in which children process sensory information is
supported in the discussion of this study, it is possible that only moderate
correlations were found due to issues with the validity of the SC. This issue can not
be resolved until further studies are conducted to validate the SC against other
measures of SPDs.
An advantage of using the SSP is that it has been used in many previous studies
and hence it is possible to directly compare the results between studies such as
Tomchek & Dunn (2007). However, it has been found that the SSP and SC are
problematic measures when it comes to directly comparing parental and teacher
responses. In addition, in order for comparisons to be made, an SC Total Score was
created, which evidently has not been party to the SC tests of reliability and validity
during the development of the SC. Hence any conclusions drawn from the SC Total
score can only be tentative. Comparison between parental and school responses
might have been easier if the Sensory Processing Measure (SPM) had been used
as the measure of sensory processing. The SPM has the same seven sensory
sections for both parents and teachers, and both questionnaires can be summed to
provide a total score. In addition, the parental form is longer (75 questions) than the
SSP and hence provides more detailed information without being as lengthy as the
full sensory profile (125 questions). At the time of data collection the SMP was only
available in America and would have been prohibitively expensive for this study, but
it presents a promising tool that should be considered for future research.
5.10.4 Identification of BESD
A major drawback of the research was that, with the exception of the 29 children
nominated by the PBST and the 18 children from the BESD special school, teachers
were relied upon to nominate children for the study by simply picking out children
143

that they felt had BESD. In discussing the research with different schools it soon
became clear that teachers had very different assumptions about what was BESD
and what was not. For example, schools with few challenging pupils may have rated
a child as having severe BESD on the SDQ questionnaire, but if that same child
was in a different school which had a high number of pupils with significant needs
the child’s behaviour may not have been considered a cause for concern. Hence,
the inclusion of children in the study was a very subjective process. The
discrepancies between schools were most clear when discussing participants from
the specialist BESD school. A number of participants from this school were
excluded from the research because teachers rated that they did not have BESD
and yet they were attending the special school due to persistent, severe concerns
with BESD. The issue was raised with the SENCo who agreed that all the children
in the school had BESD, but that the behaviour of some pupils was so extreme that
other children’s difficulties seemed inconsequential by comparison. Hence although
the SDQ provided a standard measure of BESD for all children and was completed
by an adult that knew the child well, it is clear that the teachers’ assumptions about
BESD varied considerably from one school to another, meaning that the inclusion
measure in the study was highly subjective and variable.
The cut-off set by the authors of the SDQ to identify children with BESD was more
liberal than the cut-off set by the authors of the SSP and SC. This suggests that the
SDQ criteria for ‘Abnormal’ is a broader category than the cut-offs set by the
sensory measures. This may have allowed children with fairly mild BESD to be
included in the sample.
Schools regularly reported that pupils with the most severe BESD were not included
in the study, either because the parents did not return the consent forms or because
the relationship with the parent was so fragile that it was not appropriate to invite
them to take part in the research. Hence, this study includes 7% of children whose
total BESD difficulties score on the SDQ was normal, 26% whose scores were
borderline and only 67% were rated as having overall difficulties with BESD. It could
be argued that the inclusion criteria was not rigorous enough, however the decision
to include pupils with BESD in only one area (e.g. emotional difficulties) has enabled
an analysis of sensory needs of children who specifically have difficulties with
social, emotional or behavioural difficulties rather than just examining children with
difficulties in all three areas.
144

5.10.5 Change of Descriptive Terms on the Standardised Measures
As highlighted in section 3.6.1 the descriptive terms of the standardised measures
were altered to aid ease of reading and reporting of the results. Hence the SDQ
category ‘Abnormal’ and the SSP & SC categories ‘Definite Difference’ were all give
the same term ‘Difficulties’. However, this change in terminology may be taken to
imply that the ‘Difficulties’ and ‘Probable Difficulties’ categories are calculated using
the same cut-offs on the SDQ, SSP and SC. It is acknowledged that this is not the
case as the SDQ cut-off is more liberal than the sensory measures and so the use
of the same terms on all the measures could be misleading. In addition terms such
as ‘definite difference’ were selected during the development of the SSP and SC as
a meaningful description of certain children’s scores based on Dunn’s model of
sensory processing. Altering the terminology runs the risk of subtly changing the
implied needs of children in each category in readers’ minds.
5.10.6 Background Factors
There was an intention to investigate whether associations were found between
SPDs and other clinical diagnoses, as has been found in previous research.
However, only a very small number of children were rated as having many of the
background difficulties, hence the statistical base was so small that no firm
conclusions could be drawn when exploring associations between factors. As the
main intention of the study was to focus on pupils displaying difficulties at school but
without a clinical diagnosis, it appears that attempting to investigate the needs of
those with diagnoses was unnecessary. However, collecting data on other
diagnoses enabled the confirmation that the majority of participants did not have a
diagnosis that is commonly associated with SPDs (e.g. ASD, ADHD).
It would have been interesting to investigate the links between children with an
ADHD diagnosis with movement and sensory seeking difficulties on the SC.
However, no significant relationship was found between these factors and only eight
pupils were identified by teachers as having an ADHD diagnosis. Unfortunately, the
study did not record how many of these pupils were taking stimulant medication, as
the medication may have significantly modified their behaviour.
145

In addition to adding to the pool of knowledge about SPDs this study has raised a
number of questions that would benefit from future research. These are discussed
in the final chapter.
146

Chapter 6
Conclusions
6.1 The Impact of the Results on Sensory Processing Theory
Current literature suggests that the theory of sensory processing is not without
controversy. While there is increasing evidence that SPDs are a reality for certain
children (e.g. Parush et al., 2007; McIntosh et al., 1999; and Davies & Gavin, 2007),
Sensory Processing Disorder is not yet recognised as an independent disorder in
DSM-IV and the literature review indicates that there is a lack of research into SPDs
in the UK. There is increasing evidence that SPDs are associated with specific
diagnoses, in particular ASD (e.g. Ermer & Dunn, 1998; and Dawson & Watling,
2000), but the results from this study suggest that understanding of SPDs in
mainstream schools remains limited, as is shown by the results of the SENCo
questionnaire. This research may raise awareness of possible SPDs in the BESD
population at school. The results are in line with previous research that has noted
that a proportion of children with SPDs also experience BESD (Ben-Sasson et al.,
2009; Goldsmith et al., 2006; Hilton et al., 2007; and Franklin et al., 2008). This
study also supports the suggestion that not all children with BESD experience
SPDs; rather it is cautiously proposed that within this BESD sample it is possible to
distinguish a subgroup of children with SPDs. Previous research has focused on
children already identified as having SPDs or another diagnosis with behaviour
difficulties being seen as a consequence. This study has sought to focus on
observed behavioural emotional or social difficulties at school and has found that a
large subgroup of the BESD sample may also have SPDs, as was found in previous
studies of children with ADHD (Mangeot et al., 2001 and Parush et al. 2007).
The fact that the results of this survey suggest a high level of sensory difficulties in
children with BESD compared with typical children, adds weight to the theory of
sensory processing, by showing that some children are reported to respond to
sensations differently compared with typical children. However, these results do not
suggest causality beyond the observation of a number of factors that appear to be
associated the SPDs such as anxiety and difficulties with peer relations. It is
cautiously proposed that rather than always being a ‘within child’ difficulty as is
147

suggested by the term sensory processing disorder, it is possible for children to
acquire sensory difficulties due to environmental influences such as high levels of
background noise or limited opportunities for physical activity.
6.2 Suggestions for Future Research The results tentatively suggest that between 44-55% of the sample may have SPDs
and so consideration should be given as to how these children may be best
supported in school. In order to investigate this, it may be timely to devise a
programme of sensory strategies for BESD children according to their observed
sensory need and then monitor the efficacy of the strategies in reducing the
children’s problematic behaviours at school. Any trial would need to be rigorously
designed so as to avoid the criticisms of design flaws that have plagued many
studies investigating the efficacy of sensory integration therapy (Miller, 2007).
It would be helpful to replicate this research with a much larger sample and more
thorough measures of SPDs and BESD. A future study might benefit from using the
Sensory Processing Measure to screen pupils before conducting more thorough
assessment by an occupational therapist for those pupils who were found to have
sensory difficulties on the screening measure. A future study might also collect
more thorough data on other factors that may affect the child’s behaviour, such as
parenting skills, socioeconomic status, diet, exercise, sleep patterns, relationships
with caregivers, hours of outdoor play, exposure to television and computer games
etc. so that links may be investigated between the prevalence and associations
between variables such as SPDs, environmental influences and observed BESDs in
school.
It may be helpful for forthcoming research to be conducted through institutions such
as special educational provision for BESD or specialist child and adolescent mental
health services. This should enable children with severe BESDs to be targeted
because many children reported by schools as having the most severe needs did
not take part in this research. If the research was run by professionals who had
regular long term contact with the families, it would be more likely to be able to
collect detailed data about a range of factors in the lives of the children and the long
term effects of interventions could be tracked over time.
148

In the discussion section it is hypothesised that some children are exposed to high
levels of background noise and that this may be affecting their attention and
auditory filtering skills (Flagg-Williams et al., 2011). A study which actually records
the noise levels that a range of children are exposed to over a number of weeks
could be enlightening. Evidence could be collected to measure whether there is an
association between the level of noise in children’s lives and attention and auditory
filtering difficulties.
Ashburner et al., (2008) found that ASD children with difficulties in auditory filtering
and sensory seeking were more likely to underachieve academically. A future study
could investigate whether this pattern is also true for BESD children. If a correlation
is found between certain sensory issues and underachievement in school it might
impress on teachers that an understanding of sensory processing may be pertinent
when seeking educational success.
Finally, it has been noted that, unlike the SSP, no study has examined the SC to
establish a correlation between abnormal EDR measurements and low scores on
the SC. This may be a useful exercise to strengthen evidence of the construct
validity of the SC.
6.3 Practical Implications for Schools and Educational Psychology It is suggested that one of the many possible roles of an educational psychologist is
to support schools in managing BESD pupils. Some of these pupils have very
complex needs that are difficult to accommodate in school (Jull, 2008); hence any
information that may help EPs to better understand BESD pupils should be
welcomed. While aspects of the literature surrounding sensory processing remain
open to debate, there is increasing evidence that a proportion of children experience
SPDs and that there is a considerable overlap between behaviours observed in
children with SPDs and troublesome behaviour witnessed by teachers in class
(Ben-Sasson et al., 2009 and Franklin et al., 2008). The theory of sensory
processing provides an alternative approach to some more traditional methods
which may be used such as behaviourist techniques that involve applying rewards
to change behaviour.
149

Psychologists may perform a number of functions when working with BESD pupils.
For instance it might be appropriate to collect evidence about exactly what
behaviours the child is displaying, what has triggered those behaviours and how
adults have responded to those behaviours. The psychologist may then put this
information in the context of all the other influences on the child’s life, such as the
school ethos, teaching styles, parenting skills, stresses and significant events at
home etc. Schools and parents may look to psychologists to make sense of an
apparently confused situation and to help the key players develop a way to move
the situation forward. Within such a process, knowledge of sensory processing may
be useful because it provides a possible explanation for behaviour that might
otherwise be overlooked and opens up a range of possible strategies that can be
used in conjunction with more traditional behaviour management techniques. It is
proposed that another vital aspect of an EP’s role often involves shifting the
perceptions of the key players in a difficult situation. This may be very relevant for
pupils with SPDs because, if their behaviour is not understood, they may be
perceived as being deliberately difficult and hence generate considerable frustration
in the adults in their lives. Knowledge of sensory processing theory may aid EPs in
being instrumental in shifting adults’ perceptions so that they understand and
support the child in managing their behaviour in a more positive light.
Identifying SPDs can be a complex task requiring considerable specialist knowledge
because children may have similar sensory symptoms for very different reasons.
Until now this knowledge has usually been held by occupational therapists, but this
study indicates that only 14-23% of the BESD sample had been assessed by an
occupational therapist. This suggests that it may be beneficial for sensory
processing knowledge to be further disseminated within the field of education. It is
proposed that educational psychologists may be in a good position to facilitate this
task because they regularly support schools with children who are experiencing
difficulties, are often skilled in delivering training and have the analytical skills to
examine a range of evidence about a child’s behaviour and develop hypotheses
about the best way to proceed. Finally, it is hoped that EPs may be able to foster
closer working relationships between occupational therapists and schools, both in
providing general information on good practice for all children and through joined up
working with particular children who are causing concern.
Awareness of sensory issues is increasingly filtering into schools, homes and
popular culture in the UK. This is partly through a number of well known books such
150

as the ‘Out-of-Sync Child’, (Kranowitz, 1998) and ‘Too Loud Too Bright Too Fast
Too Tight’ (Heller, 2003). Institutions such as the Sensory Integration Net are
expanding in the UK. The importance of understanding the senses is becoming
popular within Special Educational Needs as was reflected in the catalogue of the
‘Special Educational Needs Show: London’ in October 2011. The cover pictured an
eye, ear, nose etc. and stated the importance of learning through the senses. At this
event many exhibitors displayed sensory toys or sensory rooms and soft play areas.
Popular knowledge of sensory difficulties is also likely to be increased by high
profile films such as ‘Extremely Loud and Incredibly Close’ which was released in
the UK in 2012. The film features a boy with sensory sensitivities coming to terms
with the death of his father in the terrorist attacks on the ‘Twin Towers’ in New York.
While such interest in sensory needs is to be welcomed it is important that practice
is evidence-based and does not become overtaken by popular interventions which
seek to brand and overcomplicate children’s difficulties (Goldacre, 2009). As
sensory issues are increasingly discussed by parents and schools, it is suggested
that it is important the EPs are well informed about the current controversies
surrounding SPDs and it is hoped that EPs might be instrumental in driving future
research and evidence-based practice.
Finally, it is suggested that there is certainly an on-going need for further study into
the prevalence and remediation of SPDs in education. It has been shown in this
study that both parents and teachers have concerns about poor listening skills,
attention skills and overactivity in children with BESD. Whatever the causes of these
difficulties, it is hoped that EPs will continue to strive to reduce the barriers to
success faced by many BESD children so that they have the opportunity to thrive
within the British education system.
151

References
Ahn, R., Miller, L., Milberger, S. & McIntosh, D. (2004) Prevalence of parents’
perceptions of sensory processing disorders among kindergarten children. The
American Journal of Occupational Therapy, 58, (3), 287-293.
Apter, B., Arnold, C. & Swinson, J. (2010) A mass observation study of student and
teacher behaviour in British primary classrooms. Educational Psychology in
Practice, 26, (2), 151-172.
Aronen, E.T., Vuontela, V., Steenari, M. -R., Salmi, J., Carlson, S. (2005) Working
memory, psychiatric symptoms, and academic performance at school. Neurobiology
of Learning and Memory, 83, 33-42.
Ashburner, J., Ziviani, J., & Rodger, S. (2008). Sensory processing and classroom
emotional, behavioral, and educational outcomes in children with autism spectrum
disorder. American Journal of Occupational Therapy, 62, 564–573.
Ayres, A.J. (1962) Tactile functions: their relation to hyperactive and perceptual
motor behaviour. American Journal of Occupational Therapy, 18, 83-95.
Ayres, A.J. (1963) Eleanor Clarke Slagle Lecture – The development of perceptual-
motor abilities: A theoretical basis for treatment of dysfunction. American Journal of
Occupational Therapy, 27, 221-225.
Ayres, A.J., (1972) Improving academic scores through sensory integration. Journal
of Learning Disabilities, 5, (6) 23-28.
Baranek, G. (2002) Efficacy of sensory and motor interventions for children with
autism. Journal of Autism and Developmental Disorders, 32, (5), 397-421.
Baranek, G. T., Chin, Y. H., Hess, L. M. G., Yankee, J. G., Hatton, D. D., & Hooper, S. R. (2002). Sensory processing correlates of occupational performance in children with Fragile X Syndrome: Preliminary findings. American Journal of Occupational Therapy, 56, 538–546.
152

Barnhart, R., Davenport, M., Epps, S. & Nordquist, V. (2003) Developmental
Coordination Disorder. Physical Therapy, 83, (8), 722-731.
Barrett, M. (2006) “Like dynamite going off in my ears”: using autobiographical
accounts of autism with teaching professionals. Educational Psychology in Practice,
22, (2), 95-110.
Beaman, R., Wheldall, K. & Kemp, C. (2007) Recent research on troublesome
classroom behaviour: A review. Australasian Journal of Special Education, 31, (1),
45-60.
Ben-Sassoon, A., Carter, A., & Briggs-Gowan, M. (2009) Sensory over-responsivity
in elementary school: Prevalence and social-emotional correlates. Journal of
Abnormal Child Psychology, 37, (5), 705-716.
Bergman, K., Sarkar, P., O’Connor, T., Modi, N. & Glover, V. (2007) Maternal stress
during pregnancy predicts cognitive ability and fearfulness in infancy. Journal of the
American Academy of Child & Adolescent Psychiatry, 46, (11), 1454-1463.
Bhreathnach, E. (2008) Parent-Child Engagement: A Co-Regulation Process. Paper
presented at The National Conference for Occupational Therapists in Child and
Adolescent Mental Health. St Andrews Northampton.
Bhreathnach, E. (2009) Trauma, Sensory Processing & Attachment: Sensory-
Attachment Intervention. Conference Paper Family Futures Conference, London.
Innovative Body Based Interventions with Traumatised Children.
Bowlby, J. (1958) The nature of the child’s tie to his mother. International Journal of
Psycho-analysis, 39, 1-23.
Brace, N., Kemp, R. & Snelgar, R. (2009) SPSS for Psychologists. London:
Palgrave MacMillan.
Breggin, P. (2002) The Ritalin fact book; What your doctor won’t tell you about
ADHD and stimulant drugs. Cambridge, Massachusetts: Perseus Publishing.
153

Bundy, A., Luckett, T., Tranter, P., Naughton, G., Wyver, S., Ragen, J. & Spies, G.
(2009) The risk is that there is ‘no risk’: A simple, innovative intervention to increase
children’s activity levels. International Journal of Early Years Education, 17, (1), 33-
45.
Cardon, G. & De Bourdeaudhuij, I. (2008) Are Preschool Children Active Enough?
Objectively Measured Physical Activity Levels. Research Quarterly for Exercise and
Sport, 79, (3), 326-332.
Casler, L. (1975) Supplementary auditory and vestibular stimulation: Effects on
institutionalized infants. Journal of Experimental Child Psychology, 19, 456-463.
Cawson, P., Walton, C., Brooker, S. & Kelly, G. (2000) Child maltreatment in the
United Kingdom: A study of the prevalence of abuse and neglect. Executive
Summary, www.NSPCC.org.uk/inform.
Cermak, S. A. & Daunhauer, L. A. (1997) Sensory Processing in the post-
institutionalized child. American Journal of Occupational Therapy, 51, (7), 500-7.
Children’s Development Team (2006) Learning through the Senses Resource
Manual: The Impact of Sensory Processing in the Classroom. San Antonio, USA:
Pearson
Christakis, D., Zimmerman, F., DiGiuseppe, D. & McCarty, C. (2004) Early
Television exposure and subsequent attentional problems in children. Paediatrics,
113, (4), 708-713.
Church, M. & Kaltenbach (1997) Hearing, speech, language, and vestibular
disorders in the Fetal Alcohol Syndrome: A Literature Review. Alcoholism: Clinical
and Experimental Research, 21, (3), 495-512.
Cohen, N., Lojkasek, M., Zadeh, Z., Pugliese, M. & Kiefer, H. (2008) Children
adopted from China: a prospective study of their growth and development. Journal
of child Psychology and Psychiatry, 49, 458-468.
Crane, L., Goddard, L. & Pring, L. (2009) Sensory Processing in adults with autism
spectrum disorders. Autism, 13, (3), 215-228.
154

Dancey, C. & Reidy, J. (2011) Statistics without Maths for Psychology. Harlow:
Pearson Education Ltd.
Davies, P. & Gavin, W. (2007) Validating the diagnosis of sensory processing
disorders using EEG technology. The American Journal of Occupational Therapy,
61, (2), 176-189.
Davies, P. L., Chang, W.-P., & Gavin, W. J. (2010). Middle and late latency ERP
components discriminate between adults, typical children, and children with sensory
processing deficits. Frontiers in Integrative Neuroscience, 4, (16), 1-9.
Dawson, G. & Watling, R. (2000). Interventions to facilitate auditory, visual, and
motor integration: A review of the evidence. Journal of Autism and Developmental
Disorders, 30, 415–421.
Diamond, M., Krech, D. & Rosenzweig, M. (1964) The effects of an enriched
environment on the histology of the rat cerebral cortex. The Journal of Comparative
Neurology, 123, (1), 111-119.
Dunn, W. (1999) Sensory Profile, User’s Manual. San Antonio, USA: NCS Pearson.
Dunn, W. (2006) Sensory Profile School Companion, User’s Manual. San Antonio,
USA: NCS Pearson.
Dyregrov, A. (2004) Educational consequences of loss and trauma. Educational and
Child Psychology, 21, (3), 77-84.
Ermer, J. & Dunn, W. (1998) The Sensory Profile: A discriminant analysis of
children with and without disabilities. The American Journal of Occupational
therapy, 52, (4), 283-291.
Ferguson, C. J. (2007) The Good, The Bad & The Ugly: a meta-analytic review of
positive and negative effects of violent video games. Psychiatric Quarterly, 78, 309-
316.
Field, A. (2009) Discovering Statistics Using SPSS. London: Sage.
155

Flagg-Williams, J., Rubin, R. & Aquino-Russell, C. (2011) Classroom Soundscape.
Educational & Child Psychology, 28, (1), 89-99.
Franklin, L., Deitz, J., Jirikowic, T. & Astley, S. (2008) Children with Fetal alcohol
Spectrum Disorders: Problem behaviors and sensory processing. The American
Journal of Occupational Therapy, 62, (3), 265-273.
Fries, A., Ziegler, T., Kurian, J., Jacoris, S. & Pollak, S. (2005) Early experience in
humans is associated with changes in neuropeptides critical for regulating social
behavior. Proceedings of the National Academy of Sciences, 102 (47), 17237-
17240.
Fuemmeler, B. F., Anderson, C. B., & Mâsse, L. C. (2011) Parent-child relationship
of directly measured physical activity. International Journal of Behavioural Nutrition
& Physical Activity, 8, (1), 17-29.
Gallace, A. (2012) Living with Touch. The Psychologist, 25 (12) 896-899.
Gathercole, S.E. & Alloway, T.P. (2009) Working Memory & Learning: A Practical
Guide for Teachers. London: Sage.
Gavin, W. J., Dotseth, A., Roush, K. K., Smith, C. A., Spain, H. D., & Davies, P. L.
(2011). Electroencephalography in children with and without sensory processing
disorders during auditory perception. American Journal of Occupational Therapy,
65, 370–377.
Geving, A. (2007) Identifying types of student and teacher behaviours associated
with teacher stress. Teaching and Teacher Education, 23, 624-640.
Goldacre, B. (2009) Bad Science. London: Fourth Estate.
Goldsmith, H., Van Hulle, C., Arneson, C., Schreiber, J. & Gernsbacher, M. (2006)
A population-based twin study of parentally reported tactile and auditory
defensiveness in young children. Journal of Abnormal Psychology, 34 (3) 393-407.
156

Goodman, R. (2001) Psychometric Properties of the Strengths and Difficulties
Questionnaire Journal of the American Academy of Child & Adolescent Psychiatry,
40, (11), 1337-1345.
Goodman, R., Ford, T., Simmons, H., Gatward, R. & Meltzer, H. (2000) Using the
Strengths and Difficulties Questionnaire (SDQ) to screen for child psychiatric
disorders in a community sample. British Journal of Psychiatry, 177, 534-539.
Goodman, A. & Gregg, P. (2010) Poorer children’s educational attainment. How
important are attitudes and behaviour? York, UK: Joseph Rowntree Foundation.
Goodman, R. & Scott, S. (1999) Comparing the Strengths and Difficulties
Questionnaire and the Child Behavior Checklist: Is small beautiful? Journal of
Abnormal Child Psychology, 27, 17-24.
Green, H., McGinnity, A., Meltzer, H., Ford, T. & Goodman, R. (2005) Mental Health
of Children and Young People in Great Britain, 2004. London: Office for National
Statistics.
Griffiths, M. (2010) Online video gaming: what should educational psychologists
know? Educational Psychologist in Practice, 26, (1), 35-40.
Griggs, J. & Walker, R. (2008) The costs of child poverty for individuals and society:
A literature review. York, UK: The Joseph Rowntree Foundation.
Hartnell, N. (2010) Multi-disciplinary approaches to pupil behaviour in school: the
role of evaluation in service delivery. Educational Psychology in Practice, 26, (2),
187-204.
Heller, S. (2003) Too loud to bright too fast too tight: What to do if you are sensory
defensive in an overstimulating world. New York: Harper Collins.
Henry, D., Kane-Wineland, M. & Swindeman, S. (2010) Tools for Tots: Sensory
Strategies for Toddlers and Preschoolers. Glendale, Arizona: Henry Occupational
Therapy Services Inc.
157

Hilton, C., Graver, K. & LaVesser, P. (2007) Relationship between social
competence and sensory processing in children with high functioning autism
spectrum disorders. Research in Autism Spectrum Disorders, 1, (2), 164-173.
Hilton, C., Harper, J., Kueker, R., Lang, A., Abbacchi, A., Todorov, A. et al. (2010)
Sensory Responsiveness as a Predictor of Social Severity in Children with High
Functioning Autism Spectrum Disorders. Journal of Autism and Developmental
Disorders, 40, (8), 937-945.
Ho, C. & Leung, J. (2002) Disruptive classroom behaviours of secondary and
primary school students. Educational Research Journal, 17, 219-233.
Hodgetts, S. & Hodgetts, W. (2007) Somatosensory stimulation interventions for
children with autism: Literature review and clinical considerations. Canadian Journal
of Occupational Therapy, 74, (5), 393-400.
Holowenko, H. (1999) Attention Deficit/Hyperactivity Disorder; A multidisciplinary
Approach. London: Jessica Kingsley Publishers.
Jones, R. (2003) The construction of emotional and behavioural difficulties.
Educational Psychology in Practice, 19, (2), 147-158.
Jull, S. K. (2008) Educational and behavioural difficulties (EBD): the special
educational need justifying exclusion. Journal of Research in Special Educational
Needs, 8, (1), 13-18.
Kantomma, M., Tammelin, T., Demakakos, P., Ebeling, H. & Taanila, A. (2009)
Physical activity, emotional and behavioural problems, maternal education and self-
reported educational performance of adolescents. Health Education Research, 25,
(2), 368-379.
Kern, J., Trivedi, M., Garver, C., Grannemann, B., Andrews, A., Savla, J.et al.
(2006) The pattern of sensory processing abnormalities in autism. Autism, 10, (5),
480-494.
158

Kern, J., Trivedi, M., Grannemann, B., Garver, C., Johnson, D., Andrews, A. et al.
(2007) Sensory Correlations in autism. Autism, 11, (2), 123-134.
Kimball, J., Lynch, K., Stewart, K., Williams, N., Thomas, M. & Atwood, K. (2007)
Using salivary cortisol to measure the effects of a Wilbarger protocol-based
procedure on sympathetic arousal: A pilot study. The American Journal of
Occuaptional Therapy, 61, (4), 406-414.
Kinnealey, M. & Miller, L. (1993) Sensory Integration and Learning Disabilities. In
Hopkins, H.L. & Smith, H.D. (Eds.) Willard & Spackman’s Occupational Therapy.
Philadelphia: J.B. Lippincott Co. (8th Edition) p. 474-489.
Kinnealey, M. & Fuiek, M. (2006) The relationship between sensory defensiveness,
anxiety, depression and perception of pain in adults. Occupational Therapy
International, 6, (3), 195-206.
Kranowitz, C. (1998) The Out-of-Sync Child. New York: Berkley Publishing Group.
Kokkinos, C.M., Panayiotou, G. & Davazoglou, A.G (2004) Perceived seriousness
of pupils’ undesirable behaviours: The student teachers’ perspective. Educational
Psychology, 24, (1), 109-120.
LaRocque, M. (2008) Assessing perceptions of the environment in elementary
classrooms: the link with achievement. Educational Psychology in Practice, 24, (4),
289-306.
Layard, R. & Dunn, J. (2009) A Good Childhood: Searching for Values in a
Competitive Age. London: The Children’s Society.
Lin, S., Cermak, S., Coster, W. & Miller, L. (2005) The Relation between length of
institutionalization and sensory integration in children adopted from Eastern Europe.
The American Journal of Occupational Therapy, 59, (2), 139-147.
Liss, M., Saulnier, C., Fein, D. & Kinsbourne, M. (2006) Sensory and attention
abnormalities in autistic spectrum disorders. Autism, 10, (2), 155-172.
159

Little, E. (2005) Secondary school teachers’ perceptions of students’ problem
behaviours. Educational Psychology, 24, (4), 369-377.
Lopes, V., Rodrigues, L., Maia, J. & Malina (2011) Motor coordination as predictor
of physical activity in childhood. Scandinavian Journal of Medicine & Science in
Sports, 21, (5), 663-669.
MacKay, T. (2010) Guest Editorial. Educational & Child Psychology, 27, (2), 5-10.
McLaren, C., Edwards, G., Ruddick, S., Zabjek, K. & McKever, P. (2011)
Kindergarten kids in motion: rethinking inclusive classrooms for optimal learning.
Educational & Child Psychology, 28, (1), 100-113.
Mangeot, S., Miller, L., Mcintosh, D., McGrath-Clarke, Simon J., Hagerman, R. &
Goldson, E. (2001) Sensory modulation dysfunction in children with attention-deficit-
hyperactivity disorder. Developmental Medicine & Child Neurology, 43, 399-406.
Marsh, L. (2011) Evaluation of the Massage in Schools Programme in one primary
school. Educational Psychology in Practice, 27, (2), 133-142.
Mathai, J., Anderson, P. & Bourne, A. (2002) The Strengths and Difficulties
Questionnaire (SDQ) as a screening measure prior to admission to a child and
adolescent mental health service (CAMHS). Australian e-Journal for the
Advancement of Mental Health, 1, (3), 235-246.
May-Benson, T., Koomar, J. & Teasdale, A. (2009) Incidence of pre-, peri-, and
post-natal birth and developmental problems of children with sensory processing
disorder and children with autism spectrum disorder, Frontiers in Integrative
Neuroscience, 3, (31), 1-15.
McIntosh, D.N., Miller, L.J., Shyu, V. & Hagerman, R.J. (1999) Sensory modulation
disruption, electrodermal responses and functional behaviours. Developmental
Medicine & Child Neurology 41, 608-15.
Meltzer, H., Gatward, R., Goodman, R., and Ford, F. (2000) Mental health of
children and adolescents in Great Britain. London: The Stationery Office.
160

Metcalf, B., Voss, L., Hosking, J., Jeffery, A. & Wilkin, B. (2008) Physical activity at
the government-recommended level and obesity-related health outcomes: a
longitudinal study (Early Bird 37). Archives of Disease in Childhood, 93, 772-777.
Miller, L., McIntosh, D., McGrath, J., Shyu, V., Lampe, M., Taylor, A. et al. (1999)
Electrodermal responses to sensory stimuli in individuals with Fragile X Syndrome:
A Preliminary Report. American Journal of Medical Genetics, 83, 268-279.
Miller, L., Anzalone, M., Lane, S., Cermak, S. & Osten, E. (2007) Concept evolution
in sensory Integration: A proposed nosology for diagnosis. The American Journal of
Occupational Therapy, 61, (2), 135-140.
Mulhern, G. & Greer, B. (2011) Making Sense of Data and Statistics in Psychology.
Basingstoke: Palgrave MacMillan.
Murray-Slutsky, C. & Paris, B. (2005) Is It Sensory or Is It Behavior? Behavior
Problem Identification, Assessment and Intervention. Austin, Texas: Hamill Institute
on Disabilities
Naber, F. Bakermans-Kranenburg, M., Van IJzendoorn M., Swinkels, S., Buitelaar,
J., Dietz, C. et al. (2008) Play Behaviour and Attachment in Toddlers with Autism.
Journal of Autism and Developmental Disorders, 38, 857-866.
Nettlefold, L., McKay, H., Warburton, D., McGuire, K., Bredin, S. & Naylor, P. (2011)
The challenge of low physical activity during the school day: at recess, lunch and in
physical education. The British Journal of Sports Medicine, 45, 813-819.
O’Connor, T., Heron, J. & Glover, V. (2002a) Antenatal Anxiety Predicts Child
Behavioral/Emotional Problems Independently of Postnatal Depression. The British
Journal of Psychiatry, 180, 502-508.
O’Connor, T., Heron, J., Golding, J., Beveridge, M. & Glover, V. (2002b) Maternal
antenatal anxiety and children's behavioural / emotional problems at 4 years. The
British Journal of Psychiatry, 180, 502-508.
Ottenbacher, K. (1983) Developmental Implications of Clinically applied Vestibular
Stimulation. Physical Therapy, 63, (3), 338-558.
161

Pagani, L., Fitzpatrick, C., Barnett, T. & Dubow, E. ( 2010) Prospective associations
between early childhood television exposure and academic, psychosocial, and
physical well-being by middle childhood Archives of Pediatric Adolescent Medicine,
164, (5), 425-431.
Palmer, S. (2006) Toxic Childhood: How the modern world is damaging our children
and what we can do about it. London: Orion.
Parham, L. & Ecker, C. (2010) The Sensory Processing Measure Manual. Los
Angeles, USA: Western Psychological Services.
Parush, S., Sohmer, H., Steinberg & Kaitz, M. (2007) Somatosensory function in
boys with ADHD and tactile defensiveness. Physiology & Behaviour, 90, 553-558.
Perry, B., Pollard, R., Blakley, T., Vigilante, D. (1995) Childhood trauma, the
neurobiology of adaptation, and "use-dependent" development of the brain: How
"states" become "traits". Infant Mental Health Journal, 16, (4), 271-291.
Pickett, K. & Wilkinson, R. (2007) Child Wellbeing and income inequality in rich
societies: an ecological cross sectional study. British Medical Journal, 335, 7629.
Pollock, N. (2009) Sensory Integration: A review of the current state of the evidence.
Occupational Therapy Now, 11, 6-10.
Poulou, M. (2005) The prevention of emotional and behavioural difficulties in
schools: teachers’ suggestions. Educational Psychology in Practice, 21, (1), 37-52.
Raine, A., Reynolds, C., Venables, P. H. & Mednick, S. A. (2002) Stimulation
seeking and intelligence. Journal of Personality and Social Psychology, 82, (4), 663-
674.
Robson, C. (2002) Real World Research (Rev. ed.) Oxford: Blackwell Publishing.
Rogers, S., Hepburn, S. & Wehner, E. (2003) Parent Reports of sensory symptoms
in toddlers with autism and those with other developmental disorders. Journal of
Autism and Developmental Disorders, 33, (6), 631-642.
162

Ross, D & Roberts, P. (1999) Income and Child Wellbeing: a new perspective on
the poverty debate. Kanata, Canada: The Canadian Council on Social
Development.
Rothon, C., Edwards, P., Kamaldeep, B., Viner, R., Taylor, S. & Stansfeld, S. (2010)
Physical activity and depressive symptom in adolescents: a prospective study. BMC
Medicine, 8, (1), 32.
Rush, C. & Harrison, P. (2008) Ascertaining teachers perceptions of working with
adolescents diagnosed with attention-deficit/hyperactivity disorder. Educational
Psychology in Practice, 24, (3), 207-224.
Schaaf, R. & Miller, L. (2005) Occupational therapy using a sensory integrative
approach for children with developmental disabilities. Mental Retardation and
Developmental Disabilities Research Reviews, 11, 143–148.
Schaaf, R., Benevides, T., Blanche, E., Brett-Green, B., Burke, J., Cohn, E., et al.
(2010) Parasympathetic functions in children with sensory processing disorder.
Frontiers in Integrative Neuroscience, 4, (1), 1-11.
Schilling, D., Washington, K., Billingsley, F. & Deitz, J. (2003) Classroom seating for
children with Attention Deficit Hyperactivity Disorder: Therapy balls versus chairs.
The American Journal of Occupational Therapy, 57, (5), 40-47.
Schneider, M., Moore, C. Gajewski, L., Larson, J., Roberts, A., Converse, A. et al.
(2008) Sensory Processing disorder in a primate Model: Evidence from a
longitudinal Study of Prenatal Alcohol and Prenatal Stress Effects. Child
Development, 79, (1), 100-113.
Schoen, S., Miller, L., Brett-Green, B. & Nielsen (2009) Physiological and
behavioural differences in sensory processing: a comparison of children with Autism
Spectrum Disorder and Sensory Modulation Disorder. Frontiers in Integrative
Neuroscience, 3, (29), 1-11.
Sheridan, M, Sharam, A. & Cockerill, H. (2007) From Birth to Five Years: Children’s
Developmental Progress. London: Routledge.
163
Stein, B., Perrault, T., Stanford, T. & Rowland, B. (2009) Postnatal experiences
influence how the brain integrates information from different senses. Frontiers in
Integrative Neuroscience, 3, (21), 1-12.
Steer, A. (2009) Learning Behaviour: Lessons Learned. Nottingham, UK:
Department for Children Schools and Families Publications.
Swing E. L. & Anderson C. A. (2007) The unintended negative consequences of
exposure to violent video games. Cognitive Technology, 12, (1), 3-13.
Tomchek, S. & Dunn, W. (2007) Sensory Processing in Children with and without
Autism: A comparative Study using the Short Sensory Profile. American Journal of
Occupational Therapy, 61, (2), 190-200.
Thomas, G. (2009) How to do your Research Project. London: Sage Publications.
Trudeau, F. & Shepherd, R. (2008) Physical education, school physical activity,
school sports and academic performance. International Journal of Behavioral
Nutrition and Physical Activity, 5, (10), 10.
Tucker, P. (2008) Physical activity levels of preschool-aged children: a systematic
review. Early Childhood Research Quarterly, 23, (4), 547-558.
UNICEF (2007) Child poverty in perspective: An overview of child well-being in rich
countries. Innocenti Report Card 7. Florence: The United Nations Children’s Fund.
Van den Dries, L., Juffer, F., Van IJzendoorn, M., Bakermans-Kranenburg, M.
(2010) Infants' physical and cognitive development after international adoption from
foster care or institutions in China. Journal of Developmental & Behavioral
Pediatrics, 31, (2), 144-150.
Van Ijzendoorn, M. & Juffer, F. (2006) The Emanuel Miller Memorial Lecture2006:
adoption as intervention. Meta-analytic evidence for massive catch-up and plasticity
in physical, socio-emotional, and cognitive development. Journal of Child
Psychology & Psychiatry. 47, 1228-12245.
164

Washbrook, E. & Waldfogel, J. (2011) On your marks: Measuring the school
readiness of children in low-to-middle income families. London: The Resolution
Foundation.
Watling, R. L., Deitz, J., & White, O. (2001). Comparison of Sensory Profile scores
of young children with and without autism spectrum disorders. American Journal of
Occupational Therapy, 55, 416–423.
Wheldall, K. & Merrett, F. (1988) Which classroom behaviours do primary school
teachers say they find most troublesome? Educational Review, 40, 13-27.
Williams, M. & Shellenberger, S. (2008) How does your Engine Run? A Leader’s
Guide to The Alert Program for Self-Regulation. Albuquerque: Therapy Works Inc.
Willingham, D. (2009) Why Don’t Students like School? San Francisco: Jossey-
Bass.
White, M. (1979) A first-grade intervention program for children at risk for reading
failure. Journal of Learning Disabilities, 12, (4), 26-32.
Wright, J., Huston, A., Murphy, K., St. Peters, M., Pinon, M., Scantlin, R. et al.
(2001) The relations of early television viewing to school readiness and vocabulary
of children from low-income families: The early window project. Child Development,
72, (5), 1347-1366.
165

Appendix 1a: The Strengths and Difficulties Questionnaire
166

Appendix 1a continued:
167

Appendix 1b: SENCo Questionnaire Questionnaire for SENCos
This questionnaire is purely to build up a picture of the current level of knowledge about Sensory Processing Difficulties across the local authority. Your response will be anonymous.
Please indicate what type of school you work for: Special School/SRP: Mainstream School: Statement
1 2 3 4 5 I have a good understanding of the following:
1 • sensory processing disorder (also known as sensory integrative dysfunction)
2 • sensory modulation disorder
3 • the vestibular sense
4 • the proprioceptive sense
5 • tactile defensiveness
6 I am confident I can identify behaviour that might have a sensory cause.
7 I am familiar with strategies and resources to support children with sensory processing difficulties
8 I know where to find strategies and resources to support children with sensory processing difficulties
9 Teachers and TAs in my school know how to identify and support sensory processing difficulties
You may add further comments here if you would like to:
Thank you for your time. Please return to
Plum Hutton, Educational Psychology Service in the envelope provided.
Key: 1 Strongly agree 2 Agree 3 Neither agree nor disagree 4 Disagree 5 Strongly
disagree
168

Appendix 1c: Parent / Carer Background Information Sheet Parent / Carer Form: Background Information
The following background information would be very helpful. If you would like an explanation of how each question is relevant to this research please see overleaf. You do not have to answer all the questions. This information will only be seen by the researcher. Child’s identification number:
School:
Yes No Not sure
1 Was your child born prematurely i.e. before 37 weeks gestation?
2 Were there complications during labour or delivery of your child?
3 Was your child a fussy or ‘difficult’ baby?
4 Do you feel that your child is generally anxious?
5 Has your child been assessed by an Occupational Therapist?
Please indicate if your child been diagnosed by a specialist as having any of the following:
Yes No Not sure
6 ADHD (Attention Deficit & Hyperactive Disorder)
7 ASD (Autistic Spectrum Disorder including Asperger’s and Pervasive Developmental Disorder)
8 Attachment Difficulties
9 DCD (Developmental Co-ordination Disorder including Dyspraxia)
10 Dyslexia
11 Any other learning difficulty or significant medical problem. If yes, please give brief details below:
PLEASE RETURN QUESTIONNAIRES TO YOUR CHILD’S SCHOOL
WHERE THEY WILL BE FORWARDED TO THE EDUCATIONAL PSYCHOLOGY SERVICE.
169

Appendix 1c Continued: Explanation of how the background information is relevant to
this research. Reasons for asking the questions on the background information sheet: Question Number 1 & 2: To identify if there is a link between sensory processing difficulties, prematurity and difficulties at birth in this sample. Some other studies have found links between these factors. 3: Many children who over-respond to sensory input are reported to be fussy or ‘difficult’ babies. This question provides an indication of whether difficulties have been evident from an early age and hence longstanding. It should be noted that many ‘difficult babies’ do not develop any difficulties in later life. 4: Detailed assessment of sensory difficulties is usually undertaken by an occupational therapist. It would be helpful to find out how many children who are felt to have behavioural, emotional or social difficulties in school have been assessed by an occupational therapist. 5: Some studies have found strong links between anxiety and sensory difficulties. It would be helpful to establish whether there are links between anxiety and sensory difficulties in this sample. 6-11: These questions aim to provide further evidence about the links between sensory processing difficulties and other difficulties. For example some studies have shown links between dyslexia and difficulties filtering out background noise. Other studies have found that many pupils with ADHD (Attention Deficit Hyperactive Disorder) are oversensitive to touch. Many studies have shown that a high percentage of children on the autistic spectrum also experience sensory processing issues. It should be noted that children may have sensory sensitivities without any other diagnosis. Background information provided by teachers. Your child’s teacher will be asked to complete a similar background information sheet but it does not include questions about your child’s early development. Teachers are asked the following questions: 1 Does this child have academic difficulties at school? 2 Does this child’s behaviour in school negatively impact on their ability to
learn? Question 1 & 2 provide information about whether the child’s difficulties may be due to academic difficulties in school which can lead to problem behaviour or whether their behaviour is impacting on their ability to learn. Sensory processing difficulties can cause children to be over active, controlling, to have difficulties listening etc. which will all impact on the child’s ability to learn. Questions 3-10 cover the same content as questions 4-11 on the parent background information sheet.
170

Appendix 1d: Teacher Background Information Sheet Teacher Form: Background Information
The following background information would be very helpful. If you would like an explanation of how each question is relevant to this research please see overleaf. You do not have to answer all the questions. This information will only be seen by the researcher. Child’s identification number:
School:
Yes No Not sure
1 Does this child have academic difficulties at school?
2 Does this child’s behaviour in school negatively impact on their ability to learn?
3 To your knowledge has this child been assessed by an Occupational Therapist?
4 Does this child appear to be generally anxious?
Please indicate if this child been diagnosed by a specialist as having any of the following:
Yes No Not sure
5 ADHD (Attention Deficit Hyperactive Disorder)
6 ASD (Autistic Spectrum Disorder including Asperger’s and Pervasive Developmental Disorder)
7 Attachment Difficulties
8 DCD (Developmental Co-ordination Disorder including Dyspraxia)
9 Dyslexia
10 Any other learning difficulty or significant medical problem. If yes, please give brief details below:
PLEASE RETURN QUESTIONNAIRES TO THE SENCO WHO WILL
FORWARD THEM TO THE EDUCATIONAL PSYCHOLOGY SERVICE.
171

Appendix 1d Continued:
Explanation about how the background information is relevant to this research.
Reasons for asking the questions on the background information sheet: Question Number 1 This question provides information about whether the child’s difficulties may be due to academic difficulties in school, which can lead to problem behaviour. 2 Children with behavioural, emotional or social difficulties in school often have difficulties with learning as a result of their behaviour. Sensory processing difficulties can cause children to be over active, controlling, to have difficulties attending etc. which will all impact on their ability to learn. 3 Detailed assessment of sensory difficulties is usually undertaken by an occupational therapist. It would be helpful to find out how many children who are struggling to manage their behaviour in school have been assessed by an occupational therapist. 4 Some studies have found strong links between anxiety and sensory difficulties. Anxiety is not directly asked about in the Sensory Profile. 5-10 These questions aim to provide further evidence about the links between sensory processing difficulties and other difficulties. For example some studies have shown links between dyslexia and difficulties filtering out background noise. Other studies have found that many pupils with ADHD (Attention Deficit Hyperactive Disorder) are oversensitive to touch. Many studies have shown that a high percentage of children on the autistic spectrum also experience sensory processing issues. It should be noted that children may have sensory issues without any other diagnosis.
172

Appendix 2a: Parent / Carer Introductory Letter School of Psychology
Cardiff University Tower Building,
Park Place Cardiff,
September 2010 CF10 3AT
Dear Parent / Carer, I am an Educational Psychologist working in XXXX and studying for a doctorate in Educational Psychology at Cardiff University. I am conducting research into children who experience difficulties processing sensory information. For example, a child might be oversensitive or under-sensitive to touch, noise, movement, taste, texture etc., which may make it more difficult for him/her to concentrate and learn in school. Some children find it more difficult to manage their behaviour in school than others. This may be due to a number of reasons such as difficulties with attention, over activity, anxiety, bereavement, or disruptive behaviour etc. This study aims to answer the following questions:
1. How many children with behavioural, emotional or social problems at school also experience sensory issues?
2. Do children show a similar pattern of sensory processing at home and at school?
Please could you spend a few minutes completing the attached Background Information Sheet and questionnaire? Background information will enable links to be drawn between sensory processing difficulties and other factors. For example, medical conditions or learning difficulties that have been previously diagnosed by a specialist. An explanation of the reason for asking each background question is provided on the reverse side of the Background Information Sheet. If you take part in this study your child’s teacher will also be asked to complete the following:
• A Background Information Sheet. • The Strengths and Difficulties Questionnaire: this is a brief
questionnaire commonly used in schools. It provides information about 5 aspects of a child’s behaviour at school including emotional issues, conduct problems, hyperactivity, peer problems and social strengths.
• The Sensory Profile School Companion: this survey has 62 questions and provides information about how a child processes sensory information (such as noise, light, touch etc.) in school.
All information will be held confidentially (* for further details please see below). I hope that the results of this survey will help educational professionals better understand how to effectively support children in school.
173

Appendix 2a continued: Please return questionnaires to your child’s school where they will be forwarded to the Educational Psychology Service. If you have any questions please contact me or my supervisor, Dr Simon Griffey, at the addresses given below. Thank you for your time. Yours sincerely, Plum Hutton Chartered Educational Psychologist. *Confidential data: Each child will be allocated a personal identification number so that only the researcher will be able to trace the identity of the child by linking the identification number to a list kept on a secure computer drive at the Educational Psychology Service. When the information from the questionnaires has been entered onto a database it will be anonymised so that it will not be possible to trace the information back to you. Plum Hutton Dr Simon Griffey, Research Director Educational Psychologist Doctorate in Educational Psychology
Programme Educational Psychology Service XXXX
School of Psychology Cardiff University Tower Building, Park Place Cardiff, CF10 3AT
Telephone Number: XXXX Tel: 029 208 74007 E-mail: XXXX E-mail: [email protected] If you have a complaint, please contact: Secretary of the Psychology Ethics Committee,
School of Psychology, Cardiff University Tower Building, Park Place Cardiff, CF10 3AT
Tel:029 208 70360 Email: [email protected]
174

Appendix 2b: Parent / Carer Consent Form Group A
School of Psychology, Cardiff University Parent / Carer Consent Form Group A
I understand that: • my participation in this project will involve completing a Background
Information Sheet and questionnaire about how my child processes sensory information, which will require approximately 10 minutes of my time;
• my child’s teacher will also be asked to complete a Background Information Sheet, The Strengths and Difficulties Questionnaire and Sensory Profile Teacher Questionnaire about my child;
• at the end of the study I will be provided with further information about the purpose of the study.
• information provided by me will be held confidentially so that only Plum Hutton can trace this information back to me individually. My data will be anonymised when it has been entered into a database, within 3 weeks of the receipt of the questionnaires. After this point no one will be able to trace my information back to me;
• I can request access to my data or ask for it to be destroyed up until the point when it is anonymised. The anonymous data may be kept indefinitely;
• participation in this study is entirely voluntary; • I am free to ask any questions at any time and to discuss any concerns
with Dr Simon Griffey; • I understand that participating in this study will not result in individual
educational psychology assessment for my child; • The information collected is for research purposes only.
_ _ _ _ _ _ _ _ _ _ _ _ _ _ _ _ _ _ _ _ _ _ _ _ _ _ _ _ _ _ _ _ _ _ _ _ _ _ _ _ _ Please return this slip to the school in the envelope provided within two weeks: Name of Child: School: Please tick one box below. I, ___________________________________(NAME)
agree to take part in the study conducted by Plum Hutton of the School of Psychology, Cardiff University with the supervision of Dr Simon Griffey.
do not want to take part in this study. Signed: Date:
175

Appendix 2c: SENCo Consent for Group B School of Psychology, Cardiff University
SENCo Consent Form Group B Dear SENCo, I am an Educational Psychologist working in XXXX and studying for a doctorate in Educational Psychology at Cardiff University. I am conducting research into children who experience difficulties processing sensory information. For example, a child might be oversensitive or under-sensitive to touch, noise, movement, taste, texture etc., which may make it more difficult for them to concentrate and learn in school. I would be grateful if you could complete the following brief, anonymous questionnaire. This will help me to establish the current level of knowledge about Sensory Processing Disorders among SENCos. Please do not be concerned if you feel you have little knowledge in this area. I suspect you will be in good company! If you have any concerns please contact me or my supervisor at the address below. Yours sincerely, Plum Hutton Chartered Educational Psychologist. Plum Hutton Dr Simon Griffey, Research Director Educational Psychologist Doctorate in Educational Psychology
Programme Educational Psychology Service XXXX
School of Psychology, Cardiff University Tower Building, Park Place Cardiff, CF10 3AT
Telephone Number: XXXX Tel: 029 208 74007 E-mail: XXXX E-mail: [email protected] If you have a complaint, please contact: Secretary of the Psychology Ethics Committee,
School of Psychology, Cardiff University Tower Building, Park Place Cardiff, CF10 3AT
Tel:029 208 70360 Email: [email protected]
Consent Form. I understand that: • my participation in this project will involve completing 1 questionnaire, which will
require approximately 3 minutes of my time; • at the end of the study I will be provided further information about the purposes
of the study. • information provided by me will be held anonymously so that it can not be
traced back to me; • The anonymous data may be kept indefinitely; • participation in this study is entirely voluntary; • I am free to ask any questions at any time and to discuss any concerns with Dr
Simon Griffey;
By completing this questionnaire I am consenting to take part in the study.
176

Appendix 3a: Teacher Introductory Letter
School of Psychology Cardiff University
Tower Building, Park Place
Cardiff, CF10 3AT
September 2010 Dear Teacher, I am an Educational Psychologist working in XXXX and studying for a doctorate in Educational Psychology at Cardiff University. I am doing research into children who experience difficulties processing sensory information. For example, a child might be oversensitive or under-sensitive to touch, noise, movement, taste, texture etc., which may make it more difficult for them to concentrate and learn in school. This study has the following aims. I hope to find out:
1. How many children with behavioural, emotional or social problems at school also experience sensory issues?
2. Is there a link between children with sensory difficulties and other diagnoses, such as Attention Deficit Hyperactive Disorder or Dyslexia?
3. Do children show a similar pattern of sensory processing at home and at school?
4. How many pupils in the study have been assessed by an occupational therapist?
Please could you spend a few minutes completing the attached questionnaire? It would be helpful if the questionnaire could be completed by the teacher / teaching assistant who knows the child best. Parental consent will be gained prior to you completing the teacher questionnaire. I hope that the results of this survey will help educational professionals better understand how to effectively support children in school. Please return questionnaires to the SENCo who will forward them to the Educational Psychology Service.
177
Appendix 3a continued: If you have any questions please contact me or my supervisor, Dr Simon Griffey, at the addresses given below. Thank you for your time. Yours sincerely, Plum Hutton Chartered Educational Psychologist. Plum Hutton Dr Simon Griffey, Research Director Educational Psychologist Doctorate in Educational Psychology
Programme Educational Psychology Service XXXX
School of Psychology, Cardiff University Tower Building, Park Place Cardiff, CF10 3AT
Telephone Number: XXXX Tel: 029 208 74007 E-mail: XXXX E-mail: [email protected] If you have a complaint, please contact: Secretary of the Psychology Ethics Committee,
School of Psychology, Cardiff University Tower Building, Park Place Cardiff, CF10 3AT
Tel:029 208 70360 Email: [email protected]
178

Appendix 3b: Teacher Consent for Group A
School of Psychology, Cardiff University Teacher Consent Form Group A
I understand that: • my participation in this project will involve completing 2 questionnaires,
which will require approximately 20 minutes of my time; • the child’s parent/s will also be asked to complete a parental
questionnaire about how the child processes sensory information; • at the end of the study I will be provided with further information about
the purpose of the study. • information provided by me will be held confidentially so that only Plum
Hutton can trace this information back to me individually. My data will be anonymised when it has been entered into a database, within 3 weeks of the receipt of the data. After this point no one will be able to trace my information back to me;
• I can request access to my data or ask for it to be destroyed up until the point when it is anonymised. The anonymous data may be kept indefinitely;
• participation in this study is entirely voluntary; • I am free to ask any questions at any time and to discuss any concerns
with Dr Simon Griffey; • I understand that participating in this study will not result in individual
educational psychology assessment for the child concerned; _ _ _ _ _ _ _ _ _ _ _ _ _ _ _ _ _ _ _ _ _ _ _ _ _ _ _ _ _ _ _ _ _ _ _ _ _ _ _ _ _ Please return this slip to the SENCo within two weeks: Name of Child: School: I, ___________________________________(NAME) agree to take part in
the study conducted by Plum Hutton of the School of Psychology, Cardiff
University with the supervision of Dr Simon Griffey.
Signed: Date:
179

Appendix 4:
Guidance for Approaching Parents. This study involves recruiting parents of children that are considered by the school to have behavioural, emotional or social difficulties (BESD). Some parents may not be fully aware that their child’s behaviour at school is potentially concerning and so may be very sensitive about being asked to take part in this research. The following points should be considered: • Parents should not be approached when in earshot of other parents. If approaching parents at the end of the school day, they should be taken to a quiet room. It would be best to discuss participation during a pre-arranged parent-teacher meeting. • It is suggested that in most cases it is not appropriate for the pupil to be present when discussing participation in the research. Staff should either arrange an alternative activity for the pupil to do during the discussion or organize a time to speak to the parents when the pupil is in lessons. • If the child is known to the Primary Behaviour Support Team or the Educational Psychology Service (for BESD) parents should be informed that all children in the school known to these services are being asked to take part in the research. • For parents not known to the above services, reasons for including each child in the study should be sensitively explained. It is good practice for schools to keep parents informed of how their child is getting on at school, so in most cases BESD concerns should not be news to the parent. • Where appropriate, parents should be reassured that inclusion in the research does not necessarily suggest that the child presents with challenging and disruptive behaviour in school. This research is also relevant to children who are very shy, withdrawn, anxious, have difficulties making friends etc. • If you have any concerns about approaching particular parents please contact Plum Hutton, Educational Psychologist, who will be happy to provide support. Educational Psychology Service XXXX Telephone Number: XXXX E-mail: XXXX
180

Appendix 5a: End of Study Feedback for Parents School of Psychology
Cardiff University Tower Building,
Park Place Cardiff,
CF10 3AT September 2010 Dear Parent / Carer, Thank you for completing the questionnaire about your child’s sensory processing. Your participation has contributed towards the body of research knowledge about the links between sensory processing difficulties and children’s behaviour in school. As stated in the introductory letter this study aims to answer the following questions:
1. How many children with behavioural, emotional or social problems at school also experience sensory issues?
2. Is there a link between children with sensory difficulties and other diagnoses, such as Attention Deficit Hyperactive Disorder or Dyslexia? (NB. Please note that I am not suggesting that your child might have another diagnosis.)
3. Do children show a similar pattern of sensory processing at home and at school?
To date, there is very little published research into sensory processing difficulties in the United Kingdom and world wide there has been very little research into the impact of sensory processing difficulties in the field of education. It is hoped that this research will indicate whether sensory processing difficulties are common amongst children identified as having behavioural, emotional or social difficulties at school. If many children in this sample are found to have sensory sensitivities, it will indicate that sensory issues should be routinely considered when supporting children with behavioural, emotional and social difficulties in school. If you have any questions please contact me or my supervisor, Dr Simon Griffey, at the addresses overleaf. Thank you for your time. Yours sincerely, Plum Hutton Chartered Educational Psychologist.
181

Appendix 5a continued: Plum Hutton Dr Simon Griffey, Research Director Educational Psychologist Doctorate in Educational Psychology
Programme Educational Psychology Service XXXX
School of Psychology Cardiff University Tower Building, Park Place Cardiff, CF10 3AT
Telephone Number: XXXX Tel: 029 208 74007 E-mail: XXXX E-mail: [email protected] If you have a complaint, please contact:
Secretary of the Psychology Ethics Committee,
School of Psychology Cardiff University Tower Building, Park Place Cardiff, CF10 3AT
Tel:029 208 70360 Email: [email protected]
182

Appendix 5b: End of study Feedback for SENCOs School of Psychology
Cardiff University Tower Building,
Park Place Cardiff,
CF10 3AT September 2010 Dear SENCo, In September 2010 you were given a short questionnaire (by your link Educational Psychologist) about your knowledge of sensory processing difficulties. Thank you for your time if you have completed and returned this questionnaire. If you have not completed the questionnaire, but would like to do so, I have included another copy with this letter. The purpose of this letter is to thank SENCos for their involvement and to provide you with additional information about the aims of my research. The SENCo questionnaire is part of a larger study which is investigating the following questions:
1. How many children with behavioural, emotional or social problems at school also experience sensory issues?
2. If there is a link between children with sensory difficulties and other diagnoses, such as Attention Deficit Hyperactive Disorder or Dyslexia?
3. Do children show a similar pattern of sensory processing at home and at school?
4. What is the current level of knowledge of SENCos about sensory processing difficulties in schools?
To date, there is very little published research into sensory processing difficulties in the United Kingdom and world wide there has been very little research into the impact of sensory processing difficulties in the field of education. It is hoped that this research will indicate whether sensory processing difficulties are common amongst children identified as having behavioural, emotional or social difficulties (BESD) at school. If many children in this sample are found to have sensory sensitivities, it will indicate that sensory issues should be routinely considered when supporting children with BESD in school. The SENCo questionnaire will help to establish the current level of knowledge about sensory issues in school and whether future teacher training might be beneficial. Participation in this research will contribute towards the body of research knowledge about the links between sensory processing difficulties and children’s behaviour in school. Once again I would like to thank all SENCos who have found the time to support this endeavour.
183

Appendix 5b continued: If you have any questions please contact me or my supervisor, Dr Simon Griffey, at the addresses below. Yours sincerely, Plum Hutton Chartered Educational Psychologist. Plum Hutton Dr Simon Griffey, Research Director Educational Psychologist Doctorate in Educational Psychology
Programme Educational Psychology Service XXXX
School of Psychology Cardiff University Tower Building, Park Place Cardiff, CF10 3AT
Telephone Number: XXXX Tel: 029 208 74007 E-mail: XXXX E-mail: [email protected] If you have a complaint, please contact:
Secretary of the Psychology Ethics Committee,
School of Psychology Cardiff University Tower Building, Park Place Cardiff, CF10 3AT
Tel:029 208 70360 Email: [email protected]
184

Appendix 6: Associations with Background Factors that have a Frequency of < 15. Appendix 6 provides the results for background factors where less than 15 children were rated as having the background difficulty (e.g. ASD or ADHD). Person’s chi-square test was used to analyse the data. While some significant associations were found it was decided that, due to the small numbers of children involved, it would not be appropriate to draw wider conclusions about associations between SPDs and other factors from the results below. Ap.6.1 Factors with No Associations A number of factors showed no associations with any SDQ or Sensory Measures as shown in Table Ap.6.1 below. Table Ap.6.1:
Background factors where no associations were found with SDQ or sensory measures.
Background Factor/Difficulty Rated by
Teacher or Parent
N children rated as having the background
factor or difficulty
Premature birth Parent 11
Child know to have attachment
difficulties
Teacher 11
Dyslexia Parent 6
Dyslexia Teacher 3
Very few pupils were rated as having dyslexia on the two dyslexia measures, so Fisher’s exact test was used to analyse results where more than 25% of the cells had an expected frequency of less than 5. No significant associations were found.
185

Appendix 6 continued:
Ap.6.2 Associations with SSP and SC Total Scores. Associations were found between four background factors and Total Scores on the SSP and/or SC. Table Ap.6.2:
Significant Associations between Background Factors and ‘Total Scores’ on the SSP and SC.
Background Factor N % of
Total
SSP Total (Parent)
SC Total (School)
N with difficulties on
Sensory Total Score
72 64
ASD diagnosis
(Parent) 10 8
x²= 9.54 9.61
p <.005 <.005
ASD Diagnosis
(Teacher) 9 7
x²= Fisher’s 13.39
p <.01 <.001
ADHD diagnosis
(Parent) 9 7
x²= Fisher’s 4.66
p *ns <.05
DCD Diagnosis
(Parent) 4 3
x²= Fisher’s Fisher’s
p *ns <.05*
Notes: ns = non-significant. Non-significant results are shaded. Results were reported as significant if p<.05. For all calculations, degrees of freedom = 1. *Fisher’s exact test was used when more than 25% of the ‘expected count’ cells on the chi-square test was <5.
Only 2 background factors, ASD diagnosis (Teacher & Parent) showed significant
associations with the Total Score on both the parent and teacher sensory
measures. This is commensurate with previous research that has associated SPDs
with ASD (Tomchek & Dunn, 2007; Baranek, 2002; Ermer & Dunn 1998; Dawson &
Watling, 2000; Watling, Deitz & White, 2001).
186

Appendix 6 continued: Ap.6.3 Associations with SSP Subscales
Table Ap.6.3 shows associations between background factors and individual
subscales on the SSP.
Table Ap.6.3
Associations between SSP subscales and children rated as having difficulties in background factors.
Background Factor
N SSP Seeks
Sensation SSP
Auditory SSP
Tactile SSP
Taste
SSP Low Energy/ Weak
SSP Move-ment
SSP Visual & Auditory
N 94 92 40 40 40 33 30 Attachment
diffs.
(Parent)
11
x²= 1.13 3.15 4.72 .001 1.69 6.31 4.72
p =ns =ns <.05 =ns =ns <.05 <.05
ASD diagnosis
(Parent) 10
x²= 0.66 2.57 0.86 5.02 2.52 1.97 2.99
p =ns =ns =ns <.05 =ns =ns =ns
ASD diagnosis
(Teacher) 9
x²= 1.55 1.74 1.04 5.71 1.18 2.12 6.69
p =ns =ns =ns <.05 =ns =ns <.05
ADHD
diagnosis
(Teacher)
8
x²= 3.77 1.38 4.61 0.23 0.07 0.86 1.60
p =ns =ns <.05 =ns =ns =ns =ns
Note: ns = non-significant. Non-significant results are shaded. Results were reported as significant if p<.05For all calculations, degrees of freedom = 1.
Despite significant associations between ‘ASD diagnosis’ and SSP Total Scores,
there were only significant associations between three SSP subscales and ‘ASD
diagnosis’ (both parent and teacher).
187

Appendix 6 continued: Ap.6.4 Associations with SC Subscales. Associations between background factors and individual subscales on the SC were analysed using Pearson’s chi-square test and where appropriate Fisher’s exact test. The results are shown in the table below. Table Ap.6.4
Associations between SC Subscales and Children Rated as Having Difficulties in Background Factors.
Background Factor
N, back-
ground
issue
SC Movement
SC Classroom Behaviour
SC Touch
SC Auditory
SC Visual
N - difficulties on
SC subscales
85 80 75 52 36
ASD Diagnosis
(Parent) 10
x²= 4.12 2.28 3.51 6.11 1.58
p <.05 ns ns <.05 ns
ASD Diagnosis
(Teacher) 9
x²= 4.09 4.66 6.42 14.50 1.46
p <.05 <.05 <.05 <.001 ns
ADHD Diagnosis
(Parent) 9
x²= 0.07 3.95 Fisher’s 1.76 5.02
p ns <.05 ns* ns <.05
DCD Diagnosis
(Parent) 4
x²= Fisher’s Fisher’s Fisher’s Fisher’s Fisher’s
p ns* ns* ns* ns* <.05*
DCD Diagnosis
(Teacher) 3
x²= Fisher’s Fisher’s Fisher’s Fisher’s Fisher’s
p ns* ns* ns* <.05 ns*
Note: ns = non-significant. Non-significant results are shaded. Results were reported as significant if p<.05. For all calculations, degrees of freedom = 1. *Fisher’s exact test was used when more than 25% of the ‘expected count’ cells on the chi-square test was <5.
The only background factor with more than 2 significant associations was the ASD
diagnosis (Teacher), which is unsurprising as links between sensory difficulties and
ASD are well documented.
188

Appendix 6 continued: Ap.6.5 Associations with SC School Factors Analysis of the associations between background factors and school factors on the SC are presented in the table below. Table Ap.6.5
Associations between SC School Factor subscales and children rated as having difficulties in background factors.
Background Factor
N
School Companion School Factors
Tolerance for sensory
input
Sensory seeking /
Registration
Availability for
learning
Attention & Awareness
N -difficulties on
SC subscales
76 75 46 23
ASD diagnosis
(Parent) 10
x²=
6.42 1.60 3.94 1.25
p <.05 ns <.05 ns
ASD Diagnosis
(Teacher) 9
x²=
9.58 3.52 4.23 4.69
p <.005 ns <.05 <.05
ADHD Diagnosis
(Parent) 9
x²=
Fisher’s 0.09 0.42 4.58
p ns* ns ns <.05
Note: ns = non-significant. Non-significant results are shaded. Results were reported as significant if p<.05. For all calculations, degrees of freedom = 1. *Fisher’s exact test was used when more than 25% of the ‘expected count’ cells on the chi-square test was <5.
Like the analysis of other SC subscales and background factors there is no clear
pattern of association except for the ASD diagnosis (Teacher).
189

Appendix 7a Frequency Tables for Comparisons of Parental and Teacher Scores on the SSP and SC Subscales. Key: SSP= Short Sensory Profile SC= Sensory Profile, School Companion PD= Probable Difference (i.e. Probable difficulties) DD= Definite Difference (i.e. Difficulties) SSP Auditory Difficulties or Not * SC Auditory Difficulties Crosstabulation
SC Auditory
Total Typical & PD DD SSP Auditory Typical & PD Count 32 9 41
Expected Count 25.3 15.7 41.0 % within P Aud Not DD
78.0% 22.0% 100.0%
% within T Aud Not DD
39.0% 17.6% 30.8%
% of Total 24.1% 6.8% 30.8% DD Count 50 42 92
Expected Count 56.7 35.3 92.0 % within P Aud Not DD
54.3% 45.7% 100.0%
% within T Aud Not DD
61.0% 82.4% 69.2%
% of Total 37.6% 31.6% 69.2% Total Count 82 51 133
Expected Count 82.0 51.0 133.0 % within P Aud Not DD
61.7% 38.3% 100.0%
% within T Aud Not DD
100.0% 100.0% 100.0%
% of Total 61.7% 38.3% 100.0% Chi-Square Tests
Value df Asymp. Sig. (2-sided)
Exact Sig. (2-sided)
Exact Sig. (1-sided)
Pearson Chi-Square 6.739a 1 .009 Continuity Correctionb 5.773 1 .016 Likelihood Ratio 7.086 1 .008 Fisher's Exact Test .012 .007 Linear-by-Linear Association
6.688 1 .010
N of Valid Cases 133 a. 0 cells (.0%) have expected count less than 5. The minimum expected count is 15.72. b. Computed only for a 2x2 table
190

Appendix 7a continued: SSP Movement Difficulties or Not * SC Movement Difficulties Crosstabulation
SC Movement Not DD
Total Typical & PD DD SSP Movement
Typical & PD Count 46 56 102 Expected Count 41.6 60.4 102.0 % within P Move Not DD
45.1% 54.9% 100.0%
% within T Move Not DD
83.6% 70.0% 75.6%
% of Total 34.1% 41.5% 75.6% DD Count 9 24 33
Expected Count 13.4 19.6 33.0 % within P Move Not DD
27.3% 72.7% 100.0%
% within T Move Not DD
16.4% 30.0% 24.4%
% of Total 6.7% 17.8% 24.4% Total Count 55 80 135
Expected Count 55.0 80.0 135.0 % within P Move Not DD
40.7% 59.3% 100.0%
% within T Move Not DD
100.0% 100.0%
100.0%
% of Total 40.7% 59.3% 100.0% Chi-Square Tests
Value df Asymp. Sig. (2-sided)
Exact Sig. (2-sided)
Exact Sig. (1-sided)
Pearson Chi-Square 3.281a 1 .070 Continuity Correctionb 2.585 1 .108 Likelihood Ratio 3.400 1 .065 Fisher's Exact Test .102 .052 Linear-by-Linear Association
3.257 1 .071
N of Valid Cases 135 a. 0 cells (.0%) have expected count less than 5. The minimum expected count is 13.44. b. Computed only for a 2x2 table
191

Appendix 7a continued:
SSP Tactile Difficulties or Not * SC Tactile Difficulties Crosstabulation
SC Tactile
Total Typical & PD DD SSP Tactile Typical & PD Count 51 43 94
Expected Count 45.6 48.4 94.0 % within P Tactile Not DD
54.3% 45.7% 100.0%
% within T Touch Not DD
78.5% 62.3% 70.1%
% of Total 38.1% 32.1% 70.1% DD Count 14 26 40
Expected Count 19.4 20.6 40.0 % within P Tactile Not DD
35.0% 65.0% 100.0%
% within T Touch Not DD
21.5% 37.7% 29.9%
% of Total 10.4% 19.4% 29.9% Total Count 65 69 134
Expected Count 65.0 69.0 134.0 % within P Tactile Not DD
48.5% 51.5% 100.0%
% within T Touch Not DD
100.0% 100.0% 100.0%
% of Total 48.5% 51.5% 100.0% Chi-Square Tests
Value df Asymp. Sig. (2-sided)
Exact Sig. (2-sided)
Exact Sig. (1-sided)
Pearson Chi-Square 4.165a 1 .041 Continuity Correctionb 3.430 1 .064 Likelihood Ratio 4.218 1 .040 Fisher's Exact Test .058 .032 Linear-by-Linear Association
4.134 1 .042
N of Valid Cases 134 a. 0 cells (.0%) have expected count less than 5. The minimum expected count is 19.40. b. Computed only for a 2x2 table
192

Appendix 7a continued:
SSP Sensory Seeking Difficulties * SC SF1 Seeking/Registration Difficulties or Not Crosstabulation
SC SF1 Seeking /Registration
Total Typical & PD DD P Seeking Not DD
Typical & PD Count 27 14 41 Expected Count 19.4 21.6 41.0 % within P Under Not DD
65.9% 34.1% 100.0%
% within T SF1 SeekReg Not DD
42.2% 19.7% 30.4%
% of Total 20.0% 10.4% 30.4% DD Count 37 57 94
Expected Count 44.6 49.4 94.0 % within P Under Not DD
39.4% 60.6% 100.0%
% within T SF1 SeekReg Not DD
57.8% 80.3% 69.6%
% of Total 27.4% 42.2% 69.6% Total Count 64 71 135
Expected Count 64.0 71.0 135.0 % within P Under Not DD
47.4% 52.6% 100.0%
% within T SF1 SeekReg Not DD
100.0% 100.0%
100.0%
% of Total 47.4% 52.6% 100.0% Chi-Square Tests
Value df Asymp. Sig. (2-sided)
Exact Sig. (2-sided)
Exact Sig. (1-sided)
Pearson Chi-Square 8.036a 1 .005 Continuity Correctionb 7.009 1 .008 Likelihood Ratio 8.119 1 .004 Fisher's Exact Test .005 .004 Linear-by-Linear Association
7.976 1 .005
N of Valid Cases 135 a. 0 cells (.0%) have expected count less than 5. The minimum expected count is 19.44. b. Computed only for a 2x2 table
193

Appendix 7a continued: SSP Visual/Auditory Difficulties or Not * SC Visual Difficulties Crosstabulation
SC Visual
Total Typical & PD DD SSP Visual/ Auditory
Typical & PD Count 77 26 103 Expected Count 75.1 27.9 103.0 % within P VisAud Not DD
74.8% 25.2% 100.0%
% within T Vis Not DD 79.4% 72.2% 77.4% % of Total 57.9% 19.5% 77.4%
DD Count 20 10 30 Expected Count 21.9 8.1 30.0 % within P VisAud Not DD
66.7% 33.3% 100.0%
% within T Vis Not DD 20.6% 27.8% 22.6% % of Total 15.0% 7.5% 22.6%
Total Count 97 36 133 Expected Count 97.0 36.0 133.0 % within P VisAud Not DD
72.9% 27.1% 100.0%
% within T Vis Not DD 100.0% 100.0%
100.0%
% of Total 72.9% 27.1% 100.0% Chi-Square Tests
Value df Asymp. Sig. (2-sided)
Exact Sig. (2-sided)
Exact Sig. (1-sided)
Pearson Chi-Square .770a 1 .380 Continuity Correctionb .415 1 .519 Likelihood Ratio .748 1 .387 Fisher's Exact Test .484 .256 Linear-by-Linear Association
.765 1 .382
N of Valid Cases 133 a. 0 cells (.0%) have expected count less than 5. The minimum expected count is 8.12. b. Computed only for a 2x2 table
194

Appendix 7a continued: SSP Total Difficulties or Not * SC Total Difficulties or Not Crosstabulation
SC Total Diffs Total Typical & PD DD
SSP Total Difficulties
Typical & PD Count 42 17 59 Expected Count 32.4 26.6 59.0 % within P Total Not DD
71.2% 28.8% 100.0%
% within T Total Not DD
58.3% 28.8% 45.0%
% of Total 32.1% 13.0% 45.0% DD Count 30 42 72
Expected Count 39.6 32.4 72.0 % within P Total Not DD
41.7% 58.3% 100.0%
% within T Total Not DD
41.7% 71.2% 55.0%
% of Total 22.9% 32.1% 55.0% Total Count 72 59 131
Expected Count 72.0 59.0 131.0 % within P Total Not DD
55.0% 45.0% 100.0%
% within T Total Not DD
100.0% 100.0% 100.0%
% of Total 55.0% 45.0% 100.0% Chi-Square Tests
Value df Asymp. Sig. (2-sided)
Exact Sig. (2-sided)
Exact Sig. (1-sided)
Pearson Chi-Square 11.416a 1 .001 Continuity Correctionb 10.254 1 .001 Likelihood Ratio 11.653 1 .001 Fisher's Exact Test .001 .001 Linear-by-Linear Association
11.328 1 .001
N of Valid Cases 131 a. 0 cells (.0%) have expected count less than 5. The minimum expected count is 26.57. b. Computed only for a 2x2 table
195

Appendix 7a continued: SSP Assessed by an Occupational Therapist or Not * SC Assessed by an OT or Not Crosstabulation
SC OT assessment
Total no or Not sure Yes SSP OT assessment
no or Not sure Count 91 3 94 Expected Count 82.1 11.9 94.0 % within PB5 OT recode
96.8% 3.2% 100.0%
% within TB3 OT recode
82.7% 18.8% 74.6%
% of Total 72.2% 2.4% 74.6% Yes Count 19 13 32
Expected Count 27.9 4.1 32.0 % within PB5 OT recode
59.4% 40.6% 100.0%
% within TB3 OT recode
17.3% 81.3% 25.4%
% of Total 15.1% 10.3% 25.4% Total Count 110 16 126
Expected Count 110.0 16.0 126.0 % within PB5 OT recode
87.3% 12.7% 100.0%
% within TB3 OT recode
100.0% 100.0%
100.0%
% of Total 87.3% 12.7% 100.0% Chi-Square Tests
Value df Asymp. Sig. (2-sided)
Exact Sig. (2-sided)
Exact Sig. (1-sided)
Pearson Chi-Square
30.176a 1 .000
Continuity Correctionb
26.893 1 .000
Likelihood Ratio 26.113 1 .000 Fisher's Exact Test .000 .000 Linear-by-Linear Association
29.936 1 .000
N of Valid Cases 126 a. 1 cells (25.0%) have expected count less than 5. The minimum expected count is 4.06. b. Computed only for a 2x2 table
196

Appendix 7b Frequency Tables for Associations between Parental Background Factor 2 (Fussy Baby) and SSP and SC Subscales. Key: SSP= Short Sensory Profile SC Sensory Profile School Companion PD= Probable Difference (i.e. Probable difficulties) DD= Definite Difference (i.e. Difficulties) PB3 Fussy Baby * SSP Tactile Difficulties Crosstab
SSP Tactile Not DD
Total Typical & PD DD PB3 Fussy baby no or Not sure Count 73 15 88
Expected Count 63.6 24.4 88.0 Yes Count 21 21 42
Expected Count 30.4 11.6 42.0 Total Count 94 36 130
Expected Count 94.0 36.0 130.0 Chi-Square Tests
Value df Asymp. Sig. (2-sided)
Exact Sig. (2-sided)
Exact Sig. (1-sided)
Point Probability
Pearson Chi-Square 15.420a 1 .000 .000 .000 Continuity Correctionb 13.818 1 .000 Likelihood Ratio 14.819 1 .000 .000 .000 Fisher's Exact Test .000 .000 Linear-by-Linear Association
15.301c 1 .000 .000 .000 .000
N of Valid Cases 130 a. 0 cells (.0%) have expected count less than 5. The minimum expected count is 11.63. b. Computed only for a 2x2 table c. The standardized statistic is 3.912.
197

Appendix 7b continued: PB3 Fussy Baby * SSP Taste Difficulties Crosstab
P Taste Not DD
Total Typical & PD DD PB3 Fussy Baby no or Not sure Count 71 17 88
Expected Count 62.3 25.7 88.0 Yes Count 21 21 42
Expected Count 29.7 12.3 42.0 Total Count 92 38 130
Expected Count 92.0 38.0 130.0 Chi-Square Tests
Value df Asymp. Sig. (2-sided)
Exact Sig. (2-sided)
Exact Sig. (1-sided)
Point Probability
Pearson Chi-Square 12.938a 1 .000 .000 .000 Continuity Correctionb 11.497 1 .001 Likelihood Ratio 12.487 1 .000 .001 .000 Fisher's Exact Test .001 .000 Linear-by-Linear Association
12.838c 1 .000 .000 .000 .000
N of Valid Cases 130 a. 0 cells (.0%) have expected count less than 5. The minimum expected count is 12.28. b. Computed only for a 2x2 table c. The standardized statistic is 3.583.
198

Appendix 7b continued: PB3 Fussy Baby * SSP Movement Difficulties Crosstab
SSP Movement
Total Typical & PD DD PB3 Fussy Baby no or Not sure Count 70 18 88
Expected Count 67.2 20.8 88.0 Yes Count 30 13 43
Expected Count 32.8 10.2 43.0 Total Count 100 31 131
Expected Count 100.0 31.0 131.0 Chi-Square Tests
Value df Asymp. Sig. (2-sided)
Exact Sig. (2-sided)
Exact Sig. (1-sided)
Point Probability
Pearson Chi-Square 1.529a 1 .216 .274 .154 Continuity Correctionb 1.035 1 .309 Likelihood Ratio 1.489 1 .222 .274 .154 Fisher's Exact Test .274 .154 Linear-by-Linear Association
1.517c 1 .218 .274 .154 .080
N of Valid Cases 131 a. 0 cells (.0%) have expected count less than 5. The minimum expected count is 10.18. b. Computed only for a 2x2 table c. The standardized statistic is 1.232.
199

Appendix 7b continued: PB3 Fussy Baby * SSP Seeks Sensation Crosstab
SSP Seeks Sensation
Total Typical & PD DD PB3 Fussy Baby no or Not sure Count 33 56 89
Expected Count 27.2 61.8 89.0 Yes Count 7 35 42
Expected Count 12.8 29.2 42.0 Total Count 40 91 131
Expected Count 40.0 91.0 131.0 Chi-Square Tests
Value df Asymp. Sig. (2-sided)
Exact Sig. (2-sided)
Exact Sig. (1-sided)
Point Probability
Pearson Chi-Square 5.605a 1 .018 .025 .013 Continuity Correctionb 4.684 1 .030 Likelihood Ratio 5.999 1 .014 .025 .013 Fisher's Exact Test .025 .013 Linear-by-Linear Association
5.562c 1 .018 .025 .013 .009
N of Valid Cases 131 a. 0 cells (.0%) have expected count less than 5. The minimum expected count is 12.82. b. Computed only for a 2x2 table c. The standardized statistic is 2.358.
200

Appendix 7b continued: PB3 Fussy Baby * SSP Auditory Difficulties Crosstab
SSP Auditory
Total Typical & PD DD PB3 Fussy Baby no or Not sure Count 34 54 88
Expected Count 28.0 60.0 88.0 Yes Count 7 34 41
Expected Count 13.0 28.0 41.0 Total Count 41 88 129
Expected Count 41.0 88.0 129.0 Chi-Square Tests
Value df Asymp. Sig. (2-sided)
Exact Sig. (2-sided)
Exact Sig. (1-sided)
Point Probability
Pearson Chi-Square 5.998a 1 .014 .015 .011 Continuity Correctionb 5.045 1 .025 Likelihood Ratio 6.421 1 .011 .015 .011 Fisher's Exact Test .015 .011 Linear-by-Linear Association
5.952c 1 .015 .015 .011 .008
N of Valid Cases 129 a. 0 cells (.0%) have expected count less than 5. The minimum expected count is 13.03. b. Computed only for a 2x2 table c. The standardized statistic is 2.440.
201

Appendix 7b continued: PB3 Fussy Baby * SSP Low Energy/Weak Difficulties Crosstab
SSP Low Energy
Total Typical & PD DD PB3 Fussy Baby no or Not sure Count 67 20 87
Expected Count 62.0 25.0 87.0 Yes Count 25 17 42
Expected Count 30.0 12.0 42.0 Total Count 92 37 129
Expected Count 92.0 37.0 129.0 Chi-Square Tests
Value df Asymp. Sig. (2-sided)
Exact Sig. (2-sided)
Exact Sig. (1-sided)
Point Probability
Pearson Chi-Square 4.235a 1 .040 .060 .033 Continuity Correctionb 3.423 1 .064 Likelihood Ratio 4.113 1 .043 .060 .033 Fisher's Exact Test .060 .033 Linear-by-Linear Association
4.202c 1 .040 .060 .033 .021
N of Valid Cases 129 a. 0 cells (.0%) have expected count less than 5. The minimum expected count is 12.05. b. Computed only for a 2x2 table c. The standardized statistic is 2.050.
202

Appendix 7b continued: PB3 Fussy Baby * SSP Visual/Auditory Difficulties Crosstab
SSP Visual/Auditory
Total Typical & PD DD PB3 Fussy Baby no or Not sure Count 76 12 88
Expected Count 69.6 18.4 88.0 Yes Count 26 15 41
Expected Count 32.4 8.6 41.0 Total Count 102 27 129
Expected Count 102.0 27.0 129.0 Chi-Square Tests
Value df Asymp. Sig. (2-sided)
Exact Sig. (2-sided)
Exact Sig. (1-sided)
Point Probability
Pearson Chi-Square 8.901a 1 .003 .005 .004 Continuity Correctionb 7.568 1 .006 Likelihood Ratio 8.410 1 .004 .005 .004 Fisher's Exact Test .005 .004 Linear-by-Linear Association
8.832c 1 .003 .005 .004 .003
N of Valid Cases 129 a. 0 cells (.0%) have expected count less than 5. The minimum expected count is 8.58. b. Computed only for a 2x2 table c. The standardized statistic is 2.972.
203

Appendix 7b continued: PB3 Fussy Baby * SSP Total Difficulties Score Crosstab
SSP Total Difficulties
Total Typical & PD DD PB3 Fussy Baby no or Not sure Count 47 39 86
Expected Count 40.0 46.0 86.0 Yes Count 12 29 41
Expected Count 19.0 22.0 41.0 Total Count 59 68 127
Expected Count 59.0 68.0 127.0 Chi-Square Tests
Value df Asymp. Sig. (2-sided)
Exact Sig. (2-sided)
Exact Sig. (1-sided)
Point Probability
Pearson Chi-Square 7.191a 1 .007 .008 .006 Continuity Correctionb 6.207 1 .013 Likelihood Ratio 7.373 1 .007 .008 .006 Fisher's Exact Test .008 .006 Linear-by-Linear Association
7.135c 1 .008 .008 .006 .004
N of Valid Cases 127 a. 0 cells (.0%) have expected count less than 5. The minimum expected count is 19.05. b. Computed only for a 2x2 table c. The standardized statistic is 2.671.
204

Appendix 7b continued: PB3 Fussy Baby * SC Auditory Difficulties Crosstab
SC Auditory Not DD
Total Typical & PD DD PB3 Fussy Baby no or Not sure Count 59 30 89
Expected Count 56.0 33.0 89.0 Yes Count 24 19 43
Expected Count 27.0 16.0 43.0 Total Count 83 49 132
Expected Count 83.0 49.0 132.0 Chi-Square Tests
Value df Asymp. Sig. (2-sided)
Exact Sig. (2-sided)
Exact Sig. (1-sided)
Point Probability
Pearson Chi-Square 1.364a 1 .243 .255 .165 Continuity Correctionb .952 1 .329 Likelihood Ratio 1.350 1 .245 .255 .165 Fisher's Exact Test .255 .165 Linear-by-Linear Association
1.353c 1 .245 .255 .165 .077
N of Valid Cases 132 a. 0 cells (.0%) have expected count less than 5. The minimum expected count is 15.96. b. Computed only for a 2x2 table c. The standardized statistic is 1.163.
205

Appendix 7b continued: PB3 Fussy Baby * SC Visual Difficulties Crosstab
SC Visual Difficulties
Total Typical & PD DD PB3 Fussy Baby no or Not sure Count 67 22 89
Expected Count 66.1 22.9 89.0 Yes Count 31 12 43
Expected Count 31.9 11.1 43.0 Total Count 98 34 132
Expected Count 98.0 34.0 132.0 Chi-Square Tests
Value df Asymp. Sig. (2-sided)
Exact Sig. (2-sided)
Exact Sig. (1-sided)
Point Probability
Pearson Chi-Square .154a 1 .695 .832 .424 Continuity Correctionb .032 1 .857 Likelihood Ratio .153 1 .696 .832 .424 Fisher's Exact Test .678 .424 Linear-by-Linear Association
.153c 1 .696 .832 .424 .154
N of Valid Cases 132 a. 0 cells (.0%) have expected count less than 5. The minimum expected count is 11.08. b. Computed only for a 2x2 table c. The standardized statistic is .391.
206

Appendix 7b continued: PB3 Fussy Baby * SC Movement Difficulties Crosstab
SC Movement Difficulties
Total Typical & PD DD PB3 Fussy Baby no or Not sure Count 32 57 89
Expected Count 35.7 53.3 89.0 Yes Count 21 22 43
Expected Count 17.3 25.7 43.0 Total Count 53 79 132
Expected Count 53.0 79.0 132.0 Chi-Square Tests
Value df Asymp. Sig. (2-sided)
Exact Sig. (2-sided)
Exact Sig. (1-sided)
Point Probability
Pearson Chi-Square 2.002a 1 .157 .186 .110 Continuity Correctionb 1.502 1 .220 Likelihood Ratio 1.986 1 .159 .186 .110 Fisher's Exact Test .186 .110 Linear-by-Linear Association
1.987c 1 .159 .186 .110 .056
N of Valid Cases 132 a. 0 cells (.0%) have expected count less than 5. The minimum expected count is 17.27. b. Computed only for a 2x2 table c. The standardized statistic is -1.410.
207

Appendix 7b continued: PB3 Fussy Baby * SC Tactile Difficulties Crosstab
SC Tactile Difficulties
Total Typical & PD DD PB3 Fussy Baby no or Not sure Count 42 47 89
Expected Count 42.5 46.5 89.0 Yes Count 21 22 43
Expected Count 20.5 22.5 43.0 Total Count 63 69 132
Expected Count 63.0 69.0 132.0 Chi-Square Tests
Value df Asymp. Sig. (2-sided)
Exact Sig. (2-sided)
Exact Sig. (1-sided)
Point Probability
Pearson Chi-Square .031a 1 .859 1.000 .503 Continuity Correctionb .000 1 1.000 Likelihood Ratio .031 1 .859 1.000 .503 Fisher's Exact Test 1.000 .503 Linear-by-Linear Association
.031c 1 .860 1.000 .503 .145
N of Valid Cases 132 a. 0 cells (.0%) have expected count less than 5. The minimum expected count is 20.52. b. Computed only for a 2x2 table c. The standardized statistic is -.177.
208

Appendix 7b continued: PB3 Fussy Baby * SC Classroom Behaviour Difficulties Crosstab
SC Behaviour
Total Typical & PD DD PB3 Fussy Baby no or Not sure Count 37 52 89
Expected Count 37.8 51.2 89.0 Yes Count 19 24 43
Expected Count 18.2 24.8 43.0 Total Count 56 76 132
Expected Count 56.0 76.0 132.0 Chi-Square Tests
Value df Asymp. Sig. (2-sided)
Exact Sig. (2-sided)
Exact Sig. (1-sided)
Point Probability
Pearson Chi-Square .081a 1 .776 .852 .460 Continuity Correctionb .009 1 .923 Likelihood Ratio .081 1 .776 .852 .460 Fisher's Exact Test .852 .460 Linear-by-Linear Association
.080c 1 .777 .852 .460 .143
N of Valid Cases 132 a. 0 cells (.0%) have expected count less than 5. The minimum expected count is 18.24. b. Computed only for a 2x2 table c. The standardized statistic is -.284.
209

Appendix 7b continued: PB3 Fussy Baby * SC School Factor 1 Seeking/Registration Difficulties Crosstab
SC Seeking/Registration
Total Typical & PD DD PB3 Fussy Baby no or Not sure Count 41 48 89
Expected Count 41.8 47.2 89.0 Yes Count 21 22 43
Expected Count 20.2 22.8 43.0 Total Count 62 70 132
Expected Count 62.0 70.0 132.0 Chi-Square Tests
Value df Asymp. Sig. (2-sided)
Exact Sig. (2-sided)
Exact Sig. (1-sided)
Point Probability
Pearson Chi-Square .089a 1 .765 .853 .455 Continuity Correctionb .013 1 .910 Likelihood Ratio .089 1 .765 .853 .455 Fisher's Exact Test .853 .455 Linear-by-Linear Association
.089c 1 .766 .853 .455 .141
N of Valid Cases 132 a. 0 cells (.0%) have expected count less than 5. The minimum expected count is 20.20. b. Computed only for a 2x2 table c. The standardized statistic is -.298.
210
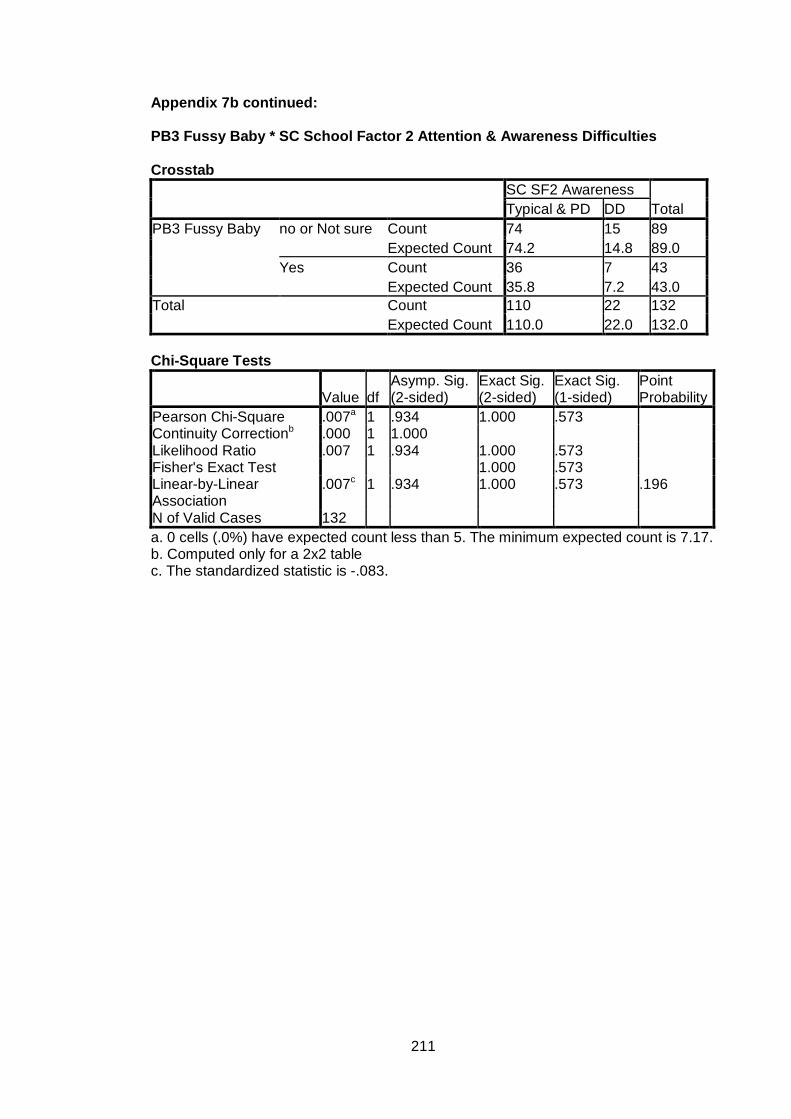
Appendix 7b continued: PB3 Fussy Baby * SC School Factor 2 Attention & Awareness Difficulties Crosstab
SC SF2 Awareness
Total Typical & PD DD PB3 Fussy Baby no or Not sure Count 74 15 89
Expected Count 74.2 14.8 89.0 Yes Count 36 7 43
Expected Count 35.8 7.2 43.0 Total Count 110 22 132
Expected Count 110.0 22.0 132.0 Chi-Square Tests
Value df Asymp. Sig. (2-sided)
Exact Sig. (2-sided)
Exact Sig. (1-sided)
Point Probability
Pearson Chi-Square .007a 1 .934 1.000 .573 Continuity Correctionb .000 1 1.000 Likelihood Ratio .007 1 .934 1.000 .573 Fisher's Exact Test 1.000 .573 Linear-by-Linear Association
.007c 1 .934 1.000 .573 .196
N of Valid Cases 132 a. 0 cells (.0%) have expected count less than 5. The minimum expected count is 7.17. b. Computed only for a 2x2 table c. The standardized statistic is -.083.
211

Appendix 7b continued: PB3 Fussy Baby * SC School Factor 3 Tolerance for Sensory Input Crosstab
SC SF3 Tolerance
Total Typical & PD DD PB3 Fussy Baby no or Not sure Count 41 48 89
Expected Count 41.8 47.2 89.0 Yes Count 21 22 43
Expected Count 20.2 22.8 43.0 Total Count 62 70 132
Expected Count 62.0 70.0 132.0 Chi-Square Tests
Value df Asymp. Sig. (2-sided)
Exact Sig. (2-sided)
Exact Sig. (1-sided)
Point Probability
Pearson Chi-Square .089a 1 .765 .853 .455 Continuity Correctionb .013 1 .910 Likelihood Ratio .089 1 .765 .853 .455 Fisher's Exact Test .853 .455 Linear-by-Linear Association
.089c 1 .766 .853 .455 .141
N of Valid Cases 132 a. 0 cells (.0%) have expected count less than 5. The minimum expected count is 20.20. b. Computed only for a 2x2 table c. The standardized statistic is -.298.
212

Appendix 7b continued: PB3 Fussy Baby * SC School Factor 4 Availability for Learning Crosstab
SC SF4 Availability
Total Typical & PD DD PB3 Fussy Baby no or Not sure Count 58 31 89
Expected Count 60.7 28.3 89.0 Yes Count 32 11 43
Expected Count 29.3 13.7 43.0 Total Count 90 42 132
Expected Count 90.0 42.0 132.0 Chi-Square Tests
Value df Asymp. Sig. (2-sided)
Exact Sig. (2-sided)
Exact Sig. (1-sided)
Point Probability
Pearson Chi-Square 1.143a 1 .285 .324 .193 Continuity Correctionb .757 1 .384 Likelihood Ratio 1.169 1 .280 .324 .193 Fisher's Exact Test .324 .193 Linear-by-Linear Association
1.135c 1 .287 .324 .193 .092
N of Valid Cases 132 a. 0 cells (.0%) have expected count less than 5. The minimum expected count is 13.68. b. Computed only for a 2x2 table c. The standardized statistic is -1.065.
213

Appendix 7b continued: PB3 Fussy Baby * SC Total Difficulties Crosstab
SC Total Difficulties
Total Typical & PD DD PB3 Fussy Baby no or Not sure Count 47 42 89
Expected Count 48.5 40.5 89.0 Yes Count 25 18 43
Expected Count 23.5 19.5 43.0 Total Count 72 60 132
Expected Count 72.0 60.0 132.0 Chi-Square Tests
Value df Asymp. Sig. (2-sided)
Exact Sig. (2-sided)
Exact Sig. (1-sided)
Point Probability
Pearson Chi-Square .332a 1 .564 .582 .349 Continuity Correctionb .152 1 .697 Likelihood Ratio .333 1 .564 .582 .349 Fisher's Exact Test .582 .349 Linear-by-Linear Association
.330c 1 .566 .582 .349 .126
N of Valid Cases 132 a. 0 cells (.0%) have expected count less than 5. The minimum expected count is 19.55. b. Computed only for a 2x2 table c. The standardized statistic is -.574.
214

Appendix 7c Frequency Tables for Associations between Parental Background Factor 4 (Parental Rating of the Child’s Anxiety) and SSP and SC Subscales. Key: P= Parental T= Teacher SSP= Short Sensory Profile SC Sensory Profile School Companion PD= Probable Difference (i.e. Probable difficulties) DD= Definite Difference (i.e. Difficulties) PB4 Anxiety * SSP Tactile Difficulties
Crosstab
SSP Tactile Difficulties
Total Typical & PD DD
PB4 Anxiety no or Not sure Count 60 8 68
Expected Count 49.2 18.8 68.0
Yes Count 34 28 62
Expected Count 44.8 17.2 62.0
Total Count 94 36 130
Expected Count 94.0 36.0 130.0
Chi-Square Tests
Value df
Asymp. Sig.
(2-sided)
Exact Sig.
(2-sided)
Exact Sig.
(1-sided)
Point
Probability
Pearson Chi-Square 18.064a 1 .000 .000 .000
Continuity Correctionb 16.435 1 .000
Likelihood Ratio 18.777 1 .000 .000 .000
Fisher's Exact Test .000 .000
Linear-by-Linear
Association
17.925c 1 .000 .000 .000 .000
N of Valid Cases 130
a. 0 cells (.0%) have expected count less than 5. The minimum expected count is
17.17.
b. Computed only for a 2x2 table
c. The standardized statistic is 4.234.
215

Appendix 7c continued: PB4 Anxiety * SSP Taste Difficulties
Crosstab
SSP Taste Difficulties
Total Typical & PD DD
PB4 Anxiety no or Not sure Count 54 14 68
Expected Count 48.1 19.9 68.0
Yes Count 38 24 62
Expected Count 43.9 18.1 62.0
Total Count 92 38 130
Expected Count 92.0 38.0 130.0
Chi-Square Tests
Value df
Asymp. Sig.
(2-sided)
Exact Sig.
(2-sided)
Exact Sig.
(1-sided)
Point
Probability
Pearson Chi-Square 5.148a 1 .023 .033 .019
Continuity Correctionb 4.309 1 .038
Likelihood Ratio 5.183 1 .023 .033 .019
Fisher's Exact Test .033 .019
Linear-by-Linear
Association
5.109c 1 .024 .033 .019 .012
N of Valid Cases 130
a. 0 cells (.0%) have expected count less than 5. The minimum expected count is
18.12.
b. Computed only for a 2x2 table
c. The standardized statistic is 2.260.
216

Appendix 7c continued: PB4 Anxiety * P Movement Difficulties
Crosstab
SSP Movement
Total Typical & PD DD
PB4 Anxiety no or Not sure Count 59 10 69
Expected Count 52.7 16.3 69.0
Yes Count 41 21 62
Expected Count 47.3 14.7 62.0
Total Count 100 31 131
Expected Count 100.0 31.0 131.0
Chi-Square Tests
Value df
Asymp. Sig.
(2-sided)
Exact Sig.
(2-sided)
Exact Sig.
(1-sided)
Point
Probability
Pearson Chi-Square 6.789a 1 .009 .013 .008
Continuity Correctionb 5.758 1 .016
Likelihood Ratio 6.873 1 .009 .013 .008
Fisher's Exact Test .013 .008
Linear-by-Linear
Association
6.737c 1 .009 .013 .008 .006
N of Valid Cases 131
a. 0 cells (.0%) have expected count less than 5. The minimum expected count is
14.67.
b. Computed only for a 2x2 table
c. The standardized statistic is 2.596.
217

Appendix 7c continued: PB4 Anxiety * SSP Seeks Sensation Difficulties
Crosstab
SSP Seeks Sensation
Total Typical & PD DD
PB4 Anxiety no or Not sure Count 24 45 69
Expected Count 21.1 47.9 69.0
Yes Count 16 46 62
Expected Count 18.9 43.1 62.0
Total Count 40 91 131
Expected Count 40.0 91.0 131.0
Chi-Square Tests
Value df
Asymp. Sig.
(2-sided)
Exact Sig.
(2-sided)
Exact Sig.
(1-sided)
Point
Probability
Pearson Chi-Square 1.240a 1 .265 .342 .178
Continuity Correctionb .853 1 .356
Likelihood Ratio 1.248 1 .264 .342 .178
Fisher's Exact Test .342 .178
Linear-by-Linear
Association
1.231c 1 .267 .342 .178 .082
N of Valid Cases 131
a. 0 cells (.0%) have expected count less than 5. The minimum expected count is
18.93.
b. Computed only for a 2x2 table
c. The standardized statistic is 1.110.
218

Appendix 7c continued: PB4 Anxiety * SSP Auditory Difficulties
Crosstab
SSP Auditory
Total Typical & PD DD
PB4 Anxiety no or Not sure Count 31 37 68
Expected Count 21.6 46.4 68.0
Yes Count 10 51 61
Expected Count 19.4 41.6 61.0
Total Count 41 88 129
Expected Count 41.0 88.0 129.0
Chi-Square Tests
Value df
Asymp. Sig.
(2-sided)
Exact Sig.
(2-sided)
Exact Sig.
(1-sided)
Point
Probability
Pearson Chi-Square 12.641a 1 .000 .001 .000
Continuity Correctionb 11.330 1 .001
Likelihood Ratio 13.141 1 .000 .001 .000
Fisher's Exact Test .001 .000
Linear-by-Linear
Association
12.543c 1 .000 .001 .000 .000
N of Valid Cases 129
a. 0 cells (.0%) have expected count less than 5. The minimum expected count is
19.39.
b. Computed only for a 2x2 table
c. The standardized statistic is 3.542.
219

Appendix 7c continued: PB4 Anxiety * SSP Low Energy Crosstab
SSP Low Energy
Total Typical & PD DD
PB4 Anxiety no or Not sure Count 55 13 68
Expected Count 48.5 19.5 68.0
Yes Count 37 24 61
Expected Count 43.5 17.5 61.0
Total Count 92 37 129
Expected Count 92.0 37.0 129.0
Chi-Square Tests
Value df
Asymp. Sig.
(2-sided)
Exact Sig.
(2-sided)
Exact Sig.
(1-sided)
Point
Probability
Pearson Chi-Square 6.431a 1 .011 .012 .009
Continuity Correctionb 5.480 1 .019
Likelihood Ratio 6.485 1 .011 .019 .009
Fisher's Exact Test .019 .009
Linear-by-Linear
Association
6.381c 1 .012 .012 .009 .006
N of Valid Cases 129
a. 0 cells (.0%) have expected count less than 5. The minimum expected count is
17.50.
b. Computed only for a 2x2 table
c. The standardized statistic is 2.526.
220

Appendix 7c continued: PB4 Anxiety * SSP Visual/Auditory Difficulties Crosstab
SSP Visual/Auditory
Total Typical & PD DD
PB4 Anxiety no or Not sure Count 61 6 67
Expected Count 53.0 14.0 67.0
Yes Count 41 21 62
Expected Count 49.0 13.0 62.0
Total Count 102 27 129
Expected Count 102.0 27.0 129.0
Chi-Square Tests
Value df
Asymp. Sig.
(2-sided)
Exact Sig.
(2-sided)
Exact Sig.
(1-sided)
Point
Probability
Pearson Chi-Square 12.079a 1 .001 .001 .000
Continuity Correctionb 10.621 1 .001
Likelihood Ratio 12.579 1 .000 .001 .000
Fisher's Exact Test .001 .000
Linear-by-Linear
Association
11.986c 1 .001 .001 .000 .000
N of Valid Cases 129
a. 0 cells (.0%) have expected count less than 5. The minimum expected count is
12.98.
b. Computed only for a 2x2 table
c. The standardized statistic is 3.462.
221
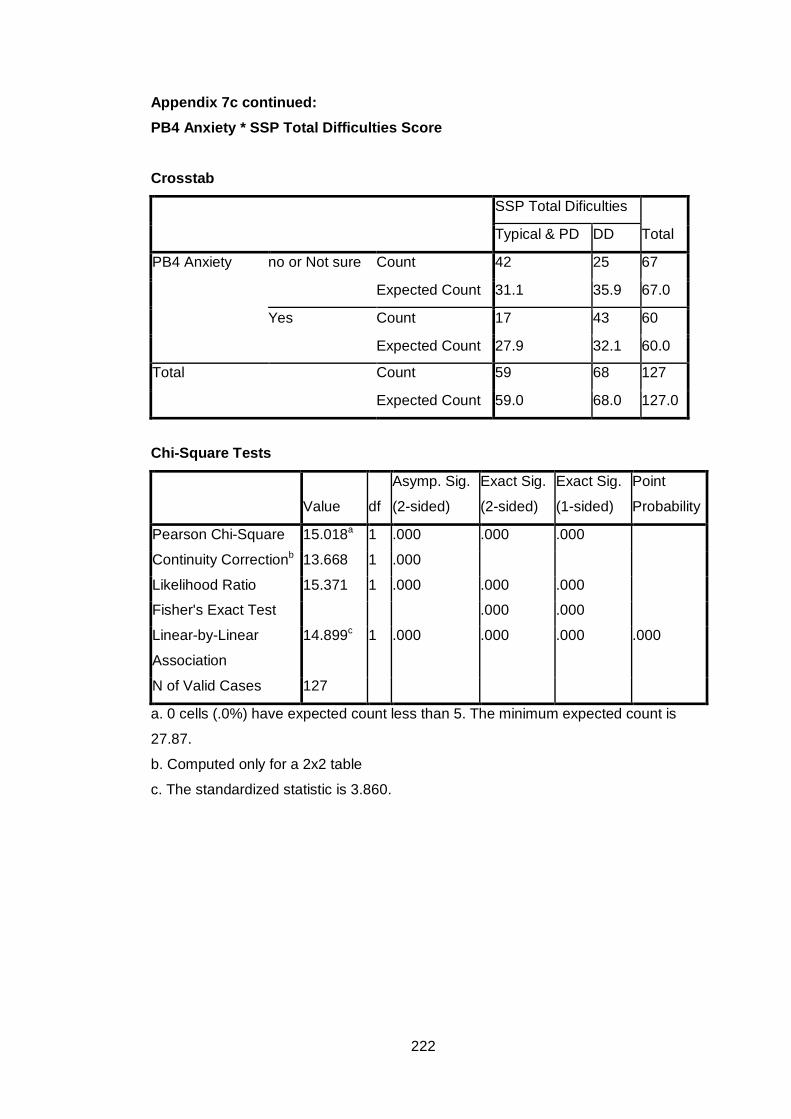
Appendix 7c continued: PB4 Anxiety * SSP Total Difficulties Score
Crosstab
SSP Total Dificulties
Total Typical & PD DD
PB4 Anxiety no or Not sure Count 42 25 67
Expected Count 31.1 35.9 67.0
Yes Count 17 43 60
Expected Count 27.9 32.1 60.0
Total Count 59 68 127
Expected Count 59.0 68.0 127.0
Chi-Square Tests
Value df
Asymp. Sig.
(2-sided)
Exact Sig.
(2-sided)
Exact Sig.
(1-sided)
Point
Probability
Pearson Chi-Square 15.018a 1 .000 .000 .000
Continuity Correctionb 13.668 1 .000
Likelihood Ratio 15.371 1 .000 .000 .000
Fisher's Exact Test .000 .000
Linear-by-Linear
Association
14.899c 1 .000 .000 .000 .000
N of Valid Cases 127
a. 0 cells (.0%) have expected count less than 5. The minimum expected count is
27.87.
b. Computed only for a 2x2 table
c. The standardized statistic is 3.860.
222

Appendix 7c continued: PB4 Anxiety * SC Auditory Difficulties
Crosstab
SC Auditory
Total Typical & PD DD
PB4 Anxiety no or Not sure Count 46 24 70
Expected Count 44.0 26.0 70.0
Yes Count 37 25 62
Expected Count 39.0 23.0 62.0
Total Count 83 49 132
Expected Count 83.0 49.0 132.0
Chi-Square Tests
Value df
Asymp. Sig.
(2-sided)
Exact Sig.
(2-sided)
Exact Sig.
(1-sided)
Point
Probability
Pearson Chi-Square .513a 1 .474 .588 .296
Continuity Correctionb .287 1 .592
Likelihood Ratio .513 1 .474 .588 .296
Fisher's Exact Test .588 .296
Linear-by-Linear
Association
.509c 1 .475 .588 .296 .111
N of Valid Cases 132
a. 0 cells (.0%) have expected count less than 5. The minimum expected count is
23.02.
b. Computed only for a 2x2 table
c. The standardized statistic is .714.
223

Appendix 7c continued: PB4 Anxiety * SC Visual Difficulties
Crosstab
SC Visual
Total Typical & PD DD
PB4 Anxiety no or Not sure Count 58 12 70
Expected Count 52.0 18.0 70.0
Yes Count 40 22 62
Expected Count 46.0 16.0 62.0
Total Count 98 34 132
Expected Count 98.0 34.0 132.0
Chi-Square Tests
Value df
Asymp. Sig.
(2-sided)
Exact Sig.
(2-sided)
Exact Sig.
(1-sided)
Point
Probability
Pearson Chi-Square 5.784a 1 .016 .018 .014
Continuity Correctionb 4.864 1 .027
Likelihood Ratio 5.825 1 .016 .018 .014
Fisher's Exact Test .018 .014
Linear-by-Linear
Association
5.740c 1 .017 .018 .014 .009
N of Valid Cases 132
a. 0 cells (.0%) have expected count less than 5. The minimum expected count is
15.97.
b. Computed only for a 2x2 table
c. The standardized statistic is 2.396.
224

Appendix 7c continued: PB4 Anxiety * SC Movement Difficulties
Crosstab
SC Movement
Total Typical & PD DD
PB4 Anxiety no or Not sure Count 28 42 70
Expected Count 28.1 41.9 70.0
Yes Count 25 37 62
Expected Count 24.9 37.1 62.0
Total Count 53 79 132
Expected Count 53.0 79.0 132.0
Chi-Square Tests
Value df
Asymp. Sig.
(2-sided)
Exact Sig.
(2-sided)
Exact Sig.
(1-sided)
Point
Probability
Pearson Chi-Square .001a 1 .970 1.000 .555
Continuity Correctionb .000 1 1.000
Likelihood Ratio .001 1 .970 1.000 .555
Fisher's Exact Test 1.000 .555
Linear-by-Linear
Association
.001c 1 .970 1.000 .555 .141
N of Valid Cases 132
a. 0 cells (.0%) have expected count less than 5. The minimum expected count is
24.89.
b. Computed only for a 2x2 table
c. The standardized statistic is -.038.
225

Appendix 7c continued: PB4 Anxiety * SC Tactile Difficulties
Crosstab
SC Tactile
Total Typical & PD DD
PB4 Anxiety no or Not sure Count 36 34 70
Expected Count 33.4 36.6 70.0
Yes Count 27 35 62
Expected Count 29.6 32.4 62.0
Total Count 63 69 132
Expected Count 63.0 69.0 132.0
Chi-Square Tests
Value df
Asymp. Sig.
(2-sided)
Exact Sig.
(2-sided)
Exact Sig.
(1-sided)
Point
Probability
Pearson Chi-Square .818a 1 .366 .388 .233
Continuity Correctionb .533 1 .465
Likelihood Ratio .819 1 .365 .388 .233
Fisher's Exact Test .388 .233
Linear-by-Linear
Association
.812c 1 .367 .388 .233 .093
N of Valid Cases 132
a. 0 cells (.0%) have expected count less than 5. The minimum expected count is
29.59.
b. Computed only for a 2x2 table
c. The standardized statistic is .901.
226

Appendix 7c continued: PB4 Anxiety * SC Classroom Behaviour Difficulties
Crosstab
SC Behaviour
Total Typical & PD DD
PB4 Anxiety no or Not sure Count 33 37 70
Expected Count 29.7 40.3 70.0
Yes Count 23 39 62
Expected Count 26.3 35.7 62.0
Total Count 56 76 132
Expected Count 56.0 76.0 132.0
Chi-Square Tests
Value df
Asymp. Sig.
(2-sided)
Exact Sig.
(2-sided)
Exact Sig.
(1-sided)
Point
Probability
Pearson Chi-Square 1.358a 1 .244 .291 .161
Continuity Correctionb .978 1 .323
Likelihood Ratio 1.363 1 .243 .291 .161
Fisher's Exact Test .291 .161
Linear-by-Linear
Association
1.348c 1 .246 .291 .161 .072
N of Valid Cases 132
a. 0 cells (.0%) have expected count less than 5. The minimum expected count is
26.30.
b. Computed only for a 2x2 table
c. The standardized statistic is 1.161.
227

Appendix 7c continued: PB4 Anxiety * SC School Factor 1 Sensory Seeking/Registration
Crosstab
SC SF1 Sensory seeking
Total Typical & PD DD
PB4 Anxiety no or Not sure Count 32 38 70
Expected Count 32.9 37.1 70.0
Yes Count 30 32 62
Expected Count 29.1 32.9 62.0
Total Count 62 70 132
Expected Count 62.0 70.0 132.0
Chi-Square Tests
Value df
Asymp. Sig.
(2-sided)
Exact Sig.
(2-sided)
Exact Sig.
(1-sided)
Point
Probability
Pearson Chi-Square .094a 1 .759 .862 .447
Continuity Correctionb .018 1 .895
Likelihood Ratio .094 1 .759 .862 .447
Fisher's Exact Test .862 .447
Linear-by-Linear
Association
.094c 1 .760 .862 .447 .132
N of Valid Cases 132
a. 0 cells (.0%) have expected count less than 5. The minimum expected count is
29.12.
b. Computed only for a 2x2 table
c. The standardized statistic is -.306.
228

Appendix 7c continued: PB4 Anxiety * SC School Factor 2 Attention & Awareness
Crosstab
SC SF2 Awareness
Total Typical & PD DD
PB4 Anxiety no or Not sure Count 63 7 70
Expected Count 58.3 11.7 70.0
Yes Count 47 15 62
Expected Count 51.7 10.3 62.0
Total Count 110 22 132
Expected Count 110.0 22.0 132.0
Chi-Square Tests
Value df
Asymp. Sig.
(2-sided)
Exact Sig.
(2-sided)
Exact Sig.
(1-sided)
Point
Probability
Pearson Chi-Square 4.769a 1 .029 .036 .025
Continuity Correctionb 3.802 1 .051
Likelihood Ratio 4.827 1 .028 .036 .025
Fisher's Exact Test .036 .025
Linear-by-Linear
Association
4.733c 1 .030 .036 .025 .018
N of Valid Cases 132
a. 0 cells (.0%) have expected count less than 5. The minimum expected count is
10.33.
b. Computed only for a 2x2 table
c. The standardized statistic is 2.176.
229

Appendix 7c continued: PB4 Anxiety * SC School Factor 3 Tolerance for Input
Crosstab
SC SF3 Tolerance
Total Typical & PD DD
PB4 Anxiety no or Not sure Count 37 33 70
Expected Count 32.9 37.1 70.0
Yes Count 25 37 62
Expected Count 29.1 32.9 62.0
Total Count 62 70 132
Expected Count 62.0 70.0 132.0
Chi-Square Tests
Value df
Asymp. Sig.
(2-sided)
Exact Sig.
(2-sided)
Exact Sig.
(1-sided)
Point
Probability
Pearson Chi-Square 2.074a 1 .150 .166 .103
Continuity Correctionb 1.601 1 .206
Likelihood Ratio 2.081 1 .149 .166 .103
Fisher's Exact Test .166 .103
Linear-by-Linear
Association
2.058c 1 .151 .166 .103 .050
N of Valid Cases 132
a. 0 cells (.0%) have expected count less than 5. The minimum expected count is
29.12.
b. Computed only for a 2x2 table
c. The standardized statistic is 1.435.
230
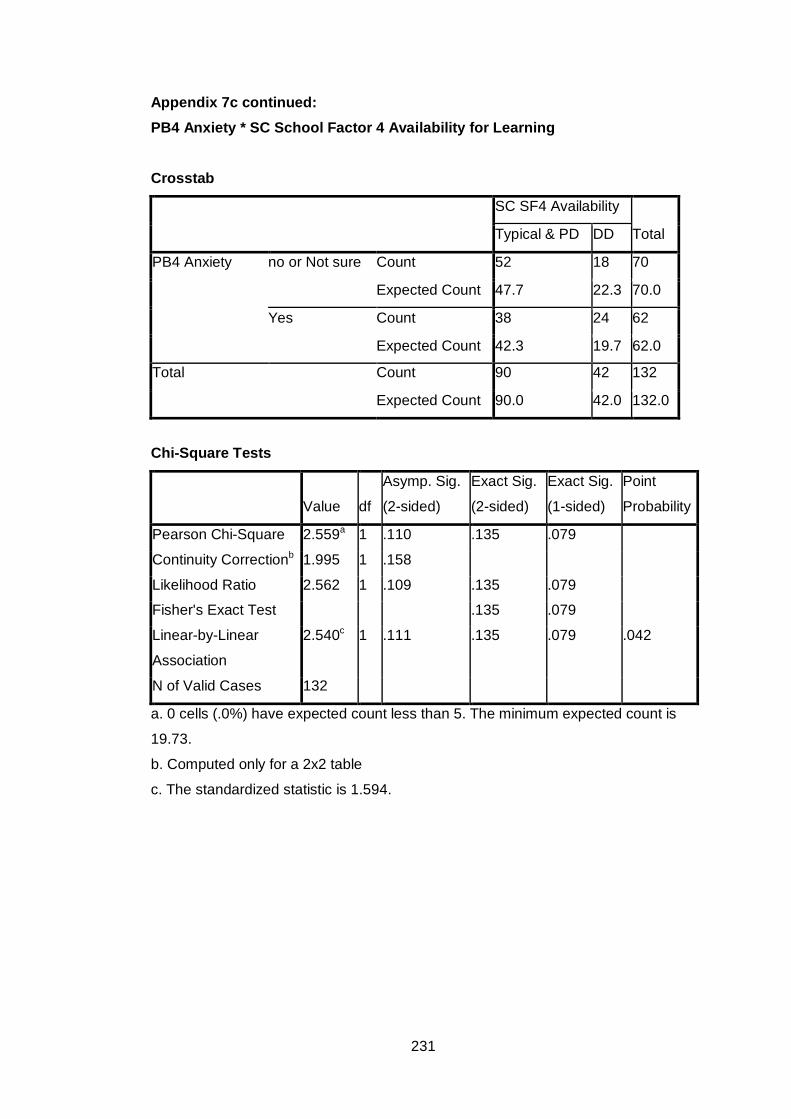
Appendix 7c continued: PB4 Anxiety * SC School Factor 4 Availability for Learning
Crosstab
SC SF4 Availability
Total Typical & PD DD
PB4 Anxiety no or Not sure Count 52 18 70
Expected Count 47.7 22.3 70.0
Yes Count 38 24 62
Expected Count 42.3 19.7 62.0
Total Count 90 42 132
Expected Count 90.0 42.0 132.0
Chi-Square Tests
Value df
Asymp. Sig.
(2-sided)
Exact Sig.
(2-sided)
Exact Sig.
(1-sided)
Point
Probability
Pearson Chi-Square 2.559a 1 .110 .135 .079
Continuity Correctionb 1.995 1 .158
Likelihood Ratio 2.562 1 .109 .135 .079
Fisher's Exact Test .135 .079
Linear-by-Linear
Association
2.540c 1 .111 .135 .079 .042
N of Valid Cases 132
a. 0 cells (.0%) have expected count less than 5. The minimum expected count is
19.73.
b. Computed only for a 2x2 table
c. The standardized statistic is 1.594.
231

Appendix 7c continued: PB4 Anxiety * SC Total Difficulties Score
Crosstab
SC Total Difficulties
Total Typical & PD DD
PB4 Anxiety no or Not sure Count 43 27 70
Expected Count 38.2 31.8 70.0
Yes Count 29 33 62
Expected Count 33.8 28.2 62.0
Total Count 72 60 132
Expected Count 72.0 60.0 132.0
Chi-Square Tests
Value df
Asymp. Sig.
(2-sided)
Exact Sig.
(2-sided)
Exact Sig.
(1-sided)
Point
Probability
Pearson Chi-Square 2.848a 1 .091 .115 .065
Continuity Correctionb 2.287 1 .130
Likelihood Ratio 2.855 1 .091 .115 .065
Fisher's Exact Test .115 .065
Linear-by-Linear
Association
2.826c 1 .093 .115 .065 .034
N of Valid Cases 132
a. 0 cells (.0%) have expected count less than 5. The minimum expected count is
28.18.
b. Computed only for a 2x2 table
c. The standardized statistic is 1.681.
232

Appendix 7d
Frequency Tables for Associations between Parental Background Factor 5 (Assessed by an Occupational Therapist) and SSP and SC Subscales.
Key: SSP= Short Sensory Profile
SC Sensory Profile School Companion PD= Probable Difference (i.e. Probable difficulties) DD= Definite Difference (i.e. Difficulties)
PB5 Assessed by an Occupational Therapist * SSP Tactile Difficulties
Crosstab
SSP Tactile
Total Typical & PD DD
PB5 OT
Assess
no or Not sure Count 70 26 96
Expected Count 69.0 27.0 96.0
Yes Count 22 10 32
Expected Count 23.0 9.0 32.0
Total Count 92 36 128
Expected Count 92.0 36.0 128.0
Chi-Square Tests
Value df
Asymp. Sig.
(2-sided)
Exact Sig.
(2-sided)
Exact Sig.
(1-sided)
Point
Probability
Pearson Chi-Square .206a 1 .650 .821 .404
Continuity Correctionb .052 1 .820
Likelihood Ratio .203 1 .652 .821 .404
Fisher's Exact Test .655 .404
Linear-by-Linear
Association
.205c 1 .651 .821 .404 .159
N of Valid Cases 128
a. 0 cells (.0%) have expected count less than 5. The minimum expected count is 9.00.
b. Computed only for a 2x2 table
c. The standardized statistic is .452.
233

Appendix 7d continued:
PB5 Assessed by an Occupational Therapist * SSP Taste Difficulties
Crosstab
SSP Taste
Total Typical & PD DD
PB5 OT
Assess
no or Not sure Count 67 29 96
Expected Count 67.5 28.5 96.0
Yes Count 23 9 32
Expected Count 22.5 9.5 32.0
Total Count 90 38 128
Expected Count 90.0 38.0 128.0
Chi-Square Tests
Value df
Asymp. Sig.
(2-sided)
Exact Sig.
(2-sided)
Exact Sig.
(1-sided)
Point
Probability
Pearson Chi-Square .050a 1 .823 1.000 .506
Continuity Correctionb .000 1 1.000
Likelihood Ratio .050 1 .823 .830 .506
Fisher's Exact Test 1.000 .506
Linear-by-Linear
Association
.050c 1 .824 1.000 .506 .174
N of Valid Cases 128
a. 0 cells (.0%) have expected count less than 5. The minimum expected count is 9.50.
b. Computed only for a 2x2 table
c. The standardized statistic is -.223.
234

Appendix 7d continued:
PB5 Assessed by an Occupational Therapist * SSP Movement Difficulties Crosstab
SSP Movement
Total Typical & PD DD
PB5 OT
Assess
no or Not sure Count 78 18 96
Expected Count 73.7 22.3 96.0
Yes Count 21 12 33
Expected Count 25.3 7.7 33.0
Total Count 99 30 129
Expected Count 99.0 30.0 129.0
Chi-Square Tests
Value df
Asymp. Sig.
(2-sided)
Exact Sig.
(2-sided)
Exact Sig.
(1-sided)
Point
Probability
Pearson Chi-Square 4.269a 1 .039 .055 .037
Continuity Correctionb 3.339 1 .068
Likelihood Ratio 4.009 1 .045 .055 .037
Fisher's Exact Test .055 .037
Linear-by-Linear
Association
4.236c 1 .040 .055 .037 .024
N of Valid Cases 129
a. 0 cells (.0%) have expected count less than 5. The minimum expected count is 7.67.
b. Computed only for a 2x2 table
c. The standardized statistic is 2.058.
235
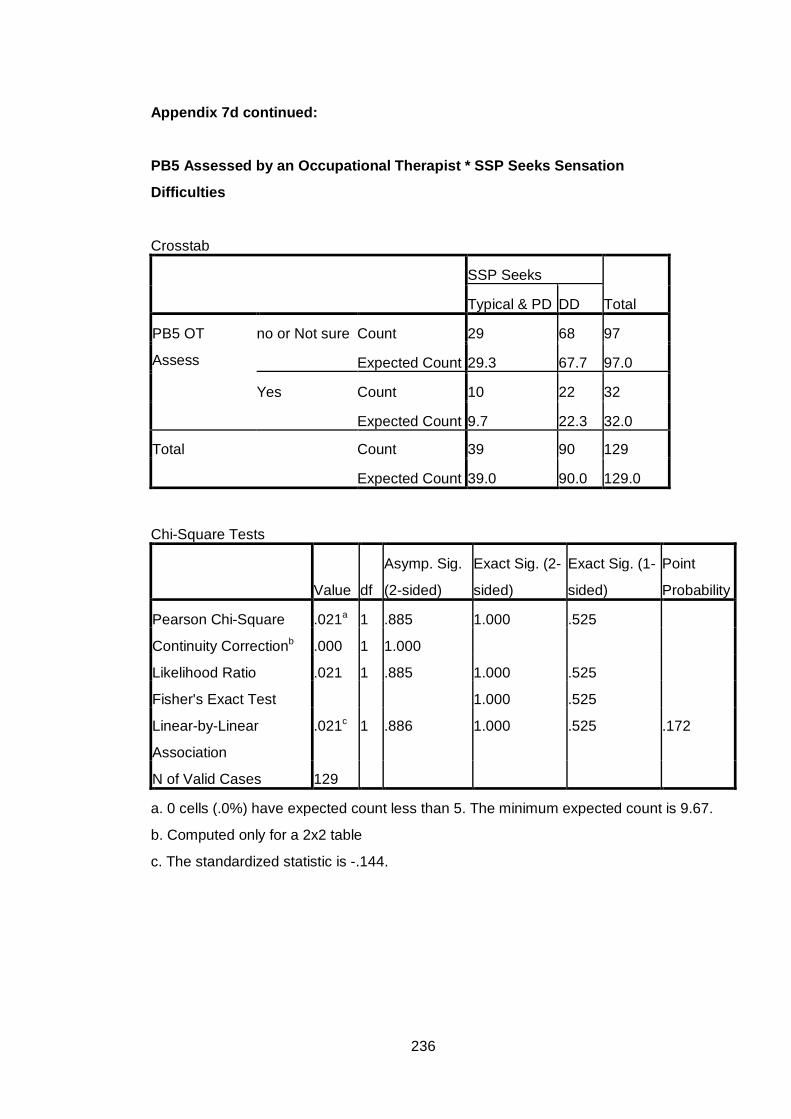
Appendix 7d continued:
PB5 Assessed by an Occupational Therapist * SSP Seeks Sensation
Difficulties
Crosstab
SSP Seeks
Total Typical & PD DD
PB5 OT
Assess
no or Not sure Count 29 68 97
Expected Count 29.3 67.7 97.0
Yes Count 10 22 32
Expected Count 9.7 22.3 32.0
Total Count 39 90 129
Expected Count 39.0 90.0 129.0
Chi-Square Tests
Value df
Asymp. Sig.
(2-sided)
Exact Sig. (2-
sided)
Exact Sig. (1-
sided)
Point
Probability
Pearson Chi-Square .021a 1 .885 1.000 .525
Continuity Correctionb .000 1 1.000
Likelihood Ratio .021 1 .885 1.000 .525
Fisher's Exact Test 1.000 .525
Linear-by-Linear
Association
.021c 1 .886 1.000 .525 .172
N of Valid Cases 129
a. 0 cells (.0%) have expected count less than 5. The minimum expected count is 9.67.
b. Computed only for a 2x2 table
c. The standardized statistic is -.144.
236

Appendix 7d continued:
PB5 Assessed by an Occupational Therapist * SSP Auditory Difficulties Crosstab
SSP Auditory
Total Typical & PD DD
PB5 OT
Assess
no or Not sure Count 33 62 95
Expected Count 29.9 65.1 95.0
Yes Count 7 25 32
Expected Count 10.1 21.9 32.0
Total Count 40 87 127
Expected Count 40.0 87.0 127.0
Chi-Square Tests
Value df
Asymp. Sig.
(2-sided)
Exact Sig.
(2-sided)
Exact Sig.
(1-sided)
Point
Probability
Pearson Chi-Square 1.835a 1 .176 .195 .127
Continuity Correctionb 1.288 1 .256
Likelihood Ratio 1.922 1 .166 .195 .127
Fisher's Exact Test .195 .127
Linear-by-Linear
Association
1.821c 1 .177 .195 .127 .073
N of Valid Cases 127
a. 0 cells (.0%) have expected count less than 5. The minimum expected count is
10.08.
b. Computed only for a 2x2 table
c. The standardized statistic is 1.349.
237

Appendix 7d continued:
PB5 Assessed by an Occupational Therapist * SSP Low Energy
Crosstab
SSP Low Energy
Total Typical & PD DD
PB5 OT
Assess
no or Not sure Count 74 22 96
Expected Count 68.0 28.0 96.0
Yes Count 16 15 31
Expected Count 22.0 9.0 31.0
Total Count 90 37 127
Expected Count 90.0 37.0 127.0
Chi-Square Tests
Value df
Asymp. Sig.
(2-sided)
Exact Sig.
(2-sided)
Exact Sig.
(1-sided)
Point
Probability
Pearson Chi-Square 7.363a 1 .007 .011 .008
Continuity Correctionb 6.181 1 .013
Likelihood Ratio 6.960 1 .008 .011 .008
Fisher's Exact Test .011 .008
Linear-by-Linear
Association
7.305c 1 .007 .011 .008 .005
N of Valid Cases 127
a. 0 cells (.0%) have expected count less than 5. The minimum expected count is
9.03.
b. Computed only for a 2x2 table
c. The standardized statistic is 2.703.
238
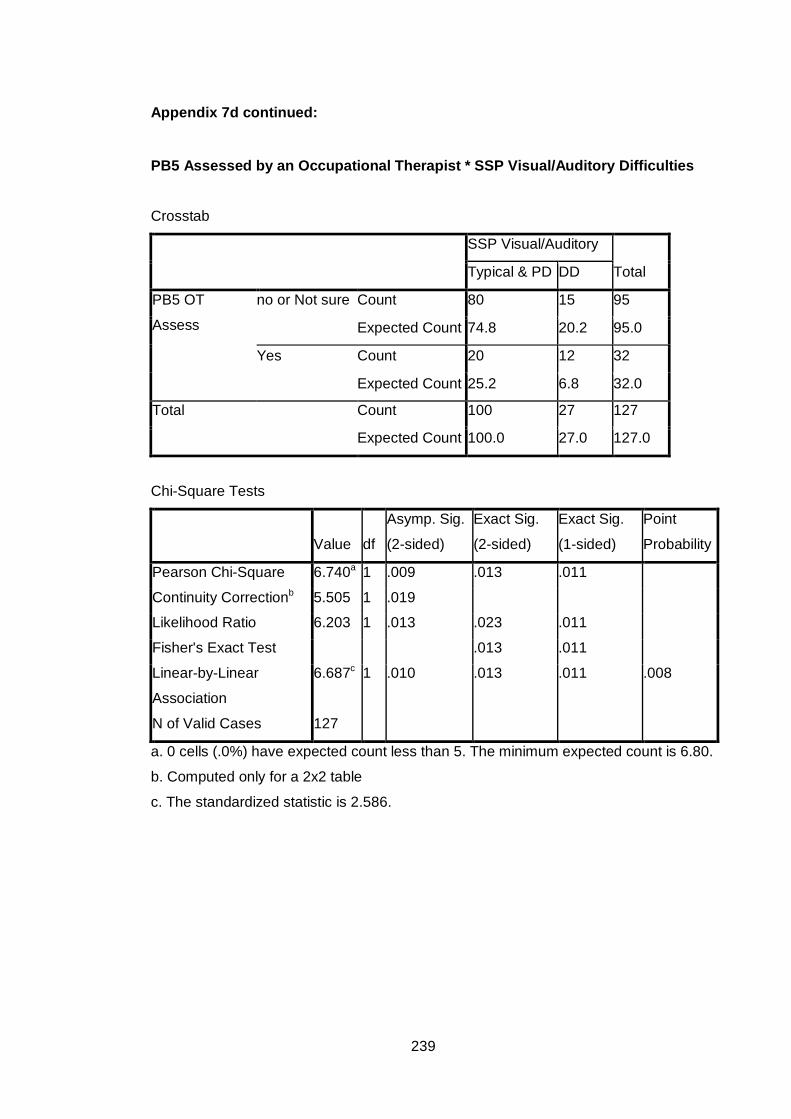
Appendix 7d continued:
PB5 Assessed by an Occupational Therapist * SSP Visual/Auditory Difficulties Crosstab
SSP Visual/Auditory
Total Typical & PD DD
PB5 OT
Assess
no or Not sure Count 80 15 95
Expected Count 74.8 20.2 95.0
Yes Count 20 12 32
Expected Count 25.2 6.8 32.0
Total Count 100 27 127
Expected Count 100.0 27.0 127.0
Chi-Square Tests
Value df
Asymp. Sig.
(2-sided)
Exact Sig.
(2-sided)
Exact Sig.
(1-sided)
Point
Probability
Pearson Chi-Square 6.740a 1 .009 .013 .011
Continuity Correctionb 5.505 1 .019
Likelihood Ratio 6.203 1 .013 .023 .011
Fisher's Exact Test .013 .011
Linear-by-Linear
Association
6.687c 1 .010 .013 .011 .008
N of Valid Cases 127
a. 0 cells (.0%) have expected count less than 5. The minimum expected count is 6.80.
b. Computed only for a 2x2 table
c. The standardized statistic is 2.586.
239

Appendix 7d continued:
PB5 Assessed by an Occupational Therapist * SSP Total Difficulties Score
Crosstab
SSP Total Diffs
Total Typical & PD DD
PB5 OT
Assess
no or Not sure Count 50 44 94
Expected Count 43.6 50.4 94.0
Yes Count 8 23 31
Expected Count 14.4 16.6 31.0
Total Count 58 67 125
Expected Count 58.0 67.0 125.0
Chi-Square Tests
Value df
Asymp. Sig.
(2-sided)
Exact Sig.
(2-sided)
Exact Sig.
(1-sided)
Point
Probability
Pearson Chi-Square 7.029a 1 .008 .012 .007
Continuity Correctionb 5.971 1 .015
Likelihood Ratio 7.306 1 .007 .012 .007
Fisher's Exact Test .012 .007
Linear-by-Linear
Association
6.973c 1 .008 .012 .007 .005
N of Valid Cases 125
a. 0 cells (.0%) have expected count less than 5. The minimum expected count is
14.38.
b. Computed only for a 2x2 table
c. The standardized statistic is 2.641.
240

Appendix 7d continued:
PB5 Assessed by an Occupational Therapist * SC Auditory Difficulties Crosstab
SC Auditory
Total Typical & PD DD
PB5 OT
Assess
no or Not sure Count 62 35 97
Expected Count 60.4 36.6 97.0
Yes Count 19 14 33
Expected Count 20.6 12.4 33.0
Total Count 81 49 130
Expected Count 81.0 49.0 130.0
Chi-Square Tests
Value df
Asymp. Sig.
(2-sided)
Exact Sig.
(2-sided)
Exact Sig.
(1-sided)
Point
Probability
Pearson Chi-Square .422a 1 .516 .538 .327
Continuity Correctionb .195 1 .659
Likelihood Ratio .418 1 .518 .538 .327
Fisher's Exact Test .538 .327
Linear-by-Linear
Association
.418c 1 .518 .538 .327 .132
N of Valid Cases 130
a. 0 cells (.0%) have expected count less than 5. The minimum expected count is
12.44.
b. Computed only for a 2x2 table
c. The standardized statistic is .647.
241

Appendix 7d continued:
PB5 Assessed by an Occupational Therapist * SC Visual Difficulties Crosstab
SC Visual
Total Typical & PD DD
PB5 OT
Assess
no or Not sure Count 77 20 97
Expected Count 71.6 25.4 97.0
Yes Count 19 14 33
Expected Count 24.4 8.6 33.0
Total Count 96 34 130
Expected Count 96.0 34.0 130.0
Chi-Square Tests
Value df
Asymp. Sig.
(2-sided)
Exact Sig.
(2-sided)
Exact Sig.
(1-sided)
Point
Probability
Pearson Chi-Square 6.062a 1 .014 .021 .015
Continuity Correctionb 4.986 1 .026
Likelihood Ratio 5.706 1 .017 .021 .015
Fisher's Exact Test .021 .015
Linear-by-Linear
Association
6.015c 1 .014 .021 .015 .010
N of Valid Cases 130
a. 0 cells (.0%) have expected count less than 5. The minimum expected count is 8.63.
b. Computed only for a 2x2 table
c. The standardized statistic is 2.453.
242

Appendix 7d continued:
PB5 Assessed by an Occupational Therapist * SC Movement Difficulties Crosstab
SC Movement
Total Typical & PD DD
PB5 OT
Assess
no or Not sure Count 41 56 97
Expected Count 39.5 57.5 97.0
Yes Count 12 21 33
Expected Count 13.5 19.5 33.0
Total Count 53 77 130
Expected Count 53.0 77.0 130.0
Chi-Square Tests
Value df
Asymp. Sig.
(2-sided)
Exact Sig.
(2-sided)
Exact Sig.
(1-sided)
Point
Probability
Pearson Chi-Square .355a 1 .551 .682 .350
Continuity Correctionb .153 1 .696
Likelihood Ratio .359 1 .549 .682 .350
Fisher's Exact Test .682 .350
Linear-by-Linear
Association
.353c 1 .553 .682 .350 .138
N of Valid Cases 130
a. 0 cells (.0%) have expected count less than 5. The minimum expected count is 13.45.
b. Computed only for a 2x2 table
c. The standardized statistic is .594.
243

Appendix 7d continued:
PB5 Assessed by an Occupational Therapist * SC Tactile Difficulties Crosstab
SC Tactile
Total Typical & PD DD
PB5 OT
Assess
no or Not sure Count 49 48 97
Expected Count 47.0 50.0 97.0
Yes Count 14 19 33
Expected Count 16.0 17.0 33.0
Total Count 63 67 130
Expected Count 63.0 67.0 130.0
Chi-Square Tests
Value df
Asymp. Sig.
(2-sided)
Exact Sig.
(2-sided)
Exact Sig.
(1-sided)
Point
Probability
Pearson Chi-Square .645a 1 .422 .546 .274
Continuity Correctionb .362 1 .547
Likelihood Ratio .648 1 .421 .546 .274
Fisher's Exact Test .546 .274
Linear-by-Linear
Association
.640c 1 .424 .546 .274 .117
N of Valid Cases 130
a. 0 cells (.0%) have expected count less than 5. The minimum expected count is 15.99.
b. Computed only for a 2x2 table
c. The standardized statistic is .800.
244

Appendix 7d continued:
PB5 Assessed by an Occupational Therapist * SC Classroom Behaviour
Difficulties
Crosstab
SC Behaviour
Total Typical & PD DD
PB5 OT
Assess
no or Not sure Count 42 55 97
Expected Count 41.0 56.0 97.0
Yes Count 13 20 33
Expected Count 14.0 19.0 33.0
Total Count 55 75 130
Expected Count 55.0 75.0 130.0
Chi-Square Tests
Value df
Asymp. Sig.
(2-sided)
Exact Sig.
(2-sided)
Exact Sig.
(1-sided)
Point
Probability
Pearson Chi-Square .154a 1 .695 .839 .427
Continuity Correctionb .035 1 .851
Likelihood Ratio .155 1 .694 .839 .427
Fisher's Exact Test .839 .427
Linear-by-Linear
Association
.153c 1 .696 .839 .427 .151
N of Valid Cases 130
a. 0 cells (.0%) have expected count less than 5. The minimum expected count is
13.96.
b. Computed only for a 2x2 table
c. The standardized statistic is .391.
245

Appendix 7d continued:
PB5 Assessed by an Occupational Therapist * SC School Factor 1 Sensory
Seeking/Registration
Crosstab
SC SF1
Seek/Registration
Total Typical & PD DD
PB5 OT
Assess
no or Not sure Count 48 49 97
Expected Count 46.3 50.7 97.0
Yes Count 14 19 33
Expected Count 15.7 17.3 33.0
Total Count 62 68 130
Expected Count 62.0 68.0 130.0
Chi-Square Tests
Value df
Asymp. Sig.
(2-sided)
Exact Sig.
(2-sided)
Exact Sig.
(1-sided)
Point
Probability
Pearson Chi-Square .492a 1 .483 .548 .309
Continuity Correctionb .250 1 .617
Likelihood Ratio .494 1 .482 .548 .309
Fisher's Exact Test .548 .309
Linear-by-Linear
Association
.488c 1 .485 .548 .309 .126
N of Valid Cases 130
a. 0 cells (.0%) have expected count less than 5. The minimum expected count is
15.74.
b. Computed only for a 2x2 table
c. The standardized statistic is .699.
246

Appendix 7d continued:
PB5 Assessed by an Occupational Therapist * SC School Factor 2 Attention &
Awareness
Crosstab
SC SF2 Awareness
Total Typical & PD DD
PB5 OT
Assess
no or Not sure Count 80 17 97
Expected Count 80.6 16.4 97.0
Yes Count 28 5 33
Expected Count 27.4 5.6 33.0
Total Count 108 22 130
Expected Count 108.0 22.0 130.0
Chi-Square Tests
Value df
Asymp. Sig.
(2-sided)
Exact Sig.
(2-sided)
Exact Sig.
(1-sided)
Point
Probability
Pearson Chi-Square .099a 1 .753 .798 .494
Continuity Correctionb .002 1 .964
Likelihood Ratio .101 1 .751 .798 .494
Fisher's Exact Test 1.000 .494
Linear-by-Linear
Association
.098c 1 .754 .798 .494 .206
N of Valid Cases 130
a. 0 cells (.0%) have expected count less than 5. The minimum expected count is
5.58.
b. Computed only for a 2x2 table
c. The standardized statistic is -.313.
247

Appendix 7d continued:
PB5 Assessed by an Occupational Therapist * SC School Factor 3 Tolerance
for Input
Crosstab
SC SF3 Tolerance
Total Typical & PD DD
PB5 OT
Assess
no or Not sure Count 48 49 97
Expected Count 44.8 52.2 97.0
Yes Count 12 21 33
Expected Count 15.2 17.8 33.0
Total Count 60 70 130
Expected Count 60.0 70.0 130.0
Chi-Square Tests
Value df
Asymp. Sig.
(2-sided)
Exact Sig.
(2-sided)
Exact Sig.
(1-sided)
Point
Probability
Pearson Chi-Square 1.706a 1 .192 .228 .135
Continuity Correctionb 1.219 1 .270
Likelihood Ratio 1.726 1 .189 .228 .135
Fisher's Exact Test .228 .135
Linear-by-Linear
Association
1.693c 1 .193 .228 .135 .070
N of Valid Cases 130
a. 0 cells (.0%) have expected count less than 5. The minimum expected count is
15.23.
b. Computed only for a 2x2 table
c. The standardized statistic is 1.301.
248

Appendix 7d continued:
PB5 Assessed by an Occupational Therapist * SC School Factor 4 Availability
for Learning
Crosstab
SC SF4 Availability
Total Typical & PD DD
PB5 OT
Assess
no or Not sure Count 66 31 97
Expected Count 65.7 31.3 97.0
Yes Count 22 11 33
Expected Count 22.3 10.7 33.0
Total Count 88 42 130
Expected Count 88.0 42.0 130.0
Chi-Square Tests
Value df
Asymp. Sig.
(2-sided)
Exact Sig.
(2-sided)
Exact Sig.
(1-sided)
Point
Probability
Pearson Chi-Square .021a 1 .884 1.000 .523
Continuity Correctionb .000 1 1.000
Likelihood Ratio .021 1 .884 1.000 .523
Fisher's Exact Test 1.000 .523
Linear-by-Linear
Association
.021c 1 .884 1.000 .523 .168
N of Valid Cases 130
a. 0 cells (.0%) have expected count less than 5. The minimum expected count is
10.66.
b. Computed only for a 2x2 table
c. The standardized statistic is .145.
249

Appendix 7d continued:
PB5 Assessed by an Occupational Therapist * SC Total Difficulties Score
Crosstab
SC Total Diffs
Total Typical & PD DD
PB5 OT
Assess
no or Not sure Count 56 41 97
Expected Count 53.0 44.0 97.0
Yes Count 15 18 33
Expected Count 18.0 15.0 33.0
Total Count 71 59 130
Expected Count 71.0 59.0 130.0
Chi-Square Tests
Value df
Asymp. Sig.
(2-sided)
Exact Sig.
(2-sided)
Exact Sig.
(1-sided)
Point
Probability
Pearson Chi-Square 1.497a 1 .221 .232 .154
Continuity Correctionb 1.043 1 .307
Likelihood Ratio 1.493 1 .222 .232 .154
Fisher's Exact Test .232 .154
Linear-by-Linear
Association
1.486c 1 .223 .232 .154 .077
N of Valid Cases 130
a. 0 cells (.0%) have expected count less than 5. The minimum expected count is
14.98.
b. Computed only for a 2x2 table
c. The standardized statistic is 1.219.
250

Appendix 7e
Frequency Tables for Associations between Teacher Background Factor 1 (Behaviour Difficulties) and SSP and SC Subscales.
Key: SSP= Short Sensory Profile
SC Sensory Profile School Companion PD= Probable Difference (i.e. Probable difficulties) DD= Definite Difference (i.e. Difficulties)
TB1 Behaviour Difficulties * SSP Tactile Difficulties Crosstab
SSP Tactile
Total Typical & PD DD
TB1 Behaviour
Difficulties
no or Not sure Count 20 5 25
Expected Count 17.9 7.1 25.0
Yes Count 73 32 105
Expected Count 75.1 29.9 105.0
Total Count 93 37 130
Expected Count 93.0 37.0 130.0
Chi-Square Tests
Value df
Asymp. Sig.
(2-sided)
Exact Sig.
(2-sided)
Exact Sig.
(1-sided)
Point
Probability
Pearson Chi-Square 1.088a 1 .297 .337 .216
Continuity Correctionb .635 1 .426
Likelihood Ratio 1.150 1 .284 .337 .216
Fisher's Exact Test .337 .216
Linear-by-Linear
Association
1.080c 1 .299 .337 .216 .120
N of Valid Cases 130
a. 0 cells (.0%) have expected count less than 5. The minimum expected count is
7.12.
b. Computed only for a 2x2 table
c. The standardized statistic is 1.039.
251

Appendix 7e continued: TB1 Behaviour Difficulties * SSP Taste Difficulties Crosstab
SSP Taste
Total Typical & PD DD
TB1 Behaviour
Difficulties
no or Not sure Count 21 4 25
Expected Count 17.5 7.5 25.0
Yes Count 70 35 105
Expected Count 73.5 31.5 105.0
Total Count 91 39 130
Expected Count 91.0 39.0 130.0
Chi-Square Tests
Value df
Asymp. Sig.
(2-sided)
Exact Sig.
(2-sided)
Exact Sig.
(1-sided)
Point
Probability
Pearson Chi-Square 2.889a 1 .089 .143 .068
Continuity Correctionb 2.122 1 .145
Likelihood Ratio 3.173 1 .075 .097 .068
Fisher's Exact Test .143 .068
Linear-by-Linear
Association
2.867c 1 .090 .143 .068 .047
N of Valid Cases 130
a. 0 cells (.0%) have expected count less than 5. The minimum expected count is 7.50.
b. Computed only for a 2x2 table
c. The standardized statistic is 1.693.
252

Appendix 7e continued: TB1 Behaviour Difficulties * SSP Movement Difficulties
Crosstab
SSP Movement
Total Typical & PD DD
TB1 Behaviour
Difficulties
no or Not sure Count 21 4 25
Expected Count 18.9 6.1 25.0
Yes Count 78 28 106
Expected Count 80.1 25.9 106.0
Total Count 99 32 131
Expected Count 99.0 32.0 131.0
Chi-Square Tests
Value df
Asymp. Sig.
(2-sided)
Exact Sig.
(2-sided)
Exact Sig.
(1-sided)
Point
Probability
Pearson Chi-Square 1.189a 1 .276 .315 .206
Continuity Correctionb .691 1 .406
Likelihood Ratio 1.278 1 .258 .315 .206
Fisher's Exact Test .315 .206
Linear-by-Linear
Association
1.180c 1 .277 .315 .206 .122
N of Valid Cases 131
a. 0 cells (.0%) have expected count less than 5. The minimum expected count is
6.11.
b. Computed only for a 2x2 table
c. The standardized statistic is 1.086.
253

Appendix 7e continued: TB1 Behaviour Difficulties * SSP Seeks Sensation Difficulties
Crosstab
SSP Seeks
Sensation
Total Typical & PD DD
TB1 Behaviour
Difficulties
no or Not sure Count 4 21 25
Expected Count 7.6 17.4 25.0
Yes Count 36 70 106
Expected Count 32.4 73.6 106.0
Total Count 40 91 131
Expected Count 40.0 91.0 131.0
Chi-Square Tests
Value df
Asymp. Sig.
(2-sided)
Exact Sig.
(2-sided)
Exact Sig.
(1-sided)
Point
Probability
Pearson Chi-Square 3.077a 1 .079 .094 .061
Continuity Correctionb 2.288 1 .130
Likelihood Ratio 3.385 1 .066 .094 .061
Fisher's Exact Test .094 .061
Linear-by-Linear
Association
3.054c 1 .081 .094 .061 .042
N of Valid Cases 131
a. 0 cells (.0%) have expected count less than 5. The minimum expected count is 7.63.
b. Computed only for a 2x2 table
c. The standardized statistic is -1.747.
254
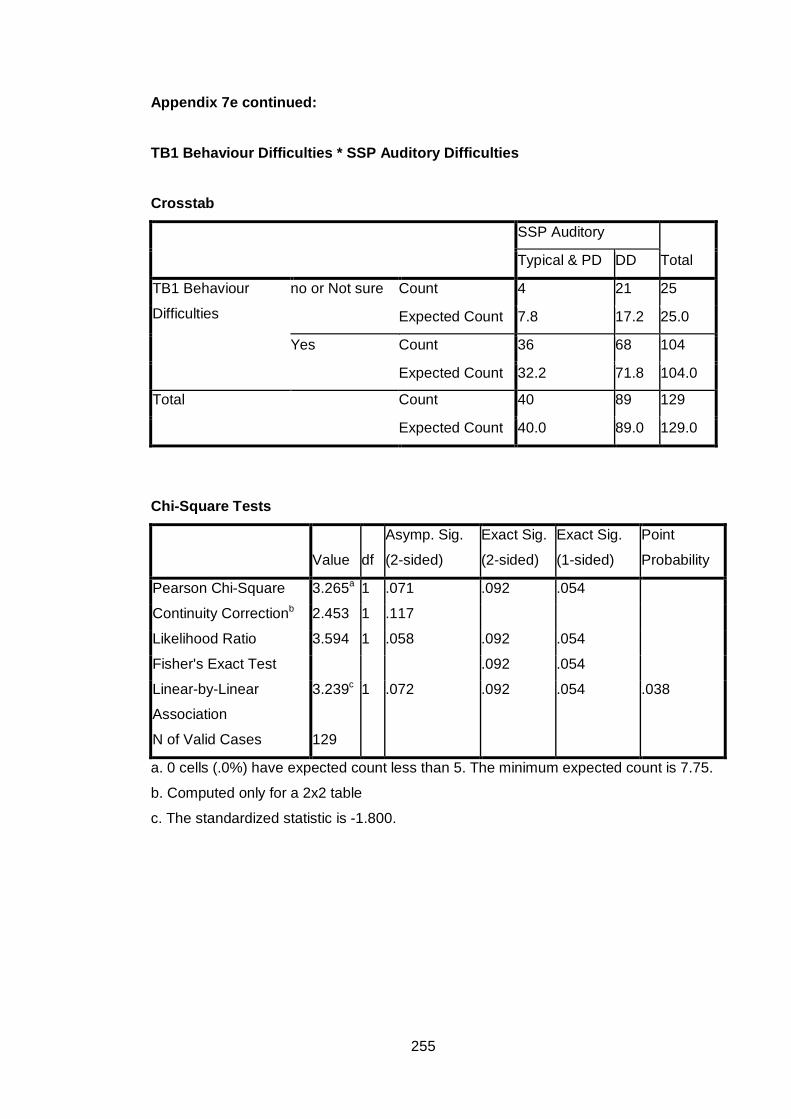
Appendix 7e continued: TB1 Behaviour Difficulties * SSP Auditory Difficulties
Crosstab
SSP Auditory
Total Typical & PD DD
TB1 Behaviour
Difficulties
no or Not sure Count 4 21 25
Expected Count 7.8 17.2 25.0
Yes Count 36 68 104
Expected Count 32.2 71.8 104.0
Total Count 40 89 129
Expected Count 40.0 89.0 129.0
Chi-Square Tests
Value df
Asymp. Sig.
(2-sided)
Exact Sig.
(2-sided)
Exact Sig.
(1-sided)
Point
Probability
Pearson Chi-Square 3.265a 1 .071 .092 .054
Continuity Correctionb 2.453 1 .117
Likelihood Ratio 3.594 1 .058 .092 .054
Fisher's Exact Test .092 .054
Linear-by-Linear
Association
3.239c 1 .072 .092 .054 .038
N of Valid Cases 129
a. 0 cells (.0%) have expected count less than 5. The minimum expected count is 7.75.
b. Computed only for a 2x2 table
c. The standardized statistic is -1.800.
255

Appendix 7e continued: TB1 Behaviour Difficulties * SSP Low Energy
Crosstab
SSP Low Energy
Total Typical & PD DD
TB1 Behaviour
Difficulties
no or Not sure Count 20 4 24
Expected Count 16.9 7.1 24.0
Yes Count 71 34 105
Expected Count 74.1 30.9 105.0
Total Count 91 38 129
Expected Count 91.0 38.0 129.0
Chi-Square Tests
Value df
Asymp. Sig.
(2-sided)
Exact Sig.
(2-sided)
Exact Sig.
(1-sided)
Point
Probability
Pearson Chi-Square 2.321a 1 .128 .145 .098
Continuity Correctionb 1.627 1 .202
Likelihood Ratio 2.533 1 .111 .145 .098
Fisher's Exact Test .145 .098
Linear-by-Linear
Association
2.303c 1 .129 .145 .098 .065
N of Valid Cases 129
a. 0 cells (.0%) have expected count less than 5. The minimum expected count is
7.07.
b. Computed only for a 2x2 table
c. The standardized statistic is 1.518.
256

Appendix 7e continued: TB1 Behaviour Difficulties * SSP Visual/Auditory Difficulties
Crosstab
SSP Visual/Auditory
Total Typical & PD DD
TB1 Behaviour
Difficulties
no or Not sure Count 21 4 25
Expected Count 19.6 5.4 25.0
Yes Count 80 24 104
Expected Count 81.4 22.6 104.0
Total Count 101 28 129
Expected Count 101.0 28.0 129.0
Chi-Square Tests
Value df
Asymp. Sig.
(2-sided)
Exact Sig.
(2-sided)
Exact Sig.
(1-sided)
Point
Probability
Pearson Chi-Square .594a 1 .441 .592 .318
Continuity Correctionb .251 1 .617
Likelihood Ratio .628 1 .428 .592 .318
Fisher's Exact Test .592 .318
Linear-by-Linear
Association
.589c 1 .443 .592 .318 .169
N of Valid Cases 129
a. 0 cells (.0%) have expected count less than 5. The minimum expected count is
5.43.
b. Computed only for a 2x2 table
c. The standardized statistic is .768.
257

Appendix 7e continued: TB1 Behaviour Difficulties * SSP Total Difficulties Score
Crosstab
SS Total Difficulties
Total Typical & PD DD
TB1 Behaviour
Difficulties
no or Not sure Count 9 15 24
Expected Count 10.8 13.2 24.0
Yes Count 48 55 103
Expected Count 46.2 56.8 103.0
Total Count 57 70 127
Expected Count 57.0 70.0 127.0
Chi-Square Tests
Value df
Asymp. Sig.
(2-sided)
Exact Sig.
(2-sided)
Exact Sig.
(1-sided)
Point
Probability
Pearson Chi-Square .652a 1 .419 .498 .283
Continuity Correctionb .336 1 .562
Likelihood Ratio .659 1 .417 .498 .283
Fisher's Exact Test .498 .283
Linear-by-Linear
Association
.647c 1 .421 .498 .283 .132
N of Valid Cases 127
a. 0 cells (.0%) have expected count less than 5. The minimum expected count is
10.77.
b. Computed only for a 2x2 table
c. The standardized statistic is -.804.
258

Appendix 7e continued: TB1 Behaviour Difficulties * SC Auditory Difficulties
Crosstab
SC Auditory
Total Typical & PD DD
TB1 Behaviour
Difficulties
no or Not sure Count 19 8 27
Expected Count 17.2 9.8 27.0
Yes Count 70 43 113
Expected Count 71.8 41.2 113.0
Total Count 89 51 140
Expected Count 89.0 51.0 140.0
Chi-Square Tests
Value df
Asymp. Sig.
(2-sided)
Exact Sig.
(2-sided)
Exact Sig.
(1-sided)
Point
Probability
Pearson Chi-Square .668a 1 .414 .507 .279
Continuity Correctionb .354 1 .552
Likelihood Ratio .684 1 .408 .507 .279
Fisher's Exact Test .507 .279
Linear-by-Linear
Association
.663c 1 .416 .507 .279 .130
N of Valid Cases 140
a. 0 cells (.0%) have expected count less than 5. The minimum expected count is
9.84.
b. Computed only for a 2x2 table
c. The standardized statistic is .814.
259

Appendix 7e continued: TB1 Behaviour Difficulties * SC Visual Difficulties
Crosstab
SC Visual
Total Typical & PD DD
TB1 Behaviour
Difficulties
no or Not sure Count 22 5 27
Expected Count 20.3 6.8 27.0
Yes Count 83 30 113
Expected Count 84.8 28.3 113.0
Total Count 105 35 140
Expected Count 105.0 35.0 140.0
Chi-Square Tests
Value df
Asymp. Sig.
(2-sided)
Exact Sig.
(2-sided)
Exact Sig.
(1-sided)
Point
Probability
Pearson Chi-Square .749a 1 .387 .466 .274
Continuity Correctionb .382 1 .536
Likelihood Ratio .789 1 .375 .466 .274
Fisher's Exact Test .466 .274
Linear-by-Linear
Association
.744c 1 .388 .466 .274 .143
N of Valid Cases 140
a. 0 cells (.0%) have expected count less than 5. The minimum expected count is
6.75.
b. Computed only for a 2x2 table
c. The standardized statistic is .863.
260

Appendix 7e continued: TB1 Behaviour Difficulties * SC Movement Difficulties Crosstab
SC Movement
Total Typical & PD DD
TB1 Behaviour
Difficulties
no or Not sure Count 13 14 27
Expected Count 10.8 16.2 27.0
Yes Count 43 70 113
Expected Count 45.2 67.8 113.0
Total Count 56 84 140
Expected Count 56.0 84.0 140.0
Chi-Square Tests
Value df
Asymp. Sig.
(2-sided)
Exact Sig.
(2-sided)
Exact Sig.
(1-sided)
Point
Probability
Pearson Chi-Square .925a 1 .336 .385 .228
Continuity Correctionb .553 1 .457
Likelihood Ratio .913 1 .339 .385 .228
Fisher's Exact Test .385 .228
Linear-by-Linear
Association
.919c 1 .338 .385 .228 .108
N of Valid Cases 140
a. 0 cells (.0%) have expected count less than 5. The minimum expected count is
10.80.
b. Computed only for a 2x2 table
c. The standardized statistic is .959.
261

Appendix 7e continued: TB1 Behaviour Difficulties * SC Tactile Difficulties Crosstab
SC Tactile
Total Typical & PD DD
TB1 Behaviour
Difficulties
no or Not sure Count 14 13 27
Expected Count 12.9 14.1 27.0
Yes Count 53 60 113
Expected Count 54.1 58.9 113.0
Total Count 67 73 140
Expected Count 67.0 73.0 140.0
Chi-Square Tests
Value df
Asymp. Sig.
(2-sided)
Exact Sig.
(2-sided)
Exact Sig.
(1-sided)
Point
Probability
Pearson Chi-Square .214a 1 .644 .673 .402
Continuity Correctionb .062 1 .804
Likelihood Ratio .214 1 .644 .673 .402
Fisher's Exact Test .673 .402
Linear-by-Linear
Association
.212c 1 .645 .673 .402 .152
N of Valid Cases 140
a. 0 cells (.0%) have expected count less than 5. The minimum expected count is
12.92.
b. Computed only for a 2x2 table
c. The standardized statistic is .461.
262

Appendix 7e continued: TB1 Behaviour Difficulties * SC Classroom Behaviour Difficulties
Crosstab
SC Behaviour
Total Typical & PD DD
TB1 Behaviour
Difficulties
no or Not sure Count 15 12 27
Expected Count 11.6 15.4 27.0
Yes Count 45 68 113
Expected Count 48.4 64.6 113.0
Total Count 60 80 140
Expected Count 60.0 80.0 140.0
Chi-Square Tests
Value df
Asymp. Sig.
(2-sided)
Exact Sig.
(2-sided)
Exact Sig.
(1-sided)
Point
Probability
Pearson Chi-Square 2.203a 1 .138 .194 .103
Continuity Correctionb 1.607 1 .205
Likelihood Ratio 2.181 1 .140 .194 .103
Fisher's Exact Test .194 .103
Linear-by-Linear
Association
2.187c 1 .139 .194 .103 .058
N of Valid Cases 140
a. 0 cells (.0%) have expected count less than 5. The minimum expected count is
11.57.
b. Computed only for a 2x2 table
c. The standardized statistic is 1.479.
263

Appendix 7e continued: TB1 Behaviour Difficulties * SC School Factor 1 Sensory Seeking/Registration
Crosstab
SC SF1
Seeking/Registration
Total Typical & PD DD
TB1 Behaviour
Difficulties
no or Not sure Count 18 9 27
Expected Count 12.7 14.3 27.0
Yes Count 48 65 113
Expected Count 53.3 59.7 113.0
Total Count 66 74 140
Expected Count 66.0 74.0 140.0
Chi-Square Tests
Value df
Asymp. Sig.
(2-sided)
Exact Sig.
(2-sided)
Exact Sig.
(1-sided)
Point
Probability
Pearson Chi-Square 5.117a 1 .024 .032 .020
Continuity Correctionb 4.192 1 .041
Likelihood Ratio 5.168 1 .023 .032 .020
Fisher's Exact Test .032 .020
Linear-by-Linear
Association
5.081c 1 .024 .032 .020 .014
N of Valid Cases 140
a. 0 cells (.0%) have expected count less than 5. The minimum expected count is
12.73.
b. Computed only for a 2x2 table
c. The standardized statistic is 2.254.
264

Appendix 7e continued: TB1 Behaviour Difficulties * SC School Factor 2 Attention & Awareness
Crosstab
SC SF2 Awareness
Total Typical & PD DD
TB1 Behaviour
Difficulties
no or Not sure Count 23 4 27
Expected Count 22.6 4.4 27.0
Yes Count 94 19 113
Expected Count 94.4 18.6 113.0
Total Count 117 23 140
Expected Count 117.0 23.0 140.0
Chi-Square Tests
Value df
Asymp. Sig.
(2-sided)
Exact Sig.
(2-sided)
Exact Sig.
(1-sided)
Point
Probability
Pearson Chi-Square .063a 1 .801 1.000 .531
Continuity Correctionb .000 1 1.000
Likelihood Ratio .065 1 .799 1.000 .531
Fisher's Exact Test 1.000 .531
Linear-by-Linear
Association
.063c 1 .802 1.000 .531 .226
N of Valid Cases 140
a. 1 cells (25.0%) have expected count less than 5. The minimum expected count is
4.44.
b. Computed only for a 2x2 table
c. The standardized statistic is .251.
265

Appendix 7e continued: TB1 Behaviour Difficulties * SC School Factor 3 Tolerance for Input Crosstab
SC SF3 Tolerance
Total Typical & PD DD
TB1 Behaviour
Difficulties
no or Not sure Count 16 11 27
Expected Count 12.7 14.3 27.0
Yes Count 50 63 113
Expected Count 53.3 59.7 113.0
Total Count 66 74 140
Expected Count 66.0 74.0 140.0
Chi-Square Tests
Value df
Asymp. Sig.
(2-sided)
Exact Sig.
(2-sided)
Exact Sig.
(1-sided)
Point
Probability
Pearson Chi-Square 1.971a 1 .160 .199 .117
Continuity Correctionb 1.414 1 .234
Likelihood Ratio 1.973 1 .160 .199 .117
Fisher's Exact Test .199 .117
Linear-by-Linear
Association
1.957c 1 .162 .199 .117 .065
N of Valid Cases 140
a. 0 cells (.0%) have expected count less than 5. The minimum expected count is
12.73.
b. Computed only for a 2x2 table
c. The standardized statistic is 1.399.
266

Appendix 7e continued: TB1 Behaviour Difficulties * SC School Factor 4 Availability for Learning
Crosstab
SC SF4 Availability
Total Typical & PD DD
TB1 Behaviour
Difficulties
no or Not sure Count 16 11 27
Expected Count 18.5 8.5 27.0
Yes Count 80 33 113
Expected Count 77.5 35.5 113.0
Total Count 96 44 140
Expected Count 96.0 44.0 140.0
Chi-Square Tests
Value df
Asymp. Sig.
(2-sided)
Exact Sig.
(2-sided)
Exact Sig.
(1-sided)
Point
Probability
Pearson Chi-Square 1.346a 1 .246 .257 .176
Continuity Correctionb .864 1 .353
Likelihood Ratio 1.302 1 .254 .356 .176
Fisher's Exact Test .257 .176
Linear-by-Linear
Association
1.336c 1 .248 .257 .176 .092
N of Valid Cases 140
a. 0 cells (.0%) have expected count less than 5. The minimum expected count is
8.49.
b. Computed only for a 2x2 table
c. The standardized statistic is -1.156.
267

Appendix 7e continued: TB1 Behaviour Difficulties * SC Total Difficulties Score Crosstab
SC Total Diffs
Total Typical & PD DD
TB1 Behaviour
Difficulties
no or Not sure Count 16 11 27
Expected Count 14.9 12.2 27.0
Yes Count 61 52 113
Expected Count 62.2 50.9 113.0
Total Count 77 63 140
Expected Count 77.0 63.0 140.0
Chi-Square Tests
Value df
Asymp. Sig.
(2-sided)
Exact Sig.
(2-sided)
Exact Sig.
(1-sided)
Point
Probability
Pearson Chi-Square .245a 1 .620 .671 .392
Continuity Correctionb .078 1 .780
Likelihood Ratio .247 1 .620 .671 .392
Fisher's Exact Test .671 .392
Linear-by-Linear
Association
.243c 1 .622 .671 .392 .152
N of Valid Cases 140
a. 0 cells (.0%) have expected count less than 5. The minimum expected count is
12.15.
b. Computed only for a 2x2 table
c. The standardized statistic is .493.
268

Appendix 7f
Frequency Tables for Associations between Teacher Background Factor 3 (Assessed by an Occupational Therapist) and SSP and SC Subscales.
Key: SSP= Short Sensory Profile
SC Sensory Profile School Companion PD= Probable Difference (i.e. Probable difficulties) DD= Definite Difference (i.e. Difficulties)
TB3 Assessed by an Occupational Therapist* SSP Tactile Difficulties Crosstab
SSP Tactile
Total Typical & PD DD
TB3 OT
Assess
no or Not sure Count 79 33 112
Expected Count 80.3 31.7 112.0
Yes Count 12 3 15
Expected Count 10.7 4.3 15.0
Total Count 91 36 127
Expected Count 91.0 36.0 127.0
Chi-Square Tests
Value df
Asymp. Sig.
(2-sided)
Exact Sig.
(2-sided)
Exact Sig.
(1-sided)
Point
Probability
Pearson Chi-Square .583a 1 .445 .553 .334
Continuity Correctionb .210 1 .646
Likelihood Ratio .620 1 .431 .553 .334
Fisher's Exact Test .553 .334
Linear-by-Linear
Association
.579c 1 .447 .553 .334 .193
N of Valid Cases 127
a. 1 cells (25.0%) have expected count less than 5. The minimum expected count is 4.25.
b. Computed only for a 2x2 table
c. The standardized statistic is -.761.
269

Appendix 7f continued: TB3 Assessed by an Occupational Therapist* SSP Taste Difficulties
Crosstab
SSP Taste
Total Typical & PD DD
TB3 OT
Assess
no or Not sure Count 75 37 112
Expected Count 78.5 33.5 112.0
Yes Count 14 1 15
Expected Count 10.5 4.5 15.0
Total Count 89 38 127
Expected Count 89.0 38.0 127.0
Chi-Square Tests
Value df
Asymp. Sig.
(2-sided)
Exact Sig.
(2-sided)
Exact Sig.
(1-sided)
Point
Probability
Pearson Chi-Square 4.387a 1 .036 .067 .028
Continuity Correctionb 3.219 1 .073
Likelihood Ratio 5.529 1 .019 .038 .028
Fisher's Exact Test .038 .028
Linear-by-Linear
Association
4.352c 1 .037 .067 .028 .025
N of Valid Cases 127
a. 1 cells (25.0%) have expected count less than 5. The minimum expected count is
4.49.
b. Computed only for a 2x2 table
c. The standardized statistic is -2.086.
270

Appendix 7f continued: TB3 Assessed by an Occupational Therapist* SSP Movement Difficulties
Crosstab
SSP Movement
Total Typical & PD DD
TB3 OT
Assess
no or Not sure Count 84 28 112
Expected Count 84.0 28.0 112.0
Yes Count 12 4 16
Expected Count 12.0 4.0 16.0
Total Count 96 32 128
Expected Count 96.0 32.0 128.0
Chi-Square Tests
Value df
Asymp. Sig.
(2-sided)
Exact Sig.
(2-sided)
Exact Sig.
(1-sided)
Point
Probability
Pearson Chi-Square .000a 1 1.000 1.000 .634
Continuity Correctionb .000 1 1.000
Likelihood Ratio .000 1 1.000 1.000 .634
Fisher's Exact Test 1.000 .634
Linear-by-Linear
Association
.000c 1 1.000 1.000 .634 .241
N of Valid Cases 128
a. 1 cells (25.0%) have expected count less than 5. The minimum expected count is
4.00.
b. Computed only for a 2x2 table
c. The standardized statistic is .000.
271

Appendix 7f continued: TB3 Assessed by an Occupational Therapist* SSP Seeks Sensation Difficulties
Crosstab
SSP Seeks
Total Typical & PD DD
TB3 OT
Assess
no or Not sure Count 36 77 113
Expected Count 33.5 79.5 113.0
Yes Count 2 13 15
Expected Count 4.5 10.5 15.0
Total Count 38 90 128
Expected Count 38.0 90.0 128.0
Chi-Square Tests
Value df
Asymp. Sig.
(2-sided)
Exact Sig.
(2-sided)
Exact Sig.
(1-sided)
Point
Probability
Pearson Chi-Square 2.177a 1 .140 .228 .117
Continuity Correctionb 1.380 1 .240
Likelihood Ratio 2.487 1 .115 .154 .117
Fisher's Exact Test .228 .117
Linear-by-Linear
Association
2.160c 1 .142 .228 .117 .087
N of Valid Cases 128
a. 1 cells (25.0%) have expected count less than 5. The minimum expected count is
4.45.
b. Computed only for a 2x2 table
c. The standardized statistic is 1.470.
272

Appendix 7f continued: TB3 Assessed by an Occupational Therapist* SSP Auditory Difficulties
Crosstab
SSP Auditory
Total Typical & PD DD
TB3 OT
Assess
no or Not sure Count 36 75 111
Expected Count 34.4 76.6 111.0
Yes Count 3 12 15
Expected Count 4.6 10.4 15.0
Total Count 39 87 126
Expected Count 39.0 87.0 126.0
Chi-Square Tests
Value df
Asymp. Sig.
(2-sided)
Exact Sig.
(2-sided)
Exact Sig.
(1-sided)
Point
Probability
Pearson Chi-Square .956a 1 .328 .390 .254
Continuity Correctionb .462 1 .496
Likelihood Ratio 1.026 1 .311 .390 .254
Fisher's Exact Test .390 .254
Linear-by-Linear
Association
.948c 1 .330 .390 .254 .158
N of Valid Cases 126
a. 1 cells (25.0%) have expected count less than 5. The minimum expected count is
4.64.
b. Computed only for a 2x2 table
c. The standardized statistic is .974.
273

Appendix 7f continued: TB3 Assessed by an Occupational Therapist* SSP Low Energy
Crosstab
SSP Low Energy
Total Typical & PD DD
TB3 OT
Assess
no or Not sure Count 80 32 112
Expected Count 78.2 33.8 112.0
Yes Count 8 6 14
Expected Count 9.8 4.2 14.0
Total Count 88 38 126
Expected Count 88.0 38.0 126.0
Chi-Square Tests
Value df
Asymp. Sig.
(2-sided)
Exact Sig.
(2-sided)
Exact Sig.
(1-sided)
Point
Probability
Pearson Chi-Square 1.206a 1 .272 .354 .212
Continuity Correctionb .623 1 .430
Likelihood Ratio 1.141 1 .285 .354 .212
Fisher's Exact Test .354 .212
Linear-by-Linear
Association
1.196c 1 .274 .354 .212 .129
N of Valid Cases 126
a. 1 cells (25.0%) have expected count less than 5. The minimum expected count is
4.22.
b. Computed only for a 2x2 table
c. The standardized statistic is 1.094.
274

Appendix 7f continued: TB3 Assessed by an Occupational Therapist* SSP Visual/Auditory Difficulties
Crosstab
SSP Visual/Auditory
Total Typical & PD DD
TB3 OT
Assess
no or Not sure Count 87 24 111
Expected Count 86.3 24.7 111.0
Yes Count 11 4 15
Expected Count 11.7 3.3 15.0
Total Count 98 28 126
Expected Count 98.0 28.0 126.0
Chi-Square Tests
Value df
Asymp. Sig.
(2-sided)
Exact Sig.
(2-sided)
Exact Sig.
(1-sided)
Point
Probability
Pearson Chi-Square .195a 1 .659 .741 .437
Continuity Correctionb .012 1 .912
Likelihood Ratio .187 1 .665 .741 .437
Fisher's Exact Test .741 .437
Linear-by-Linear
Association
.193c 1 .660 .741 .437 .223
N of Valid Cases 126
a. 1 cells (25.0%) have expected count less than 5. The minimum expected count is
3.33.
b. Computed only for a 2x2 table
c. The standardized statistic is .439.
275

Appendix 7f continued: TB3 Assessed by an Occupational Therapist* SSP Total Difficulties Score Crosstab
SSP Total Diffs
Total Typical & PD DD
TB3 OT
Assess
no or Not sure Count 53 57 110
Expected Count 48.8 61.2 110.0
Yes Count 2 12 14
Expected Count 6.2 7.8 14.0
Total Count 55 69 124
Expected Count 55.0 69.0 124.0
Chi-Square Tests
Value df
Asymp. Sig.
(2-sided)
Exact Sig.
(2-sided)
Exact Sig.
(1-sided)
Point
Probability
Pearson Chi-Square 5.781a 1 .016 .021 .014
Continuity Correctionb 4.490 1 .034
Likelihood Ratio 6.486 1 .011 .021 .014
Fisher's Exact Test .021 .014
Linear-by-Linear
Association
5.735c 1 .017 .021 .014 .012
N of Valid Cases 124
a. 0 cells (.0%) have expected count less than 5. The minimum expected count is
6.21.
b. Computed only for a 2x2 table
c. The standardized statistic is 2.395.
276

Appendix 7f continued: TB3 Assessed by an Occupational Therapist* SC Auditory Difficulties
Crosstab
SC Auditory
Total Typical & PD DD
TB3 OT
Assess
no or Not sure Count 74 43 117
Expected Count 74.3 42.7 117.0
Yes Count 13 7 20
Expected Count 12.7 7.3 20.0
Total Count 87 50 137
Expected Count 87.0 50.0 137.0
Chi-Square Tests
Value df
Asymp. Sig.
(2-sided)
Exact Sig.
(2-sided)
Exact Sig.
(1-sided)
Point
Probability
Pearson Chi-Square .023a 1 .880 1.000 .546
Continuity Correctionb .000 1 1.000
Likelihood Ratio .023 1 .880 1.000 .546
Fisher's Exact Test 1.000 .546
Linear-by-Linear
Association
.022c 1 .881 1.000 .546 .197
N of Valid Cases 137
a. 0 cells (.0%) have expected count less than 5. The minimum expected count is
7.30.
b. Computed only for a 2x2 table
c. The standardized statistic is -.150.
277

Appendix 7f continued: TB3 Assessed by an Occupational Therapist* SC Visual Difficulties Crosstab
SC Visual
Total Typical & PD DD
TB3 OT
Assess
no or Not sure Count 91 26 117
Expected Count 88.0 29.0 117.0
Yes Count 12 8 20
Expected Count 15.0 5.0 20.0
Total Count 103 34 137
Expected Count 103.0 34.0 137.0
Chi-Square Tests
Value df
Asymp. Sig.
(2-sided)
Exact Sig.
(2-sided)
Exact Sig.
(1-sided)
Point
Probability
Pearson Chi-Square 2.893a 1 .089 .099 .081
Continuity Correctionb 2.019 1 .155
Likelihood Ratio 2.656 1 .103 .159 .081
Fisher's Exact Test .099 .081
Linear-by-Linear
Association
2.872c 1 .090 .099 .081 .053
N of Valid Cases 137
a. 1 cells (25.0%) have expected count less than 5. The minimum expected count is
4.96.
b. Computed only for a 2x2 table
c. The standardized statistic is 1.695.
278

Appendix 7f continued: TB3 Assessed by an Occupational Therapist* SC Movement Difficulties
Crosstab
SC Movement
Total Typical & PD DD
TB3 OT
Assess
no or Not sure Count 49 68 117
Expected Count 47.0 70.0 117.0
Yes Count 6 14 20
Expected Count 8.0 12.0 20.0
Total Count 55 82 137
Expected Count 55.0 82.0 137.0
Chi-Square Tests
Value df
Asymp. Sig.
(2-sided)
Exact Sig.
(2-sided)
Exact Sig.
(1-sided)
Point
Probability
Pearson Chi-Square 1.003a 1 .317 .339 .227
Continuity Correctionb .570 1 .450
Likelihood Ratio 1.034 1 .309 .339 .227
Fisher's Exact Test .460 .227
Linear-by-Linear
Association
.996c 1 .318 .339 .227 .123
N of Valid Cases 137
a. 0 cells (.0%) have expected count less than 5. The minimum expected count is
8.03.
b. Computed only for a 2x2 table
c. The standardized statistic is .998.
279

Appendix 7f continued: TB3 Assessed by an Occupational Therapist* SC Tactile Difficulties
Crosstab
SC Tactile
Total Typical & PD DD
TB3 OT
Assess
no or Not sure Count 61 56 117
Expected Count 56.4 60.6 117.0
Yes Count 5 15 20
Expected Count 9.6 10.4 20.0
Total Count 66 71 137
Expected Count 66.0 71.0 137.0
Chi-Square Tests
Value df
Asymp. Sig.
(2-sided)
Exact Sig.
(2-sided)
Exact Sig.
(1-sided)
Point
Probability
Pearson Chi-Square 5.038a 1 .025 .030 .021
Continuity Correctionb 4.010 1 .045
Likelihood Ratio 5.264 1 .022 .030 .021
Fisher's Exact Test .030 .021
Linear-by-Linear
Association
5.001c 1 .025 .030 .021 .016
N of Valid Cases 137
a. 0 cells (.0%) have expected count less than 5. The minimum expected count is
9.64.
b. Computed only for a 2x2 table
c. The standardized statistic is 2.236.
280

Appendix 7f continued: TB3 Assessed by an Occupational Therapist* SC Classroom Behaviour Difficulties Crosstab
SC Behaviour
Total Typical & PD DD
TB3 OT
Assess
no or Not sure Count 49 68 117
Expected Count 50.4 66.6 117.0
Yes Count 10 10 20
Expected Count 8.6 11.4 20.0
Total Count 59 78 137
Expected Count 59.0 78.0 137.0
Chi-Square Tests
Value df
Asymp. Sig.
(2-sided)
Exact Sig.
(2-sided)
Exact Sig.
(1-sided)
Point
Probability
Pearson Chi-Square .459a 1 .498 .626 .330
Continuity Correctionb .188 1 .665
Likelihood Ratio .456 1 .500 .626 .330
Fisher's Exact Test .626 .330
Linear-by-Linear
Association
.456c 1 .500 .626 .330 .152
N of Valid Cases 137
a. 0 cells (.0%) have expected count less than 5. The minimum expected count is
8.61.
b. Computed only for a 2x2 table
c. The standardized statistic is -.675.
281

Appendix 7f continued: TB3 Assessed by an Occupational Therapist* SC School Factor 1 Sensory Seeking/Registration
Crosstab
SC SF1
Seeking/Registration
Total Typical & PD DD
TB3 OT
Assess
no or Not sure Count 59 58 117
Expected Count 54.7 62.3 117.0
Yes Count 5 15 20
Expected Count 9.3 10.7 20.0
Total Count 64 73 137
Expected Count 64.0 73.0 137.0
Chi-Square Tests
Value df
Asymp. Sig.
(2-sided)
Exact Sig.
(2-sided)
Exact Sig.
(1-sided)
Point
Probability
Pearson Chi-Square 4.436a 1 .035 .051 .029
Continuity Correctionb 3.474 1 .062
Likelihood Ratio 4.649 1 .031 .051 .029
Fisher's Exact Test .051 .029
Linear-by-Linear
Association
4.404c 1 .036 .051 .029 .021
N of Valid Cases 137
a. 0 cells (.0%) have expected count less than 5. The minimum expected count is 9.34.
b. Computed only for a 2x2 table
c. The standardized statistic is 2.099.
282

Appendix 7f continued: TB3 Assessed by an Occupational Therapist* SC School Factor 2 Attention & Awareness
Crosstab
SC SF2 Awareness
Total Typical & PD DD
TB3 OT
Assess
no or Not sure Count 99 18 117
Expected Count 98.2 18.8 117.0
Yes Count 16 4 20
Expected Count 16.8 3.2 20.0
Total Count 115 22 137
Expected Count 115.0 22.0 137.0
Chi-Square Tests
Value df
Asymp. Sig.
(2-sided)
Exact Sig.
(2-sided)
Exact Sig.
(1-sided)
Point
Probability
Pearson Chi-Square .270a 1 .603 .741 .405
Continuity Correctionb .036 1 .849
Likelihood Ratio .257 1 .612 .741 .405
Fisher's Exact Test .530 .405
Linear-by-Linear
Association
.268c 1 .605 .741 .405 .211
N of Valid Cases 137
a. 1 cells (25.0%) have expected count less than 5. The minimum expected count is
3.21.
b. Computed only for a 2x2 table
c. The standardized statistic is .518.
283

Appendix 7f continued: TB3 Assessed by an Occupational Therapist* SC School Factor 3 Tolerance for Input
Crosstab
SC SF3 Tolerance
Total Typical & PD DD
TB3 OT
Assess
no or Not sure Count 55 62 117
Expected Count 54.7 62.3 117.0
Yes Count 9 11 20
Expected Count 9.3 10.7 20.0
Total Count 64 73 137
Expected Count 64.0 73.0 137.0
Chi-Square Tests
Value df
Asymp. Sig.
(2-sided)
Exact Sig.
(2-sided)
Exact Sig.
(1-sided)
Point
Probability
Pearson Chi-Square .028a 1 .868 1.000 .532
Continuity Correctionb .000 1 1.000
Likelihood Ratio .028 1 .868 1.000 .532
Fisher's Exact Test 1.000 .532
Linear-by-Linear
Association
.027c 1 .868 1.000 .532 .189
N of Valid Cases 137
a. 0 cells (.0%) have expected count less than 5. The minimum expected count is
9.34.
b. Computed only for a 2x2 table
c. The standardized statistic is .166.
284

Appendix 7f continued: TB3 Assessed by an Occupational Therapist* SC School Factor 4 Availability for Learning
Crosstab
SC SF4 Availability
Total Typical & PD DD
TB3 OT
Assess
no or Not sure Count 79 38 117
Expected Count 79.4 37.6 117.0
Yes Count 14 6 20
Expected Count 13.6 6.4 20.0
Total Count 93 44 137
Expected Count 93.0 44.0 137.0
Chi-Square Tests
Value df
Asymp. Sig.
(2-sided)
Exact Sig.
(2-sided)
Exact Sig.
(1-sided)
Point
Probability
Pearson Chi-Square .048a 1 .826 1.000 .525
Continuity Correctionb .000 1 1.000
Likelihood Ratio .049 1 .825 1.000 .525
Fisher's Exact Test 1.000 .525
Linear-by-Linear
Association
.048c 1 .827 1.000 .525 .202
N of Valid Cases 137
a. 0 cells (.0%) have expected count less than 5. The minimum expected count is
6.42.
b. Computed only for a 2x2 table
c. The standardized statistic is -.219.
285
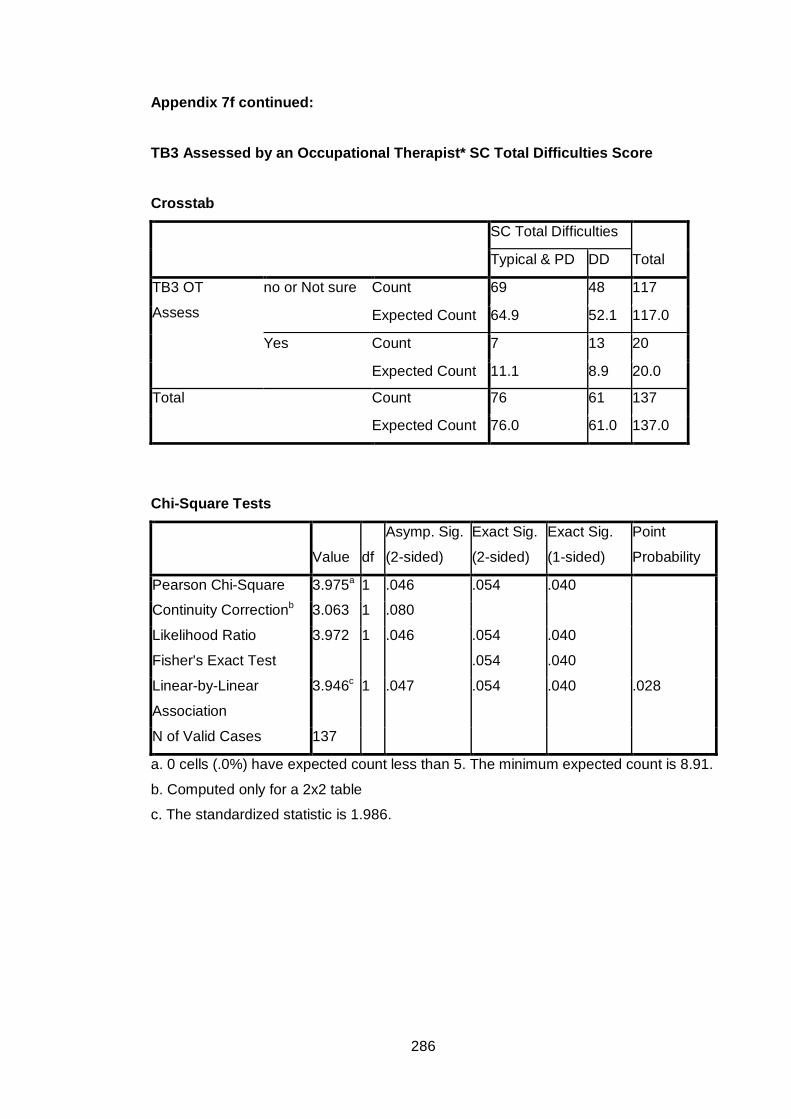
Appendix 7f continued: TB3 Assessed by an Occupational Therapist* SC Total Difficulties Score
Crosstab
SC Total Difficulties
Total Typical & PD DD
TB3 OT
Assess
no or Not sure Count 69 48 117
Expected Count 64.9 52.1 117.0
Yes Count 7 13 20
Expected Count 11.1 8.9 20.0
Total Count 76 61 137
Expected Count 76.0 61.0 137.0
Chi-Square Tests
Value df
Asymp. Sig.
(2-sided)
Exact Sig.
(2-sided)
Exact Sig.
(1-sided)
Point
Probability
Pearson Chi-Square 3.975a 1 .046 .054 .040
Continuity Correctionb 3.063 1 .080
Likelihood Ratio 3.972 1 .046 .054 .040
Fisher's Exact Test .054 .040
Linear-by-Linear
Association
3.946c 1 .047 .054 .040 .028
N of Valid Cases 137
a. 0 cells (.0%) have expected count less than 5. The minimum expected count is 8.91.
b. Computed only for a 2x2 table
c. The standardized statistic is 1.986.
286

Appendix 7g:
Frequency Tables for Associations between Teacher Background Factor 4 (Teacher Rating of the Child’s Anxiety) and SSP and SC Subscales.
Key:
P= Parental T= Teacher SSP= Short Sensory Profile
SC Sensory Profile School Companion PD= Probable Difference (i.e. Probable difficulties) DD= Definite Difference (i.e. Difficulties)
TB4 Anxiety* SSP Tactile Difficulties
Crosstab
SSP Tactile
Total Typical & PD DD
TB4 Anxiety no or Not sure Count 53 19 72
Expected Count 51.5 20.5 72.0
Yes Count 40 18 58
Expected Count 41.5 16.5 58.0
Total Count 93 37 130
Expected Count 93.0 37.0 130.0
Chi-Square Tests
Value df
Asymp. Sig.
(2-sided)
Exact Sig.
(2-sided)
Exact Sig.
(1-sided)
Point
Probability
Pearson Chi-Square .340a 1 .560 .696 .348
Continuity Correctionb .151 1 .698
Likelihood Ratio .340 1 .560 .696 .348
Fisher's Exact Test .565 .348
Linear-by-Linear
Association
.338c 1 .561 .696 .348 .130
N of Valid Cases 130
a. 0 cells (.0%) have expected count less than 5. The minimum expected count is 16.51.
b. Computed only for a 2x2 table
c. The standardized statistic is .581.
287

Appendix 7g continued:
TB4 Anxiety* SSP Taste Difficulties
Crosstab
SSP Taste
Total Typical & PD DD
TB4 Anxiety no or Not sure Count 52 20 72
Expected Count 50.4 21.6 72.0
Yes Count 39 19 58
Expected Count 40.6 17.4 58.0
Total Count 91 39 130
Expected Count 91.0 39.0 130.0
Chi-Square Tests
Value df
Asymp. Sig.
(2-sided)
Exact Sig.
(2-sided)
Exact Sig.
(1-sided)
Point
Probability
Pearson Chi-Square .379a 1 .538 .568 .335
Continuity Correctionb .179 1 .672
Likelihood Ratio .379 1 .538 .568 .335
Fisher's Exact Test .568 .335
Linear-by-Linear
Association
.377c 1 .539 .568 .335 .126
N of Valid Cases 130
a. 0 cells (.0%) have expected count less than 5. The minimum expected count is 17.40.
b. Computed only for a 2x2 table
c. The standardized statistic is .614.
288
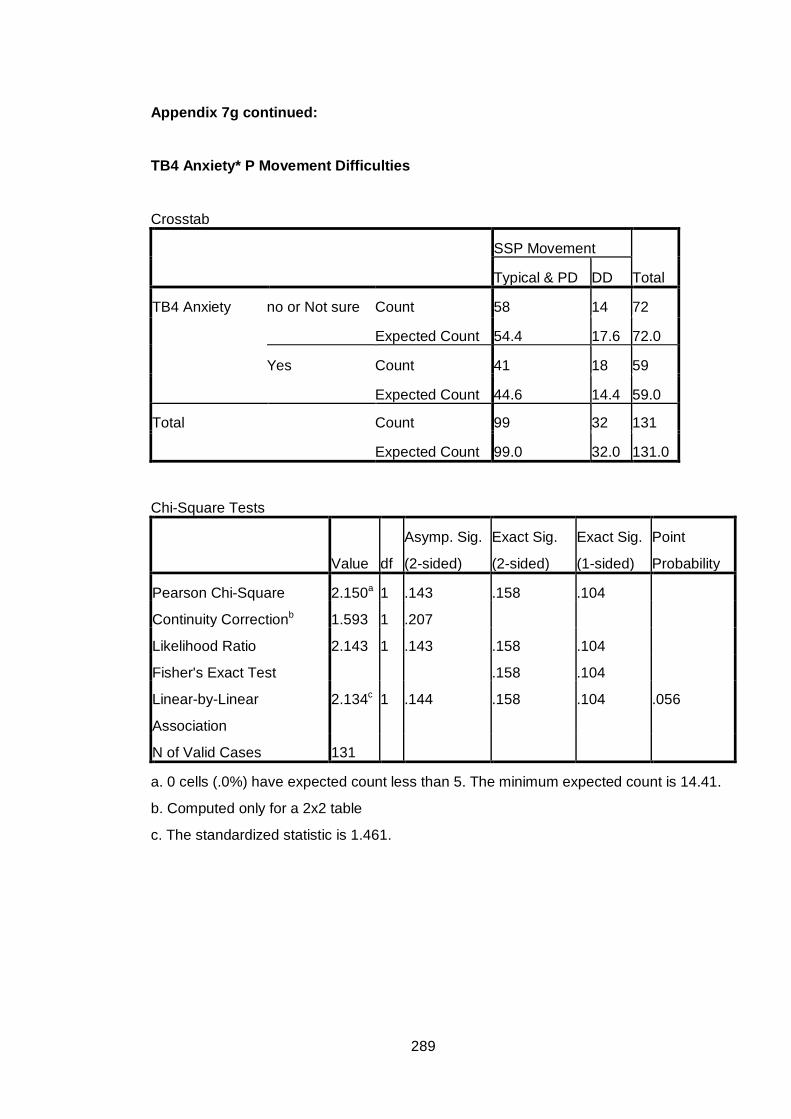
Appendix 7g continued:
TB4 Anxiety* P Movement Difficulties
Crosstab
SSP Movement
Total Typical & PD DD
TB4 Anxiety no or Not sure Count 58 14 72
Expected Count 54.4 17.6 72.0
Yes Count 41 18 59
Expected Count 44.6 14.4 59.0
Total Count 99 32 131
Expected Count 99.0 32.0 131.0
Chi-Square Tests
Value df
Asymp. Sig.
(2-sided)
Exact Sig.
(2-sided)
Exact Sig.
(1-sided)
Point
Probability
Pearson Chi-Square 2.150a 1 .143 .158 .104
Continuity Correctionb 1.593 1 .207
Likelihood Ratio 2.143 1 .143 .158 .104
Fisher's Exact Test .158 .104
Linear-by-Linear
Association
2.134c 1 .144 .158 .104 .056
N of Valid Cases 131
a. 0 cells (.0%) have expected count less than 5. The minimum expected count is 14.41.
b. Computed only for a 2x2 table
c. The standardized statistic is 1.461.
289

Appendix 7g continued:
TB4 Anxiety* SSP Seeks Sensation Difficulties
Crosstab
SSP Seeks Sensation
Total Typical & PD DD
TB4 Anxiety no or Not sure Count 20 53 73
Expected Count 22.3 50.7 73.0
Yes Count 20 38 58
Expected Count 17.7 40.3 58.0
Total Count 40 91 131
Expected Count 40.0 91.0 131.0
Chi-Square Tests
Value df
Asymp. Sig.
(2-sided)
Exact Sig.
(2-sided)
Exact Sig.
(1-sided)
Point
Probability
Pearson Chi-Square .765a 1 .382 .446 .247
Continuity Correctionb .467 1 .494
Likelihood Ratio .763 1 .383 .446 .247
Fisher's Exact Test .446 .247
Linear-by-Linear
Association
.759c 1 .384 .446 .247 .103
N of Valid Cases 131
a. 0 cells (.0%) have expected count less than 5. The minimum expected count is 17.71.
b. Computed only for a 2x2 table
c. The standardized statistic is -.871.
290

Appendix 7g continued:
Anxiety* SSP Auditory Difficulties
Crosstab
SSP Auditory
Total Typical & PD DD
TB4 Anxiety no or Not sure Count 21 51 72
Expected Count 22.3 49.7 72.0
Yes Count 19 38 57
Expected Count 17.7 39.3 57.0
Total Count 40 89 129
Expected Count 40.0 89.0 129.0
Chi-Square Tests
Value df
Asymp. Sig.
(2-sided)
Exact Sig.
(2-sided)
Exact Sig.
(1-sided)
Point
Probability
Pearson Chi-Square .258a 1 .611 .702 .375
Continuity Correctionb .100 1 .752
Likelihood Ratio .258 1 .612 .702 .375
Fisher's Exact Test .702 .375
Linear-by-Linear
Association
.256c 1 .613 .702 .375 .133
N of Valid Cases 129
a. 0 cells (.0%) have expected count less than 5. The minimum expected count is 17.67.
b. Computed only for a 2x2 table
c. The standardized statistic is -.506.
291

Appendix 7g continued:
TB4 Anxiety* SSP Low Energy
Crosstab
SSP Low Energy
Total Typical & PD DD
TB4 Anxiety no or Not sure Count 55 17 72
Expected Count 50.8 21.2 72.0
Yes Count 36 21 57
Expected Count 40.2 16.8 57.0
Total Count 91 38 129
Expected Count 91.0 38.0 129.0
Chi-Square Tests
Value df
Asymp. Sig.
(2-sided)
Exact Sig.
(2-sided)
Exact Sig.
(1-sided)
Point
Probability
Pearson Chi-Square 2.680a 1 .102 .121 .075
Continuity Correctionb 2.081 1 .149
Likelihood Ratio 2.670 1 .102 .121 .075
Fisher's Exact Test .121 .075
Linear-by-Linear
Association
2.659c 1 .103 .121 .075 .041
N of Valid Cases 129
a. 0 cells (.0%) have expected count less than 5. The minimum expected count is 16.79.
b. Computed only for a 2x2 table
c. The standardized statistic is 1.631.
292

Appendix 7g continued:
TB4 Anxiety* SSP Visual/Auditory Difficulties
Crosstab
SSP Visual/Auditory
Total Typical & PD DD
TB4 Anxiety no or Not sure Count 55 16 71
Expected Count 55.6 15.4 71.0
Yes Count 46 12 58
Expected Count 45.4 12.6 58.0
Total Count 101 28 129
Expected Count 101.0 28.0 129.0
Chi-Square Tests
Value df
Asymp. Sig.
(2-sided)
Exact Sig.
(2-sided)
Exact Sig.
(1-sided)
Point
Probability
Pearson Chi-Square .064a 1 .800 .833 .486
Continuity Correctionb .001 1 .969
Likelihood Ratio .064 1 .800 .833 .486
Fisher's Exact Test .833 .486
Linear-by-Linear
Association
.063c 1 .801 .833 .486 .165
N of Valid Cases 129
a. 0 cells (.0%) have expected count less than 5. The minimum expected count is 12.59.
b. Computed only for a 2x2 table
c. The standardized statistic is -.252.
293

Appendix 7g continued:
TB4 Anxiety* SSP Total Difficulties Score
Crosstab
SSP Total Difficulties
Total Typical & PD DD
TB4 Anxiety no or Not sure Count 34 37 71
Expected Count 31.9 39.1 71.0
Yes Count 23 33 56
Expected Count 25.1 30.9 56.0
Total Count 57 70 127
Expected Count 57.0 70.0 127.0
Chi-Square Tests
Value df
Asymp. Sig.
(2-sided)
Exact Sig.
(2-sided)
Exact Sig.
(1-sided)
Point
Probability
Pearson Chi-Square .588a 1 .443 .476 .279
Continuity Correctionb .345 1 .557
Likelihood Ratio .589 1 .443 .476 .279
Fisher's Exact Test .476 .279
Linear-by-Linear
Association
.583c 1 .445 .476 .279 .107
N of Valid Cases 127
a. 0 cells (.0%) have expected count less than 5. The minimum expected count is 25.13.
b. Computed only for a 2x2 table
c. The standardized statistic is .764.
294

Appendix 7g continued:
TB4 Anxiety* SC Auditory Difficulties
Crosstab
SC Auditory
Total Typical & PD DD
TB4 Anxiety no or Not sure Count 55 23 78
Expected Count 49.6 28.4 78.0
Yes Count 34 28 62
Expected Count 39.4 22.6 62.0
Total Count 89 51 140
Expected Count 89.0 51.0 140.0
Chi-Square Tests
Value df
Asymp. Sig.
(2-sided)
Exact Sig.
(2-sided)
Exact Sig.
(1-sided)
Point
Probability
Pearson Chi-Square 3.665a 1 .056 .077 .041
Continuity Correctionb 3.019 1 .082
Likelihood Ratio 3.661 1 .056 .077 .041
Fisher's Exact Test .077 .041
Linear-by-Linear
Association
3.638c 1 .056 .077 .041 .023
N of Valid Cases 140
a. 0 cells (.0%) have expected count less than 5. The minimum expected count is 22.59.
b. Computed only for a 2x2 table
c. The standardized statistic is 1.907.
295

Appendix 7g continued:
Anxiety* SC Visual Difficulties
Crosstab
SC Visual
Total Typical & PD DD
TB4 Anxiety no or Not sure Count 63 15 78
Expected Count 58.5 19.5 78.0
Yes Count 42 20 62
Expected Count 46.5 15.5 62.0
Total Count 105 35 140
Expected Count 105.0 35.0 140.0
Chi-Square Tests
Value df
Asymp. Sig.
(2-sided)
Exact Sig.
(2-sided)
Exact Sig.
(1-sided)
Point
Probability
Pearson Chi-Square 3.127a 1 .077 .115 .058
Continuity Correctionb 2.470 1 .116
Likelihood Ratio 3.113 1 .078 .115 .058
Fisher's Exact Test .115 .058
Linear-by-Linear
Association
3.104c 1 .078 .115 .058 .033
N of Valid Cases 140
a. 0 cells (.0%) have expected count less than 5. The minimum expected count is 15.50.
b. Computed only for a 2x2 table
c. The standardized statistic is 1.762.
296

Appendix 7g continued:
TB4 Anxiety* SC Movement Difficulties
Crosstab
SC Movement
Total Typical & PD DD
TB4 Anxiety no or Not sure Count 32 46 78
Expected Count 31.2 46.8 78.0
Yes Count 24 38 62
Expected Count 24.8 37.2 62.0
Total Count 56 84 140
Expected Count 56.0 84.0 140.0
Chi-Square Tests
Value df
Asymp. Sig.
(2-sided)
Exact Sig.
(2-sided)
Exact Sig.
(1-sided)
Point
Probability
Pearson Chi-Square .077a 1 .781 .863 .459
Continuity Correctionb .011 1 .917
Likelihood Ratio .077 1 .781 .863 .459
Fisher's Exact Test .863 .459
Linear-by-Linear
Association
.077c 1 .782 .863 .459 .133
N of Valid Cases 140
a. 0 cells (.0%) have expected count less than 5. The minimum expected count is 24.80.
b. Computed only for a 2x2 table
c. The standardized statistic is .277.
297

Appendix 7g continued:
Anxiety* SC Tactile Difficulties Crosstab
SC Tactile
Total Typical & PD DD
TB4 Anxiety no or Not sure Count 38 40 78
Expected Count 37.3 40.7 78.0
Yes Count 29 33 62
Expected Count 29.7 32.3 62.0
Total Count 67 73 140
Expected Count 67.0 73.0 140.0
Chi-Square Tests
Value df
Asymp. Sig.
(2-sided)
Exact Sig.
(2-sided)
Exact Sig.
(1-sided)
Point
Probability
Pearson Chi-Square .052a 1 .819 .866 .477
Continuity Correctionb .003 1 .953
Likelihood Ratio .052 1 .819 .866 .477
Fisher's Exact Test .866 .477
Linear-by-Linear
Association
.052c 1 .820 .866 .477 .132
N of Valid Cases 140
a. 0 cells (.0%) have expected count less than 5. The minimum expected count is
29.67.
b. Computed only for a 2x2 table
c. The standardized statistic is .228.
298
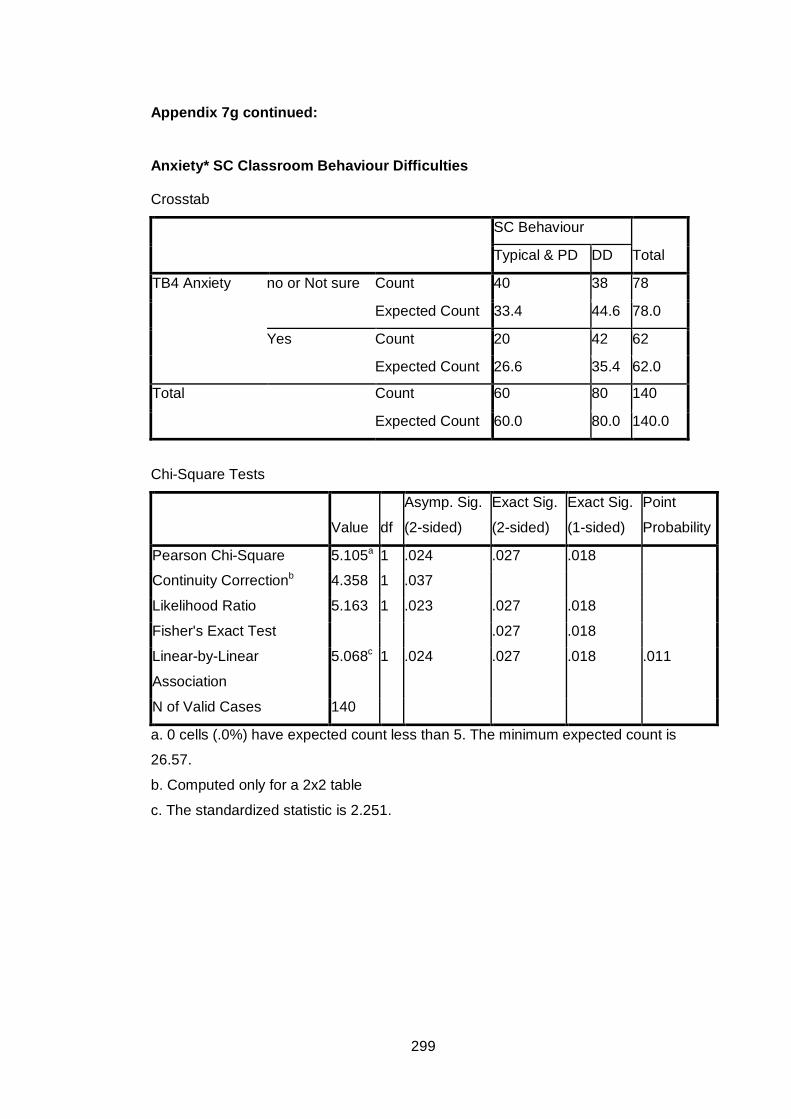
Appendix 7g continued:
Anxiety* SC Classroom Behaviour Difficulties Crosstab
SC Behaviour
Total Typical & PD DD
TB4 Anxiety no or Not sure Count 40 38 78
Expected Count 33.4 44.6 78.0
Yes Count 20 42 62
Expected Count 26.6 35.4 62.0
Total Count 60 80 140
Expected Count 60.0 80.0 140.0
Chi-Square Tests
Value df
Asymp. Sig.
(2-sided)
Exact Sig.
(2-sided)
Exact Sig.
(1-sided)
Point
Probability
Pearson Chi-Square 5.105a 1 .024 .027 .018
Continuity Correctionb 4.358 1 .037
Likelihood Ratio 5.163 1 .023 .027 .018
Fisher's Exact Test .027 .018
Linear-by-Linear
Association
5.068c 1 .024 .027 .018 .011
N of Valid Cases 140
a. 0 cells (.0%) have expected count less than 5. The minimum expected count is
26.57.
b. Computed only for a 2x2 table
c. The standardized statistic is 2.251.
299

Appendix 7g continued:
TB4 Anxiety* SC School Factor 1 Sensory Seeking/Registration
Crosstab
SC SF1
Seek/Registration
Total Typical & PD DD
TB4 Anxiety no or Not sure Count 37 41 78
Expected Count 36.8 41.2 78.0
Yes Count 29 33 62
Expected Count 29.2 32.8 62.0
Total Count 66 74 140
Expected Count 66.0 74.0 140.0
Chi-Square Tests
Value df
Asymp. Sig.
(2-sided)
Exact Sig.
(2-sided)
Exact Sig.
(1-sided)
Point
Probability
Pearson Chi-Square .006a 1 .938 1.000 .537
Continuity Correctionb .000 1 1.000
Likelihood Ratio .006 1 .938 1.000 .537
Fisher's Exact Test 1.000 .537
Linear-by-Linear
Association
.006c 1 .938 1.000 .537 .135
N of Valid Cases 140
a. 0 cells (.0%) have expected count less than 5. The minimum expected count is
29.23.
b. Computed only for a 2x2 table
c. The standardized statistic is .078.
300

Appendix 7g continued:
TB4 Anxiety* SC School Factor 2 Attention & Awareness
Crosstab
SC SF2 Awareness
Total Typical & PD DD
TB4 Anxiety no or Not sure Count 68 10 78
Expected Count 65.2 12.8 78.0
Yes Count 49 13 62
Expected Count 51.8 10.2 62.0
Total Count 117 23 140
Expected Count 117.0 23.0 140.0
Chi-Square Tests
Value df
Asymp. Sig.
(2-sided)
Exact Sig.
(2-sided)
Exact Sig.
(1-sided)
Point
Probability
Pearson Chi-Square 1.670a 1 .196 .252 .144
Continuity Correctionb 1.129 1 .288
Likelihood Ratio 1.659 1 .198 .252 .144
Fisher's Exact Test .252 .144
Linear-by-Linear
Association
1.658c 1 .198 .252 .144 .080
N of Valid Cases 140
a. 0 cells (.0%) have expected count less than 5. The minimum expected count is 10.19.
b. Computed only for a 2x2 table
c. The standardized statistic is 1.288.
301

Appendix 7g continued:
TB4 Anxiety* SC School Factor 3 Tolerance for Input
Crosstab
SC SF3 Tolerance
Total Typical & PD DD
TB4 Anxiety no or Not sure Count 47 31 78
Expected Count 36.8 41.2 78.0
Yes Count 19 43 62
Expected Count 29.2 32.8 62.0
Total Count 66 74 140
Expected Count 66.0 74.0 140.0
Chi-Square Tests
Value df
Asymp. Sig.
(2-sided)
Exact Sig.
(2-sided)
Exact Sig.
(1-sided)
Point
Probability
Pearson Chi-Square 12.155a 1 .000 .001 .000
Continuity Correctionb 10.996 1 .001
Likelihood Ratio 12.386 1 .000 .001 .000
Fisher's Exact Test .001 .000
Linear-by-Linear
Association
12.068c 1 .001 .001 .000 .000
N of Valid Cases 140
a. 0 cells (.0%) have expected count less than 5. The minimum expected count is 29.23.
b. Computed only for a 2x2 table
c. The standardized statistic is 3.474.
302
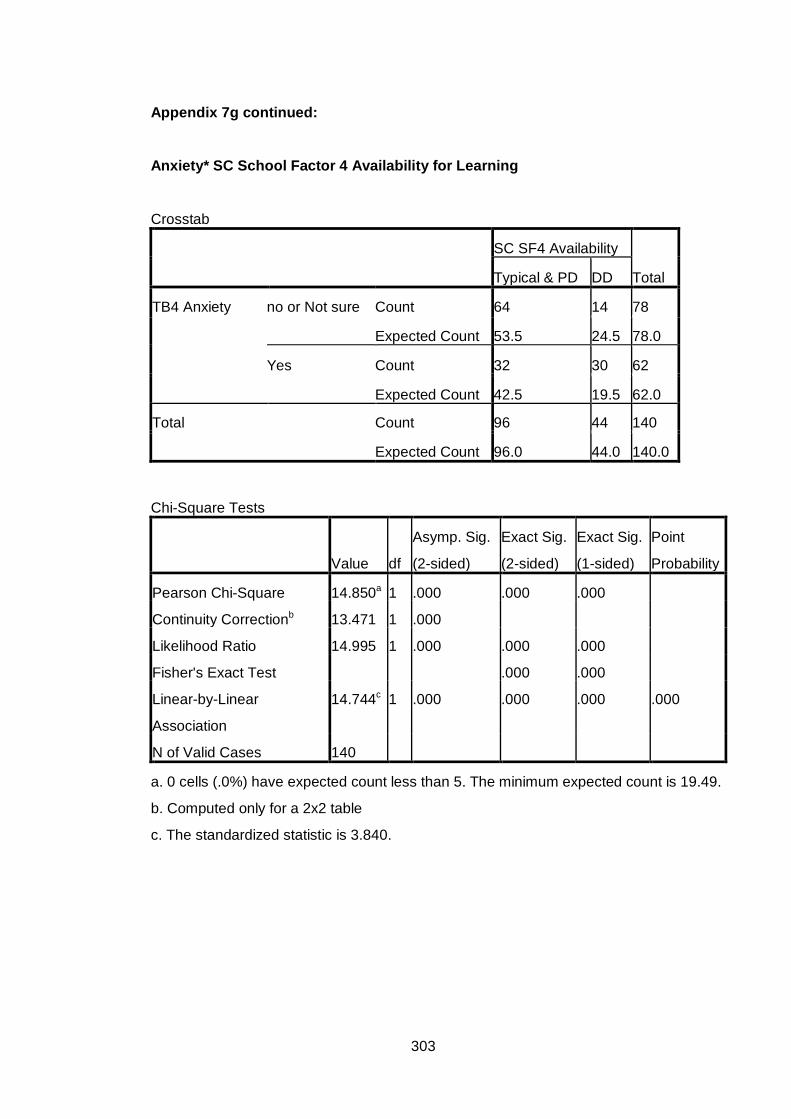
Appendix 7g continued:
Anxiety* SC School Factor 4 Availability for Learning
Crosstab
SC SF4 Availability
Total Typical & PD DD
TB4 Anxiety no or Not sure Count 64 14 78
Expected Count 53.5 24.5 78.0
Yes Count 32 30 62
Expected Count 42.5 19.5 62.0
Total Count 96 44 140
Expected Count 96.0 44.0 140.0
Chi-Square Tests
Value df
Asymp. Sig.
(2-sided)
Exact Sig.
(2-sided)
Exact Sig.
(1-sided)
Point
Probability
Pearson Chi-Square 14.850a 1 .000 .000 .000
Continuity Correctionb 13.471 1 .000
Likelihood Ratio 14.995 1 .000 .000 .000
Fisher's Exact Test .000 .000
Linear-by-Linear
Association
14.744c 1 .000 .000 .000 .000
N of Valid Cases 140
a. 0 cells (.0%) have expected count less than 5. The minimum expected count is 19.49.
b. Computed only for a 2x2 table
c. The standardized statistic is 3.840.
303

Appendix 7g continued:
TB4 Anxiety* SC Total Difficulties Score
Crosstab
SC Total Difficulties
Total Typical & PD DD
TB4 Anxiety no or Not sure Count 48 30 78
Expected Count 42.9 35.1 78.0
Yes Count 29 33 62
Expected Count 34.1 27.9 62.0
Total Count 77 63 140
Expected Count 77.0 63.0 140.0
Chi-Square Tests
Value df
Asymp. Sig.
(2-sided)
Exact Sig.
(2-sided)
Exact Sig.
(1-sided)
Point
Probability
Pearson Chi-Square 3.042a 1 .081 .090 .058
Continuity Correctionb 2.475 1 .116
Likelihood Ratio 3.047 1 .081 .090 .058
Fisher's Exact Test .090 .058
Linear-by-Linear
Association
3.021c 1 .082 .090 .058 .030
N of Valid Cases 140
a. 0 cells (.0%) have expected count less than 5. The minimum expected count is
27.90.
b. Computed only for a 2x2 table
c. The standardized statistic is 1.738.
304

Appendix 7h
Frequency Tables for Associations between SDQ Subscale Emotional Difficulties and SSP and SC Subscales.
Key: SSP= Short Sensory Profile
SC Sensory Profile School Companion PD= Probable Difference (i.e. Probable difficulties) DD= Definite Difference (i.e. Difficulties)
SDQ Emotional Difficulties* SSP Tactile Difficulties Crosstab
SSP Tactile
Total Typical & PD DD
SDQ Emotional
Difficulties
Typical & PD Count 70 27 97
Expected Count 68.0 29.0 97.0
DD Count 24 13 37
Expected Count 26.0 11.0 37.0
Total Count 94 40 134
Expected Count 94.0 40.0 134.0
Chi-Square Tests
Value df
Asymp. Sig.
(2-sided)
Exact Sig.
(2-sided)
Exact Sig.
(1-sided)
Point
Probability
Pearson Chi-Square .682a 1 .409 .527 .267
Continuity Correctionb .378 1 .539
Likelihood Ratio .669 1 .413 .527 .267
Fisher's Exact Test .408 .267
Linear-by-Linear
Association
.677c 1 .411 .527 .267 .117
N of Valid Cases 134
a. 0 cells (.0%) have expected count less than 5. The minimum expected count is
11.04.
b. Computed only for a 2x2 table
c. The standardized statistic is .823.
305

Appendix 7h continued: SDQ Emotional Difficulties* SSP Taste Difficulties
Crosstab
SSP Taste
Total Typical & PD DD
SDQ Emotional
Difficulties
Typical & PD Count 69 28 97
Expected Count 68.0 29.0 97.0
DD Count 25 12 37
Expected Count 26.0 11.0 37.0
Total Count 94 40 134
Expected Count 94.0 40.0 134.0
Chi-Square Tests
Value df
Asymp. Sig.
(2-sided)
Exact Sig.
(2-sided)
Exact Sig.
(1-sided)
Point
Probability
Pearson Chi-Square .163a 1 .687 .833 .419
Continuity Correctionb .037 1 .848
Likelihood Ratio .161 1 .688 .833 .419
Fisher's Exact Test .679 .419
Linear-by-Linear
Association
.161c 1 .688 .833 .419 .152
N of Valid Cases 134
a. 0 cells (.0%) have expected count less than 5. The minimum expected count is 11.04.
b. Computed only for a 2x2 table
c. The standardized statistic is .402.
306

Appendix 7h continued: SDQ Emotional Difficulties* SSP Movement Difficulties
Crosstab
SSP Movement
Total Typical & PD DD
SDQ Emotional
Difficulties
Typical & PD Count 77 20 97
Expected Count 73.3 23.7 97.0
DD Count 25 13 38
Expected Count 28.7 9.3 38.0
Total Count 102 33 135
Expected Count 102.0 33.0 135.0
Chi-Square Tests
Value df
Asymp. Sig.
(2-sided)
Exact Sig.
(2-sided)
Exact Sig.
(1-sided)
Point
Probability
Pearson Chi-Square 2.731a 1 .098 .120 .078
Continuity Correctionb 2.045 1 .153
Likelihood Ratio 2.618 1 .106 .120 .078
Fisher's Exact Test .120 .078
Linear-by-Linear
Association
2.711c 1 .100 .120 .078 .046
N of Valid Cases 135
a. 0 cells (.0%) have expected count less than 5. The minimum expected count is 9.29.
b. Computed only for a 2x2 table
c. The standardized statistic is 1.646.
307

Appendix 7h continued: SDQ Emotional Difficulties* SSP Seeks Sensation Difficulties Crosstab
SSP Seeks
Sensation
Total Typical & PD DD
SDQ Emotional
Difficulties
Typical & PD Count 29 69 98
Expected Count 29.8 68.2 98.0
DD Count 12 25 37
Expected Count 11.2 25.8 37.0
Total Count 41 94 135
Expected Count 41.0 94.0 135.0
Chi-Square Tests
Value df
Asymp. Sig.
(2-sided)
Exact Sig.
(2-sided)
Exact Sig.
(1-sided)
Point
Probability
Pearson Chi-Square .102a 1 .749 .834 .451
Continuity Correctionb .012 1 .912
Likelihood Ratio .102 1 .750 .834 .451
Fisher's Exact Test .834 .451
Linear-by-Linear
Association
.102c 1 .750 .834 .451 .156
N of Valid Cases 135
a. 0 cells (.0%) have expected count less than 5. The minimum expected count is
11.24.
b. Computed only for a 2x2 table
c. The standardized statistic is -.319.
308

Appendix 7h continued: SDQ Emotional Difficulties* SSP Auditory Difficulties
Crosstab
SSP Auditory
Total Typical & PD DD
SDQ Emotional
Difficulties
Typical & PD Count 30 66 96
Expected Count 29.6 66.4 96.0
DD Count 11 26 37
Expected Count 11.4 25.6 37.0
Total Count 41 92 133
Expected Count 41.0 92.0 133.0
Chi-Square Tests
Value df
Asymp. Sig.
(2-sided)
Exact Sig.
(2-sided)
Exact Sig.
(1-sided)
Point
Probability
Pearson Chi-Square .029a 1 .865 1.000 .520
Continuity Correctionb .000 1 1.000
Likelihood Ratio .029 1 .865 1.000 .520
Fisher's Exact Test 1.000 .520
Linear-by-Linear
Association
.029c 1 .865 1.000 .520 .164
N of Valid Cases 133
a. 0 cells (.0%) have expected count less than 5. The minimum expected count is
11.41.
b. Computed only for a 2x2 table
c. The standardized statistic is .169.
309

Appendix 7h continued: SDQ Emotional Difficulties* SSP Low Energy
Crosstab
SSP Low Energy
Total Typical & PD DD
SDQ Emotional
Difficulties
Typical & PD Count 72 24 96
Expected Count 67.1 28.9 96.0
DD Count 21 16 37
Expected Count 25.9 11.1 37.0
Total Count 93 40 133
Expected Count 93.0 40.0 133.0
Chi-Square Tests
Value df
Asymp. Sig.
(2-sided)
Exact Sig.
(2-sided)
Exact Sig.
(1-sided)
Point
Probability
Pearson Chi-Square 4.227a 1 .040 .057 .034
Continuity Correctionb 3.404 1 .065
Likelihood Ratio 4.076 1 .044 .057 .034
Fisher's Exact Test .057 .034
Linear-by-Linear
Association
4.195c 1 .041 .057 .034 .021
N of Valid Cases 133
a. 0 cells (.0%) have expected count less than 5. The minimum expected count is
11.13.
b. Computed only for a 2x2 table
c. The standardized statistic is 2.048.
310

Appendix 7h continued: SDQ Emotional Difficulties* SSP Visual/Auditory Difficulties
Crosstab
SSP Visual/Auditory
Total Typical & PD DD
SDQ Emotional
Difficulties
Typical & PD Count 77 19 96
Expected Count 74.3 21.7 96.0
DD Count 26 11 37
Expected Count 28.7 8.3 37.0
Total Count 103 30 133
Expected Count 103.0 30.0 133.0
Chi-Square Tests
Value df
Asymp. Sig.
(2-sided)
Exact Sig.
(2-sided)
Exact Sig.
(1-sided)
Point
Probability
Pearson Chi-Square 1.510a 1 .219 .250 .159
Continuity Correctionb .995 1 .319
Likelihood Ratio 1.454 1 .228 .250 .159
Fisher's Exact Test .250 .159
Linear-by-Linear
Association
1.499c 1 .221 .250 .159 .085
N of Valid Cases 133
a. 0 cells (.0%) have expected count less than 5. The minimum expected count is 8.35.
b. Computed only for a 2x2 table
c. The standardized statistic is 1.224.
311

Appendix 7h continued: SDQ Emotional Difficulties* SSP Total Difficulties Score
Crosstab
SSP Total Difficulties
Total Typical & PD DD
SDQ Emotional
Difficulties
Typical & PD Count 47 47 94
Expected Count 42.3 51.7 94.0
DD Count 12 25 37
Expected Count 16.7 20.3 37.0
Total Count 59 72 131
Expected Count 59.0 72.0 131.0
Chi-Square Tests
Value df
Asymp. Sig.
(2-sided)
Exact Sig.
(2-sided)
Exact Sig.
(1-sided)
Point
Probability
Pearson Chi-Square 3.310a 1 .069 .081 .051
Continuity Correctionb 2.638 1 .104
Likelihood Ratio 3.374 1 .066 .081 .051
Fisher's Exact Test .081 .051
Linear-by-Linear
Association
3.285c 1 .070 .081 .051 .030
N of Valid Cases 131
a. 0 cells (.0%) have expected count less than 5. The minimum expected count is
16.66.
b. Computed only for a 2x2 table
c. The standardized statistic is 1.812.
312

Appendix 7h continued: SDQ Emotional Difficulties* SC Auditory Difficulties
Crosstab
SC Auditory
Total Typical & PD DD
SDQ Emotional
Difficulties
Typical & PD Count 74 31 105
Expected Count 67.1 37.9 105.0
DD Count 18 21 39
Expected Count 24.9 14.1 39.0
Total Count 92 52 144
Expected Count 92.0 52.0 144.0
Chi-Square Tests
Value df
Asymp. Sig.
(2-sided)
Exact Sig.
(2-sided)
Exact Sig.
(1-sided)
Point
Probability
Pearson Chi-Square 7.292a 1 .007 .011 .007
Continuity Correctionb 6.276 1 .012
Likelihood Ratio 7.110 1 .008 .011 .007
Fisher's Exact Test .011 .007
Linear-by-Linear
Association
7.241c 1 .007 .011 .007 .004
N of Valid Cases 144
a. 0 cells (.0%) have expected count less than 5. The minimum expected count is
14.08.
b. Computed only for a 2x2 table
c. The standardized statistic is 2.691.
313

Appendix 7h continued: SDQ Emotional Difficulties* SC Visual Difficulties
Crosstab
SC Visual
Total Typical & PD DD
SDQ Emotional
Difficulties
Typical & PD Count 83 22 105
Expected Count 78.8 26.3 105.0
DD Count 25 14 39
Expected Count 29.3 9.8 39.0
Total Count 108 36 144
Expected Count 108.0 36.0 144.0
Chi-Square Tests
Value df
Asymp. Sig.
(2-sided)
Exact Sig.
(2-sided)
Exact Sig.
(1-sided)
Point
Probability
Pearson Chi-Square 3.388a 1 .066 .083 .054
Continuity Correctionb 2.637 1 .104
Likelihood Ratio 3.234 1 .072 .083 .054
Fisher's Exact Test .083 .054
Linear-by-Linear
Association
3.364c 1 .067 .083 .054 .033
N of Valid Cases 144
a. 0 cells (.0%) have expected count less than 5. The minimum expected count is 9.75.
b. Computed only for a 2x2 table
c. The standardized statistic is 1.834.
314

Appendix 7h continued: SDQ Emotional Difficulties* SC Movement Difficulties
Crosstab
SC Movement
Total Typical & PD DD
SDQ Emotional
Difficulties
Typical & PD Count 43 62 105
Expected Count 43.0 62.0 105.0
DD Count 16 23 39
Expected Count 16.0 23.0 39.0
Total Count 59 85 144
Expected Count 59.0 85.0 144.0
Chi-Square Tests
Value df
Asymp. Sig.
(2-sided)
Exact Sig.
(2-sided)
Exact Sig.
(1-sided)
Point
Probability
Pearson Chi-Square .000a 1 .994 1.000 .570
Continuity Correctionb .000 1 1.000
Likelihood Ratio .000 1 .994 1.000 .570
Fisher's Exact Test 1.000 .570
Linear-by-Linear
Association
.000c 1 .994 1.000 .570 .151
N of Valid Cases 144
a. 0 cells (.0%) have expected count less than 5. The minimum expected count is
15.98.
b. Computed only for a 2x2 table
c. The standardized statistic is -.008.
315

Appendix 7h continued: SDQ Emotional Difficulties* SC Tactile Difficulties
Crosstab
SC Tactile
Total Typical & PD DD
SDQ Emotional
Difficulties
Typical & PD Count 51 54 105
Expected Count 50.3 54.7 105.0
DD Count 18 21 39
Expected Count 18.7 20.3 39.0
Total Count 69 75 144
Expected Count 69.0 75.0 144.0
Chi-Square Tests
Value df
Asymp. Sig.
(2-sided)
Exact Sig.
(2-sided)
Exact Sig.
(1-sided)
Point
Probability
Pearson Chi-Square .067a 1 .796 .852 .472
Continuity Correctionb .005 1 .944
Likelihood Ratio .067 1 .796 .852 .472
Fisher's Exact Test .852 .472
Linear-by-Linear
Association
.066c 1 .797 .852 .472 .144
N of Valid Cases 144
a. 0 cells (.0%) have expected count less than 5. The minimum expected count is 18.69.
b. Computed only for a 2x2 table
c. The standardized statistic is .257.
316

Appendix 7h continued: SDQ Emotional Difficulties* SC Classroom Behaviour Difficulties
Crosstab
SC Behaviour
Total Typical & PD DD
SDQ Emotional
Difficulties
Typical & PD Count 53 52 105
Expected Count 46.7 58.3 105.0
DD Count 11 28 39
Expected Count 17.3 21.7 39.0
Total Count 64 80 144
Expected Count 64.0 80.0 144.0
Chi-Square Tests
Value df
Asymp. Sig.
(2-sided)
Exact Sig.
(2-sided)
Exact Sig.
(1-sided)
Point
Probability
Pearson Chi-Square 5.713a 1 .017 .023 .013
Continuity Correctionb 4.846 1 .028
Likelihood Ratio 5.893 1 .015 .023 .013
Fisher's Exact Test .023 .013
Linear-by-Linear
Association
5.673c 1 .017 .023 .013 .009
N of Valid Cases 144
a. 0 cells (.0%) have expected count less than 5. The minimum expected count is 17.33.
b. Computed only for a 2x2 table
c. The standardized statistic is 2.382.
317

Appendix 7h continued: SDQ Emotional Difficulties* SC School Factor 1 Sensory Seeking/Registration
Crosstab
SC SF1
Seeking/Registration
Total Typical & PD DD
SDQ Emotional
Difficulties
Typical & PD Count 51 54 105
Expected Count 50.3 54.7 105.0
DD Count 18 21 39
Expected Count 18.7 20.3 39.0
Total Count 69 75 144
Expected Count 69.0 75.0 144.0
Chi-Square Tests
Value df
Asymp. Sig.
(2-sided)
Exact Sig.
(2-sided)
Exact Sig.
(1-sided)
Point
Probability
Pearson Chi-Square .067a 1 .796 .852 .472
Continuity Correctionb .005 1 .944
Likelihood Ratio .067 1 .796 .852 .472
Fisher's Exact Test .852 .472
Linear-by-Linear
Association
.066c 1 .797 .852 .472 .144
N of Valid Cases 144
a. 0 cells (.0%) have expected count less than 5. The minimum expected count is
18.69.
b. Computed only for a 2x2 table
c. The standardized statistic is .257.
318

Appendix 7h continued: SDQ Emotional Difficulties* SC School Factor 2 Attention & Awareness
Crosstab
SC SF2 Awareness
Total Typical & PD DD
SDQ Emotional
Difficulties
Typical & PD Count 88 17 105
Expected Count 88.2 16.8 105.0
DD Count 33 6 39
Expected Count 32.8 6.2 39.0
Total Count 121 23 144
Expected Count 121.0 23.0 144.0
Chi-Square Tests
Value df
Asymp. Sig.
(2-sided)
Exact Sig.
(2-sided)
Exact Sig.
(1-sided)
Point
Probability
Pearson Chi-Square .014a 1 .907 1.000 .565
Continuity Correctionb .000 1 1.000
Likelihood Ratio .014 1 .906 1.000 .565
Fisher's Exact Test 1.000 .565
Linear-by-Linear
Association
.014c 1 .907 1.000 .565 .202
N of Valid Cases 144
a. 0 cells (.0%) have expected count less than 5. The minimum expected count is 6.23.
b. Computed only for a 2x2 table
c. The standardized statistic is -.117.
319

Appendix 7h continued: SDQ Emotional Difficulties* SC School Factor 3 Tolerance for Input
Crosstab
SC SF3 Tolerance
Total Typical & PD DD
SDQ Emotional
Difficulties
Typical & PD Count 58 47 105
Expected Count 49.6 55.4 105.0
DD Count 10 29 39
Expected Count 18.4 20.6 39.0
Total Count 68 76 144
Expected Count 68.0 76.0 144.0
Chi-Square Tests
Value df
Asymp. Sig.
(2-sided)
Exact Sig.
(2-sided)
Exact Sig.
(1-sided)
Point
Probability
Pearson Chi-Square 9.995a 1 .002 .002 .001
Continuity Correctionb 8.843 1 .003
Likelihood Ratio 10.372 1 .001 .002 .001
Fisher's Exact Test .002 .001
Linear-by-Linear
Association
9.926c 1 .002 .002 .001 .001
N of Valid Cases 144
a. 0 cells (.0%) have expected count less than 5. The minimum expected count is
18.42.
b. Computed only for a 2x2 table
c. The standardized statistic is 3.151.
320

Appendix 7h continued: SDQ Emotional Difficulties* SC School Factor 4 Availability for Learning
Crosstab
SC SF4 Availability
Total Typical & PD DD
SDQ Emotional
Difficulties
Typical & PD Count 83 22 105
Expected Count 71.5 33.5 105.0
DD Count 15 24 39
Expected Count 26.5 12.5 39.0
Total Count 98 46 144
Expected Count 98.0 46.0 144.0
Chi-Square Tests
Value df
Asymp. Sig.
(2-sided)
Exact Sig.
(2-sided)
Exact Sig.
(1-sided)
Point
Probability
Pearson Chi-Square 21.547a 1 .000 .000 .000
Continuity Correctionb 19.721 1 .000
Likelihood Ratio 20.650 1 .000 .000 .000
Fisher's Exact Test .000 .000
Linear-by-Linear
Association
21.397c 1 .000 .000 .000 .000
N of Valid Cases 144
a. 0 cells (.0%) have expected count less than 5. The minimum expected count is
12.46.
b. Computed only for a 2x2 table
c. The standardized statistic is 4.626.
321

Appendix 7h continued: SDQ Emotional Difficulties* SC Total Difficulties Score
Crosstab
SC Total Difficulties
Total Typical & PD DD
SDQ Emotional
Difficulties
Typical & PD Count 64 41 105
Expected Count 58.3 46.7 105.0
DD Count 16 23 39
Expected Count 21.7 17.3 39.0
Total Count 80 64 144
Expected Count 80.0 64.0 144.0
Chi-Square Tests
Value df
Asymp. Sig.
(2-sided)
Exact Sig.
(2-sided)
Exact Sig.
(1-sided)
Point
Probability
Pearson Chi-Square 4.573a 1 .032 .039 .026
Continuity Correctionb 3.802 1 .051
Likelihood Ratio 4.561 1 .033 .039 .026
Fisher's Exact Test .039 .026
Linear-by-Linear
Association
4.541c 1 .033 .039 .026 .016
N of Valid Cases 144
a. 0 cells (.0%) have expected count less than 5. The minimum expected count is
17.33.
b. Computed only for a 2x2 table
c. The standardized statistic is 2.131.
322

Appendix 7i
Frequency Tables for Associations between SDQ Subscale Conduct Difficulties and SSP and SC Subscales.
Key: SSP= Short Sensory Profile
SC Sensory Profile School Companion PD= Probable Difference (i.e. Probable difficulties) DD= Definite Difference (i.e. Difficulties)
SDQ Conduct Difficulties* SSP Tactile Difficulties Crosstab
SSP Tactile
Total Typical & PD DD
SDQ Conduct
Difficulties
Typical & PD Count 48 18 66
Expected Count 46.3 19.7 66.0
DD Count 46 22 68
Expected Count 47.7 20.3 68.0
Total Count 94 40 134
Expected Count 94.0 40.0 134.0
Chi-Square Tests
Value df
Asymp. Sig.
(2-sided)
Exact Sig.
(2-sided)
Exact Sig.
(1-sided)
Point
Probability
Pearson Chi-Square .413a 1 .521 .574 .325
Continuity Correctionb .206 1 .650
Likelihood Ratio .413 1 .520 .574 .325
Fisher's Exact Test .574 .325
Linear-by-Linear
Association
.410c 1 .522 .574 .325 .122
N of Valid Cases 134
a. 0 cells (.0%) have expected count less than 5. The minimum expected count is
19.70.
b. Computed only for a 2x2 table
c. The standardized statistic is .640.
323

Appendix 7i continued:
SDQ Conduct Difficulties* SSP Taste Difficulties
Crosstab
SSP Taste
Total Typical & PD DD
SDQ Conduct
Difficulties
Typical & PD Count 48 18 66
Expected Count 46.3 19.7 66.0
DD Count 46 22 68
Expected Count 47.7 20.3 68.0
Total Count 94 40 134
Expected Count 94.0 40.0 134.0
Chi-Square Tests
Value df
Asymp. Sig.
(2-sided)
Exact Sig.
(2-sided)
Exact Sig.
(1-sided)
Point
Probability
Pearson Chi-Square .413a 1 .521 .574 .325
Continuity Correctionb .206 1 .650
Likelihood Ratio .413 1 .520 .574 .325
Fisher's Exact Test .574 .325
Linear-by-Linear
Association
.410c 1 .522 .574 .325 .122
N of Valid Cases 134
a. 0 cells (.0%) have expected count less than 5. The minimum expected count is
19.70.
b. Computed only for a 2x2 table
c. The standardized statistic is .640.
324

Appendix 7i continued:
SDQ Conduct Difficulties* SSP Movement Difficulties
Crosstab
SSP Movement
Total Typical & PD DD
SDQ Conduct
Difficulties
Typical & PD Count 52 14 66
Expected Count 49.9 16.1 66.0
DD Count 50 19 69
Expected Count 52.1 16.9 69.0
Total Count 102 33 135
Expected Count 102.0 33.0 135.0
Chi-Square Tests
Value df
Asymp. Sig.
(2-sided)
Exact Sig.
(2-sided)
Exact Sig.
(1-sided)
Point
Probability
Pearson Chi-Square .730a 1 .393 .428 .257
Continuity Correctionb .428 1 .513
Likelihood Ratio .733 1 .392 .428 .257
Fisher's Exact Test .428 .257
Linear-by-Linear
Association
.725c 1 .394 .428 .257 .111
N of Valid Cases 135
a. 0 cells (.0%) have expected count less than 5. The minimum expected count is
16.13.
b. Computed only for a 2x2 table
c. The standardized statistic is .852.
325

Appendix 7i continued:
SDQ Conduct Difficulties* SSP Seeks Sensation Difficulties Crosstab
SSP Seeks
Sensation
Total Typical & PD DD
SDQ Conduct
Difficulties
Typical & PD Count 26 40 66
Expected Count 20.0 46.0 66.0
DD Count 15 54 69
Expected Count 21.0 48.0 69.0
Total Count 41 94 135
Expected Count 41.0 94.0 135.0
Chi-Square Tests
Value df
Asymp. Sig.
(2-sided)
Exact Sig.
(2-sided)
Exact Sig.
(1-sided)
Point
Probability
Pearson Chi-Square 4.972a 1 .026 .039 .020
Continuity Correctionb 4.172 1 .041
Likelihood Ratio 5.014 1 .025 .039 .020
Fisher's Exact Test .039 .020
Linear-by-Linear
Association
4.935c 1 .026 .039 .020 .013
N of Valid Cases 135
a. 0 cells (.0%) have expected count less than 5. The minimum expected count is
20.04.
b. Computed only for a 2x2 table
c. The standardized statistic is 2.222.
326

Appendix 7i continued:
SDQ Conduct Difficulties* SSP Auditory Difficulties Crosstab
SSP Auditory
Total Typical & PD DD
SDQ Conduct
Difficulties
Typical & PD Count 23 43 66
Expected Count 20.3 45.7 66.0
DD Count 18 49 67
Expected Count 20.7 46.3 67.0
Total Count 41 92 133
Expected Count 41.0 92.0 133.0
Chi-Square Tests
Value df
Asymp. Sig.
(2-sided)
Exact Sig.
(2-sided)
Exact Sig.
(1-sided)
Point
Probability
Pearson Chi-Square .994a 1 .319 .352 .209
Continuity Correctionb .655 1 .419
Likelihood Ratio .995 1 .318 .352 .209
Fisher's Exact Test .352 .209
Linear-by-Linear
Association
.986c 1 .321 .352 .209 .091
N of Valid Cases 133
a. 0 cells (.0%) have expected count less than 5. The minimum expected count is
20.35.
b. Computed only for a 2x2 table
c. The standardized statistic is .993.
327

Appendix 7i continued:
SDQ Conduct Difficulties* SSP Low Energy
Crosstab
SSP Low Energy
Total Typical & PD DD
SDQ Conduct
Difficulties
Typical & PD Count 42 23 65
Expected Count 45.5 19.5 65.0
DD Count 51 17 68
Expected Count 47.5 20.5 68.0
Total Count 93 40 133
Expected Count 93.0 40.0 133.0
Chi-Square Tests
Value df
Asymp. Sig.
(2-sided)
Exact Sig.
(2-sided)
Exact Sig.
(1-sided)
Point
Probability
Pearson Chi-Square 1.704a 1 .192 .256 .132
Continuity Correctionb 1.246 1 .264
Likelihood Ratio 1.708 1 .191 .256 .132
Fisher's Exact Test .256 .132
Linear-by-Linear
Association
1.691c 1 .193 .256 .132 .065
N of Valid Cases 133
a. 0 cells (.0%) have expected count less than 5. The minimum expected count is
19.55.
b. Computed only for a 2x2 table
c. The standardized statistic is -1.301.
328

Appendix 7i continued:
SDQ Conduct Difficulties* SSP Visual/Auditory Difficulties
Crosstab
SSP Visual/Auditory
Total Typical & PD DD
SDQ Conduct
Difficulties
Typical & PD Count 51 15 66
Expected Count 51.1 14.9 66.0
DD Count 52 15 67
Expected Count 51.9 15.1 67.0
Total Count 103 30 133
Expected Count 103.0 30.0 133.0
Chi-Square Tests
Value df
Asymp. Sig.
(2-sided)
Exact Sig.
(2-sided)
Exact Sig.
(1-sided)
Point
Probability
Pearson Chi-Square .002a 1 .963 1.000 .564
Continuity Correctionb .000 1 1.000
Likelihood Ratio .002 1 .963 1.000 .564
Fisher's Exact Test 1.000 .564
Linear-by-Linear
Association
.002c 1 .963 1.000 .564 .164
N of Valid Cases 133
a. 0 cells (.0%) have expected count less than 5. The minimum expected count is
14.89.
b. Computed only for a 2x2 table
c. The standardized statistic is -.047.
329

Appendix 7i continued:
SDQ Conduct Difficulties* SSP Total Difficulties Score
Crosstab
SSP Total Difficulties
Total Typical & PD DD
SDQ Conduct
Difficulties
Typical & PD Count 30 35 65
Expected Count 29.3 35.7 65.0
DD Count 29 37 66
Expected Count 29.7 36.3 66.0
Total Count 59 72 131
Expected Count 59.0 72.0 131.0
Chi-Square Tests
Value df
Asymp. Sig.
(2-sided)
Exact Sig.
(2-sided)
Exact Sig.
(1-sided)
Point
Probability
Pearson Chi-Square .065a 1 .799 .861 .468
Continuity Correctionb .006 1 .937
Likelihood Ratio .065 1 .799 .861 .468
Fisher's Exact Test .861 .468
Linear-by-Linear
Association
.064c 1 .800 .861 .468 .135
N of Valid Cases 131
a. 0 cells (.0%) have expected count less than 5. The minimum expected count is
29.27.
b. Computed only for a 2x2 table
c. The standardized statistic is .254.
330

Appendix 7i continued:
SDQ Conduct Difficulties* SC Auditory Difficulties Crosstab
SC Auditory
Total Typical & PD DD
SDQ Conduct
Difficulties
Typical & PD Count 44 26 70
Expected Count 44.7 25.3 70.0
DD Count 48 26 74
Expected Count 47.3 26.7 74.0
Total Count 92 52 144
Expected Count 92.0 52.0 144.0
Chi-Square Tests
Value df
Asymp. Sig.
(2-sided)
Exact Sig.
(2-sided)
Exact Sig.
(1-sided)
Point
Probability
Pearson Chi-Square .063a 1 .802 .863 .469
Continuity Correctionb .006 1 .939
Likelihood Ratio .063 1 .802 .863 .469
Fisher's Exact Test .863 .469
Linear-by-Linear
Association
.062c 1 .803 .863 .469 .133
N of Valid Cases 144
a. 0 cells (.0%) have expected count less than 5. The minimum expected count is
25.28.
b. Computed only for a 2x2 table
c. The standardized statistic is -.250.
331

Appendix 7i continued:
SDQ Conduct Difficulties* SC Visual Difficulties
Crosstab
SC Visual
Total Typical & PD DD
SDQ Conduct
Difficulties
Typical & PD Count 54 16 70
Expected Count 52.5 17.5 70.0
DD Count 54 20 74
Expected Count 55.5 18.5 74.0
Total Count 108 36 144
Expected Count 108.0 36.0 144.0
Chi-Square Tests
Value df
Asymp. Sig.
(2-sided)
Exact Sig.
(2-sided)
Exact Sig.
(1-sided)
Point
Probability
Pearson Chi-Square .334a 1 .564 .701 .351
Continuity Correctionb .148 1 .700
Likelihood Ratio .334 1 .563 .571 .351
Fisher's Exact Test .701 .351
Linear-by-Linear
Association
.331c 1 .565 .701 .351 .130
N of Valid Cases 144
a. 0 cells (.0%) have expected count less than 5. The minimum expected count is
17.50.
b. Computed only for a 2x2 table
c. The standardized statistic is .576.
332

Appendix 7i continued:
SDQ Conduct Difficulties* SC Movement Difficulties
Crosstab
SC Movement
Total Typical & PD DD
SDQ Conduct
Difficulties
Typical & PD Count 31 39 70
Expected Count 28.7 41.3 70.0
DD Count 28 46 74
Expected Count 30.3 43.7 74.0
Total Count 59 85 144
Expected Count 59.0 85.0 144.0
Chi-Square Tests
Value df
Asymp. Sig.
(2-sided)
Exact Sig.
(2-sided)
Exact Sig.
(1-sided)
Point
Probability
Pearson Chi-Square .618a 1 .432 .499 .269
Continuity Correctionb .381 1 .537
Likelihood Ratio .619 1 .432 .499 .269
Fisher's Exact Test .499 .269
Linear-by-Linear
Association
.614c 1 .433 .499 .269 .099
N of Valid Cases 144
a. 0 cells (.0%) have expected count less than 5. The minimum expected count is
28.68.
b. Computed only for a 2x2 table
c. The standardized statistic is .784.
333

Appendix 7i continued:
SDQ Conduct Difficulties* SC Tactile Difficulties
Crosstab
SC Tactile
Total Typical & PD DD
SDQ Conduct
Difficulties
Typical & PD Count 40 30 70
Expected Count 33.5 36.5 70.0
DD Count 29 45 74
Expected Count 35.5 38.5 74.0
Total Count 69 75 144
Expected Count 69.0 75.0 144.0
Chi-Square Tests
Value df
Asymp. Sig.
(2-sided)
Exact Sig.
(2-sided)
Exact Sig.
(1-sided)
Point
Probability
Pearson Chi-Square 4.646a 1 .031 .045 .023
Continuity Correctionb 3.955 1 .047
Likelihood Ratio 4.670 1 .031 .045 .023
Fisher's Exact Test .045 .023
Linear-by-Linear
Association
4.614c 1 .032 .045 .023 .013
N of Valid Cases 144
a. 0 cells (.0%) have expected count less than 5. The minimum expected count is
33.54.
b. Computed only for a 2x2 table
c. The standardized statistic is 2.148.
334

Appendix 7i continued:
SDQ Conduct Difficulties* SC Classroom Behaviour Difficulties Crosstab
SC Behaviour
Total Typical & PD DD
SDQ Conduct
Difficulties
Typical & PD Count 39 31 70
Expected Count 31.1 38.9 70.0
DD Count 25 49 74
Expected Count 32.9 41.1 74.0
Total Count 64 80 144
Expected Count 64.0 80.0 144.0
Chi-Square Tests
Value df
Asymp. Sig.
(2-sided)
Exact Sig.
(2-sided)
Exact Sig.
(1-sided)
Point
Probability
Pearson Chi-Square 7.007a 1 .008 .012 .006
Continuity Correctionb 6.147 1 .013
Likelihood Ratio 7.061 1 .008 .012 .006
Fisher's Exact Test .012 .006
Linear-by-Linear
Association
6.958c 1 .008 .012 .006 .004
N of Valid Cases 144
a. 0 cells (.0%) have expected count less than 5. The minimum expected count is
31.11.
b. Computed only for a 2x2 table
c. The standardized statistic is 2.638.
335

Appendix 7i continued:
SDQ Conduct Difficulties* SC School Factor 1 Sensory Seeking/Registration
Crosstab
SC SF1
Seeking/Registration
Total Typical & PD DD
SDQ Conduct
Difficulties
Typical & PD Count 40 30 70
Expected Count 33.5 36.5 70.0
DD Count 29 45 74
Expected Count 35.5 38.5 74.0
Total Count 69 75 144
Expected Count 69.0 75.0 144.0
Chi-Square Tests
Value df
Asymp. Sig.
(2-sided)
Exact Sig.
(2-sided)
Exact Sig.
(1-sided)
Point
Probability
Pearson Chi-Square 4.646a 1 .031 .045 .023
Continuity Correctionb 3.955 1 .047
Likelihood Ratio 4.670 1 .031 .045 .023
Fisher's Exact Test .045 .023
Linear-by-Linear
Association
4.614c 1 .032 .045 .023 .013
N of Valid Cases 144
a. 0 cells (.0%) have expected count less than 5. The minimum expected count is
33.54.
b. Computed only for a 2x2 table
c. The standardized statistic is 2.148.
336

Appendix 7i continued:
SDQ Conduct Difficulties* SC School Factor 2 Attention & Awareness
Crosstab
SC SF2 Awareness
Total Typical & PD DD
SDQ Conduct
Difficulties
Typical & PD Count 64 6 70
Expected Count 58.8 11.2 70.0
DD Count 57 17 74
Expected Count 62.2 11.8 74.0
Total Count 121 23 144
Expected Count 121.0 23.0 144.0
Chi-Square Tests
Value df
Asymp. Sig.
(2-sided)
Exact Sig.
(2-sided)
Exact Sig.
(1-sided)
Point
Probability
Pearson Chi-Square 5.559a 1 .018 .023 .016
Continuity Correctionb 4.538 1 .033
Likelihood Ratio 5.776 1 .016 .023 .016
Fisher's Exact Test .023 .016
Linear-by-Linear
Association
5.520c 1 .019 .023 .016 .011
N of Valid Cases 144
a. 0 cells (.0%) have expected count less than 5. The minimum expected count is
11.18.
b. Computed only for a 2x2 table
c. The standardized statistic is 2.350.
337
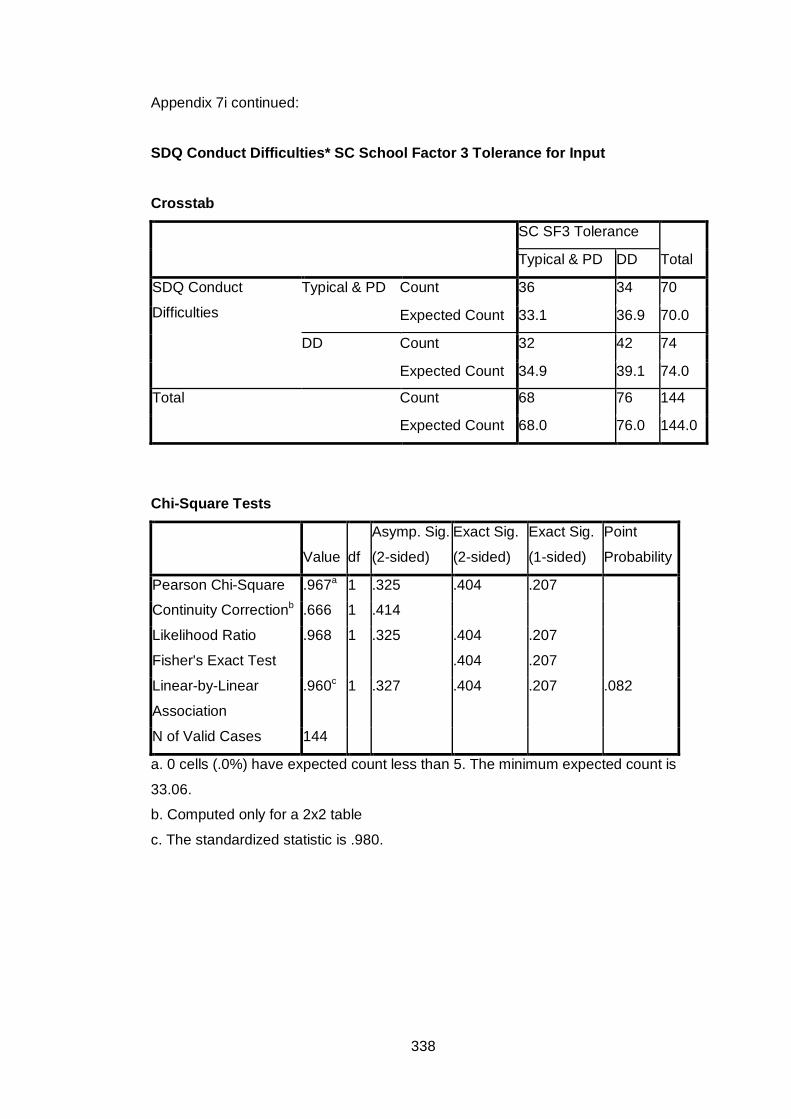
Appendix 7i continued:
SDQ Conduct Difficulties* SC School Factor 3 Tolerance for Input
Crosstab
SC SF3 Tolerance
Total Typical & PD DD
SDQ Conduct
Difficulties
Typical & PD Count 36 34 70
Expected Count 33.1 36.9 70.0
DD Count 32 42 74
Expected Count 34.9 39.1 74.0
Total Count 68 76 144
Expected Count 68.0 76.0 144.0
Chi-Square Tests
Value df
Asymp. Sig.
(2-sided)
Exact Sig.
(2-sided)
Exact Sig.
(1-sided)
Point
Probability
Pearson Chi-Square .967a 1 .325 .404 .207
Continuity Correctionb .666 1 .414
Likelihood Ratio .968 1 .325 .404 .207
Fisher's Exact Test .404 .207
Linear-by-Linear
Association
.960c 1 .327 .404 .207 .082
N of Valid Cases 144
a. 0 cells (.0%) have expected count less than 5. The minimum expected count is
33.06.
b. Computed only for a 2x2 table
c. The standardized statistic is .980.
338

Appendix 7i continued:
SDQ Conduct Difficulties* SC School Factor 4 Availability for Learning
Crosstab
SC SF4 Availability
Total Typical & PD DD
SDQ Conduct
Difficulties
Typical & PD Count 39 31 70
Expected Count 47.6 22.4 70.0
DD Count 59 15 74
Expected Count 50.4 23.6 74.0
Total Count 98 46 144
Expected Count 98.0 46.0 144.0
Chi-Square Tests
Value df
Asymp. Sig.
(2-sided)
Exact Sig.
(2-sided)
Exact Sig.
(1-sided)
Point
Probability
Pearson Chi-Square 9.543a 1 .002 .002 .002
Continuity Correctionb 8.470 1 .004
Likelihood Ratio 9.683 1 .002 .002 .002
Fisher's Exact Test .002 .002
Linear-by-Linear
Association
9.477c 1 .002 .002 .002 .001
N of Valid Cases 144
a. 0 cells (.0%) have expected count less than 5. The minimum expected count is
22.36.
b. Computed only for a 2x2 table
c. The standardized statistic is -3.078.
339

Appendix 7i continued:
SDQ Conduct Difficulties* SC Total Difficulties Score
Crosstab
SC Total Difficulties
Total Typical & PD DD
SDQ Conduct
Difficulties
Typical & PD Count 44 26 70
Expected Count 38.9 31.1 70.0
DD Count 36 38 74
Expected Count 41.1 32.9 74.0
Total Count 80 64 144
Expected Count 80.0 64.0 144.0
Chi-Square Tests
Value df
Asymp. Sig.
(2-sided)
Exact Sig.
(2-sided)
Exact Sig.
(1-sided)
Point
Probability
Pearson Chi-Square 2.941a 1 .086 .096 .061
Continuity Correctionb 2.394 1 .122
Likelihood Ratio 2.954 1 .086 .096 .061
Fisher's Exact Test .096 .061
Linear-by-Linear
Association
2.921c 1 .087 .096 .061 .031
N of Valid Cases 144
a. 0 cells (.0%) have expected count less than 5. The minimum expected count is
31.11.
b. Computed only for a 2x2 table
c. The standardized statistic is 1.709.
340

Appendix 7j
Frequency Tables for Associations between SDQ Subscale Hyperactive and SSP and SC Subscales.
Key: SSP= Short Sensory Profile
SC Sensory Profile School Companion PD= Probable Difference (i.e. Probable difficulties) DD= Definite Difference (i.e. Difficulties)
SDQ Hyperactive * SSP Tactile Difficulties Crosstab
SSP Tactile
Total Typical & PD DD
SDQ Hyperactive Typical & PD Count 23 11 34
Expected Count 23.9 10.1 34.0
DD Count 71 29 100
Expected Count 70.1 29.9 100.0
Total Count 94 40 134
Expected Count 94.0 40.0 134.0
Chi-Square Tests
Value df
Asymp. Sig.
(2-sided)
Exact Sig.
(2-sided)
Exact Sig.
(1-sided)
Point
Probability
Pearson Chi-Square .136a 1 .712 .829 .434
Continuity Correctionb .023 1 .879
Likelihood Ratio .135 1 .713 .829 .434
Fisher's Exact Test .829 .434
Linear-by-Linear
Association
.135c 1 .713 .829 .434 .158
N of Valid Cases 134
a. 0 cells (.0%) have expected count less than 5. The minimum expected count is
10.15.
b. Computed only for a 2x2 table
c. The standardized statistic is -.368.
341
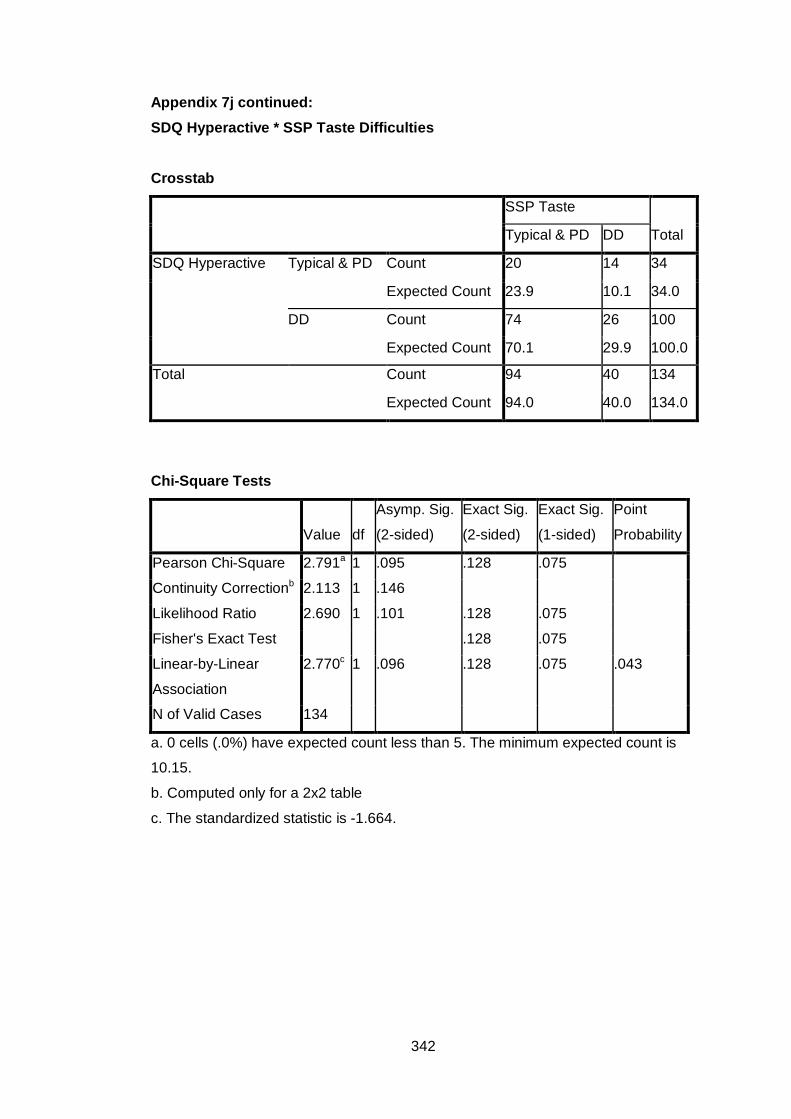
Appendix 7j continued: SDQ Hyperactive * SSP Taste Difficulties
Crosstab
SSP Taste
Total Typical & PD DD
SDQ Hyperactive Typical & PD Count 20 14 34
Expected Count 23.9 10.1 34.0
DD Count 74 26 100
Expected Count 70.1 29.9 100.0
Total Count 94 40 134
Expected Count 94.0 40.0 134.0
Chi-Square Tests
Value df
Asymp. Sig.
(2-sided)
Exact Sig.
(2-sided)
Exact Sig.
(1-sided)
Point
Probability
Pearson Chi-Square 2.791a 1 .095 .128 .075
Continuity Correctionb 2.113 1 .146
Likelihood Ratio 2.690 1 .101 .128 .075
Fisher's Exact Test .128 .075
Linear-by-Linear
Association
2.770c 1 .096 .128 .075 .043
N of Valid Cases 134
a. 0 cells (.0%) have expected count less than 5. The minimum expected count is
10.15.
b. Computed only for a 2x2 table
c. The standardized statistic is -1.664.
342

Appendix 7j continued: SDQ Hyperactive * SSP Movement Difficulties
Crosstab
SSP Movement
Total Typical & PD DD
SDQ Hyperactive Typical & PD Count 25 9 34
Expected Count 25.7 8.3 34.0
DD Count 77 24 101
Expected Count 76.3 24.7 101.0
Total Count 102 33 135
Expected Count 102.0 33.0 135.0
Chi-Square Tests
Value df
Asymp. Sig.
(2-sided)
Exact Sig.
(2-sided)
Exact Sig.
(1-sided)
Point
Probability
Pearson Chi-Square .101a 1 .751 .818 .458
Continuity Correctionb .008 1 .931
Likelihood Ratio .100 1 .752 .818 .458
Fisher's Exact Test .818 .458
Linear-by-Linear
Association
.100c 1 .752 .818 .458 .170
N of Valid Cases 135
a. 0 cells (.0%) have expected count less than 5. The minimum expected count is
8.31.
b. Computed only for a 2x2 table
c. The standardized statistic is -.317.
343

Appendix 7j continued: SDQ Hyperactive * SSP Seeks Sensation Difficulties Crosstab
SSP Seeks Sensation
Total Typical & PD DD
SDQ Hyperactive Typical & PD Count 15 20 35
Expected Count 10.6 24.4 35.0
DD Count 26 74 100
Expected Count 30.4 69.6 100.0
Total Count 41 94 135
Expected Count 41.0 94.0 135.0
Chi-Square Tests
Value df
Asymp. Sig.
(2-sided)
Exact Sig.
(2-sided)
Exact Sig.
(1-sided)
Point
Probability
Pearson Chi-Square 3.484a 1 .062 .087 .051
Continuity Correctionb 2.732 1 .098
Likelihood Ratio 3.357 1 .067 .087 .051
Fisher's Exact Test .087 .051
Linear-by-Linear
Association
3.458c 1 .063 .087 .051 .031
N of Valid Cases 135
a. 0 cells (.0%) have expected count less than 5. The minimum expected count is
10.63.
b. Computed only for a 2x2 table
c. The standardized statistic is 1.860.
344

Appendix 7j continued: SDQ Hyperactive * SSP Auditory Difficulties Crosstab
SSP Auditory
Total Typical & PD DD
SDQ Hyperactive Typical & PD Count 12 21 33
Expected Count 10.2 22.8 33.0
DD Count 29 71 100
Expected Count 30.8 69.2 100.0
Total Count 41 92 133
Expected Count 41.0 92.0 133.0
Chi-Square Tests
Value df
Asymp. Sig.
(2-sided)
Exact Sig.
(2-sided)
Exact Sig.
(1-sided)
Point
Probability
Pearson Chi-Square .631a 1 .427 .515 .279
Continuity Correctionb .333 1 .564
Likelihood Ratio .619 1 .432 .515 .279
Fisher's Exact Test .515 .279
Linear-by-Linear
Association
.626c 1 .429 .515 .279 .123
N of Valid Cases 133
a. 0 cells (.0%) have expected count less than 5. The minimum expected count is
10.17.
b. Computed only for a 2x2 table
c. The standardized statistic is .791.
345

Appendix 7j continued: SDQ Hyperactive * SSP Low Energy
Crosstab
SSP Low Energy
Total Typical & PD DD
SDQ Hyperactive Typical & PD Count 25 9 34
Expected Count 23.8 10.2 34.0
DD Count 68 31 99
Expected Count 69.2 29.8 99.0
Total Count 93 40 133
Expected Count 93.0 40.0 133.0
Chi-Square Tests
Value df
Asymp. Sig.
(2-sided)
Exact Sig.
(2-sided)
Exact Sig.
(1-sided)
Point
Probability
Pearson Chi-Square .282a 1 .595 .669 .382
Continuity Correctionb .099 1 .753
Likelihood Ratio .287 1 .592 .669 .382
Fisher's Exact Test .669 .382
Linear-by-Linear
Association
.280c 1 .597 .669 .382 .152
N of Valid Cases 133
a. 0 cells (.0%) have expected count less than 5. The minimum expected count is
10.23.
b. Computed only for a 2x2 table
c. The standardized statistic is .529.
346

Appendix 7j continued: SDQ Hyperactive * SSP Visual/Auditory Difficulties
Crosstab
SSP Visual/Auditory
Total Typical & PD DD
SDQ Hyperactive Typical & PD Count 24 9 33
Expected Count 25.6 7.4 33.0
DD Count 79 21 100
Expected Count 77.4 22.6 100.0
Total Count 103 30 133
Expected Count 103.0 30.0 133.0
Chi-Square Tests
Value df
Asymp. Sig.
(2-sided)
Exact Sig.
(2-sided)
Exact Sig.
(1-sided)
Point
Probability
Pearson Chi-Square .559a 1 .455 .477 .300
Continuity Correctionb .257 1 .612
Likelihood Ratio .543 1 .461 .477 .300
Fisher's Exact Test .477 .300
Linear-by-Linear
Association
.555c 1 .456 .477 .300 .139
N of Valid Cases 133
a. 0 cells (.0%) have expected count less than 5. The minimum expected count is
7.44.
b. Computed only for a 2x2 table
c. The standardized statistic is -.745.
347

Appendix 7j continued: SDQ Hyperactive * SSP Total Difficulties Score
Crosstab
SSP Total Difficulties
Total Typical & PD DD
SDQ Hyperactive Typical & PD Count 12 20 32
Expected Count 14.4 17.6 32.0
DD Count 47 52 99
Expected Count 44.6 54.4 99.0
Total Count 59 72 131
Expected Count 59.0 72.0 131.0
Chi-Square Tests
Value df
Asymp. Sig.
(2-sided)
Exact Sig.
(2-sided)
Exact Sig.
(1-sided)
Point
Probability
Pearson Chi-Square .972a 1 .324 .414 .218
Continuity Correctionb .611 1 .434
Likelihood Ratio .982 1 .322 .414 .218
Fisher's Exact Test .414 .218
Linear-by-Linear
Association
.965c 1 .326 .414 .218 .101
N of Valid Cases 131
a. 0 cells (.0%) have expected count less than 5. The minimum expected count is
14.41.
b. Computed only for a 2x2 table
c. The standardized statistic is -.982.
348

Appendix 7j continued: SDQ Hyperactive * SC Auditory Difficulties
Crosstab
SC Auditory
Total Typical & PD DD
SDQ Hyperactive Typical & PD Count 25 12 37
Expected Count 23.6 13.4 37.0
DD Count 67 40 107
Expected Count 68.4 38.6 107.0
Total Count 92 52 144
Expected Count 92.0 52.0 144.0
Chi-Square Tests
Value df
Asymp. Sig.
(2-sided)
Exact Sig.
(2-sided)
Exact Sig.
(1-sided)
Point
Probability
Pearson Chi-Square .292a 1 .589 .693 .369
Continuity Correctionb .117 1 .732
Likelihood Ratio .295 1 .587 .693 .369
Fisher's Exact Test .693 .369
Linear-by-Linear
Association
.290c 1 .590 .693 .369 .138
N of Valid Cases 144
a. 0 cells (.0%) have expected count less than 5. The minimum expected count is
13.36.
b. Computed only for a 2x2 table
c. The standardized statistic is .539.
349

Appendix 7j continued: SDQ Hyperactive * SC Visual Difficulties
Crosstab
SC Visual
Total Typical & PD DD
SDQ Hyperactive Typical & PD Count 31 6 37
Expected Count 27.8 9.3 37.0
DD Count 77 30 107
Expected Count 80.3 26.8 107.0
Total Count 108 36 144
Expected Count 108.0 36.0 144.0
Chi-Square Tests
Value df
Asymp. Sig.
(2-sided)
Exact Sig.
(2-sided)
Exact Sig.
(1-sided)
Point
Probability
Pearson Chi-Square 2.049a 1 .152 .189 .111
Continuity Correctionb 1.467 1 .226
Likelihood Ratio 2.185 1 .139 .189 .111
Fisher's Exact Test .189 .111
Linear-by-Linear
Association
2.035c 1 .154 .189 .111 .066
N of Valid Cases 144
a. 0 cells (.0%) have expected count less than 5. The minimum expected count is
9.25.
b. Computed only for a 2x2 table
c. The standardized statistic is 1.426.
350

Appendix 7j continued: SDQ Hyperactive * SC Movement Difficulties Crosstab
SC Movement
Total Typical & PD DD
SDQ Hyperactive Typical & PD Count 23 14 37
Expected Count 15.2 21.8 37.0
DD Count 36 71 107
Expected Count 43.8 63.2 107.0
Total Count 59 85 144
Expected Count 59.0 85.0 144.0
Chi-Square Tests
Value df
Asymp. Sig.
(2-sided)
Exact Sig.
(2-sided)
Exact Sig.
(1-sided)
Point
Probability
Pearson Chi-Square 9.245a 1 .002 .003 .002
Continuity Correctionb 8.103 1 .004
Likelihood Ratio 9.153 1 .002 .003 .002
Fisher's Exact Test .003 .002
Linear-by-Linear
Association
9.181c 1 .002 .003 .002 .002
N of Valid Cases 144
a. 0 cells (.0%) have expected count less than 5. The minimum expected count is
15.16.
b. Computed only for a 2x2 table
c. The standardized statistic is 3.030.
351

Appendix 7j continued: SDQ Hyperactive * SC Tactile Difficulties Crosstab
SC Tactile
Total Typical & PD DD
SDQ Hyperactive Typical & PD Count 22 15 37
Expected Count 17.7 19.3 37.0
DD Count 47 60 107
Expected Count 51.3 55.7 107.0
Total Count 69 75 144
Expected Count 69.0 75.0 144.0
Chi-Square Tests
Value df
Asymp. Sig.
(2-sided)
Exact Sig.
(2-sided)
Exact Sig.
(1-sided)
Point
Probability
Pearson Chi-Square 2.658a 1 .103 .128 .075
Continuity Correctionb 2.072 1 .150
Likelihood Ratio 2.666 1 .103 .128 .075
Fisher's Exact Test .128 .075
Linear-by-Linear
Association
2.640c 1 .104 .128 .075 .041
N of Valid Cases 144
a. 0 cells (.0%) have expected count less than 5. The minimum expected count is
17.73.
b. Computed only for a 2x2 table
c. The standardized statistic is 1.625.
352

Appendix 7j continued: SDQ Hyperactive * SC Classroom Behaviour Difficulties
Crosstab
SC Behaviour
Total Typical & PD DD
SDQ Hyperactive Typical & PD Count 14 23 37
Expected Count 16.4 20.6 37.0
DD Count 50 57 107
Expected Count 47.6 59.4 107.0
Total Count 64 80 144
Expected Count 64.0 80.0 144.0
Chi-Square Tests
Value df
Asymp. Sig.
(2-sided)
Exact Sig.
(2-sided)
Exact Sig.
(1-sided)
Point
Probability
Pearson Chi-Square .880a 1 .348 .443 .228
Continuity Correctionb .557 1 .455
Likelihood Ratio .888 1 .346 .443 .228
Fisher's Exact Test .443 .228
Linear-by-Linear
Association
.874c 1 .350 .443 .228 .099
N of Valid Cases 144
a. 0 cells (.0%) have expected count less than 5. The minimum expected count is
16.44.
b. Computed only for a 2x2 table
c. The standardized statistic is -.935.
353

Appendix 7j continued: SDQ Hyperactive * SC School Factor 1 Sensory Seeking/Registration
Crosstab
SC SF1 Seeking/
Registration
Total Typical & PD DD
SDQ Hyperactive Typical & PD Count 26 11 37
Expected Count 17.7 19.3 37.0
DD Count 43 64 107
Expected Count 51.3 55.7 107.0
Total Count 69 75 144
Expected Count 69.0 75.0 144.0
Chi-Square Tests
Value df
Asymp. Sig.
(2-sided)
Exact Sig.
(2-sided)
Exact Sig.
(1-sided)
Point
Probability
Pearson Chi-Square 9.970a 1 .002 .002 .001
Continuity Correctionb 8.801 1 .003
Likelihood Ratio 10.158 1 .001 .002 .001
Fisher's Exact Test .002 .001
Linear-by-Linear
Association
9.901c 1 .002 .002 .001 .001
N of Valid Cases 144
a. 0 cells (.0%) have expected count less than 5. The minimum expected count is
17.73.
b. Computed only for a 2x2 table
c. The standardized statistic is 3.147.
354

Appendix 7j continued: SDQ Hyperactive * SC School Factor 2 Attention & Awareness
Crosstab
SC SF2 Awareness
Total Typical & PD DD
SDQ Hyperactive Typical & PD Count 34 3 37
Expected Count 31.1 5.9 37.0
DD Count 87 20 107
Expected Count 89.9 17.1 107.0
Total Count 121 23 144
Expected Count 121.0 23.0 144.0
Chi-Square Tests
Value df
Asymp. Sig.
(2-sided)
Exact Sig.
(2-sided)
Exact Sig.
(1-sided)
Point
Probability
Pearson Chi-Square 2.295a 1 .130 .192 .101
Continuity Correctionb 1.574 1 .210
Likelihood Ratio 2.580 1 .108 .135 .101
Fisher's Exact Test .192 .101
Linear-by-Linear
Association
2.279c 1 .131 .192 .101 .070
N of Valid Cases 144
a. 0 cells (.0%) have expected count less than 5. The minimum expected count is
5.91.
b. Computed only for a 2x2 table
c. The standardized statistic is 1.509.
355

Appendix 7j continued: SDQ Hyperactive * SC School Factor 3 Tolerance for Input
Crosstab
SC SF3 Tolerance
Total Typical & PD DD
SDQ Hyperactive Typical & PD Count 17 20 37
Expected Count 17.5 19.5 37.0
DD Count 51 56 107
Expected Count 50.5 56.5 107.0
Total Count 68 76 144
Expected Count 68.0 76.0 144.0
Chi-Square Tests
Value df
Asymp. Sig.
(2-sided)
Exact Sig.
(2-sided)
Exact Sig.
(1-sided)
Point
Probability
Pearson Chi-Square .033a 1 .857 1.000 .505
Continuity Correctionb .000 1 1.000
Likelihood Ratio .033 1 .857 1.000 .505
Fisher's Exact Test 1.000 .505
Linear-by-Linear
Association
.032c 1 .857 1.000 .505 .149
N of Valid Cases 144
a. 0 cells (.0%) have expected count less than 5. The minimum expected count is
17.47.
b. Computed only for a 2x2 table
c. The standardized statistic is -.180.
356

Appendix 7j continued: SDQ Hyperactive * SC School Factor 4 Availability for Learning
Crosstab
SC SF4 Availability
Total Typical & PD DD
SDQ Hyperactive Typical & PD Count 19 18 37
Expected Count 25.2 11.8 37.0
DD Count 79 28 107
Expected Count 72.8 34.2 107.0
Total Count 98 46 144
Expected Count 98.0 46.0 144.0
Chi-Square Tests
Value df
Asymp. Sig.
(2-sided)
Exact Sig.
(2-sided)
Exact Sig.
(1-sided)
Point
Probability
Pearson Chi-Square 6.391a 1 .011 .015 .011
Continuity Correctionb 5.399 1 .020
Likelihood Ratio 6.143 1 .013 .024 .011
Fisher's Exact Test .015 .011
Linear-by-Linear
Association
6.347c 1 .012 .015 .011 .007
N of Valid Cases 144
a. 0 cells (.0%) have expected count less than 5. The minimum expected count is
11.82.
b. Computed only for a 2x2 table
c. The standardized statistic is -2.519.
357

Appendix 7j continued: SDQ Hyperactive * SC Total Difficulties Score
Crosstab
SC Total Difficulties
Total Typical & PD DD
SDQ Hyperactive Typical & PD Count 24 13 37
Expected Count 20.6 16.4 37.0
DD Count 56 51 107
Expected Count 59.4 47.6 107.0
Total Count 80 64 144
Expected Count 80.0 64.0 144.0
Chi-Square Tests
Value df
Asymp. Sig.
(2-sided)
Exact Sig.
(2-sided)
Exact Sig.
(1-sided)
Point
Probability
Pearson Chi-Square 1.748a 1 .186 .250 .129
Continuity Correctionb 1.277 1 .258
Likelihood Ratio 1.773 1 .183 .250 .129
Fisher's Exact Test .250 .129
Linear-by-Linear
Association
1.736c 1 .188 .250 .129 .065
N of Valid Cases 144
a. 0 cells (.0%) have expected count less than 5. The minimum expected count is
16.44.
b. Computed only for a 2x2 table
c. The standardized statistic is 1.317.
358

Appendix 7k
Frequency Tables for Associations between SDQ Subscale Peer Relations and SSP and SC Subscales.
Key: SSP= Short Sensory Profile
SC Sensory Profile School Companion PD= Probable Difference (i.e. Probable difficulties) DD= Definite Difference (i.e. Difficulties)
SDQ Peer Relations* SSP Tactile Difficulties Crosstab
SSP Tactile
Total Typical & PD DD
SDQ Peer
Relations
Typical & PD Count 62 18 80
Expected Count 56.1 23.9 80.0
DD Count 32 22 54
Expected Count 37.9 16.1 54.0
Total Count 94 40 134
Expected Count 94.0 40.0 134.0
Chi-Square Tests
Value df
Asymp. Sig.
(2-sided)
Exact Sig.
(2-sided)
Exact Sig.
(1-sided)
Point
Probability
Pearson Chi-Square 5.123a 1 .024 .034 .020
Continuity Correctionb 4.288 1 .038
Likelihood Ratio 5.068 1 .024 .034 .020
Fisher's Exact Test .034 .020
Linear-by-Linear
Association
5.084c 1 .024 .034 .020 .012
N of Valid Cases 134
a. 0 cells (.0%) have expected count less than 5. The minimum expected count is
16.12.
b. Computed only for a 2x2 table
c. The standardized statistic is 2.255.
359

Appendix 7k continued: SDQ Peer Relations * SSP Taste Difficulties Crosstab
SSP Taste
Total Typical & PD DD
SDQ Peer
Relations
Typical & PD Count 61 19 80
Expected Count 56.1 23.9 80.0
DD Count 33 21 54
Expected Count 37.9 16.1 54.0
Total Count 94 40 134
Expected Count 94.0 40.0 134.0
Chi-Square Tests
Value df
Asymp. Sig.
(2-sided)
Exact Sig.
(2-sided)
Exact Sig.
(1-sided)
Point
Probability
Pearson Chi-Square 3.528a 1 .060 .083 .046
Continuity Correctionb 2.843 1 .092
Likelihood Ratio 3.491 1 .062 .083 .046
Fisher's Exact Test .083 .046
Linear-by-Linear
Association
3.502c 1 .061 .083 .046 .027
N of Valid Cases 134
a. 0 cells (.0%) have expected count less than 5. The minimum expected count is
16.12.
b. Computed only for a 2x2 table
c. The standardized statistic is 1.871.
360

Appendix 7k continued: SDQ Peer Relations * SSP Movement Difficulties
Crosstab
SSP Movement
Total Typical & PD DD
SDQ Peer
Relations
Typical & PD Count 68 12 80
Expected Count 60.4 19.6 80.0
DD Count 34 21 55
Expected Count 41.6 13.4 55.0
Total Count 102 33 135
Expected Count 102.0 33.0 135.0
Chi-Square Tests
Value df
Asymp. Sig.
(2-sided)
Exact Sig.
(2-sided)
Exact Sig.
(1-sided)
Point
Probability
Pearson Chi-Square 9.483a 1 .002 .002 .002
Continuity Correctionb 8.270 1 .004
Likelihood Ratio 9.383 1 .002 .004 .002
Fisher's Exact Test .004 .002
Linear-by-Linear
Association
9.413c 1 .002 .002 .002 .002
N of Valid Cases 135
a. 0 cells (.0%) have expected count less than 5. The minimum expected count is
13.44.
b. Computed only for a 2x2 table
c. The standardized statistic is 3.068.
361
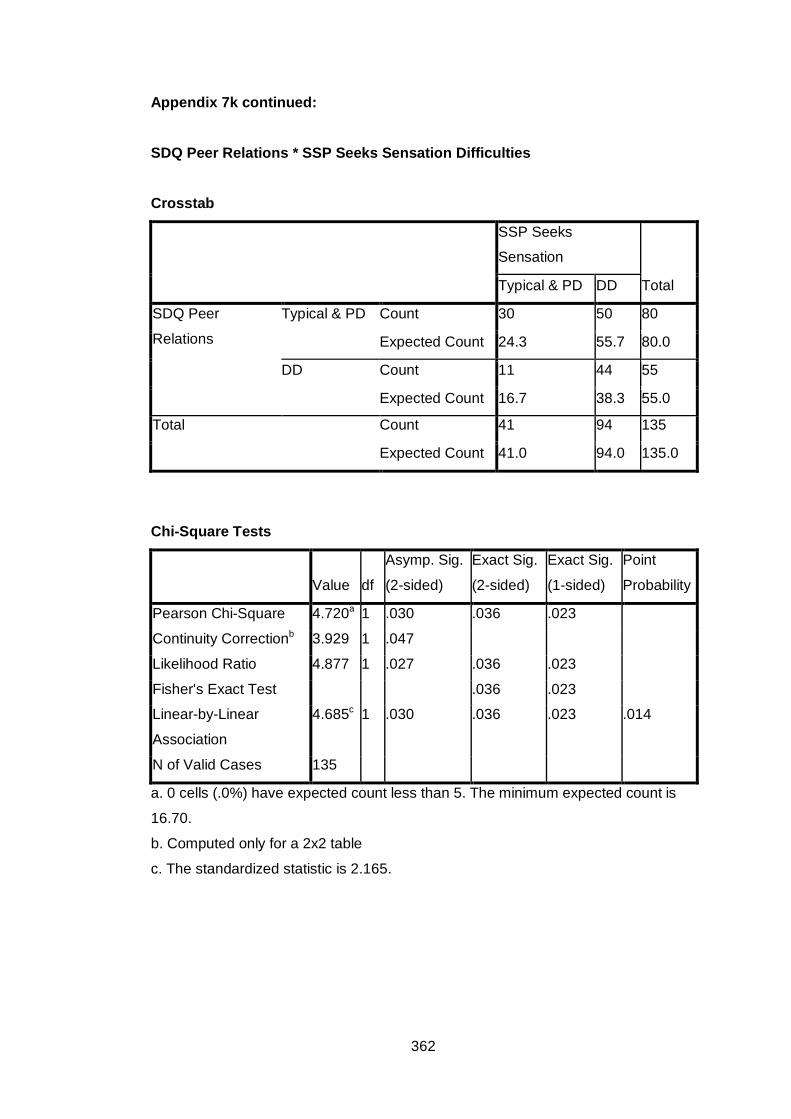
Appendix 7k continued: SDQ Peer Relations * SSP Seeks Sensation Difficulties
Crosstab
SSP Seeks
Sensation
Total Typical & PD DD
SDQ Peer
Relations
Typical & PD Count 30 50 80
Expected Count 24.3 55.7 80.0
DD Count 11 44 55
Expected Count 16.7 38.3 55.0
Total Count 41 94 135
Expected Count 41.0 94.0 135.0
Chi-Square Tests
Value df
Asymp. Sig.
(2-sided)
Exact Sig.
(2-sided)
Exact Sig.
(1-sided)
Point
Probability
Pearson Chi-Square 4.720a 1 .030 .036 .023
Continuity Correctionb 3.929 1 .047
Likelihood Ratio 4.877 1 .027 .036 .023
Fisher's Exact Test .036 .023
Linear-by-Linear
Association
4.685c 1 .030 .036 .023 .014
N of Valid Cases 135
a. 0 cells (.0%) have expected count less than 5. The minimum expected count is
16.70.
b. Computed only for a 2x2 table
c. The standardized statistic is 2.165.
362

Appendix 7k continued: SDQ Peer Relations * SSP Auditory Difficulties
Crosstab
SSP Auditory
Total Typical & PD DD
SDQ Peer
Relations
Typical & PD Count 28 51 79
Expected Count 24.4 54.6 79.0
DD Count 13 41 54
Expected Count 16.6 37.4 54.0
Total Count 41 92 133
Expected Count 41.0 92.0 133.0
Chi-Square Tests
Value df
Asymp. Sig.
(2-sided)
Exact Sig.
(2-sided)
Exact Sig.
(1-sided)
Point
Probability
Pearson Chi-Square 1.944a 1 .163 .185 .114
Continuity Correctionb 1.448 1 .229
Likelihood Ratio 1.979 1 .159 .185 .114
Fisher's Exact Test .185 .114
Linear-by-Linear
Association
1.930c 1 .165 .185 .114 .059
N of Valid Cases 133
a. 0 cells (.0%) have expected count less than 5. The minimum expected count is
16.65.
b. Computed only for a 2x2 table
c. The standardized statistic is 1.389.
363

Appendix 7k continued: SDQ Peer Relations * SSP Low Energy Crosstab
SSP Low Energy
Total Typical & PD DD
SDQ Peer
Relations
Typical & PD Count 58 22 80
Expected Count 55.9 24.1 80.0
DD Count 35 18 53
Expected Count 37.1 15.9 53.0
Total Count 93 40 133
Expected Count 93.0 40.0 133.0
Chi-Square Tests
Value df
Asymp. Sig.
(2-sided)
Exact Sig.
(2-sided)
Exact Sig.
(1-sided)
Point
Probability
Pearson Chi-Square .633a 1 .426 .446 .272
Continuity Correctionb .363 1 .547
Likelihood Ratio .629 1 .428 .446 .272
Fisher's Exact Test .446 .272
Linear-by-Linear
Association
.628c 1 .428 .446 .272 .111
N of Valid Cases 133
a. 0 cells (.0%) have expected count less than 5. The minimum expected count is
15.94.
b. Computed only for a 2x2 table
c. The standardized statistic is .793.
364

Appendix 7k continued: SDQ Peer Relations * SSP Visual/Auditory Difficulties
Crosstab
SSP Visual/Auditory
Total Typical & PD DD
SDQ Peer
Relations
Typical & PD Count 66 14 80
Expected Count 62.0 18.0 80.0
DD Count 37 16 53
Expected Count 41.0 12.0 53.0
Total Count 103 30 133
Expected Count 103.0 30.0 133.0
Chi-Square Tests
Value df
Asymp. Sig.
(2-sided)
Exact Sig.
(2-sided)
Exact Sig.
(1-sided)
Point
Probability
Pearson Chi-Square 2.938a 1 .087 .095 .067
Continuity Correctionb 2.257 1 .133
Likelihood Ratio 2.890 1 .089 .137 .067
Fisher's Exact Test .095 .067
Linear-by-Linear
Association
2.916c 1 .088 .095 .067 .040
N of Valid Cases 133
a. 0 cells (.0%) have expected count less than 5. The minimum expected count is
11.95.
b. Computed only for a 2x2 table
c. The standardized statistic is 1.708.
365

Appendix 7k continued: SDQ Peer Relations * SSP Total Difficulties Score
Crosstab
SSP Total Diffs
Total Typical & PD DD
SDQ Peer
Relations
Typical & PD Count 45 34 79
Expected Count 35.6 43.4 79.0
DD Count 14 38 52
Expected Count 23.4 28.6 52.0
Total Count 59 72 131
Expected Count 59.0 72.0 131.0
Chi-Square Tests
Value df
Asymp. Sig.
(2-sided)
Exact Sig.
(2-sided)
Exact Sig.
(1-sided)
Point
Probability
Pearson Chi-Square 11.431a 1 .001 .001 .001
Continuity Correctionb 10.250 1 .001
Likelihood Ratio 11.753 1 .001 .001 .001
Fisher's Exact Test .001 .001
Linear-by-Linear
Association
11.344c 1 .001 .001 .001 .000
N of Valid Cases 131
a. 0 cells (.0%) have expected count less than 5. The minimum expected count is
23.42.
b. Computed only for a 2x2 table
c. The standardized statistic is 3.368.
366

Appendix 7k continued: SDQ Peer Relations * SC Auditory Difficulties
Crosstab
SC Auditory
Total Typical & PD DD
SDQ Peer
Relations
Typical & PD Count 63 22 85
Expected Count 54.3 30.7 85.0
DD Count 29 30 59
Expected Count 37.7 21.3 59.0
Total Count 92 52 144
Expected Count 92.0 52.0 144.0
Chi-Square Tests
Value df
Asymp. Sig.
(2-sided)
Exact Sig.
(2-sided)
Exact Sig.
(1-sided)
Point
Probability
Pearson Chi-Square 9.408a 1 .002 .003 .002
Continuity Correctionb 8.357 1 .004
Likelihood Ratio 9.383 1 .002 .003 .002
Fisher's Exact Test .003 .002
Linear-by-Linear
Association
9.343c 1 .002 .003 .002 .001
N of Valid Cases 144
a. 0 cells (.0%) have expected count less than 5. The minimum expected count is
21.31.
b. Computed only for a 2x2 table
c. The standardized statistic is 3.057.
367

Appendix 7k continued: SDQ Peer Relations * SC Visual Difficulties
Crosstab
SC Visual
Total Typical & PD DD
SDQ Peer
Relations
Typical & PD Count 67 18 85
Expected Count 63.8 21.3 85.0
DD Count 41 18 59
Expected Count 44.3 14.8 59.0
Total Count 108 36 144
Expected Count 108.0 36.0 144.0
Chi-Square Tests
Value df
Asymp. Sig.
(2-sided)
Exact Sig.
(2-sided)
Exact Sig.
(1-sided)
Point
Probability
Pearson Chi-Square 1.618a 1 .203 .242 .141
Continuity Correctionb 1.158 1 .282
Likelihood Ratio 1.601 1 .206 .242 .141
Fisher's Exact Test .242 .141
Linear-by-Linear
Association
1.606c 1 .205 .242 .141 .069
N of Valid Cases 144
a. 0 cells (.0%) have expected count less than 5. The minimum expected count is
14.75.
b. Computed only for a 2x2 table
c. The standardized statistic is 1.267.
368

Appendix 7k continued: SDQ Peer Relations * SC Movement Difficulties Crosstab
SC Movement
Total Typical & PD DD
SDQ Peer
Relations
Typical & PD Count 43 42 85
Expected Count 34.8 50.2 85.0
DD Count 16 43 59
Expected Count 24.2 34.8 59.0
Total Count 59 85 144
Expected Count 59.0 85.0 144.0
Chi-Square Tests
Value df
Asymp. Sig.
(2-sided)
Exact Sig.
(2-sided)
Exact Sig.
(1-sided)
Point
Probability
Pearson Chi-Square 7.932a 1 .005 .006 .004
Continuity Correctionb 6.991 1 .008
Likelihood Ratio 8.119 1 .004 .006 .004
Fisher's Exact Test .006 .004
Linear-by-Linear
Association
7.877c 1 .005 .006 .004 .003
N of Valid Cases 144
a. 0 cells (.0%) have expected count less than 5. The minimum expected count is
24.17.
b. Computed only for a 2x2 table
c. The standardized statistic is 2.807.
369

Appendix 7k continued: SDQ Peer Relations * SC Tactile Difficulties
Crosstab
SC Tactile
Total Typical & PD DD
SDQ Peer
Relations
Typical & PD Count 51 34 85
Expected Count 40.7 44.3 85.0
DD Count 18 41 59
Expected Count 28.3 30.7 59.0
Total Count 69 75 144
Expected Count 69.0 75.0 144.0
Chi-Square Tests
Value df
Asymp. Sig.
(2-sided)
Exact Sig.
(2-sided)
Exact Sig.
(1-sided)
Point
Probability
Pearson Chi-Square 12.137a 1 .000 .001 .000
Continuity Correctionb 10.984 1 .001
Likelihood Ratio 12.381 1 .000 .001 .000
Fisher's Exact Test .001 .000
Linear-by-Linear
Association
12.053c 1 .001 .001 .000 .000
N of Valid Cases 144
a. 0 cells (.0%) have expected count less than 5. The minimum expected count is
28.27.
b. Computed only for a 2x2 table
c. The standardized statistic is 3.472.
370

Appendix 7k continued: SDQ Peer Relations * SC Classroom Behaviour Difficulties
Crosstab
SC Behaviour
Total Typical & PD DD
SDQ Peer
Relations
Typical & PD Count 46 39 85
Expected Count 37.8 47.2 85.0
DD Count 18 41 59
Expected Count 26.2 32.8 59.0
Total Count 64 80 144
Expected Count 64.0 80.0 144.0
Chi-Square Tests
Value df
Asymp. Sig.
(2-sided)
Exact Sig.
(2-sided)
Exact Sig.
(1-sided)
Point
Probability
Pearson Chi-Square 7.862a 1 .005 .006 .004
Continuity Correctionb 6.935 1 .008
Likelihood Ratio 8.004 1 .005 .006 .004
Fisher's Exact Test .006 .004
Linear-by-Linear
Association
7.807c 1 .005 .006 .004 .003
N of Valid Cases 144
a. 0 cells (.0%) have expected count less than 5. The minimum expected count is
26.22.
b. Computed only for a 2x2 table
c. The standardized statistic is 2.794.
371
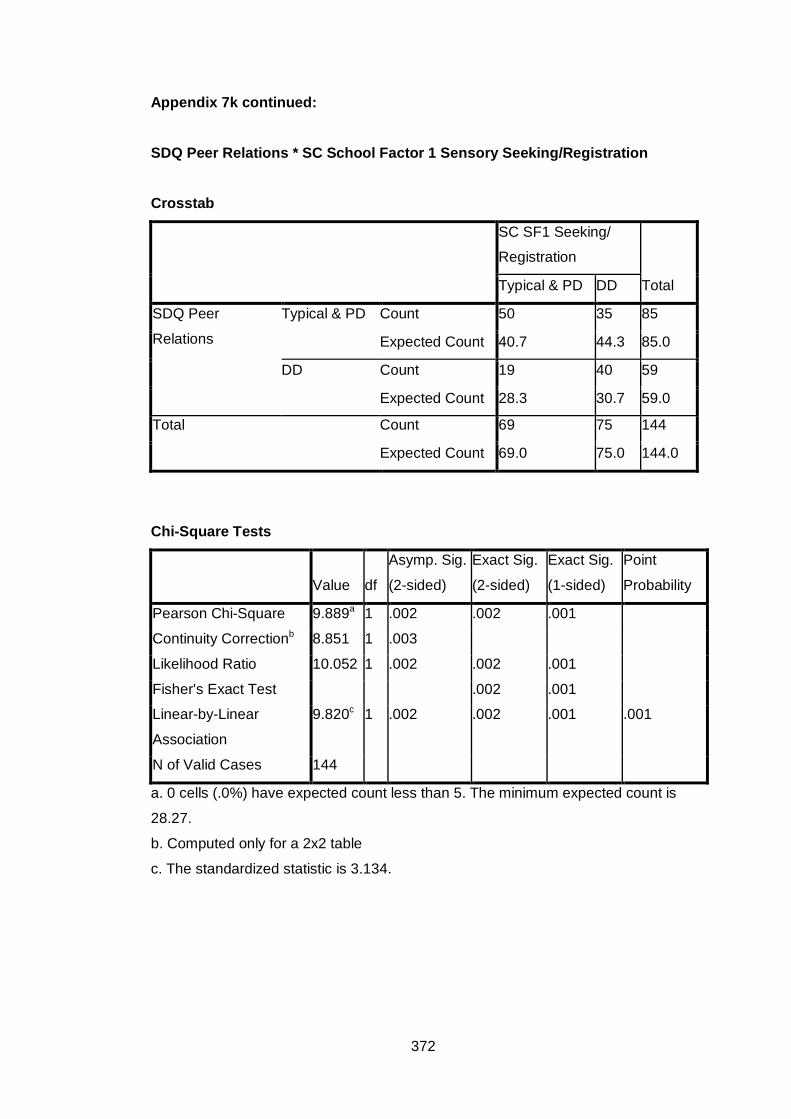
Appendix 7k continued: SDQ Peer Relations * SC School Factor 1 Sensory Seeking/Registration Crosstab
SC SF1 Seeking/
Registration
Total Typical & PD DD
SDQ Peer
Relations
Typical & PD Count 50 35 85
Expected Count 40.7 44.3 85.0
DD Count 19 40 59
Expected Count 28.3 30.7 59.0
Total Count 69 75 144
Expected Count 69.0 75.0 144.0
Chi-Square Tests
Value df
Asymp. Sig.
(2-sided)
Exact Sig.
(2-sided)
Exact Sig.
(1-sided)
Point
Probability
Pearson Chi-Square 9.889a 1 .002 .002 .001
Continuity Correctionb 8.851 1 .003
Likelihood Ratio 10.052 1 .002 .002 .001
Fisher's Exact Test .002 .001
Linear-by-Linear
Association
9.820c 1 .002 .002 .001 .001
N of Valid Cases 144
a. 0 cells (.0%) have expected count less than 5. The minimum expected count is
28.27.
b. Computed only for a 2x2 table
c. The standardized statistic is 3.134.
372

Appendix 7k continued: SDQ Peer Relations * SC School Factor 2 Attention & Awareness
Crosstab
SC SF2 Awareness
Total Typical & PD DD
SDQ Peer
Relations
Typical & PD Count 70 15 85
Expected Count 71.4 13.6 85.0
DD Count 51 8 59
Expected Count 49.6 9.4 59.0
Total Count 121 23 144
Expected Count 121.0 23.0 144.0
Chi-Square Tests
Value df
Asymp. Sig.
(2-sided)
Exact Sig.
(2-sided)
Exact Sig.
(1-sided)
Point
Probability
Pearson Chi-Square .434a 1 .510 .645 .338
Continuity Correctionb .183 1 .669
Likelihood Ratio .440 1 .507 .645 .338
Fisher's Exact Test .645 .338
Linear-by-Linear
Association
.431c 1 .512 .645 .338 .150
N of Valid Cases 144
a. 0 cells (.0%) have expected count less than 5. The minimum expected count is
9.42.
b. Computed only for a 2x2 table
c. The standardized statistic is -.656.
373

Appendix 7k continued: SDQ Peer Relations * SC School Factor 3 Tolerance for Input
Crosstab
SC SF3 Tolerance
Total Typical & PD DD
SDQ Peer
Relations
Typical & PD Count 46 39 85
Expected Count 40.1 44.9 85.0
DD Count 22 37 59
Expected Count 27.9 31.1 59.0
Total Count 68 76 144
Expected Count 68.0 76.0 144.0
Chi-Square Tests
Value df
Asymp. Sig.
(2-sided)
Exact Sig.
(2-sided)
Exact Sig.
(1-sided)
Point
Probability
Pearson Chi-Square 3.958a 1 .047 .062 .034
Continuity Correctionb 3.311 1 .069
Likelihood Ratio 3.988 1 .046 .062 .034
Fisher's Exact Test .062 .034
Linear-by-Linear
Association
3.930c 1 .047 .062 .034 .019
N of Valid Cases 144
a. 0 cells (.0%) have expected count less than 5. The minimum expected count is
27.86.
b. Computed only for a 2x2 table
c. The standardized statistic is 1.983.
374

Appendix 7k continued: SDQ Peer Relations * SC School Factor 4 Availability for Learning
Crosstab
SC SF4 Availability
Total Typical & PD DD
SDQ Peer
Relations
Typical & PD Count 65 20 85
Expected Count 57.8 27.2 85.0
DD Count 33 26 59
Expected Count 40.2 18.8 59.0
Total Count 98 46 144
Expected Count 98.0 46.0 144.0
Chi-Square Tests
Value df
Asymp. Sig.
(2-sided)
Exact Sig.
(2-sided)
Exact Sig.
(1-sided)
Point
Probability
Pearson Chi-Square 6.757a 1 .009 .011 .008
Continuity Correctionb 5.846 1 .016
Likelihood Ratio 6.708 1 .010 .011 .008
Fisher's Exact Test .011 .008
Linear-by-Linear
Association
6.711c 1 .010 .011 .008 .005
N of Valid Cases 144
a. 0 cells (.0%) have expected count less than 5. The minimum expected count is
18.85.
b. Computed only for a 2x2 table
c. The standardized statistic is 2.590.
375
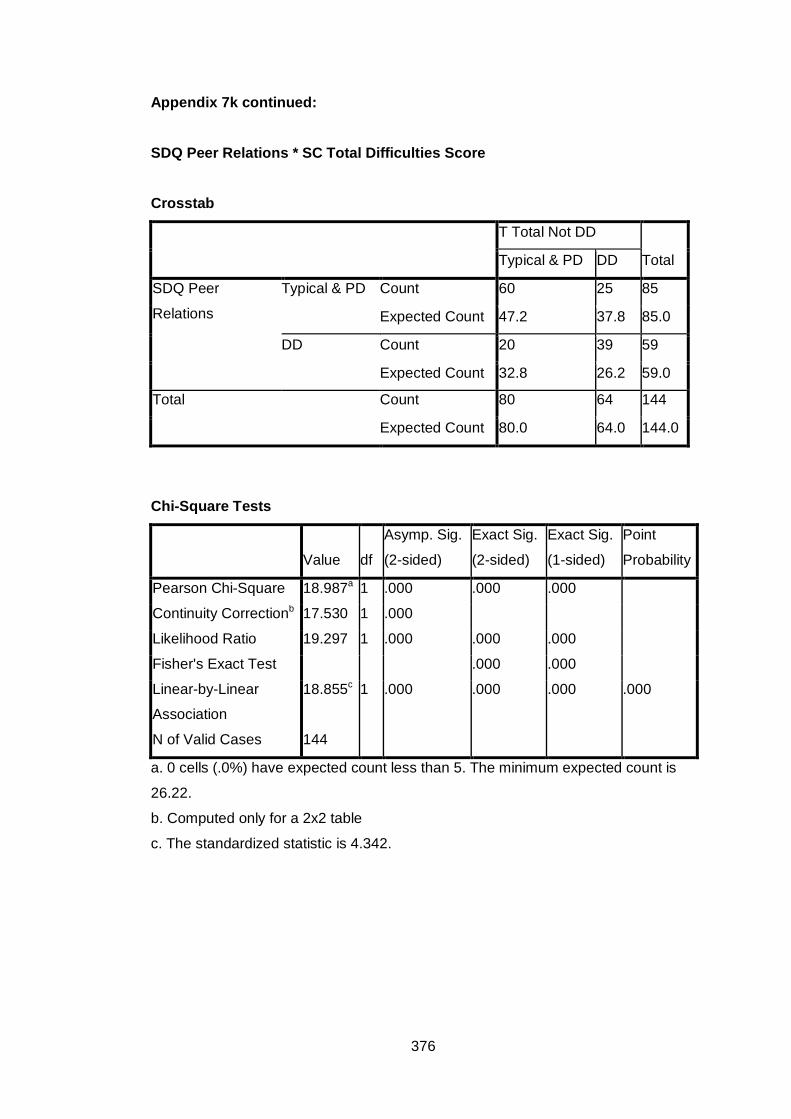
Appendix 7k continued: SDQ Peer Relations * SC Total Difficulties Score
Crosstab
T Total Not DD
Total Typical & PD DD
SDQ Peer
Relations
Typical & PD Count 60 25 85
Expected Count 47.2 37.8 85.0
DD Count 20 39 59
Expected Count 32.8 26.2 59.0
Total Count 80 64 144
Expected Count 80.0 64.0 144.0
Chi-Square Tests
Value df
Asymp. Sig.
(2-sided)
Exact Sig.
(2-sided)
Exact Sig.
(1-sided)
Point
Probability
Pearson Chi-Square 18.987a 1 .000 .000 .000
Continuity Correctionb 17.530 1 .000
Likelihood Ratio 19.297 1 .000 .000 .000
Fisher's Exact Test .000 .000
Linear-by-Linear
Association
18.855c 1 .000 .000 .000 .000
N of Valid Cases 144
a. 0 cells (.0%) have expected count less than 5. The minimum expected count is
26.22.
b. Computed only for a 2x2 table
c. The standardized statistic is 4.342.
376

Appendix 7L Frequency Tables for Associations between SDQ Total Difficulties Scores and
SSP and SC Subscales. Key: SSP= Short Sensory Profile
SC Sensory Profile School Companion PD= Probable Difference (i.e. Probable difficulties) DD= Definite Difference (i.e. Difficulties)
SDQ Total Difficulties Scores * SSP Tactile Difficulties
Crosstab
SSP Tactile
Total Typical & PD DD
SDQ Total
Difficulties
Typical & PD Count 33 11 44
Expected Count 30.9 13.1 44.0
DD Count 61 29 90
Expected Count 63.1 26.9 90.0
Total Count 94 40 134
Expected Count 94.0 40.0 134.0
Chi-Square Tests
Value df
Asymp. Sig.
(2-sided)
Exact Sig.
(2-sided)
Exact Sig.
(1-sided)
Point
Probability
Pearson Chi-Square .736a 1 .391 .428 .258
Continuity Correctionb .432 1 .511
Likelihood Ratio .750 1 .387 .428 .258
Fisher's Exact Test .428 .258
Linear-by-Linear
Association
.731c 1 .393 .428 .258 .113
N of Valid Cases 134
a. 0 cells (.0%) have expected count less than 5. The minimum expected count is
13.13.
b. Computed only for a 2x2 table
c. The standardized statistic is .855.
377

Appendix 7L continued:
SDQ Total Difficulties Scores * SSP Taste Difficulties
Crosstab
SSP Taste
Total Typical & PD DD
SDQ Total
Difficulties
Typical & PD Count 32 12 44
Expected Count 30.9 13.1 44.0
DD Count 62 28 90
Expected Count 63.1 26.9 90.0
Total Count 94 40 134
Expected Count 94.0 40.0 134.0
Chi-Square Tests
Value df
Asymp. Sig.
(2-sided)
Exact Sig.
(2-sided)
Exact Sig.
(1-sided)
Point
Probability
Pearson Chi-Square .208a 1 .648 .692 .403
Continuity Correctionb .065 1 .799
Likelihood Ratio .210 1 .647 .692 .403
Fisher's Exact Test .692 .403
Linear-by-Linear
Association
.206c 1 .650 .692 .403 .145
N of Valid Cases 134
a. 0 cells (.0%) have expected count less than 5. The minimum expected count is
13.13.
b. Computed only for a 2x2 table
c. The standardized statistic is .454.
378

Appendix 7L continued:
SDQ Total Difficulties Scores * SSP Movement Difficulties
Crosstab
SSP Movement
Total Typical & PD DD
SDQ Total
Difficulties
Typical & PD Count 38 6 44
Expected Count 33.2 10.8 44.0
DD Count 64 27 91
Expected Count 68.8 22.2 91.0
Total Count 102 33 135
Expected Count 102.0 33.0 135.0
Chi-Square Tests
Value df
Asymp. Sig.
(2-sided)
Exact Sig.
(2-sided)
Exact Sig.
(1-sided)
Point
Probability
Pearson Chi-Square 4.129a 1 .042 .054 .031
Continuity Correctionb 3.306 1 .069
Likelihood Ratio 4.445 1 .035 .054 .031
Fisher's Exact Test .054 .031
Linear-by-Linear
Association
4.098c 1 .043 .054 .031 .021
N of Valid Cases 135
a. 0 cells (.0%) have expected count less than 5. The minimum expected count is
10.76.
b. Computed only for a 2x2 table
c. The standardized statistic is 2.024.
379

Appendix 7L continued:
SDQ Total Difficulties Scores * SSP Seeks Sensation Difficulties
Crosstab
SSP Seeks
Sensation
Total Typical & PD DD
SDQ Total
Difficulties
Typical & PD Count 17 27 44
Expected Count 13.4 30.6 44.0
DD Count 24 67 91
Expected Count 27.6 63.4 91.0
Total Count 41 94 135
Expected Count 41.0 94.0 135.0
Chi-Square Tests
Value df
Asymp. Sig.
(2-sided)
Exact Sig.
(2-sided)
Exact Sig.
(1-sided)
Point
Probability
Pearson Chi-Square 2.109a 1 .146 .165 .106
Continuity Correctionb 1.569 1 .210
Likelihood Ratio 2.067 1 .151 .165 .106
Fisher's Exact Test .165 .106
Linear-by-Linear
Association
2.093c 1 .148 .165 .106 .055
N of Valid Cases 135
a. 0 cells (.0%) have expected count less than 5. The minimum expected count is
13.36.
b. Computed only for a 2x2 table
c. The standardized statistic is 1.447.
380

Appendix 7L continued:
SDQ Total Difficulties Scores * SSP Auditory Difficulties
Crosstab
SSP Auditory
Total Typical & PD DD
SDQ Total
Difficulties
Typical & PD Count 14 30 44
Expected Count 13.6 30.4 44.0
DD Count 27 62 89
Expected Count 27.4 61.6 89.0
Total Count 41 92 133
Expected Count 41.0 92.0 133.0
Chi-Square Tests
Value df
Asymp. Sig.
(2-sided)
Exact Sig.
(2-sided)
Exact Sig.
(1-sided)
Point
Probability
Pearson Chi-Square .030a 1 .862 1.000 .507
Continuity Correctionb .000 1 1.000
Likelihood Ratio .030 1 .862 1.000 .507
Fisher's Exact Test 1.000 .507
Linear-by-Linear
Association
.030c 1 .862 1.000 .507 .155
N of Valid Cases 133
a. 0 cells (.0%) have expected count less than 5. The minimum expected count is
13.56.
b. Computed only for a 2x2 table
c. The standardized statistic is .173.
381

Appendix 7L continued:
SDQ Total Difficulties Scores * SSP Low Energy Crosstab
SSP Low Energy
Total Typical & PD DD
SDQ Total
Difficulties
Typical & PD Count 35 9 44
Expected Count 30.8 13.2 44.0
DD Count 58 31 89
Expected Count 62.2 26.8 89.0
Total Count 93 40 133
Expected Count 93.0 40.0 133.0
Chi-Square Tests
Value df
Asymp. Sig.
(2-sided)
Exact Sig.
(2-sided)
Exact Sig.
(1-sided)
Point
Probability
Pearson Chi-Square 2.894a 1 .089 .109 .065
Continuity Correctionb 2.251 1 .134
Likelihood Ratio 3.016 1 .082 .109 .065
Fisher's Exact Test .109 .065
Linear-by-Linear
Association
2.872c 1 .090 .109 .065 .038
N of Valid Cases 133
a. 0 cells (.0%) have expected count less than 5. The minimum expected count is
13.23.
b. Computed only for a 2x2 table
c. The standardized statistic is 1.695.
382

Appendix 7L continued:
SDQ Total Difficulties Scores * SSP Visual/Auditory Difficulties
Crosstab
SSP Visual/Auditory
Total Typical & PD DD
SDQ Total
Difficulties
Typical & PD Count 37 7 44
Expected Count 34.1 9.9 44.0
DD Count 66 23 89
Expected Count 68.9 20.1 89.0
Total Count 103 30 133
Expected Count 103.0 30.0 133.0
Chi-Square Tests
Value df
Asymp. Sig.
(2-sided)
Exact Sig.
(2-sided)
Exact Sig.
(1-sided)
Point
Probability
Pearson Chi-Square 1.663a 1 .197 .271 .142
Continuity Correctionb 1.143 1 .285
Likelihood Ratio 1.739 1 .187 .271 .142
Fisher's Exact Test .271 .142
Linear-by-Linear
Association
1.651c 1 .199 .271 .142 .079
N of Valid Cases 133
a. 0 cells (.0%) have expected count less than 5. The minimum expected count is
9.92.
b. Computed only for a 2x2 table
c. The standardized statistic is 1.285.
383

Appendix 7L continued:
SDQ Total Difficulties Scores * SSP Total Difficulties Score Crosstab
SSP Total Diffs
Total Typical & PD DD
SDQ Total
Difficulties
Typical & PD Count 21 23 44
Expected Count 19.8 24.2 44.0
DD Count 38 49 87
Expected Count 39.2 47.8 87.0
Total Count 59 72 131
Expected Count 59.0 72.0 131.0
Chi-Square Tests
Value df
Asymp. Sig.
(2-sided)
Exact Sig.
(2-sided)
Exact Sig.
(1-sided)
Point
Probability
Pearson Chi-Square .194a 1 .660 .712 .399
Continuity Correctionb .065 1 .799
Likelihood Ratio .193 1 .660 .712 .399
Fisher's Exact Test .712 .399
Linear-by-Linear
Association
.192c 1 .661 .712 .399 .134
N of Valid Cases 131
a. 0 cells (.0%) have expected count less than 5. The minimum expected count is
19.82.
b. Computed only for a 2x2 table
c. The standardized statistic is .438.
384

Appendix 7L continued:
SDQ Total Difficulties Scores * SC Auditory Difficulties
Crosstab
SC Auditory
Total Typical & PD DD
SDQ Total
Difficulties
Typical & PD Count 35 12 47
Expected Count 30.0 17.0 47.0
DD Count 57 40 97
Expected Count 62.0 35.0 97.0
Total Count 92 52 144
Expected Count 92.0 52.0 144.0
Chi-Square Tests
Value df
Asymp. Sig.
(2-sided)
Exact Sig.
(2-sided)
Exact Sig.
(1-sided)
Point
Probability
Pearson Chi-Square 3.385a 1 .066 .095 .048
Continuity Correctionb 2.738 1 .098
Likelihood Ratio 3.490 1 .062 .069 .048
Fisher's Exact Test .095 .048
Linear-by-Linear
Association
3.361c 1 .067 .095 .048 .027
N of Valid Cases 144
a. 0 cells (.0%) have expected count less than 5. The minimum expected count is
16.97.
b. Computed only for a 2x2 table
c. The standardized statistic is 1.833.
385

Appendix 7L continued:
SDQ Total Difficulties Scores * SC Visual Difficulties
Crosstab
SC Visual
Total Typical & PD DD
SDQ Total
Difficulties
Typical & PD Count 41 6 47
Expected Count 35.3 11.8 47.0
DD Count 67 30 97
Expected Count 72.8 24.3 97.0
Total Count 108 36 144
Expected Count 108.0 36.0 144.0
Chi-Square Tests
Value df
Asymp. Sig.
(2-sided)
Exact Sig.
(2-sided)
Exact Sig.
(1-sided)
Point
Probability
Pearson Chi-Square 5.570a 1 .018 .023 .013
Continuity Correctionb 4.643 1 .031
Likelihood Ratio 6.059 1 .014 .023 .013
Fisher's Exact Test .023 .013
Linear-by-Linear
Association
5.531c 1 .019 .023 .013 .009
N of Valid Cases 144
a. 0 cells (.0%) have expected count less than 5. The minimum expected count is
11.75.
b. Computed only for a 2x2 table
c. The standardized statistic is 2.352.
386

Appendix 7L continued:
SDQ Total Difficulties Scores * SC Movement Difficulties Crosstab
SC Movement
Total Typical & PD DD
SDQ Total
Difficulties
Typical & PD Count 28 19 47
Expected Count 19.3 27.7 47.0
DD Count 31 66 97
Expected Count 39.7 57.3 97.0
Total Count 59 85 144
Expected Count 59.0 85.0 144.0
Chi-Square Tests
Value df
Asymp. Sig.
(2-sided)
Exact Sig.
(2-sided)
Exact Sig.
(1-sided)
Point
Probability
Pearson Chi-Square 9.983a 1 .002 .002 .001
Continuity Correctionb 8.874 1 .003
Likelihood Ratio 9.932 1 .002 .002 .001
Fisher's Exact Test .002 .001
Linear-by-Linear
Association
9.914c 1 .002 .002 .001 .001
N of Valid Cases 144
a. 0 cells (.0%) have expected count less than 5. The minimum expected count is
19.26.
b. Computed only for a 2x2 table
c. The standardized statistic is 3.149.
387

Appendix 7L continued:
SDQ Total Difficulties Scores * SC Tactile Difficulties
Crosstab
SC Tactile
Total Typical & PD DD
SDQ Total
Difficulties
Typical & PD Count 32 15 47
Expected Count 22.5 24.5 47.0
DD Count 37 60 97
Expected Count 46.5 50.5 97.0
Total Count 69 75 144
Expected Count 69.0 75.0 144.0
Chi-Square Tests
Value df
Asymp. Sig.
(2-sided)
Exact Sig.
(2-sided)
Exact Sig.
(1-sided)
Point
Probability
Pearson Chi-Square 11.372a 1 .001 .001 .001
Continuity Correctionb 10.204 1 .001
Likelihood Ratio 11.546 1 .001 .001 .001
Fisher's Exact Test .001 .001
Linear-by-Linear
Association
11.293c 1 .001 .001 .001 .000
N of Valid Cases 144
a. 0 cells (.0%) have expected count less than 5. The minimum expected count is
22.52.
b. Computed only for a 2x2 table
c. The standardized statistic is 3.361.
388

Appendix 7L continued:
SDQ Total Difficulties Scores * SC Classroom Behaviour Difficulties
Crosstab
T Behave Not DD
Total Typical & PD DD
SDQ Total
Difficulties
Typical & PD Count 28 19 47
Expected Count 20.9 26.1 47.0
DD Count 36 61 97
Expected Count 43.1 53.9 97.0
Total Count 64 80 144
Expected Count 64.0 80.0 144.0
Chi-Square Tests
Value df
Asymp. Sig.
(2-sided)
Exact Sig.
(2-sided)
Exact Sig.
(1-sided)
Point
Probability
Pearson Chi-Square 6.469a 1 .011 .013 .009
Continuity Correctionb 5.591 1 .018
Likelihood Ratio 6.469 1 .011 .013 .009
Fisher's Exact Test .013 .009
Linear-by-Linear
Association
6.424c 1 .011 .013 .009 .006
N of Valid Cases 144
a. 0 cells (.0%) have expected count less than 5. The minimum expected count is
20.89.
b. Computed only for a 2x2 table
c. The standardized statistic is 2.535.
389

Appendix 7L continued:
SDQ Total Difficulties Scores * SC School Factor 1 Sensory Seeking/Registration Crosstab
SC SF1 Seeking/
Registration
Total Typical & PD DD
SDQ Total
Difficulties
Typical & PD Count 33 14 47
Expected Count 22.5 24.5 47.0
DD Count 36 61 97
Expected Count 46.5 50.5 97.0
Total Count 69 75 144
Expected Count 69.0 75.0 144.0
Chi-Square Tests
Value df
Asymp. Sig.
(2-sided)
Exact Sig.
(2-sided)
Exact Sig.
(1-sided)
Point
Probability
Pearson Chi-Square 13.898a 1 .000 .000 .000
Continuity Correctionb 12.604 1 .000
Likelihood Ratio 14.172 1 .000 .000 .000
Fisher's Exact Test .000 .000
Linear-by-Linear
Association
13.802c 1 .000 .000 .000 .000
N of Valid Cases 144
a. 0 cells (.0%) have expected count less than 5. The minimum expected count is
22.52.
b. Computed only for a 2x2 table
c. The standardized statistic is 3.715.
390

Appendix 7L continued:
SDQ Total Difficulties Scores * SC School Factor 2 Attention & Awareness
Crosstab
SC SF2 Awareness
Total Typical & PD DD
SDQ Total
Difficulties
Typical & PD Count 40 7 47
Expected Count 39.5 7.5 47.0
DD Count 81 16 97
Expected Count 81.5 15.5 97.0
Total Count 121 23 144
Expected Count 121.0 23.0 144.0
Chi-Square Tests
Value df
Asymp. Sig.
(2-sided)
Exact Sig.
(2-sided)
Exact Sig.
(1-sided)
Point
Probability
Pearson Chi-Square .060a 1 .806 .817 .506
Continuity Correctionb .000 1 .997
Likelihood Ratio .061 1 .805 .817 .506
Fisher's Exact Test 1.000 .506
Linear-by-Linear
Association
.060c 1 .806 .817 .506 .188
N of Valid Cases 144
a. 0 cells (.0%) have expected count less than 5. The minimum expected count is
7.51.
b. Computed only for a 2x2 table
c. The standardized statistic is .245.
391

Appendix 7L continued:
SDQ Total Difficulties Scores * SC School Factor 3 Tolerance for Input
Crosstab
SC SF3 Tolerance
Total Typical & PD DD
SDQ Total
Difficulties
Typical & PD Count 29 18 47
Expected Count 22.2 24.8 47.0
DD Count 39 58 97
Expected Count 45.8 51.2 97.0
Total Count 68 76 144
Expected Count 68.0 76.0 144.0
Chi-Square Tests
Value df
Asymp. Sig.
(2-sided)
Exact Sig.
(2-sided)
Exact Sig.
(1-sided)
Point
Probability
Pearson Chi-Square 5.870a 1 .015 .020 .012
Continuity Correctionb 5.039 1 .025
Likelihood Ratio 5.900 1 .015 .020 .012
Fisher's Exact Test .020 .012
Linear-by-Linear
Association
5.829c 1 .016 .020 .012 .008
N of Valid Cases 144
a. 0 cells (.0%) have expected count less than 5. The minimum expected count is
22.19.
b. Computed only for a 2x2 table
c. The standardized statistic is 2.414.
392

Appendix 7L continued:
SDQ Total Difficulties Scores * SC School Factor 4 Availability for Learning
Crosstab
SC SF4 Availability
Total Typical & PD DD
SDQ Total
Difficulties
Typical & PD Count 34 13 47
Expected Count 32.0 15.0 47.0
DD Count 64 33 97
Expected Count 66.0 31.0 97.0
Total Count 98 46 144
Expected Count 98.0 46.0 144.0
Chi-Square Tests
Value df
Asymp. Sig.
(2-sided)
Exact Sig.
(2-sided)
Exact Sig.
(1-sided)
Point
Probability
Pearson Chi-Square .589a 1 .443 .455 .284
Continuity Correctionb .333 1 .564
Likelihood Ratio .598 1 .440 .455 .284
Fisher's Exact Test .568 .284
Linear-by-Linear
Association
.585c 1 .444 .455 .284 .115
N of Valid Cases 144
a. 0 cells (.0%) have expected count less than 5. The minimum expected count is
15.01.
b. Computed only for a 2x2 table
c. The standardized statistic is .765.
393

Appendix 7L continued:
SDQ Total Difficulties Scores * SC Total Difficulties Score
Crosstab
SC Total Difficulties
Total Typical & PD DD
SDQ Total
Difficulties
Typical & PD Count 35 12 47
Expected Count 26.1 20.9 47.0
DD Count 45 52 97
Expected Count 53.9 43.1 97.0
Total Count 80 64 144
Expected Count 80.0 64.0 144.0
Chi-Square Tests
Value df
Asymp. Sig.
(2-sided)
Exact Sig.
(2-sided)
Exact Sig.
(1-sided)
Point
Probability
Pearson Chi-Square 10.107a 1 .001 .002 .001
Continuity Correctionb 9.002 1 .003
Likelihood Ratio 10.478 1 .001 .002 .001
Fisher's Exact Test .002 .001
Linear-by-Linear
Association
10.037c 1 .002 .002 .001 .001
N of Valid Cases 144
a. 0 cells (.0%) have expected count less than 5. The minimum expected count is
20.89.
b. Computed only for a 2x2 table
c. The standardized statistic is 3.168.
394