investigation into the effectiveness and durability of
TRANSCRIPT

Stuart Douglas 200235604
- 1 -
Investigation into the Effectiveness and
Durability of Waterproof Coatings and
Heat Treatments of Dynamic Climbing
Ropes.
Technical Paper
Stuart Douglas
Project Number: 2005774
Supervisor: Dr A. J. McLaren
Word Count: 3785

Stuart Douglas 200235604
- 2 -
Abstract
Previous research has shown the detrimental effect that water has on the properties of
climbing ropes. Rope manufacturers are now adding dry treatments which they claim
are effective and durable methods of reducing the amount of water ropes absorb. Very
little research exists into these claims, therefore this study aims to produce of this
study to produce results validate these claims.
Three ropes were tested; a rope that was heat treated, a rope that was dry-treated and a
rope that had no treatment were all compared. Three types were conditioned in water
to examine the effectiveness of different the waterproof treatments and also to
examine how the ropes water absorption characteristics are affected by repeated
wetting and drying. The heat treated and dry treated samples underwent wear
conditioning to investigate how durable the treatments were. The samples were also
tested on an Tinius Olsen 81000 slow tensile machine, which allowed for the
observation of any change in the tensile strength and strain due to wear of the
samples.
The results suggested that the treatments significantly reduced the amount of water
absorbed by the sample ropes. The effectiveness of the treatment was not affected by
repeated soaking and drying cycles. However the effect of wear conditioning deuced
the effectiveness of the dry treated and heat treated samples.

Stuart Douglas 200235604
- 3 -
Nomenclature
s=Standard deviation
x =Sample data
x =Sample mean
n=Sample size

Stuart Douglas 200235604
- 4 -
1.0 Introduction
Modern climbing ropes are designed not only to arrest a falling climber but also to
reduce the impact force. The rope absorbs the energy generated in a fall by stretching.
Today’s climbing ropes are manufactured from either nylon 6 or nylon 66. The
material properties of these types of nylon are very suitable for the production of
ropes. They have high tenacity, good abrasion resistance, low density, rotting
resistance, and are quick drying [1]. The elastic properties of ropes arise from both the
elastic properties of nylon and the methods used in constructing the rope.
Recent research has shown that a rope holds less falls when wet [2], this reduction in
rope strengths is due plasticisation. This has a number of effects on nylon fibres
including a decrease in the mechanical moduli, a decrease in yield strength, a change
of deformation characteristics, ageing and scission [3]. Wet ropes are heavy which
makes it harder to use, it can also be dangerous in low temperatures where it will
freeze.
Rope manufacturers are now producing ropes which have treatments added to their
sheaths or individual fibers which they claim inhibit water absorption by the rope.
There is no industry standard whereby the effectiveness and durability of the
treatments can be tested. Ropes with these treatments are generally more expensive
with some manufacturers charging up to 25 % more than for treated ropes.

Stuart Douglas 200235604
- 5 -
2.0 Procedure
2.1 Rope Selection
The ropes used for the investigation were all Mammut Genesis 8.5mm, the technical
properties of the rope are located in table 1 located in the Appendix. Three different
ropes types were investigated, one with dry treatment one with heat treatment and one
with no treatment.
2.1 Water Conditioning Procedure
Rope Sample Preparation
The rope samples were cut using a gas powered hot knife which cut through the rope
by melting the nylon fibres. This sealed the ends of the samples and prevented them
from fraying and deteriorating. Seven 1 m samples were cut from each of the three
different ropes. Three of the samples were kept intact while the core and sheaths were
separated from the other three samples.
Labelling
The labelling system used to identify rope samples can be found in table 2 located in
the Appendix. The labels were attached using tie grips which allowed the labels to be
removed and reattached easily when ropes were being put through the soaking and
drying cycles. The labels had to be removed prior to the rope samples being soaked to
prevent interference with the results produced by the mass spectrometer.
Water Conditioning Duration
A soaking duration of eight hours was selected, this simulated a full days climbing in
wet conditions. Each sample was placed in separate containers to soak. A drying

Stuart Douglas 200235604
- 6 -
length of 40 hours was used to give the rope adequate drying time. The total time
taken for one full soaking and drying cycle was 48 hours. This time scale allowed
three cycles to be completed per week. The rope samples were dried on a wire rack in
the laboratory. This was not the ideal due to varying environmental factors in the
laboratory but was the most suitable method available.
Number Cycles
It was found that during the investigation by Andrew [4], that the mass decrease of the
non dry treated rope occurred over the first six cycles and then levelled off between
cycles 8 to 16. For this reason only seven cycles were investigated. This number was
also deemed adequate to test if soaking or drying cycles affected the ability of the
treatments to absorb water.
Decontamination
The apparatus used during the water conditioning stage of the investigation was
decontaminated before to every cycle. A 1% concentration DECON solution was
poured into each of the containers and left to soak for 24 hours. The containers were
then rinsed six times with running water and three times with distilled water. A
similar decontamination process was used for the container lids and pipettes.
Soaking Cycle
The glass containers were then filled with 1.8 ltrs of double distilled water and the 2.5
m sample groups placed into the containers for a soaking cycle of eight hours. Double
distilled water was used to ensure that the most accurate results would be obtained
from the Mass Spectrometry. After the rope samples had been removed from the

Stuart Douglas 200235604
- 7 -
containers they were emptied and the decontamination process was repeated. This
ensured that the containers were decontaminated and ready for the next soaking cycle.
Sample Collection
Three 5 ml samples were collected from each container and placed into screw-top
bottles. One sample was used for mass spectrometry, one sample was left to
evaporate and one sample was kept spare in case further analysis was required.
Rope Testing
The initial weight of all the ropes was recorded prior to beginning of each cycle; the
wet weight was recorded after the ropes had been allowed to sit for three minutes
which allowed for excess surface water to drip off. After 40 hours of drying time the
ropes were weighed again to assess if there was any change in the dry mass. The
weights were measured using a Pricisa 1212M Superbal balance; this allowed the
sample masses to be measured in kilograms with an accuracy of 5 decimal places.
Mass Spectrometry
To examine the sample solutions removed from the containers a mass spectrometer
machine was used. The machine used was an LCQ Duo Electrospray Ion
Trap Mass Spectrometer. 0.5 ml was removed from each sample and mixed with 0.5
ml of methanol. The methanol was added to aid the vaporisation of the solution. The
entire procedure was fully automated after the samples had been loaded into the
machine.

Stuart Douglas 200235604
- 8 -
2.3 Wear Conditioning Procedure
Wear Machine Design and Manufacture
To investigate the durability of the treatments applied to climbing ropes a wear
machine was constructed. The machine was designed to replicate the conditions
experienced by climbing ropes during belaying. Belaying is the process through
which the control of climbing rope is achieved through the application of friction. A
diagram of the machine is shown below in Figure 1. It was powered by a 12 V
windscreen wiper motor attached to a pulley wheel. The rope was passed through a
figure of eight belay device. To ensure that the tension in the system remained
constant, a mechanism was designed using a spring balance and turnbuckle. A
constant tension of 80 N was maintained on every sample.
It was decided that three different cycle lengths of 250, 500 and 750 revolutions
would be tested through the figure of eight.
Mounting Plates
Pulley Wheel Figure of
Eight
Spring Balance
Figure 1: Diagram showing the configuration of the wear machine
Turn Buckle

Stuart Douglas 200235604
- 9 -
Cycle Speed
The speed at which the rope passed through the figure of eight device played a very
important factor on the wear of the rope. Research has proven that when a rope is
subjected to very high temperatures then the quality of the rope degrades [5]. If the
rope were to pass through the figure of eight too quickly then the temperature
produced could damage the rope and therefore affect the results. It was decided that
the actions of a belayer feeding the rope through the figure of eight, a rope speed of
roughly 1m/s would be adequate. The motor speed was measured to be 66 rpm. The
diameter of the pulley wheel was designed to produce the required speed of the rope.
The machine was switched off every 50 cycles for 2 minutes to allow any heat
generated to dissipate and also to prevent the motor from over heating.
Sample Preparation
The sample length was selected to be 2.5 m, as previous investigations found this was
the optimum length for the tensile testing machine. Before being placed into the wear
machine, the sample ends were sewn together to form a loop. Twenty samples were
produced from the heat treated rope and twenty samples were produced from the dry
treated rope.
Labelling
The samples were labelled using a similar method as used in water conditioning
procedure whereby the labels could be removed and reattached to the samples after
their conditioning had been completed. The labels applied to each of the samples and
the number of cycles each sample set endured can be found in Table 3 in the
Appendix.

Stuart Douglas 200235604
- 10 -
Tensile Strength and Elongation Testing Procedure
The British Standard test for climbing ropes is to measure the number of falls held on
a DODERO machine, however due to the unavailability of such a machine, the tests
were carried out on a Tinius Olsen tensile testing machine. The samples were secured
to the tensile machine using two large shackles which had previously been used to test
high strength fabric belts used for securing loads onto lorries but also served this
purpose well. These shackles were solid steel drums of 300 mm diameter welded
between two parallel plates. The shackles were loaded into the top and bottom cross
hairs of the machine. The samples were each wound around the top and bottom
shackles once in order to secure them to the tensile machine. To ensure the samples
did not slip clamps were applied and securing knots were tied in the ends of the
samples.
It was noted that the shackles did not produce constant stress across the diameter of
the rope due to the circular drums, however as the samples were being compared
under the same conditions, this was deemed acceptable.
Once the rope had been loaded into the shackles the mid-point of the rope was marked
and a further two marks were made 100 mm either side of mid-point. These marks
were used to calculate the elongation of the sample. Initially the samples were loaded
to 400 lb and then unloaded again, in order to exercise the rope prior to the testing.
The samples were then loaded up to 1000 lb which is roughly 25% of their maximum
load. The elongation of rope was then measured against the marks and was
recorded. The samples were then loaded to failure and the breaking load was
recorded.

Stuart Douglas 200235604
- 11 -
Baseline Test
The two different rope types were tested to establish a baseline standard on which the
rest of the experiments could be compared. Sample sets A1-4 and B1-4 were soaked
in water for eight hours then removed and placed onto a drying rack for three minutes.
The samples were then tested on the tensile machine using the procedure out lined
above.

Stuart Douglas 200235604
- 12 -
3.0 Results
3.1 Analysis Method
The mean values for the wet and dry weights for both the water and the wear
conditioning cycles were calculated and graphed.
The elongation and tensile strength values for the wear conditioning cycles were taken
from the analogue reading on the slow tensile machine. The machine produced digital
readings every three seconds, however it did not always record the exact load at which
the samples failed. The analogue readings were recorded in pounds and were then
converted into newtons.
The mean breaking loads and percentage strains were calculated from the data. The
standard deviation of each data set was calculated to discover if the results produced
were significant. From Engineering Statistics by Bowker [6] it is shown that if the
standard deviations from the mean of two sample sets are not coincident, then there is
approximately a 68% likelihood that the sample means are different. This likelihood
rises to 95% if the means remain incoincident with an error of two standard
deviations. This 95% is equivalent to 2.5 standard deviations. The standard deviation
of a sample set was calculated using the following equation:
( )1
2
2
−
−= ∑
nxx
s
The graphs were then plotted incorporating the standard deviations as error bars, to
allow for the easy comparison of the effects of wear on the samples.

Stuart Douglas 200235604
- 13 -
3.2 Water Conditioning Results
3.2.1 Dry Weight after Water Conditioning
3.2.3 Dry Weight of Sheath and Cores after Water Conditioning
Figure 2: Average dry mass of samples after water conditioning cycles
Figure 3: Dry weight of sheath and cores
DRY WEIGHT OF SAMPLES AFTER WATER CONDITIONING
0.05
0.0505
0.051
0.0515
0.052
0.0525
0.053
0.0535
0.054
0 1 2 3 4 5 6 7 8
CYCLES
WEI
GH
T (k
g)
NON DRY DURA FLEX DRY
DRY WEIGHTS OF SHEATH AND CORE SAMPLES AFTER WATER CONDITIONING
0.023
0.0235
0.024
0.0245
0.025
0.0255
0.026
0.0265
0.027
0.0275
0.028
0 1 2 3 4 5 6 7 8
CYCLES
WEI
GH
T (k
g)
NON DRY CORE NON DRY SHEATH DURAFLEX SHEATH DURAFLEX CORE DRY CORE DRY SHEATH

Stuart Douglas 200235604
- 14 -
3.2.4 Mass Spectrometry Results
1 0 0 2 0 0 3 0 0 4 0 0 5 0 0m /z
4 3
0
1 0
2 0
3 0
2 3
0
5
1 0
1 5
Rel
ativ
e A
bund
ance
1 0 0
0
2 0
4 0
6 0
8 0
2 4 8 .9
1 3 6 .02 1 5 .1
3 6 2 .31 5 3 .7 3 9 8 .1 4 4 0 .9 4 7 5 .1
5 2 6 .13 0 2 .41 1 3 .98 6 .72 4 9 .0
2 3 8 .1 4 7 5 .21 3 6 .0 3 6 2 .4
3 0 2 .54 0 1 .91 9 0 .4 4 1 5 .73 5 2 .1 5 2 0 .41 1 4 .19 0 .3
2 4 8 .9
2 3 8 .1
4 7 5 .21 3 6 .03 6 2 .4
3 0 2 .5 3 9 8 .11 9 0 .34 1 4 .13 0 6 .9 5 2 6 .81 1 9 .18 0 .7
0 0
3
2
A# 1 -5 8 R T: 0 .0 0 -0 .9 8 AV: 5 8 N L : 1 .8 1 E6 T: + p Fu ll m s [ 5 0 .0 0 -1 0 0 0 .0 0 ]
d # 2 -5 4 R T: 0 .0 2 -1 .0 1 AV: 5 3 N L : 4 .0 8 E5 T: + p Fu ll m s [ 5 0 .0 0 -1 0 0 0 .0 0 ]
g # 1 -5 7 R T: 0 .0 0 -0 .9 7 AV: 5 7 N L : 7 .7 0 E5 T: + p Fu ll m s [ 5 0 .0 0 -1 0 0 0 .0 0 ]
DURAFLEX
DRY
NON DRY
100 200 300 400 500 600m/z
100
0
20
40
60
80
80
0
20
40
60
Rel
ativ
e A
bund
ance
74
0
10
20
30
40
50
60
374.1260.9
225.1191.0 376.2325.4 487.3
586.596.9 413.8 527.1 6297.293.0 430.5337.1136.790.9
374.1
261.0413.8
487.2225.3 338.3526.9
600.3263.0 451.997.0 534.3171.293.0
374.1
261.1
487.2
376.2263.0489.396.9 225.4 413.7
571.1338.3 451.3 61271.1158.991.8
0
A#63-112 RT: 1.08-1.97 AV: 50 NL: 1.62E4 T: - p Full ms [ 50.00-1000.00]
d#58-105 RT: 1.11-1.98 AV: 48 NL: 1.76E4 T: - p Full ms [ 50.00-1000.00]
g#73-111 RT: 1.27-1.97 AV: 39 NL: 2.19E4 T: - p Full ms [ 50.00-1000.00]
DRY TREATED
DURAFLEX
NON DRY
Figure 4: Negative ions results of samples taken after 1st soaking cycles
Figure 5: Positive ions Mass Spectra results of Samples taken after 1st soaking cycles

Stuart Douglas 200235604
- 15 -
3.2.5 Wet Weight after Water Conditioning
3.2.6 Percentage Change of Dry and Wet Weights after Water Conditioning Cycles
Figure 6: Average wet mass of samples after water conditioning cycles
Figure 7: Percentage change in dry and wet weights of samples after water conditioning
WET WEIGHT OF SAMPLES AFTER WATER CONDITIONING
0.07
0.071
0.072
0.073
0.074
0.075
0.076
0.077
0.078
0.079
0 1 2 3 4 5 6 7 8
CYCLES
WEI
GH
T (k
g)
NON DRY DURAFLEX DRY
AVERAGE PERCENTAGE CHANGE IN DRY/WET WEIGHT OF THE SAMPLES DURING WATER CONDITIONING
0
10
20
30
40
50
60
1 2 3 4 5 6 7
CYCLES
PER
CEN
TAG
E %
NON DRY DRY DURAFLEX

Stuart Douglas 200235604
- 16 -
3.3 Wear Conditioning Results 3.3.1 Dry Weight after Wear Conditioning 3.3.2 Wet Weight of Samples after Wear Conditioning
Figure 8: Average dry weight of samples after wear conditioning cycles
Figure 9: Average wet weight after wear conditioning cycles
AVERAGE DRY WEIGHT OF SAMPLES AFTER WEAR CONDITIONING
0.129
0.1295
0.13
0.1305
0.131
0.1315
0.132
0.1325
0.133
0.1335
0.134
0.1345
0 50 100 150 200 250 300 350 400 450 500 550 600 650 700 750 800
CYCLES
WEI
GH
T (k
g)
NONDRY POST WEAR WEIGHTWEIGHT DRY POST WEAR WEIGHT
AVERAGE WET WEIGHT OF SAMPLES AFTER WEAR CONDITIONING
0.16
0.17
0.18
0.19
0.20
0.21
0.22
0 50 100 150 200 250 300 350 400 450 500 550 600 650 700 750 800
CYCLES
WEI
GH
T (K
g)
NON DRY WET WEIGHT DRY WET WEIGHT

Stuart Douglas 200235604
- 17 -
3.3.3 Percentage Strain of Samples
3.3.4 Average Breaking Loads of Samples
Figure 10: Average percentage strain of samples at a load of 1000lb
Figure 11: Average breaking load of samples after wear conditioning
AVERAGE PERCENTAGE STRAIN OF SAMPLES
30
32
34
36
38
40
42
44
46
48
0 50 100 150 200 250 300 350 400 450 500 550 600 650 700 750 800
CYCLES
PER
CEN
TAG
E ST
RA
IN (%
)
DRY NON DRY
MEAN BREAKING LOAD OF WET SAMPLES AFTER WEAR CONDITIONING
10
10.5
11
11.5
12
12.5
13
13.5
14
14.5
15
0 50 100 150 200 250 300 350 400 450 500 550 600 650 700 750 800
CYCLES
BR
EAK
ING
LO
AD
(Kg)
NON DRY DRY

Stuart Douglas 200235604
- 18 -
4.0 Discussions 4.1 Water Conditioning The initial dry masses of the three different rope types can be seen in tables 4, 5 and 6
in the Tables section. Weight per metre of rope is one of the tests performed by
Mammut [7]. The weight of the Genesis rope is stated as 0.48 g/m. When this value is
compared with the recorded values, it is apparent that the experimental values are
heavier. The dry treated rope is over 5 g heavier. The inconsistency between the
manufacturer’s weight and the actual weight may be because the rope is weighed
immediately after manufacture before moisture from the air has entered the rope. The
lightest rope was the duraFLEX sample. This may have been lighter because of the
heat treatment which binds the fibres of the rope together, effectively sealing the rope
off from any moisture which could penetrate it.
Figure 2 shows the average dry mass of the samples after each water conditioning
cycle. The results show that the dry-treated rope samples do not lose any mass during
the conditioning cycles. However, duraFLEX and non dry-treated samples do lose
mass. The non-dry samples lost an average of 4% of their mass over eight cycles
while the duraFLEX samples lost 1.5% of their initial mass over eight cycles. Figure
3 demonstrates that this mass loss described above only occurred from the core. The
sheath samples remained at a constant weight throughout the conditioning.
It was hoped that the mass spectrometer results would be able to identify what
substance was actually being removed from the non-dry and duraFLEX cores. The
results however were disappointing as they proved inconclusive. Figures 4 and 5.
Although identification of the substance was not achieved the results did prove that
the same molecules awere being removed from all the rope samples during the
soaking phase. This can be seen from the similarites in the bar graphs. The molecular

Stuart Douglas 200235604
- 19 -
masses of the largest peaks are exactly the same for all three samples. This suggests
that the treated samples prevented the loss of mass occurring in the same magnitude in
comparison to what occurs with the non-dry treated samples.
The largest peak in the negative ion results was the molecule with mass 374 and the
largest peak in the positive ion results was a molecule with molecular mass 148.
These two masses were investigated further using the mass spectrometers built in
search facility to find any possible matches. The results returned from the library were
non-conclusive.
Figures 6 and 7 indicate the effectiveness of treatments. Figure 6 illustrates the wet
masses of the samples throughout the water conditioning. The non-dry treated
samples had the highest wet mass, the duraFLEX samples were the lightest samples
and the wet weights of the dry treated samples remained virtually constant. The
duraFLEX samples showed a very gradual increase in their wet mass over the water
conditioning. The average amount of water being absorbed by the non-dry treated
samples increased by 2 g over the course of the seven cycles. A possible reason for
this may be due to the COATINGfinish being removed during the soaking cycle there
by allowing more water to be absorbed by the rope. The most conclusive findings
regarding the effectiveness of the treatments can be made from figure 7. The graph
plots the average percentage increase of mass due to water absorption for each of the
samples. The dry treated samples had the lowest percentage increase of mass, the
sample showed a 33% increase from the dry mass. The duraFLEX samples had a 38%
increase during the first cycle, compared to the non dry treated samples increase of
43%. This mean that after the first soaking cycle there was only a 10% difference in
the percentage mass change of dry treated and non-dry treated samples. After seven

Stuart Douglas 200235604
- 20 -
cycles the percentage mass change of the non-dry treated samples has increased to
53%. This graph proves that the amount of water that the treated samples absorb over
the course of the conditioning remains constant. This reinforces the fact that the
treatments are not affected by water conditioning.
4.2 Wear Conditioning
It was confirmed that mass was lost from the dry treated samples during wear
conditioning, figure 8. The samples lost 1.6 g of their mass over the course of the
cycles. The majority of the loss of mass occurred during the first wear set of 250
cycles with an average 1.2 g of mass lost. A possible reason for this loss of mass may
be due to the removal of the dry coating from the surface of the sheath due to wear.
The post wear mass of the duraFLEX treatment shows no change in mass due to wear.
Figure 9 suggests that the treatments have been affected by the wear conditioning.
The dry treated baseline samples had a wet mass of 0.187kg. The samples that
underwent 250 cycles on the wear machine absorbed the wet mass increased to
0.197kg. This is an increase of 10g which is equivalent to 5% of the initial mass.
After 750 cycles the mass difference between the baseline and worn samples
increased to 7%. The duraFLEX samples showed a similar trend to the dry treated
samples with a large difference between the baseline samples and the wear
conditioned samples. The wet mass increased by 13% after the first wear set of 250
cycles. This implies that the duraFLEX treatment was affected more adversely by
wear than the dry treated samples. The duraFlex is a heat treatment which binds the
fibres tightly together. However after samples experience wear conditioning, the
benefits of duraFLEX begin to disappear.

Stuart Douglas 200235604
- 21 -
There are insignificant differences between the baseline elongation and the elongation
of samples that have underwent wear conditioning. Although the amount of water
absorbed by the samples increased there was no significant change in the elongation
properties. An increase in the number of samples in each set may have improved the
significance of these results.
There was a significant decrease in the mean breaking load of the dry treated samples.
It was found that the sample sets that were exposed to 500 and 750 revolutions had
tensile strengths of 12.97 kN and 12.78 kN respectively. The baseline samples were
calculated to have mean of 14.28 kN. The largest decrease in tensile strength occurred
in the 750 cycle sample set with a decrease of 1.5 kN. This decrease in the tensile
strength is thought to have occurred due to the non dry treatment being removed from
the surface of the ropes sheath. This allowed water to penetrate into the fibres of the
sheath resulting in plasticising to occur. This plasticisation led to a decrease in the
tensile strength.

Stuart Douglas 200235604
- 22 -
5.0.Conclusions
It was realised that to improve the accuracy and reliability of the investigation more
sample sets should be used with larger number of samples in each set. However due to
the limited time and budget available this was not possible.
The most significant results found during this investigation were:
1. The treatments added to protect ropes against the affect of water were
effective. The dry treated samples absorbed 20% less water over eight soaking
and drying cycles than a non dry treated rope. The heat treated rope absorbsed
13% less water than the non dry treated samples.
2. The mass lost from non dry and heat treatment sample during the water
conditioning was lost only from the cores of the samples
3. The molecular masses of molecules being removed from the core during the
water conditioning were found. However it was beyond the limits of this
investigation to identify exactly what the molecules were.
4. The effectiveness of the dry coatings were not altered by repetitive water
conditioning.
5. Wear conditioning caused a decrease in the dry mass per unit length of the dry
treated rope. This loss of mass was assumed to be due to removal of
waterproofing chemicals from the surface of the sheath.
6. Wear conditioning did not alter the dry mass per unit length of the heated
treated rope
7. Wear conditioning caused an increase in the amount of water that the dry
treated and heat treated samples absorbed.
8. Effectiveness of waterproof coatings are reduced with wear conditioning

Stuart Douglas 200235604
- 23 -
9. Dry treated rope that underwent wear conditioning had a lower tensile
breaking load when wet than a baseline that had not experienced any wear.
10. It was concluded that this was because the waterproof coating was removed by
the wearing cycles therefore increasing plasticisation.
11. There was no significant change to the elongation of dry treated sample due to
wear conditioning.
6.0 Further Studies
Initially it had been desired to test a number of ropes from different manufacturers to
allow for comparison of durability of the treatments. Due to time and budget
constraints that this would not be possible, however this is an area where further
investigation is required.
If similar research is planned then it is strongly urged by the author to use a larger,
more powerful motor. The 12 V motor used during this investigation was adequate to
turn the pulley wheel with 80 N of tension applied to the system, however this was the
upper limit of motor.
Rope samples could be placed in a container of dirt or sand and then undergo wear
cycles to investigate the effect this have on the dry treatment.

Stuart Douglas 200235604
- 24 -
7.0 References [1] Ernst, E., “Polyamide 6. The Right Raw Material for Ropes: It’s
Production and Technical Characteristics”, In Proceedings of Nylon and Ropes
Conference, Turin, 8-9 March 2002
[2] Signoretti, G., “The Influence of Water, Ice and Sunlight on the Dynamic
Performance of Mountaineering Ropes”, Commission for Materials and
Techniques, Italian Alpine Club, March 2002
[3] Contugo, S., Mensitieri, G., Musto, P. and Nicolais, L., “Water Sorption
and Transport in Polymers”, In Proceedings of Nylon and Ropes Conference,
Turin, 8-9 March 2002
[4] Andrew K. “An Assessment of the Effect of Water Absorption on the Mechanical
Properties of Dynamic Climbing Ropes”,2006
Centrale Materiali e Tecniche, Torino March 2002
[5] McCartney, A. J., Brook D and Taylor, M., “The Effect of Heat Glazing on the
Strength and Extensibility Properties of Polyamide Climbing Ropes”, Commissione
Centrale Materiali e Tecniche, Torino March 2002
[6] Bowker, A.H. and Lieberman, G.J., “Engineering Statistics”, Prentice Hall, 1972,
2nd
Edition
[7] Mammut, “Rope”, Mammut Sports Group AG, Switzerland, 2004
Stuart Douglas 200235604
- 25 -
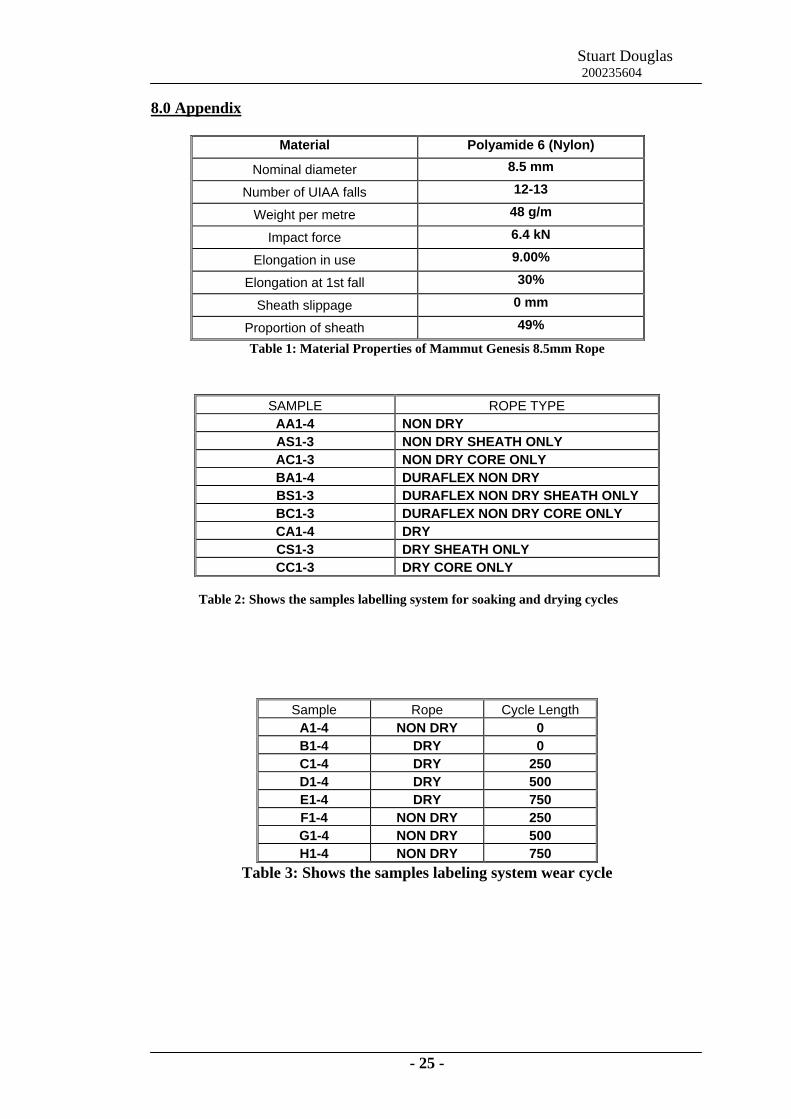
8.0 Appendix
Material Polyamide 6 (Nylon) Nominal diameter 8.5 mm
Number of UIAA falls 12-13
Weight per metre 48 g/m
Impact force 6.4 kN
Elongation in use 9.00%
Elongation at 1st fall 30%
Sheath slippage 0 mm
Proportion of sheath 49%
Table 1: Material Properties of Mammut Genesis 8.5mm Rope
Sample Rope Cycle Length A1-4 NON DRY 0 B1-4 DRY 0 C1-4 DRY 250 D1-4 DRY 500 E1-4 DRY 750 F1-4 NON DRY 250 G1-4 NON DRY 500 H1-4 NON DRY 750
Table 3: Shows the samples labeling system wear cycle
SAMPLE ROPE TYPE AA1-4 NON DRY AS1-3 NON DRY SHEATH ONLY AC1-3 NON DRY CORE ONLY BA1-4 DURAFLEX NON DRY BS1-3 DURAFLEX NON DRY SHEATH ONLY BC1-3 DURAFLEX NON DRY CORE ONLY CA1-4 DRY CS1-3 DRY SHEATH ONLY CC1-3 DRY CORE ONLY
Table 2: Shows the samples labelling system for soaking and drying cycles

Stuart Douglas 200235604
- 26 -
9.0 Results Tables-Water Conditioning
Table 4 – Non-Dry Rope Conditioning Testing Results
Table 5 – Duraflex Rope Conditioning Testing Result
Cycle Rope Section Initial Weight Wet Weight Dry Weight Rope 0.052643333 0.075895667 0.051681Sheath 0.0263985 0.0462175 0.0263915Cycle 1 Core 0.0266705 0.039136 0.0263095Rope 0.051681 0.076293 0.051382Sheath 0.0263565 0.0261465Cycle 2 Core 0.0263095 0.025816Rope 0.051382 0.076636 0.051110333Sheath 0.0261315 0.026066Cycle 3 Core 0.025816 0.025107Rope 0.051110333 0.076003333 0.050534Sheath 0.026096 0.0260085Cycle 4 Core 0.025107 0.0247174Rope 0.050534 0.077416 0.050779667Sheath 0.0260585 0.025856Cycle 5 Core 0.0247174 0.0239775Rope 0.050779667 0.077522667 0.050518Sheath 0.025956 0.02599973Cycle 6 Core 0.0239775 0.024165Rope 0.050518 0.077838667 0.050567333Sheath 0.02599973 0.025995Cycle 7 Core 0.024165 0.024165
Cycle Rope Section Initial Weight Wet Weight Dry Weight Rope 0.051923333 0.071341667 0.051653Sheath 0.0250955 0.025088Cycle 1 Core 0.026145 0.025665Rope 0.051653 0.072016333 0.051404853Sheath 0.025088 0.02499327Cycle 2 Core 0.025665 0.02557455Rope 0.051404853 0.071508 0.051330667Sheath 0.0250786 0.0250945Cycle 3 Core 0.02557455 0.024917Rope 0.051330667 0.071775333 0.051136Sheath 0.0250945 0.02493015Cycle 4 Core 0.024917 0.0245185Rope 0.051136 0.071256133 0.051204Sheath 0.02493015 0.0249038Cycle 5 Core 0.0245185 0.0244295Rope 0.051204 0.072052133 0.051080967Sheath 0.0249038 0.02510015Cycle 6 Core 0.0244295 0.02465Rope 0.051080967 0.072212667 0.051175667Sheath 0.02510015 0.0250235Cycle 7 Core 0.02465 0.0242385

Stuart Douglas 200235604
- 27 -
Cycle Rope Section Initial Weight Wet Weight Dry Weight
Rope 0.053614667 0.074710667 0.053624667Sheath 0.02671965 0.026733
Cycle 1 Core 0.0269955 0.027073Rope 0.053624667 0.074322333 0.053325333Sheath 0.026733 0.0267547
Cycle 2 Core 0.027073 0.027063Rope 0.053325333 0.075281 0.0536343Sheath 0.0267547 0.0267213
Cycle 3 Core 0.027063 0.0270485Rope 0.0536343 0.074772 0.053705667Sheath 0.0267213 0.02682425
Cycle 4 Core 0.0270485 0.027319Rope 0.053572333 0.074593 0.053643333Sheath 0.02682425 0.0267383
Cycle 5 Core 0.027319 0.0268375Rope 0.053643333 0.074643333 0.053650667Sheath 0.0267383 0.0265875
Cycle 6 Core 0.0268375 0.0265097Rope 0.053650667 0.074789667 0.053627667Sheath 0.0265875 0.026715
Cycle 7 Core 0.0265097 0.0268941Table 6 – Dry Treated Rope Testing Results
Results Tables-Wear Conditioning
Table 7: Shows the samples labelling system wear cycle
Table 8: Shows the samples labelling system wear cycle
Cycles Initial Weight (kg) Post-wear Weight (kg) Wet Weight (kg) Strain (%) Break Load (kN)0 0.13404436 N/A 0.1866585 36.8 14.27908781
250 0.1339644 0.1328156 0.19691 40.7 13.58055556500 0.1340658 0.1326954 0.2013332 42.2 12.92738255750 0.1340412 0.1324162 0.1993042 41.8 12.78223299
Cycles Initial Weight (kg) Post-wear Weight (kg) Wet Weight (kg) Strain (%) Break Load (kN)0 0.1295248 N/A 0.1782766 41.3 12.51007756
250 0.1294636 0.1293896 0.2018654 43 11.82061716500 0.1294992 0.1294242 0.2090102 44.2 11.87504825750 0.129498 0.12934 0.2079902 44.5 11.60289282