investigation and numerical modelling of roof drainage … · investigation and numerical modelling...
TRANSCRIPT

Investigation and numerical modelling of roof drainage systems under extreme events G.B. Wright, L.B. Jack and J.A. Swaffield Drainage and Water Supply Group, School of the Built Environment, Heriot-Watt University, Edinburgh, EH14 4AS, Scotland. Contact: Grant Wright (Tel. 0131 451 8261, Fax. 0131 451 3161, Email. [email protected]). Abstract In April 2003 the UK Engineering and Physical Sciences Research Council (EPSRC) and a diverse group of interested parties began funding a number of major projects looking at the impacts of climate change on the built environment, transport and utilities. One of these projects, entitled AUDACIOUS, is concerned with the impact of climate change on all aspects of urban drainage systems. The main objective of this project is to develop a set of numerical models to simulate the performance of urban drainage systems under the type of extreme rainfall events associated with climate change. Once developed, it is intended to utilise such models in a diagnostic design capacity, to assist in the formulation of strategies to improve the performance of new and existing urban drainage systems under different climate change scenarios. This paper details the work that has been undertaken at Heriot-Watt University as part of the AUDACIOUS project. To date, this has involved the development of a numerical model to simulate the performance of roof drainage systems (both conventional and siphonic) under extreme rainfall events. The necessary experimental work is described, and the development of the model is detailed. Comparisons between model output and laboratory data are illustrated. Finally, conclusions are drawn regarding the progress to date, and plans for the next stage of the project are outlined. Keywords Roof Drainage; Extreme Events; Simulation 1 Introduction AUDACIOUS stands for Adaptable Urban Drainage: Addressing Changes in Intensity, Occurrence and Uncertainty of Stormwater. As such it aims to investigate the key

effects of climate change on the performance of existing urban drainage systems, and hence provide the models and guidance necessary to identify and rectify the types of operational problems associated with climate change. Successful completion of these aims depends primarily on the generation of realistic data describing typical and extreme future rainfall patterns, and the development of the numerical models necessary to route this rainfall through urban areas. The drainage models currently under development within AUDACIOUS include: a modified hydrology model, an interlinked sewer/surface runoff model, a local drainage model and a roof drainage model. The generation of the rainfall data and the development of the first three models is detailed elsewhere[1,2], whilst the remainder of this paper is concerned with the roof drainage model. 2 Basic principles and current design practice There are basically two different types of roof drainage system, namely conventional and siphonic. Both types of system essentially comprise of three interacting components: the roof surface, the rainwater collection gutters and the system pipework. Each of these components has the ability to substantially alter the runoff hydrograph as it is routed through the system. The design of the roof surface is usually within the remit of the architect rather than the drainage designer, highlighting that structural and/or aesthetic concerns often take precedence over performance criteria. The hydraulic design of gutters is complicated by the presence of the sloping water surface profile, the form of which can only realistically be determined with recourse to some form of numerical model. Consequently, current design methods for gutters installed in conventional drainage systems are based primarily on empirical relationships[3] and the assumption of free discharge at the outlet. Little additional guidance is given in the standards for the design of gutters in siphonic systems, and the onus is firmly on the system designers to ensure adequate capacity; this is normally ensured by the laboratory testing of specific gutter outlets. With respect to system pipework, the relevant standard[4] (BS EN 12056-3:2000) specifies that downpipes in conventional systems should run no more than 33% full. Similarly, the flow conditions within offset pipes must also normally be free surface, with BS EN 12056-3:2000 specifying that offsets run no more than 70% full. Current design practice for siphonic systems assumes that, for a specified design storm, a siphonic system fills and primes rapidly with 100% water[5]. This assumption allows siphonic systems to be designed utilising steady state hydraulic theory, normally in the form of simple computer programs. The steady flow energy equation is employed[6], with the elevation difference between the gutter water level and the point of discharge being equated to the head losses in the system. However, steady state design methods are not truly applicable when a siphonic system is exposed to a rainfall event below the design criteria, or an event with varying rainfall intensity. Furthermore, current design methods cannot account for commonly occurring operational problems, such as the blockage of outlets and the submergence of the system exit due to downstream flooding.

3. Description of research As mentioned previously, the main aim of the work detailed herein was to develop a numerical model, capable of accurately simulating the operational performance of roof drainage systems. As such, it was envisaged that the model would have to be able to route rainfall from roof surfaces down to ground level. To achieve this, it was necessary to undertake both experimental and numerical work. Experimental data concerning the performance of conventional systems during extreme rainfall events is very scarce. It was therefore necessary to undertake laboratory based experimental work to determine the operational characteristics of conventional systems under such conditions. In contrast, the performance of siphonic systems under all types of rainfall events is relatively well understood [7]. Consequently, no further siphonic experimental work was required. In terms of numerical modelling, it was necessary to develop new subroutines to simulate the flow conditions on roof surfaces, along gutters and within conventional systems. Much of the developmental work concerning siphonic systems has already been completed during previous research projects[7]. However, the complexity of the existing computational subroutines often leads to numerical instabilities, restricting its general applicability and resulting in extended computational run times. Consequently, it was necessary to simplify the modelling techniques associated with siphonic systems. 4. Laboratory investigations As the capacity of conventional roof drainage systems is controlled primarily by the capacity of the gutter outlets, the main purpose of the laboratory work was to investigate the flow conditions in the vicinity of the outlets, and their dependence on gutter cross-sectional characteristics. 4.1 Experimental apparatus and procedure Experimental work was undertaken using the test rig detailed in Figure 1. Spatial constraints within the laboratory limited the maximum gutter length to 1.95m, but this was considered sufficient to investigate outlet flow conditions. To ensure realistic flow conditions, each gutter was fed via a rear supply trough and a simulated sloping roof. Pressure transducers were installed in the base of the gutters to measure flow depths and, where appropriate, in the base of the overflow tank to measure gutter overtopping. In addition, magnetic induction flowmeters were used to measure the gutter inflow rates. The transducers and flowmeters were connected to a PC based data acquisition system, capable of sampling data at frequencies of up to 30kHz. Where possible, the pipework was transparent, allowing direct observations of relevant flow conditions. Using the equipment detailed above, laboratory experiments were undertaken to determine the flow conditions arising with four representative gutter/downpipe configurations, namely:
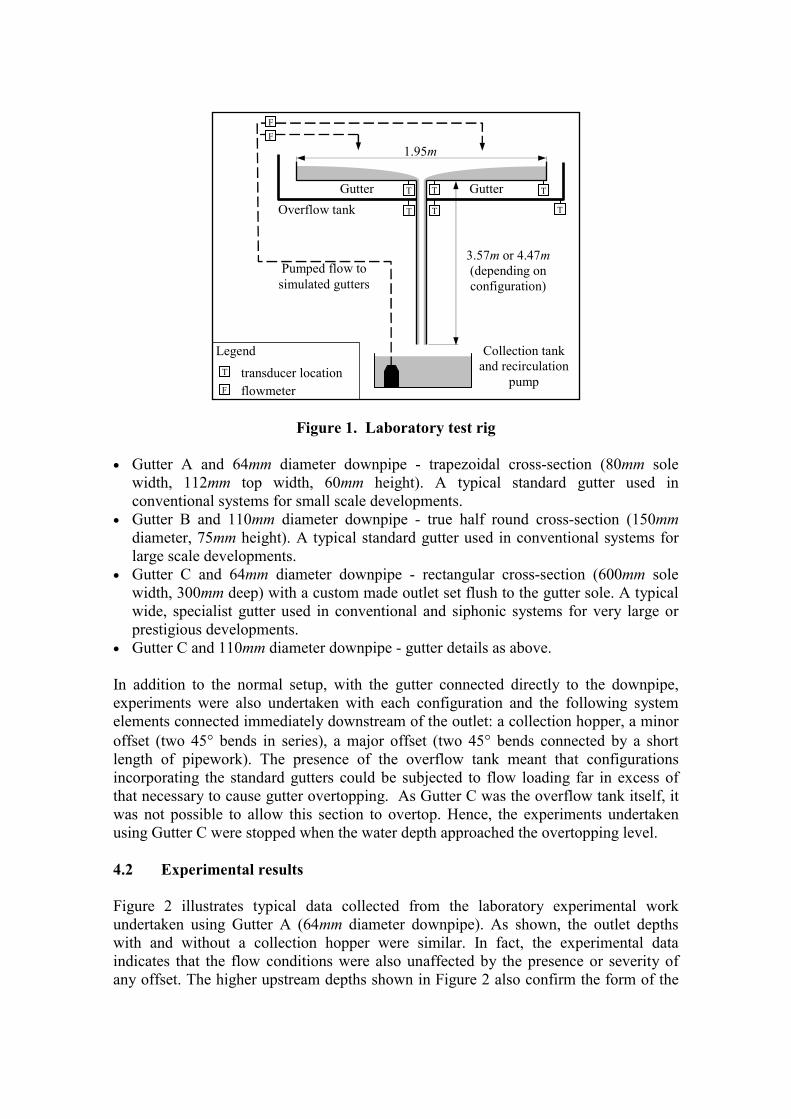
Figure 1. Laboratory test rig
• Gutter A and 64mm diameter downpipe - trapezoidal cross-section (80mm sole
width, 112mm top width, 60mm height). A typical standard gutter used in conventional systems for small scale developments.
• Gutter B and 110mm diameter downpipe - true half round cross-section (150mm diameter, 75mm height). A typical standard gutter used in conventional systems for large scale developments.
• Gutter C and 64mm diameter downpipe - rectangular cross-section (600mm sole width, 300mm deep) with a custom made outlet set flush to the gutter sole. A typical wide, specialist gutter used in conventional and siphonic systems for very large or prestigious developments.
• Gutter C and 110mm diameter downpipe - gutter details as above. In addition to the normal setup, with the gutter connected directly to the downpipe, experiments were also undertaken with each configuration and the following system elements connected immediately downstream of the outlet: a collection hopper, a minor offset (two 45° bends in series), a major offset (two 45° bends connected by a short length of pipework). The presence of the overflow tank meant that configurations incorporating the standard gutters could be subjected to flow loading far in excess of that necessary to cause gutter overtopping. As Gutter C was the overflow tank itself, it was not possible to allow this section to overtop. Hence, the experiments undertaken using Gutter C were stopped when the water depth approached the overtopping level. 4.2 Experimental results Figure 2 illustrates typical data collected from the laboratory experimental work undertaken using Gutter A (64mm diameter downpipe). As shown, the outlet depths with and without a collection hopper were similar. In fact, the experimental data indicates that the flow conditions were also unaffected by the presence or severity of any offset. The higher upstream depths shown in Figure 2 also confirm the form of the
T
T T
T T
Collection tank and recirculation
pump
Pumped flow to simulated gutters
F
3.57m or 4.47m (depending on configuration)
F
Overflow tank Gutter Gutter
Legend
transducer location flowmeter
T
F
1.95m
T
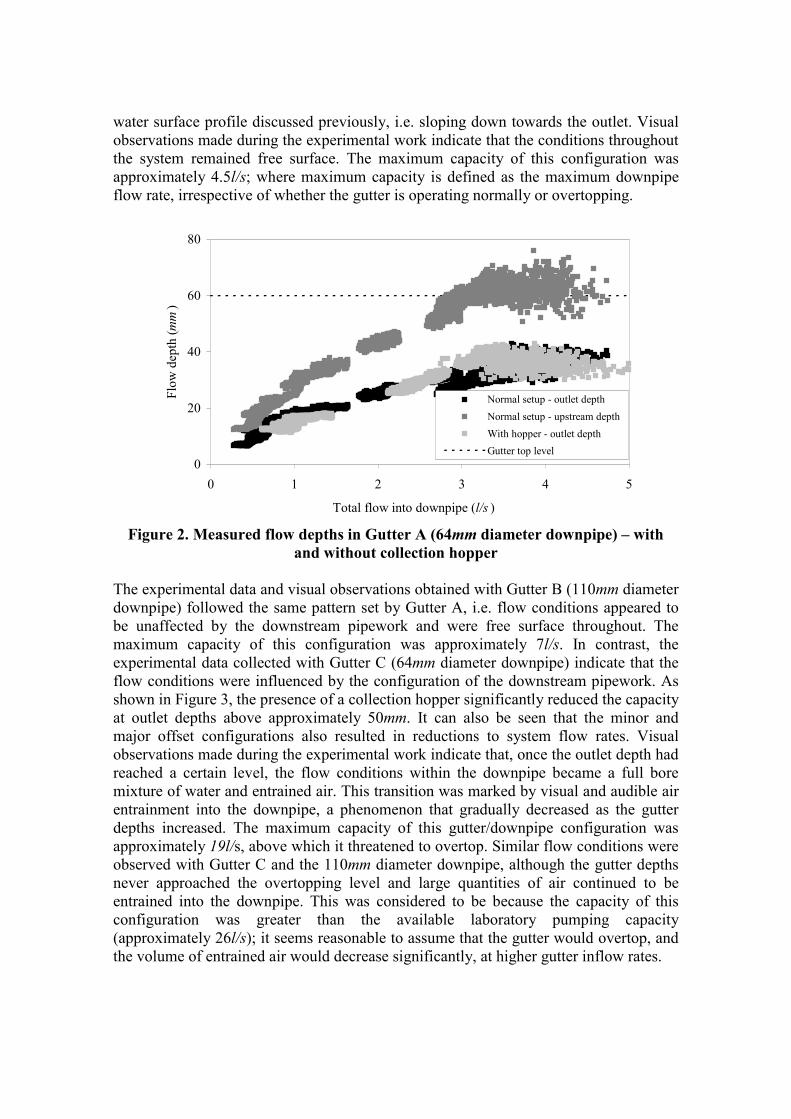
water surface profile discussed previously, i.e. sloping down towards the outlet. Visual observations made during the experimental work indicate that the conditions throughout the system remained free surface. The maximum capacity of this configuration was approximately 4.5l/s; where maximum capacity is defined as the maximum downpipe flow rate, irrespective of whether the gutter is operating normally or overtopping.
Figure 2. Measured flow depths in Gutter A (64mm diameter downpipe) – with and without collection hopper
The experimental data and visual observations obtained with Gutter B (110mm diameter downpipe) followed the same pattern set by Gutter A, i.e. flow conditions appeared to be unaffected by the downstream pipework and were free surface throughout. The maximum capacity of this configuration was approximately 7l/s. In contrast, the experimental data collected with Gutter C (64mm diameter downpipe) indicate that the flow conditions were influenced by the configuration of the downstream pipework. As shown in Figure 3, the presence of a collection hopper significantly reduced the capacity at outlet depths above approximately 50mm. It can also be seen that the minor and major offset configurations also resulted in reductions to system flow rates. Visual observations made during the experimental work indicate that, once the outlet depth had reached a certain level, the flow conditions within the downpipe became a full bore mixture of water and entrained air. This transition was marked by visual and audible air entrainment into the downpipe, a phenomenon that gradually decreased as the gutter depths increased. The maximum capacity of this gutter/downpipe configuration was approximately 19l/s, above which it threatened to overtop. Similar flow conditions were observed with Gutter C and the 110mm diameter downpipe, although the gutter depths never approached the overtopping level and large quantities of air continued to be entrained into the downpipe. This was considered to be because the capacity of this configuration was greater than the available laboratory pumping capacity (approximately 26l/s); it seems reasonable to assume that the gutter would overtop, and the volume of entrained air would decrease significantly, at higher gutter inflow rates.
0
20
40
60
80
0 1 2 3 4 5
Total flow into downpipe (l/s )
Flow
dep
th (m
m)
Normal setup - outlet depthNormal setup - upstream depthWith hopper - outlet depthGutter top level

Figure 3. Measured outlet depths in Gutter C (64mm diameter downpipe) - various setups
In view of these unexpected observations of full bore flow conditions within configurations incorporating Gutter C, a pressure transducer was installed in the wall of the 110mm diameter downpipe. The data collected from this transducer highlighted the negative system pressures that indicate the onset and establishment of siphonic conditions within the downpipe (above gutter depths of approximately 50mm). Figure 4 illustrates the experimental data obtained for all four gutter/downpipe configurations.
Figure 4. Measured outlet depths for all gutter and downpipe configurations - normal setup
0
50
100
150
200
250
0 5 10 15 20 25 30
Total flow rate into downpipe (l/s )
Out
let d
epth
(mm
)
Gutter A (64mm dia. downpipe)Gutter B (110mm dia. downpipe)
Gutter C (64mm dia. downpipe)Gutter C (110mm dia. downpipe)Gutter A top level
Gutter B top level
0
50
100
150
200
250
0 5 10 15 20 25
Total flow into downpipe (l/s )
Out
let d
epth
(mm
)
Normal setup
With hopper
With minor offset
With major offset
As shown, the outlet depths for both of the standard gutters (A and B) approached, and sometimes exceeded, the gutter top levels at relatively low flow rates (less than 7.5l/s). The sloping water surface profile meant that these high outlet depths corresponded to even higher upstream depths, which resulted in gutter overtopping. The data shown for Gutter C illustrates the far greater capacities associated with these configurations. Whilst the shape of the data plot associated with Gutter C and the 64mm diameter downpipe indicates that the maximum capacity has been achieved, the data associated with Gutter C and the 110mm diameter downpipe suggests that significantly more capacity is available. It is considered that the greater capacity of the wide Gutter C is because it’s design enables full bore flow conditions to develop in the downpipe, leading to siphonic action and the resulting higher flow rates. The most obvious reason for this is that the high flow depths possible in Gutter C help to constrict/break direct air paths into the downpipe, hence encouraging the formation of full bore conditions. The second reason is that the relatively large sole width of Gutter C, in terms of the diameter of the outlet, means that flow can readily enter the downpipe all around the circumference of the outlet, again encouraging the formation of full bore conditions. In contrast, the effective sole width of the standard gutters are approximately equal to the diameter of the outlet, and flow can therefore really only enter the downpipe from either side of the outlet.
5. Numerical modelling In order to accurately simulate the performance of roof drainage systems, it was necessary to develop a numerical model incorporating a roof flow module, a gutter flow module and a pipework module. 5.1 Roof flow module The roof flow module utilises a kinematic wave approach[8] to the routing of rainfall over sloping roof surfaces and into the gutters. Although less accurate than a full dynamic approach, the relatively large surface areas involved mean that anything more complex would result in unfeasibly long computational run times. In addition to variable rainfall conditions, the module can also account for different roof geometries (area, slope, roughness) and the effect of wind driven rain. Furthermore, by utilising the Horton infiltration formulation[8], the module can also simulate the basic effects of green roof surfaces, i.e. the module calculates the quantity of rainfall that infiltrates into a green roof rather than running off into a gutter. Whilst the above approach is applied to roof surfaces supplying gutters, flat roofs connected directly to downpipes are treated slightly differently. A simple volumetric based approach is used to determine the quantity of rainwater falling on a roof during any given interval. This data is used to calculate the corresponding depth of water on the roof, which then controls the flow rate into the connected downpipe(s). 5.2 Gutter flow module The gutter flow module utilises the method of characteristics solution technique to the continuity and momentum equations of one dimensional, unsteady flow in open

channels with lateral inflow[9]. When employing this approach, boundary conditions (BCs) are required to describe the conditions occurring at all system boundaries, namely: the upstream/downstream ends of a gutter, an open gutter outlet and a fully/partially closed gutter outlet. The BC for the ends of a gutter is very straightforward, as there is no flow past the gutter end, and the velocity is thus zero. The form of the BC for an open gutter outlet depends on the type of system, the gutter dimensions and the prevailing flow conditions. Dealing first with conventional systems, the experimental data confirms that the outlet depth in a standard gutter (Gutter A or B) is equal to the relevant critical depth of the flow, irrespective of whether the gutter is operating normally or overtopping. Hence the BC for standard gutters is critical depth at the outlet. The experimental data obtained with the wide gutter (Gutter C) indicates that, whilst the flow in the connected downpipe remains free surface, the outlet depth may be described by the weir equation detailed in BS EN 12056-3:2000, which is based on extensive laboratory data collected in the 1980s[3]. Once the flow in the downpipe becomes a full bore mixture of water and entrained air, the conditions within the gutters and the connected pipework become inextricably linked, and must therefore be analysed together. This may be achieved by solving the available characteristic equation# at the entry to the downpipe with an empirical expression linking gutter flow depth to entrained air flows. The necessary empirical relationships, for both the 64mm and 110mm downpipes, were developed by analysis of the experimental data. Hence the BC for wide gutters is weir flow up to a certain gutter depth, followed by full bore flow with a variable air content. With respect to open outlets in siphonic systems, the necessary BCs have already been developed as part of previous research projects. Essentially, they follow the same pattern as wide gutters in conventional systems, the only differences being that the empirical relationships linking entrained air content to gutter depth are slightly different, due to the due to the inclusion of a (air restricting) baffle plate. Although no experimental work was undertaken for outlets on flat roofs, it seems reasonable to treat these in a similar fashion to those in wide gutters, as the outlet would normally be surrounded by water in much the same way as a wide gutter section. For both conventional and siphonic systems, a BC was required for fully/partially closed outlets in order to represent outlets that may become blocked. This is a particular problem with siphonic systems, due to the design of the outlets and the relatively small diameter of the downpipes. In the case of total blockages, the BC is straightforward, as the flow through the outlet is simply set to zero. With partial blockages, the process is slightly more complicated, but essentially involves specifying a percentage figure to represent the proportion of pre-blockage flow that can pass into the downpipe. 5.3 Pipe flow module In order to avoid the type of stability and run time problems associated with the existing siphonic roof drainage model, the new pipe flow module utilises a two step approach to the routing of rainfall from gutter level to the ground. Under free surface gutter conditions, the flow in both conventional and siphonic systems is free surface, and is
# A characteristic equation is an expression that links conditions at one computational node at one time to those at an adjacent node, one time step in the future

thus simply routed to ground level assuming annular flow within downpipes. However, when the conditions at the gutter outlets become full bore, the flow in both conventional and siphonic systems is assumed to become full bore. The method of characteristics solution technique is then used to solve the continuity and momentum equations of one dimensional, unsteady full bore flow [9]. By utilising this two step approach, it is not possible to accurately model all aspects of siphonic system operation, particularly with respect to the priming process and the pulsing conditions characteristic of sub-design events. However, it seems to reasonable to assume that, when exposed to an extreme event, a siphonic system will prime rapidly and will not exhibit pulsing conditions. As the primary purpose of the model is to simulate the conditions occurring due to extreme events, the small errors involved in this approach are not considered particularly significant. Again boundary conditions are required to allow the full bore solution to proceed. General forms of the necessary BCs have been developed during previous research projects[10], and hence required only minor modifications to be added to the new model. These BCs are equally applicable to both conventional and siphonic systems, and include: a system entry BC (linked to the gutter outlet conditions and with variable air entry), a blocked outlet BC (with variable degree of blockage), a 90° bend BC, a diameter change BC, a three pipe junction BC and a system exit BC (including allowance for a submerged discharge or discharge to a sealed manhole). 5.4 Model output Figure 5 shows a comparison between the measured and predicted outlet depths and overtopping rates for Gutter A (64mm diameter downpipe) when the inflow to the gutter was approximately 5.9l/s.
Figure 5. Measured and predicted conditions in Gutter A (64mm diameter
downpipe) – normal setup
0
5
10
0 25 50Time since start of simulated rainfall event (s )
Flow
rate
(l/s
)
0
25
50
Flow
dep
th (m
m)
Measured flow into gutterMeasured overtopping ratePredicted overtopping rateMeasured depth at outletPredicted depth at outlet
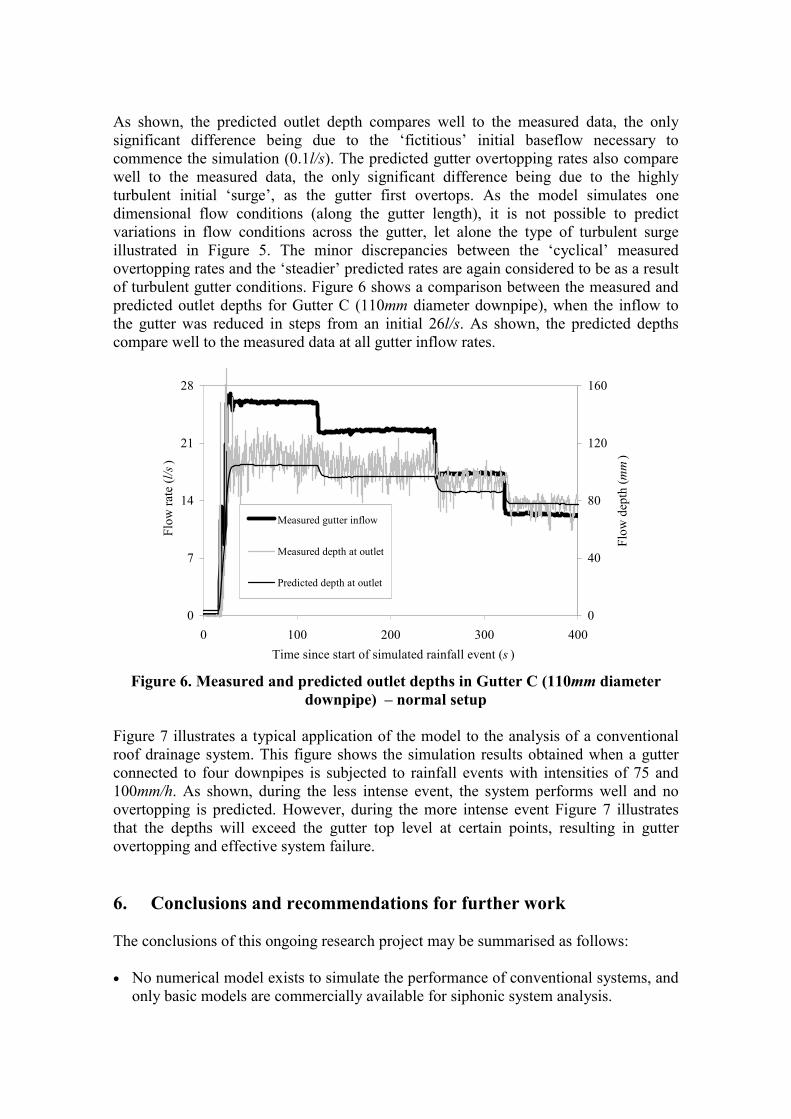
As shown, the predicted outlet depth compares well to the measured data, the only significant difference being due to the ‘fictitious’ initial baseflow necessary to commence the simulation (0.1l/s). The predicted gutter overtopping rates also compare well to the measured data, the only significant difference being due to the highly turbulent initial ‘surge’, as the gutter first overtops. As the model simulates one dimensional flow conditions (along the gutter length), it is not possible to predict variations in flow conditions across the gutter, let alone the type of turbulent surge illustrated in Figure 5. The minor discrepancies between the ‘cyclical’ measured overtopping rates and the ‘steadier’ predicted rates are again considered to be as a result of turbulent gutter conditions. Figure 6 shows a comparison between the measured and predicted outlet depths for Gutter C (110mm diameter downpipe), when the inflow to the gutter was reduced in steps from an initial 26l/s. As shown, the predicted depths compare well to the measured data at all gutter inflow rates.
Figure 6. Measured and predicted outlet depths in Gutter C (110mm diameter downpipe) – normal setup
Figure 7 illustrates a typical application of the model to the analysis of a conventional roof drainage system. This figure shows the simulation results obtained when a gutter connected to four downpipes is subjected to rainfall events with intensities of 75 and 100mm/h. As shown, during the less intense event, the system performs well and no overtopping is predicted. However, during the more intense event Figure 7 illustrates that the depths will exceed the gutter top level at certain points, resulting in gutter overtopping and effective system failure. 6. Conclusions and recommendations for further work The conclusions of this ongoing research project may be summarised as follows: • No numerical model exists to simulate the performance of conventional systems, and
only basic models are commercially available for siphonic system analysis.
0
7
14
21
28
0 100 200 300 400Time since start of simulated rainfall event (s )
Flow
rate
(l/s
)
0
40
80
120
160
Flow
dep
th (m
m)
Measured gutter inflow
Measured depth at outlet
Predicted depth at outlet

Figure 7. Predicted gutter depths and overtopping rates for a 75m section of Gutter B connected to four 110mm diameter downpipes (roof area = 650m2)
• Gutters installed in conventional systems may be classified, in terms of their
performance characteristics, as standard (low maximum depth, sole width ≈ outlet diameter) or wide (high maximum depth, sole width >> outlet diameter).
• Conventional systems incorporating standard gutters will always operate under free surface conditions, irrespective of rainfall intensity or gutter overtopping.
• Conventional systems incorporating wide gutters will operate under free surface conditions up to a point, after which they operate in a similar manner to siphonic systems approaching their design point; that is, the flow through the outlets and downpipes becomes essentially full bore, with the entrained air content of the flow gradually decreasing with increasing gutter depths. In the absence of more extensive experimental data, it seems reasonable to assume that a gutter with a maximum depth of 150mm and a sole width three times its outlet diameter could be classified as wide.
• The formation of full bore flow conditions within conventional systems incorporating wide gutters may mean that many existing systems have a far higher capacity than their design values. Although this may be beneficial from roof drainage point of view, the increased flow rates exiting the downpipes may result in unwanted consequences further downstream, e.g. surcharging of the collection sewers.
• Utilisation of a two step approach to the modelling of conditions within roof drainage systems enables the performance of such systems to be accurately simulated under extreme events.
The roof drainage model is now essentially complete. Once data describing the type of extreme events that may occur in the future has been generated, the model will be used to assess the performance of representative, existing systems. The results of this work will then be used to develop strategies to help alleviate the resulting operational problems, and to help inform the development of a whole life cycle costing model for roof drainage systems. Further work is clearly required to more accurately quantify the dimensions necessary for a gutter, within a conventional system, to be classified as wide. Additional work is also required to ascertain whether the conclusions drawn with
-60
-30
0
30
60
90
0 15 30 45 60 75
Distance along gutter (m )
Flow
dep
th (m
m)
0
0.08
0.16
0.24
0.32
0.4
Ove
rtopp
ing
rate
(l/s
)
Gutter top levelDepth - RI = 75mm/hDepth - RI = 100mm/hOvertopping - RI = 100mm/h
outlet 1 outlet 2 outlet 3 outlet 4

respect to circular pipework herein, are equally applicable to pipework with a square cross section. Acknowledgements The researchers remain grateful for the assistance given by EPSRC, UKCIP, AUDACIOUS stakeholders and Marley Plumbing and Drainage. References [1] Web site - http://www.cru.uea.ac.uk/cru/projects/betwixt [2] Web site - http://www.eng.brad.ac.uk/audacious [3] May R.W.P. (1984). Hydraulic Design of Roof Gutters. Proceedings of the
Institution of Civil Engineers. Part 2, Vol 77. [4] BSI (2000). BS EN 12056-3:2000 Gravity drainage systems inside buildings. Roof
drainage, layout and calculation. British Standards Publishing Limited : UK. [5] Arthur S. and Swaffield J.A. (2001). Siphonic Roof Drainage: The State of the
Art. Urban Water. Vol. 3, No. 1, pp. 43 - 52. [6] May R.W.P. and Escarameia M. (1996). Performance of siphonic drainage
systems for roof gutters. Report No SR 463. HR Wallingford : UK. [7] Wright G.B., Swaffield J.A and Arthur S. (2002). Investigation into the
performance characteristics of multi-outlet siphonic rainwater systems. Building Services Engineering Research and Technology. Vol. 23, No. 3, pp. 127-141(15).
[8] Chow V.T., Maidment D.R. and Mays L.W. (1988). Applied Hydrology. McGraw-Hill : Singapore.
[9] Douglas J.F., Gasiorek J.M. and Swaffield J.A. (2000). Fluid Mechanics. 4th Edition. Longman : England.
[10] Wright G.B., Swaffield J.A. and Arthur S. (2004). Numerical simulation of the dynamic balancing of siphonic roof rainwater drainage networks. Building and Environment (under review).
Presentation of authors
All of the authors work in the drainage and water supply group at Heriot-Watt University, and all are involved with building drainage research.
G.B.Wright L.B. Jack J.A. Swaffield