‘investigating the use of raman spectroscopy as a ...clok.uclan.ac.uk/9722/2/fullwood leanne final...
TRANSCRIPT

1
‘Investigating the use of Raman
spectroscopy as a histopathological
tool to identify metastatic brain
tumours and their sites of origin’
by
Leanne M. Fullwood
A thesis submitted in partial fulfilment for the requirements for the degree of Master of
Science (by Research) at the University of Central Lancashire
November 2013

2
Student Declaration
Concurrent registration for two or more academic awards
I declare that while registered as a candidate for the research degree, I have not been a registered
candidate or enrolled student for another award of the University or other academic or professional
institution
Material submitted for another award
I declare that no material contained in the thesis has been used in any other submission for an academic
award and is solely my own work
Signature of Candidate
Type of Award Master of Science (by Research)
School School of Forensic and Investigative Sciences

3
Abstract
It is reported that 13,000 people in the UK are diagnosed with tumours in the
brain every year, of which 60% are metastatic. Current methods for diagnosing the
disease can be subjective, invasive and have long diagnostic windows. Raman
spectroscopy provides a non-destructive, non-invasive, rapid and economical method
for diagnosis.
The aim of this study was to assess the use of Raman and immersion Raman
spectroscopy for diagnosing metastatic brain and glioblastoma multiforme tumours and
identifying primary sites of origin, and investigate the substrate effect on sample
preparation and resultant spectra.
The tissue specimens used in this study were formalin fixed-paraffin preserved
and were supported on spectroscopic substrates for analysis. Samples were dewaxed
prior to analysis to reduce/eliminate the paraffin contributions in the Raman spectra.
The substrate was shown to have a significant influence on this dewaxing procedure and
thus resulting spectra. It was also observed that specimens on CaF2 and Spectrosil
quartz retained paraffin after dewaxing, whereas specimens on Low-E substrates did
not.
Through data examination, the 721 cm-1
and 782 cm-1
peaks were identified as
being the most distinct peaks for discriminating between glioblastoma multiforme,
metastatic and normal brain tissue spectra. A ratio score plot of these peaks determined
classification sensitivities and specificities as 100% and 94.44% for glioblastoma
multiforme, 96.55% and 100% for metastatic brain, and 85.71% and 100% for normal
brain tissue respectively. Cancerous tissue was observed to retain more wax than normal
tissue. This difference in dewaxing efficiency was attributed to alterations in tissue
density between the histological types. Principle component-discriminant function

4
analysis revealed separation between metastatic sites: breast, lung, melanoma,
colon/rectum and oesophagus and stomach, showing the potential of Raman
spectroscopy to identify primary sites of origin from metastatic brain tissue.
Overall, this study demonstrated the diagnostic ability of Raman spectroscopy
and the importance of substrate influence on tissue preparation and the quality of
spectra.

5
Acknowledgements
Firstly, I would like to thank my Director of Studies, Dr Matthew Baker, for his
consistent support, patience and contribution to this research. His training and direction
has been invaluable over the last year in assisting my academic development and
understanding. I am grateful to Mr David Griffiths for his time, help and guidance in all
histological related matters and Dr Konrad Dorling for his invaluable Matlab training.
During this research I was able to spend three months at the Focas Institute
(DIT) in Dublin. I would like to thank Professor Hugh Byrne, Dr Franck Bonnier and
Dr Luke O’Neill for their constant kindness and assistance in this project, and for being
so welcoming and generous in allowing me to use their resources and intelligence.
I am also very grateful to Reece Hall for his SEM/EDAX expertise, without
which I would still be in the lab trying to figure out the instrumentation.
I would like to acknowledge the Sydney Driscoll Neuroscience Foundation,
Brain Tumour Northwest, the Association of British Spectroscopists and ERASMUS
and thank them for their funding and provisions which facilitated this project.
Lastly, I would like to thank my Mother, Father and four sisters for their love
and tolerance over the years, without their support and encouragement I would be lost.

6
List of Contents
Page number
List of Figures 1
List of Tables 3
List of Abbreviations 4
Chapter 1 Introduction 5
1.1 Metastatic brain cancer 5
1.1.1 Introduction and Epidemiology 5
1.1.2 Carcinogenesis 6
1.2 The diagnostic modalities of metastatic brain cancer 10
1.2.1 Associated symptoms of brain cancer 10
1.2.2 Preoperative diagnosis 10
1.2.3 Biomarkers 11
1.2.4 Histopathological diagnosis 12
1.3 Raman Spectroscopy 13
1.3.1 Fundamentals of Raman spectroscopy 13
1.3.2 Application of Raman spectroscopy in cancer
diagnostics
16
1.3.3 Raman spectra of cancerous tissue 19
1.3.4 Raman Spectroscopy Substrates 20
1.4 Dewaxing of Paraffin embedded tissue samples 21
1.5 Scanning Electron Microscope/Energy dispersive analysis of
x-rays
24

7
1.6 Study aims and rationale 25
1.6.1 Working hypothesis and rationale 25
1.6.2 Main aim of study 25
1.6.3 Secondary aims of study 26
Chapter 2 Materials and Methods 27
2.1 Summary of materials used in the study 27
2.2 Study participants 27
2.3 Tissue preparation for histological examination 29
2.4 Tissue section preparation for Raman spectroscopic analysis 30
2.5 Raman spectroscopy instrumentation and analysis 30
2.6 Data pre-processing and multivariate analysis 33
2.7 SEM-EDAX 36
2.8 Atomic force microscope (AFM)
2.9 Statistical Analysis
36
Chapter 3 Results and Discussion 37
3.1 Microscopic examinations of H&E stained sections 37
3.2 Substrate Study 38
3.3 Immersion vs. Non-Immersion Raman spectroscopy 51
3.4 532 nm vs. 785 nm laser line 55
3.5 Spectral Histopathology: Discrimination of metastatic tumours 57
Chapter 4 Conclusions 82
Chapter 5 Future Work 85
Bibliography 87
Appendices 93

8
List of Figures
Figure
Number
Title Page
Number
Figure 1 The basic process of carcinogenesis. Adapted from [1]. 7
Figure 2 Schematic diagram showing the process of metastasis. Replicated from [2]. 9
Figure 3 Energy level diagram for Rayleigh and Raman scattering. Adapted from [3]. 14
Figure 4 Diatomic and polyatomic modes of vibration adapted from [4]. 16
Figure 5 Molecular structure of paraffin replicated from [5]. 23
Figure 6 Horiba Jobin-Yvon LabRAM HR800 Raman spectrometer.
31
Figure 7 The Horiba Jobin-Yvon LabRAM HR800 confocal Raman Spectrometer used
to take paraffin wax measurements.
33
Figure 8 Microscopic images of H&E stained tissue samples of normal brain, metastatic
brain (from oesophagus and stomach, breast, colon/rectum, lung and melanoma
as labelled above) and GBM brain WHO grade IV (x 100).
37
Figure 9 Original spectral plot showing raw spectra of the substrate backgrounds: low-E
(top), Spectrosil (middle) and CaF2 (bottom).
39
Figure 10 SEM-EDAX of Low-E substrate acquired from three different areas.
41
Figure 11 SEM-EDAX of Spectrosil substrate acquired from three different areas.
42
Figure 12 SEM-EDAX of CaF2 substrate acquired from three different areas.
43
Figure 13 Original spectral plot showing the average of 458 CaF2 acquisitions, 210 low-E
acquisitions and 465 Spectrosil acquisitions from all tissue specimens and a raw
spectrum of paraffin wax. The tissue spectra have been vector normalised and
offset for visual clarity. The asterisks above the peaks correspond to the paraffin
contributions.
45
Figure 14 Original spectral plot showing vector normalised, background-subtracted
spectra of substrates after dewaxing from: 1 CaF2 acquisition, 1 Spectrosil
acquisition and 10 averaged low-E acquisitions. The raw spectrum of paraffin
wax (bottom cyan spectra) is included as a reference. The spectra have been
appropriately scaled and offset for visual clarity.
47
Figure 15 Photographs showing microscopic Raman images at x 10 of the substrate
surfaces after dewaxing. Wax residuals can be observed on the CaF2 and
Spectrosil substrates.
48
Figure 16 Photographs showing AFM images of Spectrosil, CaF2 and Low-E substrates.
50
Figure 17 Original spectral plot showing averaged raw spectra of 1116 immersion
acquisitions using, a x 50 objective, and 458 non-immersion acquisitions using
a x 60 objective from all tissue specimens on CaF2.
53

9
Figure 18 Photograph showing Raman (x 50) and immersion Raman (x60) image of brain
tissue.
55
Figure 19 Original spectral plot showing averaged raw immersion Raman spectra of 996
acquisitions using the 532 nm laser line and 1116 acquisitions using the 785 nm
laser line from all tissue specimens.
56
Figure 20 Original spectral plot showing averaged immersion spectra of 127 GBM
acquisitions, 668 metastatic acquisitions and 157 normal brain acquisitions.
Spectra have been vector normalised, the backgrounds have been corrected
using a 5th order polynomial fit and subtraction and 7 points of smoothing. The
asterisks correspond to paraffin peaks from residual wax in the tissue.
59
Figure 21 Chemical structures of the molecules contributing to spectra differences
between GBM, normal and metastatic brain tissue.
62
Figure 22 Original discriminant function plot showing the separation between GBM (1),
metastatic (2) and normal (3) brain tissue, at spectral level, based on the training
set (red) and test set (blue) with 95% (outer ellipse) and 90% (inner ellipse)
confidence limits.
64
Figure 23 PC-DFA loadings plot of discriminant functions 1 and 2 from the GBM vs.
metastatic vs. normal (Figure 9) PC-DFA model.
66
Figure 24 2D score plot of the 620 cm-1
to 782 cm-1
peak ration versus the 721 cm-1
to 620
cm-1
peak ratio. Each data point is the patient average from spectra that have
been vector normalised and 5th
order polynomial subtracted.
69
Figure 25 Score plot of intensity measurements from the 1061 cm-1
peak and the 1131 cm-
1 peak of patient averaged normal, GBM and metastatic spectra.
71
Figure 26 Bar chart of three paraffin peak intensities with standard deviation from 127
GBM acquisitions (n=5 patients), 668 metastatic acquisitions (n=29 patients)
and 157 normal brain acquisitions (n=7 patients) on CaF2 substrates.
72
Figure 27 Original spectral plot of averaged immersion spectra: 141 breast met
acquisitions, 138 colon/rectum met acquisitions, 127 GBM acquisitions, 194
lung met acquisitions, 102 melanoma met acquisitions, 157 normal brain
acquisitions and 93 oesophagus and stomach met acquisitions. Spectra have
been vector normalised and offset for visual clarity. The asterisks represent the
paraffin contributed peaks.
74
Figure 28 Discriminant function plot displaying the separation of breast met (1),
colon/rectum met (2), lung met (3) melanoma met (4) and oesophagus &
stomach met (5) based on the train set (red) and test set (blue) with a 95%
confidence limit represented by ellipse.
76
Figure 29 Discriminant function plot displaying the separation of primary breast (1),
primary colon/rectum (2), primary melanoma (3) and primary oesophagus &
stomach (4) cancers based on the train set (red) and test set (blue) with 99%
(outer ellipse) and 95% (inner ellipse) confidence limits.
78
Figure 30 Original spectral plot of averaged 95 primary breast acquisitions and 96 breast
met acquisitions (top left), 22 primary colon acquisitions and 22 metastatic
colon/rectum acquisitions (top right), 22 primary oesophagus & stomach
acquisitions and 22 oesophagus & stomach met acquisitions (bottom left) and
25 primary melanoma acquisitions and 20 melanoma met acquisitions (bottom
right). The spectra have been vector normalised, baseline corrected by 5th
order
polynomial fit and subtraction, and 7 points of smoothing
81

10
List of Tables
Table
Number
Title Page
Number
Table 1 Established biomarkers and the corresponding cancer they relate to. Adapted
from [1].
11
Table 2 Summary of tissues, reagents, instrumentation and materials used in the study 27
Table 3 Patient details with histological subtype and metastatic origin. 28
Table 4 Data showing tentative biomolecular assignments of main spectral peaks.
60
Table 5 Data showing PC-DFA model details, including spectral numbers and the
resulting sensitivities and specificities.
65
Table 6 Data showing Raman shifts of the main peaks from the PC-DFA loadings. 67

11
List of Abbreviations
AFM Atomic force microscope
ASS Anti-Stokes Scatter
AU Arbitrary units
BMUP Brain metastases of unknown primary
BTNW Brain tumour north west
CCD Charged coupled device
CNS Central nervous system
cnt Counts
CT Computed tomography
DFA Discriminant function analysis
DNA Deoxyribonucleic acid
DOB Date of birth
EDAX Energy dispersive analysis of x-rays
EM Electromagnetic
F Female
FFPP Formalin fixed paraffin preserved
FN False negative
FP False positive
GBM Glioblastoma Multiforme
gr grating
H&E Haematoxylin and Eosin
IR Infrared
Low-E low-emissivity
M Male
Mets Metastases
MRI Magnetic resonance imaging
PCA Principle component analysis
PET Positron emission tomography
SEM Scanning electron microscope
SL Scattered light
SS Stokes scatter
TN True negative
TP True positive
WHO World health organisation

12
Chapter 1
Introduction
1.1 Metastatic brain cancer
1.1.1 Introduction and epidemiology
More than one in three people in the UK will develop cancer at some point
during their lifetime and 50% of these individuals will die from the disease within 5
years of diagnosis. Cancer is responsible for one in four deaths and in 2010 it was
estimated that one person died from the disease every 4 minutes [1].
Metastatic brain tumours are intracranial neoplasms that originate from cancers
located outside the central nervous system (CNS), but have spread there via
haematogenous routes or invasion from surrounding tissue. Less than 1 in 100,000
people below 25 years old are reported to have brain metastases, this occurrence
increases to approximately 30 individuals per 100,000 above the age of 60 [2].
Currently, no significant association has been observed between gender and tumour
incidence [2]. It is estimated that 20–40% of cancer patients develop brain metastases,
making them the most common form of intracranial neoplasm in adults [3].
Approximately, 13,000 people in the UK are diagnosed with tumours of the brain every
year, of which, 60% are reported to be metastatic tumours [4].
Any malignant tumour has the potential to metastasise to the brain; however, the
location of the primary tumour is highly dependent on its probability of doing so. Lung
cancer is the most common primary cancer to metastasise comprising 50% of all brain

13
metastases, breast cancer constitutes 15–25%, and melanoma cancer is responsible for
5–20% of all metastases, the remaining 5-30% occur as a result of other primary
cancers. Renal and colon cancers are also known to commonly metastasise to the CNS.
The primary cancer site is frequently known before the diagnosis of a metastatic brain
tumour. However, nearly 30% of metastases are detected either before or at the time of
primary diagnosis [5] and approximately 15% of primary tumour locations remain
unknown. Identification of the primary tumour significantly increases the efficiency of
the cancer treatment, and thus patient survival [6].
Over 80% of brain metastases are located in the cerebral hemispheres, due to its
mass and blood supply [7], roughly 10–15% are situated in the cerebellum and 1–3%
are found in the brainstem [8]. About 50% of metastatic brain tumours exist as the only
metastasis in the brain but very rarely do they exist as the only metastasis in the body
[2]. Breast, colon and renal cancers typically produce only a single metastasis, whereas
lung and melanoma cancers are often responsible for multiple metastases. Although,
MRI studies suggest that the number of patients with single metastases is lower than
previously thought. The number of brain metastases present is important due to the
influence it has over the selected treatment; and thus all existent metastases should be
identified [9].
1.1.2 Carcinogenesis
Carcinogenesis is a multistage process whereby cells progress into cancerous
cells, and is typically divided into three stages: initiation, promotion and progression
[10]. Figure 1 diagrammatically shows the basic process of carcinogenesis. Initiation
occurs when exposure to a chemical carcinogen, radiation or other insults results in an

14
interaction with an organism, causing a change to its molecular deoxyribonucleic acid
(DNA) structure; hence, mutations arise during DNA synthesis. It causes an
irreversible increase in the susceptibility of a cell to develop cancer, but does not
necessarily alter its morphology. Promotion occurs when clonal expansion of the
initiated cell, due to genetic alteration, results in the formation of a benign tumour. In
the progression stage, the benign tumour becomes malignant, invades local tissue and
has the potential to metastasise. At this point, genetic instability increases and karyotype
alterations occur [10-12].
Figure 1: The basic process of carcinogenesis. (Adapted from [13]).
A stable equilibrium between cell proliferation, growth arrest and
differentiation, and apoptosis is successfully controlled in normal tissue. Alterations to
the homeostatic mechanisms that control this stability can result in tumour formation.
The disparity between cell proliferation and apoptosis causes an increase in tissue mass.
[11]. Cell proliferation is the production of cells, through replication, needed for normal
growth and development. The majority of normal human cells have the ability to divide
once or twice a day, thus replication must be controlled to prevent over-proliferation.
Differentiation is when cells become specialised and is directly related to a cells ability
to proliferate. The differentiation of a cell is tightly regulated in normal tissue.

15
Apoptosis refers to cell death and is essential for homeostatic maintenance in normal
tissue. In neoplastic tissue, the following cellular functions are usually incorrectly
regulated: cell proliferation is not controlled effectively, cell differentiation is distorted,
chromosomal and genetic organisation is weakened and apoptosis is inefficiently
monitored [14].
Cells that are neoplastic exhibit cytological differences including: increased
nuclear material, increased nuclear-to-cytoplasmic ratio, increased nuclear staining,
abnormal nuclear shape and size, abnormal chromatin distribution, decreased
differentiation and increased mitotic activity [15]. The conformations and quantities of
nucleic acids, proteins, lipids and carbohydrates are also altered when a normal cell
becomes neoplastic. These morphological and biochemical changes vary between the
type and location of the cancer [16].
Benign tumours are rarely fatal, but can cause health problems depending on
their anatomical location. Malignant tumours, on the other hand, progress and usually
result in mortalities if the tumour goes unnoticed or treatment is not successful.
Malignant tumours are typically differentiated from benign tumours by
histopathological observation of invasion and identification of tumour metastasis within
the tissue [17].
A metastasis occurs when cancer cells detach themselves from the malignant
tumour and travel to other sites where they form deposits [18]. Within 24 hours of
tumour cells entering the blood stream only about 0.1% is still viable, and of those, only
0.01% will go on to produce metastases; consequently, only a minority of primary
malignancies result in the formation of metastases at other locations [19]. The process

16
of metastasis from the primary cancer to a secondary organ is displayed in Figure 2.
Tumour cells are genetically less stable than normal cells [20] and are highly
heterogeneous. Cells with a high metastatic potential have been reported to have a
higher rate of mutation than those with a low metastatic potential and thus may
genetically differ from their primary cells [19]. Conversely, comparative genomic
hybridisation has produced data showing a high level of conformity between brain
metastases and their corresponding primary cancers at a chromosomal level [21].
Figure 2: Schematic diagram showing the process of metastasis. Replicated from [19].

17
1.2 The diagnostic modalities of metastatic brain cancer
1.2.1 Associated symptoms of brain cancer
The symptoms associated with brain tumours can be produced as a result of an
increase in intracranial pressure caused by the tumour mass and have a significant
impact on a patient’s quality of life. Approximately, 66% of people with brain
metastases exhibit neurological symptoms at the time of diagnosis, including:
headaches, seizures, altered vision, neurocognitive dysfunction and strokes, however,
the other 33% do not [8]. The prognosis of patients is poor and individuals are expected
to live only a few months after diagnosis of the brain metastasis [22]. The accurate and
rapid diagnosis of disease allows early intervention of the correct treatment. This leads
to an increase in life expectancy and quality of life for the patient, which in turn relieves
economic resources within healthcare [23]. Currently, diagnosis of a brain tumour is
carried out by a series of various components, comprising of: medical history, physical,
neurological and laboratory examinations [24].
1.2.2 Preoperative diagnosis
At present, neurological examinations consist of brain scans, such as magnetic
resonance imaging (MRI), computed tomography (CT) and positron emission
tomography (PET), to initially detect and assess the suspected brain tumour [25]. These
imaging techniques allow non-invasive, in vivo monitoring of the brain enabling
analysis of the existent mass, its tumour margins and its location [24]. These
examinations are only used as a preliminary assessment due to the risk of misdiagnosis
when using the aforementioned methods alone for identification of tumours. False

18
positive (FP) diagnoses of either metastatic or primary cancers occur in 11% of patients
with brain lesions when based only on the MRI scan. Further examinations must be
conducted to allow a more accurate diagnosis [26].
1.2.3 Biomarkers
Biomarkers are used in population screening studies, disease diagnosis,
prognosis and monitoring. Biomarkers have been identified through techniques such as
immunological assays [27]; Table 1 shows a selection of the biomarkers that are
currently used for cancer detection. Biomarkers have the potential to be very beneficial
for population screening and early disease detection. However, they are not universally
accepted as their specificities and sensitivities are not high enough and false positives
occur too frequently. It is thought that the most single powerful biomolecules have
already been identified and thus sensitivities and specificities can only improve by the
identification and analysis of multiple biomarkers to enable cancer diagnosis [27].
Table 1: Established biomarkers and the corresponding cancer they relate to. (Adapted from [27]).
Biomarker Cancer
α-Fetoprotein (AFP) Hepatoma; testicular cancer
Carcinoembryonic antigen (CEA) Colon; breast; lung; pancreatic
PSA Prostate cancer
CA125 Ovarian cancer
CA15.3 Breast cancer
CA19.9 Gastrointestinal
Immunoglobulins B cell discrasias
Chroriogonadotropin (hCG) Testicular cancer
Steroid hormone receptors Breast cancer

19
1.2.4 Histopathological diagnosis
The current method of choice for diagnosing metastatic brain tumours and their
primary sites is histopathological analysis of stained tissue sections. Staining is carried
out in order to visualise cellular components. Haematoxylin and Eosin (H&E) staining
is the most common and well established method for staining tissue sections for
examination of cancers. Haematoxylin dyes the nuclear component of cells blue and
eosin dyes the cytoplasm and connective tissue pink [28]. Neoplasms are identified
histologically by increased cellular crowding and disorder in the tissue [16]. Analysis
consists of assessment of the morphology, architecture and staining of the tissue.
However, this method of diagnosis requires a trained neuropathologist, is invasive and
has a lengthy processing time, delaying treatment. Histopathological examination is also
a highly subjective method of diagnosis [29, 30] and it has been reported that
pathological diagnostic discrepancy can occur in 1-43% of specimen [31, 32]. False
negatives (FN) may occur as a result of the biopsy procedure failing to locate and
remove the abnormal lesion leading to only normal tissue being analysed. Treatments
are then chosen based only on the histopathological diagnosis which could potentially
be life threatening [33].
Adenocarcinoma is the most frequent type of primary cancer for brain
metastases of unknown primary (BMUP). Tumours can be poorly differentiated in
adenocarcinomas and the resulting brain metastases. The microscopic appearance of
adenocarcinoma metastases from different primary locations is similar, and
consequently impairs histopathological examination and hence diagnosis. The
development of diagnostic techniques that can accurately identify the primary cancer

20
origin from analysis of the metastatic brain tissue alone is needed to allow early
intervention and correct treatment in order to increase patient survival time [34].
1.3 Raman Spectroscopy
1.3.1 Fundamentals of Raman spectroscopy
Raman spectroscopy is based on the interaction of electromagnetic radiation, in
the form of monochromatic light, with matter. Light is scattered either elastically or
inelastically as it hits the sample. The majority of light is elastically scattered, known as
Rayleigh scattering, and does not involve an exchange in energy between the incident
light and the molecules within a sample. Rayleigh lines are thus scattered at the same
frequency as that of the incident light. Inelastically scattered light, known as Raman
scattering, involves an energy exchange between the incident light and the molecules
within a sample in accordance with quantal laws [35]. Raman scatter is less intense than
Rayleigh scatter and generally comprises no more than 0.001% of the total scattered
light [36]. The energy change (ΔE) must be equal to the difference in energy between
two allowed states of the molecule, thus, representing a change in the molecules
rotational or vibrational energy. When a molecule gains energy photons will be
scattered with hѵ-ΔE and the light will have a frequency of ѵ-ΔE/h. Conversely, if a
molecule loses energy, photons will be scattered with hѵ+ΔE and the light will be
scattered with a frequency of ѵ+ΔE/h. Where hѵ is the photon energy, ѵ is the radiation
frequency and h is Planck’s constant [35]. Scattered light (SL) with a lower frequency
to that of the incident light is called Stokes scattering (SS). This is where energy is
transferred from the incident light to the molecule; the excited molecule does not return

21
to its ground state from the virtual state, but to its vibrational state, and a lower energy
photon is emitted. Scattered light of a higher frequency to that of the incident light is
called Anti-Stokes scattering (ASS). This is where the molecule is already at its
vibrational state, due to prior excitement or thermal disturbance, and the molecule is
excited to a virtual state. Energy is transferred to the incident light from the molecule,
returning it to its ground state, and a photon of higher energy is emitted [37, 38]. Figure
3 displays a basic diagram of energy levels for Rayleigh and Raman: Stokes and Anti-
Stokes scatter.
Figure 3: Energy level diagram for Rayleigh and Raman scattering. (Adapted from [39]).
If a molecule is exposed to a static electric field it becomes distorted as the
positively charged nuclei are attracted toward the negative pole and the negatively
charged electrons are attracted toward the positive pole. The charge centre separates and
an induced dipole moment occurs as a result, the molecule is polarised. A change in the

22
polarisability, reflected in the magnitude or direction of the polarisability ellipsoid, must
be caused by molecular rotations and vibrations for its modes to be Raman active. The
number of normal vibrational modes a molecule has can be calculated by the degrees of
freedom: either 3N-5 for linear molecules, such as CO2, or 3N-6 for non-linear
molecules, such as H2O; where N represents the number of atoms in the molecule. The
vibrational modes of a molecule can include symmetric stretching, asymmetric
stretching and bending, but not all vibrational modes will be Raman active (Figure 4)
[35].

23
Figure 4: Diatomic and polyatomic modes of vibration (adapted from [35]).
1.3.2 Application of Raman spectroscopy in cancer diagnostics
Raman spectroscopy measures the energy shift and intensities of scattered
photons [40]. It is both a quantitative and qualitative technique which is able to provide
molecular information about samples from their spectra, regarding conformation and

24
composition [41, 42]. The frequencies and intensities of Raman bands are based on the
atoms involved, the conformations and the chemical environments of the bonds, and
their concentrations within a molecule; and are thus unique to specific molecules,
enabling the production of characteristic spectra and the identification of molecules
within a sample [43].
Raman spectroscopy is a non-destructive technique which is able to analyse
samples in any state, without extensive solvent use or sample preparation. It is a rapid
and economical method of analysis. Moreover, it is a relatively low-risk and easy
technique to use [44]. Measurement of a single cell can be achieved with Raman
spectroscopy due to its good spatial resolution [45]. It is a non-ionising technique and
water presence does not significantly alter spectra produced, as it is a weak light
scatterer. With the use of fibre optic probes, Raman spectroscopy can be used for in vivo
measurements, giving it an advantage over other vibrational techniques, such as infrared
spectroscopy, which is highly affected by H2O absorption bands in spectra [46] [47].
With the use of deep Raman spectroscopic techniques, measurements can be made up to
several millimetres into tissue samples [48].
Tumours that are not completely resected during surgery to remove all
neoplastic and pre-neoplastic cells have a greater chance of reoccurrence [49]. Within
five years after simple surgical excision of the tumour, cancer recurrence is reported to
occur in 10.1% of basal cell carcinoma cases [50]. There cannot be an application of
safety margins for the excision of brain tumours, as there is in extracerebral cancers, due
to the brain’s high level of functional responsibility. Thus, accurate identification of
tumour margins is essential for an optimistic prognosis [51]. The advantage of in vivo
analysis that Raman spectroscopy offers allows real-time analysis of tissue. This can aid

25
tumour margin identification during surgery, help direct biopsies to enable complete
removal of cancerous tissue [52], whilst preserving the surrounding healthy tissue [53].
When analysing biological tissue at short wavelengths, below 500 nm, Raman
spectroscopy can suffer from intense spectral backgrounds, thought to be as a result of
fluorescence, which can significantly affect the quality of the spectra. The use of near
infrared (NIR) lasers, such as 785 nm, to irradiate the sample reduces this phenomenon;
as wavelengths in this region do not typically induce the electronic transitions in tissue
chromophores that contribute to fluorescence. Dispersive Raman spectrometers enable
the use of 785 nm lasers and help to reduce the spectral background that can result when
analysing biological materials. Charged coupled device detectors are employed in
dispersive instruments and have assisted the development of portable Raman
spectrometers [54].
Immersion Raman spectroscopy utilises an immersion lens which is in direct
contact with an appropriate liquid, such as deionised water, which covers the sample
under analysis. Bonnier et al. [55] describe and demonstrate the successful use of
immersion Raman spectroscopy for both live cell and in vitro tissue specimens on CaF2
substrate, and observe the improvement of spectral quality, sample stability and the
reduction of spectral background [55, 56]. They determined that fluorescence,
contributing to spectral background, is only significant at short wavelength laser
sources, as proteins typically only fluoresce with wavelengths below 500 nm. Hence,
the background of spectra acquired using 785 nm lasers should not be attributed to
fluorescence but to sample morphology, associated with scattering of the incident light
and Raman lines that cause non-collimated entry into the spectrometer. The exchange of
a tissue/air interface with a tissue/liquid interface results in more uniform refractive

26
indices thus, reducing this level of stray light, and in turn, the intensity of the spectral
background. Submerging the sample in liquid also protects tissue specimens from
photo-damage. In turn this enabling more powerful lasers of shorter wavelengths to be
used and longer acquisition times and a higher number of accumulations to be
employed, hence, improving spectral quality [55-57].
The potential of Raman spectroscopy as a diagnostic tool for diseases has been
demonstrated by a variety of studies [33, 58-69]. Many papers have shown the ability of
Raman spectroscopy to diagnose cancers, including: brain cancers using tissue on low-
E microscope slides and CaF2 slides [58, 59], lung tumours through the analysis of
bronchial tissue sections [60], gastric adenocarcinomas using tissue samples [61, 62],
non-melanoma skin cancers from the analysis of tissue in vivo [63], laryngeal cancers
from tissue at endoscopy [64], breast cancers using both fresh and frozen tissue
specimens [65, 66], cervical cancers from tissue in vivo [67], bladder and prostate
cancers from tissue sections [68, 69] and oesophagus and colon cancers through the
analysis of snap frozen tissue on CaF2 [33].
1.3.3 Raman spectra of cancerous tissue
Significant biochemical differences should be present between neoplastic and
healthy tissue that arise as a result of an alteration in biological processes [70]. When a
tissue becomes diseased, molecular composition is altered, DNA concentrations in the
cell increase and the amounts of other components in the cell vary compared with non-
diseased cells [71]. These molecular changes should be expressed in its vibrational
spectra, enabling the spectral discrimination between diseased and healthy tissue. As a

27
result, significant spectral differences can act as markers for the identification of
specific diseases [52].
Gajjar et al. [58] observed significant (P ≤ 0.0001) differences between the
Raman spectra of brain tumour tissue and healthy brain tissue at the following spectral
points: 1483 cm-1
(CH2 bend), 852 cm-1
(tyrosine and proline), ≈ 1235 cm-1
and 1276
cm-1
(Amide III), 1654 cm-1
(Amide I) and 997 cm-1
(phospholipids and glucose-I-
phosphate). They also reported the ability of Raman spectroscopy to successfully
discriminate between different brain tumour types. They observed that metastatic brain
tissue could be differentiated from healthy brain tissue at the following spectral points:
997 cm-1
(phospholipids and glucose-I-phosphate), 1077 cm-1
and 1446 cm-1
(lipids and
proteins), 1241 cm-1
(Amide III), ≈ 1460 cm-1
(cytosine) and 1654 cm-1
(Amide I) [58].
The Raman spectra of biological samples can be largely affected by artefacts.
Gaussian noise, as a result of fluorescence of the sample or thermal fluctuations on the
charged coupled device (CCD), can result in unwanted intense backgrounds. The result
of this effect needs to be reduced prior to data analysis through background correction
pre-processing methods. Cosmic spikes can also occur in the spectrum, caused by high
energy particles hitting the CCD, but this effect can be eliminated during measurements
by accumulating the spectra more than once [72].
1.3.4 Raman Spectroscopy Substrates
Substrates are needed in Raman spectroscopy to support the samples during
analysis. Samples are often relatively thin allowing incident light the opportunity of
interacting with the substrate below. This interaction has an effect on the spectral

28
background; thus, the correct choice of substrate for Raman analysis is essential for
reducing this background and optimising the quality of the spectral data [57].
Common spectroscopy substrates used currently include quartz, calcium fluoride
(CaF2) and low-emissivity (low-E) microscope slides. Spectrosil, a type of quartz
substrate, is approximately 0.5 mm thick, has a perimeter of 7.5 cm x 2.5 cm and costs
typically £9.00 per slide. CaF2 is approximately 1 mm thick, has a perimeter of 2.5 cm x
2.5 cm and costs £35 per slide. MirrIR, a low-E slide, is approximately 2 mm thick, has
a perimeter of 7.5 cm x 2.5 cm and costs £1.50 per slide. Low-E substrates are glass
slides that are coated with a metallic reflective coating, such as tin oxide/silver,
allowing high transmission of visible light [73].
Draux et al. [74] investigated the use of different optical substrates for Raman
measurements of live cells. The substrates they analysed were CaF2, quartz and zinc
selenide (ZnSe). They reported that ZnSe is toxic to living cells and hence were unable
to take measurement of the live cells using this substrate. They found that both the CaF2
and quartz produced Raman spectra with comparable signal-to-noise ratios and that
neither substrate interfered with the obtained results. Although, they concluded that due
to quartz having no effect on cell growth and morphology, it is the best substrate to use
for Raman spectroscopic measurement of live cells [74].
1.4 Dewaxing of Paraffin embedded tissue samples
Raman spectroscopy can analyse tissue samples in a variety of different
conditions. These most commonly consist of tissues that have been formalin fixed
paraffin preserved (FFPP), frozen, and fresh tissue. Using tissue in an unaltered state is

29
desirable for Raman analysis, but fresh tissue is not easily accessible and is difficult to
section [75]. Frozen and FFPP tissues are frequently used as alternatives to fresh tissue
due to better accessibility. FFPP tissue is often chosen over frozen tissue due to its long
preservation time, easy obtainability and storage and the ability to use it for carrying out
retrospective studies [76].
In order to prevent degradation, by halting biochemical processes, biological
tissues must be fixed. The most frequently used fixative solution is formalin which uses
bonding reactions to work on tissue proteins [77]. Huang et al. [78] investigated the
impact of fixation on tissues; they observe formalin fixation artefacts at 980 cm-1
– 1100
cm-1
and 1480 cm-1
– 1650 cm-1
; yet, they report that the major Raman peaks for
proteins and lipids are not altered by formalin fixation. However, they conclude that
with a large focus being on in vivo applications, fresh tissue is always preferable for
analysis in order to generate results that would be more similar to those experienced in
clinical settings [78].
Tissue is often impregnated with a medium for preservation and to add support
to aid sectioning through microtomy. The most common and efficient medium for
embedding tissue sections is paraffin wax. The sections are dehydrated, washed in an
organic solvent, saturated with molten paraffin wax and are then left to cool to enable
the wax to solidify. FFPP tissue has to be dewaxed prior to spectroscopic analysis to
reduce the spectral contribution of the paraffin wax and allow the tissue to be as similar
to an in vivo state as possible for analysis [79]. Ó Faoláin et al. [79] observed that
paraffin wax contributes to Raman spectra at wavenumbers; 1063 cm-1
, 1133 cm-1
, 1296
cm-1
and 1441 cm-1
corresponding to C-C, CH2 and CH3 bonds as a result of its straight
hydrocarbon chain structure. They also reported a less intense peak at 1004 cm-1

30
n=Paraffin
Iso=Paraffin
Cycloparaffin
corresponding to the C-C bonds of an aromatic ring, due to a small number of
cycloparaffins [79]. The structure of paraffin is displayed in Figure 5. Xylene is
frequently the method of choice for dewaxing FFPP tissue sections due to its efficacy
and rapidity in doing so. However, associated problems such as its high toxicity and
flammability can lead to the use of histoclear as it is a suitable alternative. Histoclear is
not toxic or flammable and is biodegradable [79]. Ó Faoláin et al. [79] evaluated the
efficacy of these two common dewaxing solvents and also looked into the potential use
of hexane for dewaxing tissue. They observed that hexane is better at dewaxing FFPP
tissue than both xylene and histoclear; however, requires 18 hours of tissue submersion
in the solvent and is currently not an accepted solvent for dewaxing tissue sections [79].
Figure 5: Molecular structure of paraffin (Replicated from [79]).
Chemical dewaxing is not 100% efficient and can also alter samples. Digital dewaxing
methods have been developed, utilising the application of independent component
analysis, to identify and subtract paraffin peaks in the spectra [80].

31
1.5 Scanning Electron Microscope/Energy dispersive analysis of X-rays
Scanning electron microscopy (SEM) combined with energy dispersive analysis
of X-rays (EDAX) is used to observe and analyse specimens microscopically, and
tentatively identify and quantify the elements present in samples. SEM is based on the
detection of secondary electrons and it takes place under vacuum to enable an optimum
mean free path, so the electrons are not scattered. An electron gun emits high energy
electrons which are focused into a small-diameter electron probe by magnetic lenses and
serially scanned across the specimen surface by scanning coils. When the primary
electron beam hits the surface of the specimen, secondary electrons are knocked loose
from its surface. These electrons are detected and then amplified to produce an image of
the specimen, created using the count of secondary electrons at each scanned point
along the surface. Instrumental resolution is typically between 1 nm -10 nm [81, 82].
Samples are often placed on aluminium stubs for analysis and held there using
carbon tape which enables good electrical contact between the sample and the
aluminium stub. Samples are illuminated with a high energy beam of electrons; thus,
SEM analysis requires samples to be good electrical conductors. A sputter coater is used
prior to SEM analysis which coats samples with gold to ensure they conduct electricity
[83].
EDAX uses X-rays, which are generated as a result of the interaction between a
high-energy electron beam and a solid, to produce a chemical spectrum of the analysed
material. Essentially, all elements with atomic numbers 4 to 92 can be detected. It is
both a qualitative and quantitative technique for the analysis of elemental components
within materials. For qualitative analysis, detection of the specific x-ray wavelengths is

32
required. Quantitative analysis requires measurement of the intensities of the
wavelengths for each element, which are compared with the intensities produced from
known calibration standards [84].
1.6 Study aims and rationale
1.6.1 Working hypothesis and rationale
The working hypothesis of this study is that Raman spectroscopy will be able to
discriminate metastatic brain tumours from normal brain and GBM tissue based on
Raman spectra.
Current detection methods for metastatic brain cancer have a long diagnostic
window, require highly trained personnel and are subjective. Raman spectroscopy can
provide non-subjective, minimally invasive, non-destructive, rapid and economical
diagnosis and would thus be an ideal method for diagnosing metastatic brain cancer
[85].
1.6.2 Main aim of study
The primary aim of this study was to assess the diagnostic potential of Raman
and immersion Raman spectroscopy for metastatic brain cancer. This was done by
analysing metastatic, normal and GBM brain tissue, to identify if any spectral
differences can be observed.

33
1.6.3 Secondary aims of study
A further aim of this study was to investigate the ability of Raman spectroscopy
to identify the primary cancer site of origin of brain metastases. This was conducted by
analysing metastatic brain tissue from various primary cancers of: lung, breast,
oesophagus and stomach, colon/rectum and melanoma, and identifying if any spectral
differences are present that can demarcate the groups and thus enable identification of
the primary cancer.
The study also involved an investigation into the effect of spectroscopic
substrates on tissue preparation methods and the outcome of spectra. This was carried
out by comparing the background and tissue spectra produced from Raman
spectroscopy of three common substrates: CaF2, Spectrosil quartz and Low-E, to
analyse the quality of both the spectra and the dewaxing procedure.
A comparison between Raman and immersion Raman spectroscopy, using a 785
nm laser, was carried out to ascertain which method yields better quality spectra for
spectral histopathology. This involved an examination of the tissue spectra produced by
both methods.
Raman spectroscopy can be carried out using a variety of wavelengths for the
incident laser. This study evaluated the differences in the resulting spectra of tissue
samples produced from Raman spectroscopy using a 532 nm laser line and a 785 nm
laser line. This was carried out in order to assess which wavelength laser produces the
better quality spectra for the specimens in this study.

34
Chapter 2
Materials and Methods
2.1 Summary of materials used in the study
Table 2 displays a summary of all the materials employed to carry out this study.
Table 2: Summary of tissues, reagents, instrumentation and materials used in the study
Tissue Reagents Instrumentation Materials
Normal brain Ethanol Raman spectrometer Spectrosil substrate
Metastatic brain Haematoxylin microtome CaF2 substrate
Colon/rectum Eosin Desiccator Low-E substrate
Oesophagus/stomach Deionised water SEM-EDAX
Breast Atomic force microscope
Skin Optical microscope
2.2 Study participants
Tissue samples were obtained from formalin fixed paraffin preserved (FFPP)
tissue blocks from the Brain Tumour North West (BTNW) bio-bank under ethical
approval (BTNW/WRTB 13_01). Patient data consisted of histological information,
patient gender and date of birth, origin of metastasis/histological subtype. A total of 48
tissue specimens were obtained from 41 different patients. Tissue consisted of normal
brain samples (n=7), glioblastoma multiforme (GBM) brain samples WHO (world
health organisation) grade IV (n=5), metastatic brain samples (n=29) and primary
cancer tissue samples (n=7). The normal tissue all had a normal microscopic appearance
with no detectable tumour present, coming from patients with meningiomas, aneurisms,
chondrosarcomas, oedematous changes or no disease. Table 3 displays further
information about the tissue specimens. Sections were cut, by microtomy, at both 4 µm

35
onto glass microscope slides and 10 µm onto spectroscopic substrates: low-E MirrIR
slides (Kevley Technologies, Chesterland, OH, 44026, USA), Spectrosil quartz (Starna
Scientific) and calcium fluoride (CaF2) (Crystran).
Table 3: Patient details with histological subtype and metastatic origin.
BTNW no. Gender DOB Origin of metastasis/histological
subtype
119 F 26/06/1963 Breast (met and primary site)
707 F 07/08/1945 Breast (met and primary site)
756 F 15/03/1957 Breast (met and primary site)
888 M 25/11/1948 Colon/rectum (met and primary site)
985 M 05/02/1933 Melanoma (met and primary site)
988 M 30/12/1949 Oesophagus & stomach (met and
primary site)
1001 F 20/12/1944 Lung (met only)
690 F 25/10/1960 Breast (met and primary site)
1004 F 03/09/1956 Breast (met only)
998 M 25/07/1946 Colon (met only)
1020 F 05/06/1948 Breast (met only)
2 F 28/10/1937 GBM
3 F 22/09/1981 GBM
4 M 08/12/1942 GBM
5 F 29/10/1958 GBM
7 M 14/04/1939 Normal Brain
10 F 13/06/1929 GBM
78 F 24/09/1955 Lung (met only)
106 F 14/02/1965 Normal Brain
132 F 24/06/1943 Normal Brain
136 F 25/09/1956 Normal Brain

36
137 M 26/04/1944 Colon/rectum (met only)
164 M 10/04/1954 Oesophagus & stomach (met only)
184 F 21/11/1948 Lung (met only)
215 M 21/01/1973 Lung (met only)
274 M 12/07/1940 Colon/rectum (met only)
295 F 12/06/1936 Lung (met only)
358 M 08/05/1935 Melanoma (met only)
409 F 08/08/1925 Colon/rectum (met only)
444 M 30/01/1978 Normal Brain
509 M 11/02/1930 Melanoma (met only)
517 F 05/06/1955 Lung (met only)
521 M 18/01/1949 Oesophagus & stomach (met only)
562 F 12/03/1953 Lung (met only)
567 F 09/04/1947 Melanoma (met only)
668 F 30/08/1943 Colon/rectum (met only)
678 F 13/11/1961 Normal Brain
688 F 15/06/1965 Melanoma (met only)
694 M 18/09/1951 Lung (met only)
721 F 04/01/1976 Oesophagus & stomach (met only)
772 M 21/09/1972 Normal Brain
2.3 Tissue preparation for histological examination
Tissue sections on the microscope slides needed to undergo staining with
Haematoxylin and Eosin (H&E) for parallel histological examination; to allow
microscopic examination the sections cannot be too thick and 4 µm is standard. Using
standard procedures, the sections were de-waxed before staining by: 2 x 5 minute baths
of histoclear followed by 2 x 5 minute baths of ethanol. The tissue sections were

37
washed in distilled water for 5 minutes after de-waxing, prior to H&E staining. Sections
were bathed in haematoxylin for 5 minutes and then washed in warm tap water to allow
the nuclei to turn blue. The sections were then covered in eosin for 4 minutes and rinsed
with distilled water. Finally, the tissue sections were dehydrated in 2 x 5 minute baths of
ethanol and cleared in 2 x 5 minute baths of histoclear, and then protected and preserved
through the application of histomount and a coverslip. The sections were then
microscopically examined in order to identify the metastatic sites present in the tissue.
2.4 Tissue section preparation for Raman spectroscopic analysis
The tissue sections on Raman substrates must be thick enough for spectral
analysis, to avoid large amounts of substrate contribution to the spectra, and needed to
be de-waxed prior to Raman analysis in order to reduce paraffin peaks in the spectra.
The de-waxing procedure, consistent with standard procedures [58], was carried out by
an initial 3 x 5 minute baths of histoclear followed by 3 x 5 minute baths of ethanol. The
sections were left to air dry for 30 minutes, placed in a Petri dish and stored in a
desiccator until spectroscopic analysis.
2.5 Raman spectroscopy instrumentation and analysis
Spectroscopic measurements were carried out using a Horiba Jobin-Yvon
LabRAM HR800 spectrometer (Figure 6). An air cooled CLDS point mode diode 785
nm laser with a single edge filter (cut off to 100 cm-1
) and an output power of 300 mW
was used to acquire spectra. A narrow bandwidth, solid state diode 532 nm laser with
single edge filter (120 cm-1
) and an output power of 50 mW was also used for spectral

38
acquisition. The aforementioned lasers were used with gratings of 300 gr/mm and 600
gr/mm respectively and blazed at 1000 nm for the near-infrared region and 500 nm
respectively. Non-immersion point spectra were acquired using a 0.9 (x 100) (MPlanN)
objective, with a 1 µm spot size, non-immersion spectral maps were collected using a
0.75 (x 50) (MPlanN, Olympus) objective and immersion point spectra and maps were
taken using a 1 (x 60) objective (LUMPlanFLN, Olympus), with a 1.5 µm spot size. The
confocal hole was set at 100 µm for the 785 nm spectral collections and 200 µm for the
532 nm spectral collections. The detectors used were an Andor electromagnetic (EM)
CCD and a Synapse CCD, with 1024 x 256 pixels and cooled at –70 o
C, for the laser
line 785 nm and 532 nm respectively. The spectra were measured across the wavelength
range of 400 cm-1
–1800 cm-1
.
Figure 6: Horiba Jobin-Yvon LabRAM HR800 Raman spectrometer.

39
The instrumentation was calibrated before operation to silicon at the spectral line
at 520.8 cm-1
. Spectra collected using a 100% exposure 785 nm laser were acquired for
30 seconds and accumulated twice, with both the immersion and non-immersion
objectives. Spectra collected using the 532 nm laser were 100% exposed with an
acquisition time of 4 seconds and accumulated twice. Three to five areas were used to
produce at least 20 spectra per tissue sample, targeting the nucleus of cells. A total of
3054 spectra were generated through the production of at least 20 spectra from three to
five areas on each tissue samples, depending on size, to enable the production of results
that are good representations of each sample. Immersion Raman spectroscopy consisted
of tissue submersion in deionised water which was then placed in direct contact with the
immersion objective lens.
Spectroscopic measurements of the paraffin wax were carried out on a Horiba
Jobin-Yvon LabRAM HR800 confocal Raman Spectrometer (Figure 7). The detector
used with this system was an air-cooled open electrode 1024 x 256 pixel CCD detector.
A x 50/0.55 long working distance microscope objective (PL FLUOTAR, Leica) was
employed for the measurements. Spectral acquisition was carried out for 30 seconds and
accumulated twice using a 785 nm laser as the incident source with a filter set to 100%.
The 785 nm laser line has an output power of 400 mW and has a power at the sample of
100 mW.

40
Figure 7: The Horiba Jobin-Yvon LabRAM HR800 confocal Raman Spectrometer used to take paraffin
wax measurements.
2.6 Data pre-processing and multivariate analysis
Pre-processing and multivariate analysis were carried out on the raw data using
LabSpec 6 spectroscopy software suite (HORIBA Scientific) and MATLAB version
7.11.0 (R2010b) (The MathWorks, Inc., USA) using in-house written software.
Pre-processing of the data was kept minimal to allow a better level of
reproducibility. Initially, all the data were subjected to a visual quality test to ensure
only adequate spectra were included in the analysis. Vector normalisation was applied
to all the raw data in MATLAB using codes written by Dr A. Henderson. Biological

41
samples are heterogeneous and the environmental and instrumental settings are
changeable, thus, normalisation is applied to mathematically account for this
inconsistency through the identification of non-disease attributed variability between the
data prior to adjustment [86]. A fifth order polynomial fit was applied and then
subtracted to each of the spectra followed by 7 point smoothing in the LabSpec 6
software. A polynomial fit is a method of baseline correction whereby non-constant,
low frequency baselines are adjusted for. Smoothing is a method of local averaging that
is applied to the data to produce de-noised spectra [86]. Paraffin peaks were manually
removed from the spectra for multivariate analysis at the following wavenumbers: 882
cm-1
- 912 cm-1
, 1051 cm-1
- 1071 cm-1
, 1115 cm-1
- 1143 cm-1
, 1163 cm-1
– 1187 cm-1
,
1284 cm-1
– 1305 cm-1
and 1407 cm-1
– 1501 cm-1
.
Multivariate analysis was then carried out on the spectral set, employing
principal component-discriminant function analysis (PC-DFA). Principle component
analysis (PCA) is an unsupervised method of identifying patterns in data, and
expressing the data in such a way to highlight similarities and differences. PCA can be
used to reduce the dimensionality of the dataset prior to DFA. Spectra for PC-DFA were
organised into two sets: a training set and a blind test set. DFA is a supervised
technique, based on the PCs and the DFA algorithm’s prior informed knowledge of
group memberships. It maximises the intergroup variance and minimises the intragroup
variance. Hence, discrimination between groups is achieved. The PC-DFA model was
tested by a blind test set using one third of the total dataset which was randomly
selected, supplied to the model and then analysed on a graphical output by identifying
what group they were classified as belonging to [87].

42
Error ellipses were used to highlight 90%, 95% and 99% confidence limits on
the PC-DFA graphical output, using error_ellipse.m written by A.J. Johnson and
obtained from Matlab central file exchange. These were formed by calculated the
covariance matrices from the discriminant function score matrix. The mean of each data
group defined the centroid of the ellipsoid.
The classification sensitivities and specificities were calculated from the DFA
score plot based on the error ellipses. This study investigated three different PC-DFA
models. Sensitivity is the percentage of a population with a disease that are classified as
positive and specificity is the percentage of a population without a disease that are
classified as negative [88] .
Sensitivity = [TP/TP+FN] x 100
Specificity = [TN/TN+FP} x100
Where:
TP = true positive
- Number of spectra correctly classified as cancerous
FN = false negative
- Number of spectra incorrectly classified as not-cancerous
TN = true negative
- Number of spectra correctly classified as not cancerous
FP = false positive
- Number of spectra incorrectly classified as cancerous
[89]

43
2.7 SEM-EDAX
The FEI Company Quanta series 200 SEM/EDAX, with an xT microscope
system, was used to generate microscopic images and produce information on elemental
composition of the three substrates. The substrates were coated in gold prior to
SEM/EDAX analysis and situated on a carbon tape for analysis.
2.8 Atomic force microscope (AFM)
The atomic force microscope (AFM) model used to image the samples for
surface morphology for this study is the MFP-3D-BIO (Asylum Research), with
Olympus silicon AC160 cantilevers. The tips were 160 nm long with resonant
frequencies typical of 320 kHz. A/C mode was employed for operation to reduce
tip/sample interaction.
2.9 Statistical Analysis
All data were analysed using relevant statistical test. All data were analysed
using in-house written software on Matlab. The data was interrogated using PCA and
PC-DFA methods. All experiments were performed more than three times to ensure
reproducibility of the results.

44
Chapter 3
Results and Discussion
3.1 Microscopic examinations of H&E stained sections
Figure 8 shows the microscopic images of the H & E stained tissue specimens at
x 100 magnification of normal brain, GBM, Oesophagus and stomach metastasis, breast
metastasis, colon/rectum metastasis, lung metastasis and melanoma metastasis. It can be
observed that normal brain, metastatic brain and GBM brain tissue architecturally differ
from one another and between the metastatic types.
Figure 8: Microscopic images of H&E stained tissue samples of normal brain, metastatic brain (from
oesophagus and stomach, breast, colon/rectum, lung and melanoma as labelled above) and GBM brain
WHO grade IV (x 100).

45
3.2 Substrate Study
Raman spectra were acquired of the three substrates: low-E, Spectrosil and CaF2
using the 785 nm laser under the same conditions, which display the spectral
‘fingerprints’ of the substrates, shown in Figure 9. This is to ascertain the impact of the
substrates’ contribution to the spectral background and hence establish their level of
interaction with the incident light source and the impact they have on the spectra of
tissue samples.

46
Figure 9: Original spectral plot showing raw spectra of the substrate backgrounds: low-E (top), Spectrosil (middle) and CaF2 (bottom).

47
It can be observed that low-E has the highest intensity baseline and CaF2 has the
lowest intensity baseline of the three substrates. The baseline of Spectrosil is slightly
higher than that of CaF2 and has apparent peak contributions at approximately 600 cm-1
and 800 cm-1
. These results indicate that the spectra taken from samples on CaF2 are
less affected by substrate background and should display spectral information relating
only to the sample of interest and low-intensity peaks more clearly than either low-E or
Spectrosil substrates.
Each substrate was analysed using the scanning electron microscope and energy
dispersive analysis of X-rays (SEM/EDAX) instrument, in order to assess the chemical
constituents present and microscopically observe the substrate surface. Figures 10-12
show the results of the analysis and the associated microscopic images of these
substrates. The Spectrosil substrate exhibits peaks of silicon and oxygen. CaF2 exhibits
peaks of calcium, fluoride and oxygen. Low-E substrates exhibit peaks of silicon,
oxygen, cobalt, nickel, magnesium sodium, palladium, silver, cadmium, tin and
calcium. The gold peak and carbon peak are not contributed by the specimen, but are
present as a result of the gold used to coat the samples and the carbon tape used to
situate the sample on.
The higher number of constituents present in the low-E substrate provides more
molecules that can interact with the incident laser of Raman spectroscopy. Thus,
providing an explanation for the substrate’s high spectral baseline when compared with
CaF2 and Spectrosil, which is only composed of two elements and three elements
respectively.

48
Figure 10: SEM-EDAX of Low-E substrate acquired from three different areas.

49
Figure 11 SEM-EDAX of Spectrosil substrate acquired from three different areas.

50
Figure 12 SEM-EDAX of CaF2 substrate acquired from three different areas.

51
Spectra were acquired of the tissue samples situated on the three different
substrates, under the same conditions using the 785 nm laser, to further ascertain the
level of influence substrate type has on the outcome of spectra. It can be observed from
the averaged, vector normalised spectra displayed in Figure 13 that the tissue spectra on
Low-E has a lower signal-to-noise ratio and the peaks are visually less clear and not as
distinguishable as those produced from tissue on either CaF2 or Spectrosil. The
discrepancy between the spectra on different substrates shows that the substrate used
has an effect on signal-to-noise ratio, and thus influences the resulting Raman spectra.

52
Figure 13: Original spectral plot showing the average of 458 CaF2 acquisitions (18 specimens from n=11 patients), 210 low-E acquisitions (10 speciments from n=10 patients and
465 Spectrosil (18 specimens from n=11 patients) acquisitions from all pathologies and a raw spectrum of paraffin wax. The tissue spectra have been vector normalised and offset for
visual clarity. The asterisks above the peaks correspond to the paraffin contributions.

53
A paraffin spectrum displays notable spectral peaks at 888 cm-1
, 1061 cm-1
,
1131 cm-1
, 1171 cm-1
, 1294 cm-1
, 1417 cm-1
, 1440 cm-1
, 1462 cm-1
, which can be
assigned to C-C stretching and CH2 and CH3 deformations within the molecule [79]. It
can be seen from Figure 13 that the spectra of tissue samples on Spectrosil and CaF2
still exhibit paraffin peaks after the samples have been dewaxed, however, dewaxed
tissue spectra from low-E substrates do not display any visible paraffin peaks.
In order to investigate any substrate effect on the dewaxing process, the wax was
analysed on each of the substrates without tissue present. Paraffin wax was cut at 10 µm
sections, the same thickness as that of the tissue sections, and mounted onto the three
different substrates. The wax was then left to melt onto the substrate for 20 minutes in
an oven set at 60 oC and allowed to cool. The paraffin only samples were then dewaxed
by the same method as the FFPP tissue samples and analysed; Figure 14 displays the
resulting vector normalised and background subtracted spectra. Spectrosil and CaF2
substrates continue to exhibit large paraffin peaks in their spectra, which correspond to
the peaks displayed in the spectra of paraffin, whilst the low-E substrate exhibits no
such peaks.

54
Figure 14: Original spectral plot showing vector normalised, background-subtracted spectra of substrates after dewaxing from: 1 CaF2 acquisition, 1 Spectrosil acquisition and 10
averaged low-E acquisitions. The raw spectrum of paraffin wax (bottom cyan spectra) is included as a reference. The spectra have been appropriately scaled and offset for visual
clarity.

55
From both Raman analysis and visual inspection it is clear that, using the same
dewaxing procedure, the low-E substrate is fully dewaxed, yet the CaF2 and Spectrosil
substrates retain paraffin wax. Residual wax, still present on both the Spectrosil and
CaF2 substrate, could be seen visually both macroscopically and microscopically
(Figure 15). Its presence is confirmed by paraffin peak contributions in their spectra.
The low-E substrate did not retain any visual paraffin wax and no paraffin peaks were
present in the 10 spectra taken at different points along the surface of the substrate. This
observation infers that the difference of surface chemistry, properties or morphology
between the substrates causes low-E slides to dispel wax more readily than either CaF2
or Spectrosil. This shows, for the first time, that substrate type has an effect on the
dewaxing process. The difference in dewaxing between Low-E, CaF2 and Spectrosil
slides will reflect in the spectra produced from specimen situated on these different
substrate types through their input of paraffin contributions.
Figure 15: Photographs showing microscopic Raman images at x 10 of the substrate surfaces after
dewaxing. Wax residuals can be observed on the CaF2 and Spectrosil substrates.
Atomic force microscopy (AFM) was used to analyse the three substrates’
surface composition. The AFM images of the three substrates are displayed in Figure
16, showing the surface morphology at a nanoscopic level. The low-E substrate was
observed to have a far smoother surface than either CaF2 or Spectrosil with an average

56
surface roughness of 1.10 nm compared to 4.76 nm and 3.88 nm respectively. Low-E
slides are coated with a metal oxide layer [73]. This could provide an explanation for
why their surface is far smoother than the other polished substrates.

57
Figure 16: Photographs showing AFM images of Spectrosil, CaF2 and Low-E substrates.

58
The clinical application of spectral histopathology is the primary aim of this
research field and the ability to fit into the current clinical processes is desired. The use
of Low-E slides has more advantages for this application than the other substrates, such
as lower cost, larger slide size and higher levels of slide resilience. Although high
spectral background and undefined peaks lead to a poor signal-to-noise ratio, spectra
generated using low-E substrates still exhibit all the major peaks that are present in the
spectra of CaF2 and Spectrosil. Further work is needed to understand the variation that
occurs between the Raman spectra of different substrates and assess the significance of
this impact upon clinical application.
3.3 Immersion vs. Non-Immersion Raman spectroscopy
Immersion and non-immersion Raman spectroscopy, using an incident
wavelength of 785 nm, are investigated to initially assess the two techniques as
diagnostic tools by comparison of the tissue spectra quality produced by both methods.
Spectral acquisition of tissue on Low-E slides was attempted via immersion
Raman, but produced a saturated spectral baseline. After observation of a burned hole in
the substrate from the live video image, this has been attributed to substrate
photodamage caused by the incident laser source. Therefore, CaF2 substrates were used
for further Immersion Raman measurements.
Figure 17 shows the averaged, raw spectra of tissue on CaF2 using immersion
and non-immersion Raman spectroscopy. It is clear that the averaged immersion Raman
spectrum initially has a lower spectral background, from 600 cm-1
to 930 cm-1
, than the
averaged non-immersion spectrum. It remains at a relatively stable intensity throughout

59
all the Raman shifts. The non-immersion spectrum has an intense spectral background,
where it starts at 600 cm-1
, but becomes dramatically less intense as the Raman shifts
increase, without an increase in the signal-to-noise ratio of the peaks-of-interest.
Immersion Raman produces spectra of higher signal-to-noise ratios and peaks with
larger areas than those acquired by non-immersion Raman. The observed results give
evidence that immersion Raman spectroscopy receives stronger Raman scatter signals
than the standard technique.

60
Figure 17: Original spectral plot showing averaged raw spectra of 1116 immersion (48 samples from n=41 patients) acquisitions using, a x 50 objective, and 458 non-immersion
acquisitions (18 samples from n=11 patients) using a x 60 objective from all tissue specimens on CaF2.

61
In Figure 18 the morphological differences of the same brain tissue sample can
be observed between Raman and immersion Raman spectroscopy. The tissue analysed
by immersion Raman analysis is saturated in deionised water prior the acquisition of
measurements. The cells appear clearly delineated and transparent and the nucleus of
cells can also be seen. The cells of the dry tissue are much less delineated and appear as
a mass of cells. The heterogeneity of the cell thickness of the dry tissue causes some
areas of the sample to look out of focus, whereas the immersed sample is made to look
homogenous by their visual clarity throughout the tissue. The transition of the tissue
from a dry state to a saturated state was seen through observation of the microscopic
image in real time. The tissue was seen to absorb the water and the cells became
visually clearer and more demarcated. Full saturation was concluded to occur after
approximately 10 minutes when no further visual changes were detected, after this time
Raman analysis could proceed and spectroscopic measurements acquired.
The observed advantages, including visual clarity and better spectral quality, led
to the further use of immersion Raman spectroscopy, over dry tissue techniques, for the
analysis of the tissue samples and assessment of the ability of the technique as a
diagnostic tool for metastatic brain cancer.

62
Figure 18: Photograph showing Raman (x 50) and immersion Raman (x60) image of brain tissue.
3.4 532 nm vs. 785 nm laser line
Figure 19 shows the averaged, raw spectra of tissue taken using both the 532 nm
and 785 nm laser line. It is obvious that the baseline of the averaged spectrum taken
using the 785 nm laser line is lower in intensity than the averaged spectrum taken using
the 532 nm laser line. As a result of the advantage of a lower spectral background using
the 785 nm laser line, its use was continued on tissue spectra acquisition for assessment
of its use in spectral histopathology.

63
Figure 19: Original spectral plot showing averaged raw immersion Raman spectra of 996 acquisitions (48 samples from n=41 patients) using the 532 nm laser line and 1116
acquisitions (48 samples from n=41 patients) using the 785 nm laser line from all tissue specimens.

64
3.5 Spectral Histopathology: Discrimination of metastatic tumours
Although low-E substrates were demonstrated to aid tissue dewaxing more
efficiently than the other substrates, CaF2 is a commonly used substrate for Raman
spectroscopy due to the small background it produces. CaF2 was used to support tissue
samples under spectral histopathology analysis.
Figure 20 shows the averaged, vector normalised and background-subtracted
immersion Raman spectra of normal (157 spectra from 7 patients), metastatic (668
spectra from 31 patients) and GBM (127 spectra from 5 patients) brain tissue on CaF2
substrates. Table 4 lists the tentative assignments of the major peaks present in these
spectra [33, 60, 90-92].
Spectral differences between these tissue types are observed at various peaks
throughout the averaged spectra. The peak at 721cm-1
, assigned to the C-N symmetric
stretch (Figure 21) of choline [90, 91], is prominently observed in GBM tissue. In
normal and metastatic tissues this peak is not present, although a 725 cm-1
peak
assigned to adenine (Figure 21) is present [93]. Choline has been observed, in studies
employing magnetic resonance spectroscopy, to increase in content in GBM tissue and
all primary tumours. This is thought to be caused by increased cell proliferation and cell
membrane turnover, resulting in an increased production of choline transporters and
kinase enzymes [94, 95].
Both GBM and metastatic tissues exhibit 782 cm-1
peaks of a considerable
intensity in their spectra, assigned to nucleotide ring breathing [33] (Figure 21), whereas
the peak in the normal tissue spectrum is either absent or of a much weaker intensity,

65
making it unidentifiable as a major peak. A peak at 1083 cm-1
, assigned to the C-N
stretch of proteins [33] is observable in the averaged spectrum of normal brain tissue yet
appears absent from the spectra of cancerous tissue.
A peak at 1263 cm-1
, assigned to CN and CH2 vibrational modes of amide III
[92] (Figure 21), is present in the normal tissue spectrum but is shifted to 1250 cm-1
and
exhibits higher intensities in the spectra of GBM and metastatic brain tissue. Amide III
is a component of the collagen within the tissue samples. Increased collagen in
cancerous tissue is consistent with other Raman spectroscopy studies and is attributed to
fibrosis association with lesion formation [96]. Additionally, women with dense breast
tissues, which are normally associated with increased collagen, are found to have an
elevated chance of developing breast cancer [97].
The peak present at approximately 1658 cm-1
is attributed to the C=O stretch of
amide I [33], and appears to be shifted in the average spectrum of metastatic tissues to a
higher Raman shift of 1661 cm-1
. The intensity of this peak is also decreased in both the
cancerous spectra. This is consistent with the results of Gniadecka et al. who found
reduced intensities of the amide I band of proteins in the spectra of melanoma. The
changes in the amide bands between the normal and melanoma specimens are attributed
to conformational changes to the protein structures [98].
Intensity changes between spectral peaks of normal, GBM and metastatic brain
tissue indicate alterations in specific biomolecule concentrations when the tissue is in
different states of health. These observable spectral differences demonstrate the ability
of Raman spectroscopy as a potential diagnostic tool for brain cancer.
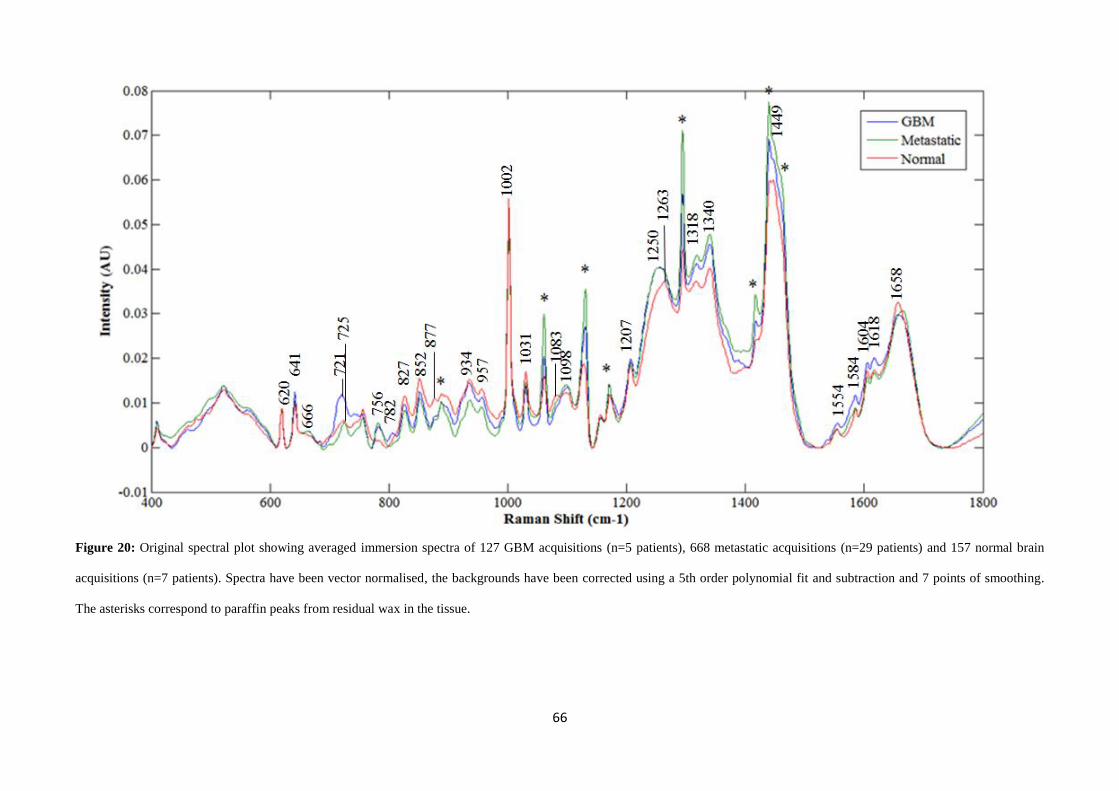
66
Figure 20: Original spectral plot showing averaged immersion spectra of 127 GBM acquisitions (n=5 patients), 668 metastatic acquisitions (n=29 patients) and 157 normal brain
acquisitions (n=7 patients). Spectra have been vector normalised, the backgrounds have been corrected using a 5th order polynomial fit and subtraction and 7 points of smoothing.
The asterisks correspond to paraffin peaks from residual wax in the tissue.

67
Table 4: Data showing tentative biomolecular assignments of main spectral peaks.
Raman Shift (cm-1
) of
peak
Tentative assignment [33, 60, 90-92]
620 C-C twisting mode of phenylalanine
641 C-C twisting mode of tyrosine
666 C-S stretching mode of cystine
721 (only GBM) Symmetric choline C-N stretch (membrane phospholipid head)/adenine
725 Adenine/C-S (protein)/C-H2 rocking
756 Symmetric breathing of tryptophan
782 Cytosine/uracil ring breathing of nucleotide
827 DNA O-P-O, cytosine, uracil, thymine
852 (CCH) ring breathing mode of tyrosine and C-C stretch of proline ring
877 Proline
888 Paraffin wax
934 C-C stretching mode of proline and valine and α-helix protein
backbone/glycogen
957 Hydroxyapartite (PO43-
symmetric stretching) /carotenoid/cholesterol
1002 Symmetric ring breathing mode of phenylalanine
1031 C-H in-plane bending mode phenylalanine
1061 Paraffin wax
1083 (only normal) C-N stretching mode of proteins
1098 C-C/C-O phospholipids
1131 Paraffin wax
1156 C-C carotenoids, C-N stretching of proteins
1171 Paraffin wax
1207 Tyrosine, Hydroxyproline/tryptophan, phenylalanine (C-C6H5)
1250 Amide III: collagen (C-H2 wag, C-N stretch)/Pyrimidine bases C, T
1263 (only normal) Amide III: collagen (C-H2 wag, C-N stretch)/Pyrimidine bases C, T
1294 Paraffin wax

68
1318 CH3 CH2 twisting mode of collagen/lipids
1340 CH3 CH2 wagging mode of collagen, nucleic acids
1389 CH3 bend
1417 Paraffin wax
1440 Paraffin wax
1449 CH2 bending mode of proteins/(CH3) (CH2) collagen
1462 Paraffin wax
1554 C=C Tryptophan, porphyrin
1584 Pyrimidine ring (nucleic acids) and heme protein/C=C phenylalanine
1604 C=C in-plane bending mode of phenylalanine and tyrosine, C=C porphyrin
1618 C=C stretching mode of tyrosine and tryptophan
1658 Amide I (C=O stretching mode of proteins, α-helix conformation)/C=C lipid
stretch

69
Figure 21: Chemical structures of choline, amide, nucleotide and the bases of nucleotides: adenine,
guanine, cytosine, thymine and uracil, which contribute to peaks in the spectral differences between
GBM, normal and metastatic brain tissue.
Amide groupCholine
Nucleotide
Nitrogenous base
Sugar Phosphate backbone
-
-
R
Purines
Pyrimidines
Adenine Guanine
Cytosine Thymine Uracil

70
It can be seen from Figure 22, that on a spectral level the data assembles
together in their histopathological groups for GBM, metastatic and normal brain
respectively. However, there is a degree of overlap between the groups. Details of the
PC-DFA model and the number of spectra used can be found in Table 5. At a 95%
confidence limit, GBM classification has a sensitivity of 95.24% and a specificity of
36.13%, metastatic classification has a sensitivity of 95.47% and a specificity of
81.05% and normal brain classification has a sensitivity of 90.38 % and a specificity of
56.82%. At a 90% confidence interval GBM classification has a sensitivity of 92.86%
and a specificity of 72.63%, metastatic classification has a sensitivity of 91.82% and a
specificity of 90.43% and normal brain classification has a sensitivity of 88.46% and a
specificity of 78.41%.

71
Figure 22: Original discriminant function plot showing the separation between GBM (n=5 patients) (1), metastatic (n=29 patients) (2) and normal (n=7 patients) (3) brain tissue, at
spectral level, based on the training set (red) and test set (blue) with 95% (outer ellipse) and 90% (inner ellipse) confidence limits.

72
Table 5: Data showing the PC-DFA model details, including spectral numbers and the resulting
sensitivities and specificities.
Train
spectra
Test
spectra
Confidence
level
Histopathological
type
Sensitivity
(%)
Specificity
(%)
GBM vs.
norm vs. met
639 316 90% GBM 92.86 72.63
Normal 88.46 78.41
Metastatic 91.82 90.43
95% GBM 95.24 36.13
Normal 90.38 56.82
Metastatic 95.47 81.05
Metastatic
comparison
449 222 95% Breast 95.74 44
Lung 93.75 30.38
Colon/Rectum 76.08 50
Melanoma 97.06 20.21
Oesophagus &
stomach
96.67 47.64
primary
comparison
111 53 95% Breast 77.42 89.66
Colon/Rectum 57.14 100
Melanoma 100 55.56
Oesophagus &
stomach
14.29 100
99% Breast 87.1 86.36
Colon/Rectum 71.43 100
Melanoma 100 42.22
Oesophagus &
stomach
42.86 100
Figure 23 displays the discriminant function loadings plots relating to this PC-
DFA and Table 6 identifies the Raman shifts of the main peaks. The loadings contain

73
the peaks 721 cm-1
, 725 cm-1
and 782 cm-1
which were visibly identified as being
different in the metastatic, normal and GBM brain tissue spectra. Therefore, the
discriminatory power of these peaks were further tested through calculation of their
ratios to the 620 cm-1
peak, which appeared to be more uniform across the spectra, to
analyse the importance of the intensity differences between the spectra.
Figure 23: PC-DFA loadings plot of discriminant functions 1 and 2 from the GBM vs. metastatic vs.
normal (Figure 9) PC-DFA model.
1
2

74
Table 6: Data showing the Raman shifts of the main peaks from the PC-DFA loadings.
Raman Shift (cm-1
) of PC-DFA loadings peak
DF 1 loadings DF2 loadings
620 721
641 756
666 827
725 957
756 1031
782 1156
827 1263
852 1389
877 1554
934 1584
957 1618
1002
1031
1083
1098
1156
1207
1250
1318
1340
1554
1584
1604
1618
1658

75
Figure 24 displays the 2D score plot of peak intensity ratios and further shows
separation between metastatic, GBM and normal brain tissues based on the intensity
ratios of the 620 cm-1
peak, which is uniform in all the spectra, to the 782 cm-1
peak,
which appears absent in normal brain, and the 721 cm -1
peak, present in only GBM
tissue spectra. It can be seen that the ratios calculated from the spectra of GBM,
metastatic and normal brain tissue clearly group together in their tissue types. Two
outliers can be seen from the ratio graph at location (1.45, 2.19) and (1.9, 1.09),
belonging to the normal and metastatic group, identified as patient 007 and 509
respectively. Upon inspection of these patients’ averaged spectra, it was observed that
they notably differed from the other averaged spectra from the same histological group
and also from the total averaged spectra of the histological group.
GBM classification has a sensitivity of 100% and a specificity of 94.44% based
on the 721 cm-1
to 620 cm-1
ratio data above 1. Metastatic classification has a sensitivity
of 96.55% and a specificity of 100% based on the 721 cm-1
to 620 cm-1
ratio data below
1 and 620 cm-1
to 782 cm-1
ratio data below 5, respectively. Moreover, normal brain
classification has a sensitivity of 85.71% and a specificity of 100% based on the 721
cm-1
to 620 cm-1
ratio data below 1 and 620 cm-1
to 782 cm-1
ratio data above 5. The
ratios of peaks in the low wavenumber regions, 600-800 cm-1
, allow rapid, directed
Raman analysis to discriminate GBM, metastatic and normal brain tissue.

76
Figure 24: 2D score plot of the 620 cm-1
to 782 cm-1
peak ratio versus the 721 cm-1
to 620 cm-1
peak ratio. Each data point is the patient average (n=≥20 spectra per specimen) from
normal (n=7 patients), metastatic (n=29 patients) and GBM (n=5 patients) spectra that have been vector normalised and 5th
order polynomial subtracted.

77
It can also be observed from Figure 20 (page 59), that the averaged spectrum of
normal tissue that the paraffin peaks (asterisked peaks) present are of a much lower
intensity than those in the spectra acquired from metastatic and GBM tissue. This could
be attributed to either structural or compositional differences between the tissue types
showing a tissue effect on the dewaxing efficacy as well as a substrate effect.

78
Figure 25: Score plot of intensity measurements from the 1061 cm-1
peak and the 1131 cm-1
peak of patient averaged normal, GBM and metastatic spectra.

79
Figure 25 shows the score plot of the intensities of the paraffin peaks: 1061 cm-1
against 1131 cm-1
, from patient averaged spectra. It can be seen that the paraffin peaks
from normal brain tissue spectra generally exhibit lower intensities than the cancerous
tissue spectra. As a result the normal brain tissue data group together at the lower
intensity range of the score plot and the cancerous brain tissue data group together at the
higher intensity range on the score plot. The disparity of wax retention between these
different histological tissues could perhaps be used to tentatively highlight cancerous
areas in the tissue and differentiate between cancerous and normal tissue. The spectra
within the GBM group appear to be less uniform and displays paraffin peaks of both
high and low intensities which can overlap with those from the metastatic spectra. As a
result, it would be more challenging to differentiate between GBM and metastatic tissue
to a reliable level and combining the two groups together, as cancerous tissue, gives a
better indication of the disparity of dewaxing efficacy between normal and cancerous
specimens.
Figure 26: Bar chart of three paraffin peak intensities with standard deviation from 127 GBM
acquisitions (n=5 patients), 668 metastatic acquisitions (n=29 patients) and 157 normal brain acquisitions
(n=7 patients) on CaF2 substrates.

80
Figure 26 shows the standard deviations of intensity across the spectra from
paraffin peaks 1061 cm-1
, 1131 cm-1
and 1294 cm-1
. It can be observed from the graph
that there is a general trend for higher paraffin peak intensities in the spectra of
metastatic and GBM tissue than in the spectra of normal tissue specimens.
Li et al. [99] state that the amount of fibro-glandular and adipose tissue is
strongly related to the risk of developing breast cancer. They explain that although no
direct evidence has been found to link dense mammographic tissue with the increased
chance of developing breast cancer, the obvious correlations observed have encouraged
the use of tissue density for breast cancer monitoring. They go on to support the
observations of this correlation through their findings that the mammograms of
cancerous breast tissue are far denser than those of normal breast tissue [99]. The
modification in tissue density observed between normal and cancerous tissue could
provide an explanation for the efficiency inconsistency of the dewaxing procedure, and
thus the variation of paraffin peak intensity between the normal brain and cancerous
brain tissue spectra. It would appear that the denser, cancerous tissue retains paraffin
wax better than the less dense, normal tissue.
Figure 27 shows the averaged spectra of GBM and normal brain tissues, and
metastatic: breast, lung, colon/rectum, melanoma and oesophagus and stomach brain
tissues. No visible differences between the spectra of the metastases based on their
origins are apparent.

81
Figure 27: Original spectral plot of averaged immersion spectra: 141 breast met acquisitions (n=6), 138 colon/rectum met acquisitions (n=6), 127 GBM acquisitions (n=5), 194 lung
met acquisitions (n=8), 102 melanoma met acquisitions (n=5), 157 normal brain acquisitions (n=7) and 93 oesophagus and stomach met acquisitions (n=4). Spectra have been vector
normalised and offset for visual clarity. The asterisks represent the paraffin contributed peaks.

82
Figure 28 shows the PC-DFA was performed on the metastatic tissues data. It
can be seen that, although there is a large amount of overlap between the classes, the
tissue types generally group together showing the potential for primary cancer site
identification from analysis of the metastatic brain tissue. Details of the PC-DFA can be
found in Table 5. In particular, the melanoma metastases and breast metastases show the
clearest separation from each other and the others groupings. At a 95% confidence limit
breast met classification has a sensitivity of 95.74% and a specificity of 44.00%.
Colon/rectum met classification has a sensitivity of 76.08% and a specificity of 50.00%.
Lung met classification has a sensitivity of 93.75% and a specificity of 30.38%.
Melanoma met classification has a sensitivity of 97.06% and a specificity of 20.21%.
Oesophagus and stomach met classification has a sensitivity of 96.67% and a specificity
of 47.64%.
Although their classification sensitivities are considerably high, the low
classification specificities would result in a high number of false positives based on this
PC-DFA model.

83
Figure 28: Original discriminant function plot displaying the separation of breast met (n=6 patients) (1), colon/rectum met (n=6 patients) (2), lung met (n=8 patients) (3) melanoma
met (n=5 patients) (4) and oesophagus & stomach met (n=4 patients) (5) based on the train set (red) and test set (blue) with a 95% confidence limit represented by ellipse.

84
PC-DFA was performed on the primary cancers spectral dataset: breast,
melanoma, oesophagus and stomach and colon/rectum. Primary lung tissue specimens
were not available in the biobank. Details of the PC-DFA model are displayed in Table
5. The primary cancer tissue samples are linked samples, from the same patient as the
corresponding metastatic tissue samples used in the metastatic tumour model. As can be
seen in Figure 29, the tissue types separate well and crossover is only observed between
the breast and melanoma cancers. At a 95% confidence limit breast cancer classification
has a sensitivity of 77.42% and a specificity of 89.66%. Colon/rectum cancer
classification has a sensitivity of 57.14% and a specificity of 100%. Melanoma cancer
classification has a sensitivity of 100% and a specificity of 55.56%. Oesophagus and
stomach cancer classification has a sensitivity of 14.29% and a specificity of 100%. At
a 99% confidence limit breast cancer classification has a sensitivity of 87.10% and a
specificity of 86.36%. Colon/rectum cancer classification has a sensitivity of 71.43%
and a specificity of 100%. Melanoma cancer classification has a sensitivity of 100% and
a specificity of 42.22%. Oesophagus and stomach cancer classification has a sensitivity
of 42.86% and a specificity of 100%. The primary cancer tissues show much better
separation than the metastatic tissues in their PC-DFA models. Hence, the spectra
produced from the brain metastases in this study must be comparatively different from
those produced from their primary site cancers. Metastatic types are more spectrally
alike than primary cancers are to each other. This may suggest a change in the
biochemistry of the cancer cells depending on organ location and not cancer type.
However, due to only a small number of primary tissue specimens investigated in this
study no accurate conclusions can be made, as variations may arise from molecular
differences between patients rather than disease.

85
Figure 29 Original discriminant function plot displaying the separation of primary breast (n=5 patients) (1), primary colon/rectum (n=1 patients) (2), primary melanoma (25 spectra
from n=1 patients) (3) and primary oesophagus & stomach (n=1 patients) (4) cancers based on the train set (red) and test set (blue) with 99% (outer ellipse) and 95% (inner ellipse)
confidence limits.

86
Figure 30 displays the baseline-subtracted and vector normalised, averaged
spectra of both metastatic brain and their corresponding primary sites. From the results,
it is observable that they spectrally vary from one another in their peak intensities. This
supports the difference in grouping between their PC-DFA models and further suggests
that the biomolecular composition of tissue differs between the primary sites and the
corresponding brain metastases.
A uniform difference that appears between all the metastatic brain tissue spectra
and the primary site tissue spectra is seen in the amide I peak. In metastatic brain tissue
spectra it peaks as high as 1667 cm-1
, in stomach/oesophagus metastases, a higher
Raman shift than the primary sites which peak at around 1658 cm-1
.
The averaged spectra of breast cancer tissue and the corresponding metastatic
brain tissue appear relatively similar to one another. The main difference between these
two groups is a peak at 700 cm-1
present in the metastatic brain tissue spectrum but not
visually present in the primary site tissue spectrum.
Colon cancer tissues and the metastatic brain tissues are also spectrally similar
to each other and vary mainly through the difference in peak intensities. The primary
site tissue spectrum exhibits much higher intensity peaks than the spectrum of
metastatic brain tissue. The primary site tissue spectrum also displays a much more
visually obvious peak at 666 cm-1
than the metastatic brain tissue spectra.
The spectral difference between oesophagus and stomach cancer tissues and
metastatic brain tissues are far more obvious than between the spectra of the other
cancers. The most noticeable disparity between the two averaged spectra is due to the

87
peak at 1621 cm-1
which is much more intense in the primary site spectrum than the
metastatic brain spectrum. Furthermore, the amide I peak, at 1658 cm-1
is much less
intense in the primary site spectrum than the metastatic brain spectrum which produces
an unusual ratio between the two peaks. This unusual ratio is only exhibited in the
oesophagus and stomach cancer spectrum. However, the spectra of both the primary and
metastatic site, for the other cancers exhibit similar ratios for these peaks where the
Amide I is much more intense than the 1621 cm-1
peak. A peak at 796 cm-1
is displayed
in the primary site spectrum of the oesophagus and stomach but is not present in the
spectrum of metastatic brain.
The spectral differences between melanoma primary site and metastatic tissue
are between the peak intensities. The amide III peak at 1250 cm-1
is at a similar intensity
to the 1340 cm-1
peak in the metastatic tissue spectrum. In the primary site spectrum
there is a disparity between these two peaks with the 1340 cm-1
peak having a much
higher intensity than the amide III peak.

88
Figure 30 Original spectral plot of averaged 95 primary breast acquisitions (n=5) and 96 breast met acquisitions (n=5) (top left), 22 primary colon acquisitions (n=1) and 22
metastatic colon/rectum acquisitions (n=1) (top right), 22 primary oesophagus & stomach acquisitions (n=1) and 22 oesophagus & stomach met acquisitions (n=1) (bottom left) and
25 primary melanoma acquisitions (n=1) and 20 melanoma met acquisitions (n=1) (bottom right). The spectra have been vector normalised, baseline corrected by 5th
order
polynomial fit and subtraction, and 7 points of smoothing.

89
Chapter 4
Conclusions
Through assessments, comparing the 785 nm laser line to the 532 nm laser line
and Raman spectroscopy to immersion Raman spectroscopy, the techniques and settings
used for spectral histopathological analysis were tailored to optimise the quality of the
results generated in the study. It is observed in this study that immersion Raman
spectroscopy employing a 785 nm laser generated spectra of better overall quality, with
higher signal-to-noise ratios. Hence, these methods and settings were used for further
investigation into the diagnostic capabilities of Raman spectroscopy.
In this study, the use of immersion Raman spectroscopy to differentiate between
GBM, metastatic and normal brain tissue has been demonstrated using peak ratios, with
sensitivities and specificities of 100% and 94.44%, respectively for GBM, 96.55% and
100%, respectively for metastatic brain, and 85.71% and 100%, respectively for normal
brain tissue. The potential of immersion Raman spectroscopy to identify the origin site
of the primary cancer from the analysis of brain metastases has also been observed
through the PC-DFA model which shows separation of different metastatic brain tissue
spectra based on their location for breast, lung, melanoma, colon/rectum and
oesophagus and stomach. From analysis this study has identified spectral differences
between GBM, metastatic and normal brain tissues and highlighted the main alterations
to be attributed to the choline peak at 721 cm-1
, present in GBM and absent in both
metastatic and normal brain, and the nucleotide peak at 782 cm-1
present in metastatic
and GBM and absent in normal brain. The ratios of these peaks were significantly
different between the spectra of the different histopathological groups enabling
segregation of the various tissue types. PC-DFA on the data produced sensitivities and

90
specificities for GBM classification of up to 95.24% and 72.63%, respectively. For
metastatic classification of up to 95.47% and 90.43% were calculated, respectively. For
normal brain classification of up to 90.38% and 78.41% were calculated, respectively.
This analysis used the spectra across the full wavelength range that was analysed. This
further shows that the spectra, from 400 cm-1
to 1800 cm-1
, of metastatic, GBM and
normal brain tissue are distinguishable from each other and can potentially be used to
diagnose cancerous tissue.
However, this study is based on the assumption that histopathology, employed in
this study to diagnose the tissue specimens, has identified all the samples and their
primary sites of origin correctly.
This study also shows the influence that Raman substrates have on sample
preparation and the resulting spectra. Spectral backgrounds of the substrates show that
the baseline of low-E is the highest and CaF2 the lowest of the three substrates. It has
been observed that the tissue specimens on the CaF2 and Spectrosil substrates exhibit
paraffin peaks in their spectra whereas the tissue specimens on the low-E substrates do
not. Throughout this investigation it has been established that CaF2 and Spectrosil
substrates retain paraffin wax residuals after the dewaxing procedure was carried out,
whereas low-E did not. This was attributed to the difference in surface morphology of
the substrates causing a variation in the retention of paraffin wax. AFM of the three
substrate types shows that low-E is smoother than either CaF2 or Spectrosil and thus
must dispel wax more easily.
It was also noted that the spectra of metastatic tissue had much larger paraffin
peaks present than the spectra of GBM tissue and that normal tissue spectra had an even

91
smaller paraffin contribution than that of GBM. This has been attributed to the change
of tissue density between normal tissue and cancerous tissue. The denser cancerous
tissue seems to have an increased ability to retain paraffin wax than the less dense,
normal tissue.
Overall, this study has shown the successful use of immersion Raman
spectroscopy as a diagnostic clinical tool for cancer and its potential for primary cancer
origin site identification. This study has also presented the substantial influence
substrate material has on tissue preparation methods and the outcome of spectra.

92
Chapter 5
Future Work
There are many future studies that could be of interest and benefit to the
advancement of this area of cancer research and other related areas. The spectral
differences between normal brain, metastatic brain and GBM tissues need to be further
investigated to ascertain the relevance of immersion Raman spectroscopy as a
diagnostic technique and assess its potential use in clinical settings. The analysis of a
larger sample size and wider variety of metastatic cancer types from different primary
locations would be of benefit and improve the reliability of the results. Other primary
tumours of the brain could also be studied to analyse the spectral differences between
these tumours and metastatic lesions, and the ability to stage tumours based on their
spectral signatures. Such studies could lead to the identification of particular
characteristic peaks or spectral patterns capable of acting as biomarkers for metastatic
brain cancer.
A study more closely designed for in vivo use of the technique is essential to
assess the clinical relevance of Raman spectroscopy. Such studies could utilise deep
Raman techniques and fibre optics.
A study could also be carried out to further identify the spectral differences
between metastatic brain cancer and their corresponding primary cancers to ascertain a
greater understanding of the biomolecular changes that incur between primary cancers
and resulting metastases in the brain and possibly other organs where metastases
frequently form.

93
A further investigation into the identification of primary sites from metastases is
needed. This should be carried out on a variety of metastatic tissue, not just brain, in
order to analyse significant spectral trends that could accurately diagnose the primary
cancers from metastatic tissues.
A study is required to further ascertain the effects spectroscopic substrates and
tissues of different histology have on the dewaxing process of tissue samples and the
outcome of Raman spectra. This should be carried out in order to optimise Raman
spectroscopy and tissue preparation techniques for future work in the field of bio-
spectroscopy.

94
Bibliography
1. Cancer Research UK. All cancers combined key facts. (2012) [15/04/2013]; Available from: http://www.cancerresearchuk.org/cancer-info/cancerstats/keyfacts/Allcancerscombined/.
2. Louis, D.N., H. Ohgaki, O. D. Wiestler and W. K. Cavenee, (2007) World Health Organisation Classification of Tumours : WHO Classification of Tumours of the Central Nervous System 4th ed. Geneva, CHE: World Health Organisation: p. 248-251.
3. Richards, G.M., D. Khuntia, and M.P. Mehta, (2007) Therapeutic management of metastatic brain tumors. Critical Reviews in Oncology/Hematology. 61(1): p. 70-78.
4. Brain Research Trust. About Brain Tumours. [cited 08/10/2012]; Available from: http://www.brt.org.uk/brain-tumours.
5. Soffieti, R., P. Cornu, J. Y. Delattre, R. Grant, F. Graus, W. Grisold, J. Heimans, J. Hildebrand, P. Hoskin, M. Kallijo, P. Krauseneck, C. Marosi, T. Siegal and C. Vecht,(2011) Brain Metastases. European Handbook of Neurological Managments, 2nd ed. (eds: N. E. Gilhus, M. P. Barnes and M. Brainin). 1: p. 437-445.
6. Bergner, N., B. F. M. Romeike, R. Reichart, R. Kalff, C. Krafft and J. Popp, (2011) Raman and FTIR Microspectroscopy for Detection of Brain Metastasis. Optical Society of America.
7. Hengel, K., G. Sidhu, J. Choi, J. Weedon, E. Nwokedi, C. Axiotis, X. Song, and A. Braverman (2013), Attributes of brain metastases from breast and lung cancer. International Journal of Clinical Oncology, 18 (3): p. 396-401.
8. Peacock, K. and G. Lesser, (2006) Current therapeutic approaches in patients with brain metastases. Current Treatment Options in Oncology. 7(6): p. 479-489.
9. Wen, P. and J. Loeffler, Brain metastases. Current Treatment Options in Oncology, 2000. 1(5): p. 447-457.
10. Vincent, T.L. and R.A. Gatenby, (2008) An evolutionary model for initiation, promotion, and progression in carcinogenesis. International Journal of Oncology. 32(4): p. 729-37.
11. Tannock, I.F., R.P. Hill, R.G. Bristow, and L. Harrington, The Basic Science of Oncology. 4th ed. 2005, USA: The McGraw-Hill Companies, Inc.
12. Weston, A., C. Curtis and M.D. Harris, (2000) Chapter 12: Chemical Carcinogenesis. In: Bast, R.C. Jr., D.W. Kufe and R.E. Pollock, et al., editors. Holland-Frei Cancer Medicine. Hamilton (ON): BC Decker.
13. Moon, Y.J., X. Wang, and M.E. Morris, (2006) Dietary flavonoids: Effects on xenobiotic and carcinogen metabolism. Toxicology in Vitro. 20(2): p. 187-210.
14. Andreeff, M., D.W. Goodrich, and A.B. Pardee, (2000) Chapter 2: Cell proliferation, differentiation, and apoptosis. 5th ed. Holland-Frei Cancer Medicine, ed. R.C.J. Bast, D.W. Kufe, and R.E. Pollock. Hamilton (ON): BC Decker.
15. Weinberg, R.A., (2007) The biology of Cancer. USA: Garland Science, Taylor and Francis Group, LLC.
16. Mahadevan-Jansen, A. and R.R. Richards-Kortum, (1996) Raman spectroscopy for the detection of cancers and precancers. Journal of Biomedical Optics. 1(1): p. 31-70.
17. Bower, M. and J. Waxman, (20011) Lecture Notes: Oncology. 2nd ed. USA: Wiley-Blackwell.
18. Polyzoidis, K.S., G. Miliaras, and N. Pavlidis, (2005) Brain metastasis of unknown primary: A diagnostic and therapeutic dilemma. Cancer Treatment Reviews. 31(4): p. 247-255.
19. Fidler, I.J., (2003) The pathogenesis of cancer metastasis: the 'seed and soil' hypothesis revisited. Nature Reviews Cancer. 3(6): p. 453-458.
20. Nowell, P.C., (1976) The clonal evolution of tumour cell populations. Science. 194: p. 23-28.

95
21. Mueller, W.C., Y. Spector, T.B. Edmonston, B. St Cyr, D. Jaeger, U. Lass, R. Aharonov, S. Rosenwald, and A. Chajut, (2011) Accurate classification of metastatic brain tumors using a novel microRNA-based test. Oncologist. 16(2): p. 165-74.
22. Kim, D.G. and L.D. Lunsford, (2012) Current and Future Management of Brain Metastasis. Progress in Neurological Surgery. Vol. 25, Basel: Karger.
23. Ellis, D.I., and R. Goodacre, (2006) Metabolic fingerprinting in disease diagnosis: biomedical applications of infrared and Raman spectroscopy. Analyst. 131: p. 875-885.
24. Zarandi, M.H.F., M. Zarinbal, and M. Izadi, (2011) Systematic image processing for diagnosing brain tumors: A Type-II fuzzy expert system approach. Applied Soft Computing. 11(1): p. 285-294.
25. Santra, A.R.K., P. Sharma, C. Bal, A. Kumar, P. K. Julka and A. Malhotra, (2012) F-18 FDG PET-CT in patients with recurrent glioma: Comparison with contrast enhanced MRI. European Journal of Radiology. 81(3): p. 508-513.
26. Campos, S., P. Davey, A. Hird, B. Pressnail, J. Bilbao, R.I. Aviv, S. Symons, F. Pirouzmand, E. Sinclair, S. Culleton, E. Desa, P. Goh, and E. Chow, (2009) Brain metastasis from an unknown primary, or primary brain tumour? A diagnostic dilemma. Current Oncology. 16(1): p. 62-6.
27. Diamandis, E.P., (2004) Mass spectrometry as a diagnostic and a cancer biomarker discovery tool: opportunities and potential limitations. Molecular and Cellular Proteomics. 3(4): p. 367-78.
28. Gurcan, M.N., L.E. Boucheron, A. Can, A. Madabhushi, N.M. Rajpoot, and B. Yener, (2009) Histopathological image analysis: a review. IEEE Reviews in Biomedical Engineering. 2: p. 147-71.
29. Krafft, C., S.B. Sobottka, G. Schackert, and R. Salzer, (2004) Analysis of human brain tissue, brain tumors and tumor cells by infrared spectroscopic mapping. Analyst. 129(10): p. 921-925.
30. Zhou, Y., C.H. Liu, Y. Sun, Y. Pu, S. Boydston-White, Y. Liu, and R.R. Alfano, (2012) Human brain cancer studied by resonance Raman spectroscopy. Journal of Biomedical Optics. 17(11): p. 116021.
31. Raab, S.S., R.E. Nakhleh, and S.G. Ruby, (2005) Patient Safety in Anatomic Pathology: Measuring Discrepancy Frequencies and Causes. Archives of Pathology & Laboratory Medicine. 129(4): p. 459-466.
32. Raab, S.S., D.M. Grzybicki, J.E. Janosky, R.J. Zarbo, F.A. Meier, C. Jensen, and S.J. Geyer, (2005) Clinical impact and frequency of anatomic pathology errors in cancer diagnoses. Cancer. 104(10): p. 2205-13.
33. Stone, N., C. Kendall, J. Smith, P. Crow, and H. Barr, (2004) Raman Spectroscopy for identification of epithelial cancers. Faraday Discussions. 126: p. 141-157.
34. Krafft, C., L. Shapoval, S.B. Sobottka, K.D. Geiger, G. Schackert, and R. Salzer, (2006) Identification of primary tumors of brain metastases by SIMCA classification of IR spectroscopic images. Biochimica et Biophysica Acta (BBA) - Biomembranes. 1758(7): p. 883-891.
35. Banwell, C.N. and E.M. McCash, (1994) Fundamentals of Molecular Spectroscopy 4th ed., UK: McGraw-Hill International Limited.
36. Skoog, D.A., F.J. Holler and S.R. Crouch, (2007) Principles of Instrumental Analysis. 6th ed., USA: Thompson Brooks/Cole.
37. Tu, Q. and C. Chang, (2012) Diagnostic applications of Raman spectroscopy. Nanomedicine. 8(5): p. 545-58.
38. Wagner, M., (2009) Single-cell ecophysiology of microbes as revealed by Raman microspectroscopy or secondary ion mass spectrometry imaging. Annual Reviews of Microbiology. 63: p. 411-29.
39. Das, R.S. and Y.K. Agrawal, (2011) Raman spectroscopy: Recent advancements, techniques and applications. Vibrational Spectroscopy. 57(2): p. 163-176.

96
40. Auner, A.W., R.E. Kast, R. Rabah, J.M. Poulik, and M.D. Klein (2013), Conclusions and data analysis: a 6-year study of Raman spectroscopy of solid tumors at a major pediatric institute. Pediatric Surgery International, 29(2): p. 129-140.
41. Devpura, S., J.S. Thakur, F.H. Sarkar, W.A. Sakr, V.M. Naik and R. Naik, (2010) Detection of benign epithelia, prostatic intraepithelial neoplasia, and cancer regions in radical prostatectomy tissues using Raman spectroscopy. Vibrational Spectroscopy. 53(2): p. 227-232.
42. Kawabata, T., H. Kikuchi, S. Okazaki, M. Yamamoto, Y. Hiramatsu, J. Yang, M. Baba, M. Ohta, K. Kamiya, T. Tanaka, and H. Konno, (2011) Near-Infrared Multichannel Raman Spectroscopy with a 1064 nm Excitation Wavelength for Ex Vivo Diagnosis of Gastric Cancer. Journal of Surgical Research. 169(2): p. e137-e143.
43. Wartewig, S. and R.H.H. Neubert, (2005) Pharmaceutical applications of Mid-IR and Raman spectroscopy. Advanced Drug Delivery Reviews. 57(8): p. 1144-1170.
44. Moros, J., S. Garrigues, and M. de la Guardia, (2010) Vibrational spectroscopy provides a green tool for multi-component analysis. TrAC Trends in Analytical Chemistry. 29(7): p. 578-591.
45. Krishna, C.M., G.D. Sockalingum, G. Kegelaer, S. Rubin, V.B. Kartha, and M. Manfait, (2005) Micro-Raman spectroscopy of mixed cancer cell populations. Vibrational Spectroscopy. 38(1–2): p. 95-100.
46. Krafft, C., M. Kirsch, C. Beleites, G. Schackert and R. Salzer, (2007) Methodology for fiber-optic Raman mapping and FTIR imaging of metastases in mouse brains. Analytical and Bioanalytical Chemistry. 389(4): p. 1133-1142.
47. Brożek-Płuska, B., I. Placek, K. Kurczewski, Z. Morawiec, M. Tazbir, and H. Abramczyk, (2008) Breast cancer diagnostics by Raman spectroscopy. Journal of Molecular Liquids. 141(3): p. 145-148.
48. Matousek, P., E.R.C. Draper, A.E. Goodship, I.P. Clark, K.L. Ronayne, and A.W. Parker, (2006) Noninvasive Raman Spectroscopy of Human Tissue In Vivo. Applied spectroscopy. 60(7): p. 758-763.
49. Patel, I.I., J. Trevisan, G. Evans, V. Llabjani, P.L. Martin-Hirsch, H.F. Stringfellow, and F.L. Martin, (2011) High contrast images of uterine tissue derived using Raman microspectroscopy with the empty modelling approach of multivariate curve resolution-alternating least squares. Analyst. 136(23): p. 4950-4959.
50. Nijssen, A., T.C. Bakker Schut, F. Heule, P.J. Caspers, D.P. Hayes, M.H. Neumann, and G.J. Puppels, (2002) Discriminating basal cell carcinoma from its surrounding tissue by Raman spectroscopy. J Invest Dermatol. 119(1): p. 64-69.
51. Kirsch, M., G. Schackert, R. Salzer, and C. Krafft, (2010) Raman spectroscopic imaging for in vivo detection of cerebral brain metastases. Analytical and Bioanalytical Chemistry. 398(4): p. 1707-1713.
52. Choo-Smith, L.P., H.G.M. Edwards, H.P. Endtz, J.M. Kros, F. Heule, H. Barr, J.S. Robinson, H.A. Bruining, and G.J. Puppels, (2002) Medical applications of Raman spectroscopy: From proof of principle to clinical implementation. Biopolymers. 67(1): p. 1-9.
53. Krafft, C., S.B. Sobottka, G. Schackert, and R. Salzer, (2005) Near infrared Raman spectroscopic mapping of native brain tissue and intracranial tumors. Analyst. 130(7): p. 1070-1077.
54. Stone, N., P. Stavroulaki, C. Kendall, M. Birchall, and H. Barr, (2000) Raman spectroscopy for early detection of laryngeal malignancy: preliminary results. Laryngoscope. 110(10 Pt 1): p. 1756-1763.
55. Bonnier, F., A. Mehmood, P. Knief, A.D. Meade, W. Hornebeck, H. Lambkin, K. Flynn, V. McDonagh, C. Healy, T.C. Lee, F.M. Lyng, and H.J. Byrne, (2011) In vitro analysis of immersed human tissues by Raman microspectroscopy. Journal of Raman Spectroscopy. 42(5): p. 888-896.

97
56. Bonnier, F., S.M. Ali, P. Knief, H. Lambkin, K. Flynn, V. McDonagh, C. Healy, T.C. Lee, F.M. Lyng, and H.J. Byrne, (2012) Analysis of human skin tissue by Raman microspectroscopy: Dealing with the background. Vibrational Spectroscopy. 61(0): p. 124-132.
57. Bonnier, F., A.D. Meade, S. Merzha, P. Knief, K. Bhattacharya, F.M. Lyng, and H.J. Byrne, (2010) Three dimensional collagen gels as a cell culture matrix for the study of live cells by Raman spectroscopy. Analyst. 135(7): p. 1697-703.
58. Gajjar, K., L. D. Heppenstall, W. Pang, K. M. Ashton, J. Trevisan, I. I. Patel, V. Llabjani, H. F. Stringfellow, P. L. Martin-Hirsch, T. Dawson and F. L. Martin, (2013) Diagnostic segregation of human brain tumours using Fourier-transform infrared and/or Raman spectroscopy coupled with discriminant analysis. Analytical Methods. 5: p. 89-102.
59. Krafft, C., S.B. Sobottka, G. Schackert, and R. Salzer, (2006) Raman and infrared spectroscopic mapping of human primary intracranial tumors: a comparative study. Journal of Raman Spectroscopy. 37(1-3): p. 367-375.
60. Huang, Z., A. McWilliams, H. Lui, D. I. McLean, S. Lam and H. Zeng, (2013) Near-infrared Raman spectroscopy for optical diagnosis of lung cancer. International Journal of Cancer. 107(6): p. 1047-1052.
61. Teh, S.K., W. Zheng, K.Y. Ho, M. Teh, K.G. Yeoh, and Z. Huang, (2010) Near-infrared Raman spectroscopy for early diagnosis and typing of adenocarcinoma in the stomach. British Journal of Surgery. 97(4): p. 550-557.
62. Bergholt, M.S., W. Zheng, K. Lin, K.Y. Ho, M. Teh, K.G. Yeoh, J.B. Yan So, and Z. Huang, (2011) In vivo diagnosis of gastric cancer using Raman endoscopy and ant colony optimization techniques. International Journal of Cancer. 128(11): p. 2673-2680.
63. Lieber, C.A., S.K. Majumder, D.L. Ellis, D.D. Billheimer, and A. Mahadevan-Jansen, (2008) In vivo nonmelanoma skin cancer diagnosis using Raman microspectroscopy. Lasers in Surgery and Medicine. 40(7): p. 461-467.
64. Lin, K., D.L.P. Cheng, and Z. Huang, (2012) Optical diagnosis of laryngeal cancer using high wavenumber Raman spectroscopy. Biosensors and Bioelectronics. 35(1): p. 213-217.
65. Abramczyk, H., J. Surmacki, B. Brożek-Płuska, Z. Morawiec, and M. Tazbir, (2009) The hallmarks of breast cancer by Raman spectroscopy. Journal of Molecular Structure. 924–926: p. 175-182.
66. Moreno, M., L. Raniero, E.A.L. Arisawa, A.M. do Espirito Santo, E.A.P. dos Santos, R.A. Bitar, and A.A. Martin, (2010) Raman spectroscopy study of breast disease. Theoretical Chemistry Accounts. 125: p. 329-334.
67. Kanter, E.M., E. Vargis, S. Majumder, M.D. Keller, E. Woeste, G.G. Rao, and A. Mahadevan-Jansen, (2009) Application of Raman spectroscopy for cervical dysplasia diagnosis. Journal of Biophotonics. 2(1-2): p. 81-90.
68. Crow, P., A. Molckovsky, N. Stone, J. Uff, B. Wilson, and L.M. WongKeeSong, (2005) Assessment of fiberoptic near-infrared raman spectroscopy for diagnosis of bladder and prostate cancer. Urology. 65(6): p. 1126-1130.
69. Tollefson, M., J. Magera, T. Sebo, J. Cohen, A. Drauch, J. Maier, and I. Frank, (2010) Raman spectral imaging of prostate cancer: can Raman molecular imaging be used to augment standard histopathology? British Journal of Urology International. 106(4): p. 484-488.
70. Manoharan, R., Y. Wang, and M.S. Feld, (1996) Histochemical analysis of biological tissues using Raman spectroscopy. Spectrochimica Acta Part A: Molecular and Biomolecular Spectroscopy. 52(2): p. 215-249.
71. Shetty, G., C. Kendall, N. Shepherd, N. Stone, and H. Barr, (2006) Raman spectroscopy: elucidation of biochemical changes in carcinogenesis of oesophagus. British Journal of Cancer. 94(10): p. 1460-1464.
98
72. Bocklitz, T., A. Walter, K. Hartmann, P. Rosch, and J. Popp, (2011) How to pre-process Raman spectra for reliable and stable models? Analytica Chimica Acta. 704(1-2): p. 47-56.
73. Bassan, P., A. Sachdeva, J. Lee, and P. Gardner, (2013) Substrate contributions in micro-ATR of thin samples: implications for analysis of cells, tissue and biological fluids. Analyst. 138(14): p. 4139-4146.
74. Draux, F., P. Jeannesson, A. Beljebbar, A. Tfayli, N. Fourre, M. Manfait, J. Sule-Suso, and G.D. Sockalingum, (2009) Raman spectral imaging of single living cancer cells: a preliminary study. Analyst. 134(3): p. 542-548.
75. Ali, S.M., F. Bonnier, A. Tfayli, H. Lambkin, K. Flynn, V. McDonagh, C. Healy, T. Clive Lee, F.M. Lyng, and H.J. Byrne, (2013) Raman spectroscopic analysis of human skin tissue sections ex-vivo: evaluation of the effects of tissue processing and dewaxing. J Biomed Opt. 18(6): p. 061202.
76. Ó Faoláin, E., M. Hunter, J. Byrne, P. Kelehan, M. McNamara, H. Byrne and F. Lyng, (2005) A study examining the effects of tissue processing on human tissue sections using vibrational spectroscopy. Materials Synthesis and Applications, Dublin Institute of Technology. 38: p. 121-127.
77. Trunova, V., A. Sidorina, V. Zvereva, and B. Churin, (2013) Changes in the elemental content of rat heart as a result of the fixation in formalin analyzed by synchrotron radiation X-ray fluorescent analysis. Journal of Trace Elements and Medicine and Biology. 27(1): p. 76-77.
78. Huang, Z., A. McWilliams, S. Lam, J. English, D.I. McLean, H. Lui, and H. Zeng, (2003) Effect of formalin fixation on the near-infrared Raman spectroscopy of normal and cancerous human bronchial tissues. International Journal of Oncology. 23(3): p. 649-655.
79. Ó Faoláin, E., M.B. Hunter, J.M. Byrne, P. Kelehan, H.A. Lambkin, H.J. Byrne, and F.M. Lyng, (2005) Raman spectroscopic evaluation of efficacy of current paraffin wax section dewaxing agents. Journal of Histochemistry and Cytochemistry. 53(1): p. 121-129.
80. Gobinet, C., D. Sebiskveradze, V. Vrabie, A. Tfayli, O. Piot and M. Manfait, (2008) Digital dewaxing of Raman spectral images of paraffin-embedded human skin biopsies based in ICA and NCLS. 16th European Signal Processing Conference (EUSIPCO).
81. Egerton, R.F., (2010) Physical Principles of Electron Microscopy, An introduction to TEM, SEM and AEM. US: Springer Scince+Business Media, Inc.
82. Museum of Science: Boston. How the SEM Works. (1996) [03/09/2013]; Available from: http://legacy.mos.org/sln/sem/tour01.html.
83. The Field Museum. SEM/EDS. (2013) [03/09/2013]; Available from: http://fieldmuseum.org/explore/department/conserving-collections/examination-documentation/sem-eds.
84. University of California. Introduction to Energy Dispersive X-ray Spectrometry (EDS). [06/09/2013]; Available from: http://micron.ucr.edu/public/manuals/EDS-intro.pdf.
85. Fenn, M.B., P. Xanthopoulos, G. Pyrgiotakis, S.R. Grobmyer, P.M. Pardalos, and L.L. Hench, (2011) Raman Spectroscopy for Clinical Oncology. Advances in Optical Technologies. 2011: p. 1-20.
86. Randolph, T.W., (2006) Scale-based normalization of spectral data. Cancer Biomark. 2(3-4): p. 135-144.
87. Baker, M.J., E. Gazi, M.D. Brown, J.H. Shanks, P. Gardner, and N.W. Clarke, (2008) FTIR-based spectroscopic analysis in the identification of clinically aggressive prostate cancer. British Journal of Cancer. 99(11): p. 1859-1866.
88. Akobeng, A.K., (2007) Understanding diagnostic tests 1: sensitivity, specificity and predictive values. Acta Paediatrica. 96(3): p. 338-341.
89. Hands, J.R., P. Abel, K. Ashton, T. Dawson, C. Davis, R. Lea, A. McIntosh, and M. Baker, (2013) Investigating the rapid diagnosis of gliomas from serum samples using infrared

99
spectroscopy and cytokine and angiogenesis factors. Analytical and Bioanalytical Chemistry, 405(23): p. 7347-7355.
90. Huang, Z., X. Chen, Y. Chen, J. Chen, M. Dou, S. Feng, H. Zeng, and R. Chen, (2011) Raman spectroscopic characterization and differentiation of seminal plasma. Journal of Biomedical Optics. 16(11): p. 110501-110501.
91. Sikirzhytski, V., K. Virkler, and I.K. Lednev, Discriminant analysis of Raman spectra for body fluid identification for forensic purposes. Sensors (Basel), 2010. 10(4): p. 2869-84.
92. Chan, J.W., D.S. Taylor, T. Zwerdling, S.M. Lane, K. Ihara, and T. Huser, (2006) Micro-Raman spectroscopy detects individual neoplastic and normal hematopoietic cells. Biophysical Journal. 90(2): p. 648-656.
93. Feng, S., R. Chen, J. Lin, J. Pan, G. Chen, Y. Li, M. Cheng, Z. Huang, J. Chen, and H. Zeng, (2010) Nasopharyngeal cancer detection based on blood plasma surface-enhanced Raman spectroscopy and multivariate analysis. Biosensors and Bioelectronics. 25(11): p. 2414-2419.
94. Tan, C.H. and E.H. Tan, (2012) Post-treatment Assessment of Glioblastoma Multiforme: Imaging with Fluorodeoxyglucose, Sestamibi, and Choline. World Journal of Nuclear Medicine. 11(1): p. 30-32.
95. Al-Okaili, R.N., J. Krejza, S. Wang, J.H. Woo, and E.R. Melhem, (2006) Advanced MR imaging techniques in the diagnosis of intraaxial brain tumors in adults. Radiographics. 26 Suppl 1: p. S173-189.
96. Haka, A.S., K. E. Shafer-Peltier, M. Fitzmaurice, J. Crowe, R. R. Dasari and M. S. Feld, (2005) Diagnosing breast cancer by using Raman spectroscopy. Proceedings of the National Academy of Sciences. 102(35): p. 12371-12376.
97. Boyd, N.F., G.A. Lockwood, J.W. Byng, D.L. Tritchler, and M.J. Yaffe, (1998) Mammographic densities and breast cancer risk. Cancer Epidemiolgy, Biomarkers and Prevention. 7: p. 1133-1144.
98. Gniadecka, M., P.A. Philipsen, S. Sigurdsson, S. Wessel, O.F. Nielsen, D.H. Christensen, J. Hercogova, K. Rossen, H.K. Thomsen, R. Gniadecki, L.K. Hansen, and H.C. Wulf, (2004) Melanoma Diagnosis by Raman Spectroscopy and Neural Networks: Structure Alterations in Proteins and Lipids in Intact Cancer Tissue. Journal of Investigative Dermatology. 122(2): p. 443-449.
99. Li, L., Z. Wu, L. Chen, F. George, Z. Chen, A. Salem, M. Kallergi, and C. Berman, (2005) Breast Tissue Density and CAD Cancer Detection in Digital Mammography. Conference Proceedings IEEE Engineering in Medicine and Biology Society. 3: p. 3253-3256.

100
Appendices
Appendix 1 – Poster submitted to the 7th
International Conference on Advanced
Vibrational Spectroscopy held in Kobe, Japan.

101
Appendix 2 – Poster submitted to the British Neuro-oncology society Annual meeting
2013 held at Durham University.

102
Appendix 3 - A report entitled ‘Investigating the use of Raman and Immersion Raman
Spectroscopy for Spectral Histopathology of Metastatic Brain Cancer and Primary Sites
of Origin’, written based on the findings from this MSc (by research) currently under
review by the authors for submission to ‘Analytical Methods’.
103
Investigating the use of Raman and Immersion Raman Spectroscopy for
Spectral Histopathology of Metastatic Brain Cancer and Primary Sites of
Origin
Leanne M. Fullwood
1, Graeme Clemens
1, Dave Griffiths
2, Katherine Ashton
3, Timothy
Dawson3, Robert W. Lea
2, Charles Davis
3, Franck Bonnier
4, Hugh J. Byrne
4, and
Matthew J. Baker1*
1
Centre for Materials Science, Division of Chemistry, University of Central Lancashire, Preston, PR1
2HE, UK 2 School of Pharmacy and Biomedical Sciences, University of Central Lancashire, Preston, PR1 2HE, UK
3Lancashire Teaching Hospital NHS Trust
Royal Preston Hospital, Sharoe Green Lane, Fulwood, Preston
PR2 9HT, UK 4FOCAS Research Institute, Dublin Institute of Technology, Kevin Street, Dublin 8, Ireland
*Corresponding Author: [email protected]
Abstract
It is estimated that approximately 13,000 people in the UK are diagnosed with
brain cancer every year; of which 60% are metastatic. Current methods of diagnosis can
be subjective, invasive and have long diagnostic windows. Raman spectroscopy
provides a non-destructive, non-invasive, rapid and economical method for diagnosing
diseases. The aim of this study was to investigate the use of Raman and immersion
Raman spectroscopy for diagnosing metastatic brain cancer and identifying primary
sites of origin using brain tissue. Through spectral examination, the Raman peaks at 721
cm-1
and 782 cm-1
were identified as being the most distinct for discriminating between
the glioblastoma multiforme (GBM), metastatic and normal brain tissue spectra. A ratio
score plot of these peaks calculated the classification sensitivities and specificities as
100% and 94.44% for GBM, 96.55% and 100% for metastatic brain, and 85.71% and
100% for normal brain tissue. Principal Component-Linear Discriminant Analysis (PC-
LDA) also showed discrimination between normal, GBM and metastatic brain tissue
spectra. We also present, for the first time, the use of Raman spectroscopy to investigate
primary site of origin for metastatic brain cancer and any biochemical differences
between different primary and metastatic cancer using linked samples. This study

104
revealed interesting spectral differences in the amide regions showing changes in the
biochemistry of the metastatic brain cancer from the primary cancer
Keywords: Immersion Raman, Vibrational Spectroscopy, Diagnosis, Brain Cancer,
Metastatic
Introduction
It is estimated that a third of people in the UK will develop cancer at some point
during their lifetimes; and approximately 50% of these will die as a result of the disease
within five years after diagnosis [1]. Brain metastases are the most common form of
intracranial neoplasms in adults and are predicted to develop in 20-40% of cancer
patients [2]. It is reported that around 13,000 people in the UK are diagnosed with brain
cancer every year, of which, 60% are metastatic tumours that have originated from
primary cancers located outside the central nervous system [3]. All cancers have the
potential to metastasise and their probability of doing so is influenced by their location;
lung cancer is the most common cancer to metastasise and is responsible for 50% of all
brain metastases, breast cancer is the second most common and accounts for 15-25%,
melanoma accounts for 5-20%, and the remaining 5-30% are as a result of other cancers
[4]. Identifying the site of origin of the primary tumour increases the efficiency of
treatment and thus patient survival; however, in 15% of metastatic cases, the location of
the primary cancer is unknown [5].
The current method of diagnosis for brain metastases and their primary sites is
histopathological analysis. The cancer type and the origin of the primary cancer can be
identified based on the tissue architecture observed [6]. This method requires a trained
neuropathologist, has a long diagnostic window, and can be subjective [7]. As well as
these issues, disagreement amongst pathologists is reported to occur in up to 43% of

105
specimens [8]. The accurate and rapid diagnosis of disease allows early intervention of
appropriate treatment, thus increasing life expectancy and reducing healthcare costs [9].
Therefore, there is a requirement for non-subjective techniques that can rapidly and
accurately identify disease.
Raman spectroscopy is an analytical technique that utilises the phenomenon of
inelastic light scattering to produce characteristic spectra unique to specific samples.
When a tissue becomes diseased, molecular changes occur, which should be reflected in
its spectrum. The identification of spectral differences between healthy and diseased
tissue should enable objective diagnosis of specific diseases. Raman spectroscopy is not
significantly affected by water and thus can be used in vivo to reduce and aid biopsy
[10]. Raman spectroscopy is also a non-destructive, rapid and economical technique,
making it an attractive method for diagnosis [11].
The potential of Raman spectroscopy as a diagnostic technique for diseases has
been demonstrated by a variety of studies. Many papers have shown the ability of
Raman spectroscopy to diagnose cancers, such as: brain cancers using tissue on low-E
microscope slides and CaF2 slides respectively [12, 13], lung tumours through the
analysis of bronchial tissue sections [14], gastric adenocarcinomas using tissue samples
[15, 16], non-melanoma skin cancers from the analysis of tissue in vivo [17], laryngeal
cancers from tissue at endoscopy [18], breast cancers using fresh and frozen tissue
specimens respectively [19, 20], cervical cancers from tissue in vivo and ex vivo [21,
22], bladder and prostate cancers from tissue sections [23, 24] and oesophagus and
colon cancers through the analysis of snap frozen tissue on CaF2 [25].
Gajjar et al. reported the ability of Raman spectroscopy to differentiate between
brain tumour and healthy brain tissue [12]. They observed successful discrimination
between different brain tumour types in their study. They reported that metastatic brain
tissue could be recognised from healthy brain tissue on low-E substrates based on

106
spectral peaks at: 997 cm-1
(phospholipids and glucose-I-phosphate), 1077 cm-1
and
1446 cm-1
(lipids and proteins), 1241 cm-1
(Amide III), ≈ 1460 cm-1
(cytosine) and 1654
cm-1
(Amide I) [12].
Tissue samples are usually fixed using formalin and impregnated with paraffin
wax to preserve the tissue for future analysis. The addition of paraffin also provides
support for the microtomy process, enabling the sectioning of the tissue block for
microscopic examination. However, prior to histological and Raman analysis, tissue
sections must undergo a dewaxing process to remove the added paraffin. This then
allows histological staining of the tissue for pathological examination, and reduces the
paraffin contributions in Raman spectra. Ó Faoláin et al. investigated the efficacy of
dewaxing procedures on formalin fixed, paraffin preserved (FFPP) cervical tissue on
glass slides [26]. They reported that dewaxing procedures employing the commonly
used, xylene and histoclear solvents, do not completely remove all of the paraffin wax;
they found hexane to be a much more efficient dewaxing agent [26] However it requires
18 hours of tissue submersion and is not clinically used for dewaxing procedures,
conventional clinical dewaxing procedures were employed here [27].
Immersion Raman spectroscopy utilises an immersion lens which is in direct
contact with an appropriate liquid, such as deionised water covering a sample under
investigation. Bonnier et al. describe and successfully demonstrate the use of immersion
Raman spectroscopy for both live cell and the first example of in vitro tissue specimens
on CaF2, and observed an improvement in spectral quality, sample stability and the
reduction of spectral background [28, 29]. Bonnier et al. [28, 29] demonstrated that
fluorescence, contributing to spectral background, is only significant from sources
producing short wavelengths of light, as proteins typically only fluoresce when sources
producing wavelengths below 500nm are used and therefore, the background
contribution seen from spectra acquired when using 785 nm lasers should not be

107
attributed to fluorescence, but to morphology dependant scattering of the incident light,
and Raman lines that cause non-collimated entry into the spectrometer as stray light.
The exchange of a tissue/air interface with a tissue/liquid interface results in more
uniform refractive indices, thus reducing this level of stray light, and in turn, the
intensity of the spectral background. Submerging the sample in liquid also protects the
tissue specimen from photo-damage; enabling more powerful lasers of shorter
wavelengths to be used, longer acquisition times and higher numbers of accumulations
to be employed hence, improving spectral quality.
We present a comparison of Raman and immersion Raman recorded spectra,
with a study highlighting the use of immersion Raman spectroscopy for the rapid
diagnosis of site of origin of metastatic brain tumours. Vibrational spectroscopy has the
ability to revolutionise the clinical environment allowing for increased efficiency within
the diagnostic regime with corresponding decreases in mortality, morbidity and
economic impact upon the health services [30].
Experimental
Study participants
Tissue sections were cut using a microtome. Parallel tissue sections of 4 µm in
thickness were cut for glass microscope slides and 10 µm for CaF2 (Crystran, UK)
substrates. Tissue was obtained from formalin fixed paraffin preserved (FFPP) tissue
blocks from the Brain Tumour North West (BTNW) bio-bank under ethical approval
(BTNW/WRTB 13_01). Patient data consisted of histological information, patient
gender, and date of birth and origin of metastasis/histological subtype. A total of 48
tissue specimens were obtained from 41 different patients. Tissue consisted of normal
brain samples (n=7), glioblastoma multiforme (GBM) brain samples WHO (World
Health Organisation) grade IV (n=5), metastatic brain samples (n=29) and primary

108
cancer tissue samples (n=7). Table 1 displays further information about the tissue
specimens.
Table 1 Patient details with histological subtype and metastatic origin.
BTNW no. Gender DOB Origin of Metastasis/histological
subtype
119 F 26/06/1963 Breast (met and primary site)
707 F 07/08/1945 Breast (met and primary site)
756 F 15/03/1957 Breast (met and primary site)
888 M 25/11/1948 Colon/rectum (met and primary site)
985 M 05/02/1933 Melanoma (met and primary site)
988 M 30/12/1949 Oesophagus & stomach (met and
primary site)
1001 F 20/12/1944 Lung (met only)
690 / 1012 F 25/10/1960 Breast (met and primary site)
1004 F 03/09/1956 Breast (met only)
998 / 1010 M 25/07/1946 Colon (met only)
1020 F 05/06/1948 Breast (met only)
2 F 28/10/1937 GBM
3 F 22/09/1981 GBM
4 M 08/12/1942 GBM
5 F 29/10/1958 GBM
7 M 14/04/1939 Normal Brain
10 F 13/06/1929 GBM
78 F 24/09/1955 Lung (met only)
106 F 14/02/1965 Normal Brain
132 F 24/06/1943 Normal Brain
136 F 25/09/1956 Normal Brain
137 M 26/04/1944 Colon/rectum (met only)
164 M 10/04/1954 Oesophagus & stomach (met only)
184 F 21/11/1948 Lung (met only)
215 M 21/01/1973 Lung (met only)
274 M 12/07/1940 Colon/rectum (met only)
295 F 12/06/1936 Lung (met only)
358 M 08/05/1935 Melanoma (met only)
409 F 08/08/1925 Colon/rectum (met only)
444 M 30/01/1978 Normal Brain
509 M 11/02/1930 Melanoma (met only)
517 F 05/06/1955 Lung (met only)
521 M 18/01/1949 Oesophagus & stomach (met only)
562 F 12/03/1953 Lung (met only)
567 F 09/04/1947 Melanoma (met only)
668 F 30/08/1943 Colon/rectum (met only)
678 F 13/11/1961 Normal Brain
688 F 15/06/1965 Melanoma (met only)
694 M 18/09/1951 Lung (met only)
721 F 04/01/1976 Oesophagus & stomach (met only)
772 M 21/09/1972 Normal Brain
Dewaxing and Haematoxylin and Eosin staining of tissue
Tissue sections on the microscope slides were stained with Haematoxylin and
Eosin (H&E) for histological examination So as to remove the paraffin, tissue sections

109
were de-waxed through 2 x 5 minute baths of Histoclear followed by 2 x 5 minute baths
of ethanol. Prior to H&E staining, tissue sections were washed in distilled water for 5
minutes after de-waxing. Sections were then bathed in haematoxylin for 5 minutes and
washed in warm tap water to allow the nuclei to turn blue. The sections were then
covered in eosin for 4 minutes and washed off with distilled water. Finally, the tissue
sections were dehydrated in 2 x 5 minute baths of ethanol and cleared in 2 x 5 minute
baths of Histoclear tissue sections were protected and preserved through the application
of Histomount and a coverslip. The sections were then microscopically examined in
order to identify the metastatic sites present in the tissue.
Figure 1 Microscopic images of H&E stained tissue sections of normal brain, metastatic brain, primary
sites and GBM brain WHO grade IV (x 100). Scale bar represents 50 microns.
Figure 1 shows the microscopic images of the H & E stained tissue samples at x
100 magnification. It can be observed that normal, metastatic and GBM brain tissue

110
architecturally differ from one another, with differences also being observed between
the differing metastatic types.
Tissue section preparation for Raman spectroscopic analysis
The tissue sections on the CaF2 substrates also needed to be de-waxed prior to
Raman analysis, in order to reduce the paraffin peak contributions in the spectra. The
de-waxing procedure consisted of 3 x 5 minute baths of Histoclear followed by 3 x 5
minute baths of ethanol. The sections were left to air dry for 30 minutes, placed in a
Petri dish and stored in a desiccator until spectroscopic analysis.
Raman spectroscopy instrumentation and analysis
Spectroscopic measurements were carried out on a Horiba Jobin-Yvon LabRAM
HR800 spectrometer. An air cooled CLDS point mode diode 785 nm laser with a single
edge filter (cut off to 100 cm-1
) and an output power of 300mW was used to acquire
spectra; which was used with a grating of 300 gr/mm and blazed at 1000 nm. Non-
immersion point spectra were acquired using a 0.9 numerical aperature (x 100)
(MPlanN) objective and immersion point spectra were acquired using a 0.75 numerical
aperature (x 60) objective (LUMPlanFLN, Olympus). The confocal hole was set at 100
µm for 785 nm spectral collections. The detector used was an Andor electromagnetic
(EM) charged coupled device (CCD). A video camera within the Raman system was
used to take images of the specimens.
The instrumentation was calibrated before operation to silicon at the spectral line
of 520.8 cm-1
. Spectra were acquired using the 785 nm laser at 100% exposure for 30 s
and accumulated twice, with both the immersion and non-immersion objectives. A total
of 1574 spectra were generated through the production of 20 spectra from three to five
areas on each tissue sample, ensuring a representative area was used to gather data.

111
Immersion Raman spectroscopy was carried out by submerging the tissue sample in
deionised water for spectral collection.
Data pre-processing and multivariate analysis
Pre-processing and multivariate analysis was carried out on the raw data using
LabSpec 6 spectroscopy software suite (HORIBA Scientific) and MATLAB version
7.11.0 (R2010b) (The MathWorks, Inc., USA) using in-house written software. Pre-
processing methods were kept to a minimum to enable better reproducibility; data were
background subtracted through the application of a fifth order polynomial and smoothed
using 7 point smoothing (Labspec 6) and vector normalised. Paraffin peaks were
removed from the spectra for multivariate analysis at the following wavenumbers: 882
cm-1
- 912 cm-1
, 1051 cm-1
- 1071 cm-1
, 1115 cm-1
- 1143 cm-1
, 1163 cm-1
– 1187 cm-1
,
1284 cm-1
– 1305 cm-1
and 1407 cm-1
– 1501 cm-1
. Multivariate analysis was then
carried out on the data set using PC-DFA.
Principal component analysis (PCA) is an unsupervised multivariate algorithm
used to find spectral differences between recorded spectra. Being unsupervised means
that the algorithm has no priori information on the grouping of the recorded spectra,
PCA can only find orthogonal dimensions of spectral variance. One advantage to PCA
is that can be used to reduce the dimensionality of the dataset prior to discriminate
classification algorithms, such as Linear Discriminant Analysis (LDA). Without
dimension reduction, LDA can overfit, producing over generous classification results
based on random errors or noise, and not on the relationships between the recorded
spectra. LDA is a supervised technique requiring prior knowledge of the group classes
beforehand. LDA then finds the best linear hyperlane between the class groups at each
variable dimension, maximising the intergroup variance and minimising the intragroup
variance. The PC-LDA models created were tested using cross-validation, partitioning

112
the data matrix into two sets (training set and test set). One third of the original data set
was randomly removed while the remaining training set data is used to build the
classification model. The classification model is then tested using the removed (blind)
test set spectra [31, 32]. The performance of the model is judged on how well the
model, built using the training set, predicts the new and previously unseen test set data.
PC-LDA model performance was judged through the percentage of test set spectra
correctly classified (%CC) and spectra classification sensitivities and specificities based
on the confidence ellipses plotted (95% (outer ellipse) and 90% (inner ellipse)). This
study investigates three different PC-LDA models.
Results and Discussion
Raman and Immersion Raman spectroscopy comparison
The averaged raw spectra of all tissue samples on CaF2 using immersion and
non-immersion Raman spectroscopy are shown in Figure 2. It is clear that the averaged
immersion Raman spectrum has an initial lower spectral background than the averaged
non-immersion spectrum in the 600 cm-1
to 930 cm-1
spectral range, which remains at a
relatively stable intensity throughout. Immersion Raman also produces better delineated
peaks with larger areas than spectra acquired by non-immersion Raman. Therefore, due
to the advantage of better spectral quality, immersion Raman spectroscopy was chosen
over standard techniques to analyse its potential as a diagnostic tool for metastatic brain
cancer and its ability to identify primary cancer sites of origin.
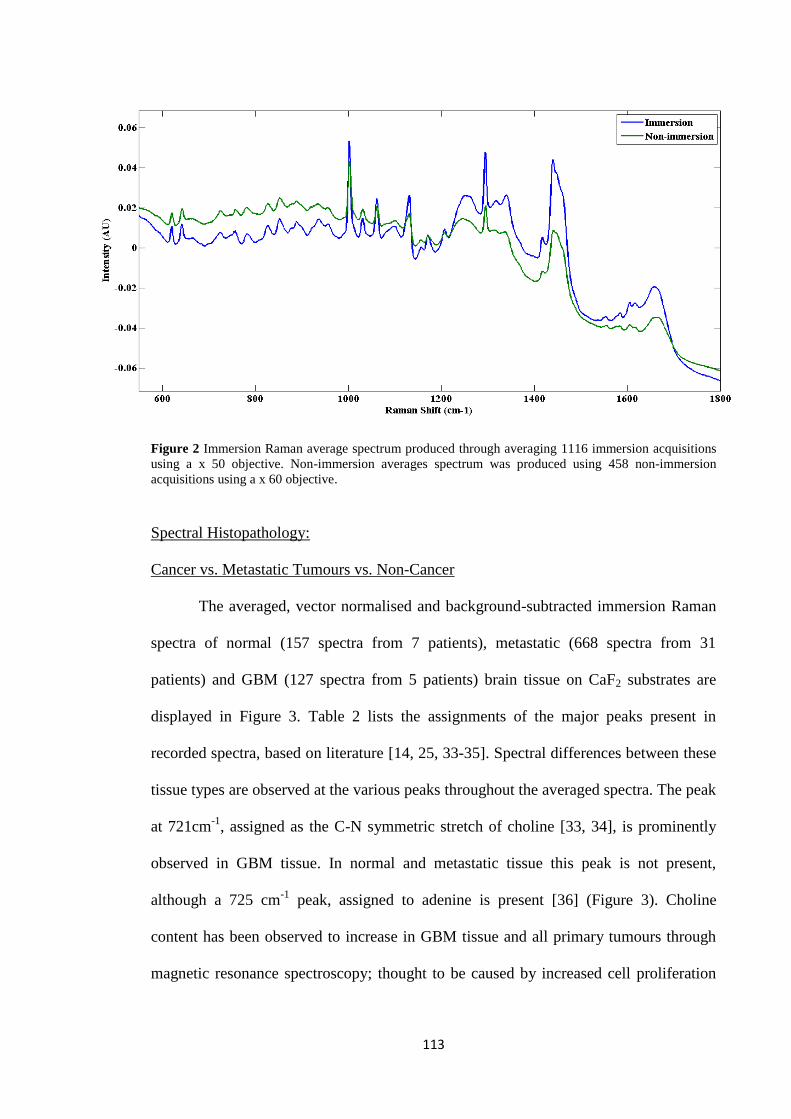
113
Figure 2 Immersion Raman average spectrum produced through averaging 1116 immersion acquisitions
using a x 50 objective. Non-immersion averages spectrum was produced using 458 non-immersion
acquisitions using a x 60 objective.
Spectral Histopathology:
Cancer vs. Metastatic Tumours vs. Non-Cancer
The averaged, vector normalised and background-subtracted immersion Raman
spectra of normal (157 spectra from 7 patients), metastatic (668 spectra from 31
patients) and GBM (127 spectra from 5 patients) brain tissue on CaF2 substrates are
displayed in Figure 3. Table 2 lists the assignments of the major peaks present in
recorded spectra, based on literature [14, 25, 33-35]. Spectral differences between these
tissue types are observed at the various peaks throughout the averaged spectra. The peak
at 721cm-1
, assigned as the C-N symmetric stretch of choline [33, 34], is prominently
observed in GBM tissue. In normal and metastatic tissue this peak is not present,
although a 725 cm-1
peak, assigned to adenine is present [36] (Figure 3). Choline
content has been observed to increase in GBM tissue and all primary tumours through
magnetic resonance spectroscopy; thought to be caused by increased cell proliferation

114
and cell membrane turnover, resulting in an increased production of choline transporters
and kinase enzymes [37].
GBM and metastatic tissue both exhibit 782 cm-1
peaks of a considerable
intensity in their spectra, assigned to nucleotide ring breathing [25], whereas the peak in
the normal tissue spectrum is much weaker and is not easily identifiable in the spectra.
A peak at ~1081 cm-1
, assigned to PO2− symmetric stretching (nucleic acids) [38], is
observable in the averaged spectrum of normal brain tissue yet appears absent from the
spectra of cancerous tissue (Figure 3).
An amide III peak is present at 1263 cm-1
[35] in the normal tissue spectrum but
for GBM and metastatic brain tissue spectra, the peak has been shifted to 1250 cm-1
,
possibly as a result of peak broadening, or changes in hydrogen bonding. As well as the
shift, there is a noticeable increase in amide III peak intensity from the GBM and
metastatic brain average spectra, when compared to normal tissue spectrum. As the 782
cm-1
has previously associated with ring breathing vibrations of nucleic acids [39] the
increase in intensity from the 782 cm-1
and may suggest an increase in cellular density
from the cancerous tissue. The increase in intensity from the amide III band may well be
in agreement with this, showing an increase in cellular proteins as a result of increased
cell mass in the tissue.
The peak present at approximately 1658 cm-1
, attributed to the C=O stretch of
amide I [25] appears to be shifted in the average spectrum of metastatic to a higher
Raman shift of 1661 cm-1
. The intensity of this 1658 cm-1
peak is also decreased in both
the cancerous spectra. This is consistent with the report of Gniadecka et al., who found
reduced intensities of the amide I band of proteins in the spectra of melanoma. The

115
changes in the amide bands between the normal and melanoma specimens are attributed
to conformational changes to the protein structures [40].
It can also be observed from the averaged spectrum of normal tissue that the
paraffin peaks (asterisked peaks) present are of a much lower intensity than those in the
spectra of metastatic and GBM tissue. This could be attributed to either structural or
compositional differences between the tissue types showing a tissue effect on the
dewaxing efficacy [27].
Figure 3 GBM, Metastatic and normal brain tissue average spectrums, recorded using immersion Raman
spectroscopy. The GBM spectrum was created from averaging 127 GBM acquisitions, the Metastatic
from 668 metastatic acquisitions and the normal brain spectrum from 157 normal brain acquisitions.
Spectra have been vector normalised, the backgrounds have been corrected using a 5th order polynomial
fit and 7 points of smoothing. The asterisks correspond to paraffin peaks from residual wax in the tissue.
Table 2 Bio-molecular assignments of main spectral peaks.
Raman Shift (cm-1
) of peak Tentative assignment [14, 25, 33-35, 38]
524 S-S stretch in proteins
550 Tryptophan/cytosine, guanine
620 C-C twisting mode of phenylalanine
641 C-C twisting mode of tyrosine
666 C-S stretching mode of cystine
721 (only GBM) Symmetric choline C-N stretch (membrane phospholipid head)/adenine
725 Adenine/C-S (protein)/C-H2
756 Symmetric breathing of tryptophan

116
782
805
Cytosine/uracil ring breathing of nucleotide
A-DNA [38]
827 DNA O-P-O, cytosine, uracil, thymine
852 (CCH) ring breathing mode of tyrosine and C-C stretch of proline ring
870 Proline
888
925
Paraffin wax
C-C stretching mode of proline [38]
934 C-C stretching mode of proline and valine and α-helix protein backbone/glycogen
957 Hydroxyapartite (PO43-
symmetric stretching) /carotenoid/cholesterol
1002 Symmetric ring breathing mode of phenylalanine
1031 C-H in-plane bending mode phenylalanine
1061 Paraffin wax
1081 (only normal) PO2− symmetric stretching (nucleic acids) [38]
1098 C-C/C-O phospholipids
1131 Paraffin wax
1156 C-C carotenoids, C-N stretching of proteins
1171 Paraffin wax
1207
1234
Hydroxyproline, tyrosine/tryptophan, phenylalanine (C-C6H5)
Antisymmetric phosphate stretching [38]
1250 Amide III: (β-sheet, protein) [38]
1263 (only normal) Amide III: (α-helix, protein) [38]
1294 Paraffin wax
1318 CH3 CH2 twisting mode of collagen/lipids
1340 CH3 CH2 wagging mode of collagen, nucleic acids
1389
1397
CH3 bend
CH3 bending due to methyl bond in the membrane [38]
1417 Paraffin wax
1440 Paraffin wax
1449 CH2 bending mode of proteins/(CH3) (CH2) collagen
1462 Paraffin wax
1554 C=C Tryptophan, porphyrin
1578 Guanadine, adenine, TRP (protein)
1584 Pyrimidine ring (nucleic acids) and heme protein/C=C phenylalanine
1604 C=C in-plane bending mode of phenylalanine and tyrosine, C=C porphyrin
1618 C=C stretching mode of tyrosine and tryptophan
1658
1670
Amide I (C=O stretching mode of proteins, α-helix conformation)/C=C lipid stretch
Amide I (Proteins with β-sheet conformational structures)
The mean spectral intensity changes between spectral peaks of normal, GBM
and metastatic brain tissue (Figure 3) indicate alterations in specific biomolecule

117
concentrations when the tissue is in different states of health. These observable spectral
differences demonstrate the ability of Raman spectroscopy as a potential diagnostic tool
for brain cancer.
Figure 4 (a) LDA scores plot showing the separation of GBM (blue), metastatic (green) and normal
brain tissue (black) spectra. Training spectra displayed with symbols filled and test spectra un-filled, 95%
(outer ellipse) and 90% (inner ellipse) confidence limits are also shown; PC-LDA training model created
using the first 12 PCs, which achieved a %CC score of 72% (b) LDA scores plot of the same data used in
(a) but with the spectra averaged. The 20 spectra recorded from each patient tissue sample were split into
4 and averaged. The training model was created using the first 8 PCs and achieved a % CC score of 97%.
(a)
(b)

118
As a result of there being spectral differences between GBM, Metastatic and
normal brain tissue mean spectra (Figure 3), the recorded spectra were investigated
using PC-LDA to see if linear separation boundaries could be found between the spectra
recorded from the different tissue types in multidimensional space (Figure 4). Figure 4
shows a LDA scores plot (LDA1 vs. LDA2) of spectra recorded from GBM, Metastatic
and normal brain tissue using immersion Raman spectroscopy. Although complete
separation of the different tissue type spectra is not seen in the LDA scores plot (a
degree of overlap seen between the different groups), there is some separation between
spectra recorded from all three tissue types. The majority of GBM and normal brain
tissue spectra are separated from Metastatic tissue spectra along the LDA 1 axis, and the
majority of normal brain tissue spectra can be discriminated from GBM spectra along
the LDA 2 axis. However, it can be seen in Figure 1 that all tissue types have some
degree of tissue heterogeneity, with some Metastatic tissue types and GBM tissue being
very heterogeneous. The heterogeneous nature of GBM tissue is said to be due to areas
of necrosis found in the tissue surrounded by pseudopalisades and microvascular
hyperplasia, believed to be instrumental in the accelerated growth of GBM [41]. By
investigating different areas on each tissue sample with Raman spectroscopy there is the
possibility that non-cancerous tissue chemistry will be captured when investigating very
heterogeneous cancerous tissue. This is possible reflected in Figure 4 (a), which shows
that both Metastatic and GBM tissue spectra have some overlap with normal tissue
spectra. Therefore, the spectra used for Figure 4 (a) was split into smaller groups and
averaged (The 20 spectra recorded from each patient tissue sample were split into 4 and
averaged). This produced the LDA model displayed in Figure 4 (b), which now shows
good separation between all three classes of tissue spectra; producing a classification

119
model performance score of 97%CC. Details of both PC-LDA models created in Figure
4 can be found in Table 3.
Figure 5 displays the LDA loadings plots relating to the LDA scores plot in Figure 4
(b). Table 4 identifies the Raman shifts from the LDA 1 and 2 loading plots which are
responsible for distinguishing normal, Metastatic and GBM tissue spectra. The LDA 1
axis separates the Metastatic tissue spectra from the rest. The main peaks in the LDA 1
loading plot included the 718, 925, 1250, 1400 and 1670 cm-1
Raman bands associated
with symmetric choline C-N stretch (membrane phospholipid head)/adenine, C-C
stretching mode of proline, Amide III band, CH3 bending mode due to methyl bond in
the membrane and the Amide I C=O stretching mode of β-sheet structural proteins
respectively. These spectral differences are in agreement with the mean spectra and
show the Metastatic tissue spectra to have reduced intensities from the 718 and 925 cm-1
peak’s, and increased intensities from the 1250 1400, and 1670 cm-1
peaks when
compared to the tissue spectra recorded from the GBM and normal tissue. The LDA 2
axis in Figure 4 (b) separates the majority of GBM and Metastatic spectra from normal
tissue spectra. The main peaks in the LDA 2 loading plot included the 719, 780/805,
1078, 1234, 1268, 1653, 1672 cm-1
Raman bands associated with symmetric choline C-
N stretch, cytosine/uracil ring breathing of nucleotide/A-DNA, PO2 symmetric
stretching (nucleic acids), antisymmetric phosphate stretching, Amide III: (α-helix,
protein), Amide I (C=O stretching mode of proteins, α-helix conformation) and the
Amide I C=O stretching mode of β-sheet structural proteins respectively. The loading
peaks at 1235 and 1268 are in agreement with the mean spectral differences, which
show the Amide III peak in the cancerous spectra to shift from 1268 cm-1
, associated
with α-helix protein, to a lower frequency associated with β-sheet protein. The LDA 2
loading plot and mean spectral comparisons also show the cancerous spectra to have

120
reduced intensity from the Amide I α-helix peak when compared to the normal tissue
spectra, while the cancerous spectra also show increased intensity at ~1670 cm-1
,
associated with Amide I proteins with β-sheet structural conformations. This may
suggest a link between protein secondary structure content and cancerous tissue.
Yamada et al. also showed β-sheet protein levels to increase significantly when
investigating necrotic areas of murine carcinoma using FT-IR microspectroscopy. The
increase in β-sheet protein levels coincided with a sharp decrease in α-helix protein
levels, in agreement with our results [42]. It can also be seen from the Figure 5 (b) that
the cancerous tissue spectra have increased intensity from peaks associated with nucleic
acids and DNA structures. As previously described, the increase intensity from nucleic
acid structures may suggest an increase in cellular density from the cancerous tissue, in
agreement with increased cell proliferation.
Table 3 PC-LDA model details, including spectral numbers and the resulting sensitivities and
specificities.
Train
spectr
a
Test
spectr
a
Confidence
level
Histopathological
type
Sensitivit
y (%)
Specificit
y (%)
GBM vs.
norm vs.
met
639 316 90% GBM 90.48 22.26
Normal 91.89 88.30
Metastatic 98.08 59.09
95% GBM
Normal
Metastatic

121
Figure 5 (a) PC-LDA loading plot of the LDA 1 separation boundary produced in Figure 4 (b) (pink)
(upper curves) and mean spectra (lower curves), GBM (blue), metastatic (green) and normal tissue
spectra (black) (b) PC-LDA loading plot of the LDA 2 separation boundary produced in Figure 4 (b).
(a)
(b)

122
LDA1 loading bands LDA2 loading bands
~Negative Loading
Band Position (cm-1
)
~Positive Loading
Band Position (cm-1
)
~Negative Loading
Band Position (cm-1
)
~Positive Loading
Band Position (cm-1
)
524
642
718
925
1200
1010
1250
1402
1670
642
719
780
805
998
1234
1338
1375
1578
1613
1673
550
869
1078
1268
1653
Table 4 Spectral differences causing the separations seen in Figure 4 (b).
From the mean spectral differences (Figures 3 and 5) it can be visibly seen that
the average normal brain tissue spectrum has a low intensity from the 782 cm-1
peak,
when compared to the average GBM and Metastatic spectra. It can also be seen that the
average GBM mean spectrum has a much greater intensity in the 721 cm-1
peak than the
average normal tissue and metastatic spectrums. As a result, a 2D scores plot was
produced based on the intensity ratios between the 721/782 cm-1
peaks and the 620 cm-1
peak (620 cm-1
peak intensity was relatively uniform in all the recorded spectra) (Figure
6). Figure 6 shows the 721 and 782 cm-1
peaks to be significant discrimination markers
for GBM, Metastatic and normal tissue spectra, with average GBM, Metastatic and
normal tissue spectra clearly grouped in the 2D scores plot. This shows that the 721 and
782 cm-1
peaks could potentially be markers for diseased tissue therefore, the
monitoring of these peak intensities through Raman spectroscopy may aid the early
diagnosis of disease. However, Figure 6 does show two spectra which cannot be
grouped with their representative class, identified as patient 007 and 509, belonging to
the normal and metastatic group respectively. Upon visual inspection of the spectra, it
was observed that they notably differed from the total averaged spectra for their tissue
types. This could potentially be a result of tissue misclassification.

123
Primary site analysis
Raman spectra were also recorded from tissue representative of primary cancers
(breast, melanoma, oesophagus and stomach and colon/rectum) and patient averaged.
The primary cancer tissue samples are linked samples (from the same patient) of
corresponding metastatic tissue samples in the metastatic tumour model. As before, PC-
LDA was performed on the spectra recorded from the tissue samples using immersion
Raman spectroscopy. The LDA scores plot (Figure 7) shows that spectra recorded from
the colon/rectum (blue) and oesophagus & stomach cancerous tissue (green) have some
good separation from the remaining spectra. Less clear is the separation of the primary
breast and melanoma tissue spectra which are shown to be spectrally similar. This may
suggest that the tissue architecture of both primary breast and melanoma tissue is
similar.
Figure 6 2D score plot of the 620 cm-1
to 782 cm-1
peak ratio versus the 721 cm-1
to 620 cm-1
peak ratio.
Each data point is the spectral patient average.

124
Figure 7 LDA scores plot of average spectra recorded from primary breast (black), primary colon/rectum
(blue), primary melanoma (red) and primary oesophagus & stomach (green) cancerous tissue. Training
spectra displayed with symbols filled and test spectra un-filled, 95% (outer ellipse) and 90% (inner
ellipse) confidence limits are also shown; training model created using the first 12 PCs and achieved a %
CC score of 72%.
Train
spectr
a
Test
spectr
a
Confidence
level
Histopathological
type
Sensitivit
y (%)
Specificit
y (%)
Metastatic
comparison
90% Breast 89.29 85.71
Lung 60.00 72.22
Colon/Rectum 92.31 60.78
Melanoma 80.00 83.33
Oesophagus &
stomach
87.50 54.17
Primary
comparison
111 53 90% Breast 89.29 85.71
Colon/Rectum 100 54.76
Melanoma 71.43 38.90
Oesophagus &
stomach
85.71 100
Table 5 PC-LDA model details, including spectral numbers and the resulting sensitivities and
specificities.

125
Analysis of site of origin
Figure 7 shows that the identification of spectra recorded from some primary cancers is
possible using multivariate classification algorithms. As the origins of metastatic brain
tissue are determined from the tissue architecture observed, it should also be possible to
determine metastatic brain tissue origins from the spectra recorded. Therefore, PC-LDA
was also performed on the metastatic tissue data with the LDA scores plot displayed in
Figure 8. As with the data used in Figure 4 (b), the 20 spectra recorded from each
patient tissue sample were split into 4 and averaged. The LDA scores plot in Figure 8
shows that although there is some overlap between the spectra recorded from each type
of brain metastases, there is some separation between metastatic breast (blue),
melanoma (red), oesophagus & stomach (black) and colon/rectum (green)/lung (cyan)
spectra. As spectra recorded from both metastatic colon/rectum and lung tissue almost
overlap in LDA scores space, this may suggest that the different tissue types have
similar tissue architecture. The spectral similarities may also be due to not enough
spectra being recorded from the different tissue types, and as a result, spectra recorded
from the three different sites of each patient sample have not been able to capture the
differing tissue architecture which would discriminate between the two. However, it
may also be possible that that the movement of metastatic cancer from primary sites to
the brain effects the biochemistry of the cancers, with all metastatic cancer found in the
brain becoming biochemically similar due to their new environment. One of the reasons
for this could be that the movement of metastatic cancer from primary sites to the brain
effects the biochemistry of the cancers, with all metastatic cancer found in the brain
becoming biochemically similar due to their new environment. This would suggest that
biochemical differences between primary cancers are generally a result of the organ
location and not the cancer type.

126
Figure 8 LDA scores plot of average spectra recorded from metastatic breast (blue), colon/rectum met
(green), lung met (cyan) melanoma met (red) and oesophagus & stomach met (black). Training spectra
displayed with symbols filled and test spectra un-filled, 95% (outer ellipse) and 90% (inner ellipse)
confidence limits are also shown; training model created using the first 9 PCs and achieved a % CC score
of 63%.
(a) (b)
(1)

127
Figure 9 (a) Mean spectral comparisons of primary (blue) and Metastatic brain tissue (black) (b) PCA
comparisons of primary and Metastatic brain tissue recorded spectra (2d PCA scores plot displaying the
best separation between Primary and Metastatic tissue). The spectra have been vector normalised,
baseline corrected by 5th
order polynomial fit and subtraction, and 7 points of smoothing (1) Primary
Breast spectra vs. Met Breast tissue spectra (2) Primary Colon/Rectum spectra vs. Met Colon/Rectum
tissue spectra (3) Primary Melanoma vs. Met Melanoma tissue spectra (4) Primary Oesophagus and
Stomach spectra vs. Met Oesophagus and Stomach tissue spectra.
(2)
(3)
(4)

128
Spectral analysis of primary site and corresponding brain metastasis
Figure 9 (a) displays the baseline-subtracted averaged spectra of both Metastatic
brain and their corresponding primary sites. It is observable from Figure 9 (a) that the
Metastatic spectra (black) from the different sites of primary origin all look similar,
whereas the same cannot be said from the primary cancer spectra (blue), with primary
Colon/Rectum, Melanoma and Oesophagus and Stomach tissue spectra all showing
mean spectral differences when compared against their corresponding primary sites.
This supports the theory that the movement of metastatic cancer from primary sites to
the brain affects the biochemistry of the cancers, with all metastatic brain tissue spectra
having similar chemistry when in the brain. However, the mean breast cancer tissue
spectrum and the corresponding metastatic brain tissue spectrum appear relatively
similar to one another. The PCA scores plot also shows no separation between the
primary and Metastatic breast spectra therefore, suggesting that there is no real change
from primary and Metastatic breast tissue. The spectral differences between
Colon/Rectum cancer tissue and the metastatic brain tissue are not large and vary
mainly through differences in peak intensities. The primary site tissue spectrum exhibits
much higher intensity peaks than the spectrum of metastatic brain tissue. The spectral
differences between oesophagus and stomach tissue and metastatic brain tissue are far
more obvious than between the spectra of the other cancers. The most noticeable
disparity between the two average spectra is due to the peak at 1621 cm-1
, which is
much more intense in the primary site spectrum than the metastatic brain spectrum.
Furthermore, the amide I peak, at 1658 cm-1
, is much less intense in the primary site
spectrum than the metastatic brain spectrum which produces an unusual ratio between
the two peaks. Also, a peak at ~796 cm-1
is displayed in the primary site spectrum but is
not present in the spectrum of metastatic brain. For melanoma tissue, the spectral
differences between melanoma primary site and metastatic tissue are primarily due

129
spectral differences seen from the amide I peak, the amide III and peaks present
between 850 - 950 cm-1
.
Conclusion
In this study, we have demonstrated the use of immersion Raman spectroscopy
to differentiate between GBM, metastatic and normal brain tissue with sensitivities and
specificities of 100% and 94.44% respectively for GBM, 96.55% and 100%
respectively for metastatic brain, and 85.71% and 100% respectively for normal brain
tissue, based on the intensity ratios between the 721/782 cm-1
peaks. This shows that the
Raman spectral peaks at 721 and 782 cm-1
, primarily associated with the symmetric C-
N stretch of choline and the cytosol/uracil ring breathing of nucleotides respectively,
may be possible spectral biomarkers for the discrimination of normal, GBM and
Metastatic tissue. As well as this, PC-LDA was performed on the tissue spectra
producing good separation of GBM, Metastatic and normal tissue spectra, again
highlighting the potential of the analytical technique for the classification of cancerous
tissue. As well as investigating GBM, Metastatic and normal tissue spectra, this study
has also been able to distinguish some of the different primary site cancerous tissue and
the different Metastatic brain cancerous tissue, based on the Raman spectra recorded.
Being able to able to distinguish Metastatic brain tissue origins based on recorded
Raman spectra, coupled with supervised multivariate analysis, would be non-subjective,
therefore, the analytical technique could be used as a qualitative tool alongside
neuropathology for disease diagnosis. For the first time the chemistry of Metastatic
brain and their corresponding primary site tissue have also been investigated in this
study by Raman spectroscopy, with primary Colon/Rectum, primary Melanoma and
primary Oesophagus and Stomach tissue all being separated from their representative
Metastatic brain tissue in PCA scores space, plus, significant mean spectral differences

130
were observed. Interestingly, this suggests that in some cases, that the movement of
metastatic cancer from primary sites to the brain effects the biochemistry of the cancers,
with metastatic cancerous tissue found in the brain becoming biochemically similar due
to the new environment.
Acknowledgements
The authors would like to acknowledge the support of the Sydney Driscoll
Neuroscience Foundation, Rosemere Cancer Foundation, Brain Tumour North West, the
Centre for Materials and Science at the University of Central Lancashire, the Focas
Institute at Dublin Institute of Technology, the European Community Action Scheme for
the Mobility of University Students and the Association of British Spectroscopists. The
Focas Research Institute is supported through the National Biophotonics and Imaging
Platform (NBIP) Ireland funded under the Higher Education Authority PRTLI
(Programme for Research in Third Level Institutions) Cycle 4, co-funded by the Irish
Government and the European Union.

131
References
1. Cancer Research UK. All cancers combined key facts. 2012 [15/04/2013]; Available from: http://www.cancerresearchuk.org/cancer-info/cancerstats/keyfacts/Allcancerscombined/.
2. Richards, G.M., D. Khuntia, and M.P. Mehta, Therapeutic management of metastatic brain tumors. Critical Reviews in Oncology/Hematology, 2007. 61(1): p. 70-78.
3. Brain Research Trust. About Brain Tumours. [cited 2012 08/10]; Available from: http://www.brt.org.uk/brain-tumours.
4. Soffieti, R., P. Cornu, J. Y. Delattre, R. Grant, F. Graus, W. Grisold, J. Heimans, J. Hildebrand, P. Hoskin, M. Kallijo, P. Krauseneck, C. Marosi, T. Siegal and C. Vecht, Brain Metastases. European Handbook of Neurological Managments, 2nd ed. (eds: N. E. Gilhus, M. P. Barnes and M. Brainin), 2011. 1: p. 437-445.
5. Bergner, N., B.F.M. Romeike, R. Reichart, R. Kalff, C. Krafft, and J. Popp, Raman and FTIR microspectroscopy for detection of brain metastasis. Clinical and Biomedical Spectroscopy and Imaging II, 2011: p. 80870X-80870X.
6. Mahadevan-Jansen, A. and R.R. Richards-Kortum, Raman spectroscopy for the detection of cancers and precancers. Journal of Biomedical Optics, 1996. 1(1): p. 31-70.
7. Krafft, C., S.B. Sobottka, G. Schackert, and R. Salzer, Analysis of human brain tissue, brain tumors and tumor cells by infrared spectroscopic mapping. Analyst, 2004. 129(10): p. 921-925.
8. Raab, S.S., D.M. Grzybicki, J.E. Janosky, R.J. Zarbo, F.A. Meier, C. Jensen, and S.J. Geyer, Clinical impact and frequency of anatomic pathology errors in cancer diagnoses. Cancer, 2005. 104(10): p. 2205-13.
9. Ellis, D.I., and R. Goodacre, Metabolic fingerprinting in disease diagnosis: biomedical applications of infrared and Raman spectroscopy. Analyst, 2006. 131: p. 875-885.
10. Choo-Smith, L.P., H.G.M. Edwards, H.P. Endtz, J.M. Kros, F. Heule, H. Barr, J.S. Robinson, H.A. Bruining, and G.J. Puppels, Medical applications of Raman spectroscopy: From proof of principle to clinical implementation. Biopolymers, 2002. 67(1): p. 1-9.
11. Moros, J., S. Garrigues, and M. de la Guardia, Vibrational spectroscopy provides a green tool for multi-component analysis. TrAC Trends in Analytical Chemistry, 2010. 29(7): p. 578-591.
12. Gajjar, K., L. D. Heppenstall, W. Pang, K. M. Ashton, J. Trevisan, I. I. Patel, V. Llabjani, H. F. Stringfellow, P. L. Martin-Hirsch, T. Dawson and F. L. Martin, Diagnostic segregation of human brain tumours using Fourier-transform infrared and/or Raman spectroscopy coupled with discriminant analysis. Analytical Methods, 2012.
13. Krafft, C., S.B. Sobottka, G. Schackert, and R. Salzer, Raman and infrared spectroscopic mapping of human primary intracranial tumors: a comparative study. Journal of Raman Spectroscopy, 2006. 37(1-3): p. 367-375.
14. Huang, Z., A. McWilliams, H. Lui, D. I. McLean, S. Lam and H. Zeng,, Near-infrared Raman spectroscopy for optical diagnosis of lung cancer. International Journal of Cancer, 2003. 107(6): p. 1047-1052.
15. Teh, S.K., W. Zheng, K.Y. Ho, M. Teh, K.G. Yeoh, and Z. Huang, Near-infrared Raman spectroscopy for early diagnosis and typing of adenocarcinoma in the stomach. British Journal of Surgery, 2010. 97(4): p. 550-557.
16. Bergholt, M.S., W. Zheng, K. Lin, K.Y. Ho, M. Teh, K.G. Yeoh, J.B. Yan So, and Z. Huang, In vivo diagnosis of gastric cancer using Raman endoscopy and ant colony optimization techniques. International Journal of Cancer, 2011. 128(11): p. 2673-80.
17. Lieber, C.A., S.K. Majumder, D.L. Ellis, D.D. Billheimer, and A. Mahadevan-Jansen, In vivo nonmelanoma skin cancer diagnosis using Raman microspectroscopy. Lasers in Surgery and Medicine, 2008. 40(7): p. 461-467.

132
18. Lin, K., D.L.P. Cheng, and Z. Huang, Optical diagnosis of laryngeal cancer using high wavenumber Raman spectroscopy. Biosensors and Bioelectronics, 2012. 35(1): p. 213-217.
19. Abramczyk, H., J. Surmacki, B. Brożek-Płuska, Z. Morawiec, and M. Tazbir, The hallmarks of breast cancer by Raman spectroscopy. Journal of Molecular Structure, 2009. 924–926(0): p. 175-182.
20. Moreno, M., L. Raniero, E.A.L. Arisawa, A.M. do Espirito Santo, E.A.P. dos Santos, R.A. Bitar, and A.A. Martin, Raman spectroscopy study of breast disease. Theoretical Chemistry Accounts, 2009.
21. Kanter, E.M., E. Vargis, S. Majumder, M.D. Keller, E. Woeste, G.G. Rao, and A. Mahadevan-Jansen, Application of Raman spectroscopy for cervical dysplasia diagnosis. Journal of Biophotonics, 2009. 2(1-2): p. 81-90.
22. Lyng, F.M., E.Ó. Faoláin, J. Conroy, A.D. Meade, P. Knief, B. Duffy, M.B. Hunter, J.M. Byrne, P. Kelehan, and H.J. Byrne, Vibrational spectroscopy for cervical cancer pathology, from biochemical analysis to diagnostic tool. Experimental and Molecular Pathology, 2007. 82(2): p. 121-129.
23. Crow, P., A. Molckovsky, N. Stone, J. Uff, B. Wilson, and L.M. WongKeeSong, Assessment of fiberoptic near-infrared raman spectroscopy for diagnosis of bladder and prostate cancer. Urology, 2005. 65(6): p. 1126-1130.
24. Tollefson, M., J. Magera, T. Sebo, J. Cohen, A. Drauch, J. Maier, and I. Frank, Raman spectral imaging of prostate cancer: can Raman molecular imaging be used to augment standard histopathology? British Journal of Urology International, 2010. 106(4): p. 484-488.
25. Stone, N., C. Kendall, J. Smith, P. Crow, and H. Barr, Raman Spectroscopy for identification of epithelial cancers. Faraday Discussions, 2004. 126: p. 141-157.
26. Ó Faoláin, E., M.B. Hunter, J.M. Byrne, P. Kelehan, H.A. Lambkin, H.J. Byrne, and F.M. Lyng, Raman spectroscopic evaluation of efficacy of current paraffin wax section dewaxing agents. Journal of Histochemistry and Cytochemistry, 2005. 53(1): p. 121-9.
27. Fullwood, L.M., D. Griffiths, K. Ashton, T. Dawson, R.W. Lea, C. Davis, F. Bonnier, H.J. Byrne, and M.J. Baker, Effect of substrate choice and tissue type on tissue preparation for spectral histopathology by Raman microspectroscopy. Analyst.
28. Bonnier, F., S.M. Ali, P. Knief, H. Lambkin, K. Flynn, V. McDonagh, C. Healy, T.C. Lee, F.M. Lyng, and H.J. Byrne, Analysis of human skin tissue by Raman microspectroscopy: Dealing with the background. Vibrational Spectroscopy, 2012. 61(0): p. 124-132.
29. Bonnier, F., A. Mehmood, P. Knief, A.D. Meade, W. Hornebeck, H. Lambkin, K. Flynn, V. McDonagh, C. Healy, T.C. Lee, F.M. Lyng, and H.J. Byrne, In vitro analysis of immersed human tissues by Raman microspectroscopy. Journal of Raman Spectroscopy, 2011. 42(5): p. 888-896.
30. Hands, J.R., P. Abel, K. Ashton, T. Dawson, C. Davis, R. Lea, A. McIntosh, and M. Baker, Investigating the rapid diagnosis of gliomas from serum samples using infrared spectroscopy and cytokine and angiogenesis factors. Analytical and Bioanalytical Chemistry, 2013: p. 1-9.
31. Baker, M.J., E. Gazi, M.D. Brown, J.H. Shanks, P. Gardner, and N.W. Clarke, FTIR-based spectroscopic analysis in the identification of clinically aggressive prostate cancer. British Journal of Cancer, 2008. 99(11): p. 1859-1866.
32. Baker, M.J., E. Gazi, M.D. Brown, N.W. Clarke, J.C. Vickerman, and N.P. Lockyer, ToF-SIMS PC-DFA analysis of prostate cancer cell lines. Applied Surface Science, 2008. 255(4): p. 1084-1087.
33. Huang, Z., X. Chen, Y. Chen, J. Chen, M. Dou, S. Feng, H. Zeng, and R. Chen, Raman spectroscopic characterization and differentiation of seminal plasma. Journal of Biomedical Optics, 2011. 16(11): p. 110501-110501.
34. Sikirzhytski, V., K. Virkler, and I.K. Lednev, Discriminant analysis of Raman spectra for body fluid identification for forensic purposes. Sensors (Basel), 2010. 10(4): p. 2869-84.

133
35. Chan, J.W., D.S. Taylor, T. Zwerdling, S.M. Lane, K. Ihara, and T. Huser, Micro-Raman spectroscopy detects individual neoplastic and normal hematopoietic cells. Biophysical Journal, 2006. 90(2): p. 648-56.
36. Feng, S., R. Chen, J. Lin, J. Pan, G. Chen, Y. Li, M. Cheng, Z. Huang, J. Chen, and H. Zeng, Nasopharyngeal cancer detection based on blood plasma surface-enhanced Raman spectroscopy and multivariate analysis. Biosensors and Bioelectronics, 2010. 25(11): p. 2414-2419.
37. Tan, C.H. and E.H. Tan, Post-treatment Assessment of Glioblastoma Multiforme: Imaging with Fluorodeoxyglucose, Sestamibi, and Choline. World J Nucl Med, 2012. 11(1): p. 30-2.
38. Aksoy, C. and F. Severcan, Role of Vibrational Spectroscopy in Stem Cell Research. Spectroscopy: An International Journal, 2012. 27(3).
39. Notingher, I., Raman Spectroscopy Cell-based Biosensors. Sensors (Basel), 2007. 7(8): p. 1343-1358.
40. Gniadecka, M., P.A. Philipsen, S. Sigurdsson, S. Wessel, O.F. Nielsen, D.H. Christensen, J. Hercogova, K. Rossen, H.K. Thomsen, R. Gniadecki, L.K. Hansen, and H.C. Wulf, Melanoma Diagnosis by Raman Spectroscopy and Neural Networks: Structure Alterations in Proteins and Lipids in Intact Cancer Tissue. Journal of Investigative Dermatology, 2004. 122(2): p. 443-449.
41. Zhang, X., W. Zhang, W.D. Cao, G. Cheng, and Y.Q. Zhang, Glioblastoma multiforme: Molecular characterization and current treatment strategy (Review). Exp Ther Med, 2012. 3(1): p. 9-14.
42. Yamada, T., N. Miyoshi, T. Ogawa, K. Akao, M. Fukuda, T. Ogasawara, Y. Kitagawa, and K. Sano, Observation of molecular changes of a necrotic tissue from a murine carcinoma by Fourier-transform infrared microspectroscopy. Clin Cancer Res, 2002. 8(6): p. 2010-4.
Figure and Table Legends

134
Appendix 4 - A manuscript submitted to ‘Analyst’ entitled ‘Effect of Substrate Choice
and Tissue Type on Tissue Preparation for Spectral Histopathology’ written based on
findings during this MSc (by research).

Effect of Substrate Choice and Tissue Type on Tissue
Preparation for Spectral Histopathology by Raman Microspectroscopy
Journal: Analyst
Manuscript ID: AN-ART-09-2013-001832.R1
Article Type: Paper
Date Submitted by the Author: n/a
Complete List of Authors: Fullwood, Leanne; University of Central Lancashire, Division of Chemistry
Griffiths, David; University of Central Lancashire, School of Pharmacy and Biomedical Sciences Ashton, Katherine; Royal Preston Hospital, Pathology Dawson, Timothy; Royal Preston Hospital, Pathology Lea, Robert; University of Central Lancashire, School of Pharmacy and Biomedical Sciences Davis, Charles; Royal Preston Hospital, Pathology Bonnier, Franck; Dublin Institute of Technology, Focas Research Institute Byrne, Hugh; Focas Institute, Dublin Institute of Technology Baker, Matthew J; University of Central Lancashire, Division of Chemistry
Analyst

Dr Matthew J Baker
Senior Lecturer in Toxicology and Analytical Chemistry
School of Forensic & Investigative Sciences
University of Central Lancashire
Preston PR1 2HE
Tel: (Office) 01772 893209
email: [email protected]
www.uclan.ac.uk
Dear Sir or Madam
Please accept this as a cover letter for my submission of a research paper entitled “Effect of
Substrate Choice and Tissue Type on Tissue Preparation for Spectral
Histopathology”
This paper reports, for the first time, the influence of substrate choice and tissue type on the sample preparation of tissue for the dynamic field of spectral histopathology. This is truly a timely manuscript as there is much debate within the field concerning substrate choice. We show results describing a novel phenomenon of substrate interaction with paraffin that has previously not been reported elsewhere and show a disparity between the paraffin retention of tissue based upon histological types. I feel your audience will be interested and enlightened by these findings and the methodological approach taken. I hope that this paper will communicate this interesting research area directly to the biomedical Spectroscopists and wider audience that your journal has. I expect that this paper will be a driver for further research into sample preparation for spectral histopathology Please do not hesitate to get in touch if you have any questions or queries as I would relish any opportunity to discuss this research with you or your editorial board. Yours faithfully
Dr Matthew J Baker
Page 1 of 42 Analyst

Dr Matthew J Baker
Senior Lecturer in Toxicology and Analytical Chemistry
School of Forensic & Investigative Sciences
University of Central Lancashire
Preston PR1 2HE
Tel: (Office) 01772 893209
email: [email protected]
www.uclan.ac.uk
Dear Editorial Team, We would like to thank the reviewers for their time taken in reviewing the article. Please find my answers to specific points raised by each reviewer below, all changes are highlighted in the paper in red. Referee: 1 Comments to the Author The authors use Raman microspectroscopy in order to detect the level of paraffin retained in thin sections from different types of cancerous tissues (mainly brain) after dewaxing. They compare the level of paraffin retained by tissues on 3 different substrates (CaF2, quartz, low-e glass) and by 4 different tissue types (normal brain, metastatic, primary brain tumour and glioblastoma). They make several claims: paraffin retention depends on the type of substrate and is lower on low-e slides; paraffin retention is higher in cancerous tissue than in normal tissue. They tentatively link this higher paraffin retention to cancerous tissue density. Some of these findings are new. Although not of primary importance, they can be useful to the bio-analytical community.
Some results presented in this paper – the composition of the substrates – are clearly not new and could be removed.
As advised, the section on composition of the substrates has been removed.
Some results are not accurately reported – the level of paraffin retention in tissues – and should be significantly extended, and some data are lacking. More importantly, some findings cannot be substantiated by the provided data.
We have attempted to address this general comment under the more specific points below.
The paper is clearly written but a few points need to be clarified: - There is a discrepancy in the number of samples in the Experimental and results sections (29 vs 31 metastatic patients)
This has been changed in the text. The number of metastatic patients is 29
- In Table 1, one of the patients is supposedly born in 2025; this is clearly an achievement in early
Page 2 of 42Analyst

Page 2
This image cannot currently be display ed.
diagnosis ;-)
Apologies, Table 1 has been revised
Dewaxing Efficiency by Substrate Type Please note that a title for the first section of the results is lacking.
The title “Dewaxing Efficiency by Substrate Type” has been added to the manuscript
The findings that low-e slides retain less paraffin than CaF2 and quartz is new and may be of interest for the wider biospectroscopist community. However, the authors state that “the adherence to current clinical process will be advantageous”. It could be suggested that adherence to clinical practice requires the use of glass slides (that can not be used for infrared but can be used for Raman. The authors should describe why normal glass was not included in their study. Is it due to the incompatibility between glass and their laser frequency? If so this laser choice should be explained.
When Raman spectroscopy is performed on Glass, there is a large fluorescent background within the region where the peaks of interest are contained. Low e slides, the same size as glass slides, were used due to their similarity, low cost and the ease with which they could be substituted for glass in clinical processes. The following has been added to the introduction:
“Commercial glass microscope slides exhibit a very large fluorescent background under excitation in the near infra red, and are thus not suitable. Therefore, common spectroscopy substrates currently used include quartz, CaF2 and low-E microscope slides, the latter being relatively low cost.28”
Although paraffin adhered more to CaF2 and quartz than to low-e slides with the dewaxing protocol used in this study, it would be of great interest if the authors would discuss or investigate whether longer/more stringent dewaxing procedures would result in better dewaxing on these substrates. Especially since authors stated in the introduction that alternative dewaxing protocols (hexane) can be more efficient.
The text has been modified to include “An important advantage in using spectroscopy for diagnosis is the short diagnostic window; therefore, a dewaxing solvent that requires a long processing time period is not an attractive option for this field of study”
…. The SEM/EDX results obtained on quartz, low-e slides and CaF2 are clearly not new and should be removed. There is no knowledge gained in showing that quartz and glass are made of Si and O, and that CaF2 is made of Ca and F. The AFM experiments are relevant to the problem.
The SEM/EDX results have been removed from the manuscript
Spectral Histopathology: Dewaxing Efficiency by Tissue Types First, the reporting of this finding is clearly lacking as there is no numerical data, only 3 averaged spectra are provided, and readers are given no mean to estimate the variability of the paraffin signal
Page 3 of 42 Analyst

Page 3
This image cannot currently be display ed.
within each group. Quantitative data should be reported with standard deviations or other means to judge the variability of the data.
A further Figure (Figure 8) has been added to the manuscript. The legend below has been added to the figure and manuscript “Figure 8. The average intensity and standard deviation of three intense paraffin peaks at 1061, 1131 and 1294 cm-1 for the three tissue types; Normal tissue (blue), Glioblastoma multiforme (red) and Metastatic brain cancer (green)” The manuscript has been changed to read “Figure 8 shows the average intensity and standard deviation of the intense paraffin peaks at 1061, 1131 and 1294 cm-1. As can be seen, there is a trend to greater paraffin retention in normal to the cancerous states, metastatic tissue retaining the most paraffin, after the same processing procedures. Further imaging studies are planned to examine the impact of the substrate upon paraffin retention, as there seems to be an interplay of tissue dependence and substrate dependence where the paraffin clumps upon the substrate surface, as can be seen in Figure 5.”
Second, only 2 types of brain cancer are compared with normal tissue in Figure 10 while 3 types of tumours (GBM, metastatic and primary) are described in the Experimental section. The results from primary brain tumours must be given.
The reference to primary tumours has been removed from the experimental section for ease of understanding. The primary brain tumours (GBM) are already shown in the results. The primary tumours previously referred to in the experimental section are the original tumour sites of the metastatic brain tumours and hence were different tissue (i.e. breast) and were not suitable for the comparison of paraffin retention.
Third, the protocol is not adapted to show a correlation between paraffin signal and pathological status because it doesn’t measure the paraffin signal accurately and because the spectra were recorded on CaF2 windows which – as shown by the authors – are a cause of paraffin retention. The study should be made on low-e slides to minimise retention from the slide. The authors used either 100X or 60X immersion objectives and a 785nm laser, the laser spot size at sample must be in the micron range although no information is given in experimental section.
The text has been modified in the section, Experimental: Raman spectroscopy instrumentation and analysis
“Point spectra were acquired using a x 100 (Olympus MPlanN, NA = 0.9, spotsize ~1µm) objective and immersion point spectra were taken using a x 60 (Olympus LUMPlanFLN, NA = 1.0, spotsize ~ 1.5 µm) objective.”
They report recording around 22 spectra per sample. This low sampling can not accurately measure the quantity of paraffin in sections of several square millimeters, even less so since some sample are highly
Page 4 of 42Analyst

Page 4
heterogeneous (Figure 1) and may accumulate different paraffin levels in different regions. To substantiate the claim of higher retention by cancerous tissues, it would require measuring the amount of paraffin retained in representative area of the sections maybe using an infrared imager to quickly collect images on several square millimeters.
The aim was not to quantify the paraffin within several square millimetres of section, as the reviewer correctly states, and this would most likely require an FTIR equipped with an FPA. Rather, this study targeted cancerous areas of tissue and examined non-cancerous tissue from multiple patients and it was discovered that the paraffin retention is different between cancerous and non-cancerous tissue.
In addition, the results presented by the authors in the first part of the paper suggest that the level of paraffin retention is a feature of the slide surface roughness that may vary locally on a window, may also vary on different CaF2 windows, and from batch to batch.
The manuscript has been changed to read “The substrates had not been used for prior investigations and were fresh for this study. The measurements were taken from multiple slides and multiple places on each slide so batch to batch variability should not affect the trends in the data shown.”
The level of paraffin may be higher in the metastatic tumor sample due to the simple fact that their architecture is different and that the dewaxing procedure is less efficient than in the other samples. This is not discussed.
The reviewer is correct and indeed we had attempted to make this point in the discussion. For clarity, the text has been amended to read:
“Abnormal tissue can be of very different morphology than normal tissue. A difference in tissue density could provide an explanation for the inconsistency of the dewaxing efficiency, and thus the variation of paraffin peak intensity between the normal brain and cancerous brain tissue spectra.”
The tentative explanation given in the Discussion section fails to convince as extending findings on breast tumour to brain tumours appears arbitrary, and data linking brain tissue density to tumorous status are not provided. These results are thus clearly not substantiated and should be removed from the paper.
We accept the reviewers point and as such the manuscript has been changed to provide a more relevant argument.
“Berrtholdo et al. correlate increased choline signals from Magnetic Resonance Spectroscopy as a measure of malignancy in brain tumours due to increased glial cell density as choline is a marker of cellular membrane turnover reflecting cellular proliferation38. Therefore, the disparity of wax retention between normal and cancerous tissue evident in figure 7 can be proposed to de due to local differences in tissue density.
In the discussion it is stated that for breast tissue “state that the amount of fibro-glandular and adipose tissue is strongly related to the risk of developing cancer”. The proposed method for dewaxing eliminates all fat from tissues including myelin from axons and probably modifies protein through precipitation and hydrolysis, potentially destroying useful information for spectroscopic diagnosis. This should be discussed and the advantages of “computationally” dewaxing tissue section spectra as shown by the work of Sockalingum, Gobinet, Manfait and al. should be discussed.
The following text has been added to the discussion
Page 5 of 42 Analyst

Page 5
“The results indicate that tissue processing still remains an issue for Spectropathology, particularly using Raman spectroscopy. For clinical relevancy, however, and indeed acceptance of the techniques by the clinical community, it is important that the sample preparation and measurement protocols for Raman spectroscopic analyses are consistent with current clinical practice. Choice of substrate for routine clinical analyses may be dominated by economic considerations, thus favouring low E slides. Paraffin embedding facilitates tissue cutting, but also is commonly employed, worldwide, for archiving tissue samples. The availability of a wide range of pathologically characterized samples for study potentially enables extensive retrospective studies using spectroscopic and other techniques. The embedding process and wax itself can, however, contribute significantly to the spectroscopic signature of the tissue 40. An alternate method of “digital dewaxing” biological specimens to remove paraffin contributions of the spectrum has been proposed by Gobinet et al., recognising that chemical dewaxing methods are known to be inefficient for the complete removal of wax in tissue and can cause alterations to the samples. Their method of dewaxing consists of an estimation of the paraffin sources in the spectrum using Independent Component Analysis (ICA), followed by a Non-negatively Constrained Least Squares (NCLS) method to subtract the contributions. This enables removal of the paraffin signals to allow analysis of the underlying tissue spectrum 33. However, although “digital dewaxing” has been demonstrated41, it is also often important to compare spectroscopic profiling with parallel histological analyses, requiring chemical dewaxing of sections, a process which adds to the sample variability. The observation of variable dewaxing efficiencies depending on tissue pathology ads complexity to the challenge, perhaps requiring a combination of established clinical dewaxing protocols with computational procedures.”
Page 6 of 42Analyst

Page 6
Referee: 2 Comments to the Author Dear Authors, The submission addresses very fundamental issues in vibrational spectroscopy. The work presented is succinct and to the point. Excluding minor typos and omissions, listed below, I recommend the text for publication. 1) Pg. 8 - World Health Organization, name of the organization
This has been changed in the manuscript and W, H and O has been capitalised
2) Pg. 8 - haemotoxylin and eosin, name of chemicals
This has been changed in the manuscript, h and e are now not capitalised
3) Pg. 8 - HistoClear, trade name of chemical
This has been changed in the manuscript H and C are now capitalised
4) Pg. 9 - EM CCD, electron multiplying CCD
This has been changed in the manuscript
5) The formatting of company affiliation is not consistent throughout the text This has been changed in the manuscript
Page 7 of 42 Analyst
Page 7
Referee: 3 Comments to the Author In the context of spectral histopathology, this article studies by Raman spectroscopy the influence of the substrate choice and of the analyzed tissue type on the efficacy of chemical dewaxing. This work is innovative and addresses a problem that was never pointed out before. However, this article leads to minor and major comments and questions. 1) The title is not enough specific. The authors should precise that the study is realized using Raman spectroscopy.
The title has been changed to read
Effect of Substrate Choice and Tissue Type on Tissue Preparation for Spectral Histopathology by Raman Microspectroscopy
2) The introduction is ambiguous because infrared and Raman spectroscopy are mixed throughout. Thus, I thought that the two techniques would be used in the rest of the paper. The authors thus should justify the construction of their introduction or should change their introduction in order to focus on Raman spectroscopy.
A paragraph has been added to the introduction in answer to this comment. The text now reads
“The contribution of paraffin peaks in vibrational spectra is apparent in both infrared and Raman spectroscopy. However, these peaks appear more prominently in the spectra of the latter technique; thus, Raman spectroscopy was used in this study to analyse the efficacies of current dewaxing techniques.” 3) The ambiguity of the introduction is also illustrated by its first paragraph which focuses on prostate cancer. Thus, I thought that the study would be based on prostate tissues. Why not constructing this paragraph on brain cancer?
A sentence has been added and the manuscript now reads “There have been many studies of different pathologies but the issues are well demonstrated by the example of prostate cancer.”
4) In page 6 of the received manuscript, the sentences "O Faolain et al. suggest that the complete removal of paraffin from the tissue section is not possible to assess accurately with FTIR spectroscopy using the ~1462 cm-1 signal and should be performed using Raman spectroscopy. This was concluded following analysis of Raman and FTIR spectra obtained from identically deparaffinised tissue sections in which spectral peaks characteristic of paraffin wax were more clearly resolved in Raman spectra (strong sharp bands), compared with FTIR spectra" are almost entirely copied/pasted from a sentence of the reference [26] of Lyng et al. Authors should personalize these sentences.
The manuscript has been changed to read
“Ó Faoláin et al. indicate that Raman spectroscopy is much more sensitive to assess the incomplete removal of wax than FTIR”
5) Furthermore, the authors refer to reference [26] of Lyng et al. for these sentences. However, these sentences summarize the work of Faolain et al. in the following article, which should be added in the
Page 8 of 42Analyst

Page 8
reference part of the paper: E.O. Faolain, M.B. Hunter, J.M. Byrne, P. Kelehan, M. McNamara, H.J. Byrne, F.M. Lyng, A study examining the effects of tissue processing on human tissue sections using vibrational spectroscopy, Vibrational Spectroscopy, 38, 121-127, 2005.
The reference has been added
6) Page 7, authors write that "CaF2 has been shown to be better for Raman measurements". Should they provide references proving this claim?
The following reference has been added to support the comparison of substrates:
" Collagen matrices as an improved model for in vitro study of live cells using Raman microspectroscopy", F. Bonnier, P. Knief, A. D. Meade, J. Dorney, K. Bhattacharya, F. M. Lyng and H. J. Byrne, Clinical and Biomedical Spectroscopy and Imaging II, edited by Nirmala Ramanujam, Jürgen Popp, Proc. of SPIE-OSA Biomedical Optics, SPIE Vol. 8087, 80870F·(2011)
7) Are the sections for H&E staining and Raman acquisition directly adjacent?
The manuscript has been changed to read “The tissue sections used from each sample were cut consecutively with one section used for Raman analysis and one for haematoxylin and eosin staining”
8) Why didn't the author consider in their study glass substrate since it is classically used in clinical routine?
When Raman spectroscopy is performed on Glass there is a large fluorescent background within the region where the peaks of interest are contained. Low e slides the same size as glass slides were used due to their similarity and the ease with which they could be substituted for glass in clinical processes. The text has been amended to read:
“Commercial glass microscope slides exhibit a very large fluorescent background under excitation in the near infra red, and are thus not suitable. Therefore, common spectroscopy substrates currently used include quartz, CaF2 and low-E microscope slides, the latter being relatively low cost.”
Note: This question was also raised by reviewer 1 and thus the amended text is highlighted in red
9) In E.O. Faolain et al, Vibrational Spectroscopy, 38, 2005, normal parenchymal tissue from the placenta was chosen because it is an homogenous tissue. What are the arguments of the authors to explain their choice to analyze brain tissues?
The authors use brain tissue as this work is part of a larger study on the use of spectral histopathology for the diagnosis and detection of brain tumours.
10) In reference [25], E.O. Faolain et al showed that hexane is a more effective dewaxing agent than Histoclear. Thus, why did the authors prefer to use Histoclear?
Page 9 of 42 Analyst

Page 9
HistoClear is the clinical standard and the authors used HistoClear in order to assess the current clinical practices and their use within the developing field of spectral histopathology.
The text has been modified to clarify
“An important advantage in using spectroscopy for diagnosis is the short diagnostic window; therefore, a dewaxing solvent that requires a long processing time period is not an attractive option for this field of study.”
Note: This question was also raised by reviewer 1 and thus the amended text is highlighted in red
11) In page 9, in the "Raman spectroscopy instrumentation and analysis" section, authors write "immersion point spectra". What does it mean and for which acquisitions was it used?
The following text has been added to the manuscript
Immersion spectroscopy was used for measurement of the tissue samples for spectral histopathology. Immersion Raman utilises an immersion lens which is in direct contact with a liquid that the sample under analysis is submerged in, such as deionised water used in this study. Bonnier et al. describe the use of immersion Raman spectroscopy and demonstrate its successful use for improving spectral quality34,35.
12) The authors should precise the average number of Raman spectra acquired on each section.
The manuscript has been changed to read
“From each tissue section 20 spectra were acquired from different regions, depending upon the size of the tissue slice.”
13) For normal tissue, on which structures did the authors make the acquisitions: white matter, gray matter, ...? These structures having different densities, have the authors analyzed the influence of the type of analyzed structure for the same section on the dewaxing procedure efficacy? The same questions are asked for the tumoral tissues.
For normal tissue, an approach to the spectral acqusition was taken as it would be in the clinic. i.e all and any normal tissue was analysed. The trends seen therefore are across all the sturcture of normal brain analysed as no particular area was targeted. As for tumoral sections, these are all cancerous areas and were not analysed according to the origin of the structure, again mimicking clinical practice.
The trends seen are therefore general trends linked to the retentation by the vastly different tissue types of normal, high grade cancer and metastatic.
The following text has been added in the experimtnal section
For all tissue samples, sample analysis by spectral acquisition was carried out as it would be in the clinic. i.e all and any normal tissue was analysed, and no particular area was targeted (eg white/grey matter). Similarly, for tumoral sections, all cancerous areas were analysed irrespective of the origin of the structure, again mimicking clinical practice.
Page 10 of 42Analyst

Page 10
14) In page 10, in the "Data pre-processing" section, the authors should provide a reference or explain the method used to subtract the background.
The manuscript has been changed to read
“background subtraction was performed through the application of a fifth order polynomial and smoothed using 7 point smoothing”
15) In page 10, in the "Data pre-processing" section, I do not understand the sentence "using the cytospec code written by Dr A Henderson" since CytoSpec has been developed by Peter Lasch. Who is A Henderson and what is his link with CytoSpec and this article?
The manuscript has been changed to read “using in-house written code”
16) In page 11, in the "Results and discussion" section, what is the aim of the microscopic observation of the substrate surface? What information is supplied by right panel images of figures 3, 4 and 5? Are these figures necessary since they are not commented in the results?
These figures have been removed on recommendation of Reviewer 1.
17) In page 13, in the "Results and discussion" section, the authors should compare their results (complete dewaxing on low-E MirrIR slide) to those obtained by Faolain et al, Vibrational Spectroscopy, 38, 2005 (incomplete dewaxing on MirrIR slide).
The study by O Faoláin et al., was conducted under somewhat different circumstances (dewaxing protocol, tissue type). Nevertheless a comment has been added to the Results and discussion. “Indeed, it should be noted that, whereas in this study complete removal of wax was observed for tissue samples on low-E slides, O’ Faoláin et al. 39 reported incomplete was removal from normal parenchymal tissue from the placenta, dewaxed using a xylene based protocol also measured in low-E slides.” 18) The subsection title "Spectral histopathology: Dewaxing efficiency by tissue types" is useless since no such subsection title was provided for the first part of the "Results and discussion" section.
A title has been added to the first part of the section
19) Compared to the first part of the "Results and discussion" section, the second part concerning the study of the dewaxing efficiency by tissue types is very light. It mainly consist of the observation that normal tissues are better dewaxed than tumoral ones. Isn't it possible to demonstrate that tissue density is really responsible of this effect? What to conclude from this part of the study?
The discussion has been added to with reference to the previous studies on parenchymal tissue from the placenta as well as further evidence of higher densities in brain tumours, allowing a stronger statement on dependence of dewaxing efficacy on tissue density.
Page 11 of 42 Analyst

Page 11
Berrtholdo et al. correlate increased choline signals from Magnetic Resonance Spectroscopy as a measure of malignancy in brain tumours due to increased glial cell density as choline is a marker of cellular membrane turnover reflecting cellular proliferation38. Therefore, the disparity of wax retention between normal and cancerous tissue evident in figure 7 can be proposed to de due to local differences in tissue density.
Note: This question was also raised by reviewer 1 and thus the amended text is highlighted in red
20) On the one hand, the low-E MirrIR slide induces a perfect dewaxing of samples. On the other hand, CaF2 leads to incomplete dewaxing. In function of the type of tissue, the paraffin residue is variable, and thus CaF2 induces more discriminative information between different types of tissues thanks to paraffin residue. What is thus the position of the authors concerning the slide to choose for Raman analysis of FFPP samples?
A further paragraph has been added to the Discussion section
“The results indicate that tissue processing still remains an issue for Spectropathology,
particularly using Raman spectroscopy. For clinical relevancy, however, and indeed acceptance of the techniques by the clinical community, it is important that the sample preparation and measurement protocols for Raman spectroscopic analyses are consistent with current clinical practice. Choice of substrate for routine clinical analyses may be dominated by economic considerations, thus favouring low E slides. Paraffin embedding facilitates tissue cutting, but also is commonly employed, worldwide, for archiving tissue samples. The availability of a wide range of pathologically characterized samples for study potentially enables extensive retrospective studies using spectroscopic and other techniques. The embedding process and wax itself can, however, contribute significantly to the spectroscopic signature of the tissue 40. An alternate method of “digital dewaxing” biological specimens to remove paraffin contributions of the spectrum has been proposed by Gobinet et al., recognising that chemical dewaxing methods are known to be inefficient for the complete removal of wax in tissue and can cause alterations to the samples. Their method of dewaxing consists of an estimation of the paraffin sources in the spectrum using Independent Component Analysis (ICA), followed by a Non-negatively Constrained Least Squares (NCLS) method to subtract the contributions. This enables removal of the paraffin signals to allow analysis of the underlying tissue spectrum 33. However, although “digital dewaxing” has been demonstrated41, it is also often important to compare spectroscopic profiling with parallel histological analyses, requiring chemical dewaxing of sections, a process which adds to the sample variability. The observation of variable dewaxing efficiencies depending on tissue pathology ads complexity to the challenge, perhaps requiring a combination of established clinical dewaxing protocols with computational procedures.”
This section has also been added in response to a comment by Reviewer 1
21) Page 19, the authors should write "Figure 2" instead of "Figure 1"
Figure references have been corrected within the manuscript
Page 12 of 42Analyst

Page 12
22) Figures 3, 4 and 5 should be grouped together.
These figures have been removed from the manuscript
23) For figure 6, the averaged spectrum of low-E Mirr acquisitions is computed from 210 spectra, while around 450 are used for CaF2 and Spectrosil acquisitions. Why this huge difference?
The spectra acquired are part of a larger study and as such there are different numbers of spectra for each substrate
24) For figure 7, the averaged spectrum acquired on low-E Mirr shows no paraffin spectral contribution. This spectrum is thus characteristic of low-E Mirr. Why is this spectrum different from the reference spectrum of low-E Mirr presented on figure 2?
Upon futher inspection, the bacground has been standardised acrosse the images
25) The authors should provide a scale bar for images provided on figures 1 and 8.
Scale bars have been added to these figures
26) To compare the spectra of figure 10 and to make conclusions, averaged spectra +/- standard deviation should be plotted.
A further Figure (Figure 8) has been added to the manuscript. The legend below has been addedd to the figure and manuscript “Figure 8. The average intensity and standard deviation of three intense paraffin peaks at 1061, 1131 and 1294 cm-1 for the three tissue types; Normal tissue (blue), Glioblastoma multiforme (red) and Metastatic brain cancer (green)” The manuscript has been changed to read
“Figure 8 shows the average intensity and standard deviation of the intense paraffin peaks at 1061, 1131 and 1294 cm-1. As can be seen, there is a trend to greater paraffin retention in normal to the cancerous states, metastatic tissue retaining the most paraffin, after the same processing procedures. Further imaging studies are planned to examine the impact of the substrate upon paraffin retention, as there seems to be an interplay of tissue dependence and substrate dependence where the paraffin clumps upon the substrate surface, as can be seen in Figure 5.”
This section has also been added in response to a comment by Reviewer 1
27) In table 1, one patient was born in 2029 and another one in 2025.
Page 13 of 42 Analyst

Page 13
This has been modified in the revised manuscript
Yours faithfully
Dr Matthew J Baker
Page 14 of 42Analyst

Effect of Substrate Choice and Tissue Type on Tissue Preparation for Spectral Histopathology by Raman Microspectroscopy
Leanne M. Fullwood1, Dave Griffiths2, Katherine Ashton3, Timothy Dawson3, Robert W.
Lea2, Charles Davis3, Franck Bonnier4, Hugh J. Byrne4, and Matthew J. Baker1*
1 Centre for Materials Science, Division of Chemistry, University of Central Lancashire, Preston, PR1 2HE, UK 2 School of Pharmacy and Biomedical Sciences, University of Central Lancashire, Preston, PR1 2HE, UK 3Lancashire Teaching Hospital NHS Trust Royal Preston Hospital, Sharoe Green Lane, Preston PR2 9HT, UK 4FOCAS Research Institute, Dublin Institute of Technology, Kevin Street, Dublin 8, Ireland
*Corresponding Author: [email protected]
Abstract
Raman spectroscopy is a non-destructive, non-invasive, rapid and economical
technique which has the potential to be an excellent method for the diagnosis of cancer and
understanding disease progression through retrospective studies of archived tissue samples.
Historically, biobanks are generally comprised of formalin fixed paraffin preserved tissue and
as a result these specimens are often used in spectroscopic research. Tissue in this state has to
be dewaxed prior to Raman analysis to reduce paraffin contributions in the spectra. However,
although the procedures are derived from histopathological clinical practice, the efficacy of
the dewaxing procedures that are currently employed is questionable. Ineffective removal of
paraffin results in corruption of the spectra and previous experiments have shown that the
efficacy can depend on the dewaxing medium and processing time. The aim of this study was
to investigate the influence of commonly used spectroscopic substrates (CaF2, Spectrosil
quartz and low-E slides) and the influence of different histological tissue types (normal,
cancerous and metastatic) on tissue preparation and to assess their use for spectral
Page 15 of 42 Analyst

histopathology. Results show that CaF2 followed by Spectrosil contribute the least to the
spectral background. However, both substrates retain paraffin after dewaxing. Low-E
substrates, which exhibit the most intense spectral background, do not retain wax and
resulting spectra are not affected by paraffin peaks. We also show a disparity in paraffin
retention depending upon the histological identity of the tissue with abnormal tissue retaining
more paraffin than normal.
Keywords Cancer, Diagnosis, Raman, Substrate, Histopathology, Vibrational Spectroscopy
Page 16 of 42Analyst

Introduction
The primary requirement for successful treatment of any disease is early detection.
Cancer incidence rates have continued to rise 1, although survival rates for cancer are
increased with early diagnosis. Current methods used in cancer diagnosis focus on changes in
architecture of tissue, cells or internal constituents and the identification of protein
expression. Research performed into identification of protein expression in blood has
produced single biomarkers for specific cancers that have become misleading. There have
been many studies of different pathologies but the issues are well demonstrated by the
example of prostate cancer. The Prostate Specific Antigen (PSA) test is used to indicate
prostate cancer (CaP). However, approximately 40 % of organ confined CaP show no
elevation of PSA 2 and many other benign conditions can show increased PSA serum, thus
producing false positives in screening. Hoffman et al. suggest that CaP screening would
benefit from improved biomarkers, which more readily identify clinically important cancers
3. As cancer is a heterogeneous disease, a set of markers or a whole sample profile will
provide significantly more diagnostic information than any one marker 4. After initial
indication of cancer, diagnosis is confirmed by biopsy and assessment of tissue architecture.
The biopsy is assessed based upon a subjective measurement. For CaP this is called the
Gleason grading system and in a study of 390 patients identical grades were assigned to only
29.2% of the tumours by different histopathologists 5. Pathological discrepancies are reported
to occur in up to 43% of specimens assessed via histopathology 6. The accurate and rapid
diagnosis of disease allows early intervention of appropriate treatment, thus increasing life
expectancy and reducing healthcare costs 7. Therefore, there is a requirement for non-
subjective techniques that can rapidly and accurately identify disease.
Page 17 of 42 Analyst

Spectroscopic techniques, such as Raman and Infrared (IR), are excellent methods for
the analysis of a wide range of materials. They are non-destructive, rapid, cost-effective and
simple to operate. The inelastic (Raman) scattered light from molecules under irradiation is
wavelength-shifted with respect to the incident light by molecular vibrations. The Raman
spectrum is complementary to that of IR which represents the absorption of incident light at
the resonant frequency of the bond or group, exciting vibrational modes. Different
biomolecules exhibit responses to different wavelengths of light; the resultant spectrum can
be thought of as a ‘fingerprint’ of the sample. Spectroscopic analysis allows the objective
classification of biological material on a molecular level8. Previous studies have
demonstrated the use of spectroscopy (imaging and point spectra) to analyse gastrointestinal
(GI) tract 9, 10, lung 11, 12, cervix 13, 14, brain 15, 16,breast 17, 18, prostate 19-21 and lymph node
cancers 22, 23. Initial work has focused on differentiating between normal tissue and advanced
cancers. Technological development is enabling diagnosis at progressively earlier stages and
potential to do so in vivo 24. The aim of these studies is to develop spectral histopathology
based upon objective chemical information.
In order to develop spectral histopathology, a database of tissue spectra is required to
enable spectral disease identification. The ideal situation would be to build this database
using fresh or frozen tissue sections. However, historically, biobanks have been built using
Formalin Fixed Paraffin Preserved Tissue (FFPP) sections, which are fixed using formalin
and impregnated with paraffin wax to preserve the tissue for future analysis and provide
support to aid microtomy for sectioning the tissue block to enable microscopic examination.
Prior to histological and/or spectral analysis, the tissue sections generally undergo a
Page 18 of 42Analyst

dewaxing process, to allow histological staining of the tissue for pathological examination
and to reduce paraffin contributions in vibrational spectra, consequently, returning the tissue
to as much of an in vivo state as possible 25.
Ó Faoláin et al. investigated the efficacy of dewaxing procedures on formalin fixed,
paraffin preserved (FFPP) cervical tissue on glass slides 25. They reported that dewaxing
procedures employing, the commonly used xylene and HistoClear solvents do not completely
remove all of the paraffin wax. Although, they found hexane to be a much more efficient
dewaxing agent, it requires 18 hours of tissue submersion and is not clinically used for
dewaxing procedures 25. An important advantage in using spectroscopy for diagnosis is the
short diagnostic window; therefore, a dewaxing solvent that requires a long processing time
period is not an attractive option for this field of study. Ó Faoláin et al. indicate that Raman
spectroscopy is much more sensitive to assess the incomplete removal of wax than FTIR.
This was concluded following analysis of Raman and FTIR spectra obtained from identically
deparaffinised tissue sections in which spectral peaks characteristic of paraffin wax were
more clearly resolved in Raman spectra (strong sharp bands), compared with FTIR spectra 26.
The contribution of paraffin peaks in vibrational spectra is apparent in both infrared
and Raman spectroscopy. However, these peaks appear more prominently in the spectra of
the latter technique; thus, Raman spectroscopy was used in this study to analyse the efficacies
of current dewaxing techniques.
Substrates are needed in spectral histopathology to support the samples during
analysis. Samples are often relatively thin allowing incident light the opportunity of
interacting with the substrate below. This interaction has an effect on the spectral
Page 19 of 42 Analyst

background; thus, the correct choice of substrate for spectroscopic analysis is essential for
reducing this background and optimising the quality of the spectral data 27. Commercial glass
microscope slides exhibit a very large fluorescent background under excitation in the near
infrared, and are thus not suitable. Therefore, common spectroscopy substrates currently used
include quartz, CaF2 and low-E microscope slides, the latter being relatively low cost.28
Recently, the choice of substrate has been a hot topic within the spectral
histopathology field, as spectral artefacts have been identified in FTIR transflection analysis
using highly reflective low-E slides29,30. However, when analysing tissue, a 2nd derivative
spectrum minimises these contributions allowing for spectral histopathological diagnosis31.
Both quartz and CaF2 are transparent over a large range of the mid-IR and are therefore
suitable for transmission measurements, although CaF2 has been shown to be better for
Raman measurements, and so is an obvious choice for use of both complementary
techniques. The choice of substrate is also important if spectral diagnoses are going to be
effective in the clinical setting, substrates that can easily fit into current methodologies (due
to size, solubility etc.) are advantageous and also cost needs to be minimised to ensure
efficient health services.
Vibrational spectroscopy has the potential to revolutionise the clinical environment,
allowing for increased efficiency within the diagnostic regime with corresponding decreases
in mortality, morbidity and economic impact upon the health services 32. In order to achieve
this potential, research needs to be performed to understand the impact of sample preparation
upon the vibrational spectrum. We present, for the first time, a study of the effect and
efficiency of the dewaxing process, using a clinical standard HistoClear procedure, by
Page 20 of 42Analyst

substrate and tissue type utilising Raman spectroscopy in order to develop the basis of
standard approaches for spectral histopathology.
Experimental
Study participants
Tissue sections cut, by microtomy, at both 4 µm onto glass microscope slides and 10
µm onto spectroscopic substrates: low-E MirrIR slides (Kevley Technologies, Chesterland,
OH, 44026, USA), Spectrosil quartz (Starna Scientific) and calcium fluoride (CaF2)
(Crystran), were obtained from formalin fixed paraffin preserved (FFPP) tissue blocks from
the Brain Tumour North West (BTNW) bio-bank under ethical approval (BTNW/WRTB
13_01). The substrates had not been used for prior investigations and were fresh for this
study. The measurements were taken from multiple slides and multiple places on each slide so batch
to batch variability should not affect the trends in the data shown. The tissue sections used from
each sample were cut consecutively with one section used for Raman analysis and one for
haematoxylin and eosin staining. Patient data consisted of histological information, patient
gender and date of birth, origin of metastasis/histological subtype. A total of 48 tissue
specimens were obtained from 41 different patients. Tissue consisted of normal brain samples
(n=7), glioblastoma multiforme (GBM) brain samples WHO (World Health Organisation)
grade IV (n=5) and metastatic brain samples (n=29). Table 1 displays further information
about the tissue specimens.
Page 21 of 42 Analyst

Dewaxing and Haematoxylin and Eosin staining of tissue
Tissue sections on the microscope slides needed to undergo staining with
haematoxylin and eosin (H&E) for parallel histological examination. The sections were de-
waxed before staining, carried out by: 2 x 5 minute baths of HistoClear followed by 2 x 5
minute baths of ethanol. The tissue sections were washed in distilled water for 5 minutes after
de-waxing, prior to H&E staining. Sections were bathed in haematoxylin for 5 minutes and
then washed in warm tap water to allow the nuclei to turn blue. The sections were then
covered in eosin for 4 minutes and rinsed with distilled water. Finally, the tissue sections
were dehydrated in 2 x 5 minute baths of ethanol and cleared in 2 x 5 minute baths of
histoclear, and then protected and preserved through the application of HistoMount and a
coverslip. The sections were then microscopically examined in order to identify the
metastatic sites present in the tissue.
Figure 1 shows the microscopic images of the H & E stained tissue samples at x 100
magnification. It can be observed that normal brain, metastatic and GBM brain tissue
architecturally differ from one another and between the metastatic types.
Tissue section preparation for Raman spectroscopic analysis
The tissue sections on Raman substrates needed to be de-waxed prior to Raman
analysis in order to reduce the paraffin peak contributions in the spectra. The de-waxing
procedure consisted of 3 x 5 minute baths of HistoClear followed by 3 x 5 minute baths of
Page 22 of 42Analyst

ethanol. The sections were left to air dry for 30 minutes, placed in a Petri dish and stored in a
desiccator until spectroscopic analysis.
Raman spectroscopy instrumentation and analysis
Spectroscopic measurements were carried out using a Horiba Jobin-Yvon LabRAM HR800
spectrometer. An air cooled CLDS point mode diode 785 nm laser with a single edge filter
(cut off to 100 cm-1) and an output power of 300 mW was used to acquire spectra; which was
used with a grating of 300 gr/mm and blazed at 1000 nm. Point spectra were acquired using a
x 100 (Olympus MPlanN, NA = 0.9, spotsize ~1µm) objective and immersion point spectra
were taken using a x 60 (Olympus LUMPlanFLN, NA = 1.0, spotsize ~ 1.5µm). Immersion
spectroscopy was used for measurement of the tissue samples for spectral histopathology.
Immersion Raman utilises an immersion lens which is in direct contact with a liquid that the
sample under analysis is submerged in, such as deionised water used in this study. Bonnier et
al. describe the use of immersion Raman spectroscopy and demonstrate its successful use for
improving spectral quality34,35.
The confocal hole was set at 100 µm for 785 nm spectral collections. The detector used was
an Andor charged coupled device (CCD). A video camera within the Raman system was used
to take images of the specimens. The instrumentation was calibrated before operation to
silicon at the spectral line of 520.8 cm-1. Spectra were acquired using the 785 nm laser at
100% exposure for 30 s and accumulated twice. From each tissue section 20 spectra were
acquired from different regions, depending upon the size of the tissue slice.
Page 23 of 42 Analyst

For all tissue samples, sample analysis by spectral acquisition was carried out as it would be
in the clinic. i.e all and any normal tissue was analysed, and no particular area was targeted
(eg white/grey matter). Similarly, for tumoral sections, all cancerous areas were analysed
irrespective of the origin of the structure, again mimicking clinical practice.
Data pre-processing
Pre-processing was carried out on the raw data using LabSpec 6 spectroscopy
software suite (HORIBA Scientific, Japan) and MATLAB version 7.11.0 (R2010b) (The
MathWorks, Inc., USA) using in-house written software. Pre-processing methods were kept
to a minimum to enable better reproducibility; background subtracted was performed through
the application of a fifth order polynomial and smoothed using 7 point smoothing (Labspec 6)
and vector normalised (Matlab) using in-house written code.
Atomic force microscope (AFM)
The atomic force microscope (AFM) model that was used to image the samples for
surface morphology for this study is the MFP-3D-BIO (Asylum Research, USA), with
Olympus silicon AC160 cantilevers. The tips were 160 nm long with resonant frequencies
typical of 320 kHz. A/C mode was employed for operation to reduce tip/sample.
Results and Discussion
Dewaxing efficiency of spectroscopic substrates
Page 24 of 42Analyst

Raman spectra of the three substrates: low-E, Spectrosil and CaF2, were acquired
under identical conditions to generate spectral ‘fingerprints’ of the substrates, shown in
Figure 2, and thus ascertain the impact of their contribution to the spectral background.
It can be observed that low-E has the highest intensity baseline and CaF2 has the
lowest intensity baseline of the three substrates; indicating that spectra taken from samples on
CaF2 are less affected by substrate background than either low-E or Spectrosil and should
display background peaks of lower intensities.
The spectra of dewaxed tissue samples on the three different substrates were
compared to further investigate the level of influence substrate type has on the outcome of
spectra. Figure 3 displays average spectra of dewaxed tissue on the three substrates and a
paraffin spectrum for comparison
A paraffin spectrum displays significant peaks at 888 cm-1, 1061 cm-1, 1131 cm-1,
1171 cm-1, 1294 cm-1, 1417 cm-1, 1440 cm-1, 1462 cm-1 (Figure 3), which can be assigned to
C-C stretching and CH2 and CH3 deformations within the molecule 25. It can be seen from
Figure 3 that the spectra from the dewaxed tissue samples on Spectrosil and CaF2 exhibit
residual paraffin peaks. However, dewaxed tissue spectra on low-E do not display visible
paraffin peaks.
In order to further investigate any substrate effect on the dewaxing process, paraffin
wax was analysed on the substrates without the presence of tissue specimens. Paraffin wax
was cut at 10 µm sections and mounted onto the three different substrates. The substrates
Page 25 of 42 Analyst

were then dewaxed by the same method as the FFPP tissue samples and analysed; Figure 4
displays the resulting spectra. Residual wax, still present on both the Spectrosil and CaF2
substrate, could be seen visually both macroscopically and microscopically, shown in Figure
5, and its presence was confirmed by paraffin peak contributions in their spectra. The low-E
substrate did not retain any visual paraffin wax and no paraffin peaks were present in the 10
spectra taken from the substrate. This shows, for the first time, a substrate effect that occurs
during the dewaxing process inferring that as a result of surface chemistry or morphology,
low-E slides facilitate the removal of wax more readily than CaF2 and Spectrosil. From
Raman analysis and visual inspection, it is clear that, using the same dewaxing protocol, the
low-E substrate is fully dewaxed, yet the CaF2 and Spectrosil substrates retain paraffin wax.
Atomic force microscopy (AFM) was utilised to assess the three substrates’ surface
roughness. The AFM images of the three substrates are displayed in Figure 6, showing the
surface morphology at a nanoscopic level. The low-E substrate was observed to have a far
smoother surface than either CaF2 or Spectrosil with an average surface roughness of 1.10 nm
compared to 4.76 nm and 3.88 nm respectively. Low-E slides are coated with metal oxide36;
this could explain why their surface is far smoother than the other substrates which are only
polished.
The clinical application of spectral histopathology is the ultimate aim of this field. As
such, the adherence to current clinical process will be advantageous. The use of Low-E slides
holds a number of advantages for this, such as low cost, their microscope slide size and
robustness when compared to other substrates. Although substrate spectral background is
Page 26 of 42Analyst

higher, all tissue spectral peaks that are detected when using other substrates are present in
the spectrum.
Spectral Histopathology: Dewaxing Efficiency by Tissue Types
Although low-E substrates clearly perform better in terms of wax removal from the
tissue sections using routine clinical protocols, CaF2 is commonly used in Raman
spectroscopic studies due to its low contribution to the spectral background (Figure 2). It is of
interest to investigate whether the tissue type mounted on these substrates also contributes to
the residual signals. The vector normalised mean Raman spectra of dewaxed sections of
normal (157 spectra from 7 patients), metastatic (668 spectra from 29 patients) and GBM
(127 spectra from 5 patients) brain tissue on CaF2 substrates are displayed in Figure 7. It can
be observed from the averaged spectrum of normal tissue that the paraffin peaks (asterisked
peaks) are not fully removed by the dewaxing process, but notably the characteristic features
are of a much lower intensity than those in the spectra of metastatic and GBM tissue Figure 8
shows the average intensity and standard deviation of the intense paraffin peaks at 1061,
1131 and 1294 cm-1. As can be seen, there is a trend to greater paraffin retention in normal to
the cancerous states, metastatic tissue retaining the most paraffin, after the same processing
procedures. Further imaging studies are planned to examine the impact of the substrate upon
paraffin retention, as there seems to be an interplay of tissue dependence and substrate
dependence where the paraffin clumps upon the substrate surface, as can be seen in Figure 5.
Abnormal tissue can be of very different morphology than normal tissue. A difference
in tissue density could provide an explanation for the inconsistency of the dewaxing
efficiency, and thus the variation of paraffin peak intensity between the normal brain and
Page 27 of 42 Analyst

cancerous brain tissue spectra. For breast cancer Li et al. state that the amount of fibro-
glandular and adipose tissue is strongly related to the risk of developing cancer. They explain
that, although no direct evidence has been found to link dense mammographic tissue with the
increased chance of developing breast cancer, the correlations observed have encouraged the
use of tissue density for breast cancer monitoring. They go on to support the observations of
this correlation through their findings that the mammograms of cancerous breast tissue are far
denser than those of normal breast tissue 37. Berrtholdo et al. correlate increased choline
signals from Magnetic Resonance Spectroscopy as a measure of malignancy in brain
tumours due to increased glial cell density as choline is a marker of cellular membrane
turnover reflecting cellular proliferation38. Indeed, it should be noted that, whereas in this
study complete removal of wax was observed for tissue samples on low-E slides, O’ Faoláin
et al. 39 reported incomplete was removal from normal parenchymal tissue from the placenta,
dewaxed using a xylene based protocol also measured in low-E slides.
The results indicate that tissue processing still remains an issue for Spectropathology,
particularly using Raman spectroscopy. For clinical relevancy, however, and indeed
acceptance of the techniques by the clinical community, it is important that the sample
preparation and measurement protocols for Raman spectroscopic analyses are consistent with
current clinical practice. Choice of substrate for routine clinical analyses may be dominated
by economic considerations, thus favouring low E slides. Paraffin embedding facilitates
tissue cutting, but also is commonly employed, worldwide, for archiving tissue samples. The
availability of a wide range of pathologically characterized samples for study potentially
enables extensive retrospective studies using spectroscopic and other techniques. The
embedding process and wax itself can, however, contribute significantly to the spectroscopic
Page 28 of 42Analyst

signature of the tissue 40. An alternate method of “digital dewaxing” biological specimens to
remove paraffin contributions of the spectrum has been proposed by Gobinet et al.,
recognising that chemical dewaxing methods are known to be inefficient for the complete
removal of wax in tissue and can cause alterations to the samples. Their method of dewaxing
consists of an estimation of the paraffin sources in the spectrum using Independent
Component Analysis (ICA), followed by a Non-negatively Constrained Least Squares
(NCLS) method to subtract the contributions. This enables removal of the paraffin signals to
allow analysis of the underlying tissue spectrum 33. However, although “digital dewaxing”
has been demonstrated41, it is also often important to compare spectroscopic profiling with
parallel histological analyses, requiring chemical dewaxing of sections, a process which adds
to the sample variability. The observation of variable dewaxing efficiencies depending on
tissue pathology ads complexity to the challenge, perhaps requiring a combination of
established clinical dewaxing protocols with computational procedures.
Conclusion
This study shows the influence that Raman substrates have on resulting spectra from
Raman analysis. Spectral backgrounds of the substrates show that the baseline of low-E is the
highest and CaF2 the lowest of the three substrates. It has been established through
observation and investigation that CaF2 and Spectrosil substrates retain paraffin wax after the
dewaxing procedure is carried out whereas low-E does not. This is attributed to the difference
in surface roughness and chemistry between substrates. AFM demonstrated that low-E
substrates are far smoother than either CaF2 or Spectrosil substrates with average roughness
of 1.10 nm compared to 4.76 nm and 3.88 nm respectively.
Page 29 of 42 Analyst

This study has also observed the difference between the dewaxing efficiency between
normal brain and cancerous brain tissue. This has been attributed to a change in density
between normal and cancerous, which causes the denser cancerous tissue to retain wax better
than the, less dense, normal tissue. It is important to note therefore that tissue processing
procedures for spectral histopathology of normal tissue may not be optimised for abnormal
regions.
Acknowledgements
The authors would like to acknowledge the support of the Sydney Driscoll Neuroscience
Foundation, Rosemere Cancer Foundation, Brain Tumour North West, the Centre for
Materials and Science at the University of Central Lancashire, the European Community
Action Scheme for the Mobility of University Students and the Association of British
Spectroscopists. The Focas Research Institute is supported through the National Biophotonics
and Imaging Platform (NBIP) Ireland funded under the Higher Education Authority PRTLI
(Programme for Research in Third Level Institutions) Cycle 4, co-funded by the Irish
Government and the European Union. The authors thank Dr Alex Henderson for the in-house
written Matlab code, Dr Luke O’Neill, Focas Research Institute for assistance with AFM
measurements and Mr Reece Hall for assistance with SEM/EDAX measurements.
References
Page 30 of 42Analyst

1. X Prize. 2. S. Frankel, G. D. Smith, J. Donovan and D. Neal, The Lancet, 2003, 361, 1122-1128. 3. R. M. Hoffman and A. Y. Smith, Asian J. Androl., 2011, 13, 369-373. 4. D. Hessels, H. G. Rittenhouse and J. A. Schalken, EAU Update Series, 2005, 3, 200-213. 5. J. B. Lattouf and F. Saad, BJU Int., 2002, 90, 694-699. 6. S. S. Raab, D. M. Grzybicki, J. E. Janosky, R. J. Zarbo, F. A. Meier, C. Jensen and S. J. Geyer,
Cancer, 2005, 104, 2205-2213. 7. D. I. Ellis, and R. Goodacre, Analyst, 2006, 131, 875-885. 8. S. E. Taylor, K. T. Cheung, Patel, II, J. Trevisan, H. F. Stringfellow, K. M. Ashton, N. J. Wood, P.
J. Keating, P. L. Martin-Hirsch and F. L. Martin, British journal of cancer, 2011, 104, 790-797. 9. R. S. Da Costa, B. C. Wilson and N. E. Marcon, Curr Opin Gastronenterol, 2005, 21, 70-79. 10. M. G. Shim, L.-M. Wong Kee Song, N. E. Marcon and B. C. Wilson, Photochemistry and
Photobiology, 2000, 72, 146-150. 11. T. C. Bakker Schut, G. J. Puppels, Y. M. Kraan, J. Greve, L. L. van der Maas and C. G. Figdor,
International journal of cancer. Journal international du cancer, 1997, 74, 20-25. 12. J. Sulé-Suso, A. Forster, V. Zholobenko, N. Stone and A. El Haj, Applied spectroscopy, 2004,
58, 61-67. 13. F. M. Lyng, E. Ó. Faoláin, J. Conroy, A. D. Meade, P. Knief, B. Duffy, M. B. Hunter, J. M. Byrne,
P. Kelehan and H. J. Byrne, Experimental and Molecular Pathology, 2007, 82, 121-129. 14. A. Podshyvalov, R. K. Sahu, S. Mark, K. Kantarovich, H. Guterman, J. Goldstein, R.
Jagannathan, S. Argov and S. Mordechai, Appl. Opt., 2005, 44, 3725-3734. 15. S. Koljenovic, L. P. Choo-Smith, T. C. Bakker Schut, J. M. Kros, H. J. van den Berge and G.
Puppels, Lab. Invest, 2002, 82, 1265-1277. 16. C. Beleites, G. Steiner, M. G. Sowa, R. Baumgartner, S. Sobottka, G. Schackert and R. Salzer,
Vibrational Spectroscopy, 2005, 38, 143-149. 17. R. Manoharan, K. Shafer, L. Perelman, J. Wu, K. Chen, G. Deinum, M. Fitzmaurice, J. Myles, J.
Crowe, R. R. Dasari and M. S. Feld, Photochem Photobiol, 1998, 67, 15-22. 18. R. K. Dukor, M. N. Liebman and B. L. Johnson, Cellular and molecular biology (Noisy-le-Grand,
France), 1998, 44, 211-217. 19. M. J. Baker, E. Gazi, M. D. Brown, J. H. Shanks, N. W. Clarke and P. Gardner, Journal of
Biophotonics, 2009, 2, 104-113. 20. D. C. Malins, N. L. Polissar and S. J. Gunselman, Proc. Natl. Acad. Sci. USA, 1997, 94, 259-264. 21. M. J. Baker, E. Gazi, M. D. Brown, J. H. Shanks, P. Gardner and N. W. Clarke, British journal of
cancer, 2008, 99, 1859-1866. 22. M. Isabelle, N. Stone, H. Barr, M. Vipond, N. Shepherd and K. Rogers, Spectroscopy 2008, 22,
97-104. 23. M. J. Romeo and M. Diem, Vib Spectrosc, 2005, 38, 115-119. 24. C. Kendall, M. Isabelle, F. Bazant-Hegemark, J. Hutchings, L. Orr, J. Babrah, R. Baker and N.
Stone, Analyst, 2009, 134, 1029-1045. 25. E. Ó Faoláin, M. B. Hunter, J. M. Byrne, P. Kelehan, H. A. Lambkin, H. J. Byrne and F. M. Lyng,
Journal of Histochemistry and Cytochemistry, 2005, 53, 121-129. 26. E. Ó Faoláin, M. Hunter, J. Byrne, P. Kelehan, M. McNamara, H. Byrne and F. Lyng, Materials
Synthesis and Applications, Dublin Institute of Technology, 2005, 38, 121-127. 27. F. Bonnier, A. D. Meade, S. Merzha, P. Knief, K. Bhattacharya, F. M. Lyng and H. J. Byrne,
Analyst, 2010, 135, 1697-1703. 28. F. Bonnier, P. Knief, A.D. Meade, J. Dorney, K. Bhattacharya, F.M. Lyng, H.J. Byrne, Proc. of
SPIE-OSA Biomedical Optics,2011, SPIE Vol. 8087, 8087F
Page 31 of 42 Analyst

29. J. Filik, M. D. Frogley, J. K. Pijanka, K. Wehbe and G. Cinque, Analyst, 2012, 137, 853-861. 30. P. Bassan, J. Lee, A. Sachdeva, J. Pissardini, K. M. Dorling, J. S. Fletcher, A. Henderson and P.
Gardner, Analyst, 2013, 138, 144-157. 31. M. Miljkovic, B. Bird, K. Lenau, A. I. Mazur and M. Diem, Analyst, 2013, 138, 3975-3982. 32. J. R. Hands, P. Abel, K. Ashton, T. Dawson, C. Davis, R. Lea, A. McIntosh and M. Baker,
Analytical and Bioanalytical Chemistry, 2013, 1-9. 33. C. Gobinet, D. Sebiskveradze, V. Vrabie, A. Tfayli, O. Piot and M. Manfait,, 16th European
Signal Processing Conference (EUSIPCO). 2008. 34. F. Bonnier, S. M. Ali, P. Knief, H. Lambkin, K. Flynn, V. McDonagh, C. Healy, T. C. Lee, F. M.
Lyng and H. J. Byrne, Vibrational Spectroscopy, 2012, 61, 124-132. 35. F. Bonnier, A. Mehmood, P. Knief, A. D. Meade, W. Hornebeck, H. Lambkin, K. Flynn, V.
McDonagh, C. Healy, T. C. Lee, F. M. Lyng and H. J. Byrne, Journal of Raman Spectroscopy, 2011, 42, 888-896.
36. P. Bassan, A. Sachdeva, J. Lee and P. Gardner, Analyst, 2013, 138, 4139-4146. 37. L. Li, Z. Wu, L. Chen, F. George, Z. Chen, A. Salem, M. Kallergi and C. Berman, Conference
proceedings : ... Annual International Conference of the IEEE Engineering in Medicine and
Biology Society. IEEE Engineering in Medicine and Biology Society. Conference, 2005, 3, 3253-3256.
38. D. Bertholdo, A. Watcharakorn, M. Castillo, Neuroimaging Clinics, 2013, 23(3), 359-380
39. E.O. Faolain, M.B. Huinter, J.M. Byrne, P. Kelehan. M. Mcnamara, H.J. Byrne, F.M. Lyng,
Vibrational Spectroscopy, 2005, 38 (1-2), 121-127
40. E.O. Faolain, M.B. Huinter, J.M. Byrne, P. Kelehan. P. Lambkin, H.J. Byrne, F.M. Lyng Faolain,
J Histochem Cytochem, 2005, 53, 121-129
41. A. Tfayli, C. Gobinet, V. Vrabie,R. Huez , M. Manfait,O. Piot, Appl Spectrosc, 2009, 63, 564-
570
List of Tables and Figures
Table 1 Patient details with histological subtype and metastatic origin.
Figure 1 Microscopic images of H&E stained tissue samples of normal brain, metastatic (from oesophagus and stomach, breast, colon/rectum, lung and melanoma as labelled above) and GBM brain WHO grade IV (x 100). Scale bar represents 50 microns.
Figure 3 Averaged spectra of 458 CaF2 acquisitions, 210 low-E acquisitions and 465 Spectrosil acquisitions from all tissue specimens and a background-subtracted spectrum of paraffin wax. The tissue spectra have been vector normalised and offset for visual clarity. The asterisks above the peaks correspond to the paraffin contributions.
Figure 4 Vector normalised, background corrected spectra of substrates after dewaxing from: 1 CaF2 acquisition, 1 Spectrosil acquisition and 10 averaged low-E acquisitions. The spectrum of paraffin wax is included as a reference. The spectra have been appropriately scaled and offset for visual clarity.
Figure 5 Microscopic Raman images at x 10 of the substrate surfaces after dewaxing. Wax residuals can be observed on the CaF2 and Spectrosil substrates. Scale bars represent 0.5 mm.
Page 32 of 42Analyst

Figure 6 AFM images of Spectrosil, CaF2 and Low-E substrates.
Figure 7 Averaged immersion spectra of 127 GBM acquisitions, 668 metastatic acquisitions and 157 normal brain acquisitions. Normal tissue spectrum is shown with its standard deviation in red (top), GBM tissue spectrum is shown with its standard deviation in green (middle), and metastatic tissue spectrum is shown with its standard deviation in blue (bottom). Spectra have been vector normalised, the backgrounds have been corrected using a 5th order polynomial fit and subtraction and 7 points of smoothing. The asterisks correspond to paraffin peaks from residual wax in the tissue.
Figure 8 The average intensity and standard deviation of three intense paraffin peaks at 1061, 1131
and 1294 cm-1 for the three tissue types; Normal tissue (blue), Glioblastoma multiforme (red) and
Metastatic brain cancer (green)
Page 33 of 42 Analyst

Table 1 Patient details with histological subtype and metastatic origin.
BTNW no. Gender DOB Origin of Metastasis/histological
subtype
119 F 26/06/1963 Breast
707 F 07/08/1945 Breast
756 F 15/03/1957 Breast
888 M 25/11/1948 Colon/rectum
985 M 05/02/1933 Melanoma
988 M 30/12/1949 Oesophagus & stomach
1001 F 20/12/1944 Lung
690 / 1012 F 25/10/1960 Breast
1004 F 03/09/1956 Breast
998 / 1010 M 25/07/1946 Colon
1020 F 05/06/1948 Breast
2 F 28/10/1937 GBM
3 F 22/09/1981 GBM
4 M 08/12/1942 GBM
5 F 29/10/1958 GBM
7 M 14/04/1939 Normal Brain
10 F 13/06/1929 GBM
78 F 24/09/1955 Lung
106 F 14/02/1965 Normal Brain
132 F 24/06/1943 Normal Brain
136 F 25/09/1956 Normal Brain
137 M 26/04/1944 Colon/rectum
164 M 10/04/1954 Oesophagus & stomach
184 F 21/11/1948 Lung
215 M 21/01/1973 Lung
274 M 12/07/1940 Colon/rectum
295 F 12/06/1936 Lung
358 M 08/05/1935 Melanoma
409 F 08/08/1925 Colon/rectum
444 M 30/01/1978 Normal Brain
509 M 11/02/1930 Melanoma
517 F 05/06/1955 Lung
521 M 18/01/1949 Oesophagus & stomach
562 F 12/03/1953 Lung
567 F 09/04/1947 Melanoma
668 F 30/08/1943 Colon/rectum
678 F 13/11/1961 Normal Brain
688 F 15/06/1965 Melanoma
694 M 18/09/1951 Lung
721 F 04/01/1976 Oesophagus & stomach
772 M 21/09/1972 Normal Brain
Page 34 of 42Analyst

Figure 1 Microscopic images of H&E stained tissue samples of normal brain, metastatic (from oesophagus and
stomach, breast, colon/rectum, lung and melanoma as labelled above) and GBM brain WHO grade IV (x 100).
Scale bar represents 50 microns.
Page 35 of 42 Analyst

Figure 2 Raw spectra of the substrate backgrounds: CaF2, low-E and Spectrosil.
Page 36 of 42Analyst

Figure 3 Averaged spectra of 458 CaF2 acquisitions, 210 low-E acquisitions and 465 Spectrosil acquisitions
from all tissue specimens and a background-subtracted spectrum of paraffin wax. The tissue spectra have been
vector normalised and offset for visual clarity. The asterisks above the peaks correspond to the paraffin
contributions.
Page 37 of 42 Analyst

Figure 4 Vector normalised, background corrected spectra of substrates after dewaxing from: 1 CaF2
acquisition, 1 Spectrosil acquisition and 10 averaged low-E acquisitions. The spectrum of paraffin wax is
included as a reference. The spectra have been appropriately scaled and offset for visual clarity.
Page 38 of 42Analyst

Figure 5 Microscopic Raman images at x 10 of the substrate surfaces after dewaxing. Wax residuals can be observed on the CaF2 and Spectrosil substrates. Scale bars represent 0.5 mm.
Page 39 of 42 Analyst

Figure 6 AFM images of Spectrosil, CaF2 and Low-E substrates.
Average surface roughness = 3.88 nm
Average surface roughness = 4.76 nm
Average surface roughness = 1.10 nm
Page 40 of 42Analyst
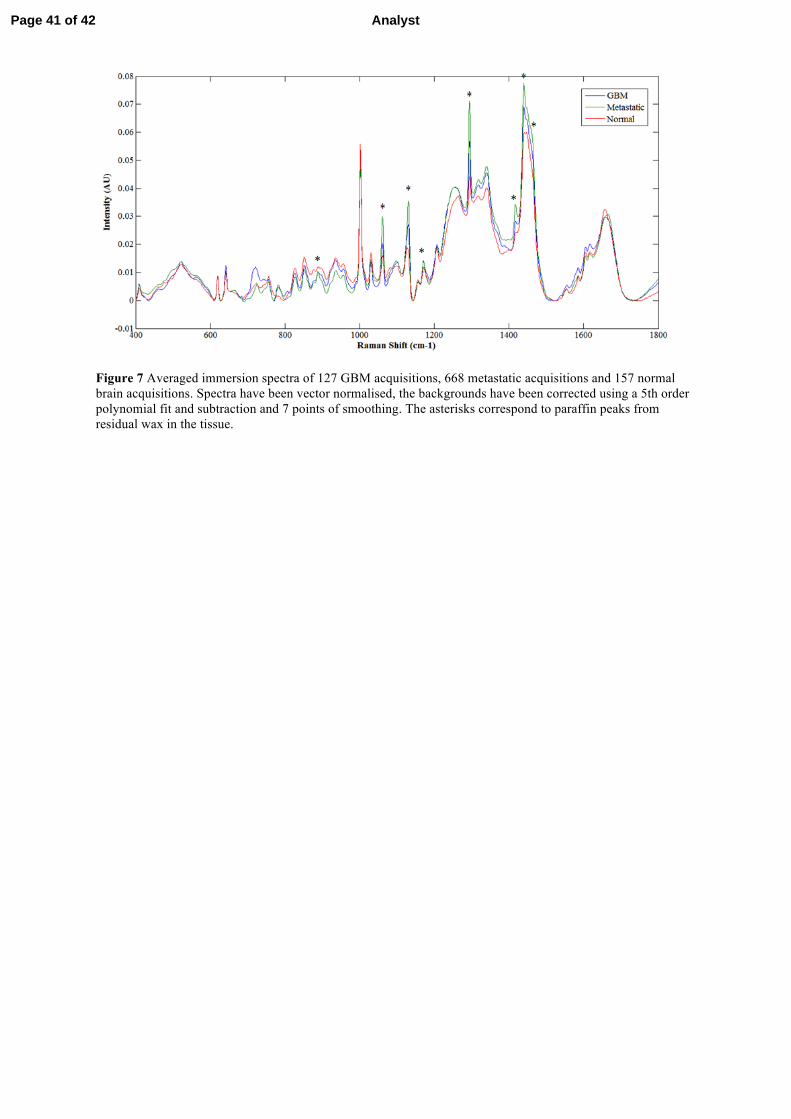
Figure 7 Averaged immersion spectra of 127 GBM acquisitions, 668 metastatic acquisitions and 157 normal brain acquisitions. Spectra have been vector normalised, the backgrounds have been corrected using a 5th order polynomial fit and subtraction and 7 points of smoothing. The asterisks correspond to paraffin peaks from residual wax in the tissue.
Page 41 of 42 Analyst

Figure 8. The average intensity and standard deviation of three intense paraffin
peaks at 1061, 1131 and 1294 cm-1 for the three tissue types; Normal tissue
(blue), Glioblastoma multiforme (red) and Metastatic brain cancer (green)
Page 42 of 42Analyst