investigating the effect of sa:v on the rate of · pdf file · 2013-10-06can call...
TRANSCRIPT

Investigating The Effect of SA:V On The Rate Of Diffusion

Introduction
Agar blocks containing DCPIP are used to represent cells.
Ascorbic acid turns DCPIP colourless.
Blocks of different SA:V are placed in ascorbic acid and the time taken for the blocks to go completely colourless is recorded.
Group results are collated and a graph showing SA:V ratios against time is drawn and a curve of best fit added.

DCPIP
• DCPIP is dichlorophenolindophenol but you can call it DCPIP!
• It is used to test for vitamin C (ascorbic acid).
• Ascorbic acid makes DCPIP change from a dark blue to colourless.
Fig.1 You can see how far the ascorbic acid has diffused and can time how long it takes for the ascorbic acid to diffuse to the centre of the cell.

Method
1. Accurately cut blocks of different sizes to a maximum of 10mm x 10mm x10mm.
2. Place in ascorbic acid.
3. Time how long it takes for the blocks to go colourless.

The Fast Way
Discard
10x5x10mm 10x5x5mm 5x5x5mm 5x2.5x5mm 5x2.5x2.5mm
2.5x2.5x2.5mm
N.B. The blocks are not the same shape – consider this when writing an evaluation
0.8:1 1.0:1 1.2:1 1.6:1 2.0:1
2.4:1

Data Processing and Presentation

Raw Data
SA:V
Time taken for the agar block to go colourless (±1s)
Student 1 Student 2 Student 3 Student 4 Student 5 Student 6
0.80 628 440 620 1000 589 695
1.00 435 394 287 580 520 625
1.20 230 286 170 452 395 460
1.60 90 266 156 255 200 150
2.00 53 166 101 160 132 126
2.40 23 116 46 120 100 89

Processed Data Table 1
SA:V Mean σ
0.80 427 313
1.00 349 270
1.20 262 193
1.60 121 84
2.00 85 59
2.40 63 41

Processed Data Table 2
SA:V
Rate of diffusion 1/time (±1s)
Student 1 Student 2 Student 3 Student 4 Student 5 Student 6
0.0000 0.0000 0.0000 0.0000 0.0000 0.0000 0.0000
0.8000 0.0016 0.0023 0.0016 0.0010 0.0017 0.0014
1.0000 0.0023 0.0025 0.0035 0.0017 0.0019 0.0016
1.2000 0.0044 0.0035 0.0059 0.0022 0.0025 0.0022
1.6000 0.0111 0.0038 0.0064 0.0039 0.0050 0.0067
2.0000 0.0189 0.0060 0.0099 0.0063 0.0076 0.0079
2.4000 0.0435 0.0086 0.0217 0.0083 0.0100 0.0112
N.B. Blocks of SA:V 0.0 were not used but have been included in the data to ensure that the curve in graph 2 has its origins at 0,0.

Processed Data Table 3
SA:V Mean σ
0.0 0.0000 0.0000
0.8 0.2012 0.0004
1.0 0.2514 0.0007
1.2 0.3020 0.0015
1.6 0.4045 0.0027
2.0 0.5062 0.0048
2.4 0.6096 0.0138

Graph 1 – The effect of SA:V on the time taken for the blocks to go colourless
R² = 0.9746
0
100
200
300
400
500
600
700
0 0.2 0.4 0.6 0.8 1 1.2 1.4 1.6 1.8 2 2.2 2.4
Error bars represent ± 1σ
Mean
Expon. (Mean)
Surface Area:Volume x:1
Tim
e (±
1s)

Graph 2 – The effect of SA:V on the rate of diffusion of ascorbic acid into agar/DCPIP blocks
R² = 0.984
0.0000
0.0050
0.0100
0.0150
0.0200
0.0250
0.0300
0.0350
0.0 0.5 1.0 1.5 2.0 2.5
Series1
Poly. (Series1)
Surface Area:Volume x:1
Rat
e 1
/tim
e in
se
con
ds
Error bars represent ± 1σ

Conclusion (Aspect 1) • Graph 1 shows that the time take for the blocks to go completely colourless
decreases as the SA:V increases. • Graph 2 shows that the rate of diffusion increases exponentially with increasing
SA:V. • Doubling the SA:V ratio from 1.0:1 to 2.0:1 resulted in approximately four times
the rate of diffusion. • As each living cell is bathed in extracellular fluid and is closely associated with
capillaries, the small size of cells allows sufficient oxygen and glucose to diffuse into cells for the synthesis of ATP by respiration.
• Red blood cells are particularly small and have a biconcave shape, resulting in the rapid diffusion of oxygen into and out of the cells.
• Some invertebrates carry out gaseous exchange through their skin and such taxonomic groups can only reach a certain size (see fig. 2).
• Larger organisms have developed special respiratory surfaces for gaseous exchange such as lungs or gills which provide a much larger surface area.
• Remember to include qualitative observations! All the cubes went from blue to colourless, smallest first and then in order of increasing size. fig. 2

Conclusion (Aspects 2 and 3)
Aspect 2 Evaluating procedure(s) Aspect 3 Improving the investigation
The blocks were not cut with great accuracy but only ± 0.5mm.
Use a micrometer to measure the dimensions and calculate the SA:V accordingly. See fig. 1
It was difficult to cut the cubes flat and perpendicular ensuring true cuboids.
Using a single edged razor blade (fig. 2) and/or two equally sized metal blocks placed against a vertical surface (fig 3) providing the precision of a guillotine.
It was difficult to determine when the blue DCPIP had completely turned colourless.
Use a white tile, good light source and a magnifying glass.
Fig. 1 Fig. 2
cut metal block
agar block
Fig. 3
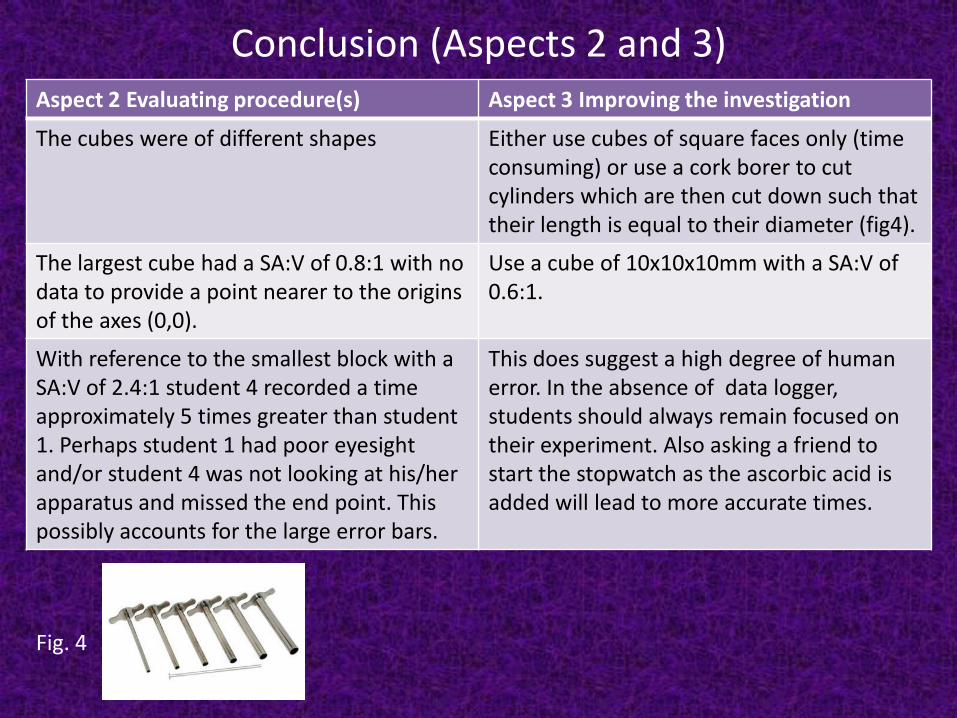
Conclusion (Aspects 2 and 3) Aspect 2 Evaluating procedure(s) Aspect 3 Improving the investigation
The cubes were of different shapes Either use cubes of square faces only (time consuming) or use a cork borer to cut cylinders which are then cut down such that their length is equal to their diameter (fig4).
The largest cube had a SA:V of 0.8:1 with no data to provide a point nearer to the origins of the axes (0,0).
Use a cube of 10x10x10mm with a SA:V of 0.6:1.
With reference to the smallest block with a SA:V of 2.4:1 student 4 recorded a time approximately 5 times greater than student 1. Perhaps student 1 had poor eyesight and/or student 4 was not looking at his/her apparatus and missed the end point. This possibly accounts for the large error bars.
This does suggest a high degree of human error. In the absence of data logger, students should always remain focused on their experiment. Also asking a friend to start the stopwatch as the ascorbic acid is added will lead to more accurate times.
Fig. 4

Other relevant information
1. The cubes were placed in a test tube that was corked and placed on its side. Only the corners of the cubes were in contact with the glass of the test tube. The tube was gently moved from side to side to make sure that the cubes were not touching.
2. Cells are not cuboids and unlike the agar blocks, are surrounded by a plasma membrane. Water soluble substances can only diffuse through the channel proteins.