investigating soil chemistry on intensive horticulture …...soil and dam sediment chemistry report...
TRANSCRIPT
Soil and dam sediment chemistry report Southern Cross University 1
Investigating soil chemistry on intensive horticulture
sites and in associated dam sediments
Final Report - Coffs Harbour City Council Environmental Levy Program
Stephen R. Conrad; Christian J. Sanders; Isaac R. Santos; Shane A. White
15 July 2019
Soil and dam sediment chemistry report Southern Cross University 2
Prepared for: Coffs Harbour City Council
Citation: Conrad, S.R., Sanders C.J., Santos, I. R., White S.A. (2019). Investigating soil
chemistry on intensive horticulture sites and in associated dam sediments. National Marine
Science Centre, Southern Cross University, Coffs Harbour, NSW. 41 pages.
Contact:
Professor Christian J. Sanders
Phone: 02 6659 8117
Email: [email protected]
Address: National Marine Science Centre
2 Bay Drive
Charlesworth Bay
Coffs Harbour, NSW
Australia, 2450
Acknowledgements:
This project was funded by the Coffs Harbour City Council’s Environmental Levy program.
We would like to acknowledge the contributions of Samantha Hessey, Project Officer for the
Orara River Rehabilitation Project & Regional State of the Environment Reporting, Coffs
Harbour City Council for inspiring and supporting this project. We wish to thank the
landowners who were kind enough to let us conduct sampling on their property, this project
would have not have gone on without this permission. Next, we acknowledge the efforts of
Dylan Brown, Carolina Bueno, and Ceylena Holloway. Their efforts and expertise in both the
laboratory and the field were integral to the completion of this project. The authors would
also like to acknowledge Simon Proust for local insight in choosing sampling locations.
This report belongs to the public domain. Data and text can be made publicly available. The
report’s intellectual property is vested in Southern Cross University. Coffs Harbour City
Council has been granted a non-exclusive, royalty-free, worldwide licence to use and
reproduce this work.

Soil and dam sediment chemistry report Southern Cross University 3
Contents
List of Figures ........................................................................................................................... 4
List of Tables ............................................................................................................................ 4
Executive Summary ................................................................................................................. 5
1. Introduction ...................................................................................................................... 6
2. Materials and Methods .................................................................................................... 7
2.1 Study Site .......................................................................................................................... 7
2.2 Sample collection ............................................................................................................. 7
2.3 Sample processing and chemical analyses..................................................................... 11
2.3.1 Terrestrial core pesticide analysis .......................................................................... 11
2.3.2 Dam sediment cores and sediment dating ............................................................... 12
2.3.3 Trace metal contents and enrichment factors (EF) ................................................. 12
3. Results .............................................................................................................................. 13
3.1 Terrestrial soil cores ...................................................................................................... 13
3.1.1 Pesticides ................................................................................................................. 13
3.1.2 Trace metals ............................................................................................................ 17
3.2 Dam sediment cores ....................................................................................................... 20
3.2.1 Sediment density and dating .................................................................................... 20
3.2.2 Trace metal contents and EF ................................................................................... 20
4. Discussion ........................................................................................................................ 27
4.1 Pesticide residues in terrestrial cores ....................................................................... 27
4.1.1 Spatial distribution of pesticides ............................................................................. 27
4.1.2 Fungicides ............................................................................................................... 27
4.1.3 Herbicides ................................................................................................................ 28
4.1.4 Organophosphates ................................................................................................... 29
4.1.5 Other pesticides ....................................................................................................... 30
4.2 Trace metals and P ......................................................................................................... 31
5. Conclusions...................................................................................................................... 32
6. References ........................................................................................................................ 35
Appendix ................................................................................................................................. 40

Soil and dam sediment chemistry report Southern Cross University 4
List of Figures
Figure 1. Aerial photography time series of the Sandy Beach catchment (red line, near
Woolgoolga, NSW) demonstrating land use change in Northern NSW agricultural lands
between 1956 and 2017. ArcGIS software used to quantify land uses. Banana farms: yellow
polygons and percentages; blueberry farms: blue polygons and percentages. Images provided
by NSW DPI. ............................................................................................................................. 9
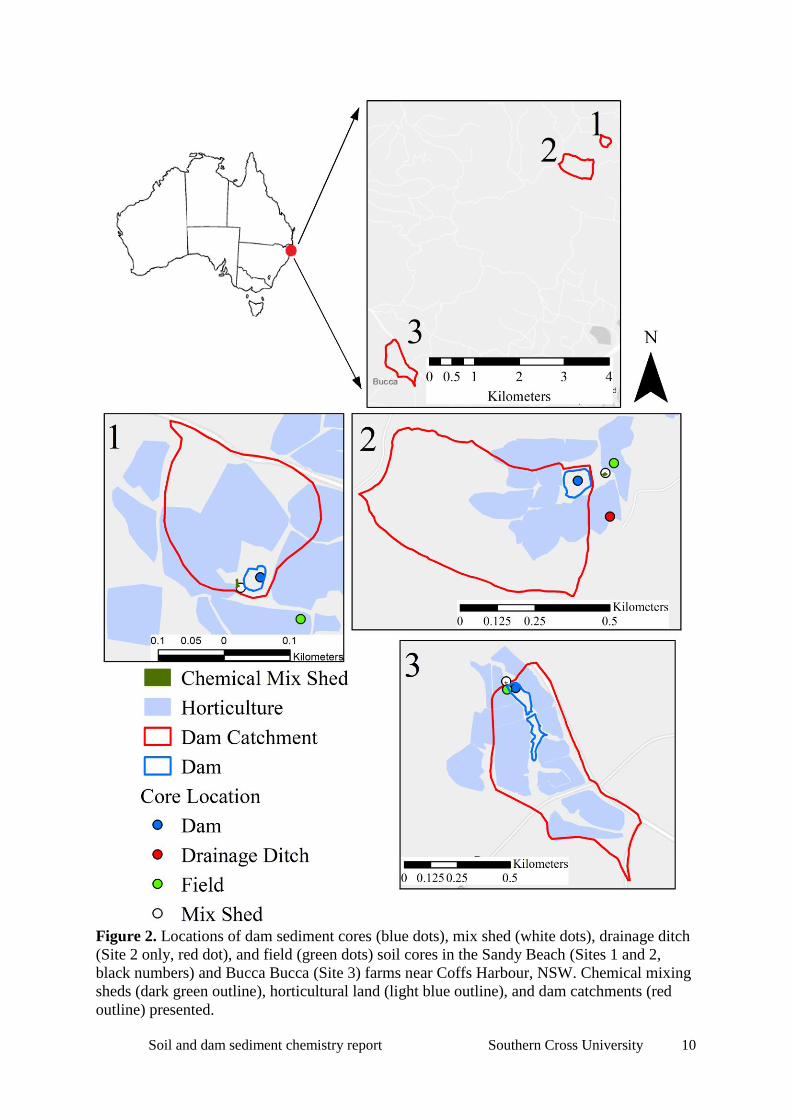
Figure 2. Locations of dam sediment cores (blue dots), mix shed (white dots), drainage ditch
(Site 2 only, red dot), and field (green dots) soil cores in the Sandy Beach (Sites 1 and 2,
black numbers) and Bucca Bucca (Site 3) farms near Coffs Harbour, NSW. Chemical mixing
sheds (dark green outline), horticultural land (light blue outline), and dam catchments (red
outline) presented. .................................................................................................................... 10
Figure 3. Percentage of total detected pesticide masses (mg) from each terrestrial soil core
subsample (coloured cylinders). A total of 217 mg of pesticides were detected from our 21
core subsamples. Soil core intervals classified by colour based on mass percentages of the
total detected pesticide mass. Grey: below limit of detection. Green: 0-10 %. Yellow: 10-20
%. Red: > 20 %. Site numbers are displayed in gold in the top right corner of each map.
Figure 2 displays a more detailed map of the sampling area and Table 1 displays soil
pesticide contents from each subsample. ................................................................................. 15
Figure 4. Dry bulk density (DBD, g cm-3
) and excess 210
Pb (210
Pbex) activity (Bq kg-1
) plotted
against depth from dam sediment cores of Sites 1, 2, and 3. Profiles of 210
Pbxs indicate
mixing, therefore sedimentation rates were not calculated for the dam cores. ........................ 20
Figure 5. Contents of trace metals with depth from dam sediment cores at Site 1 (black), Site
2 (white), and Site 3 (red). ....................................................................................................... 23
Figure 6. Enrichment factors (EF) depth profiles of trace metals which were moderately to
severely enriched in dam cores from each site. EF > 1 signifies anthropogenic portion of that
element. Note the different scale of enrichment for each site. *Note large increase in scale for
Se at Site 3. .............................................................................................................................. 24
List of Tables
Table 1. Pesticide soil contents (in mg kg-1
) from chemical mixing sheds, agricultural
production areas (field), and drainage ditch soil cores from farms in the Coffs Harbour LGA.
.................................................................................................................................................. 16
Table 2. Trace metal and P soil quality guidelines (SQG) and contents from chemical mixing
sheds, agricultural production areas (field), and drainage ditch soil cores from farms in the
Coffs Harbour LGA. Highlighted cells are above SQG values (> SQG low = highlight only; >
SQG high = highlight + bold). ................................................................................................. 19
Table 3. Trace metal soil quality guidelines (SQG) and contents from dam sediment cores.
Highlighted cells are above SQG values (> SQG low = highlight only; > SQG high =
highlight + bold). ..................................................................................................................... 25
Table 4. Summary of environmental and aquatic toxicity, detections, magnitude of
concentration (either ANZECC SQG or enrichment factors), spatial distribution amongst our
study sites, and persistence and mobility within the environment for pesticides and trace
metals investigated in this study. Contaminants evaluated with literature, online databases,
data from this report, and our judgement to generate a rating of overall concern. Red, yellow,
and green text indicate high, moderate, and low risk, respectively. Overall risk of some
contaminants remains uncertain due to conflicting reports from the literature and lack of
more specific geochemical data. Literature cited in appendix. ............................................... 34

Soil and dam sediment chemistry report Southern Cross University 5
Executive Summary
Southern Cross University performed soil and sediment quality investigations on farms with
various land use histories, including blueberry and banana cultivation, with funding from the
Coffs Harbour City Council’s Environmental Levy program.
Terrestrial soils from chemical mixing sheds, crop production areas (fields), drainage areas,
and bottom sediments from retention reservoirs (dams) were sampled from three different
sites in the Coffs Harbour local government area. Sites 1 and 2 were in the Sandy Beach
catchment, while Site 3 was in the Bucca Bucca Creek catchment. All three sites are currently
used for blueberry cultivation.
Terrestrial soil cores were analysed for 97 different pesticide residues of different classes
(herbicides, insecticides, fungicides). Additionally, terrestrial soil and dam sediment cores
were analysed for trace metal contents.
Spatial distributions of pesticides and trace metals in terrestrial soils and sediments were
analysed to identify contaminated sites. Comparisons to the Australia and New Zealand
Environment and Conservation Council (ANZECC) and other soil quality guidelines (SQG)
and enrichment factors (anthropogenic vs. naturally occurring portions) were used to assess
contamination of trace metals.
The farm in the Bucca Bucca catchment (Site 3) had the greatest degree of contamination
with pesticides. Fifty percent of the detectable pesticide residues were from two cores at this
site. Ninety-eight percent of the total detected pesticide mass was observed in the chemical
mixing shed core from Site 3. The fungicides propiconazole and cyprodinil were the most
abundant pesticides from this core. Soil contents of these fungicides should decline as they
degrade via natural processes, however propiconazole and cyprodinil can persist in the
environment while bound to soil organic material. Degradation rates remain uncertain.
Additionally, toxicity of propiconazole and cyprodinil degradation products may be greater
than their parent compounds.
14 of 26 subsamples of terrestrial soil and dam sediment cores from Site 2 in Sandy Beach
had arsenic contents over the SQG low value (20 mg kg-1
). One of these samples exceeded
the SQG high range value (70 mg kg-1
). Arsenic is suspected to be from pesticide application
which occurred during previous land use (banana cultivation).
Subsamples from dam sediment cores at all three sites had mercury (Hg) contents over the
SQG low value (150 µg kg-1
). Mean contents of Hg from dam sediments (141 ± 15.5 µg kg-1
)
were greater than terrestrial soils (78 ± 6.5 µg kg-1
) suggesting mobility of Hg from terrestrial
soils and retention in nearby sediments.
Overall, based on their environmental toxicity, distribution, persistence, and mobility we
identified the herbicide diuron, trace metals cadmium (Cd) and (Hg), and the fertiliser
nutrient phosphorus (P) as contaminants of high concern. Using international pesticide
toxicity standards from the Globally Harmonised System of classification and labelling of
chemicals, we classified all other detected pesticides as contaminants of potential concern.
We highlight that our sampling was spatially restricted and suggest more sampling of farm
soils to increase confidence in identifying contaminants of concern.

Soil and dam sediment chemistry report Southern Cross University 6
1. Introduction
Residues of agricultural treatment products such as fertilizers, herbicides, fungicides, and
insecticides (or more broadly termed pesticides) may not undergo rapid degradation and are
able to become persistent environmental pollutants. Accumulation and overexposure of
pesticides within the natural environment can cause ecosystem and human health
complications (Hernández et al. 2011, Schäfer et al. 2012).
Example pesticides include dieldrin, DDT, chlorpyrifos, paraquat, atrazine, propiconazole,
diuron, and many others. In addition to pesticides, some naturally occurring elements, for
example, trace metals such as lead (Pb), mercury (Hg), and arsenic (As) and excess nutrients
from fertilizers such as nitrogen (N) and phosphorus (P) are associated with agricultural
treatment products. These contaminants, whether of artificial (pesticides) or natural (trace
metals and excess nutrients) origins, can disrupt normal ecosystem functioning via
eutrophication and alteration of trophic interactions leading to decreased biomass and
biodiversity (Tilman 1999, Bennett et al. 2001, He et al. 2005).
Contaminants are introduced and transported within the environment in various ways.
Application methods used on farms include sprays (Aeolian transport), irrigation treatments
(hydrological transport), or applied directly over top of crops in solid form (terrestrial
transport with sediment erosion). Some contaminants such as N and certain organophosphate
pesticides, may exhibit affinity to remain dissolved in water (Heathwaite and Johnes 1996,
Ragnarsdottir 2000), while many others (trace metals and lipophilic pesticide molecules) may
react with clay mineral particles and become bound to soil particles in the terrestrial setting
(on the farm) or suspended in the water column (Kreuger et al. 1999).
As agricultural contaminants are often applied directly to the crops and because many
contaminants exhibit the affinity to rapidly bind to soil particles, the accumulation of
contaminants occurs in the soil underlying the crops. Indeed, agricultural fields are often sites
of increased nutrient, metal, and pesticide accumulation (Haynes and Naidu 1998, He et al.
2005, Fang et al. 2007). While agricultural soils may be the predominant (or first) major sink
for anthropogenic contaminants, these substances may be transported away from agricultural
lands under changing environmental conditions. Rainfall leaches contaminants from the soils
to surface or ground waters and increases soil erosion from agricultural landscapes (Brodie
and Mitchell 2005, Santos et al. 2011). Areas receiving sediment downstream of agricultural
lands, such as engineered dams or estuaries, can also become sinks of agricultural runoff
(Kreuger et al. 1999, Conrad et al. 2019). Sampling crop production areas and adjacent
waterways can provide better understanding of the extent of environmental impact from
agricultural treatment products.
Vertical profiles of the soil/sediment column can also be useful when assessing the extent of
contamination, especially associated with a particular land use history. Indeed, sediment core
profiles can provide evidence of historical contamination by a particular industry or activity,
especially when sediments are dated with radionuclides, such as 210
Pb (Machado et al. 2016,
Conrad et al. 2017). Additionally, the depths at which contaminants are found in the
soil/sediment column could be indicative of mobility within the sediment column, with
potential implications for groundwater (Farooq et al. 2010). Using a multiple lines of
evidence approach, such as dated sediments combined with contaminant quantification in

Soil and dam sediment chemistry report Southern Cross University 7
different soil/sediment types and from various land uses allows for better understanding of
different agricultural activities contributions to environmental contamination.
The objectives of this work were to quantify contaminant levels in various soil and sediment
types in catchments with different land use histories and to identify contaminants of concern.
We analysed sediment cores for nutrient, trace metal, and select pesticide residues from
different use areas of three farms in the Coffs Harbour local government area (LGA) that are
currently used for blueberry cultivation, but have varying land use histories. This report
focuses on the upper catchment very close to active farming operations, building on our
earlier report (Conrad et al. 2019), which discussed sediment contamination in the
downstream coastal areas (estuary and mangroves).
2. Materials and Methods
2.1 Study Site
The history of Coffs Harbour includes timber collection, dairy farming, gold mining, and
other industries, however Coffs Harbour is most known for its history of banana farming.
Cultivation of bananas began in 1891, with extensive plantations being developed by the
1920s. In the 1980’s there was evidence of health effects of banana farm pesticide use
including higher than average birth defect and cancer rates (Short 1994). Budd (1995)
reported blood borne concentrations of organochlorine (OC) pesticides in Coffs Harbour
children were higher than other more populous cities in Australia and other nations.
However, data on the extent of environmental contamination from nearly a century of banana
cultivation is lacking. Conrad et al. (2017) reported sediment enrichments with copper (Cu)
which coincided with the beginning of aerial spraying of fungicides in 1956 (Hedditch 2014).
Loughran et al. (1993) used Cesium-137 (137
Cs) radionuclides to estimate no net sediment
erosion from banana farms in the Coffs Harbour region.
More recent times have seen a change in the primary horticultural industry of the Coffs
Harbour LGA. Since the year 2000, there has been a > 400 % increase in blueberry farms in
the area (White et al. 2018), with large scale land use change from banana to blueberry farms
(demonstrated by Figure 1). Many uncertainties remain regarding the environmental impact
of blueberry farms. Our recent studies identified high levels of dissolved N in waters leaving
blueberry farms (White et al. 2018, White 2018). Conrad et al. (2019) identified increased
erosion from land use conversion from banana to blueberry cultivation has led to trace metal
and P sediment enrichment in an estuary downstream of an intensive horticultural basin
(Hearnes Lake estuary). Here we sample soil and sediment cores from blueberry farms in the
Coffs Harbour LGA to better understand the accumulation of agricultural contaminants
nearer to their source of potential of introduction.
2.2 Sample collection
We sampled three separate farms (hereby referred to as Sites 1, 2, and 3) with varying land
use history. Sites 1 and 2 are located in Sandy Beach, within the Hearnes Lake catchment
(Figure 2), and have a history of banana cultivation since the 1940s, however are now both
currently used for blueberries (blueberry cultivation beginning ~ 2002). Site 3 is located
further inland in the Bucca Bucca creek catchment (Figure 2). Previous land use here was for
Soil and dam sediment chemistry report Southern Cross University 8
cattle grazing. A blueberry farm was established after 2012 (personal communication with
land owner).
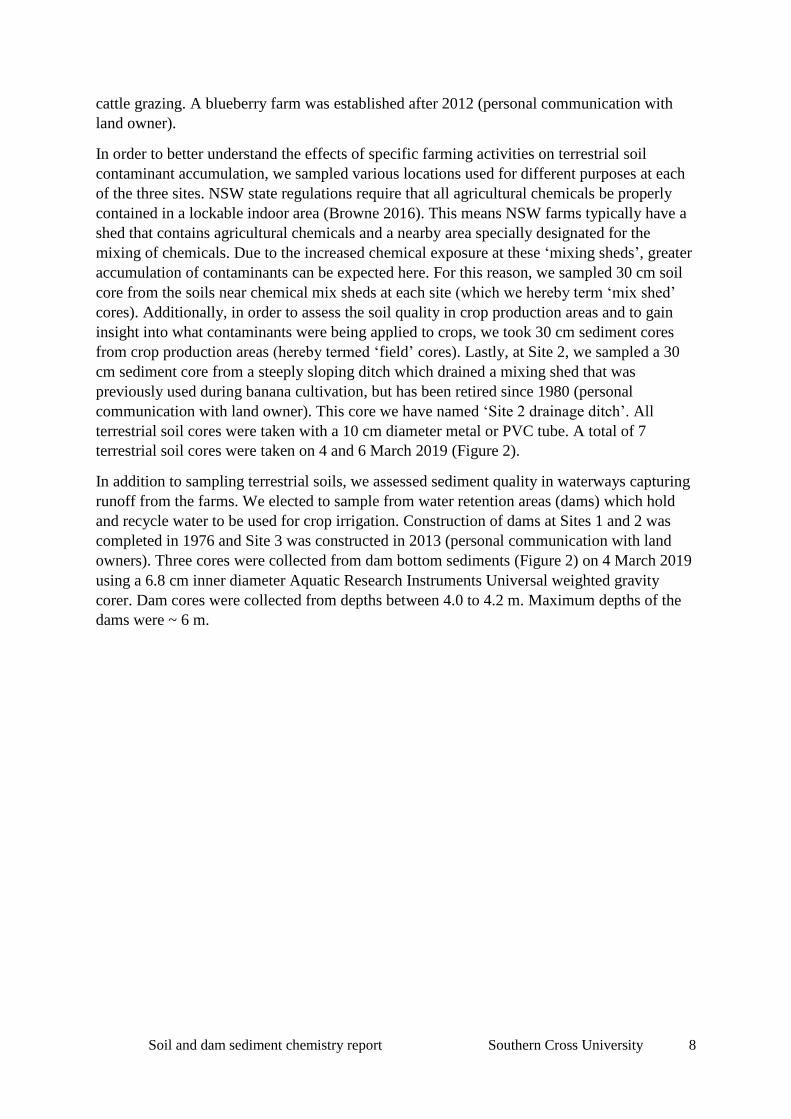
In order to better understand the effects of specific farming activities on terrestrial soil
contaminant accumulation, we sampled various locations used for different purposes at each
of the three sites. NSW state regulations require that all agricultural chemicals be properly
contained in a lockable indoor area (Browne 2016). This means NSW farms typically have a
shed that contains agricultural chemicals and a nearby area specially designated for the
mixing of chemicals. Due to the increased chemical exposure at these ‘mixing sheds’, greater
accumulation of contaminants can be expected here. For this reason, we sampled 30 cm soil
core from the soils near chemical mix sheds at each site (which we hereby term ‘mix shed’
cores). Additionally, in order to assess the soil quality in crop production areas and to gain
insight into what contaminants were being applied to crops, we took 30 cm sediment cores
from crop production areas (hereby termed ‘field’ cores). Lastly, at Site 2, we sampled a 30
cm sediment core from a steeply sloping ditch which drained a mixing shed that was
previously used during banana cultivation, but has been retired since 1980 (personal
communication with land owner). This core we have named ‘Site 2 drainage ditch’. All
terrestrial soil cores were taken with a 10 cm diameter metal or PVC tube. A total of 7
terrestrial soil cores were taken on 4 and 6 March 2019 (Figure 2).
In addition to sampling terrestrial soils, we assessed sediment quality in waterways capturing
runoff from the farms. We elected to sample from water retention areas (dams) which hold
and recycle water to be used for crop irrigation. Construction of dams at Sites 1 and 2 was
completed in 1976 and Site 3 was constructed in 2013 (personal communication with land
owners). Three cores were collected from dam bottom sediments (Figure 2) on 4 March 2019
using a 6.8 cm inner diameter Aquatic Research Instruments Universal weighted gravity
corer. Dam cores were collected from depths between 4.0 to 4.2 m. Maximum depths of the
dams were ~ 6 m.

Soil and dam sediment chemistry report Southern Cross University 9
Figure 1. Aerial photography time series of the Sandy Beach catchment (red line, near Woolgoolga, NSW) demonstrating land use change in
Northern NSW agricultural lands between 1956 and 2017. ArcGIS software used to quantify land uses. Banana farms: yellow polygons and
percentages; blueberry farms: blue polygons and percentages. Images provided by NSW DPI.
Soil and dam sediment chemistry report Southern Cross University 10
Figure 2. Locations of dam sediment cores (blue dots), mix shed (white dots), drainage ditch
(Site 2 only, red dot), and field (green dots) soil cores in the Sandy Beach (Sites 1 and 2,
black numbers) and Bucca Bucca (Site 3) farms near Coffs Harbour, NSW. Chemical mixing
sheds (dark green outline), horticultural land (light blue outline), and dam catchments (red
outline) presented.

Soil and dam sediment chemistry report Southern Cross University 11
2.3 Sample processing and chemical analyses
2.3.1 Terrestrial core pesticide analysis
For the terrestrial soil cores, we followed the NSW Environmental Protection Authority’s
(EPA) “Guidelines for Assessing Banana Plantation Sites” protocol (EPA 1997) for sampling
pesticide residues and trace metals at areas of localised contamination (hotspots). Terrestrial
soil cores were sectioned into intervals from 0 to 7.5 cm, 7.5 to 15 cm, and 15 to 30 cm
depths (EPA 1997). Each subsection was frozen until the pesticide or trace metal analysis.
Soils were dried at 105° C prior to analysis.
To determine soil organochlorine (OC) pesticide content, 10 g of sample was transferred to a
tumbler bottle. Anhydrous sodium sulphate (Na2SO4) was added until the mixture was free
flowing. To assess soil matrix effects on contaminant recovery, each sample was spiked with
a universal pesticide surrogate (dibromo-DDE). Next, 30 mL of 1:1 dichloromethane (DCM):
acetone solution was added. Bottles were tumbled for 1 hour. The resulting extract was
concentrated under N2 gas to 1 mL and placed into 1.5 mL vial. Samples were run on an
Agilent 5975 Gas Chromatograph/Mass Selective Detector (GC/MSD) at ALS Laboratories
in Brisbane. The OC pesticides tested for were alpha-BHC, hexachlorobenzene (HCB), beta-
BHC, delta-BHC, heptachlor, aldrin, heptachlor epoxide, trans-chlordane, cis-chlordane,
alpha-endosulfan, dieldrin, 4.4’-DDE, endrin, beta-endosulfan, 4.4’-DDT, endrin aldehyde,
endosulfan sulfate, 4.4’ DDT, endrin ketone, and methoxychlor. Limits of reporting (LOR)
ranged from 0.05 to 0.2 mg kg-1
. Blank (free of contaminant) samples of a similar soil matrix
were performed before analysis. Reference material was spiked with 0.5 mg kg-1
of each
target OC pesticide. Spike recoveries ranged from 77 to 108 % recoveries. During analysis, a
selected sample with a representative array of target analytes was split to assess potential
matrix interference and homogeneity of samples and spiked with OC pesticides at
concentrations between 0.5 and 2 mg kg-1
. Spike recoveries ranged from 78.5 to 124 %
recovery.
Synthetic pyrethroids were extracted in the same manner as the OC pesticides. Samples were
run on an Agilent 59755 GC/MSD in selected ion monitoring (SIM) mode. The list of
pyrethroids analysed for were bioresmethrin, phenothrin, lambda-cyhalothrin, permethrin,
cyfluthrin, cypermethrin, fenvalerate, esfenvalerate, deltamathrin, tralomethrin, allethrin,
transfluthrin, tetramethrin, tau-fluvalinate. The pytrethroid synergist piperonyl butoxide was
also tested for. LOR was 0.05 mg kg-1
for all pyrethroids. Blanks and reference spikes were
performed in the same manner as the OC pesticides. Spike recoveries ranged from 80.5 to
115 % recoveries. Representative samples were split to test for homogeneity and matrix
interference and spiked at concentrations of 0.5 mg kg-1
. One analyte (bioresmethrin) had
recovery of 22.8 % and was therefore discarded from analysis. All other spike recoveries
ranged from 81.4 to 115 %.
To determine the organophosphate (OP) and carbamate pesticide, triazine, urea, and
chloroacetanilide herbicide, and aminopyrimidine, benzimidazole, and conazole fungicide
soil concentrations, 5 g of sample was placed into a 50 mL polypropylene centrifuge tube. 4
mL of acetonitrile (ACN) was added, followed by 6 mL of methanol (MeOH). Centrifuge
tubes were vigorously hand shaken and vortexed to mix contents. Tubes were then either
sonicated for 15 mins or tumbled for 1 hour. Tubes were centrifuged at 3000 rpm for 5 mins.

Soil and dam sediment chemistry report Southern Cross University 12
25 µL of the supernatant was pipetted into a 10 mL glass tube containing 2 mL of milli-Q
water and 25 µL MeOH. Samples were briefly vortexed and filtered into 1.5 mL
microcentrifuge tubes. Samples were run on an Applied Biosystems/MDS Sciex API 5000
Liquid Chromatography/mass spectrometry/mass spectrometry (LC/MSMS) with Qjet ion
guide at ALS Laboratories in Brisbane. LORs ranged from 0.001 to 1 mg kg-1
. Blank samples
of a similar soil matrix were run prior to analysis. Reference materials were spiked with
standards to concentrations between 0.01 to 4 mg kg-1
. Reference material spike recoveries
ranged from 63.2 to 103 %. Representative samples were split and spiked with concentrations
of contaminants ranging from 0.01 mg kg-1
to 4 mg kg-1
. Recoveries ranged from 72.8 to 102
%.
2.3.2 Dam sediment cores and sediment dating
Dam sediments were extruded in 1 cm intervals using the provided extruding device from
Aquatic Research Instruments. Sediments were frozen, freeze dried, and weighed to obtain
dry bulk density (DBD). A separate portion of the sample was kept in the dark at -4° C until
pesticide analysis.
For sediment dating, 3 to 6 g of dam sediments were packed into labelled 4 mL plastic vials
to a height of 27 mm to establish uniform geometry for gamma detection. Vials were sealed
with epoxy resin for 21 or more days to allow 222
Rn to establish secular equilibrium between 226
Ra and 214
Pb. Vials were placed in a high purity germanium (HPGe) well detector
(Canberra®). 210
Pb activity was measured using the 46.5 keV gamma peak. The mean of the
295.2, 351.9, and 609.3 keV peak areas were used to determine 226
Ra activity.
2.3.3 Trace metal contents and enrichment factors (EF)
Trace metals from all samples (terrestrial soil and dam sediment cores) were analysed for
trace metals using the methodology outlined in Conrad et al. (2019) and references therein.
We used the Australian and New Zealand Environment Conservation Council (ANZECC)
Soil Quality Guidelines (SQG) (Simpson et al. 2013) as threshold values to assess the extent
of trace metal contamination (Conrad et al. 2019). Where no ANZECC SQGs existed (for
example, selenium (Se) and P), we used SQG values from the literature. SQG for Se was
obtained from Van Derveer and Canton (1997). For P, SQG values were obtained from
Ontario, Canada sediment quality guidelines (Persaud et al. 1993). We used their value of
600 mg kg-1
(the ‘lowest effect level’ described as ‘a level of sediment contamination that can
be tolerated by the majority of benthic organisms’) as our P SQG default value (Table 2). For
our high range P SQG, we used their value of 2000 mg kg-1
, described as a ‘severe effect
level’ which indicates ‘pronounced disturbance of the sediment dwelling community’. At
sediment contents above this value, P is expected to be ‘detrimental to the majority of benthic
species’ (Persaud et al. 1993).
To compare geologic and anthropogenic fractions of trace metals enrichment factors were
calculated using aluminium (Al) as the reference material as outlined in Conrad et al. (2019).

Soil and dam sediment chemistry report Southern Cross University 13
3. Results
3.1 Terrestrial soil cores
3.1.1 Pesticides
We detected 52 pesticide residues in the terrestrial soil cores. From the five soil cores from
Sites 1 and 2 there were 26 residues (50 %) from six different pesticides detected. The two
cores from Site 3 had the other 50 % of residues from seven different pesticides. In total,
there was 217 mg of pesticides detected in the 21 core subsamples analysed. By weight, 98 %
of the pesticide mass we detected occurred in the Site 3 mix shed, with only small amounts of
pesticides in the other cores (Figure 3).
ANZECC guidelines do not exist for the pesticide compounds we detected, therefore no
comparison to ANZECC guidelines could be made for our pesticide residues.
No OC pesticide residues were detected above limits of reporting (between 0.05-0.2 mg kg-1
depending on specific contaminant) at any of the study sites.
Ethoprophos and dimethoate were the OP pesticides detected. Ethoprophos was detected in
Site 1 mix shed 7.5-15 cm depth at a concentration of 0.017 mg kg-1
(Table 1). In the Site 2
mix shed ethoprophos contents were of 0.007 and 0.004 mg kg-1
at 7.5-15 and 15-30 cm
depth, respectively, and in the surface interval (0 – 7.5 cm) of S2 drainage ditch at a
concentration of 0.006 mg kg-1
. No ethoprophos was detected at Site 3. Dimethoate was
found exclusively at Site 3 mix shed in concentrations of 0.195, 0.091, and 0.186 mg kg-1
at
depths 0 – 7.5, 7.5-15, and 15-30 cm, respectively.
The carbamate insecticide methomyl concentration was greatest at 15-30 cm depth interval of
the Site 3 mix shed core (0.074, 0.011, and 0.089 mg kg-1
with increasing depth).
The pyrethroid insecticide bifenthrin in the Site 3 mix shed core followed a trend of
decreasing concentration with depth (11.4, 1.36, 0.10 mg kg-1
at 0-7.5, 7.5-15, and 15-30 cm
depth, respectively).
Four fungicides were found. The conzaole fungicide propiconazole was found in Site 2 mix
shed (0.10, 0.05, and 0.03 mg kg-1
with decreasing core depths), in Site 2 drainage ditch
surface interval (0-7.5 cm) at a concentration of 0.020 mg kg-1
, and in Site 2 field (0.13 mg
kg-1
in 0-7.5 and 0.04 mg kg-1
in 15-30). Propiconazole in the Site 3 mix shed had the highest
concentration of any pesticide we detected. Propiconazole concentrations decreased with
depth in the Site 3 mix shed core from 125 to 34.6 to 14.9 mg kg-1
as depth increased.
Propiconazole also decreased with depth in the Site 3 field core (0.99, 0.28, and 0.21 mg kg-1
with increasing depth).
Two aminopyrimidine fungicides were found. Cypronodil had the highest spatial distribution
of any contaminant found in our testing, being found in the surface intervals of the mix shed
and field cores at all three sites (Table 1). Cypronodil was also found at depths 7.5-15 and 15-
30 cm in the Site 3 mix shed and Site 3 field cores. Cypronodil was detected in S2 Field at
15-30 cm depth with a content of 0.068. Pyrimethanil contents were 0.10 mg kg-1
in 7.5-15
and 15-30 cm depth in Site 1 field core. The benzimidazole fungicide carbendazim contents
decreased with depth in the Site 3 mix shed core (0.021, 0.008, and 0.006 mg kg-1
with
increasing depths), and was also found in the surface interval (0–7.5 cm) in the Site 3 field,

Soil and dam sediment chemistry report Southern Cross University 14
Site 1 and 2 mix shed cores. Carbendazim contents were highest in the surface of the Site 2
mix shed (0.044 mg kg-1
), and relatively low in the bottom interval of Site 2 mix shed (0.006
mg kg-1
) site 1 mix shed surface (0.008 mg kg-1
).
The aryl urea herbicide diuron was found in all intervals of Site 2 Mix shed (0.010, 0.018,
and 0.015 mg kg-1
with increasing depth). Site 2 field core had diuron concentrations of 0.010
and 0.014 mg kg-1
at depths 7.5-15 and 15-30, respectively. Site 2 drainage ditch cores had
diuron contents of 0.02 and 0.012 mg kg-1
in 0-7.5 and 7.5-15 cm, respectively.
The triazine herbicide prometryn was detected in the surface interval of the Site 3 mix shed
with contents of 0.004 mg kg-1
.

Soil and dam sediment chemistry report Southern Cross University 15
Figure 3. Percentage of total detected pesticide masses (mg) from each terrestrial soil core subsample (coloured cylinders). A total of 217 mg of pesticides were
detected from our 21 core subsamples. Soil core intervals classified by colour based on mass percentages of the total detected pesticide mass. Grey: below limit
of detection. Green: 0-10 %. Yellow: 10-20 %. Red: > 20 %. Site numbers are displayed in gold in the top right corner of each map. Figure 2 displays a more
detailed map of the sampling area and Table 1 displays soil pesticide contents from each subsample.

Soil and dam sediment chemistry report Southern Cross University 16
Table 1. Pesticide soil contents (in mg kg-1
) from chemical mixing sheds, agricultural
production areas (field), and drainage ditch soil cores from farms in the Coffs Harbour LGA.
Name Class/function
Site 1
Mix
Shed
Site 1
Field
Site 2
Mix
Shed
Site 2
Field
Site 2
Drainage
Ditch
Site 3
Mix
Shed
Site 3
Field
0-7.5 Bifenthrin Pyrethroid insecticide - - - - - 11.4 -
Carbendazim Benzimidazole fungicide 0.008 - 0.044 - - 0.021 0.008
Cypronodil Aminopyrimidine fungicide 0.01 0.058 0.046 0.213 - 13.5 0.751
Dimethoate Organophosphate pesticide - - - - - 0.195 -
Diuron Aryl urea herbicide - - 0.01 - 0.02 - -
Ethoprophos Organophosphate pesticide - - - - 0.006 - -
Methomyl Carbamate insecticide - - - - - 0.074 -
Prometryn Triazine herbicide - - - - - 0.004 -
Propiconazole Conazole fungicide - - 0.1 0.13 - 125 0.99
Pyrimethanil Aminopyrimidine fungicide - - - - - - -
7.5-15 Bifenthrin Pyrethroid insecticide - - - - - 1.36 -
Carbendazim Benzimidazole fungicide - - - - - 0.008 -
Cypronodil Aminopyrimidine fungicide - - - - - 4.69 0.108
Dimethoate Organophosphate pesticide - - - - - 0.091 -
Diuron Aryl urea herbicide - - 0.018 0.01 0.012 - -
Ethoprophos Organophosphate pesticide 0.017 - 0.007 - - - -
Methomyl Carbamate insecticide - - - - - 0.011 -
Prometryn Triazine herbicide - - - - - - -
Propiconazole Conazole fungicide - - 0.05 - - 34.6 0.28
Pyrimethanil Aminopyrimidine fungicide - 0.01 - - - - -
15-30 Bifenthrin Pyrethroid insecticide - - - - - 0.1 -
Carbendazim Benzimidazole fungicide - - 0.006 - - 0.006 -
Cypronodil Aminopyrimidine fungicide - - - 0.068 - 7.27 0.226
Dimethoate Organophosphate pesticide - - - - - 0.186 -
Diuron Aryl urea herbicide - - 0.015 0.014 - - -
Ethoprophos Organophosphate pesticide - - 0.004 - - - -
Methomyl Carbamate insecticide - - - - - 0.089 -
Prometryn Triazine herbicide - - - - - - -
Propiconazole Conazole fungicide - - 0.03 0.04 - 14.9 0.21
Pyrimethanil Aminopyrimidine fungicide - 0.01 - - - - -
Concentration (mg kg-1
)Pesticide
Depth
(cm)

Soil and dam sediment chemistry report Southern Cross University 17
3.1.2 Trace metals
Arsenic (As) contents ranged from 3.7 to 99.2 mg kg-1
. Eight out of twenty one samples
exceeded the ANZECC SQGs for As, all from Site 2 (Table 2). Seven samples from Site 2
cores exceeded the SQG low range value of 20 mg kg-1
, while Site 2 drainage ditch core 7.5-
15 cm was the highest soil As content (99.2 mg kg-1
) and exceeded the SQG high range value
(70 mg kg-1
). All three sediment intervals and therefore, mean sediment contents in the Site 2
mix shed (mean 23.6 ± 1.3 (standard error) mg kg-1
) and drainage ditch (mean 63.8 ± 21.8 mg
kg-1
) cores exceeded SQG low values.
Lead (Pb) contents ranged from 8.4 to 21.8 mg kg-1
. No Pb contents exceeded the ANZECC
SQGs.
Cadmium (Cd) contents ranged from 22.2 to 310.8 µg kg-1
. No Cd contents exceeded the
ANZECC SQGs. Site 1 mix shed had the highest mean Cd contents (201.9 ± 54.5 µg kg-1
).
Chromium (Cr) contents ranged from 7.0 to 52.2 mg kg-1
. No Cr contents exceeded the
ANZECC SQGs. There was relatively high Cr in the Site 1 mix shed core middle interval
(7.5-15 cm, 52.2 mg kg-1
).
Copper (Cu) contents ranged from 3.4 to 100.3 mg kg-1
. Cu contents in the surface interval
(0-7.5 cm, 100.3 mg kg-1
) of Site 3 mix shed exceeded the ANZECC SQG low range value of
65 mg kg-1
. Site 3 mix shed had the highest average Cu contents of any core (48.4 ± 26.4 mg
kg-1
).
Nickel (Ni) contents ranged from 2.3 to 7.2 mg kg-1
. No Ni contents exceeded the ANZECC
SQGs.
Selenium (Se) contents ranged from 0.4 to 2.7 mg kg-1
. While there is no ANZECC SQG
value for Se, one sample (Site 2 drainage ditch, 15-30 cm, 2.7 mg kg-1
) exceeded the
threshold Se SQG value (2.5 mg kg-1
) derived from data in streams of the western United
States Van Derveer and Canton (1997).
Zinc (Zn) contents ranged from 10.7 to 638.4 mg kg-1
. All three sediment core intervals from
the Site 3 mix shed exceeded the ANZECC SQG (mean Zn content: 406 ± 116.9 mg kg-1
).
From 0-7.5 (638.4 mg kg-1
) exceeded the ANZECC SQG high value of 410 mg kg-1
. Contents
at greater depths (313.2 and 266.7 mg kg-1
for 7.5-15 and 15-30 cm) exceeded the SQG low
range value (200 mg kg-1
). No other samples exceeded the ANZECC SQG for Zn.
Mercury (Hg) contents ranged from 25.0 to 150.2 µg kg-1
. Site 3 field 7.5-15 cm (150.2 µg
kg-1
) was slightly above the SQG low value of 150.0 µg kg-1
. Site 2 field had the highest
average Hg contents (104.6 ± 4.4 µg kg-1
).
Cobalt (Co) contents ranged from 0.7 to 18.2 mg kg-1
. There are no ANZECC SQG for Co
and no relevant Co SQG could be found in the literature.
Iron (Fe) contents ranged from 1.0 to 5.3 %. Fe content was ~3.5 times greater in the surface
of the Site 3 mix shed core than the underlying sediments here. Aluminium (Al) contents
ranged from 1.0 to 1.6 %. Al contents varied little amongst sites and depths relative to other
elements. Manganese (Mn) contents ranged from 105 to 2634 mg kg-1
. Mean Mn contents
Soil and dam sediment chemistry report Southern Cross University 18
were highest in the growing areas (field cores) at Sites 1 and 2. These elements are naturally
abundant in the lithosphere therefore, ANZECC SQG do not exist for Al and Mn.
Phosphorus (P) contents ranged from 148.9 to 2272 mg kg-1
. No ANZECC SQG exists for P,
so instead we used the ‘Lowest Effect Level’ and ‘Severe Effect Level’ values (600 and 2000
mg kg-1
, respectively) from the Ontario, Canada SQG (Persaud et al. 1993). Site 1 mix shed
had the highest mean P contents (1273 ± 507 mg kg-1
, > SQG low). The surface interval (0-
7.5 cm) of Site 1 mix shed had the highest P contents (2272 mg kg-1
, > SQG high). At Site 3
mix shed, 0-7.5 and 7.5-15 cm intervals exceeded the SQG low value (1095 and 745 mg kg-1
,
respectively).

Soil and dam sediment chemistry report Southern Cross University 19
Table 2. Trace metal and P soil quality guidelines (SQG) and contents from chemical mixing sheds, agricultural production areas (field), and drainage ditch soil
cores from farms in the Coffs Harbour LGA. Highlighted cells are above SQG values (> SQG low = highlight only; > SQG high = highlight + bold).
As Pb Cd Cr Cu Ni Se Zn Hg Co Mn Fe Al P
Core Depth mg kg-1
mg kg-1
µg kg-1
mg kg-1
mg kg-1
mg kg-1
mg kg-1
mg kg-1
µg kg-1
mg kg-1
mg kg-1
% % mg kg-1
Site 1 Mix Shed 0-7.5 13.7 19.4 311 9.9 22.9 4.6 1.4 134.9 55 7.4 670 2.0 1.2 2272
7.5-15 13.1 10.4 145 52.2 8.0 2.5 0.8 57.8 106 5.4 544 1.1 1.1 924
15-30 9.4 11.9 150 9.5 7.2 2.8 1.5 71.2 65 5.3 2172 2.2 1.2 623
Mean ± SE 12.1 ± 1.3 13.9 ± 2.8 202 ± 55 23.9 ± 14.2 12.7 ± 5.1 3.3 ± 0.7 1.3 ± 0.2 87.9 ± 23.8 75 ± 16 6.1 ± 0.7 1129 ± 523 1.8 ± 0.4 1.2 ± 0.03 1273 ± 507
Site 1 Field 0-7.5 5.4 14.9 55 7.0 12.2 3.1 1.2 21.4 71 5.7 1014 1.5 1.2 432
7.5-15 7.6 17.2 54 7.9 11.1 3.8 0.9 21.0 109 10.3 2081 1.9 1.3 284
15-30 11.4 17.5 199 7.5 9.5 5.6 1.1 33.4 60 12.3 2003 2.2 1.4 259
Mean ± SE 8.2 ± 1.7 16.5 ± 0.8 103 ± 48 7.5 ± 0.3 11.0 ± 0.8 4.2 ± 0.8 1.1 ± 0.08 25.3 ± 4.1 80 ± 15 9.4 ± 2.0 1699 ± 343 1.9 ± 0.2 1.3 ± 0.08 325 ± 54
Site 2 Mix Shed 0-7.5 25.8 18.7 112 10.5 26.6 6.3 0.4 638 67 6.6 457 1.7 1.3 576
7.5-15 21.3 19.2 116 9.7 25.4 7.0 0.7 313 54 8.0 950 1.7 1.2 529
15-30 23.8 21.8 135 10.9 29.9 7.1 1.0 267 25 9.0 1033 2.1 1.5 584
Mean ± SE 23.6 ± 1.3 19.9 ± 1.0 121 ± 7 10.4 ± 0.4 27.3 ± 1.3 6.8 ± 0.2 0.7 ± 0.2 406 ± 117 49 ± 13 7.9 ± 0.7 813 ± 180 1.9 ± 0.1 1.3 ± 0.1 563 ± 17
Site 2 Field 0-7.5 21.8 16.0 82 11.0 24.9 6.4 0.7 89.8 112 7.5 1155 2.1 1.3 521
7.5-15 20.2 15.6 24 9.7 20.1 7.2 0.6 49.7 105 10.8 1869 2.0 1.4 333
15-30 15.1 20.4 51 9.9 20.1 7.2 0.8 72.4 97 18.2 2653 2.4 1.6 414
Mean ± SE 19.0 ± 2.0 17.4 ± 1.5 52.4 ± 16.9 10.2 ± 0.4 21.7 ± 1.6 6.9 ± 0.2 0.7 ± 0.1 70.6 ± 11.6 105 ± 4 12.2 ± 3.2 1893 ± 433 2.1 ± 0.1 1.5 ± 0.1 423 ± 55
Site 2 Drainage Ditch 0-7.5 68.0 17.3 146 8.5 12.4 6.1 1.5 52.3 79 10.1 391 1.3 1.4 545
7.5-15 99.2 20.6 80 13.8 10.0 6.6 1.1 50.3 53 10.6 430 3.8 1.5 467
15-30 24.2 19.8 29 12.7 10.4 6.7 2.7 51.3 101 8.7 369 4.6 1.5 155
Mean ± SE 63.8 ± 21.8 19.3 ± 1.0 85 ± 34 11.7 ± 1.6 10.9 ± 0.7 6.4 ± 0.2 1.8 ± 0.5 51.3 ± 0.6 78 ± 14 9.8 ± 0.6 397 ± 18 3.3 ± 1.0 1.5 ± 0.1 389 ± 119
Site 3 Mix Shed 0-7.5 5.1 9.2 62 7.3 100.3 2.3 0.5 73.9 28 1.6 383 1.4 1.0 1095
7.5-15 3.7 8.4 50 7.0 30.5 2.7 0.8 59.6 87 1.9 261 1.0 1.1 745
15-30 4.3 10.7 30 9.2 14.4 2.7 0.7 35.5 88 2.9 237 1.6 1.3 510
Mean ± SE 4.4 ± 0.4 9.4 ± 0.7 47 ± 9 7.8 ± 0.7 48.4 ± 26.4 2.6 ± 0.1 0.7 ± 0.1 56.3 ± 11.2 68 ± 20 2.1 ± 0.4 294 ± 45 1.3 ± 0.2 1.1 ± 0.1 783 ± 170
Site 3 Field 0-7.5 9.7 10.5 30 25.1 4.0 3.3 0.7 14.5 67 0.7 105 5.3 1.3 270
7.5-15 4.1 9.3 22 8.6 3.4 2.3 0.7 10.7 150 0.8 117 1.6 1.3 149
15-30 4.7 9.0 30 7.3 8.7 2.3 0.6 14.8 64 0.9 180 1.2 1.2 270
Mean ± SE 6.2 ± 1.8 9.6 ± 0.5 28 ± 3 13.7 ± 5.7 5.4 ± 1.7 2.6 ± 0.3 0.7 ± 0.1 13.3 ± 1.3 94 ± 28 0.8 ± 0.1 134 ± 23 2.7 ± 1.3 1.3 ± 0.02 230 ± 40
ANZECC SQG Low 20 50 1500 80 65 21 2.5* 200 150 - - - - 600**
High 70 220 10000 370 270 52 4 410 1000 - - - - 2000**
n > Low 7 0 0 0 1 0 1 2 1 - - - - 4
Total n = 21 n > High 1 0 0 0 0 0 0 1 0 - - - - 1
* values from van Derveer and Canton 1997
** values from Persaud et al. 1993
Highlight = contents > SQG low
Bold + highlight = content > SQG high

Soil and dam sediment chemistry report Southern Cross University 20
3.2 Dam sediment cores
3.2.1 Sediment density and dating
Sediment dry bulk density (DBD) ranged from 0.37 to 0.85, 0.11 to 0.85, and 0.28 to 0.61 g
cm-3
in cores from Site 1, 2, and 3, respectively. Mean sediment DBD was 0.64 ± 0.02, 0.39 ±
0.04, and 0.40 ± 0.03 g cm-3
in cores from Site 1, 2, and 3, respectively. Sediment DBD in
each of the three cores increased with increasing depth (Figure 4). DBD was greatest at the
bottom of cores from Sites 2 and 3.
All three cores showed evidence of mixing along the sediment column, as evidenced by the 210
Pbxs profiles (Figure 4). The lack of 210
Pbxs decay violates the assumptions of the constant
initial concentration (CIC) method (Appleby and Oldfield 1992) used for calculating
sediment accumulation rates (SAR) and sediment ages, therefore no SAR, sediment ages, or
trace contaminant fluxes could be estimated in our dam cores.
Figure 4. Dry bulk density (DBD, g cm-3
) and excess 210
Pb (210
Pbex) activity (Bq kg-1
) plotted
against depth from dam sediment cores of Sites 1, 2, and 3. Profiles of 210
Pbxs indicate
mixing, therefore sedimentation rates were not calculated for the dam cores.
3.2.2 Trace metal contents and EF
Mean arsenic (As) contents were 7.7 ± 0.5 (standard error), 19.2 ± 2.2, and 9.5 ± 1.4 mg kg-1
for dam cores from Site 1, 2, and 3, respectively (Table 3). In the Site 2 core, As contents
increase rapidly from 6.5 cm to 3.5 cm depth, then decrease again rapidly to the surface
(Figure 5), however all contents from 0 to 5.5 cm depth exceeded the ANZECC SQG low
range value of 20 mg kg-1
. In Site 3 core, As contents were elevated between 7.5 and 5.5 cm
depths and from 1.5 cm to the surface. The profile of As distribution resembled Fe
distribution (Figure 5). EFs at Site 1 reflect natural variation (Zhang and Liu 2002). EF at Site
2 were elevated (EF > 2) between 5.5 and 3.5 cm depths (Figure 6). EF at Site 3 indicated
enrichment between 7.5 and 4.5 cm (max EF = 3.6).

Soil and dam sediment chemistry report Southern Cross University 21
Mean cadmium (Cd) contents were 16.4 ± 0.5, 152.9 ± 17.3, and 11.6 ± 5.6 µg kg-1
for dam
cores from Site 1, 2, and 3, respectively. At Site 2, Cd contents were elevated from 2.5 to 5.5
cm depth. This correlated with severe enrichments of Cd (EF: 6-12 at these depths. At Site 3,
Cd increased from 4.5 cm to the surface, corresponding with moderate enrichment at the top
(EF = 5 at surface). No Cd contents exceeded the ANZECC SQG.
Mean selenium (Se) contents were 1.3 ± 0.1, 0.8 ± 0.04, and 0.5 ± 0.1 mg kg-1
for dam cores
from Site 1, 2, and 3, respectively. Due to the low Se contents in the bottom interval at Site 3,
there was severe Se enrichment throughout this core. Enrichment factors in the Site 3 core
decreased towards the top, however remained severely enriched (EF between 20-80). Despite
the severe enrichments at Site 3, no Se contents in the dam cores exceeded the Se SQG from
Van Derveer and Canton (1997).
Mean zinc (Zn) contents were 19.2 ± 0.4, 74.1 ± 3.2, and 41.4 ± 1.9 mg kg-1
for dam cores
from Site 1, 2, and 3, respectively. Zn contents spiked between 6 and 9 cm depths in all three
cores. Sites 2 and 3 had slight increases in Zn contents at the surface. There was no Zn
enrichment and no Zn contents in the dam cores exceeded the ANZECC SQG.
Mean mercury (Hg) contents were 99.5 ± 5.7, 216.4 ± 45.8, and 141.0 ± 20.9 µg kg-1
for dam
cores from Site 1, 2, and 3, respectively. Thirteen total samples exceeded the ANZECC SQG
low value (150 µg kg-1
). Three samples from Site 1 (0.5, 5.5, and 11.5 cm depths), six from
Site 2 (6.5 cm and the 12.5 cm to the bottom of the core), and four from Site 3 (1.5-2.5 and
8.5-9.5 cm). The highest Hg contents were found at the bottom intervals of the Site 2 core.
Hg contents at the bottom of Site 3 core also exceeded ANZECC SQG low values.
Mean cobalt (Co) contents were 1.5 ± 0.04, 13.5 ± 0.3, and 1.2 ± 0.2 mg kg-1
for dam cores
from Site 1, 2, and 3, respectively. Co contents were generally very steady at Site 1 and 3.
Site 2 Co decreased towards the top of the core. There were no enrichments of Co. No Co
SQG could be obtained from the literature.
Mean manganese (Mn) contents were 44.9 ± 2.9, 664.5 ± 38.9, and 54.2 ± 32.2 mg kg-1
for
dam cores from Site 1, 2, and 3, respectively. At all depths, Mn contents were an order of
magnitude greater at Site 2. Mn contents at Site 2 spiked at 10.5 cm depth. Mn contents at
Site 3 spiked from 17 mg kg-1
3.5 cm depth to 340 mg kg-1
at the top. The rise in contents at
the top of the Site 3 core correlated with severe enrichment of Mn (EF ~ 9).
Mean iron (Fe) contents were 3.0 ± 0.2, 2.3 ± 0.1, and 2.0 ± 0.2 % for dam cores from Site 1,
2, and 3, respectively. At 8.5 cm depth in the Site 1 core a spike in Fe contents occurred
along with Pb, Zn, and, to a lesser extent, Ni and As. At 15.5 cm depth in the Site 2 core
contents of Fe, Pb, Cr, Ni and to a lesser extent Cu spiked together. At 6.5 cm depth in the
Site 3 core, contents of Fe, As, Pb, Cu, Ni, Se, and Zn spiked together. As Fe is very
abundant in the lithosphere EFs for Fe were not considered.
Mean aluminium (Al) contents were 1.7 ± 0.03, 2.2 ± 0.1, and 0.6 ± 0.1 % for dam cores
from Site 1, 2, and 3, respectively. At Site 1, Al contents gradually decreased with depth,
whereas, at Site 2, Al contents gradually increased with decreasing depth. At Site 3, Al
contents increased from 0.4 % at 3.5 cm to 1.5 % at the surface.
Mean phosphorus (P) contents were 52.9 ± 8.6, 708.4 ± 73.6, and 378.2 ± 199.0 mg kg-1
for
dam cores from Site 1, 2, and 3, respectively. At Site 1, P contents increased ~ 5 fold from
Soil and dam sediment chemistry report Southern Cross University 22
2.5 cm to the surface (~ 50 to 250 mg kg-1
). While no P contents at Site 1 exceeded the SQG
from Persaud et al. (1993), EF in the top two intervals of the Site 1 core indicated moderate to
severe P enrichment (EF ~ 4-10). At Site 2, P contents spiked to over 1000 mg kg-1
(exceeding the SQG low from Persaud et al. 1993) from 6.5 to 3.5 cm depths. EFs at these
depths indicated moderate enrichment of P (EF ~ 4). P contents in the surface interval at Site
3 (2161 mg kg-1
) exceeded the SQG high value (2000 mg kg-1
). Due to the relatively high Al
contents in these same sediments (1.54 %), there was only moderate enrichment of P (EF ~
4).
Mean lead (Pb) contents were 13.7 ± 0.6, 19.0 ± 0.8, and 17.2 ± 1.9 for dam cores from Site
1, 2, and 3, respectively. Mean chromium (Cr) contents were 11.4 ± 0.4, 11.8 ± 0.3, and 4.2 ±
0.7 mg kg-1
for dam cores from Site 1, 2, and 3, respectively. Mean copper (Cu) contents
were 4.0 ± 0.1, 26.9 ± 1.1, and 15.8 ± 2.6 mg kg-1
for dam cores from Site 1, 2, and 3,
respectively. Mean nickel (Ni) contents were 2.7 ± 0.1, 9.6 ± 0.3, and 4.4 ± 0.3 mg kg-1
for
dam cores from Site 1, 2, and 3, respectively. The EFs of Pb, Cr, Cu, and Ni reflect natural
variation (Zhang and Liu 2002). No contents of Pb, Cr, Cu, or Ni exceeded the ANZECC
SQG.

Soil and dam sediment chemistry report Southern Cross University 23
Figure 5. Contents of trace metals with depth from dam sediment cores at Site 1 (black), Site 2 (white), and Site 3 (red).

Soil and dam sediment chemistry report Southern Cross University 24
Figure 6. Enrichment factors (EF) depth profiles of trace metals which were moderately to
severely enriched in dam cores from each site. EF > 1 signifies anthropogenic portion of that
element. Note the different scale of enrichment for each site. *Note large increase in scale for
Se at Site 3.

Soil and dam sediment chemistry report Southern Cross University 25
Table 3. Trace metal soil quality guidelines (SQG) and contents from dam sediment cores. Highlighted cells are above SQG values (> SQG low = highlight
only; > SQG high = highlight + bold).
As Pb Cd Cr Cu Ni Se Zn Hg Co Mn Fe Al P
Core Depth mg kg-1
mg kg-1
µg kg-1
mg kg-1
mg kg-1
mg kg-1
mg kg-1
mg kg-1
µg kg-1
mg kg-1
mg kg-1
% % mg kg-1
Site 1 0.5 9.4 13.2 16 10.6 5.7 2.4 0.9 18.4 171 1.6 102 2.7 1.4 287
1.5 5.6 10.5 21 9.2 4.5 2.5 1.1 17.3 120 1.5 67 2.0 1.5 110
2.5 5.3 11.0 22 9.2 3.4 2.4 1.0 16.7 86 1.5 49 2.3 1.5 46
3.5 6.0 12.1 19 10.5 3.6 2.7 1.0 19.4 112 1.3 44 2.7 1.7 40
4.5 5.0 10.7 19 9.0 3.4 2.4 0.9 17.4 94 1.3 40 2.4 1.5 42
5.5 13.8 16.0 20 17.4 3.6 2.4 1.7 17.6 165 1.6 83 3.8 1.6 63
6.5 6.2 11.0 12 9.9 3.7 2.7 1.0 18.4 111 1.4 38 2.7 1.6 35
7.5 5.6 10.5 14 9.4 3.4 2.5 1.0 16.8 116 1.3 36 2.3 1.5 27
8.5 14.3 27.9 15 16.2 4.6 3.4 1.7 26.0 112 2.1 75 6.3 1.9 93
9.5 5.7 10.8 16 9.1 3.6 2.2 1.2 16.5 101 1.3 33 2.3 1.5 24
10.5 7.6 15.1 16 11.1 3.9 2.6 1.3 19.7 121 1.5 37 3.1 1.7 36
11.5 6.7 11.8 18 10.9 4.3 2.7 1.1 19.9 157 1.4 35 2.8 1.8 28
12.5 7.3 12.9 11 10.6 3.5 2.3 1.5 18.4 116 1.3 32 3.0 1.6 33
13.5 5.2 12.5 15 9.9 3.7 2.6 1.2 17.6 116 1.4 31 2.1 1.6 32
14.5 5.8 13.4 15 10.9 4.1 2.7 1.3 19.7 126 1.5 35 2.3 1.7 39
15.5 5.7 11.7 13 9.8 3.8 2.6 1.3 18.7 69 1.3 31 2.5 1.7 33
16.5 6.4 12.3 16 11.0 4.0 3.2 1.3 19.2 73 1.5 34 2.7 1.6 39
17.5 9.1 14.2 15 12.2 3.8 2.7 1.3 19.3 52 1.6 41 3.3 1.6 55
18.5 11.4 18.9 17 12.1 3.5 2.8 1.5 18.4 101 1.7 51 3.6 1.5 75
19.5 6.2 12.7 18 10.5 3.9 2.8 1.6 19.1 111 1.5 34 2.7 1.7 34
20.5 6.7 10.7 18 9.9 3.5 2.2 1.0 18.1 63 1.4 34.8 2.8 1.5 28
21.5 13.2 15.5 17 14.5 3.7 3.0 1.4 20.2 39 1.7 47.6 4.1 1.7 74
22.5 7.2 11.6 13 11.0 3.4 2.4 1.5 18.4 74 1.4 36.5 3.0 1.6 37
23.5 6.9 12.4 15 10.5 3.6 2.6 1.4 18.3 80 1.4 35.0 2.9 1.6 33
24.5 8.9 15.5 21 12.9 4.3 3.4 1.6 22.3 84 2.1 48.9 3.5 1.8 62
25.5 11.0 15.2 18 13.2 4.3 2.7 1.4 20.2 91 1.7 48.5 3.5 1.7 53
26.5 6.7 13.5 18 11.8 4.4 2.9 1.3 20.3 69 1.7 41.9 3.1 1.8 37
27.5 8.1 15.7 15 13.6 4.8 3.0 1.9 21.9 59 1.6 42.1 3.5 1.8 40
28.5 8.3 15.5 12 12.6 4.7 3.0 1.4 21.7 121 1.8 44.7 3.7 1.9 37
29.5 6.1 14.0 17 11.2 4.4 2.8 1.4 18.3 98 1.6 38.8 2.6 1.7 27
30.5 7.7 14.9 19 12.6 5.2 3.2 1.5 21.0 78 1.6 40.4 2.8 2.0 42
Mean ± SE 7.7 ± 0.5 13.7 ± 0.6 16.4 ± 0.5 11.4 ± 0.4 4.0 ± 0.1 2.7 ± 0.1 1.3 ± 0.1 19.2 ± 0.4 99 ± 6 1.5 ± 0.04 44.9 ± 2.9 3.0 ± 0.2 1.7 ± 0.03 53 ± 9
Low 20 50 1500 80 65 21 2.5* 200 150 - - - - 600**
High 70 220 10000 370 270 52 4 410 1000 - - - - 2000**
n > Low 6 0 0 0 0 0 0 0 13 - - - - 4
Total n = 58 n > High 0 0 0 0 0 0 0 0 0 - - - - 1
* values from van Derveer and Canton 1997
** values from Persaud et al. 1993
ANZECC
SQG
Highlight = contents > SQG low
Bold + highlight = content > SQG high

Soil and dam sediment chemistry report Southern Cross University 26
Table 3 (cont). Trace metal soil quality guidelines (SQG) and contents from dam sediment cores. Highlighted cells are above SQG values (> SQG low = 1
highlight only; > SQG high = highlight + bold). 2
3
As Pb Cd Cr Cu Ni Se Zn Hg Co Mn Fe Al P
Core Depth mg kg-1
mg kg-1
µg kg-1
mg kg-1
mg kg-1
mg kg-1
mg kg-1
mg kg-1
µg kg-1
mg kg-1
mg kg-1
% % mg kg-1
Site 2 0.5 20.1 17.3 94 12.7 37.6 8.3 0.9 85.4 119 10.7 478.8 2.5 2.4 960
1.5 20.6 21.4 143 11.5 26.7 9.3 0.8 69.2 143 12.8 564.8 2.3 2.5 877
2.5 28.8 15.8 143 10.8 24.7 7.6 0.7 72.2 133 12.5 684.3 2.1 2.2 1002
3.5 43.8 17.1 280 12.4 27.2 8.6 0.9 74.5 106 13.5 811.6 2.3 2.4 1496
4.5 27.0 18.7 168 12.1 27.0 8.6 1.0 70.5 107 15.0 711.1 2.3 2.5 915
5.5 32.8 16.9 278 12.0 28.7 10.7 0.6 111.5 98 13.1 694.3 2.1 2.1 839
6.5 18.4 18.6 214 11.6 25.9 9.7 0.8 93.6 155 13.7 612.1 2.0 2.3 587
7.5 15.9 16.3 165 11.9 26.7 10.5 0.8 86.7 92 14.5 594.0 2.1 2.3 629
8.5 13.6 16.9 166 10.8 22.0 11.8 1.0 74.0 95 15.1 587.4 2.1 2.2 595
9.5 16.7 18.8 152 12.1 23.8 9.2 0.5 65.1 145 15.9 870.5 2.3 2.5 820
10.5 17.4 18.2 199 10.7 22.0 8.3 0.8 63.2 143 14.7 1136.7 2.1 2.3 814
11.5 14.3 16.8 168 10.7 21.6 9.0 1.0 69.7 140 12.9 682.7 1.9 2.2 533
12.5 14.3 17.0 185 10.8 22.2 8.8 0.6 65.9 185 13.3 693.6 2.0 2.1 542
13.5 11.8 18.9 112 11.2 25.5 9.6 1.0 64.1 286 12.8 576.9 2.1 2.1 440
14.5 11.2 20.6 80 11.5 27.5 9.8 0.6 60.8 391 11.7 516.4 2.3 1.9 341
15.5 10.5 29.4 31 14.3 34.5 12.2 0.7 69.4 595 14.3 574.4 3.0 1.9 348
16.5 9.9 24.9 21 13.9 33.1 11.4 0.6 64.9 747 13.1 506.9 2.8 1.8 303
Mean ± SE 19.2 ± 2.2 19.0 ± 0.9 153 ± 17 11.8 ± 0.3 26.9 ± 1.1 9.6 ± 0.3 0.8 ± 0.04 74.1 ± 3.2 216 ± 46 13.5 ± 0.3 665 ± 39 2.3 ± 0.1 2.2 ± 0.1 708 ± 74
Site 3 0.5 17.8 10.0 58 8.6 35.1 3.6 0.8 43.3 115 2.8 339.6 3.4 1.5 2161
1.5 8.9 11.1 19 6.6 8.7 4.2 0.4 35.0 267 1.6 62.2 1.8 1.1 237
2.5 7.3 12.9 16 5.7 10.2 4.3 0.4 39.4 195 1.4 45.3 1.8 0.9 162
3.5 7.3 13.1 4 3.4 9.3 4.1 0.4 39.2 96 0.8 16.9 1.4 0.4 116
4.5 7.6 16.6 0 3.6 13.8 4.3 0.6 42.7 79 0.8 17.9 1.8 0.4 148
5.5 11.5 24.7 2 4.1 21.7 5.5 0.7 48.8 103 1.0 19.1 2.5 0.4 224
6.5 15.5 29.2 6 3.3 22.3 6.2 0.8 53.4 54 1.0 14.3 2.9 0.4 293
7.5 10.1 20.3 8 2.2 13.8 4.6 0.4 40.6 124 0.8 9.8 1.7 0.4 203
8.5 5.3 17.2 0 2.0 10.8 3.5 0.6 35.8 196 0.7 8.1 1.3 0.4 126
9.5 3.7 16.6 3 2.4 12.6 3.5 0.0 35.4 180 0.7 9.4 0.9 0.4 112
Mean ± SE 9.5 ± 1.4 17.2 ± 1.9 11.6 ± 5.6 4.2 ± 0.7 15.8 ± 2.6 4.4 ± 0.3 0.5 ± 0.1 41.4 ± 1.9 141 ± 21 1.2 ± 0.2 54 ± 32 2.0 ± 0.2 0.6 ± 0.1 378 ± 199
Low 20 50 1500 80 65 21 2.5* 200 150 - - - - 600**
High 70 220 10000 370 270 52 4 410 1000 - - - - 2000**
n > Low 6 0 0 0 0 0 0 0 13 - - - - 4
Total n = 58 n > High 0 0 0 0 0 0 0 0 0 - - - - 1
* values from van Derveer and Canton 1997
** values from Persaud et al. 1993
ANZECC
SQG
Highlight = contents > SQG low
Bold + highlight = content > SQG high

Soil and dam sediment chemistry report Southern Cross University 27
4. Discussion
4.1 Pesticide residues in terrestrial cores
Our analyses detected 10 of 97 pesticide molecules tested for. Discussion will be focused
around the most abundant pesticides and most contaminated sites.
4.1.1 Spatial distribution of pesticides
Terrestrial cores from Site 3 had the highest degree contamination in our study (Table 1,
Figure 3). Fifty percent of pesticide residues (26 out of 52 total detected residues from our 21
core subsamples) were detected in terrestrial soil cores at Site 3 (in the mix shed or field
core). The highest contents of all contaminants were found in the Site 3 mix shed core (i.e.
propiconazole, cyprodinil, bifenthrin). There may be an increased need for pesticide
application at Site 3 relative to the other sites due to site specific pest issues. Site 1 was the
least contaminated, with 6 out of 52 detected residues (~ 12 %). Site 2 had 20 pesticide
residues detected (~ 38 %), however at this location we sampled an additional core
(containing 3 residues, ~ 6 %). The soil cores from other sites had trace amounts of pesticide
residues relative to Site 3 (Figure 3). Because pesticides do not occur naturally, their
detection signifies that soil composition has been altered by horticultural activities. However,
differences in degradation rates, toxicity, and mobility within the environment of each
pesticide (discussed further below), means the concerns over environmental impacts of these
pesticides is variable.
With respect to pesticides, the identification of chemical mixing sheds as potential hotspots
for contaminant accumulation proved feasible. Thirty three out of 52 residues were found in
mixing sheds (64 % of all detected residues). Four contaminants (bifenthrin, dimethoate,
methomyl, and prometryn) were found exclusively in the mixing sheds and not in growing or
drainage areas. The absence of these contaminants from our field cores does not clearly
signify their absence from crop production areas. A more widespread sample effort of
growing and other use areas may provide a better understanding of the extent of spatial
contamination in multiple land use farms in the Coffs Harbour region.
4.1.2 Fungicides
The conazole fungicide, propiconazole found in the soils of the Site 3 mix shed had the
highest soil content for any pesticide we detected (mean contents 58.2 ± 38.9 mg kg-1
). At
contents of 100 mg kg-1
propiconazole was found to reduce agricultural soil phosphatase
activity by 46 %, which was expected to cause decreased phosphate availability (Kalam et al.
2004). Propiconazole content in the surface interval of the Site 3 mix shed exceeded this
threshold (125 mg kg-1
), however the contents we observed in the crop production area (field
cores, 0.21-0.99 mg kg-1
) are below this concentration. If propiconazole contents in the
growing areas reach levels similar to in the Site 3 mix shed, exchange of nutrients between
the soils and plants may become altered. The propiconazole contents we observed in the Site
3 mix shed were higher than observations from corn and soybean field over 2 growing
seasons from the Midwestern United States, while our field cores had orders of magnitude
less or similar contents depending on timing of propiconazole application (Edwards et al.
2016).

Soil and dam sediment chemistry report Southern Cross University 28
Another fungicide, cyprodinil, was the most spatially widespread of all pesticides, found in
trace amounts in mix shed and field cores at all three sites. It is understandable that we would
not find cyprodinil in the Site 2 drainage ditch, as the area up the hill that this drains has been
discontinued as the chemical storage/mixing area since 1980 (personal communication with
landowner) and cyprodinil is considered a relatively new fungicide (Komárek et al. 2010).
Cyprondinil was found at higher contents in Site 1 and 2 field cores than Site 1 and 2 mix
shed cores (Table 1), perhaps indicating a separate mixing area for these chemicals at these
sites, or alternatively increased accumulation in growing areas due to repeated applications
here. The relatively high contents of cyprodinil at the Site 3 mix shed imply increased use of
this fungicide at this farm. Bermúdez-Couso et al. (2007) reported surface sediment
concentrations of cyprodinil at 0.462 mg kg-1
in a Spanish vineyard, orders of magnitude
lower than the mean concentration found in the Site 3 mix shed core (8.5 mg kg-1
), but
elevated compared to the Site 3 field core mean concentration (0.36 mg kg-1
) and other
surface interval concentrations (see Table 1). Cyprodinil contents may decrease over time,
however toxicity of the breakdown products can be greater than the parent product (Nicol et
al. 2016). The widespread spatial distribution of cyprodinil across our cores, and potentially
more toxic breakdown products make cyprodinil a contaminant to monitor further.
Two other fungicides, pyrimethanil and carbendazim, were found in low contents (0.006 to
0.044 mg kg-1
) at all three sites. These fungicides degrade into their by-products within 4
weeks (Baude et al. 1974, Agüera et al. 2000). Carbendazim detection may have resulted
from carbendazim applied directly to blueberries or from degradation of benomyl (Baude et
al. 1974), a fungicide previously used in banana cultivation, which has been discontinued
since 2006 (APVMA 2014). Pyrimethanil degradation products have low toxicity (Sirtori et
al. 2012). Sampling for degradation products of pyrimethanil and carbendazim will reveal
more information on the environmental fate of these fungicides after application.
Propiconazole, cyprodinil, and carbendazim bind to soil organic and clay particles and are
generally immobile in soil (Thorstensen et al. 2001, Komárek et al. 2010, Ahmad 2018),
while pyrimethanil may leech into subsurface water under typical field conditions (Komárek
et al. 2010). The erosion of soil from areas with high fungicide contents could deliver
fungicides into nearby waterways. Erosion of soils from the Site 3 mix shed is of particular
concern due to the high concentrations of fungicides here and the lack of connectivity into the
dam at Site 3 (Figure 2). Soils eroded from the Site 3 mix shed are probably transported into
the natural waterway Bucca Bucca creek.
4.1.3 Herbicides
Diuron is a water soluble aryl urea herbicide commonly applied in Australia, with regulations
regarding with specific timing and concentrations of application (APVMA 2012). However,
according to the Australian Pesticides and Veterinary Medicines Authority (APVMA) there is
no approval for use of diuron on blueberries. In an effort to mitigate aquatic ecosystem harm
from diuron runoff use, the APVMA regulated diuron use to a general use concentration of
450 g of active constituent ha-1
(APVMA 2012, Holmes 2014). While no official data on
diuron application rates for our study area could be obtained, literature comparisons may be
useful.
Our soil diuron contents were less than in other studies. Soil diuron contents in grass seed
production areas in the northwestern United States were 0.38 mg kg-1
, estimated to be 46 %

Soil and dam sediment chemistry report Southern Cross University 29
of the applied diuron (Field et al. 2003). A study of Queensland sugarcane soils found that
267 days after diuron application, diuron surface soil (0-15 cm depth) content was 0.009 mg
kg-1
(Stork et al. 2008). These diuron contents were slightly lower or within the same range as
our surface soil (0-15 cm) contents (0.010-0.020 mg kg-1
) from Site 2 mix shed and drainage
ditch cores, possibly indicating the application of diuron at Site 2 over the last year. Stork et
al. (2008) estimated their observed diuron contents to be equivalent to 22 g of diuron applied
ha-1
year-1
based upon assumptions of time since application, soil density, and depth. This
application rate estimate falls well below the 2012 AVPMA diuron general use guideline of
450 g ha-1
, possibly signifying diuron application rates at Site 2 could be similar, although
this is merely speculation based upon large assumptions. Our relatively low soil diuron
concentrations and its water solubility may indicate that diuron is a contaminant that could
leach to waterways (Yang et al. 2006, Stork et al. 2008, Liu et al. 2010), however more
monitoring during diuron application is needed.
Another herbicide, prometryn, was detected in the surface interval of the Site 3 mix shed core
at contents of 0.004 mg kg-1
. Prometryn is less soluble in water than diuron, but
photodegrades rapidly in the aqueous phase, especially with UV light (Jiang et al. 2017).
Prometryn is typically applied wet, therefore prometryn leaching/soil retention may be a low
risk due to degradation by sunlight. As we only detected one residue of prometryn just above
our limit of detection, prometryn is likely not a widespread contaminant in our blueberry
horticultural setting.
4.1.4 Organophosphates
The organophosphate ethoprophos was found in relatively small contents at the mixing sheds
of Sites 1 and 2 and the drainage ditch of Site 2 (0.004 to 0.017 mg kg-1
). Ethoprophos in the
Site 2 drainage ditch core may be from previous land use, as ethoprophos is a common
pesticide used in banana cultivation (Collins et al. 1991). Low ethoprophos contents may not
simply signify low ethoprophos application rate. Repeated applications of ethoprophos can
promote increased rate of biodegradation by soil microbes, albeit with a reduction of the
desired pest control effect (Smelt et al. 1987). Populations of some target pest species in this
region of NSW are resistant to ethoprophos treatments (Collins et al. 1991). This combination
of factors (increased biodegradation after repeated exposure, lowering of pest control effect,
and resistant target species) may lead to more frequent, less efficient applications of
ethoprophos.
Possibly due to more rapid biodegradation occurring after repeated exposures, our
ethoprophos contents are low when compared to the literature. Smelt et al. (1987) found
mean contents of 1.22 mg kg-1
in the top 25 cm of Dutch potato fields. Our mean contents
between Sites 1 and 2 was 0.0085 mg kg-1
from our 30 cm sediment cores. Studies report
ethoprophos residues disappeared completely below 25 cm depth after 474 days (Boesten and
Gottesbüren 2000, Boesten and van der Pas 2000). Assuming similar degradation rates, Sites
1 and 2 may have undergone ethoprophos treatment within this timespan. While ethoprophos
contents from our cores were overall low, data on the application and degradation rate of
ethoprophos will aid in better understanding the dynamics of optimal ethoprophos use and
efficient management practice.
Another organophosphate, dimethoate, was present in the Site 3 mix shed core at all three
depths. Dimethoate has low soil persistence and is water soluble, with risk for runoff into
Soil and dam sediment chemistry report Southern Cross University 30
surface and groundwaters (Van Scoy et al. 2016), which may explain the low soil contents we
found. Degradation rates of dimethoate in soil vary within the literature, from between 4 days
to over two years, depending on soil organic material content (Bohn 1964, El Beit et al. 1981,
Martikainen 1996). Sampling of surface and groundwaters, especially shortly after
dimethoate application and flood events, could be useful in determining the fate of
dimethoate in the environment.
Our soil contents of dimethoate are low compared to toxicity guidelines. Martikainen (1996)
reports concentrations above 9 mg kg-1
cause mortality in soil invertebrates, while 3 mg kg-1
was sufficient to reduce soil invertebrate biomass. Rates safe for human consumption range
between 2 to 18 mg kg-1
daily (Sanderson and Edson 1964). Soil dimethoate was only found
in the mix shed of Site 3, meaning it may not persist for long periods in the growing areas.
More data on the transport of dimethoate between soils, surface and groundwaters, and biota
will be useful in resolving if dimethoate is a contaminant of concern in blueberry horticulture
from this region.
4.1.5 Other pesticides
Site 3 mix shed was the only core where we detected the pyrethroid insecticide bifenthrin.
Due to its low water solubility and affinity to bind to organic matter bifenthren is believed to
be immobile in the soil and have low groundwater leaching potential, however for these same
reasons bifenthrin residues can be very long lasting in the soil (Kamble and Saran 2005).
While bifenthrin was highest in the surface sediments of the Site 3 mix shed, we detected
residues, albeit decreasing, in the lower sediment intervals of the Site 3 mix shed core. Our
detected soil contents of bifenthrin are lower than other studies reporting field soil
concentrations. Soils from potato fields of western Canada had mean soil bifenthrin contents
of 872.25 + 62.98 mg kg-1
329 days after application, equivalent to 35 % of the field
application rate of 349 g active ingredient ha-1
(van Herk et al. 2013). While no data
pertaining to the application rate of bifenthrin was obtained, our soil bifenthrin contents were
11.4 mg kg-1
in surface sediments of the Site 3 mix shed, orders of magnitude lower than
reported by van Herk et al. (2013).
Contents of the carbamate insecticide methomyl were greatest in the bottom (15-30 cm) layer
of the Site 3 mix shed core. This result may be demonstrative of methomyl’s high water
solubility and low soil retention affinity (Van Scoy et al. 2013). Evidence of the high
methomyl contents in the bottom of our core may indicate risk of transfer to groundwater,
however other processes in the soil may be reducing methomyl contents.
Disapperance of methomyl from field soils is typically < 1 month and occurs via microbial
degradation (Harvey Jr and Pease 1973, Van Scoy et al. 2013). Reported methomyl soil
contents from same day applications were 1.272 ± 0.1 in soils of tomato plants (Malhat et al.
2015) and 0.025-0.035 mg kg-1
in sandy loam soils (Bisht et al. 2015). Methomyl disappeared
within 15 days after application for both of these studies. Our soil concentrations of
methomyl are within this range (mean contents 0.058 mg kg-1
). Our results suggest recent
environmental exposure to methomyl at the Site 3 mix shed. More sampling is needed to
investigate the degradation rates and leaching potential of methomyl in our blueberry
horticultural setting.

Soil and dam sediment chemistry report Southern Cross University 31
4.2 Trace metals and P
Phosphorus (P) and arsenic (As) were the elements that most frequently exceeded our SQG in
our terrestrial and dam cores (15 subsamples were over the SQG low values, 2 subsamples
for P and 1 for As over SQG high values). All of the SQG exceedances for As occurred at
Site 2. All cores from Site 2 (mix shed, field, drainage ditch, and dam) had subsamples which
exceeded the As SQG. The widespread presence of high As contents at Site 2 is likely due to
the use of As pesticides during previous land use. The use of As pesticides in northern NSW
is well documented (Smith et al. 1998, Smith et al. 2003). Indeed, the highest As contents
were found in the steeply sloping drainage ditch, which served drained the chemical mixing
shed used during times of banana cultivation (until 1980). Our results demonstrate the
persistence of As in the terrestrial environment from previous land use, even over 15 years
after a change in horticultural regime at Site 2.
P contents exceeded the SQG at various locations within each site. The presence of P over the
SQG guidelines is probably due to the use of P fertilizers. Mix sheds cores from Site 1 and 3
had mean P contents above the SQG low value, probably due to the increased environmental
exposure of fertilizers here. Dam cores at Site 2 and 3 had subsamples which exceeded the
SQG. Increased accumulation in these sediments is likely due to deposition of eroded soils
rich in P from the surrounding fertilized terrestrial environment. The surface interval of the
Site 3 dam core exceeded the SQG high range value, and was the only subsample from this
core to exceed any P SQG, and P contents are 9 fold higher than the sediment interval below.
While our sediment dating failed to yield an acceptable geochronology in this core, the high P
contents in the top sediment layer indicate rapid P accumulation after blueberry cultivation
began.
When soils are rich in As and P, dams may prove to be an efficient sink for these
contaminants. Dam cores from all three sites displayed various degrees of enrichment with
As and P (Figure 6), demonstrating the sediments from retaining ponds proficiency to
accumulate these elements. Mean contents and EF for As in the three dam cores were 11.30
mg kg-1
and 1.56, respectively, greater than content and enrichment in three sediment cores
from the receiving estuary downstream of Sites 1 and 2 (mean content = 6.74 mg kg-1
, mean
EF = 0.94 , Conrad et al. 2019). The closer proximity of dams to the source of terrestrial As
(especially at Site 2) is likely to mean they are receiving more As-rich eroded soils. Despite
the lower As contents, the site with no previous banana history (Site 3) had the greatest As
enrichment for any of our dam cores (max EF of 2.3, 3.4, and 3.6 for Sites 1, 2, and 3,
respectively). The enrichment of As occurred towards the bottom of the Site 3 dam core
(Figure 6). Enrichments in the bottom layers of this core could be due to natural processes
(i.e. the migration of As along the sediment column under anoxic conditions, Burton et al.
2008).
Mercury (Hg) had 14 subsamples which exceeded the SQG low value. Hg contents just
exceeded SQG in the growing area of Site 3 (150.2 µg kg-1
), however other literature reports
Hg soil contents of 50-350 µg kg-1
are within a natural range (Rundgren et al. 1992, Grigal
2003). Investigating baseline contents of Hg in soils from this area would aid in determining
if any of the terrestrial soils in our farms are contaminated with Hg. The dam cores had 13 of
14 of the subsamples which exceeded the SQG low range value and overall mean Hg content
of the dam cores (141 µg kg-1
) was greater than terrestrial cores (78 µg kg-1
). The Hg in dam
Soil and dam sediment chemistry report Southern Cross University 32
bottom sediments is likely received during episodic rain events which mobilises organic
material bound Hg stored in soils (Shanley and Bishop 2012). Enrichment of sediment with
Hg was only observed at Site 1 (Figure 6), however the increased contents of Hg in dam
sediments compared to terrestrial soils may signify the role of these retention reservoirs as a
sink for Hg from terrestrial runoff. Analysis of sediments downstream of Sites 1 and 2
revealed lower content and no enrichments of Hg (Conrad et al. 2019), suggesting sediments
of waterways nearer to the farm can be efficient sinks of terrestrially sourced Hg.
The profile of Hg contents from dam cores of Site 2 and 3 indicate relatively high Hg in
bottom sediments (Figure 5), especially at Site 2. Hg is relatively immobile in sediments and
profiles of Hg in sediments typically follow patterns of deposition (Lockhart et al. 2000,
Rydberg et al. 2008). While sediment dating failed to yield an acceptable geochronology at
Site 2, the Hg profile suggests decreasing Hg deposition in the more recent sediments
(Outridge and Wang 2015). Despite high Hg contents in the deeper sediments, bioactive
methyl-Hg production in the anoxic layer may be low due to loss via diagenetic processes
(Rydberg et al. 2008).
Several other localised contaminations were observed. Contamination of zinc (Zn) was
localised to the Site 2 mix shed core, however Zn contents here exceeded the SQG high value
in surface sediments. Zn over the SQG low was present in all depths along the core (Table 2).
High Zn here could be from fertiliser, as Zn is present in trace amounts in certain fertilisers
(Nziguheba and Smolders 2008). The surface sediment of the Site 3 mix shed contained
copper (Cu) higher than the SQG low value. Elevated Cu in surface sediments may be from
Cu-containing fungicides used on blueberry farms (Simpson 2019). Sediments in the surface
of the Site 3 mix shed core had high contents of other fungicides (propiconazole and
cyprodinil, Table 1). The bottom interval of the Site 2 drainage ditch core contained selenium
(Se) greater than the SQG value of Van Derveer and Canton (1997). Elevated Se contents at
this location could be caused by the accumulation of salts after evaporation of irrigation
waters introduced during times of banana cultivation (Lemly 2004).
5. Conclusions
1. Site 3, especially in the chemical mixing shed, was the site most contaminated with
pesticides, in particular the fungicides propiconazole and cyprodinil. Soil contents of these
fungicides should decrease as they degrade via natural processes, however breakdown
products may have increased toxicity in the soil environment.
2. Arsenic contents over the ANZECC SQG low values were observed in the mix shed,
field, drainage ditch, and dam cores at Site 2. Arsenic contamination at this location is
suspected to be from pesticide application during previous land use for banana cultivation.
3. Contents of mercury (Hg) from dam sediment cores at all three sites exceeded ANZECC
SQG low values. Dam sediments contained high amounts of Hg relative to terrestrial soils.
We attribute this result to the mobility of Hg in the agricultural soils and the retention of Hg
in aquatic sediments with low oxygen.
4. Localised contamination with zinc (Zn), phosphorus (P), and copper (Cu) occurred in mix
sheds from different sites. These contaminants are likely sourced from agricultural treatment
products which are frequently exposed to the environment at mix shed locations.

Soil and dam sediment chemistry report Southern Cross University 33
These results build upon our previous work from areas downstream of Sites 1 and 2 and
demonstrate that waterways on the farm may be useful in retaining certain nutrients and trace
metals from intensive horticulture. This work also proved to be a useful preliminary
assessment in identifying pesticides contamination from blueberry horticultural practices in
the Coffs Harbour LGA.
In order to identify contaminants of particular concern, a multiple lines of evidence approach
was used. Our evaluation of pesticide and trace metal contamination concern was based on
their environmental and aquatic toxicity, magnitude of soil/sediment contents, spatial
distribution, and persistence and mobility within the environment to generate a rating of
overall concern (Table 4). We qualified toxicity based on environmental effects, as soil and
sediments were the environmental mediums considered in this report, not exposure directly or
through food. Pesticide environmental toxicities were rated referencing the Globally
Harmonized System (GHS) of classification and labelling of chemicals. The GHS is an
international chemical hazard classification system developed by the United Nations to
identify environmental human and health risks associated with commercially available
chemicals (SWA 2019b).
We identified the herbicide diuron, trace metals cadmium and mercury, and the nutrient
phosphorus (P) as contaminants of high concern based upon their relatively high contents,
extensive distributions amongst our study sites, potential for negative effects on biota, long
environmental residence times, and mobility in the terrestrial/aquatic environment.
Uncertainties and conflicts in the literature did not allow us to confidently qualify overall
concern for all contaminants. The literature reports variable degradation rates and
solubility/desorption behaviours for cyprodinil, dimethoate, and propiconazole (see appendix
for literature). Due to their inherent toxicity, we believe that the detection of any pesticide
makes it a potential risk. More data pertaining to the breakdown and transport of the
pesticides we detected is necessary in order to confidently qualify these contaminants in our
risk assessment framework. Therefore the overall concern for all of the pesticides we detected
has been qualified as potential (Table 4).
The classes of pesticides we did not detect have been classified as uncertain, as their absence
from our samples does not signify their absence from other horticultural landscapes in the
Coffs Harbour LGA.
Contamination of arsenic (As) was localised to Site 2. We qualified the overall concern for
As as potential. We recommend other locations with banana cultivation history should be
assessed for As contamination.
Contamination of zinc (Zn) was localised. Zn accumulation is common in horticultural
landscapes, and contamination of Zn has occurred in sediments downstream of Sites 1and 2.
It is possible our spatially restricted sampling may not have identified full extent of Zn
contamination. The trace metal manganese (Mn) may be an important carrier for other trace
metals and harmful to biota above certain amounts, although no ANZECC SQG exists for
this element (see appendix for cited literature). These uncertainties did not allow for us to
qualify overall concern for Zn and Mn with confidence.
Although here we have made a preliminary qualification of contaminants of concern, we
would like to acknowledge that our sampling regime was restricted spatially. In order to have

Soil and dam sediment chemistry report Southern Cross University 34
more confidence in broadly identifying horticultural contaminants of concern from Coffs
Harbour horticultural industries, we recommend further studies should more intensely sample
soils on farms, especially in growing areas.
Table 4. Summary of environmental and aquatic toxicity, detections, magnitude of
concentration (either ANZECC SQG or enrichment factors), spatial distribution amongst our
study sites, and persistence and mobility within the environment for pesticides and trace
metals investigated in this study. Contaminants evaluated with literature, online databases,
data from this report, and our judgement to generate a rating of overall concern. Red, yellow,
and green text indicate high, moderate, and low risk, respectively. Overall risk of some
contaminants remains uncertain due to conflicting reports from the literature and lack of
more specific geochemical data. Literature cited in appendix.
Pesticides Toxicity Detection
Spatial
distribution Persistence Mobility
Overall
concern
Bifenthrin High Detected Confined High Low Potential
Carbendazim High Detected Extensive Variable Low Potential
Cypronodil High Detected Extensive Low Moderate Potential
Dimethoate High Detected Confined Variable High Potential
Diuron High Detected Moderate High High High
Ethoprophos High Detected Moderate High Moderate Potential
Methomyl High Detected Confined Low Moderate Potential
Prometryn High Detected Confined Low Moderate Potential
Propiconazole High Detected Moderate Variable Low Potential
Pyrimethanil Moderate Detected Confined Low High Potential
Organochlorines High Undetected N/A High Low Uncertain
Traiazine Herbicides High Undetected N/A Moderate Low Uncertain
Triazinone Herbicides High Undetected N/A Moderate Low Uncertain
Trace Metals Toxicity
Exceeded
SQG or
displayed
enrichment
Spatial
distribution Persistence Mobility
Overall
concern
Arsenic High Yes Moderate High Moderate Potential
Lead High No Confined High Moderate Low
Cadmium High Yes Moderate High High High
Chromium Moderate No Confined High Moderate Low
Copper Moderate Yes Confined High Moderate Low
Nickel Moderate No Confined High Moderate Low
Selenium Moderate Yes Confined High Moderate Low
Zinc Moderate Yes Confined High Moderate Uncertain
Mercury High Yes Extensive High High High
Cobalt Moderate No Confined High Moderate Low
Manganese Moderate No Confined High High Uncertain
Iron Low No Confined High High Low
Aluminium Low No Confined High Moderate Low
Phosphorus Moderate Yes Extensive High Moderate High

Soil and dam sediment chemistry report Southern Cross University 35
6. References
Agüera, A., E. Almansa, A. Tejedor, A. R. Fernández-Alba, S. Malato, and M. I. Maldonado. 2000. Photocatalytic Pilot Scale Degradation Study of Pyrimethanil and of Its Main Degradation Products in Waters by Means of Solid-Phase Extraction Followed by Gas and Liquid Chromatography with Mass Spectrometry Detection. Environmental Science & Technology 34:1563-1571.
Ahmad, K. S. 2018. Sorption-Desorption Characteristics of Benzimidazole Based Fungicide Benomyl on Physicochemical Properties of Selected Pakistani Soils and their Minerals. Biological Sciences-PJSIR 61:59-67.
Appleby, P., and F. Oldfield. 1992. Applications of lead-210 to sedimentation studies. Uranium-series disequilibrium: applications to earth, marine, and environmental sciences. 2. ed.
APVMA. 2012. Diuron Final Review Report. Pages 1-112 in A. P. a. V. M. Authority, editor., Canberra, ACT, Australia.
APVMA. 2014. Benomyl Chemical Review. Page 1 Listing of Chemical Reviews. Australian Pesticides and Veterinary Medicines Authority, APVMA Website.
Austin, D. J., and G. G. Briggs. 1976. A new extraction method for benomyl residues in soil and its application in movement and persistence studies. Pesticide Science 7:201-210.
Baude, F. J., H. L. Pease, and R. F. Holt. 1974. Fate of benomyl on field soil and turf. Journal of Agricultural and Food Chemistry 22:413-418.
Bennett, E. M., S. R. Carpenter, and N. F. Caraco. 2001. Human Impact on Erodable Phosphorus and Eutrophication: A Global Perspective: Increasing accumulation of phosphorus in soil threatens rivers, lakes, and coastal oceans with eutrophication. AIBS Bulletin 51:227-234.
Bermúdez-Couso, A., M. Arias-Estévez, J. Nóvoa-Muñoz, E. López-Periago, B. Soto-González, and J. Simal-Gándara. 2007. Seasonal distributions of fungicides in soils and sediments of a small river basin partially devoted to vineyards. Water research 41:4515-4525.
Bisht, S., R. Chauhan, B. Kumari, and R. Singh. 2015. Fate of thiodicarb and its metabolite methomyl in sandy loam soil under laboratory conditions. Environmental monitoring and assessment 187:429.
Boesten, J. J. T. I., and B. Gottesbüren. 2000. Testing PESTLA using two modellers for bentazone and ethoprophos in a sandy soil. Agricultural Water Management 44:283-305.
Boesten, J. J. T. I., and L. J. T. van der Pas. 2000. Movement of water, bromide and the pesticides ethoprophos and bentazone in a sandy soil: the Vredepeel data set. Agricultural Water Management 44:21-42.
Bohn, W. 1964. The disappearance of dimethoate from soil. Journal of Economic Entomology 57:798-799.
Brodie, J. E., and A. W. Mitchell. 2005. Nutrients in Australian tropical rivers: changes with agricultural development and implications for receiving environments. Marine and Freshwater Research 56:279-302.
Browne, B. 2016. Storing pesticides safely on farm. Pages 1-4 in D. o. P. Industries, editor. NSW DPI, NSW, Australia.
Budd, L. 1995. Toxic playground: reducing the toxic chemica load on schools and childcare centres. Pages 4-7 in Children's Health and Chemicals, Total Environment Center Sydney, NSW, Australia.
Burton, E. D., R. T. Bush, L. A. Sullivan, S. G. Johnston, and R. K. Hocking. 2008. Mobility of arsenic and selected metals during re-flooding of iron-and organic-rich acid-sulfate soil. Chemical Geology 253:64-73.
Carpenter, S. R. 2005. Eutrophication of aquatic ecosystems: bistability and soil phosphorus. Proceedings of the National Academy of Sciences 102:10002-10005.

Soil and dam sediment chemistry report Southern Cross University 36
Collins, P. J., N. L. Treverrow, and T. M. Lambkin. 1991. Organophosphorus insecticide resistance and its management in the banana weevil borer, Cosmopolites sordidus (Germar) (Coleoptera: Curculionidae), in Australia. Crop Protection 10:215-221.
Company, C. C. 2018. Safety Data Sheet: Cyprodinil. Cayman Chemical Company, Ann Arbor, Michigan, United States.
Conrad, S. R., I. R. Santos, D. R. Brown, L. M. Sanders, M. L. van Santen, and C. J. Sanders. 2017. Mangrove sediments reveal records of development during the previous century (Coffs Creek estuary, Australia). Marine pollution bulletin 122:441-445.
Conrad, S. R., I. R. Santos, S. White, and C. J. Sanders. 2019. Nutrient and Trace Metal Fluxes into Estuarine Sediments Linked to Historical and Expanding Agricultural Activity (Hearnes Lake, Australia). Estuaries and Coasts:1-14.
Cox, L., M. C. Hermosín, and J. Cornejo. 1992. Distribution coefficient of methomyl in soils from different depths.
Edwards, P. G., T. M. Murphy, and M. J. Lydy. 2016. Fate and transport of agriculturally applied fungicidal compounds, azoxystrobin and propiconazole. Chemosphere 146:450-457.
El Beit, I. O. D., J. Verner Wheelock, and D. E. Cotton. 1981. Factors affecting soil residues of dieldrin, endosulfan, γ-HCH, dimethoate, and pyrolan. Ecotoxicology and Environmental Safety 5:135-160.
EPA, N. 1997. Guidelines for Assessing Banana Plantation Sites.in E. P. Authoritiy, editor. NSW Environmental Protection Authority, Sydney, NSW.
Fang, W., X. JIANG, Y.-r. BIAN, F.-x. YAO, H.-j. GAO, G.-f. YU, J. C. Munch, and R. Schroll. 2007. Organochlorine pesticides in soils under different land usage in the Taihu Lake region, China. Journal of Environmental Sciences 19:584-590.
Farooq, S. H., D. Chandrasekharam, Z. Berner, S. Norra, and D. Stüben. 2010. Influence of traditional agricultural practices on mobilization of arsenic from sediments to groundwater in Bengal delta. Water research 44:5575-5588.
Field, J. A., R. L. Reed, T. E. Sawyer, S. M. Griffith, and P. Wigington. 2003. Diuron occurrence and distribution in soil and surface and ground water associated with grass seed production. Journal of Environmental Quality 32:171-179.
Garau, V. L., A. Angioni, A. A. Del Real, M. Russo, and P. Cabras. 2002. Disappearance of azoxystrobin, pyrimethanil, cyprodinil, and fludioxonil on tomatoes in a greenhouse. Journal of Agricultural and Food Chemistry 50:1929-1932.
Grigal, D. 2003. Mercury sequestration in forests and peatlands. Journal of environmental quality 32:393-405.
Harvey Jr, J., and H. L. Pease. 1973. Decomposition of methomyl in soil. Journal of agricultural and food chemistry 21:784-786.
Haynes, R. J., and R. Naidu. 1998. Influence of lime, fertilizer and manure applications on soil organic matter content and soil physical conditions: a review. Nutrient Cycling in Agroecosystems 51:123-137.
He, Z. L., X. E. Yang, and P. J. Stoffella. 2005. Trace elements in agroecosystems and impacts on the environment. Journal of Trace Elements in Medicine and Biology 19:125-140.
Heathwaite, A. L., and P. Johnes. 1996. Contribution of nitrogen species and phosphorus fractions to stream water quality in agricultural catchments. Hydrological processes 10:971-983.
Hedditch, R. 2014. Coffs Harbour 2014 Heritage Study. Hernández, A., F. Gil, A. Pla, A. Gómez, D. Lozano, T. Parrón, M. Requena, and R. Alarcón. 2011.
Emerging human health concerns from chronic exposure to pesticide mixtures. Toxicology Letters:S4-S5.
Holmes, G. 2014. Australia’s pesticide environmental risk assessment failure: The case of diuron and sugarcane. Marine pollution bulletin 88:7-13.
Jiang, C., X. J. Li, Y. R. Wang, L. Y. Ma, Y. K. Wang, Y. C. Lu, and H. Yang. 2017. Assessment of Photodegradation of Herbicide Prometryn in Soil. Water, Air, & Soil Pollution 228:135.

Soil and dam sediment chemistry report Southern Cross University 37
Kalam, A., J. Tah, and A. K. Mukherjee. 2004. Pesticide effects on microbial population and soil enzyme activities during vermicomposting of agricultural waste. Journal of environmental biology 25:201-208.
Kamble, S., and R. Saran. 2005. Effect of concentration on the adsorption of three termiticides in soil. Bulletin of environmental contamination and toxicology 75:1077-1085.
Khan, S. U. 1982. Distribution and characteristics of bound residues of prometryn in an organic soil. Journal of Agricultural and Food Chemistry 30:175-179.
Kim, I. S., L. A. Beaudette, J. H. Shim, J. T. Trevors, and Y. T. Suh. 2002. Environmental fate of the triazole fungicide propiconazole in a rice-paddy-soil lysimeter. Plant and soil 239:321-331.
Komárek, M., E. Čadková, V. Chrastný, F. Bordas, and J.-C. Bollinger. 2010. Contamination of vineyard soils with fungicides: A review of environmental and toxicological aspects. Environment International 36:138-151.
Kreuger, J., M. Peterson, and E. Lundgren. 1999. Agricultural inputs of pesticide residues to stream and pond sediments in a small catchment in southern Sweden. Bulletin of environmental contamination and toxicology 62:55-62.
Lemly, A. D. 2004. Aquatic selenium pollution is a global environmental safety issue. Ecotoxicology and Environmental Safety 59:44-56.
Li, H.-F., C. Gray, C. Mico, F.-J. Zhao, and S. P. McGrath. 2009. Phytotoxicity and bioavailability of cobalt to plants in a range of soils. Chemosphere 75:979-986.
Li, P., H. Qian, K. W. Howard, J. Wu, and X. Lyu. 2014. Anthropogenic pollution and variability of manganese in alluvial sediments of the Yellow River, Ningxia, northwest China. Environmental monitoring and assessment 186:1385-1398.
Liu, Y., Z. Xu, X. Wu, W. Gui, and G. Zhu. 2010. Adsorption and desorption behavior of herbicide diuron on various Chinese cultivated soils. Journal of Hazardous Materials 178:462-468.
Lockhart, W., R. Macdonald, P. Outridge, P. Wilkinson, J. DeLaronde, and J. Rudd. 2000. Tests of the fidelity of lake sediment core records of mercury deposition to known histories of mercury contamination. Science of the Total Environment 260:171-180.
Loughran, R., G. Elliott, B. Campbell, S. Curtis, D. Cummings, and D. J. A. G. Shelly. 1993. Estimation of erosion using the radionuclide caesium-137 in three diverse areas in eastern Australia. 13:169-188.
Machado, W., C. J. Sanders, I. R. Santos, L. M. Sanders, E. V. Silva-Filho, and W. Luiz-Silva. 2016. Mercury dilution by autochthonous organic matter in a fertilized mangrove wetland. Environmental Pollution 213:30-35.
Malhat, F., H. Watanabe, and A. Youssef. 2015. Degradation profile and safety evaluation of methomyl residues in tomato and soil. Hellenic Plant Protection Journal 8:55-62.
Martikainen, E. 1996. Toxicity of Dimethoate to Some Soil Animal Species in Different Soil Types. Ecotoxicology and Environmental Safety 33:128-136.
Mortvedt, J., and G. Osborn. 1982. Studies on the chemical form of cadmium contaminants in phosphate fertilizers. Soil Science 134:185-192.
National Center for Biotechnology Information. 2018. Compound Summary: Prometryn.in PubChem, editor. U.S. National Library of Medicine, Bethesda, Maryland, USA.
Nicol, E., H. Chayata, C. Genty, S. Bouchonnet, and S. Bourcier. 2016. Photodegradation of cyprodinil under UV–visible irradiation–chemical and toxicological approaches. Rapid Communications in Mass Spectrometry 30:2201-2211.
Nziguheba, G., and E. Smolders. 2008. Inputs of trace elements in agricultural soils via phosphate fertilizers in European countries. Science of the Total Environment 390:53-57.
Outridge, P. M., and F. Wang. 2015. The stability of metal profiles in freshwater and marine sediments. Pages 35-60 Environmental Contaminants. Springer.
Persaud, D., R. Jaagumagi, and A. Hayton. 1993. Guidelines for the protection and management of aquatic sediment quality in Ontario.

Soil and dam sediment chemistry report Southern Cross University 38
Ragnarsdottir, K. V. 2000. Environmental fate and toxicology of organophosphate pesticides. Journal of the Geological Society 157:859-876.
Rhodes, R. C., and J. D. Long. 1974. Run-off and mobility studies on benomyl in soils and turf. Bulletin of environmental contamination and toxicology 12:385-393.
Riise, G., H. Lundekvam, Q. Wu, L. Haugen, and J. Mulder. 2004. Loss of pesticides from agricultural fields in SE Norway–runoff through surface and drainage water. Environmental geochemistry and health 26:269-276.
Rose, G., S. Lane, and R. Jordan. 2009. The fate of fungicide and insecticide residues in Australian wine grape by-products following field application. Food chemistry 117:634-640.
Roussiez, V., A. Probst, and J.-L. Probst. 2013. Significance of floods in metal dynamics and export in a small agricultural catchment. Journal of hydrology 499:71-81.
Rundgren, S., Å. Rühling, K. Schlüter, and G. Tyler. 1992. Mercury in Soil:–distribution, speciation and biological effects. Nordic Council of Ministers.
Ryd er , J., V. G lman, . en er , . Bindler, . am ertsson, and A. Mart ne -Cortizas. 2008. Assessing the stability of mercury and methylmercury in a varved lake sediment deposit. Environmental science & technology 42:4391-4396.
Sanderson, D., and E. Edson. 1964. Toxicological properties of the organophosphorus insecticide dimethoate. Occupational and Environmental Medicine 21:52-64.
Santos, I. R., J. De Weys, and B. D. Eyre. 2011. Groundwater or floodwater? Assessing the pathways of metal exports from a coastal acid sulfate soil catchment. Environmental science & technology 45:9641-9648.
Schäfer, R. B., M. Bundschuh, D. A. Rouch, E. Szöcs, P. C. von der Ohe, V. Pettigrove, R. Schulz, D. Nugegoda, and B. J. Kefford. 2012. Effects of pesticide toxicity, salinity and other environmental variables on selected ecosystem functions in streams and the relevance for ecosystem services. Science of the total environment 415:69-78.
Shanley, J. B., and K. Bishop. 2012. Mercury cycling in terrestrial watersheds. Short, K. 1994. Quick poison, slow poison: pesticide risk in the lucky country. K. Short. Simpson, M. 2019. Berry Plant Protection Guide. Pages 1-100 in N. D. o. P. Industries, editor.
Wollongbar Primary Industries Institute. Department of Primary Industries, Wollongbar, NSW.
Simpson, S., G. Batley, and A. Chariton. 2013. Revision of the ANZECC/ARMCANZ sediment quality guidelines. CSIRO Land and Water Report 8:128.
Sirtori, C., A. Zapata, S. Malato, and A. Agüera. 2012. Formation of chlorinated by-products during photo-Fenton degradation of pyrimethanil under saline conditions. Influence on toxicity and biodegradability. Journal of Hazardous Materials 217-218:217-223.
Smelt, J. H., S. J. H. Crum, W. Teunissen, and M. Leistra. 1987. Accelerated transformation of aldicarb, oxamyl and ethoprophos after repeated soil treatments. Crop Protection 6:295-303.
Smith, E., J. Smith, L. Smith, T. Biswas, R. Correll, and R. Naidu. 2003. Arsenic in Australian environment: an overview. Journal of Environmental Science and Health, Part A 38:223-239.
Smith, E. R. G., R. Naidu, and A. Alston. 1998. Arsenic in the soil environment. Academic Press. Stork, P. R., F. R. Bennett, and M. J. Bell. 2008. The environmental fate of diuron under a
conventional production regime in a sugarcane farm during the plant cane phase. Pest Management Science: formerly Pesticide Science 64:954-963.
SWA. 2019a. Hazardous chemical Information System (HCIS). Safe Work Australia, Canberra, A.C.T. SWA. 2019b. Hazardous Chemicals: Proposal to adopt GHS 7. Safe Work Australia. Thorstensen, C. W., O. Lode, O. M. Eklo, and A. Christiansen. 2001. Sorption of bentazone,
dichlorprop, MCPA, and propiconazole in reference soils from Norway. Journal of environmental quality 30:2046-2052.
Tilman, D. 1999. Global environmental impacts of agricultural expansion: the need for sustainable and efficient practices. Proceedings of the National Academy of Sciences 96:5995-6000.
Soil and dam sediment chemistry report Southern Cross University 39
Tixier, C., P. Bogaerts, M. Sancelme, F. Bonnemoy, L. Twagilimana, A. Cuer, J. Bohatier, and H. Veschambre. 2000. Fungal biodegradation of a phenylurea herbicide, diuron: structure and toxicity of metabolites. Pest Management Science: formerly Pesticide Science 56:455-462.
Van Derveer, W. D., and S. P. Canton. 1997. Selenium sediment toxicity thresholds and derivation of water quality criteria for freshwater biota of western streams. Environmental Toxicology and Chemistry 16:1260-1268.
van Herk, W. G., R. S. Vernon, and S. McGinnis. 2013. Response of the dusky wireworm, Agriotes obscurus (Coleoptera: Elateridae), to residual levels of bifenthrin in field soil. Journal of pest science 86:125-136.
Van Scoy, A., A. Pennell, and X. Zhang. 2016. Environmental fate and toxicology of dimethoate. Pages 53-70 Reviews of Environmental Contamination and Toxicology Volume 237. Springer.
Van Scoy, A. R., M. Yue, X. Deng, and R. S. Tjeerdema. 2013. Environmental fate and toxicology of methomyl. Pages 93-109 Reviews of environmental contamination and toxicology. Springer.
White, S., I. Santos, and S. Hessey. 2018. Effect of intensive horticulture practices on surrounding headwater stream nitrate concentrations. Environmental Pollution 243:1036-1046.
White, S. A., Santos, I.R., Conrad, S.R., Sanders C.J. 2018. Investigating water quality in Coffs coastal estuaries and the relationship to adjacent land use Part 2: Water quality. National Marine Science Centre, Southern Cross University, Coffs Harbour, NSW.
Wu, Q., G. Riise, and R. Kretzschmar. 2003. Size distribution of organic matter and associated propiconazole in agricultural runoff material. Journal of environmental quality 32:2200-2206.
Xue, H., L. Sigg, and R. Gächter. 2000. Transport of Cu, Zn and Cd in a small agricultural catchment. Water Research 34:2558-2568.
Yang, Y., G. Sheng, and M. Huang. 2006. Bioavailability of diuron in soil containing wheat-straw-derived char. Science of the total environment 354:170-178.
Zhang, J., and C. Liu. 2002. Riverine composition and estuarine geochemistry of particulate metals in China—weathering features, anthropogenic impact and chemical fluxes. Estuarine, Coastal and Shelf Science 54:1051-1070.

Soil and dam sediment chemistry report Southern Cross University 40
Appendix
Literature cited for Table 4. All references here appear in reference list above.
Pesticides Literature cited
Bifenthrin Kamble and Saran 2005, SWA 2019a, van Herk et al. 2013
Benomyl Ahmad 2018, Austin and Briggs 1976, Baude et al. 1974, Rhodes and Long 1974, SWA 2019a
Cypronodil Bermúdez-Couso et al. 2007, Cayman Chemical Company 2018, Komarek et al. 2010
Dimethoate Bohn 1964, El Beit et al. 1981, Martikainen 1996, Sanderson and Edson 1964, SWA 2019a, Van Scoy et al. 2016
Diuron Field et al. 2003, Stork et al. 2008, SWA 2019a, Tixier et al. 2000
Ethoprophos Boesten and Gottesbüren 2000, Boesten and van der Pas 2000, Smelt et al. 1987, SWA 2019a
Methomyl Cox et al. 1992, Harvey Jr and Pease 1973, Malhat et al. 2015, SWA 2019a, Van Scoy et al. 2016
Prometryn Jiang et al. 2017, Khan 1982, National Center for Biotechnology Information 2018
Propiconazole Edwards et al. 2016, Kim et al. 2002, Riise et al. 2004, SWA 2019a, Thorstensen et al. 2001, Wu et al. 2003
Pyrimethanil Aguera et al. 2000, Garau et al. 2002, Rose et al. 2009, Sirtori et al. 2012, SWA 2019a
Organochlorines SWA 2019a
Triazine Herbicides SWA 2019a
Triazinone Herbicides SWA 2019a
Trace Metals Literature cited
Arsenic Burton et al. 2008, Simpson et al. 2013
Lead Roussiez et al. 2013, Simpson et al. 2013
Cadmium Conrad et al. 2019, Mortvedt and Osborn 1982, Roussiez et al. 2013, Simpson et al. 2013, Xue et al. 2000
Chromium Roussiez et al. 2013, Simpson et al. 2013, Xue et al. 2000
Copper Roussiez et al. 2013, Simpson et al. 2013, Xue et al. 2000
Nickel Roussiez et al. 2013, Simpson et al. 2013, Xue et al. 2000
Selenium Lemly 2004, van Derveer and Canton 1997
Zinc Conrad et al. 2019, Nziguheba and Smolders 2008, Simpson et al. 2013, Xue et al. 2000
Mercury Shanley and Bishop 2012, Simpson et al. 2013
Cobalt Li et al. 2009
Manganese Li et al. 2014, Simpson et al. 2013
Iron Simpson et al. 2013
Aluminium Roussiez et al. 2013, Simpson et al. 2013
Phosphorous Carpenter 2005, Conrad et al. 2019, Persaud et al. 1993