investigating challenges facing implementation of …
TRANSCRIPT

INVESTIGATING CHALLENGES
FACING IMPLEMENTATION OF CLEAN
DEVELOPMENT MECHANISM PROJECTS AT KENYA
ELECTRICITY GENERATING COMPANY
JAMES KIPCHUMBA METTO
MASTER OF SCIENCE
(Environmental Legislation and Management)
JOMO KENYATTA UNIVERSITY OF
AGRICULTURE AND TECHNOLOGY
2015


Investigating Challenges
Facing Implementation of Clean Development Mechanism Projects
at Kenya Electricity Generating Company
James Kipchumba Metto
Thesis Submitted in Partial Fulfilment for the Degree of Master of
Science in Environmental Legislation and Management in the Jomo
Kenyatta University of Agriculture and Technology
2015

ii
DECLARATION
This thesis is my original work and has not been presented for a degree in any
other university.
Signature……………………....... Date……..........................................
James Kipchumba Metto,
This thesis has been submitted for examination with our approval as university
supervisors.
Signature……………………... Date…..............................................
Dr. Paul Njogu, PhD
JKUAT
Signature…………………...... Date.................................................
Prof. Erastus Gatebe, PhD
JKUAT, Kenya

iii
DEDICATION
This Thesis is dedicated to my caring parents, Mr & Mrs Metto for their passion
for education as evidenced by their commitment to educating their children in
pursuit of knowledge despite the limited resources coupled with competing
needs. Secondly I dedicate this piece of work to my lovely wife and our children
Beryl and Neema for their continuous support especially during the times I had
to be away from home for studies. I could not have done it without you! Your
care and support mean the world to me. Thanks and I wish you all God’s
blessings.

iv
ACKNOWLEDGEMENT
I wish to appreciate a number of people who have made significant
contribution in development and successful completion of this research project.
First I would like to thank the almighty God for his presence and provision in
my life, without him this process would not have been a success.
Secondly I would like to thank my supervisors; Dr. Njogu and Prof. Gatebe for
giving me inspiration and advice throughout my study period and especially
during the research period. I wish you both God’s blessings.
The KenGen management and the staff who took their time to complete my
questionnaire, am indebted to you for your support. We can contribute to
mitigating the challenges of climate change together by ensuring successful
implementation of renewable energy projects and as a result move our country
to a low carbon development trajectory.
Last but not least I wish to thank my parents, wife, children, brothers and
sisters for their inspiration and support during the study period; you have made
a difference by your support and presence in my life.

v
TABLE OF CONTENTS
DECLARATION ............................................................................................................... ii
DEDICATION .................................................................................................................. iii
ACKNOWLEDGEMENT ............................................................................................... iv
TABLE OF CONTENTS .................................................................................................. v
LIST OF TABLES ......................................................................................................... viii
LIST OF FIGURES ......................................................................................................... ix
LIST OF APPENDICES................................................................................................... x
ACRONYMS AND ABBREVIATIONS ........................................................................ xi
ABSTRACT .................................................................................................................... xiii
CHAPTER ONE................................................................................................................ 1
INTRODUCTION ............................................................................................................. 1
1.1 Background to the Study ........................................................................................... 1
1.2 Statement of Problem ................................................................................................ 2
1.3 Null Hypothesis ......................................................................................................... 3
1.4 Objective of the Study ............................................................................................... 3
1.5 Conceptual Framework .............................................................................................. 4
1.6 Rationale and Justifications ....................................................................................... 5

vi
CHAPTER TWO .............................................................................................................. 6
LITERATURE REVIEW ................................................................................................. 6
2.1 Climate Change ......................................................................................................... 6
2.2 Kyoto Protocol and Global Response to Climate Change ......................................... 8
2.3 Clean Development Mechanism .............................................................................. 10
2.4 Clean Development Mechanism Implementation Process ...................................... 15
2.5 Clean Development Mechanism in Kenya .............................................................. 18
2.6 Clean Development Mechanism Implementation at KenGen ................................. 19
CHAPTER THREE ........................................................................................................ 23
METHODOLOGY .......................................................................................................... 23
3.1 Introduction ............................................................................................................. 23
3.2 Research Design ...................................................................................................... 23
3.3 Sampling….. ............................................................................................................ 25
3.4 Description of Study Site ......................................................................................... 27
3.5 Data Collection ........................................................................................................ 32
3.6 Data Analysis and Presentation ............................................................................... 33
CHAPTER FOUR ........................................................................................................... 34
RESULTS AND DISCUSSIONS ................................................................................... 34
4.1 Introduction ............................................................................................................. 34

vii
4.2 Level of awareness in relation to Implementation of CDM at KenGen .................. 39
4.3 Organizational constraints that impede CDM implementation at KenGen ............. 47
4.4 Challenges related to procedures of the CDM Project Registration ........................ 49
CHAPTER FIVE ............................................................................................................. 61
CONCLUSIONS AND RECOMENDATIONS ............................................................ 61
5.1 Conclusions ............................................................................................................. 61
5.2 Recommendations and way forward ....................................................................... 63
REFERENCES ................................................................................................................ 65
APPENDICES ................................................................................................................. 69
viii
LIST OF TABLES
Table 2.1: KenGen CDM registered projects......................................................... 20
Table 2.2: KenGen’s Existing Generation Facilities ............................................. 21
Table 3.1: The sample population .......................................................................... 27
Table 4.1: Benefits of implementation of CDM projects....................................... 42
Table 4.2: Level of awareness with regard to CDM project requirements ............ 45
Table 4.3: Factors that influenced respondents’ involvement with the CDM
project……… .............. ……………………………………………….46
Table 4.4: Pearson’s Correlation Matrix ................................................................ 47
Table 4.5: Barriers and Challenges to implementing CDM initiatives for
KenGen ................................................................................................. 51
Table 4.6: Multiple Regression Analysis ............................................................... 52
Table 4.7: Challenges relating to implementation of the CDM projects ............... 53
Table 4.8: Inhibiting factors to KenGen pro-activeness in implementing
CDM projects ........................................................................................ 55
Table 4.9: ANOVA results of the regression analysis between
implementation of CDM projects and predictor variables.................... 57
Table 4.10: Regression coefficients implementation of CDM projects and the
variables ................................................................................................ 58
Table 4.11: Chi-Square tests results on relationship between challenges and
implementation of CDM projects at Kenya Electricity Generating
Company ............................................................................................... 59

ix
LIST OF FIGURES
Figure 1.1: CDM Projects Conceptual Framework .......................................................4
Figure 2.1: CDM Implementation process ...................................................................13
Figure 2.2: Regional distributions of CDM projects....................................................14
Figure 2.3: Distributions of CERs issuances among the top countries ........................15
Figure 2.4: Categories of CDM projects in Africa.......................................................21
Figure 3.1: Location of Olkaria II Expansion Project..................................................29
Figure 3.2: Location of Tana Power Station...............................................................30
Figure 3.3: Location of Kiambere Power Station.......................................................31
Figure 3.4: Location of Ngong Power Station............................................................32
Figure 4.1: Distribution of respondents at KenGen .....................................................35
Figure 4.2: Age group of the respondents ....................................................................35
Figure 4.3: Gender of the respondents .........................................................................35
Figure 4.4: Educational Level of the Respondents ......................................................36
Figure 4.5: Duration of employment of respondents ...................................................37
Figure 4.6: Respondents Area of Operation.................................................................38
Figure 4.7: Knowledge of presence of a Climate Change Policy/Strategy in KenGen40
Figure 4.8: Knowledge of presence of a CDM Policy in KenGen ..............................40
Figure 4.9: Status of CDM related training among respondents..................................41
Figure 4.10: Respondents’ role in KenGen’s CDM projects .......................................43
Figure 4.11: Consideration of clean renewable energy in investment decisions .........49
Figure 4.12: Challenges of KenGen CDM Projects Validation and Registration .......56
Figure 4.13: NEMA’s support for KenGen CDM process ..........................................60

x
LIST OF APPENDICES
Appendix 1: Letter of Approval to carry out research ....................................... 69
Appendix 2: Questionnaire on KenGen’s Environmental Policy Matters ......... 71
Appendix 3: Questionnaire for KenGen’s Environment and CDM Team ......... 74
Appendix 4: Questionnaire for KenGen’s Operations Team ............................. 81
Appendix 5: Publication and Conference Presentation ...................................... 84

xi
ACRONYMS AND ABBREVIATIONS
AfDB African Development Bank
APF Africa Partnership Forum
BAU Business as Usual
CDM Clean Development Mechanism
CER Certified Emission Reductions
CFA Community Forest Associations
CO2e Carbon dioxide equivalent
COP Conference of Parties
DNA Designated National Authorities
GHG Greenhouse-gases
GWh Gigawatt hours
Gt CO2e Giga tonnes of carbon dioxide equivalent
GBM Green Belt Movement
Ha Hectares
HND Higher National Diploma
IETA International Emissions Trading Association
IPCC Intergovernmental Panel on Climate Change
JI Joint Implementation
KenGen Kenya Electricity Generating Company
KP Kyoto Protocol
MDGs Millennium Development Goals
MEMR Ministry of Environment and Mineral Resources
MSCL Mumias Sugar Company Limited
MW Mega watts
NAMA Nationally Appropriate Mitigation Action
NGO Non-Governmental Organization

xii
OECD Organisation for Economic Co-operation and
Development
OEC Ormat Energy Converter
PDD Project Design Document
PIN Project Idea Note
PHD Doctor of Philosophy
PLDVs Passenger light duty vehicles
REDD Reducing Emissions from Deforestation and forest
Degradation
SSA Sub-Saharan Africa
SPSS Statistical Package for the Social Scientists
tCO2 Tonnes of Carbon dioxide equivalent
TWh Terawatt-hour
UN United Nations
UNECA United Nations Economic Commission for Africa
UNEP United Nations Environment Programme
UNFCCC United Nations Framework Convention on Climate
Change

xiii
ABSTRACT
Climate change has become the biggest global environmental challenge. The
International community acknowledged it as a global concern with the establishment
of the United Nations Framework Convention on Climate Change (UNFCCC) at the
Rio de Janeiro Earth Summit in 1992. The clean development mechanism (CDM)
was established under the UNFCCC as one of the mechanisms to achieve sustainable
development while reducing emissions. African countries unfortunately have not
benefited from CDM with only 2.4% of the projects registered and only one country
Egypt contributing 0.8% from amongst the nine countries contributing 93.6% of the
issued carbon credits. The objective of this study was to determine the challenges
affecting implementation of CDM projects at KenGen which is a major player of
CDM process in Kenya. The study findings demonstrate that there were low
awareness levels among key persons in relation to KenGen’s CDM implementation
requirements. The study further identified complex and tedious CDM procedures,
lack of adequate internal capacity and the long approval process as the main
challenges at the development stage of KenGen CDM projects. The Chi –Square test
shows a statistic of 38.32 with an associated p of 0.001 (P<0.05). The P value of
0.001 is statistically significant in explaining the influence of the organizational
constraints, rules and procedures and level of awareness on implementation of CDM
Projects considering that the P-value is less than 0.05 at the 95% level of confidence.
In conclusion the study found that the implementation of CDM at KenGen is
influenced by organizational constraints, rules and procedures and level of
awareness. It’s expected that the results from this study will contribute towards fast
tracking the development of CDM projects at KenGen as well as enabling the
company to benefit from the global initiatives geared towards sustainable
development.


1
CHAPTER ONE
INTRODUCTION
1.1 Background to the Study
Climate change has become the biggest global environmental challenge and the
International community acknowledged it as an important global issue with the
establishment of the United Nations Framework Convention on Climate Change
(UNFCCC) at the Rio de Janeiro Earth Summit in 1992 (UNFCCC, 1992). The ultimate
objective of the UNFCCC and its related legal instruments that the Conference of the
Parties has adopted was to achieve stabilization of greenhouse gas concentrations in the
atmosphere at a level that would prevent dangerous anthropogenic interference with the
climate system. The convention envisaged that such level should be achieved within a
time frame sufficient to allow ecosystems to adapt naturally to climate change, to ensure
that food production is not threatened and to enable economic development to proceed in
a sustainable manner (UNFCCC, 1992).
Growing evidence of human influence on climate change and the possible irreversible
nature of its impacts led the international community to adopt the Kyoto Protocol of
1997. The Kyoto Protocol resolved to reduce emissions of greenhouse gases (GHGs) on
a global scale and stabilize their concentration in the atmosphere to a level that would
prevent dangerous anthropogenic interference with the climate system (UNFCCC,
1997).
The effects of climate change have a global impact for example the loss of ice sheet on
polar land and thermal expansion of seawater over very long time scale could lead to
metres of sea level rise, major changes in coastline and inundation of low lying areas. In
Australia there is reported decline in agricultural production and forestry in the southern

2
and eastern regions. In the case of Africa some countries will see reduced agricultural
yields by up to 50% as early as 2020 (IETA, 2009).
One of the proposed mitigation of the effects of climate change is limiting global
warming and keeping temperatures at levels where human life remains possible, global
GHG emissions must therefore be reduced by 40% by 2020 and 95% by 2050, with
1990 emission levels as baselines (Reddy, 2011). These demanding targets can only be
met by urgently and drastically changing the way we live and by moving towards low
carbon development which includes reducing use of fossil fuels which in turn reduce
greenhouse gas emissions.
Deforestation and forest degradation are among the most important single sources of
emissions of greenhouse gases (GHG), contributing about 20 percent of total emissions
annually and the associated losses of livelihoods, biodiversity, environmental services
and cultural benefits (Pagiola & Bosquet, 2009). The Parties to the UNFCCC agreed in
December 2007 in Bali to explore policies and financial incentives that could be
implemented to encourage Reduced Emissions from Deforestation and Forest
Degradation in Developing Countries (REDD). This initiative is expected to address the
challenges related deforestation and forest degradation while at the same time contribute
to reducing GHG emissions.
1.2 Statement of Problem
CDM was expected to have considerable effects in the climate change regime by
assisting developed nations in reducing their cost of climate change mitigation and
contribute to sustainable development by the developing nations. The execution of CDM
project activities were expected to generate employment, technology transfer,
environmental improvement, generation of income, attraction of foreign investment, de-
carbonization of the economy. The involvement of developing countries in the climate
change regime has however been low with the current geographical distribution of CDM
project activities indicating that only 2.4% of CDM projects registered by the UNFCCC

3
are in Africa (UNFCCC, 2014). As of December 2013, Kenya had sixteen registered
projects but only Olkaria II project had been paid for the sale of emission reductions.
Kenya has therefore not yet benefitted from its registered projects despite registering its
first project in 2008. An analysis of the time it took to register four KenGen CDM
projects gave an average duration of 1,307 days from start of public participation to
registration. Olkaria II took 1,232 days, Tana 1,372, Kiambere 1,689 and Ngong wind
took 935 days (UNFCCC, 2014). The global average time from start of public
participation to registration as analysed by the UNEP (2014) had the highest average as
938 days in September 2009, 356 days in September 2011 and 169 days in November
2012.
Upon registration of the projects, monitoring and verification process is expected to lead
to issuance of CER’s. The analysis of issuance indicated that CERs amounting to 93.6%
of the total issuance from the registered projects has been contributed by only nine
countries as shown by figure 1.3. Out of the nine countries only one country is African
i.e. Egypt contributing 0.8% of the issued CERs (UNEP, 2014).
This study therefore was undertaken to determine the main obstacles affecting
implementation of CDM projects at KenGen which is a major player in the CDM
process in Kenya.
1.3 Null Hypothesis
There are no challenges affecting the implementation of clean development mechanism
projects at Kenya Electricity Generating Company
1.4 Objective of the Study
1.4.1 Main Objective
To assess the challenges affecting the implementation of clean development mechanism
projects at Kenya Electricity Generating Company.

4
1.4.2 Specific Objectives of the Study
1. To determine the levels of awareness with regard to implementation of CDM
among staff involved with KenGen’s CDM implementation process.
2. To determine KenGen’s organizational, administrative and policy issues that
impedes the implementation of Clean Development Mechanism projects.
3. To establish the challenges faced by KenGen in relation to the rules and
procedures of the CDM projects registration process.
4. To recommend measures that will enable KenGen successfully implement clean
development mechanism projects
1.5 Conceptual Framework
Figure 1.1 CDM Projects Conceptual Framework
In the conceptual framework depicted in Figure 1.1 CDM is hypothesized to lead to
reduction of global warming through reduced anthropogenic emissions (GHG’s). GHG’s

5
have been shown to contribute to rise in temperatures and climate change (UNFCCC,
1997). The benefits expected from implementation CDM includes contribution to
sustainable development by attracting investments, transfer of technology, earning of
carbon revenue by sale of CER’s and finally it enables developed countries to comply
with Kyoto protocol’s emissions targets (UNFCCC, 1997).
To benefit from implementation of CDM projects the project participants require skills
and competencies in order to ensure that project requirements comprising of monitoring
and verifications are complied with.
1.6 Rationale and Justifications
Although Africa is the continent least responsible for climate change, it is particularly
vulnerable to the effects of climate change, including reduced agricultural production,
worsening food security, increased incidence of both flooding and drought, poverty,
spreading disease and an increased risk of conflict over scarce land and water resources.
Currently limited studies have been carried out to establish the cause of the slow uptake
of CDM projects in Africa which currently stands at 2.4% yet it’s the most vulnerable
continent with regard to the impacts of climate change. In the Kenyan context no
documented research has been carried out on CDM at project level in general and power
generation in particular where KenGen is the single largest participant in the Kenyan
CDM development with Six Projects. It is hoped that the results of this study will be of
benefit to the project managers in the renewable energy sector to benefit from the global
initiatives which apart from contributing to emission reductions enable organizations to
get additional revenue as well as creation of employment within the community.
6
CHAPTER TWO
LITERATURE REVIEW
2.1 Climate Change
Climate change is the variation in climate over time (IPCC, 2007). The UNFCCC in its
Article 1, defines climate change as a change of climate which is attributed directly or
indirectly to human activity that alters the composition of the global atmosphere and
which is in addition to natural climate variability observed over comparable time periods
(UNFCCC, 1992). Climate change is a major threat to sustainable growth and
development in Africa, and the achievement of the Millennium Development Goals
(MDGs). It is being argued that, poorer developing countries are especially vulnerable to
climate change because of their geographic exposure, low incomes and greater reliance
on climate sensitive sectors, particularly agriculture and poses multiple threats to
economic growth, wider poverty reduction, and the achievement of the MDGs. Climate
change may spark conflict between nations because it turns arable land into deserts,
melted ice fields and poisoned water supplies. These occurrences indicate that climate
change is the major threat in future decades (AfDB, 2002).
Africa is particularly vulnerable to climate change because of its overdependence on
rain-fed agriculture, compounded by factors such as widespread poverty and weak
capacity. The main longer-term impacts include: changing rainfall patterns affecting
agriculture and reducing food security; poverty, worsening water security; decreasing
fish resources in large lakes due to rising temperature; shifting vector-borne diseases;
rising sea level affecting low-lying coastal areas with large populations; and rising water
stress (APF, 2007). Africa’s agricultural yields are already on the decline, so the
attainment of MDG 1 - eradicating poverty and hunger – could be seriously threatened.
A 3°C warming could put 150 million to 550 million additional people at risk of hunger
(APF, 2008). More extreme weather events are occurring worldwide, sometimes in
unexpected ways – such as the flooding events in the dry regions of Ethiopia in 2007
and in Brisbane Australia in 2010. Flood and windstorm events together from 1900 to
7
2006, accounted for 56.7% and more than 21.7% of the total number of disasters and
fatalities (UNESCO, 2009).
Other effects of climate change include decreased hydro-power generations, widespread
increase in the risk of flooding in many human settlements sequel to increased heavy
precipitation affecting people living in river valleys and sea-level rise, also affecting
people living in low lying coastal areas (Agbogidi, 2011). Global warming is a major
consequence of climate change particularly the depletion of the Ozone layer by
greenhouse gases (Aluko, et al., 2008). The interactions of man with the environment
through agriculture, urbanization/industrialization, human settlements, logging, and
deforestation, burning of fossil fuels, population explosion and others contribute
significantly to climate change (Agbogidi, 2011).
The predicted global temperature increase of between 1.5 o
C and 4.5 oC could lead to
potentially catastrophic environmental impacts (Defra, 2006). These include sea level
rise, increased frequency of extreme weather events, floods, droughts, disease migration
from various places and possible stalling of the gulf stream. This has led scientists to
argue that climate change issues are not ones that politicians can afford to ignore, and
policy makers tend to agree (Defra, 2006).
The IPCC (2001a) Third Assessment Report presented possible consequences from
extreme climatic events such as the higher maximum and increasing minimum
temperatures, more intense precipitation events, and intensified droughts and floods
associated with El Niño events, among others. Carbon emissions to the atmosphere need
to be curtailed to address climate change and many carbon emissions are related to
energy processes and activities. One of the greatest emitters of carbon to the atmosphere
is the energy sector, making the sector one of the largest contributors to climate change
(Rosen, 2009). According to the World Energy Council the world’s energy

8
consumption today is estimated to be 22 billion kWh per year and expected to reach 53
billion kWh by 2020 (WEC, 2009). The increasing demand could lead to damage of the
world environment by CO, CO2, SO2, NOx effluent gas emissions and global warming
(ASHRAE, 2005).
The Copenhagen Accord of 2009 and the Cancun agreements of 2010 have been
identified by the United Nations Environment Programme (UNEP) as some of the
international efforts under the United Nations Framework Convention on Climate
Change that are focused on keeping the average rise in global temperature to below 2
°C, compared to pre-industrial levels. Although current commitments and pledges by
developed and developing nations can take the world partly towards achieving this 2 °C
target, an assessment by UNEP shows that the there is still a significant gap between
political ambition and practical reality. One of the most important areas for international
cooperative initiatives that has been identified to contribute to emission reductions is
Renewable energy estimated to lead to reduction of 1–3 GtCO2e by 2020 (UNEP, 2013).
Kenya has developed a National Climate Change Response Strategy (NCCRS), which
seeks to strengthen nationwide focused actions towards adapting to, and mitigating
against a changing climate. Initiatives being undertaken include ensuring commitment
and engagement of all stakeholders while taking into account the vulnerable nature of
our natural resources and society as a whole (GOK, 2010). The strategy enhances
understanding of the global climate change regime: the negotiations process,
international agreements, policies and processes and most importantly the position
Kenya needs to take in order to maximize beneficial effects.
2.2 Kyoto Protocol and Global Response to Climate Change
In 1992, The United Nations Framework Convention on Climate Change (UNFCCC)
was tabled at the Earth summit in Rio de Janeiro and has subsequently been ratified by

9
approximately 190 nations (Dessler & Parson, 2006). The UNFCCC under the Kyoto
Protocol established the Clean Development Mechanism as one of three flexibility
mechanisms and it is the only mechanism open for participation by parties from both
industrialized and developing countries. It has two complementary objectives: to support
sustainable development objectives and to provide cost-effective emissions reductions,
(UNFCCC, 1997). The Kyoto Protocol is founded on numerous internationally accepted
principles including; the Precautionary Principle, Preventative Principle, Common but
Differentiated Principle, Polluter Pays Principle, the Principle of Sustainable
Development and the Principle of Intergenerational Equity.
Negotiations on a new climate regime are currently underway with a growing demand
for increased contribution to climate change mitigation by all Parties, and calls for
carbon market mechanisms, including the CDM to deliver net mitigation beyond
offsetting. A review of the existing mechanisms is currently underway with new
approaches being developed under the United Nations Framework Convention on
Climate Change (UNFCCC). The negotiations are ongoing on a global climate regime
from 2020 onwards including negotiations based on the Bali Action Plan concluded at
COP 18 in Doha. As a part of the agreed outcome, developing country Parties are
expected to take Nationally Appropriate Mitigation Actions (NAMAs) in the context of
sustainable development. (UNFCCC, 2014).
The concept of Nationally Appropriate Mitigation Actions (NAMAs) was developed in
the context of the international negotiations under the United Nations Framework
Convention on Climate Change (UNFCCC). NAMAs are considered to be voluntary
climate protection measures taken by developing countries, which are embedded within
their national development plans. By moving countries towards a low-carbon
development trajectory, NAMA’s have the potential to significantly contribute to global
efforts to reduce greenhouse gas (GHG) emissions. Simultaneously, they offer

10
developing countries and emerging economies a framework for combining broad-based
climate action with the achievement of sustainable development goals. This concept is
gaining momentum as many developing countries are already developing NAMA’s in
the context of their national development strategies and plans. Their aim is to assist
developing countries that wish to reduce emissions to a level below that of Business as
Usual (BAU), but they do not represent a legal obligation under the UNFCCC.
Determining which actions to take under a NAMA is each country’s sovereign right,
since the definition of “appropriate mitigation action” is relative to a party’s particular
national circumstances. In general, NAMA’s are designed to support efforts towards
sustainable development, as interpreted by the host country. NAMAs refer to any action
that reduces emissions in developing countries and is prepared under the umbrella of a
national governmental initiative. They can be policies directed at transformational
change within an economic sector, or actions across sectors for a broader national focus.
NAMAs are supported and enabled by technology, financing, and capacity-building and
are aimed at achieving a reduction in emissions relative to 'business as usual' emissions
in 2020.
2.3 Clean Development Mechanism
The Clean Development Mechanism as defined by Article 12 of the Kyoto Protocol has
two basic objectives. The first objective is to assist developing countries achieve
sustainable development and the second is to assist Annex I parties achieve compliance
obligations to reduce their GHG emissions by approximately 5.2% below 1990 levels
over the first commitment period 2008 – 2012 as defined by the Kyoto Protocol, 1997.
Annex 1 parties are the 43 Parties to the UNFCCC listed in Annex I of the Convention,
including the European Union. These Parties are classified as industrialized (developed)
countries and "economies in transition" (EITs). The 14 EITs are the former centrally-
planned (Soviet) economies of Russia and Eastern Europe (UNFCCC, 1997).

11
In order to achieve this objective, the Kyoto Protocol allows the use of three flexible
mechanisms: Emissions Trading, Joint Implementation and the Clean Development
Mechanism (UNFCCC, 1997). Kenya ratified the UNFCCC on 30th
August 1994, Kyoto
protocol on 25th February 2005 as well as the amendment to the protocol on 7
th April
2014 (UNFCCC, 2014). The ratification of the protocol is one of the requirements for
any country to implement CDM projects.
The CDM allows carbon offset projects in non-Annex I Parties (developing countries) to
generate Certified Emission Reductions (CERs) from investing in CDM projects which
can be used towards the national compliance obligations of Annex I Parties under the
Kyoto Protocol. For developing countries CDM contributes to sustainable development
objectives through increased technology transfer, increased financial resources,
sustainable energy production, increased energy efficiency and poverty alleviation
through income and employment generation.
The CDM project goes through a number of steps in its implementation process as
shown by Figure 2.1. The first stage is the preparation of the project idea note (PIN) or
Project design document (PDD) by the project participants (PP), this document captures
the information on the project as specified by the Executive board of the UNFCCC. The
eligibility of CDM projects is defined by the requirement that they should be voluntary,
show long-term climate change mitigation benefits and contribute to emissions
reductions above-and-beyond business as usual and the demonstration of compliance to
these requirements are validated by an independent designated operating entity (DOE)
prior to registration by the UNFCCC.
Validation process then commences by implementation of an independent evaluation by
an approved designated operating entity (DOE). The aim of validation is to confirm that
all the requirements of the methodology have been met. One of the requirements of the
validation is the confirmation that the projects requirements of the host country
sustainable development criteria have been met. The designated national authority

12
(DNA) plays a critical role by issuing a letter of acceptance (LOA) to the project
participants confirming that the project contributes to sustainable development.
Once a positive validation opinion is provided by the DOE the registration process is
carried out by UNFCCC through its Executive Board (EB) by issuing a formal
acceptance of the project. After registration of the project the PP implements the project
as documented in the PDD. Monitoring of the information that is required to quantify the
emissions reductions achieved by the project is a key requirement if the CDM project
activity is to succeed. The monitoring process entails collection and archiving of all
relevant data necessary for establishing GHG sources occurring within the project
boundary during the crediting period which are used for verification.
The project verification is carried out by an independent audit firm a DOE who reviews
and determines GHG reductions that have occurred due to the registered CDM project
activity during the period. At the end of the verification process the DOE will certify by
giving a written assurance that a project activity achieved the GHG reductions during the
specified time period.
The EB will review the recommendation of the DOE report and if in agreement will
issue the Certified Emission Reductions (CER’s) to the PP’s account and finally
payment is made.

13
Figure 2.1: CDM Implementation process
The adoption of CDM globally has gradually grown over the years but Africa
unfortunately still has few projects being registered with only 2.4% of CDM projects,
Asia and Pacific Region are currently leading and represents the highest number of
CDM projects registered at 84.2% followed by Latin America and Caribbean with
12.8% of the registered projects and the Economies in Transition have 0.6% of
registered projects as shown by Figure 2.2 (UNFCCC, 2014).

14
Figure 2.2: Regional distributions of CDM projects
Issuance of CERs amounting to 93.6% of the total issuance from the registered projects
was contributed by only nine countries as shown by Figure 2.3. Out of the nine countries
only one country is African i.e. Egypt contributing 0.8% of the issued CERs. (UNEP,
2014).

15
Figure 2.3: Distributions of CERs issuances among the top countries
Source: UNEP (2014).
2.4 Clean Development Mechanism Implementation Process
CDM is a set of operational rules for the trade of greenhouse gas emissions between
developed and developing countries defined by the Kyoto Protocol. Based on the
evidence of global warming due to anthropogenic causes (IPCC, 2001b), the Kyoto
Protocol, with its three flexible mechanisms, aims to mitigate the emission of GHG to
the atmosphere (UNFCCC, 1997).The main target of the Kyoto Protocol is to reduce the
overall emissions from industrialized countries (referred as Annex I countries) from six
(6) selected greenhouse gases (CO2, CH4, N2O, HFCs, PFCs and SF6) by at least 5%
below the levels recorded in 1990 during the commitment period covering 2008 – 2012
(UNFCCC, 1997). In order to achieve this objective, the Kyoto Protocol allows the use
16
of three flexible mechanisms: Emissions Trading, Joint Implementation and the Clean
Development Mechanism (UNFCCC, 1997).
CDM provides incentives for developing countries to implement climate-change
mitigation projects, which must be compatible with and supportive of the sustainable
development principles set at the national level. CDM defined in Article 12 of the Kyoto
Protocol, allows a country with an emission-reduction or emission-limitation
commitment under the Kyoto Protocol (Annex B Party) to implement an emission-
reduction project in developing countries. Such projects can earn saleable certified
emission reductions (CERs) credits, each equivalent to one tonne of CO2, which can be
counted towards meeting Kyoto targets (UNFCCC, 1997).
A tradable emissions permit system has been proposed as the most cost-effective
instrument that can combine the economic efficiency with the social and environmental
constraints. The system is based on the marginal abatement cost for each user. In a
tradable emissions permit systems, users are allowed to have a certain amount of
emissions. When two users have different marginal abatement costs, the users with a
lower cost can profit from selling their allowances when their emissions are under the
assigned limit. Users with higher abatement costs can comply with their limits and profit
by buying cheaper allowances. Both users can benefit from the trade until they reach the
point when their marginal abatements costs are equal for both of them (Blignaut, 2004).
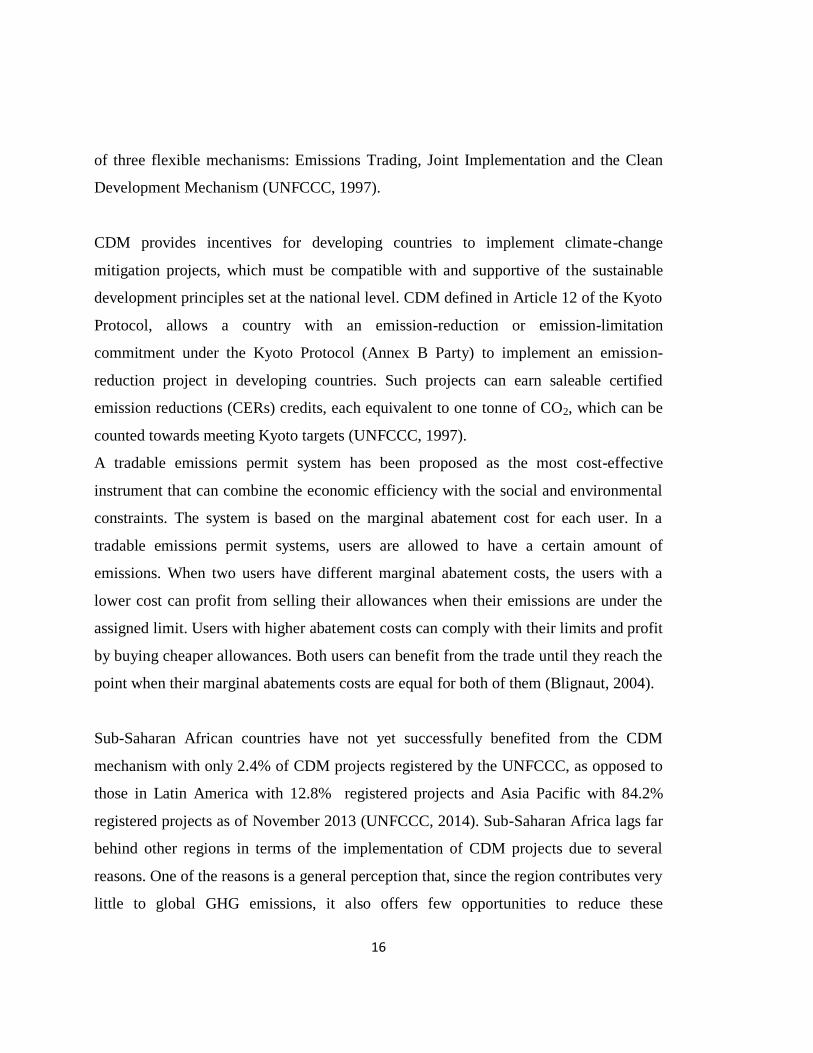
Sub-Saharan African countries have not yet successfully benefited from the CDM
mechanism with only 2.4% of CDM projects registered by the UNFCCC, as opposed to
those in Latin America with 12.8% registered projects and Asia Pacific with 84.2%
registered projects as of November 2013 (UNFCCC, 2014). Sub-Saharan Africa lags far
behind other regions in terms of the implementation of CDM projects due to several
reasons. One of the reasons is a general perception that, since the region contributes very
little to global GHG emissions, it also offers few opportunities to reduce these

17
emissions. Previous studies by Govinda, et al. (2010) found that sub-Saharan Africa
could develop 3,227 CDM projects, including 361 programs of activities, which could
reduce approximately 9.8 billion tons of GHG emissions during the CDM project cycles.
The study also estimates that the realization of this CDM potential could significantly
enhance sustainable development in the region as it would attract more than US$200
billion in investment and could generate US$98 billion of CDM revenue at a CER price
of US$10/tCO2. Another notable finding of the study is that the realization of this CDM
potential could supply clean electricity by doubling the current capacity and thereby
providing access of electricity to millions of people in the region (Govinda et al., 2010).
The transport sector is a major contributor of emissions that are harmful to atmosphere,
terrestrial ecosystems and human health. It’s estimated that an increase of 880 TWh of
electricity consumption will be realised in transport in 2030 compared with the reference
scenario. 90% of this occurs in passenger light duty vehicles (PLDVs) which results in
about 250 Metric tonnes of additional CO2 emissions (IEA, 2009).
Many African governments and environmentalists also note that the CDM’s rules favour
pollution-reducing projects rather than those that could help Africa cope with climate
changes, such as irrigation schemes, soil conservation and flood-control programmes.
Such projects were instead to be met by the Kyoto Protocol’s adaptation fund, financed
in part by a 2% levy on CDM credits (Fleshman, 2007). The development of CDM
projects is a daunting task for developers, especially of small-scale projects. The detailed
project cycle, emission baselines, regulations concerning grid connectivity and
requirements for additionality require skills and experience to succeed. A CDM project
activity is additional if anthropogenic emissions of greenhouse gases by sources are
reduced below those that would have occurred in the absence of the registered CDM
project activity (UNFCCC, 2001). Determination of return on investment, processes of
validation, verification and approval are complex issues that interested project
developers must become familiar with if they are to produce accurate Project Idea Notes
(PINs) and Project Design Document (PDDs). (Brunt & Knechtel, 2005)

18
One drawback of the CDM, however, is its high transaction costs and specialized skills
requirements that have tended to limit the participation of African countries and experts
to date (Karekezi, et al., 2009). Other previous research on the subject have showed that
the main constraints that hinder sub-Saharan African countries from benefiting for the
CDM initiatives come to a large extend from within the country (Kreuger, 2005)
2.5 Clean Development Mechanism in Kenya
As of November 2013, Sub-Saharan African countries had only 2.4% of CDM projects
registered by the UNFCCC, as opposed to those in Latin America with 12.8% registered
projects and Asia Pacific with 84.2% registered projects (UNFCCC, 2014). Africa has
now registered 249 projects registered consisting of 54% in the renewable sector as of
August 2014 which is still low compared to 1,156 projects registered by the Latin
America and 7,103 projects that have been registered by the Asia and Pacific region
(UNEP, 2014).
The government of Kenya acceded to the Kyoto Protocol in February 25, 2005, however
it took up to 2008 for the first CDM project to be registered from Kenya i.e. the 35 MW
Bagasse Based Cogeneration Project by Mumias Sugar Company Limited (UNFCCC,
2014). Olkaria III Phase 2 Geothermal Expansion Project and Olkaria II Geothermal
Expansion Project were registered in 2010 (UNFCCC, 2014). Lake Turkana 310 MW
Wind Power Project, Aberdare Range/Mt. Kenya Small Scale Reforestation Initiative
Kamae-Kipipiri Small Scale A/R Project, Aberdare Range/Mt. Kenya Small Scale
Reforestation Initiative, Kirimara-Kithithina Small Scale A/R Project and
Redevelopment of Tana Hydro Power Station Project were registered in 2011. Aberdare
Range/Mt. Kenya Small Scale Reforestation Initiative Kibaranyeki Small Scale A/R
Project, Nairobi River Basin Biogas Project, 60 MW Kinangop Wind Park Project,
Karan Biofuel CDM project – Bio residues briquettes supply for industrial steam

19
production, Optimisation of Kiambere Hydro Power Project, Corner Baridi Wind Farm,
Kipeto Wind Energy Project, Olkaria IV Geothermal Project and Olkaria I Units 4&5
Geothermal Project were registered in 2012 (UNFCCC, 2014). Energy efficiency
improvement project through modification of heat exchanger network at Kenya
Petroleum Refineries Ltd was registered in 2013 (UNFCCC, 2014). Restoration of
Degraded Lands through Reforestation in MAU Forest Complex, Restoration of
Degraded Lands through Reforestation in Aberdare Forest Complex & National Park
area and 5.1MW Grid Connected Wind Electricity Generation at Ngong Hills were
registered in 2014 (UNFCCC, 2014). The Implementation of CDM projects in Kenya
has progressed at a slower pace based on the analysis above. The Kenya Electricity
Generating Company (KenGen) commenced the development of green energy projects
under CDM in 2006 when the Company entered into a partnership with the World Bank.
The World Bank approved six project idea notes (PIN’s) of the nine that KenGen
presented but the first KenGen project was registered in 2010 and the latest was
registered in 2014 which demonstrates that the process takes long and hence the need to
carry out this study. The need for specialized skills requirements has been shown by
Karekezi, et al. (2009) to limit the participation of African countries.
2.6 Clean Development Mechanism Implementation at KenGen
The Kenya Electricity Generating Company (KenGen) commenced the development of
green energy projects under CDM in 2006 when the Company entered into a partnership
with the World Bank, (Kollikho, 2008). The World Bank approved six project idea notes
(PIN’s) of the nine that KenGen presented. Out of these six projects as detailed by table
2.1 have been registered by UNFCCC and the World Bank has provided technical
support on some of the current projects.

20
Table 2.1: KenGen CDM registered projects
No.
Project
Registration
Date Project Title
Estimated
Emission
Reductions
(tonnes of CO2e)
Project
Commissionin
g Dates
1 04-Dec-10
Olkaria II
Geothermal
Expansion Project 149,632 15/03/2010
2 11-Oct-11
Redevelopment of
Tana Hydro Power
Station Project 25,680 23/12/2010
3 24-Oct-12
Optimisation of
Kiambere Hydro
Power Project 41,204 5/09/2009
4 19 May -14 Ngong Wind 9,941 21/08/2009
5 28-Dec-12
Olkaria IV
Geothermal Project 651,349
Expected in
2014
6 28-Dec-12
Olkaria I Units 4&5
Geothermal Project 635,049
Expected in
2014
Source: UNFCCC, 2014
The current generation mix at KenGen indicated in Table 2.2 comprises of 80.84%
renewable energy from hydro, geothermal and wind (KenGen, 2014).

21
Table 2.2: KenGen’s Existing Generation Facilities
Generation Type Installed Capacity (MW) Percentage Contribution (%)
Hydro 819.9 61.31%
Geothermal 256.1 19.15%
Thermal 256.2 19.16%
Wind Turbine 5.1 0.38%
Total 1,337.30 100
Source: (KenGen, 2014)
The potential for KenGen to consider more projects for CDM is therefore feasible based
on research that has shown that the composition of CDM projects in Africa is 54%
renewable energy as indicated by Figure 2.4, UNEP (2014).
Figure 2.4 Categories of CDM projects in Africa
Source: UNEP (2014)
The sale of certified emissions reductions (CER’s) generated by the CDM projects will
act as a catalyst to focus on renewable energy in the country. The rural communities
living in and around the project areas are also expected to benefit from CDM projects

22
through implementation of community programs funded by carbon revenues. An
example is the constructions of classrooms, water lines and water pans for livestock by
KenGen in Olkaria after the registration of its first project (KenGen, 2014). The
implementation of clean energy CDM projects will also go a long way in reducing the
number of people with no access to electricity. The challenges of implementation of
CDM projects were identified by Kollikho, (2008) to include the few validators leading
to challenges in validation of CDM projects which was rarely achieved in less than three
months, lack of capacity to develop CDM projects and the monitoring protocol
comprising of monitoring procedures, calibration procedures and collection of despatch
data for emission reduction calculation. The implementation of the monitoring protocol
is the basis for the issuance certificate of CER’s and hence is in the critical path to the
success of CDM implementation.

23
CHAPTER THREE
METHODOLOGY
3.1 Introduction
Authority (See Appendix 7.1) was obtained from KenGen to carry out the research at the
sampled power stations while persons sampled for interview and survey during the
research were made aware of their right to respond, give information and withdraw at
any stage of the study and such decision was respected. Confidentiality has been upheld
during the research and the findings of this study shall be used for the benefit of those
who participated.
3.2 Research Design
In order to investigate the objectives of this study and answer the hypothesis, the
qualitative research method was employed as this was deem the most appropriate too for
this kind of research. The questionnaires shown in appendix 1, 2 and 3 were designed
and survey technique was used to collect data. The questionnaire document was
structured to facilitate easy and short answering of questions by the respondent and this
was expected to increase the chances of response from the targeted sample population.
The choices of questions for this investigation included questions on personal
background; age- lowest range was 18 - 30 and highest was 51-60; gender- male/female;
education level (Diploma, HND, Bachelors, Masters and Doctor of Philosophy ),
duration of employment (less than 10 years to more than 25 years), area of operations
(Head Office, Tana, Olkaria, Kiambere and Ngong Wind).
Specific questions on variables related to the CDM Implementation process as shown by
figure 2.1 were also developed. The choices of questions and targeted sample was aimed
at the assessment of challenges related to CDM Implementation at KenGen covering the
policy level, CDM implementation and level of awareness with respect specific stages of
the CDM process. The rating scale varied from “Most Important” to “Absolutely Not

24
Important”. Please see the Appendix 1, 2 and 3 for full details of the questionnaire. The
questionnaires were tailor made to suit the various cadres of KenGen staff related to the
CDM process comprising of head office team who are expected to shape the policy
direction of the company, the Environment and CDM department team with respect to
the expert opinion on CDM process and finally the operations team who run the
generation component of KenGen business but are also expected to know the impact of
the power plants running to CDM process.
The questionnaires were administered to the employees that were chosen for the
research based on their involvement in CDM related projects and representation of all
CDM project areas via mail and followed up with individual phone calls. The choice of
respondents who are involved in the CDM process was expected to enhance the potential
of having a response based on prior interaction with the subject. Secondary data was
reviewed from current information from scientific journals, research project reports,
publications, Project Design Documents (PDD) of the KenGen CDM projects and public
information from the UNFCCC and UNEP websites in order to determine the process of
CDM Implementation process.
The study focus considered was in three broad areas as indicated in section 3.2.1 to
3.2.3.
3.2.1 Determination of the level of awareness with regard to implementation of
CDM
The level of awareness among key persons in the company and whether the level of
awareness plays a role in the CDM implementation process was determined during this
study by use of the developed questionnaire and interviews with the program managers
at the respective areas of operations within the company where CDM projects have been
implemented as detailed by the study sites as described in section 3.4.

25
3.2.2 Determination of organizational, administrative and policy issues that
impede the implementation of CDM projects
In order to appreciate the organization constraints limiting the implementation of CDM
projects at KenGen, the developed questionnaire was administered to the respondents’.
Secondly CDM officers who are tasked with implementation of CDM projects at
KenGen were interviewed. Data on the geographical distribution of CDM project
activities and role of actors in the CDM process was obtained through the official
website of the United Nations Framework Convention on Climate Change
(https://cdm.unfccc.int/). This website makes data available on all projects in the CDM
project cycle including validation and registration process.
3.2.3 Determination of challenges faced by KenGen in relation to the rules and
procedures of CDM implementation
Literature on policy analysis, evaluation and the role of actors in the CDM process was
studied to develop an analytical framework for the empirical data interpretation.
Thereafter the challenges faced by KenGen related to rules and procedures of the CDM
projects implementation process were determined. Secondary data was also reviewed in
the course of the study to understand the CDM Process. The reviewed data came from
current information from scientific journals, research project reports, publications,
Project Design Documents (PDD), project validation reports and project monitoring
reports for the KenGen CDM projects.
3.3 Sampling
3.3.1 Sample Size determination
A non-probability or judgmental sampling technique was adopted with focus on the
divisions/department within the Company where the four CDM projects have been
implemented. This was deemed as the appropriate technique due to the technical nature
of the subject under investigation. The respondents were expected to possess the

26
required knowledge of the subject matter and therefore the sample population comprised
of representatives from a team of staff that have a direct link/familiar with KenGen
CDM projects as shown by the Table 3.1. The study sample covered staff representatives
comprising of top management (Directors & Managers), middle management (Chief
Officers) and other staff members (Officers). The Sample was therefore purposively
chosen based on their experience and proximity to projects that had a CDM component
and this was deemed to be likely to give feedbacks that will contribute to improvement
of the CDM process in KenGen.

27
Table 3.1: The sample population
Sampled Staff Members Sample
Population
(%)
Total
Population of
Potential
Respondents
Responsibility with
respect to CDM
Projects
Directors 1 (11.11%) 9 Leadership and Policy
Matters
Managers 5 (22.73%) 22 Leadership and Policy
Matters
Capital Planning and
Strategy team
1 (12.5%) 8 Strategy and Planning
Environment and CDM
team
5 (45.45%) 11 CDM Project
development and
Monitoring
Operation Team in Olkaria
II power station
5 (27.78%) 18 Plant Operations and
Monitoring
Olkaria II Steam Field
Management and
Laboratory
4 (26.67%) 15 Plant Operations and
Monitoring
Operation Team in Tana
power station
2 (28.57%) 7 Plant Operations and
Monitoring
Operation Team in Ngong
power station
1 (33.33%) 3 Plant Operations and
Monitoring
Operation Team in
Kiambere Hydropower
project
2 (25%) 8 Plant Operations and
Monitoring
Total 26
(25.74%)
101
3.4 Description of Study Site
The study was carried out at the Kenya Electricity Generating Company installations
comprising of the head office located at Stima Plaza, Phase 3, Kolobot Road, Parklands
and the specific generation sites where CDM projects have been implemented and

28
registered by the UNFCCC up to 2014. The head office plays an administration role in
all of KenGen’s operations. All policies and programs are ordinarily initiated,
implemented and monitored by a team of senior managers based at the head office. The
research therefore incorporated a team of senior staff at the head office as well as the
operation sites as detailed by the results in chapter 4.
The registered projects visited were the 35 MW Olkaria II geothermal expansion project,
the 20 MW re-development of Tana hydro power, 20 MW optimization of Kiambere
hydropower project and the 5.1 MW Ngong 1 wind power project.
The KenGen CDM registered projects which are located in various parts of the country
that were considered in this study are as detailed in sections 3.4.1, 3.4.2, 3.4.3 and 3.4.4.
3.4.1 The 35 MW Olkaria II geothermal expansion project
The Olkaria II Geothermal Expansion Project located in the Rift valley as shown in
figure 1.7 was developed with an objective to increase the capacity of the existing
Olkaria II Geothermal Power Plant by adding a third generating unit of 35MW. Prior to
the project implementation Olkaria II had an installed capacity of 70 MW (2 x 35MW)
and its steam gathering capacity could produce approximately 98 MW. To make use of
this surplus steam KenGen added a third generating unit (Unit 3) of 35 MW at Olkaria
II. A part from the increased generating capacity, the project was expected to result in
greenhouse gas (GHG) emission reductions by displacing fossil fuel-based electricity
generation in the Kenyan grid with clean geothermal power.
The project activity is located at Latitude 0 51” 45” and Longitude 36 17” 55” and lies
within Kenya’s Rift Valley as shown by Figure 3.1

29
Figure 3.1 Location of Olkaria II Expansion Project
3.4.2 The 20 MW Re-development of Tana hydro power project
The Redevelopment of Tana Power Station Project involved rehabilitation through
replacement of the existing Tana power station which was a run-of-river hydropower
generation plant. The project utilises water from the Tana and Maragua Rivers to
generate electricity. The Tana power station originally had an installed capacity of 14.4
MW. At the completion of the project it was expected to increase capacity to 20MW.
The redevelopment project was expected to have a net electricity generation for export
to the grid amounting to 130.3 GWh per year and greenhouse gas (GHG) emission
reductions by displacing fossil fuel-based electricity generation in the Kenyan grid with
clean hydropower.

30
The project activity is located at Latitude 9913468 N and Longitude 306523 E. The Tana
power station lies just upstream of the confluence of the Tana and Maragua Rivers at the
end of the Masinga Reservoir as shown by Figure 3.2
Figure 3.2 Location of Tana Power Station
3.4.3 The 20 MW optimization of Kiambere hydropower project
The Optimisation of Kiambere Hydro Power Project involved rehabilitation of Kiambere
Power Plant including upgrading of the turbines with new efficient runners at the
existing Kiambere power plant. The existing (2 x 72 MW) turbines were replaced with
(2 x 84.5 MW) turbines with new efficient runners. The project activity was expected to
result in greenhouse gas (GHG) emission reductions by displacing fossil fuel-based
electricity generation in the Kenyan grid with clean hydropower. Emission reductions

31
associated with the project activity was expected from the additional 20 MW of
contracted capacity.
The project activity is located at Latitude 0° 38' 24" S (-0.6400) and Longitude 37° 54'
36" E (+37.9100). The Kiambere power station is the last of the five hydropower
stations on the Tana River as indicated by Figure 3.3
Figure 3.3 Location of Kiambere Power Station
3.4.4 The 5.1 MW Ngong 1 wind power project
The Project is a newly built wind farm located in Kajiado District. The project comprises
of six (6) Vestas V52 turbines having a power rating of 850kW. The project involves the
generation of electricity through renewable energy i.e. wind energy at the Ngong Hills in
Kenya, to displace grid electricity generated by fossil fuel based electricity. The project
activity was expected to result in greenhouse gas (GHG) emission reductions by
displacing fossil fuel-based electricity generation in the Kenyan grid with clean wind
power.
32
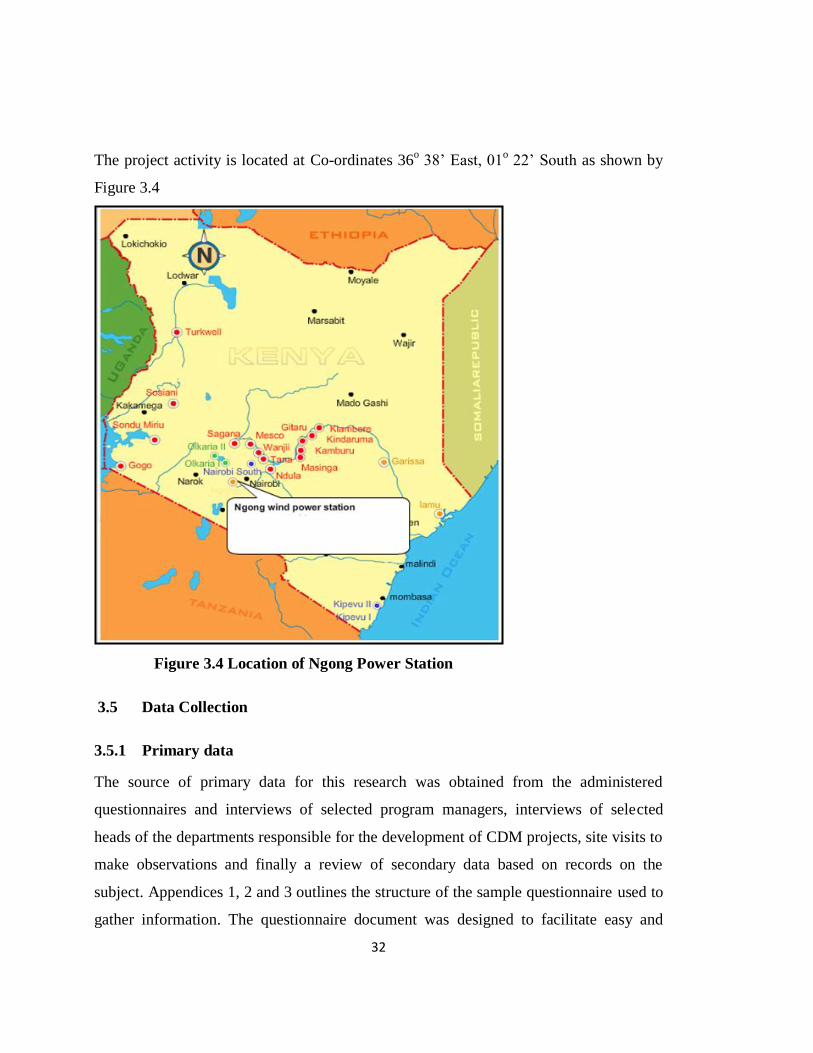
The project activity is located at Co-ordinates 36o 38’ East, 01
o 22’ South as shown by
Figure 3.4
Figure 3.4 Location of Ngong Power Station
3.5 Data Collection
3.5.1 Primary data
The source of primary data for this research was obtained from the administered
questionnaires and interviews of selected program managers, interviews of selected
heads of the departments responsible for the development of CDM projects, site visits to
make observations and finally a review of secondary data based on records on the
subject. Appendices 1, 2 and 3 outlines the structure of the sample questionnaire used to
gather information. The questionnaire document was designed to facilitate easy and

33
short answering of questions by the respondent based on the role played in the
implementation of CDM projects at KenGen.
3.5.2 Secondary data
Secondary data was extracted from current information from scientific journals, research
project reports, publications, Project Design Documents (PDD) of the KenGen CDM
projects and public information from the UNFCCC website. The role of actors in the
CDM process was studied to determine the organization constraints that impede CDM
implementation at KenGen.
3.6 Data Analysis and Presentation
The relationships between responses to different questions and frequencies of responses
was worked out using the Statistical Package for the Social Scientists (SPSS),
interpreted, and explained in terms of the general trends that emerged from the analysis.
The Statistical Package for Social Sciences (SPSS) 17.0 was used to analyze the data
collected. The descriptive statistics was applied to assess the level of respondent’s
awareness to the challenges of implementing of CDM projects at KenGen. The CDM
project implementation attributes, specific demographic variables and challenges was
analyzed to show the relationships using tables, graphs and charts as detailed in chapter
four.

34
CHAPTER FOUR
RESULTS AND DISCUSSIONS
4.1 Introduction
The study results discussed below were achieved based on descriptive statistics which
were applied to assess the level of respondent’s awareness to the challenges of
implementing of CDM projects at KenGen. The relationship between the CDM project
implementation attributes, specific demographic variables and challenges were based on
the results presented in graphs, tables, charts and analysed using the SPSS software.
4.1.1 Demographic Characteristics of the Respondents
The demographic characteristics of the respondents comprising of level within the
organization structure, age, gender, educational level, area of operation and years of
service with the company have been analysed and presented in Figure 4.1.
As shown by Figure 4.1, majority of the respondents (61.90%) were officers while the
other levels were adequately represented with chief officers (23.81%), managers
(9.52%) and directors (4.76%) covering the entire spectrum of the company. The study
findings as shown by Figure 4.2 found that 47.6% of the study participants were aged 41
– 50 years, 28.6% aged 31 – 40 years, 14.3% aged 51 - 60 years and 9.5% were aged 18
- 30 years. The results from the study therefore represent views of all the age groups
within KenGen with a higher number (76.2%) being those between 31 – 50 years, the
findings from this study therefore are based on a study population that is knowledgeable
as well as experienced with respect to the subject matter under study.
Gender representation comprised of 81% male and 19% female as shown by Figure 4. 3,
this is based on the technical nature of roles in the company hence the biasness towards
the male gender.

35
Figure 4.1: Distribution of respondents at KenGen
Figure 4.2: Age group of the respondents
Figure 4.3 Gender of the respondents
Level of education as shown in Figure 4.4 has shown that majority of the respondents
had university level education with 42.9% first degree, 38.1% with masters and 4.8%
with doctor of philosophy (PhD). Diploma at 9.5% and Higher National diploma at 4.8%
completed the spectrum of the respondent’s qualification. The study therefore found that
all the respondents had adequate education to respond to the research questions. The

36
feedback obtained from this study therefore demonstrates a true reflection of the
challenges of implementing CDM projects at KenGen. The study has established that
KenGen has a highly trained manpower. However due to the specialized nature of the
CDM process implementation, the team requires training specific to CDM processes.
Currently only 19% of the staff involved in the CDM projects implementations have
undergone CDM specific courses. Studies on implementation of CDM projects among
the African countries have been shown to face limitation due to the need for specialized
skills (Karekezi et al., 2009). It is therefore expected that the low level of training
specific to CDM among KenGen’s staff at 19% is likely to have an effect on the success
of its CDM projects.
Figure 4.4: Educational Level of the Respondents
Years of service KenGen was considered during this study as an indicator of the
experience levels of the study participants. According to the findings as detailed in
Figure 4.5, majority of the respondents (52.4%) had worked with the organization for
less than 10 years. The findings on education level (Figure 4.4) demonstrated a highly
trained team with 85% comprising of Bachelors, Masters and PhD degrees in the

37
respective fields of competence for the KenGen employees. The short duration with the
company is therefore taken care of by the skills and competence exhibited by the
participants. About 47.6% of the participants had more than 10 years of work experience
with the organization comprising 23.8% (More than 25 years), 14.3% (15-20 years),
4.8% (20 – 25 years) and 4.8% (10-15 years). The respondents to this study therefore
comprise of adequate mix experience which is an important contribution in achieving
the objective of establishing the challenges faced by KenGen in implementing CDM
projects by drawing on individual experience during the project implementation process.
Figure 4.5: Duration of employment of respondents

38
KenGen has implemented CDM projects across its business operation areas and
according to the findings as shown by Figure 4.6, 38.1% of the respondents operated at
Olkaria, 28.6% operated at Head Office, 19.1% operated at Kiambere, 9.5% operated at
Tana and 4.8% operated at Ngong Wind. The respondents to this study therefore
comprise of representatives from all the areas where the CDM projects have been
implemented at KenGen.
The study participants have a critical contribution by sharing their CDM experience at
their specific station and as shown by Figure 4.6, the study has achieved adequate
representation from the study population. The objective of study to establish the
challenges faced by KenGen in implementing CDM projects has therefore been achieved
based on the representation of the feedback from the KenGen teams operating from
various geographical locations.
Figure 4.6: Respondents Area of Operation

39
4.2 Level of awareness in relation to Implementation of CDM at KenGen
The implementation of CDM involves a number of critical steps including preparation of
the PDD, validation, monitoring, verification, issuance and payment as shown by figure
1.1 in chapter 1 of this report. The awareness by the stakeholders of what it takes to have
a successful implementation of a CDM project is an important contribution to addressing
the challenges of implementing CDM in KenGen. Kreuger (2005) in previous research
found that the main constraints that hinder sub-Saharan African countries from
benefiting for the CDM initiatives come to a large extent from within the country. The
level of awareness therefore forms an important link to successful implementation of
CDM projects.
This study has determined the level of awareness with regard to procedures of the CDM
among key persons at KenGen and whether the level of awareness plays a role in the
CDM implementation process. Based on the study, the level of awareness with regard to
various aspects of the CDM procedures have been determined including awareness on
availability of the climate change policy, CDM policy, the contribution of CDM projects
to climate change mitigation and sustainable development. The awareness of the study
participants on the CDM projects requirements including implementation, monitoring
and quality assurance requirements among others were determined using a qualitative
method. The findings with regard to the specific aspects of the CDM awareness within
the Company are as detailed in Sections 4.2.1, 4.2.2 and 4.2.3.
4.2.1 Respondents level of awareness on Climate Change and CDM Policy
CDM process and procedures form an important component of the success of a CDM
project, the study therefore sought to find out the level of awareness within KenGen on
specific aspects including Climate Change Policy/Strategy, CDM policy, training on
CDM process and benefits expected to be accrued from implementation of renewable
energy projects. According to the study findings as shown by Figure 4.7, about 57% of
the respondents indicated that KenGen did not have a Climate Change Policy/Strategy

40
while 29% indicated that KenGen had a Climate Change Policy/Strategy. As shown by
Figure 4.8, majority of the respondents (52.4%) indicated that KenGen had a CDM
Policy while 28.6% indicated that KenGen did not have a CDM Policy and the
remaining 14 % did not respond.
Figure 4.7 Knowledge of presence of a
Climate Change Policy/Strategy in
KenGen
Figure 4.8 : Knowledge of presence of
a CDM Policy in KenGen
The UNFCCC aims to mitigate the emission of GHG to the atmosphere and it is
therefore an important process that requires to be communicated to project implementers
(UNFCCC, 1997). The CDM mechanism can benefit KenGen and hence the need to
create awareness by carrying out training of staff involved in renewable energy projects.
The study however found that 76% of the respondents had not been trained on CDM
related training while the minority (19%) had undergone relevant CDM training as
shown by Figure 4.9. This creates a weakness in ensuring successful implementation of
CDM projects at KenGen given that the success of the CDM project depends on
compliance to requirements defined by the Kyoto Protocol. Specific methodologies and
tools that specify activities to be implemented by project participants prior to registration

41
of the CDM project by the executive board of the UNFCCC are critical components in a
CDM project process. Issuance of CER’s occurs only after successful implementation
and monitoring of the project as per the established procedures. The executive board
makes its decisions based on the third party evaluations done by designated operating
entities that are approved to validate and verify CDM projects.
Figure 4.9: Status of CDM related training among respondents
4.2.2 Level of awareness on Contribution of CDM Projects to Climate Change
Mitigation and Sustainable Development
According to the study as detailed in Table 4.1, the respondents agreed (Strongly agree
and agree) that implementation of the CDM projects contributed to sustainable
development (76%), reaching millennium development goals (81%) and reduction of
poverty (94%). In addition the respondents agreed that implementation of the CDM
projects contributed to improve local community livelihood (79%) and increase the
overall population living standards (73%).

42
Table 4.1 Benefits of implementation of CDM projects
CDM Benefits (%)
With N = 12
Strongly
agree Agree Neutral Disagree
Strongly
disagree
Sustainable Development 34 43 17 3 3
Reach the Millennium
Development Goals 33 48 17 10 2
Reduce poverty 41 53 0 3 2
Diminish social inequalities 10 23 40 20 7
Improve local community
livelihood 40 39 13 3 4
Increase the overall population
living standards 63 10 17 6 4
Studies by AfDB (2002) have showed that poorer developing countries are especially
vulnerable to climate change because of their geographic exposure, low incomes and
greater reliance on climate sensitive sectors particularly agriculture and pose multiple
threats to economic growth, wider poverty reduction, and the achievement of the MDGs.
CDM will therefore contribute to alleviation of poverty and achievement of the MDGs
as shown by the findings above.
The implementation of the CDM projects is expected contribute to sustainable
development (UNFCCC, 1997), this study confirms this objective with 76%
confirmation by the study participants. Sustainable development is a requisite criterion
for approval of CDM projects by NEMA. Compliance to this criteria by each individual

43
projects before issuance of the letter of approval by NEMA is a necessary step for
registration of CDM projects by the UNFCCC executive board.
4.2.3 Level of awareness with respect to the CDM Project requirements
The organizational awareness with respect to the various stages of the CDM process
plays an important role in equipping the staff with the relevant skills. According to the
findings detailed in Figure 4.10, 50% of the respondents were involved in project
monitoring, while 16.7% were involved in both the PDD development and project
implementation. A smaller number at 8.3% were involved in quality assurance yet this
is an important process of ensuring the success of the issuance of CER’s. Kreuger (2005)
in previous research on the subject indicated that the main constraints that hinder sub-
Saharan African countries from benefiting for the CDM initiatives come to a large
extend from within the country and therefore the limitations to implementation of
KenGen projects need to be addressed internally including involvement of key staff in
all the critical stages of the CDM project implementation.
Figure 4.10: Respondents’ role in KenGen’s CDM projects

44
The level of awareness with regard to CDM project requirements was found to be high
on some specific elements as detailed in Table 4.2. Project monitoring requirements
(80%) and compliance to requirements of methodologies (70%) were rated highly (very
high and high) by the respondents. The level of awareness with respect to quality
assurance and quality control requirements had 47% ratings by the respondents. In
addition, 50% of the respondents were undecided on their level of awareness in
calibration of measuring equipment requirements and 60% of the respondents were
undecided on their level of awareness in reporting and record control including data
backup requirements. The two aspects where the respondents were undecided indicate
an opportunity for KenGen to train its staff in order to enable the organization to benefit
from the CDM process as this aspects affects the success of the KenGen CDM projects
during the validation and verification phase.

45
Table 4.2: level of awareness with regard to CDM project requirements
CDM Project
Requirements (%)
With N = 12 Very high High Undecided Low Very low
Project Monitoring
Requirements 55 25 7 10 3
Compliance to
requirements of
Methodologies 10 60 20 5 5
Quality Assurance and
Quality Control
requirements 7 40 10 40 3
Calibration of measuring
equipment requirements 10 30 50 5 5
Reporting and Record
Control including data
backup requirements 0 35 60 3 2
The motivation for involvement was reviewed in this study and according to the study
findings as detailed in Table 4.3, 80% of the respondents indicated that training on CDM
Requirements was an important (Most Important and Important) influence on
involvement with the CDM project development and implementation. In addition, 55%
of the respondents indicated that involvement in the project operations was an important
influence on their involvement with the CDM project development and implementation.
Involvement in project development had 50% importance to the respondents for their
involvement in the CDM implementation.
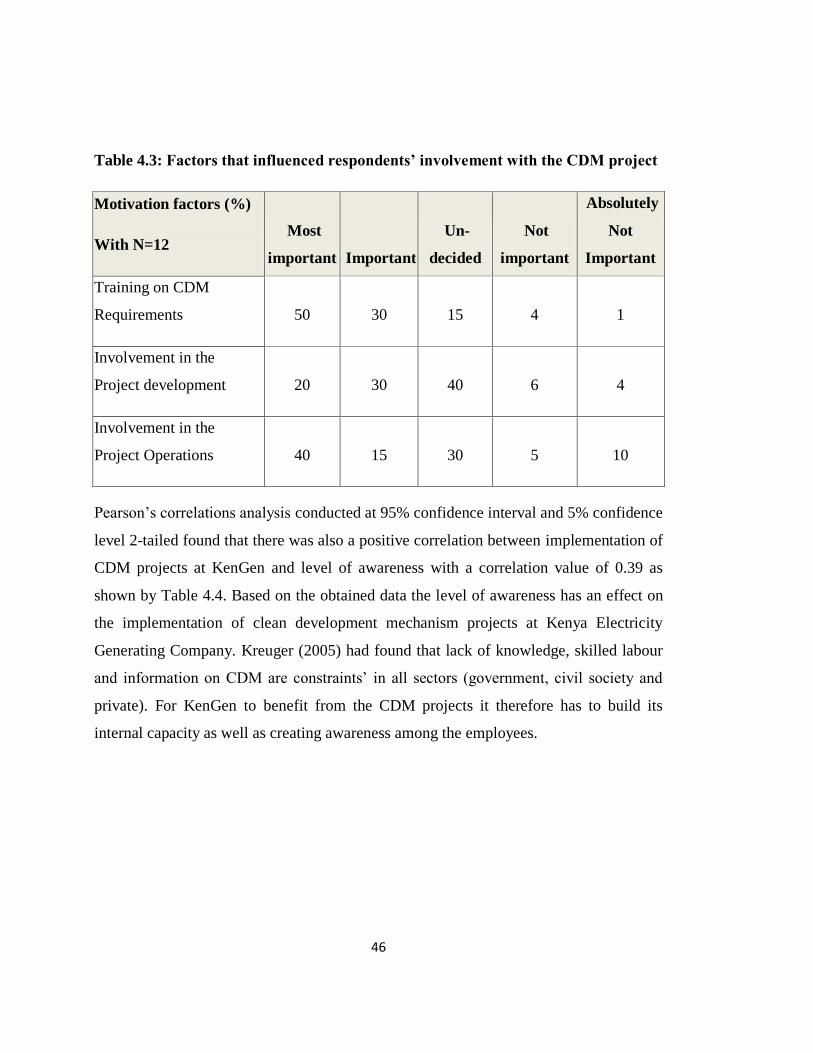
46
Table 4.3: Factors that influenced respondents’ involvement with the CDM project
Motivation factors (%)
With N=12 Most
important Important
Un-
decided
Not
important
Absolutely
Not
Important
Training on CDM
Requirements 50 30 15 4 1
Involvement in the
Project development 20 30 40 6 4
Involvement in the
Project Operations 40 15 30 5 10
Pearson’s correlations analysis conducted at 95% confidence interval and 5% confidence
level 2-tailed found that there was also a positive correlation between implementation of
CDM projects at KenGen and level of awareness with a correlation value of 0.39 as
shown by Table 4.4. Based on the obtained data the level of awareness has an effect on
the implementation of clean development mechanism projects at Kenya Electricity
Generating Company. Kreuger (2005) had found that lack of knowledge, skilled labour
and information on CDM are constraints’ in all sectors (government, civil society and
private). For KenGen to benefit from the CDM projects it therefore has to build its
internal capacity as well as creating awareness among the employees.

47
Table 4.4: Pearson’s Correlation Matrix
Implement
ation of
CDM
projects
Organizational
constraints
Rules and
procedures
Level of
awareness
Implementati
on of CDM
projects
Pearson
Correlation
1
Sig. (2-tailed)
Organization
al constraints
Pearson
Correlation
0.27 1
Sig. (2-
tailed)
0.02
Rules and
procedures
Pearson
Correlation
0.49 0.26 1
Sig. (2-
tailed)
0.02 0.11
Level of
awareness
Pearson
Correlation
0.39 0.07 0.11 1
Sig. (2-
tailed)
0.04 0.67 0.51
4.3 Organizational constraints that impede CDM implementation at KenGen
Organizations play a critical role in Implementation of CDM projects. At the inception
phase they prepare the project idea note (PIN) and/or Project design document (PDD)
and during validation by responding to findings by the independent auditors (DOE).
After the registration of the project the organization has the task of implementing the
project as stated in the PDD. Monitoring of the information that is required to quantify

48
the emissions reductions achieved by the project is a key requirement if the CDM
project activity is to succeed; the organization is therefore expected to ensure that
monitoring is carried out as specified by the CDM procedures and methodologies. The
monitoring process entails collection and archiving of all relevant data necessary for
establishing GHG sources occurring within the project boundary during the crediting
period. Finally the organization has to engage a DOE to carry out verification of its
project through an independent review and determination of GHG reductions that have
occurred due to the registered CDM project activity during the period.
Organizational constraints within organization like KenGen are therefore expected to
impede implementations of CDM. This study has therefore sought to determine if such
organization constraints exist within KenGen. The consideration in investment by the
company as well as the barriers and challenges being faced by KenGen has been
reviewed during this study. The findings discussed below describe the relationships
between implementation of CDM projects at KenGen and its organizational constraints.
4.3.1 Company Consideration in its Projects Implementation
According to the findings as depicted by Figure 4.11, 90% of the respondents indicated
that clean renewable energy was a consideration in investment decisions by the
company. The study has found that KenGen considers renewable energy as a focus for
its new KenGen projects with a majority of the study participants (95.2%). This finding
demonstrates that KenGen has a potential to benefit from implement CDM projects
related to the renewable energy sector.

49
Figure 4.11: Consideration of clean renewable energy in investment
decisions
4.3.2 Budgetary provision and Management Support
According to the study findings KenGen has made provision of budget within the
Environment and CDM department. The department has also assigned the
responsibilities for CDM project coordination to a dedicated team of staff with a clear
mandate to ensure successful implementation of its CDM Projects. Management support
was therefore found as adequate within the organization.
4.4 Challenges related to procedures of the CDM Project Registration
This study attempted to determine the challenges have hindered the implementation of
CDM projects as evidenced by the long duration that KenGen projects have taken to get
registered. The impacts of rules and procedures in the CDM project registration process
is one of the aspects that has been determined in this study as discussed by the results
below;

50
4.4.1 Barriers to CDM Projects Implementation at KenGen
According to the findings detailed in table 4.5, 93% of the respondents indicated that
long approval process were important (Most Important and Important) barriers to
implementing CDM initiatives for KenGen, 97% of the respondents indicated that lack
of adequate internal technical capacity e.g. development of PDD were important
barriers to implementing CDM initiatives for KenGen which has been previously
identified by Karekezi, et al., (2009) that specialized skills requirements have tended to
limit the participation of African countries and experts to date in CDM projects.
The findings also indicated that 90% of the respondents considered that complex and
tedious CDM procedures were important barriers to implementing CDM initiatives for
KenGen, 95% of the respondents indicated that CDM is a non-core business function
were important barriers to implementing CDM initiatives for KenGen and 77% of the
respondents indicated that lack of awareness on the CDM benefits were critical barriers
to implementing CDM initiatives for KenGen, the details of the responses to the barriers
are as detailed in Table 4.5.

51
Table 4.5: Barriers and Challenges to implementing CDM initiatives for KenGen
Barriers (%)
With N = 21 Most
important Important
Un-
decided
Not
important
Absolutely
Not
Important
Long Approval
Process
69 24 7 0 0
Lack of adequate
Internal technical
Capacity e.g.
development of PDD
74 23 3 0 0
Complex and tedious
CDM procedures
67 23 2 1 7
CDM is a non-Core
Business Function
55 40 5 0 0
Lack of awareness on
the CDM benefits
45 32 10 13 0
The study further sought to find out whether the CDM implementation was resourced
and the results showed that department responsible for implementing CDM projects had
a budget allocated towards facilitating and promoting CDM projects initiatives.
According to the study findings, all the respondents indicated that the department had a
budget allocated towards facilitating and promoting CDM Initiatives.
The results above show that organizational constraints have an effect on the
implementation of clean development mechanism projects at KenGen. Pearson’s
correlations analysis was conducted at 95% confidence interval and 5% confidence level

52
2-tailed similarly found that there was a positive correlation between implementation of
CDM projects at KenGen and organizational constraints as shown by a correlation
Figure of 0.26 as shown by Table 4.4.
A multiple regression analysis was further conducted to test the influence among
predictor variables on the implementation of CDM projects at KenGen using the
statistical package for social sciences (SPSS V 17.0) to code, enter and compute the
measurements of the multiple regressions. The multiple regressions between
implementation of CDM projects and the combined effect of the selected predictors
were as detailed in the results showed by Table 4.6;
Table 4.6: Multiple Regression Analysis
Model R R Square
Adjusted R
Square
Std. Error of
the Estimate
1 .797 .635 .626 .0614
a. Predictors: (Constant), Organizational constraints, Rules and procedures,
Level of awareness.
The analysis returned an R-Square (coefficient of determination) of 62.6%. The study
therefore finds that the changes in the implementation of CDM projects could be
attributed to the combined effect of the organization constraints, rules and procedures
and level of awareness.
4.4.2 Challenges of implementation of KenGen CDM Projects
According to the study findings as shown in Table 4.7, determination of monitoring
requirements (60%), baseline determination (60%), PDD development (60%) comprise
of the most critical stages that contributes to the challenges in development and
implementation of CDM projects at KenGen. Kreuger (2005) found that the main

53
constraints that hinder sub-Saharan African countries from benefiting for the CDM
initiatives come to a large extend from within the country.
Table 4.7: Challenges relating to implementation of the CDM projects
CDM
Implementation
Challenges (%)
With N =5
Most
important Important Un-decided
Not
important
Absolutely
Not Important
PIN Development 0 0 20 40 40
PDD Development 40 20 20 20 0
Feasibility study
formulation and
“business plans” 20 20 20 40 0
Demonstration of
Additionality 20 20 60 0 0
Baseline
Determination 20 40 40 0 0
Compliance to
requirements of
Methodologies 20 20 40 20 0
Determination of
Monitoring
requirements 20 40 40 0 0
Consultations with
the actors 0 40 60 0 0
Economic and
financial analysis 0 20 80 0 0

54
The barriers that inhibited KenGen from being pro-active in implementing CDM
projects have also been reviewed during this study and according to the findings as
detailed in Table 4.8, the respondents indicated that the long approval process (80%),
Complex and tedious CDM procedures (80%) and lack of adequate Internal technical
Capacity e.g. development of PDD (60%) are the critical factors inhibiting KenGen from
being pro-active in implementing CDM projects. Fleshman (2007) indicates that many
African governments and environmentalists consider the CDM’s rules as favouring
pollution-reducing projects rather than those that could help Africa cope with climate
changes, such as irrigation schemes, soil conservation and flood-control programmes.
KenGen being in the energy sector would therefore be expected to benefit from the
CDM process however the long approval process (80%), complex and tedious CDM
procedures (80%) and lack of adequate internal technical capacity (60%) still affect the
successful implementation of CDM projects.

55
Table 4.8: Inhibiting factors to KenGen pro-activeness in implementing CDM
projects
Inhibiting Factors to
KenGen’s CDM Pro-
activeness (%)
With N =5
Most
important
Important
Un-
decided
Not
important
Absolutely
Not
Important
Lack of funds 0 0 40 40 20
Long Approval Process 60 20 0 20 0
Lack of adequate Internal
technical Capacity e.g.
development of PDD 0 60 40 0 0
Complex and tedious CDM
procedures 0 80 20 0 0
CDM is a non-Core Business
Function 0 40 40 20 0
Lack of awareness on the CDM
benefits 0 20 40 0 40
The study findings as shown by Figure 4.12 identified that on average Complex and
tedious CDM procedures (80%), Lack of adequate Internal technical Capacity (65%)
and long approval process (50%) as the main challenges that affected the process of
validation and registration of KenGen’s CDM projects at Olkaria II, Tana, Kiambere and
Ngong Wind Power plants. At Olkaria II Expansion Project the study identified complex
and tedious CDM procedures (100%), lack of adequate internal technical capacity (80%)
and long approval process (60%) as the challenges with significant impact on the
Validation and Registration. Tana Redevelopment Project rated complex and tedious
CDM procedures (60%), lack of adequate internal technical capacity (60%) and long

56
approval process (60%) as the challenges with significant impact on the Validation and
Registration.
At Kiambere Optimization Project the study found that the factors that affected the
Validation and Registration of KenGen CDM Projects are complex and tedious CDM
procedures (80%), lack of adequate internal technical capacity (60%) and long approval
process (40%) while at the Ngong Wind Project the study identified complex and
tedious CDM procedures (80%), lack of adequate internal technical capacity (60%) and
long approval process (40%) as the challenges with significant impact on the Validation
and Registration.
Figure 4.12: Challenges of KenGen CDM Projects Validation and Registration
The ANOVA results found the probability value of 0.0001 (p < 0.05) with a mean
square of 3.13 which indicates that the model is statistically significant in explaining the
influence of organizational constraints, rules and procedures and level of awareness on

57
implementation of CDM projects considering that the P-value is less than .05 at the 95%
level of confidence. The F critical at 5% level of significance was 2.96 since F calculated
is greater than the F critical (value = 2.83), this shows that the overall model was
significant.
Table 4.9: ANOVA results of the regression analysis between implementation of
CDM projects and predictor variables
Model Sum of Squares df Mean Square F Sig.
1 Regression 12.236 3 3.132 2.958 .0001
Residual 92.936 73 .668
Total 115.081 76
a. Predictors: Organizational constraints, Rules and procedures, Level of awareness.
b. Dependent Variable: Implementation of CDM projects.
The regression coefficients analysis as shown by Table 4.10 has established that taking
all factors into account (rules and procedures, level of awareness and organizational
constraints) constant at zero implementation of CDM projects will be 4.84. The findings
presented also show that taking all other independent variables at zero, a unit increase in
rules and procedures would lead to a 0.66 increase in implementation of CDM projects.
Further, the findings shows that a unit increases in level of awareness would lead to a
0.47 increase in implementation of CDM projects. In addition, the findings show that a
unit increase in organizational constraints would lead to a 0.349 increase in
implementation of CDM projects. Overall, organizational constraints had the least effect
on implementation of CDM projects and rules and procedures had the highest effect.
Considering that the P-value is less than .05 at the 95% level of confidence for the three
variables as shown by Table 4.10 (0.03, 0.01 and 0.03) it means that the model is

58
statistically significant in explaining the influence of the level of awareness, procedures
and organizational constraints on implementation of CDM projects at KenGen.
Table 4.10: Regression coefficients implementation of CDM projects and the
variables
The relationship between variables and implementation of CDM projects at KenGen was
also analysed using Chi – Square. The analysis looked at the relationship between
Organizational constraints, Rules and procedures, Level of awareness and
implementation of CDM projects at Kenya Electricity Generating Company. The
statistical relationships were as shown by Table 4.11.
Model
Unstandardized
Coefficients
Standardized
Coefficients
B Std. Error Beta t Sig.
1 (Constant) 4.84 0.52 4.31 0.000
Level of awareness +0.47 0.23 0.24 3.35 0.03
Rules and procedures +0.66 0.16 0.63 3.26 0.01
Organizational constraints +0.35 0.19 0.15 3.38 0.03
a. Dependent Variable: Implementation of CDM projects

59
Table 4.11: Chi-Square tests results on relationship between challenges and
implementation of CDM projects at Kenya Electricity Generating Company
Chi-Square Tests
Value Df
Asymp. Sig. (2-
sided)
Pearson Chi-Square 38.32 9 .001
Likelihood Ratio 39.18 9 .000
Linear-by-Linear Association 10.52 1 .001
N of Valid Cases 38
The Chi –Square results as indicated in the Table 4.11 above showed that the chi-
squared test statistic is 38.32 with an associated p of 0.001 (P<.05). The P value of 0.001
is statistically significant in explaining the influence of the variables on implementation
of CDM Projects considering that the P-value is less than .05 at the 95% level of
confidence. The results therefore show that there is a relationship between
implementation of CDM projects and organizational constraints, procedures and level of
awareness. This finding has been confirmed by similar studies by Ichihara and Uchida,
(2014) which found that the International level carbon market barriers and International
CDM policies and rules are major barriers.
4.4.3 Approval of KenGen CDM Projects by NEMA
The designated national authorities (DNA’s) are organizations assigned by the national
governments the role of approving proposed CDM projects and ensuring that the
projects contribute to sustainable development. Obtaining host country approval is a
critical step in the CDM project cycle; without it, a project is not eligible for the CDM.
This approval is provided in writing through a Letter of Approval that confirms that the

60
host country has ratified the Kyoto Protocol, the host country's participation in the CDM
is voluntary and confirmation that the project contributes to the host country’s
sustainable development (UNFCCC, 1997).
The Kenyan DNA role has been assigned to NEMA. From the study NEMA was found
to be supportive of the CDM process with majority of the respondents (60%) in the four
KenGen’s CDM projects indicating that NEMA was supportive of the CDM process.
The approvals of KenGen CDM projects according to the study took between 0 – 3
months after request as detailed in Figure 4.13.
Figure 4.13: NEMA’s support for KenGen CDM process
The duration is a shorter period compared to the duration it takes to register KenGen
CDM projects which is an average of 1,307 days from start of public comments to
registration (UNFCCC, 2014). The finding therefore indicates that NEMA has supported
the implementation of KenGen CDM projects although other researchers had indicated
that DNA’s lack clear guidelines in their decision making partly due to inadequate
staffing (Ellis & Kamel, 2007).

61
CHAPTER FIVE
CONCLUSIONS AND RECOMENDATIONS
5.1 Conclusions
The objective of this study was to identify the challenges of CDM implementation at
KenGen. CDM implementation is a catalyst for enhancing sustainable development
potential especially in the power sector. In order to meet this broad objective the study
sought to determine the level of awareness with regard to procedures of the CDM,
KenGen’s organizational constraints that impede the implementation of Clean
Development Mechanism projects and the challenges faced by KenGen in relation to the
rules and procedures of the CDM process in the CDM projects registration process.
The study findings identified low awareness levels among key persons in relation to
KenGen’s CDM projects with regard to specific CDM implementation requirements
namely; quality assurance/quality control, calibration of measuring equipment, record
control and data backup. This has an impact on the success of the CDM projects given
that CDM is a regulated market mechanism that requires the highest level of compliance
to established procedures. The CDM projects are verified independently by DOE’s and
lack of understanding of requirements would lead to delays in completion of the CDM
project process when specific requirements are not verifiable at the time of the audit.
On the organization front the study has found that KenGen considers renewable energy
as a focus for its new KenGen projects as part of mitigation and adaptation to climate
change as evidenced by the consideration of clean renewable energy in investment
decisions by the company.
According to the study findings, KenGen has made provision for budgetary resources
within the Environment and CDM department. The department has also assigned the
responsibilities for CDM project coordination to a dedicated team of staff with a clear
mandate to ensure successful implementation of its CDM Projects. Management support

62
was therefore found as adequate within the organization. It was however noted among
the project implementation teams that CDM is considered as a non core process (i.e. its
not part of the power generation).This creates a barrier to successful implementation of
KenGen’s CDM projects since its not given the seriousness the project deserves as
evidenced by the potential to provide additional revenue to the organization.
The study also considered the challenges posed by rules and procedures in the CDM
process. The study findings identified complex and tedious CDM procedures, lack of
adequate internal capacity and the long approval process as the three main challenges at
the development stage of KenGen CDM projects. At the monitoring phase, knowledge
of specific project requirements to be monitored has been identified as a weakness. This
is a critical stage that determines whether the verification process will be successful
leading to payment for the emission reduction and needs to be addressed by KenGen.
The support of the regulatory body responsible for CDM approval in Kenya (NEMA)
was positively reported by the respondents with the KenGen CDM projects getting
approval within three months which is a shorter period compared to the duration it takes
to register KenGen projects at an average of 1,307 days.
Pearson’s correlations analysis conducted at 95% confidence interval and 5% confidence
level 2-tailed has found that there was a positive correlation between implementation of
CDM projects at KenGen and organizational constraints with a correlation figure of
0.26, implementation of CDM projects and rules and procedures of the CDM process in
the CDM projects registration process with a correlation figure of 0.48 and correlation
value of 0.39 for implementation of CDM projects and level of awareness. The
implementation of CDM projects had a positive correlation value of 0.390 with level of
awareness. The Chi –Square test shows a statistic of 38.32 with an associated p of 0.001
(P<.05). The ANOVA results similarly found the probability value of 0.0001 (P < 0.05)
at the 95% level of confidence. The P value of 0.001 is statistically significant in
explaining the influence of the organizational constraints, rules and procedures and level

63
of awareness on implementation of CDM Projects considering that the P-value is less
than .05 at the 95% level of confidence. R-Square (coefficient of determination) analysis
similarly demonstrated that 62.6% of the changes in the implementation of CDM
projects could be attributed to the combined effect of the organization constraints, rules
and procedures and level of awareness. This study therefore concludes that
organizational constraints, rules and procedures and level of awareness have an effect on
the implementation of clean development mechanism projects at Kenya Electricity
Generating Company.
Based on this analysis the null hypothesis is rejected and it’s therefore concluded there
are challenges that affect the implementation of clean development mechanism projects
at Kenya Electricity Generating Company.
5.2 Recommendations and way forward
5.2.1 Policy Recommendations
KenGen is placed at the pivotal role in Kenya being the single largest electricity
generator to contribute to mitigating the challenges of climate change by successfully
implementing renewable energy projects that can move our country to a low carbon
development trajectory while at the same time benefiting from CDM revenues.
The study findings have identified weaknesses that once addressed will enable KenGen
improve its CDM processes. The first area that is recommended for improvement is the
awareness levels on some Key parameters that impact on the success of the CDM
process. It’s recommended that the organization should put in place measures to address
the awareness level by employees on aspects of the CDM process especially the
employees involved in the CDM project implementation. Secondly to enable the success
of its CDM projects, its recommended that KenGen should provide of appropriate
training since the study found that majority of its project teams had not undergone any
CDM specific training and yet this forms a key pillar in implementation of CDM

64
projects. Thirdly sensitization of the project implementation teams on the potential
benefits should be enhanced to create a common understanding of the impact of the
CDM process in contributing to sustainable development while at the same time
providing additional revenue to the Company. This will enable the teams feel that CDM
is a core business process that generates revenue to the Company that is additional to the
traditional revenue from energy sales.
Lastly the internal technical capacity within the CDM implementation team with respect
to the rules and procedures that govern the implementation of CDM Projects needs to be
enhanced to ensure successful monitoring of KenGen’s CDM projects which will go a
long way in enabling the Company to get the requisite verification in a shorter period as
well as payments.
5.2.2 Recommendations for Further Research
The research has shown that Kenya has a potential to gain from the global intervention
to utilize the green energy technology to mitigate against the impacts of Climate Change
if only the constraints from within are addressed. Kenya as a country should in future
prepare early including having adequate technical capacity if we are to benefit from new
global initiatives geared towards combating the challenges of climate change. Based on
the research work a detailed study on adoption of new initiatives including the new
market mechanism expected to be adopted in 2015 and NAMA’s which is currently
ongoing should be carried out to ensure that Kenya does not lag behind in its
implementations’ as was the case with CDM.

65
REFERENCES
African Development Bank, (2002). Poverty and climate change: reducing the
vulnerability of the poor, a contribution to the eighth conference of parties to the
United National Framework Convention on Climate Change. Consultation Draft.
Africa Partnership Forum, (2007). Climate Change and Africa 8th
Meeting of the
Africa Partnership Forum Berlin, Germany.
Africa Partnership Forum, (2008). Climate Challenges to Africa: A Call for Action.
10th
Meeting of the Africa Partnership Forum in Tokyo. 13.
Agbogidi, O.M, (2011). Global Climate Change: A Threat to Food Security and
Environmental Conservation. British Journal of Environment & Climate Change,
1(3), 74-89.
Aluko, A.P., Adebagbo, C.A., and Ukpe, I.E, (2008). Implications of climate change
on sustainable forest management in Nigeria. Journal of Sustainable Environment
Management, (I), 53-58.
ASHRAE, (2005). Commercial/institutional ground source heat pump engineering
manual. Atlanta, GA: American Society of Heating, Refrigeration and Air-
conditioning Engineers, Inc.
Blignaut, J, (2004). Domestic Pollution Permit Allocation Regimes. The Clean
Development Mechanism and Future Emissions Trading Regimes: Economic
Opportunities for South Africa USAID / SOUTH AFRICA ATRIP PROJECT.
Brunt, C. and Knechtel, A, (2005). Delivering Sustainable Development Benefits
Through the Clean Development Mechanism, A background paper for the
COP-11 Side Event: Promoting the developmental benefits of the CDM: An
African Case Study, The Pembina Institute Canada
Defra, (2006). Energy resources. Doncaster, UK: Sustainable Development and
Environment.
Dessler, A.E. and Parson, E.A., (2006). The Science and Politics of Global Climate
Change: A guide to the Debate. New York: Cambridge University Press.

66
Ellis, J., and Kamel, S., (2007). Overcoming barriers to Clean Development
Mechanism projects. Organization for Economic Co-operation and Development
(OECD) and International Energy Agency (IEA).
Ichihara, J, and Uchida, T, (2014). Prioritizing Barriers to Implementing more CDM
Projects in Indonesia: An Application of AHP. Asian Social Science, 10(18), 191
– 201.
IEA, (2009). World Energy Outlook; OECD/IEA, Paris
IETA, (2009). Facing the Challenge of global climate change, News desk
Communications Limited London, 15 – 19.
IPCC, (2001a), Climate change 2001: Impacts, adaptation vulnerability, Contribution
of Working Group II to the Third Assessment Report of the
Intergovernmental Panel on Climate Change, UNEP/WMO, Geneva: IPCC.
IPCC, (2001b). Climate Change 2001: Synthesis Report. IPCC Third Assessment
Report: Climate Change 2001 R. T. a. t. C. W. T. Watson: IPCC, 184.
IPCC, (2007). Climate change 2007: the physical science Basis, Summary for Policy
makers. IPCC.
Fleshman, M, (2007). Africa seeks fair share of ‘green’ cash, Africa Renewal, 22 (2)
GoK, (2010). National Climate Change Strategy, Government of Kenya, Nairobi: GOK.
Govinda, R. T, Christophe G, Massamba T and Dayo F, (2010). Clean Development
Mechanism Potential and Challenges in Sub-Saharan Africa, Mitigation and
Adaptation Strategies for Global Change 15(1), 93-111
Karekezi, S., Kimani J., Onguru O. and Kithyoma W, (2009). Large Scale
Hydropower, Renewable Energy Adaptation and Climate Change: Climate
Change and Energy Security in East and Horn of Africa.
KenGen, (2014). 62nd
Annual Report and Financial Statements.
Kollikho, P, (2008). Opportunities and Challenges of Geothermal Clean Development
Mechanism Projects in Kenya. A paper presented at the Short Course on
Geothermal Project Management and Development, organized by UNU-GTP,

67
KenGen and MEMD-DGSM, at the Imperial Botanical Beach Hotel, Entebbe,
Uganda.
Kreuger, M, (2005). Challenges preventing francophone Sub-Saharan Africa’s
participation in the Clean Development Mechanism, MSC thesis unpublished
Sweden: Lund University.
Pagiola, S, and Bosquet, B, (2009). Estimating the Costs of REDD at the Country
Level, Version 2.3, Forest Carbon Partnership Facility, Washington: World
Bank.
Reddy, T, (2011). Carbon Trading in Africa, A critical Review. Institute of Security
Studies, Pretoria South Africa, 3-10.
Rosen, M, (2009). Key energy-related steps in addressing climate change. International
Journal of Climate Change Strategies and Management, 1(1), 31 – 41.
UNEP, (2014). United Nation Environmental Programme Risoe Centre.
Retrieved from: www.cdmpipeline.org
UNEP, (2013). The Emissions Gap Report 2013. United Nations Environment
Programme, Nairobi: UNEP.
UNESCO, (2009). Global Trends in Water-Related Disasters: an insight for
policymakers. Edited by Yoganath, Adikari and Junichi, Yoshitani.
International Centre for Water Hazard and Risk Management (ICHARM),
75352: Paris: UNESCO
UNFCCC, (1992). United Nations Framework Convention on Climate Change.
Retrieved from
http://unfccc.int/key_documents/the_convention/items/2853.php
UNFCCC, (1997). Kyoto Protocol to the Convention on Climate Change, New York:
UNFCCC, Retrieved from
http://unfccc.int/key_documents/kyoto_protocol/items/6445.php

68
UNFCCC, (2001). Modalities and procedures for a clean development mechanism, as
defined in Article 12 of the Kyoto Protocol. FCCC/CP/2001/13/Add.2. Decision
17/CP.7, Bonn: United Nations Framework Convention on Climate Change.
UNFCCC, (2011). United Nations Framework Convention on Climate Change official
Retrieved from http://unfccc.int/
UNFCCC, (2012). United Nations Framework Convention on Climate Change official
Retrieved from: http://unfccc.int/
UNFCCC, (2014). United Nations Framework Convention on Climate Change
Retrieved from: http://cdm.unfccc.int/
WEC, (2009). The world energy demand in 2020.
69
APPENDICES
Appendix 1: Letter of Approval to carry out research

70

71
Appendix 2: Questionnaire on KenGen’s Environmental Policy Matters
CONFIDENTIAL
Questionnaire
No……..
INVESTIGATION OF THE CHALLENGES FACING THE
IMPLEMENTATION OF CLEAN DEVELOPMENT MECHANISM PROJECTS
AT KENYA ELECTRICITY GENERATING COMPANY
Introduction:
I am an MSc Student at Jomo Kenyatta University of Agriculture and Technology
currently working on my research study for a master’s degree course in Environmental
Legislation and Management. This study is aimed at establishing the challenges of
implementing CDM projects at KenGen. The information given shall be treated with
confidence and shall be used only for this research.
Kindly fill in the information as accurately as possible seek clarification for any part or
whole of information not understood. You are free to give additional information related
to this topic or decline to respond to any part or entire questions without having to
explain your reasons.
Please give the most accurate answer to each question based on your experience.

72
a) Biographical details of the Respondent
1. Name
2. What is your current position in the organization
3. Age bracket
18 - 30 31 – 40 41 – 50 51 - 60
4. Gender
Male Female
5. Highest Educational/Professional Qualification
High School Certificate Diploma Certificate Higher National
Diploma Degree Certificate Masters Certificate PHD Certificate
6. Please indicate your business area/area of operations within the Company
Head Office Olkaria Tana Kiambere Ngong Wind
7. For how long have you been working with the Company in years
Less than 10 10- 15 15-20 20 – 25 More than 25
b) Policy Matters
1. Does KenGen have a Climate Change Policy/Strategy?
Yes No
2. Does KenGen have a CDM Policy?
Yes No

73
3. Is clean renewable energy a consideration in investment decisions by the
Company?
Yes No
4. Are you aware of the process of CDM project registration and its benefits to
KenGen?
Yes No
5. Have you undergone any CDM related training?
Yes No
6. Is renewable energy a focus for new KenGen projects as part mitigation of and
adaptation to climate change?
Yes No
7. What do you believe are the barriers to implementing CDM initiatives for
KenGen i.e. what factors do you believe inhibits KenGen from being pro-active
in implementing / initiating CDM projects? (Please tick as many as you want
and rank them from 1 to 5, with 1 being the most important)
Scale 1: Most Important 2: Important 3: Undecided 4: Not Important 5:
Absolutely Not Important
Rank
a) Lack of funds
b) Long Approval Process
c) Lack of adequate Internal technical Capacity e.g.
development of PDD
d) Complex and tedious CDM procedures
e) CDM is a non-Core Business Function
f) Lack of awareness on the CDM benefits
Thank you for your time and cooperation

74
Appendix 3: Questionnaire for KenGen’s Environment and CDM Team
CONFIDENTIAL
Questionnaire
No……..
INVESTIGATION OF THE CHALLENGES FACING THE
IMPLEMENTATION OF CLEAN DEVELOPMENT MECHANISM PROJECTS
AT KENYA ELECTRICITY GENERATING COMPANY
Introduction:
I am an MSc Student at Jomo Kenyatta University of Agriculture and Technology
currently working on my research study for a master’s degree course in Environmental
Legislation and Management. This study is aimed at establishing the challenges of
implementing CDM projects at KenGen. The information given shall be treated with
confidence and shall be used only for this research.
Kindly fill in the information as accurately as possible seek clarification for any part or
whole of information not understood. You are free to give additional information related
to this topic or decline to respond to any part or entire questions without having to
explain your reasons.
Please give the most accurate answer to each question based on your experience.

75
a) Biographical details of the Respondent
1. Name
2. What is your current position in the organization
3. Age bracket
18 - 30 31 – 40 41 – 50 51 - 60
4. Gender
Male Female
5. Highest Educational/Professional Qualification
High School Certificate Diploma Certificate Higher National
Diploma Degree Certificate Masters Certificate PHD Certificate
6. Please indicate your business area/area of operations within the Company
Head Office Olkaria Tana Kiambere Ngong Wind
7. For how long have you been working with the Company in years
Less than 10 10- 15 15-20 20 – 25 More than 25
b) Challenges related to implementation of CDM Projects
1. Which of these aspects from the CDM cycle were the most problematic during
implementation of the CDM projects (Please tick as many as you want and rank
them from 1 to 5, with 1 being the most important)

76
Scale 1: Most Important 2: Important 3: Undecided 4: Not Important 5:
Absolutely Not Important
Rank
a) PIN Development
b) PDD Development
c) Feasibility study formulation and “business plans”
d) Demonstration of Additionality
e) Baseline Determination
f) Compliance to requirements of Methodologies
g) Determination of Monitoring requirements
h) Consultations with the actors
i) Economic and financial analysis
2. Do you think that the implementation of the CDM projects could contribute to
each of the following Sustainable Development Indicators
(Please rank them from 1 to 5, with 1 being Strongly Disagree, 2 being
Disagree, 3 being Neutral, 4 being Agree and 5 being Strongly Agree)
Sustainable Development – Indicator Rank
a) Reach the Millennium Development Goals
b) Reduce poverty
c) Diminish social inequalities
d) Improve local community livelihood
e) Increase the overall population living standards
3. Does your department have a budget allocated towards facilitating and
promoting CDM Initiatives?
Yes No

77
What do you believe are the barriers to implementing CDM initiatives for
KenGen i.e. what factors do you believe inhibits KenGen from being pro-active
in implementing / initiating CDM projects? (Please tick as many as you want and
rank them from 1 to 5, with 1 being the most important)
Scale 1: Most Important 2: Important 3: Undecided 4: Not Important 5:
Absolutely Not Important
Rank
a) Lack of funds
b) Long Approval Process
c) Lack of adequate Internal technical Capacity e.g.
development of PDD
d) Complex and tedious CDM procedures
e) CDM is a non-Core Business Function
f) Lack of awareness on the CDM benefits
c) Validation and Registration of KenGen CDM Projects
What factors affected the Validation and Registration of KenGen CDM Projects
i.e. what factors do you believe inhibits KenGen from registering CDM projects?
(Please tick as many as you want and rank them from 1 to 5, with 1 being the
most important)
Scale 1: Most Important 2: Important 3: Undecided 4: Not Important 5:
Absolutely Not Important

78
a) Olkaria II Expansion Project
Rank
a) Lack of Management Support
b) Long Approval Process
c) Lack of adequate Internal technical Capacity
d) Complex and tedious CDM procedures
e) Lack of awareness on the CDM requirements
b) Tana Redevelopment Project
Rank
a) Lack of Management Support
b) Long Approval Process
c) Lack of adequate Internal technical Capacity
d) Complex and tedious CDM procedures
e) Lack of awareness on the CDM requirements
c) Ngong Wind Project
Rank
a) Lack of Management Support
b) Long Approval Process
c) Lack of adequate Internal technical Capacity
d) Complex and tedious CDM procedures
e) Lack of awareness on the CDM requirements

79
d) Kiambere Optimization Project
Rank
a) Lack of Management Support
b) Long Approval Process
c) Lack of adequate Internal technical Capacity
d) Complex and tedious CDM procedures
e) Lack of awareness on the CDM requirements
d) Approval of KenGen CDM Projects by NEMA
1. Is the Kenyan Designated National Authority (DNA) – NEMA supportive of the
CDM process?
Strongly Disagree Disagree Neutral Agree Strongly Agree
2. How long did the DNA project approval take for the following CDM Projects?
a) Olkaria II Expansion Project
0 – 3 Months 3 - 6 Months 6 Months – 1 Year 1- 2 years
More than two years
b) Tana Redevelopment Project
0 – 3 Months 3 - 6 Months 6 Months – 1 Year 1- 2 years
More than two years
c) Ngong Wind Project
0 – 3 Months 3 - 6 Months 6 Months – 1 Year 1- 2 years
More than two years

80
d) Kiambere Optimization Project
0 – 3 Months 3 - 6 Months 6 Months – 1 Year 1- 2 years
More than two years
Thank you for your time and cooperation

81
Appendix 4: Questionnaire for KenGen’s Operations Team
CONFIDENTIAL
Questionnaire
No……..
INVESTIGATION OF THE CHALLENGES FACING THE
IMPLEMENTATION OF CLEAN DEVELOPMENT MECHANISM PROJECTS
AT KENYA ELECTRICITY GENERATING COMPANY
Introduction:
I am an MSc Student at Jomo Kenyatta University of Agriculture and Technology
currently working on my research study for a master’s degree course in Environmental
Legislation and Management. This study is aimed at establishing the challenges of
implementing CDM projects at KenGen. The information given shall be treated with
confidence and shall be used only for this research.
Kindly fill in the information as accurately as possible seek clarification for any part or
whole of information not understood. You are free to give additional information related
to this topic or decline to respond to any part or entire questions without having to
explain your reasons.
Please give the most accurate answer to each question based on your experience.
a) Biographical details of the Respondent
1. Name
2. What is your current position in the organization

82
3. Please tick your age bracket
18 - 30 31 – 40 41 – 50 51 - 60
4. Please tick your gender
Male Female
5. Please indicate your highest Educational/Professional Qualification
High School Certificate Diploma Certificate Higher National
Diploma Degree Certificate Masters Certificate PHD Certificate
6. Have you undergone any CDM related training
Yes No
7. Please indicate your business area/area of operations within the Company
Head Office Olkaria Tana Kiambere Ngong Wind
8. For how long have you been working with the Company in years
Less than 10 10- 15 15-20 20 – 25 More than 25
b) Impact of Level of awareness with regard to Procedures of the CDM on
Project Implementation and Monitoring
1. Are you aware of KenGen CDM/Climate Change Policy/Strategy?
Yes No
2. Please indicate the type of CDM Project implemented in your area of Operations
Hydro Power Small Hydro Power (Less that 35 MW) Geothermal
Wind
3. Have you been Involved in the CDM process

83
Yes No
4. If yes please indicate your role in the development/implementation of the CDM
project
PDD Development Project Implementation Project Monitoring
Quality Assurance
5. Please rate how important each of the following factors influenced your
involvement with the CDM project development and implementation
Scale 1: Most Important 2: Important 3: Undecided 4: Not Important 5:
Absolutely Not Important
Motivation factors Rank
a) Training on CDM Requirements
b) Involvement in the Project development
c) Involvement in the Project Operations
4. Please rate your level of awareness with regard to the following CDM project
requirements. Rank them from 1 to 5, with 1 being low and 5 as high
Rank
a) Project Monitoring Requirements
b) Compliance to requirements of Methodologies
c) Quality Assurance and Quality Control requirements
d) Calibration of measuring equipment requirements
e) Reporting and Record Control including data backup
requirements
Thank you for your time and cooperation

84
Appendix 5: Publication and Conference Presentation
Metto, J. K, Njogu, P. M and Gatebe, E, (2015), Challenges facing
implementation of clean development Mechanism projects at Kenya
Electricity Generating Company (KenGen): Prime Journal of Social
Science (PJSS); ISSN: 2315-5051. 4(1) pp 946-952
Metto, J. K., (2015), Implementing Clean Development Mechanism Projects at
KenGen; Challenges and Opportunities: Proceedings of the KenGen
G2G Technical Seminar, Nairobi, Safari Park Hotel., July 08-10,
2015