invest ing · 61 report of the human resources and ... as well as significant acceleration toward...
TRANSCRIPT
PUBLIC SECTOR PENSION INVESTMENT BOARD 2017 ANNUAL REPORT
INVESTING

TABLE OF CONTENTS
53 Governance61 Report of the Human
Resources and Compensation Committee
74 Directors’ Biographies78 Senior Management
and Officers80 Consolidated 10-Year
Financial Review
81 Financial Statements and Notes to the Financial Statements
83 Management’s Responsibility for Financial Reporting
84 Investment Certificate85 Public Sector
Pension Investment Board Consolidated Financial Statements
121 Public Service Pension Plan Account
157 Canadian Forces Pension Plan Account
193 Royal Canadian Mounted Police Pension Plan Account
229 Reserve Force Pension Plan Account
3 Our Vision6 Chair’s Report8 President’s Report14 Fiscal Year 2017
Financial Highlights20 Investing Responsibly24 Key Corporate Objectives30 Diversity and Inclusion32 Management’s Discussion
of Fund Performance and Results

PSP INVESTMENTS | ANNUAL REPORT 2017 1
Investing is the very core of our vision, our mandate and our business. It’s about seizing opportunities and making the most of them for the funding of the public sector pension plans, in the best interests of contributors and beneficiaries – the men and women who have served Canada throughout their careers.
WE INVEST IN LONG-TERM PARTNERSHIPSWe invest in establishing long-term partnerships with industry leaders that have complementary skills and access to investment opportunities and with which we have aligned interests.
WE INVEST AS ONE PSPWe invest in building a talented, global and diverse team because we firmly believe it will lead to superior performance over the long term.
WE INVEST IN GIVING BACKWe empower our employees to invest time and energy in their communities through our PSP Gives Back program.
WE INVEST IN OUR GLOBAL FOOTPRINT We invest in the creation of offices in key financial markets to establish critical local connections and to improve local knowledge.
We believe that our all-encompassing approach to investing enriches the lives of pension plan contributors and beneficiaries, our employees, our partners and the communities of which we are a part in Canada and abroad.

ANNUAL REPORT 2017 | PSP INVESTMENTS 2
WHO WE AREThe Public Sector Pension Investment Board (PSP Investments) is one of Canada’s largest pension investment managers, with $135.6 billion of net assets under management as of March 31, 2017.
We are a Canadian Crown corporation that invests funds for the pension plans of the federal public service, the Canadian Forces, the Royal Canadian Mounted Police and the Reserve Force. Our headquarters are located in Ottawa and our highly-skilled and diverse team of more than 700 professionals works from offices in Montréal, New York and London.
WHAT WE DOPSP Investments’ mandate is to manage the pension funds transferred to it by the Government of Canada in the best interests of contributors and beneficiaries, and to maximize investment returns without undue risk of loss.
To that end, we manage a diversified global portfolio composed of investments in public financial markets, private equity, real estate, infrastructure, natural resources and private debt.
All amounts in Canadian dollars throughout the report unless otherwise specified.

PSP INVESTMENTS | ANNUAL REPORT 2017 3
Our vision is to be a leading global institutional investor that reliably delivers on its risk-return objective by focusing on a total fund perspective and always acting in the best interests of our Canadian sponsor and pension plan contributors and beneficiaries. As we pursue a larger global footprint, we will leverage our talent to deliver agile and efficient execution at scale and to become a sought-after enabler of complex global investments.
OUR VISION
Our Vision

FOR PEACE OF MIND
INVESTING
J. R. Gallant Lieutenant (Navy) Executive Officer, Fleet Diving Unit (Atlantic)

PSP INVESTMENTS | ANNUAL REPORT 2017 5
LIEUTENANT GALLANT CAN LOOK TO THE FUTURE WITH CONFIDENCEWe invest with the shared purpose of generating benefits for pension plan contributors and beneficiaries
“When I think about retirement, investing and security are synonymous;
they’re both about putting the right actions in place now to ensure
peace of mind in the future.”
As an Executive Officer for the Royal Canadian Navy’s Fleet Diving Unit, I take pride in ensuring
that the 110 people I work with have everything they need to be safe and successful. As they
move up through the ranks and take on more responsibility, my focus will always be on making
sure they are well equipped to handle as many different situations as possible.
With my family, it’s the same thing: I need to make sure that they are taken care of at all times,
whether I’m at home or deployed abroad. I want my children to get off to a great start and
to have access to the right kind of education and opportunities.
For me, investing is also about exploiting different opportunities to ensure I won’t need to
worry about money in the future, and that I can pursue the things I’m passionate about.
Knowing that the professionals at PSP Investments are managing assets set aside by the
Government of Canada for my retirement contributes to my peace of mind and will allow me
to shift my focus from my fleet to my family with confidence.
My pension will allow me to forget about my paycheques, and focus on pleasure: a volunteer
commitment to coaching football, which I plan on pursuing well into retirement.
James Gallant

ANNUAL REPORT 2017 | PSP INVESTMENTS 6
Our mission, after all, is to contribute to the long-term sustainability of the public sector pension plans for the ultimate benefit of the contributors and beneficiaries.
With that in mind, I am pleased to report that 2017 was a standout year with a total net portfolio return of 12.8%. This translates into a five-year net return of 10.6% and a 10-year net return of 6.0%, as well as significant acceleration toward Vision 2021. I could not be prouder of what the management team and every single one of the organization’s more than 700 employees accomplished.
BOARD ACTIVITIES
In fiscal year 2017, the Board successfully completed several key projects that were essential in supporting management toward its Vision 2021 goals. The Human Resources and Compensation Committee (HRCC), led by Diane Bean, undertook a special compensation plan review, which included performance benchmarks, threshold levels, and value-added objectives. The Governance Committee, led by Garnet Garven, conducted an extensive review of Board member remuneration and succession planning. Our Investment Committee, led by Timothy E. Hodgson, oversaw the creation of the new total fund portfolios. And our Audit Committee, led by William A. Mackinnon, was instrumental in overseeing the adequacy and effectiveness of the organization’s internal controls, as PSP Investments continues to undergo a period of tremendous growth.
THIS YEAR’S ANNUAL REPORT THEME REFLECTS OUR ALL-ENCOMPASSING APPROACH TO INVESTING AND OUR CONVICTION THAT IT LEADS TO BETTER RESULTS TO HELP FUND THE PENSION PLANS FOR CONTRIBUTORS AND BENEFICIARIES — THE MEN AND WOMEN WHO HAVE SERVED CANADA THROUGHOUT THEIR CAREERS.
A STANDOUT YEAR
Chair’s Report
PSP INVESTMENTS | ANNUAL REPORT 2017 7
Key Board projects included the following:
Compensation plan review
The HRCC provided oversight of an important compensation plan review in fiscal year 2017. The revised plan will pay employees appropriately for individual performance and discourage undue risk taking. It will also provide the Board and management with the tools and flexibility required to make the best reward decisions in an environment that is highly competitive for top-tier talent.
The HRCC also supported PSP Investments’ talent and diversity initiatives, both of which are extremely important to the Board. For example, women occupied 30% of senior roles in 2016, exceeding a national labour market availability rate (the share of women in the workforce from which employers can hire) of 27.4%. Members of visible minorities also increased from 15% in 2015, to 16.6% in 2016. Additionally, with the recent opening of the New York and London offices, PSP Investments is further broadening the scope of diversity and expertise throughout the organization.
Board remuneration and succession planning
With the assistance of an external compensation consultant, the Governance Committee conducted an extensive review of director remuneration. The review was designed to ensure PSP Investments continues to have the capacity to attract, retain and motivate high-quality directors with the experience and competencies required to govern a leading global institutional investor. As a result of the committee’s hard work, PSP Investments will continue to compensate its directors fairly for their important contribution. The committee has also been working diligently on succession planning for the coming years, including identifying the skills and competencies required for the filling of the vacant eleventh director position in the near term.
Total fund portfolios
In fiscal year 2017, with the oversight of the Investment Committee, PSP Investments created its total fund portfolios. These portfolios support the organization’s total fund perspective when developing investment strategies, making business decisions and managing risk, leverage and liquidity. They also provide increased flexibility, and enable a shift toward a more balanced consideration of both total risk and total return.
This means the organization is one important step closer to the “One PSP” vision put forward by André Bourbonnais, our President and CEO: By investing with a total fund perspective — instead of solely via specific asset classes — we can capture investment opportunities that align with our mandate even if they do not fit into a specific asset class.
LOOKING AHEAD
As we ramp up for fiscal year 2018, the Board fully supports André’s priorities in the areas of scalability, efficiency and talent.
Scalability refers to targeting larger deals and leveraging partners and investment platforms to scale up private investments and infrastructure. It is essential as PSP Investments is expected to reach $200 billion in assets under management by 2025.
Efficiency refers to having flexible processes, swift and reliable execution, and transparency and predictability. In fiscal year 2018, PSP Investments will continue to make significant strides toward increased operational efficiency. Management will implement initiatives to review the operating models of several departments, optimize processes, and implement new systems.
Furthermore, to sustain our growth, PSP Investments will make talent acquisition and development a key focus. In fiscal year 2018, the organization will develop its talent value proposition and revamp its talent acquisition strategy to attract the right global talent mix. We will also rewrite the rules to foster greater talent acceleration through growth and career development.
The Board looks forward to overseeing and guiding management to deliver on these priorities. As we saw with our successes last year, by ensuring a top-tier governance structure is in place, the Board will continue to provide effective and agile oversight in 2018.
Acknowledgements
In closing, on behalf of the Board, I would like to express my sincere thanks to the external nominating committee, mandated by the Government of Canada to identify and recommend qualified candidates to serve on our Board. As such, their work is essential to facilitating the Board’s succession planning. Maintaining a full contingent of high-calibre Board members is especially important for PSP Investments today, in a global environment that is increasingly politically and economically challenging and complex.
My fellow Board members once again provided exceptional support throughout the year. I would like to thank them for their strategic counsel, constructive attitude and unwavering dedication.
I would also like to thank PSP Investments’ world-class employees for their hard work and commitment, and senior management, whose expertise and vision are so effectively guiding the organization at this pivotal time in its history.
Michael P. Mueller Chair of the Board

ANNUAL REPORT 2017 | PSP INVESTMENTS 8
Thanks to a clear vision and well-thought-out plan, our employees are working as one to simultaneously carry out a broad range of strategic initiatives — with contributors and beneficiaries at the heart of everything we do.
As you will see throughout this report, we are doing something a little different this year. We have included a theme — Investing — to reflect our commitment to those contributors and beneficiaries, as well as our employees, partners, and the communities of which we are a part, in Canada and abroad.
In addition, we have included five stories featuring our people, and those whose lives we touch, to convey more about who we are — and our pride in what we do.
THIS IS A TRULY EXCITING TIME FOR PSP INVESTMENTS. WE ARE IN A STATE OF ACCELERATED EVOLUTION.
THE COURAGE OF OUR CONVICTIONS
President’s Report

PSP INVESTMENTS | ANNUAL REPORT 2017 9
A CULTURAL SHIFT
The market has recently become more challenging, and with it, our competition has become increasingly sophisticated. We responded with Vision 2021, our five-year strategic plan. This includes implementing our total fund perspective; increasing collaboration and knowledge sharing; seeking opportunities to invest innovatively and capture value; fostering relationships with partners; and continuously improving efficiency.
The fact that we have made progress on each of these fronts speaks to the strength of our organization, and the courage of our people. The types of employees we look for are those with innovative ideas and an entrepreneurial spirit. We need them to be empowered to share their insights, and take action.
This shift in our culture, which may have seemed like a revolution to some, was actually a natural evolution — the seeds were already there — and it was absolutely necessary if we were to raise the bar.
I am pleased to say, the results of our employees’ efforts are proof positive that Vision 2021 is within reach.
2017 RESULTS
For the year ending March 31, 2017, our portfolio return was 12.8% net of all costs. We delivered a net return of 10.6% on a five-year basis, exceeding our policy benchmark; and we exceeded our long-term return objective by delivering a net return of 6.0% on a 10-year basis. We also reached $135.6 billion of net assets under management at fiscal year end, and expect to manage $200 billion by 2025.
Our results reflect a combination of strong global markets and a strong performance in Public Markets, Private Debt, Real Estate, Infrastructure and Natural Resources. The total portfolio generated significant returns and, despite market volatility, proved resilient to the fallout from the UK Brexit referendum, the US presidential election and other
global macroeconomic factors (see more on p. 39). On the other hand, despite a formidable turnaround by Guthrie Stewart and his team, Private Equity’s performance remains a challenge. Though the asset class grew its portfolio by $3.4 billion, overall results were negatively impacted by certain legacy investments in technology and communications. We believe that a better constructed and more diversified portfolio will yield the expected performance in the short- to medium-term.
ADVANCING OUR STRATEGIC PLAN
As we continued to grow our assets under management and expand into new geographic markets, the entire organization worked together to advance the five strategic axes of our Vision 2021 plan:
Cultivate One PSP: In fiscal year 2017, with the oversight of the Investment Committee, PSP Investments created its total fund portfolios. These portfolios will allow us to pursue opportunities that will benefit overall performance, especially when the opportunity does not fit within one specific asset class. Cultivating One PSP is not limited to investment activities, however. It is also reflected in our commitment to the development of a common corporate culture of collaboration and teamwork, which is highlighted in the story featuring Tatiana Lewin, Director, Legal Affairs, on p. 22.
Improve our brand locally and internationally: Throughout the year, we made significant strides in defining PSP Investments’ identity and increasing our visibility with carefully targeted social media, traditional media and public speaking initiatives. In order to find the right partners to support our growth as we move into new markets, it is critical that our name be top of mind with a strong brand. To that end, I invite you to read about the relationship we are developing with AlixPartners on p. 12. It is a great example of the type of partnerships we are looking to create.

ANNUAL REPORT 2017 | PSP INVESTMENTS 10
Because defining our identity begins with how we operate internally, we also evolved our communications approach with employees to foster increased openness, dialogue and transparency. Employees are now fully aware of the role they each play in our strategy and business plan, and benefit from more direct and frequent interactions with senior management.
Increase our global footprint: In fiscal 2017, the New York office completed its initial hiring plan. We also opened our London office as our European hub, with top-tier teams in Private Equity, Private Debt, Real Estate and Infrastructure. Both offices combine expatriated PSP Investments employees from Montréal with locally sourced talent. As illustrated by the story featuring one of those expats — Patrick Charbonneau, Managing Director, Infrastructure Investments (Europe) — on p. 28, establishing our presence in these markets constitutes a long-term investment that puts us closer to larger, more complex deals. Having local, well-connected teams on the ground will also facilitate critical, local relationships and help us build strong strategic partnerships. In fiscal 2018, we plan to follow this up with an office in Asia.
Increase scalability and efficiency: We revisited the operating model of our public equities team and introduced a new Global Equity Research platform. With the new model, we will expand the internally managed active equity investment function and centralize the public equity research function. This will allow us to optimize knowledge sharing across all our teams, better manage risks across portfolios, and avoid duplication of research — giving us a decisive edge in the market place.
Develop our talent: The Human Resources team has been extremely active in fiscal year 2017 in its mission to help PSP Investments become an employer of choice. Aside from focusing on the creation of our new talent
attraction and retention strategy, they also reviewed our compensation plan. In fiscal year 2018, we will implement this new plan to encourage accountability, and better align organizational and individual performance, to reward outstanding results.
Looking ahead: Agility and flexibility
It is true that, as pension fund managers, our obligations are long term by nature. But having a long-term horizon does not mean we need to — or ought to — give up on flexibility. We must remain opportunistic and alert in order to capitalize on market cycles. This sometimes entails selling assets before they have reached full maturity, or investing in assets that do not fall within our traditional groups. Likewise, agility — our ability to respond quickly to seize more complex global transactions — will be ever more crucial going forward, as competition intensifies and the geopolitical landscape continues to shift.
The changes we have implemented in the last two years are empowering our people to embrace the organization’s mission, and fulfil our shared purpose of contributing to the financial security of the contributors and beneficiaries who have served Canada in their careers. The story of Lieutenant (Navy) James Gallant on p. 4 of this report embodies that shared purpose.
In fiscal year 2018, we will continue to build on the solid foundations created since PSP Investments’ inception. Efficiency and talent development strategies will be our next areas of focus as we aim to become more agile and flexible, and invest in our people by supplying them with the tools they need to grow.

PSP INVESTMENTS | ANNUAL REPORT 2017 11
ACKNOWLEDGEMENTS
I would like to thank our employees for their hard work and commitment to our organization, and for always keeping the best interests of pension plan contributors and beneficiaries at heart. Moreover, I’d like to praise them for the time they proudly invest in their communities, including as part of the PSP Gives Back volunteering initiative. I invite you to read the story on p. 18, in which Karine Dion, Senior Director, Business Planning, talks about her team’s experience at Montréal’s Welcome Hall Mission.
I’d also like to acknowledge the senior management team for expertly crafting and steering our strategic direction. Together, we are transforming PSP Investments from being one of the industry’s best-kept secrets, into a top-of-mind enabler of complex global investments.
Finally, I’d like to express my gratitude to the Board of Directors for the confidence they place in us, and for the oversight and guidance they provide. Their role in the implementation of Vision 2021 has been invaluable.
André Bourbonnais President and Chief Executive Officer
AGILITY — OUR ABILITY TO RESPOND QUICKLY TO SEIZE MORE COMPLEX GLOBAL TRANSACTIONS — WILL BE EVER MORE CRUCIAL GOING FORWARD, AS COMPETITION INTENSIFIES AND THE GEOPOLITICAL LANDSCAPE CONTINUES TO SHIFT.

IN LONG-TERM PARTNERSHIPS
INVESTING
Jay Alix Founder, AlixPartners
Guthrie Stewart Senior Vice President and Global Head of Private Investments, PSP Investments

PSP INVESTMENTS | ANNUAL REPORT 2017 13
At AlixPartners, our business is to support companies around the world with advisory services
when it really matters. When it really mattered for us, PSP Investments, together with other
partners, helped our firm acquire long-term capital and supporters for the future growth
of AlixPartners.
Since then, we are developing an enviable relationship. PSP Investments has rapidly become
a trusted business partner providing valuable input and judgement on strategy, leadership
and finance. Together, we collaborate on new ideas in line with our common vision for long-term
growth, we share knowledge on a wide breadth of industries, and we offer help in evaluating
investment opportunities.
This burgeoning partnership has allowed AlixPartners to aim its sights on a longer horizon,
where our goals are focused on building value through growing our company. If PSP Investments
isn’t already on the short list for an organization seeking long-term growth capital and a true
business partner, it should be.
Jay Alix
“Investing is about more than providing capital;
it’s an opportunity to build mutually beneficial relationships
that can create long-term value. PSP Investments
and AlixPartners are building a relationship that will
generate wide ranging benefits for years to come.”
PSP INVESTMENTS AND ALIXPARTNERSBuilding a solid partnership based on a shared vision for long-term growth

ANNUAL REPORT 2017 | PSP INVESTMENTS 14
* Based on market value of assets as at March 31, 2017, taking into account timing and size of contributions.
$57.5 OF CUMULATIVE 10-YEAR NET INVESTMENT INCOME
BILLION
$13.7 OF CUMULATIVE NET INVESTMENT GAINS ABOVE THE RETURN OBJECTIVE OVER 10 YEARS
BILLION*
$17.8 IN NEW INVESTMENTS AND COMMITMENTS TO PRIVATE MARKETS AND PRIVATE DEBT IN FISCAL YEAR 2017
BILLION
TOTAL NET PORTFOLIO RETURN
10.6%
12.8%
FIVE-YEAR NET ANNUALIZED RETURN
6.0%
10-YEAR NET ANNUALIZED RETURN
FINANCIAL HIGHLIGHTSFiscal Year 2017
Fiscal Year 2017 Financial Highlights

PSP INVESTMENTS | ANNUAL REPORT 2017 15
1 Includes cash and cash equivalents.
NET ASSETS PER PENSION PLAN ACCOUNT ($ billions)As at March 31, 2017
ASSET MIXAs at March 31, 2017
52.4%EQUITY
26.1%REAL ASSETS
3.3%CREDIT
18.2%GOVERNMENT FIXED INCOME1
$98.572.6% PUBLIC SERVICE
$26.719.7% CANADIAN FORCES
$9.87.3% RCMP
$0.60.4% RESERVE FORCE
NET CONTRIBUTIONS
$3.6BILLION
$135.6 16.1%
INCREASE IN NET ASSETS
BILLION NET ASSETS

ANNUAL REPORT 2017 | PSP INVESTMENTS 16
$77.2 BILLION NET ASSETS
FINANCIAL HIGHLIGHTSFiscal Year 2017
PUBLIC MARKETS1
REAL ESTATE
16.0% ONE-YEARRATE OF RETURN 10.9% FIVE-YEAR
ANNUALIZED RETURN
$20.6 BILLION NET ASSETS
10.8% ONE-YEARRATE OF RETURN 12.3% FIVE-YEAR
ANNUALIZED RETURN
56.9%OF TOTALNET ASSETS
15.2%OF TOTALNET ASSETS
PRIVATE EQUITY
$15.9 BILLION NET ASSETS
(3.4)% ONE-YEARRATE OF RETURN 7.8% FIVE-YEAR
ANNUALIZED RETURN
11.7%OF TOTALNET ASSETS
1 Includes public market equities and government fixed income.
Total net assets exclude cash and cash equivalents.
PSP INVESTMENTS | ANNUAL REPORT 2017 17
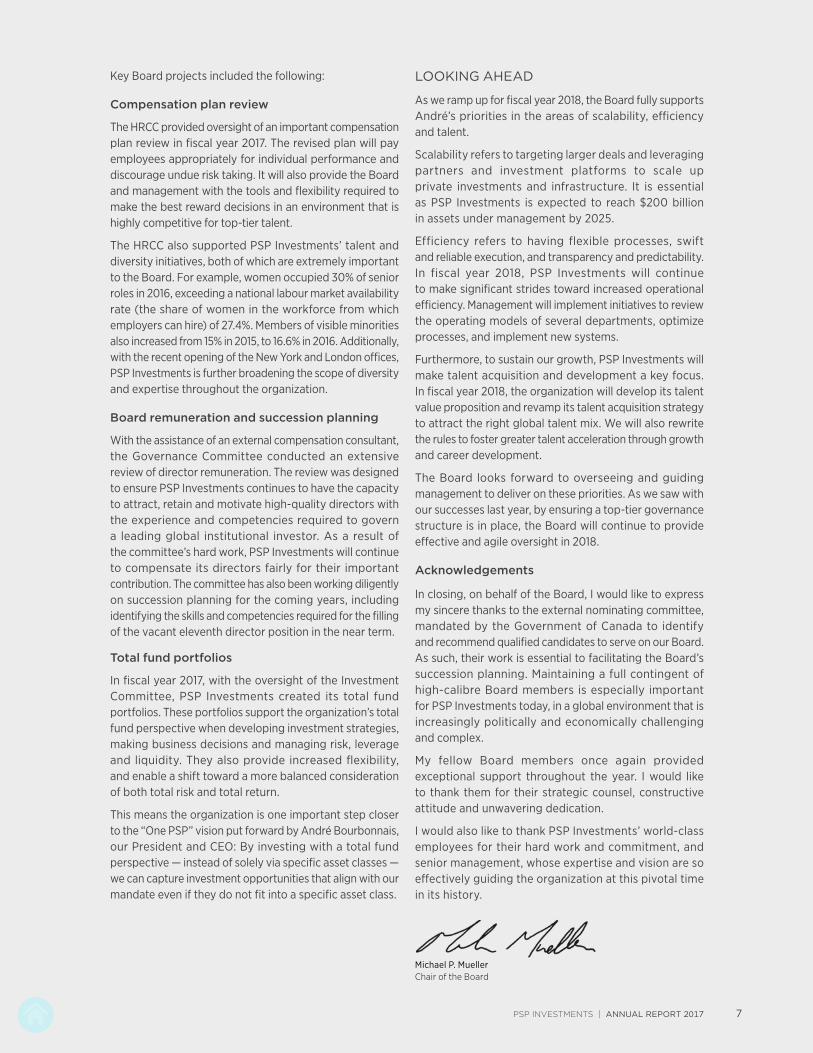
$4.4 BILLION NET ASSETS
PRIVATE DEBT
27.5% ONE-YEARRATE OF RETURN 23.2% SINCE INCEPTION
ANNUALIZED RETURN (1.3 years)
3.3%OF TOTALNET ASSETS
NATURAL RESOURCES
$3.7 BILLION NET ASSETS
19.5% ONE-YEARRATE OF RETURN 14.1% FIVE-YEAR
ANNUALIZED RETURN
2.7%OF TOTALNET ASSETS
INFRASTRUCTURE
$11.1 BILLION NET ASSETS
14.4% ONE-YEARRATE OF RETURN 11.7% FIVE-YEAR
ANNUALIZED RETURN
8.2%OF TOTALNET ASSETS
Total net assets exclude cash and cash equivalents.

IN GIVING BACK
INVESTING
Karine Dion Senior Director, Business Planning PSP Investments
PSP INVESTMENTS | ANNUAL REPORT 2017 19
Karine Dion
KARINE AND HER TEAMMATES GIVE BACK They are among the more than 460 employees who have taken part in PSP Gives Back since the program’s launch in 2016
“When we added up all the work we did at Welcome Hall Mission
that day, and the positivity that came from our experience,
it exceeded all of our expectations. It reminded us of
the importance of giving back.”
Each year, the PSP Gives Back program offers us the opportunity to do two days of fully-paid
volunteer work in our community. It is a concrete example of how our culture of collaboration
empowers and enables us to make a difference.
I believe that, as individuals, the most precious thing we can do is invest our time. For some
helping out at Welcome Hall Mission that day, it was their first time volunteering. We were
there to lend a hand at their food bank that distributes more than 850,000 kg of groceries
each year.
For us, the big payoff was knowing that we were working together and making a solid
contribution to the community. In this context, the benefits of our collaboration were even
more obvious than at work. Every minute we spent there made a difference in someone’s life.
It motivated us to work with energy and enthusiasm.
In exchange for the hours we invested, we each got so much more out of the experience than
we expected. We could see that our efforts were improving the lives of others and it inspired
us to contribute even more in the future. This is what I believe fuels PSP Gives Back.
ANNUAL REPORT 2017 | PSP INVESTMENTS 20
PSP Investments has adopted a Responsible Investment Policy that embodies our belief that responsible corporate behaviour with respect to environmental, social and governance (ESG) factors has a positive influence on long-term financial performance.
The integration of ESG factors in investment decision making is well established across our asset classes. When analyzing the risks and opportunities inherent to an investment, we work to identify, monitor and mitigate ESG issues that are, or could become, material to our long-term financial performance.
As a long-term investor, we believe in the importance of establishing strong governance oversight for all our investments. We encourage corporate conduct aimed at enhancing long-term financial performance through ongoing dialogue with boards of directors and senior management of the private and public companies in which we invest.
For details: Responsible Investment Policy.
MAKING A DIFFERENCE BY INVESTING RESPONSIBLY
Fiscal year 2017 marks an important milestone for us with the creation of a dedicated Responsible Investment group and the expansion of in-house capabilities in respect to ESG matters. The Responsible Investment group reports to the Chief Investment Officer and ensures that ESG factors are considered more broadly and consistently within PSP Investments and across all asset classes.
To this end, the Responsible Investment group’s mandate is articulated with four key pillars:
FOUR KEY PILLARS
f POLICY DEVELOPMENT AND STRATEGY Develop responsible investment policy and strategic initiatives.
Monitor ESG themes and measure risks for each asset and sub-asset class, and on a total portfolio basis.
f ADVISORY ROLE TO BOARD, PRESIDENT AND CEO, AND INVESTMENT GROUPS Provide advice and guidance to the Board, the President and CEO, and investment
groups on ESG trends and practices to ensure they form part of the investment decision making process.
f RESPONSIBLE INVESTMENT OVERSIGHT Pursue active ownership through proxy voting and engagement activities with public issuers.
f ESG TRAINING Increase internal capabilities so ESG factors are adequately considered during the investment
decision making process.
PSP Investments’ responsible investment activities are highlighted in our inaugural standalone publication: 2017 Responsible Investment Report.
INVESTING RESPONSIBLY
Investing Responsibly

PSP INVESTMENTS | ANNUAL REPORT 2017 21
FISCAL YEAR 2017 INITIATIVES
Public markets
At PSP Investments, we use our ownership positions to promote good corporate governance practices by exercising our proxy voting rights and actively engaging with publicly-listed companies.
Proxy voting
Our Proxy Voting Guidelines address issues of corporate governance, as well as the principles on which we rely in determining our voting decisions. We give due consideration to corporate governance principles when assessing the merits of an issue, and exercise our voting rights with a view to maximizing shareholder value.
For details: Proxy Voting Guidelines.
Engagement activities
With the assistance of a service provider, we actively engage in direct dialogue with public companies to improve their ESG practices. Public companies are selected for engagement based on a process that accounts for such factors as the ability to create shareholder value, prospects for success and the relevancy of issues. The intensity of our engagement with public companies evolves over time. Some engagements entail one or two meetings over a period of months; others are more complex and warrant multiple meetings with board members and senior management over several years.
In addition to our direct engagement efforts with public companies, we participate in collaborative governance initiatives and engagements with other like-minded institutional investors to effectively encourage change with regard to ESG issues.
Private asset classes
For our investments in real estate, private equity, infrastructure, natural resources and private debt, we work to identify ESG risks, including those linked to carbon emissions, climate change, health and safety, human rights and business ethics. ESG risk analysis is fundamental to our due diligence process and addressed in each investment recommendation submitted to the Board of Directors’ Investment Committee, the President and CEO, and other approving officers. Throughout the life of an investment, our investment teams adequately monitor ESG factors and, when risks arise, they ensure that mitigation measures are implemented as necessary.
Environmental assessment
As a Crown corporation, PSP Investments is subject to the Canadian Environmental Assessment Act, 2012. In analyzing the risks in any investment, we identify, monitor and mitigate environmental risks that are or could become material to long-term financial performance. We take these risks into consideration as part of the due diligence process with respect to potential investments and ongoing monitoring of investments.
In fiscal year 2017, all investments reviewed by PSP Investments were considered unlikely to cause significant adverse environmental effects.

AS ONE PSP
INVESTING
Tatiana Lewin Director, Legal Affairs PSP Investments

PSP INVESTMENTS | ANNUAL REPORT 2017 23
PSP Investments’ reputation precedes us; our agility and our ability to enable complex
global investments mean that we are always working on innovative solutions with our business
partners. This leads to lots of opportunities for us to provide input on exciting projects.
As part of the Legal Affairs team, I support negotiations by getting a solid understanding
of the investment’s intricacies and by preparing contracts that ensure deals are right for all
parties involved. I take pride in working with asset class teams in all of our offices to materialize
the global investment plan.
Our culture fosters an atmosphere of collaboration and teamwork. We are all continuously
raising the bar on the work we do, and we feel empowered in our roles because they are
recognized as essential to PSP Investments’ success.
I’m proud to play an active role in PSP Investments’ international growth strategy. I can see
first-hand the importance of collaboration between offices, and the opportunities available
when connecting strategists from the investment teams to our professionals specialized
in Human Resources, Communications, Legal Affairs and Taxation, as well as many others,
to facilitate hundreds of deals every year.
Tatiana Lewin
“Everyone at PSP Investments has a role to play in executing
the investment strategy – whether in business or investment roles.
For me, investing means putting money to work as part
of a smart and well thought out plan with the collaboration
of some of the best in the business.”
TATIANA IS PART OF A GLOBAL TEAMShe plays an integral role in investment deal teams

ANNUAL REPORT 2017 | PSP INVESTMENTS 24
PSP Investments developed an ambitious business plan for fiscal year 2017. It was a one-year articulation of Vision 2021, our five-year corporate strategy to achieve our desired end state.Our corporate objectives and initiatives are channelled through five strategic axes that guide our
actions and measure our success. Each axis is critical to achieve our vision of becoming a leading
global institutional investor that reliably delivers on its risk-return objective by driving a total fund
perspective and striving to be an agile and sought-after enabler of complex global investments.
In fiscal year 2017, we successfully delivered on our objectives and established a transformational
foundation. We built strong organizational momentum, which we will continue to leverage in fiscal
year 2018 and beyond.
As we move forward, we will consolidate the progress made to date and continue to focus on priorities
to add value to the organization and positively impact operations, while always acting in the best
interests of Canadian contributors and beneficiaries.
KEY CORPORATE OBJECTIVES
Key Corporate Objectives
ANNUAL REPORT 2017 | PSP INVESTMENTS 24

PSP INVESTMENTS | ANNUAL REPORT 2017 25
INTEGRATED EXECUTION PLAN
Our corporate objectives, fiscal year 2017 achievements and fiscal year 2018 priorities are summarized
as follows:
CULTIVATE ONE PSPSTRATEGIC AXIS
CORPORATE OBJECTIVES(Vision 2021 elements)
FY2017 ACHIEVEMENTS FY2018 PRIORITIES
Total fund
Apply a total fund perspective to investment strategies, decision making processes, risk, leverage and liquidity management.
Delivered benchmark performance within our Policy Portfolio guidelines and added value through active management within total fund risk limits.
Implemented a CIO Group to seek greater total fund perspective, guidance and alignment with asset classes.
Developed new frameworks to guide total fund decisions regarding elements such as leverage, liquidity and collateral.
Implemented a new compensation system to better align performance management and rewards with new total fund views and desired collaboration.
Continue to operationalize total fund frameworks to ensure total fund governance and oversight.
Develop more sophisticated total fund reporting and analytics to increase efficiency and enhance total fund decision making.
Implement total fund portfolios to enhance scalability, provide additional flexibility in deal selection and improve total fund risk-return profile.
Develop corporate views on key ESG themes in order to guide the analysis of potential investments and the review of the current portfolio.
Collaboration
Increase collaboration and knowledge sharing across asset classes, other internal groups, and with external partners and stakeholders.
Delivered on a large number of cross-departmental initiatives that advanced our strategic plan.
Pursued numerous investment opportunities on which multiple asset classes collaborated.
Continue to improve collaboration to increase the quality of insights shared across the organization.
PSP INVESTMENTS | ANNUAL REPORT 2017 25
ANNUAL REPORT 2017 | PSP INVESTMENTS 26 ANNUAL REPORT 2017 | PSP INVESTMENTS 26
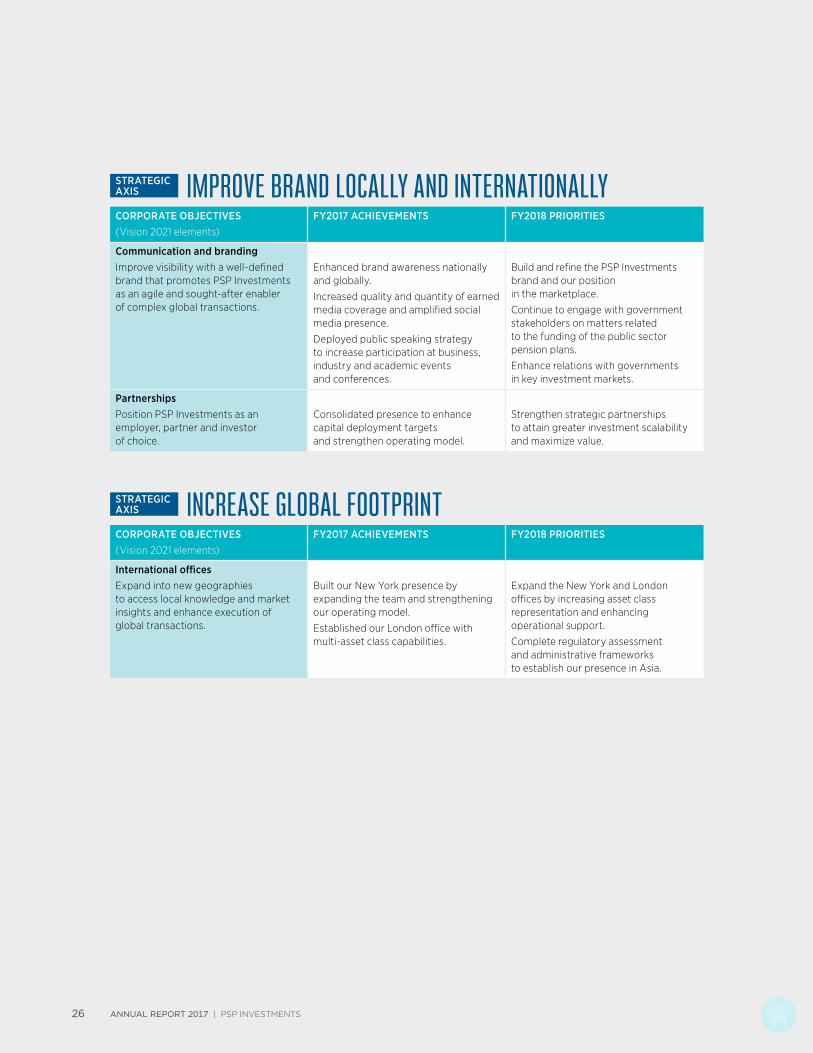
STRATEGIC AXIS IMPROVE BRAND LOCALLY AND INTERNATIONALLYCORPORATE OBJECTIVES(Vision 2021 elements)
FY2017 ACHIEVEMENTS FY2018 PRIORITIES
Communication and brandingImprove visibility with a well-defined brand that promotes PSP Investments as an agile and sought-after enabler of complex global transactions.
Enhanced brand awareness nationally and globally.
Increased quality and quantity of earned media coverage and amplified social media presence.
Deployed public speaking strategy to increase participation at business, industry and academic events and conferences.
Build and refine the PSP Investments brand and our position in the marketplace.
Continue to engage with government stakeholders on matters related to the funding of the public sector pension plans.
Enhance relations with governments in key investment markets.
PartnershipsPosition PSP Investments as an employer, partner and investor of choice.
Consolidated presence to enhance capital deployment targets and strengthen operating model.
Strengthen strategic partnerships to attain greater investment scalability and maximize value.
STRATEGIC AXIS INCREASE GLOBAL FOOTPRINTCORPORATE OBJECTIVES(Vision 2021 elements)
FY2017 ACHIEVEMENTS FY2018 PRIORITIES
International officesExpand into new geographies to access local knowledge and market insights and enhance execution of global transactions.
Built our New York presence by expanding the team and strengthening our operating model.
Established our London office with multi-asset class capabilities.
Expand the New York and London offices by increasing asset class representation and enhancing operational support.
Complete regulatory assessment and administrative frameworks to establish our presence in Asia.

PSP INVESTMENTS | ANNUAL REPORT 2017 27PSP INVESTMENTS | ANNUAL REPORT 2017 27
CREATE SCALABLE AND EFFICIENT INVESTMENTSTRATEGIC AXIS AND OPERATIONAL ACTIVITIESCORPORATE OBJECTIVES(Vision 2021 elements)
FY2017 ACHIEVEMENTS FY2018 PRIORITIES
Investment scalabilitySeek opportunities to invest innovatively at scale.
Executed on our deployment strategies and reached ambitious private investment deployment objectives.
Expand proven deployment strategies and develop new investing partnerships and product offerings.
Strengthen our asset management approach to bring greater consistency and value.
Operational efficiencyEnhance agility and efficiency to execute complex transactions quickly.
Completed the deployment of our portfolio and order management system to increase efficiency and insights for the Public Markets group.
Continue to review our operating model to streamline operations and increase efficiency.
STRATEGIC AXIS DEVELOP OUR TALENTCORPORATE OBJECTIVES(Vision 2021 elements)
FY2017 ACHIEVEMENTS FY2018 PRIORITIES
AttractionPromote PSP Investments as an employer of choice.
Recruited a large number of diverse and talented professionals.
Enhance PSP Investments’ attractiveness with a stronger talent value proposition.
Development and retentionFoster internal talent acceleration through growth and career development.
Redesign the individual performance management frameworks, processes and tools to make them more dynamic, business driven and better aligned with leading performance management practices.
Invest significant effort in talent development to accelerate personal growth and professional development.
Diversity and inclusionFoster a diverse and inclusive workplace.
Fostered understanding of diversity as a business imperative: a strategic component of individual and organizational success.
Increased representation of women in middle and senior management.
Continue to build a diverse and inclusive working environment.
CultureDevelop and foster a unified corporate culture across our global organization.
Developed a new and unified culture with six levers: agility, collaboration, empowerment, entrepreneurship, insight and talent acceleration.
Continue to build and sustain a strong, participatory organizational culture.
Continue to encourage employee community involvement.

IN OUR GLOBAL FOOTPRINT
INVESTING
Patrick Charbonneau Managing Director, Infrastructure Investments (Europe) PSP Investments

PSP INVESTMENTS | ANNUAL REPORT 2017 29
PSP Investments puts talent, experience and empowerment to work. We are given responsibility
to lead change within the organization, to influence the strategy and to constantly make
decisions that have significant impact on the organization’s success. This is how we grow
as professionals.
When I first started at PSP Investments as a young professional, I was given real opportunities
to contribute to important projects. Being given responsibility showed me that senior
management trusted me, which drove me to deliver the best possible results.
Ten years later, moving to London to expand the infrastructure team was exactly the type
of professional challenge I wanted to take on. I am humbled by the trust PSP Investments
is placing in me, and proud of our results so far.
Our office in London also seeds opportunities for cultural exchange throughout our entire
organization. Not only have we been able to recruit top talent in leading professionals who are
an amazing fit with PSP Investments’ culture, but the rich diversity they bring to the table
is invaluable as our organization grows its global footprint.
Patrick Charbonneau
“Having an office in London is a game changer.
Thanks to our local presence, we are gaining a better understanding
of the global environment, we are strengthening our current
partnerships and we are developing new investment opportunities
and partnerships. I am humbled by the trust placed in me to expand
our team in the world’s largest infrastructure investment market.”
PATRICK LEADS THE EXPANSION OF OUR INFRASTRUCTURE TEAM IN LONDON A rewarding challenge for him and PSP Investments

ANNUAL REPORT 2017 | PSP INVESTMENTS 30
At PSP Investments, diversity is rooted in a wide spectrum of merit and competencies – a mosaic of talent – that we leverage to create a stimulating work environment. Diversity engenders innovation and creativity. It is a critical factor in enabling each of our employees to reach his or her full potential and for them, as a team, to successfully deliver on our corporate business strategy, Vision 2021.
A diverse workforce, representative of the contributors and beneficiaries of the pension plans whose assets we manage, and of our global business partners, gives us a comparative edge as a leading international institutional investor.
Our talent development programs foster an inclusive workplace. Our programs are designed to attract, develop and retain employees with different qualifications, aptitudes, skills, cognitive styles and competencies. These qualities are based on different socio-cultural perspectives, educational backgrounds, multi-generational work habits and life experiences, whether grounded in gender, race, ethnicity, age, sexual orientation, disability, religion and personality.
A FUNDAMENTAL ELEMENT OF OUR HUMAN RESOURCES STRATEGY
PSP Investments has dedicated resources to manage our diversity and inclusion policies, procedures and programs. Our approach is based on industry best practices. We use quantitative data gathered during ongoing assessments to measure progress and evaluate the efficacy of our initiatives. Diversity is a core value of our Human Resources decision making processes.
In fiscal year 2017, we conducted a customized employee satisfaction survey. We are using its findings to mitigate identified challenges and obstacles in terms of communication, adaptability and change management.
We also continue to institute policies and practices to increase representation for individuals belonging to the designated groups named in the Employment Equity Act, namely: women, persons with disabilities, Aboriginal peoples and members of visible minorities. Much of our recent focus has been on improving representation for women, especially at middle and senior management levels.
DIVERSITY AWARENESS AND INCLUSION INITIATIVES
Multicultural orientation
f For a second consecutive year, our Human Resources group administered the Intercultural Development Inventory (IDI) assessment. Findings are being used to ensure our diversity in the workplace plan is comprehensive, measurable and attainable.
f For a second consecutive year, Human Resources offered unconscious bias training to managers. In addition to individual awareness and actions, these sessions emphasize the importance of managerial cooperation and commitment. PSP Investments’ management takes responsibility for creating a culture conducive to the success of our diversity in the workplace initiatives.
f As of fiscal 2017 year end, 228 managers received unconscious bias training.
Gender
f Women represented more than 61% of internship participants (55 of a total of 90), compared to 42% in fiscal year 2016.
f Women in senior roles increased from 18.2% in 2015 to 30% in 2016, compared to a national availability rate of 27.4%.
f PSP Investments partnered with the Association des femmes en finance du Québec (AFFQ) for a third consecutive year.
– PSP Investments offers AFFQ memberships to women in middle and senior management, allowing them to access professional networking and development activities. The membership program is popular; in fiscal year 2017, there were 58 PSP Investments-AFFQ members, up from 35 in fiscal year 2016.
DIVERSITY AND INCLUSION
Diversity and Inclusion

PSP INVESTMENTS | ANNUAL REPORT 2017 31
f In fiscal year 2017, PSP Investments also participated in career development programs and events for women with other industry organizations, including:
– L’effet A 100-day challenge – A for ambition. Two cohorts – eight PSP Investments employees – participated in mentoring and career evaluation activities supervised by Québec business leaders.
– Legal Leaders for Diversity (LLD). PSP Investments initially sponsored LLD and continues to support the mentorship program of the Montréal chapter of this pan-Canadian organization of general counsel that advocates for an inclusive legal profession.
– National Women in Business Conference at McGill University. This forum serves as a liaison between industry professionals and female management students interested in pursuing corporate careers, especially in fields with low female representation. It provides a valuable channel for PSP Investments to promote our brand on campus and attract candidates from a targeted group.
Members of visible minorities, persons with disabilities and Aboriginal peoples
f As a percentage of our workforce, members of visible minority groups increased from 15.4% in 2015 to 16.6% on December 31, 2016 (117 of a total of 706 employees). Representation of group members within PSP Investments is consistent with the market availability rate of 14.8%.
f Despite our commitment, we face ongoing challenges in increasing the number of employees with disabilities and of Aboriginal descent.
Moving forward, we will expand our definition of diversity to encompass a wider range of competencies to better reflect the wealth of perspectives that we want to leverage.
A DIVERSE WORKFORCE, REPRESENTATIVE OF THE CONTRIBUTORS AND BENEFICIARIES OF THE PENSION PLANS WHOSE ASSETS WE MANAGE, AND OF OUR GLOBAL BUSINESS PARTNERS, GIVES US A COMPARATIVE EDGE AS A LEADING INTERNATIONAL INSTITUTIONAL INVESTOR.

ANNUAL REPORT 2017 | PSP INVESTMENTS 32
MANAGEMENT’S DISCUSSIONof Fund Performance and Results
Management’s Discussion of Fund Performance and Results
PSP Investments’ strategic ambition is to be a leading global investor, working together and focusing on a total fund investment approach that optimizes our ability to identify opportunities, deploy capital and capture value. This total fund approach influences all our decision making.
With the implementation of our strategic plan, Vision 2021, internal cooperation and insights sharing are yielding new opportunities and deal flows. Collaboration between asset classes is being enhanced as we expand our global footprint and establish investment teams in our New York and London offices. To cite but one fiscal year 2017 example, our Infrastructure group worked closely with our CIO, Private Equity and Real Estate groups to acquire a participation in US-based Vantage Data Centers. This was made possible by the introduction of a new Complementary Portfolio, one of the total fund portfolios, that provides additional flexibility to seize investment opportunities that may not have been pursued because they do not fit into a specific asset class. In an environment characterized by expected low returns and ever increasing competition for assets, PSP Investments’ improved ability to unlock new investment opportunities gives us a marked advantage.
In fiscal year 2018, we will further define and implement our total fund approach to create additional synergies and capabilities. We will also implement initiatives to manage our exposure to key risks from our total fund perspective and to improve the quality of decision making and fund performance with enhanced analytics.
The following section outlines PSP Investments’ mandate and investment approach and provides an assessment of the success of our investment strategy. It presents the policies and practices for identifying, evaluating, managing, mitigating, reporting and monitoring risk. It also provides an analysis of our performance.
Continued growth in global markets and the solid performance of many of our portfolios and asset classes when measured against their benchmarks led to strong results in fiscal year 2017. The real test of PSP Investments’ success, however, is that our investment approach successfully achieves our return objective over the long term – 10 years or more – and that it creates value for the sponsor of the Plans, the Government of Canada, and their contributors and beneficiaries. As will be discussed in the next few pages, over the last 10 years, PSP Investments has been successful on both counts.

PSP INVESTMENTS | ANNUAL REPORT 2017 33
MANDATE, OBJECTIVE AND INVESTMENT APPROACHPSP INVESTMENTS’ MANDATE
PSP Investments is a Crown corporation that was established by the Government of Canada (“Government”) on April 1, 2000, to invest the amounts transferred for the funding of benefits earned from that day forward (“Post-2000 Liabilities”) by members of the public sector pension plans of the federal Public Service, the Canadian Forces, the Royal Canadian Mounted Police and since March 1, 2007, the Reserve Force (collectively the “Plans”). PSP Investments statutory mandate is to:
f Manage the amounts transferred to it in the best interests of contributors and beneficiaries under the Plans.
f Maximize returns without undue risk of loss, having regard to the funding, policies and requirements of the Plans and the ability of those Plans to meet their financial obligations.
Based on these statutory objects, PSP Investments has implemented an investment approach expected to achieve a return consistent with the full funding of the Post-2000 Liabilities, at an acceptable level of risk.
INVESTMENT APPROACH AND RISK TAKING
On an annual basis, the Treasury Board of Canada Secretariat, which oversees the Government of Canada’s relationship with PSP Investments, communicates a return objective to PSP Investments. The return objective is currently set at a long-term real rate of return of 4.1%. This return objective is consistent with the Government’s funding objectives for the Post-2000 Liabilities. In the absence of other factors affecting the funding of the Plans, contributions and pension benefits would be maintained at current levels if the return objective were to be achieved.
Investments promising to deliver the return objective on a risk-free basis do not exist. Consequently, PSP Investments must take a certain amount of risk to achieve this objective. The Risk Appetite Statement (“RAS”), as approved by the Board of Directors and summarized in the Risk Appetite Overview, articulates PSP Investments’ appetite, attitude and tolerance to risk in pursuit of the return objective. A key element of the RAS is the Government’s assumed appetite for risk (“risk appetite”), defined as the tolerance for a possible requirement to make supplementary pension contributions to the Plans due to less than favourable investment performance.
The assumed risk appetite is determined by evaluating the pension funding risk (i.e. the risk of a funding deficit in the Plans) that would result from investing in a simple, passively-managed portfolio that is expected to achieve, over the long term, an expected real rate of return of 4.1%. This portfolio, known as the Reference Portfolio, is composed of publicly-traded securities representing broad market indices that are easy to replicate at a minimal cost. Based on our long-term expectations of market conditions, a Reference Portfolio composed of 71% equities and 29% bonds is expected to achieve the return objective over the long term. This portfolio articulates both our return objective and the risk that is deemed acceptable to achieve our mandate.
The return objective, the risk appetite and the Reference Portfolio anchor our investment approach. Our long-term aim is to achieve a return equal to or greater than the return objective and the Reference Portfolio, with a level of risk within the defined risk appetite. Our investment approach, illustrated below, is composed of two pillars.
=Acceptable levelof pension
funding risk
RETURN OBJECTIVE
Targetasset
allocations
Risk-controlleddeviation vs.benchmarks
ACTIVE MANAGEMENT
ACTUAL PORTFOLIO
POLICY PORTFOLIO
RISK APPETITE
REFERENCEPORTFOLIO
INVESTMENT MANDATE INVESTMENT APPROACH
ANNUAL REPORT 2017 | PSP INVESTMENTS 34
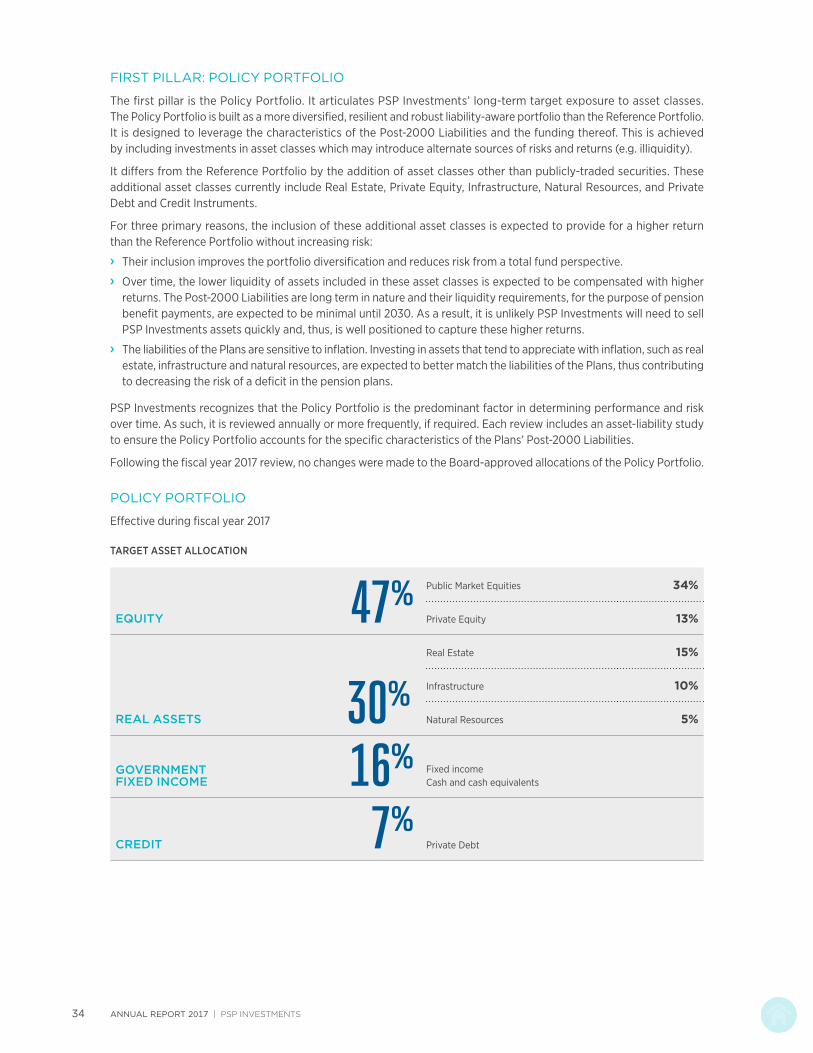
FIRST PILLAR: POLICY PORTFOLIO
The first pillar is the Policy Portfolio. It articulates PSP Investments’ long-term target exposure to asset classes. The Policy Portfolio is built as a more diversified, resilient and robust liability-aware portfolio than the Reference Portfolio. It is designed to leverage the characteristics of the Post-2000 Liabilities and the funding thereof. This is achieved by including investments in asset classes which may introduce alternate sources of risks and returns (e.g. illiquidity).
It differs from the Reference Portfolio by the addition of asset classes other than publicly-traded securities. These additional asset classes currently include Real Estate, Private Equity, Infrastructure, Natural Resources, and Private Debt and Credit Instruments.
For three primary reasons, the inclusion of these additional asset classes is expected to provide for a higher return than the Reference Portfolio without increasing risk:
f Their inclusion improves the portfolio diversification and reduces risk from a total fund perspective.
f Over time, the lower liquidity of assets included in these asset classes is expected to be compensated with higher returns. The Post-2000 Liabilities are long term in nature and their liquidity requirements, for the purpose of pension benefit payments, are expected to be minimal until 2030. As a result, it is unlikely PSP Investments will need to sell PSP Investments assets quickly and, thus, is well positioned to capture these higher returns.
f The liabilities of the Plans are sensitive to inflation. Investing in assets that tend to appreciate with inflation, such as real estate, infrastructure and natural resources, are expected to better match the liabilities of the Plans, thus contributing to decreasing the risk of a deficit in the pension plans.
PSP Investments recognizes that the Policy Portfolio is the predominant factor in determining performance and risk over time. As such, it is reviewed annually or more frequently, if required. Each review includes an asset-liability study to ensure the Policy Portfolio accounts for the specific characteristics of the Plans’ Post-2000 Liabilities.
Following the fiscal year 2017 review, no changes were made to the Board-approved allocations of the Policy Portfolio.
POLICY PORTFOLIO
Effective during fiscal year 2017
TARGET ASSET ALLOCATION
EQUITY 47% Public Market Equities 34%
Private Equity 13%
REAL ASSETS 30%Real Estate 15%
Infrastructure 10%
Natural Resources 5%
GOVERNMENT FIXED INCOME 16% Fixed income
Cash and cash equivalents
CREDIT 7%Private Debt
PSP INVESTMENTS | ANNUAL REPORT 2017 35
SECOND PILLAR: ACTIVE MANAGEMENT
The second pillar of the investment approach is active management. Based on thorough and proprietary research, PSP Investments seeks to invest in companies and securities whose risk-adjusted returns are expected to outperform the market. When implemented within our active risk limits and the assumed risk appetite, PSP Investments believes that active management activities can add materially to Policy Portfolio returns without increasing risk beyond the risk appetite.
FOCUS ON TOTAL FUND APPROACH
A key priority of PSP Investments’ five-year strategic plan, Vision 2021, is to implement an investment approach that focuses on the fund as a whole – our total fund – rather than on individual asset classes. This is what we refer to as a total fund perspective or approach and it guides our investment strategy.
The CIO Group, led by the Executive Vice President and Chief Investment Officer, was created in fiscal year 2016 to implement our total fund approach. The CIO Group’s focus is to enable PSP Investments to best achieve its mandate by managing total fund allocations and exposures in terms of asset classes, geographies and sectors, while taking into consideration risk and other pertinent factors.
In fiscal year 2017, the CIO Group focused on building the tools and capabilities needed to implement the total fund approach. In particular, the group:
f Enhanced its capacity to analyze the key factors that influence risk and return, and revised the portfolio construction framework to incorporate more comprehensive views on broad factors that could impact the portfolio, such as geographic exposure and foreign exchange.
f Expanded in-house capabilities to develop views on ESG factors, including the creation of the position of Vice President, Responsible Investment, and how they affect individual investments and total fund risks and return.
f Introduced portfolios that support our total fund approach (e.g. the Complementary Portfolio). The total fund portfolios were created to support scalability, provide additional flexibility to PSP Investments’ approach and improve the risk-return profile of the total fund. They are designed to enable PSP Investments to capture investment opportunities that fit our mandate but are outside the scope of our current investment framework.
f In fiscal year 2018, the CIO Group’s main priority will be to further develop and deploy these initiatives to maximize their contribution to the fulfillment of PSP Investments’ mandate and optimize their usefulness to other groups on an enterprise-wide basis. Much emphasis will be placed on the CIO Group’s contribution to the One PSP approach through increased communication, collaboration and organizational cohesion.

ANNUAL REPORT 2017 | PSP INVESTMENTS 36
THE IMPORTANCE OF INVESTMENT RETURNS IN THE FUNDING OF THE PENSION PLAN OBLIGATIONS
The Government transfers to PSP Investments amounts equivalent to the proceeds of the employee and employer contributions to the Plans after subtracting the administrative expenses for the Plans and the amounts paid for benefits earned since April 1, 2000 (March 1, 2007, for the Reserve Force). Transfers are expected to remain positive until approximately 2030, at which time the amounts paid for benefits earned since April 1, 2000, are expected to exceed contributions.
At the end of fiscal year 2017, the sum of all fund transfers received from the Government since April 1, 2000, represented 51% of assets under management, with the remaining 49% representing investment returns earned by PSP Investments on those funds. As illustrated below, the proportion of assets representing investment returns is expected to reach about 80% as the Plans mature. In other words, for every $1 of pension benefits paid, 80 cents will be sourced from investment returns, illustrating their importance in the funding of the Post-2000 Liabilities of the Plans.
HISTORICAL AND PROJECTED NET ASSETS UNDER MANAGEMENT
50
0
100
150
200
250
300
Accumulated Net Contributions
Projected
Accumulated Return
2000 2002 2005 2008 2011 2014 2017 2020 2023 2026 2029
$B
Cumulative amounts are based on historical contributions (net of benefit payments) and PSP Investments’ assets up to March 31, 2017, and are projected using the latest actuarial valuations of the Plans afterward.
Accumulated net contributions
Accumulated return
2000 2002 2005 2008 2011 2014 2017 2020 2023 2026
50
0
100
150
200
250
300$B
PSP INVESTMENTS | ANNUAL REPORT 2017 37
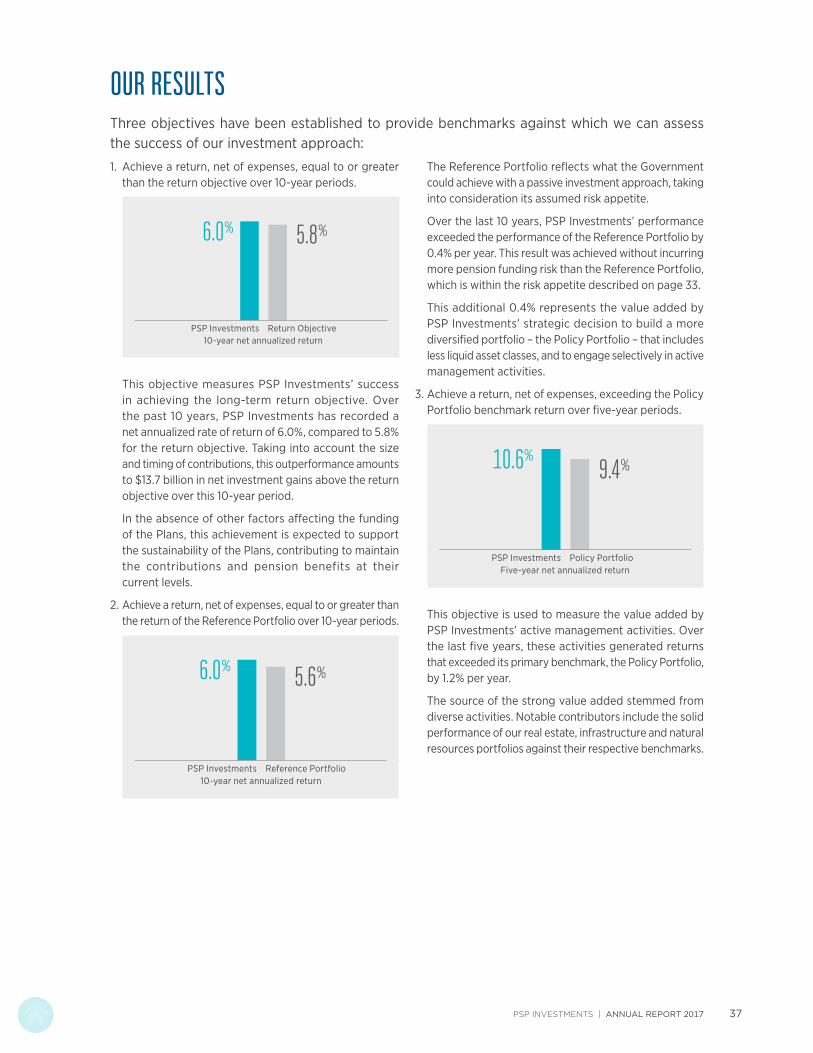
OUR RESULTSThree objectives have been established to provide benchmarks against which we can assess the success of our investment approach:
1. Achieve a return, net of expenses, equal to or greater than the return objective over 10-year periods.
PSP Investments Return Objective
6.0% 5.8%
10-year net annualized return
This objective measures PSP Investments’ success in achieving the long-term return objective. Over the past 10 years, PSP Investments has recorded a net annualized rate of return of 6.0%, compared to 5.8% for the return objective. Taking into account the size and timing of contributions, this outperformance amounts to $13.7 billion in net investment gains above the return objective over this 10-year period.
In the absence of other factors affecting the funding of the Plans, this achievement is expected to support the sustainability of the Plans, contributing to maintain the contributions and pension benefits at their current levels.
2. Achieve a return, net of expenses, equal to or greater than the return of the Reference Portfolio over 10-year periods.
PSP Investments Reference Portfolio
6.0% 5.6%
10-year net annualized return
The Reference Portfolio reflects what the Government could achieve with a passive investment approach, taking into consideration its assumed risk appetite.
Over the last 10 years, PSP Investments’ performance exceeded the performance of the Reference Portfolio by 0.4% per year. This result was achieved without incurring more pension funding risk than the Reference Portfolio, which is within the risk appetite described on page 33.
This additional 0.4% represents the value added by PSP Investments’ strategic decision to build a more diversified portfolio – the Policy Portfolio – that includes less liquid asset classes, and to engage selectively in active management activities.
3. Achieve a return, net of expenses, exceeding the Policy Portfolio benchmark return over five-year periods.
PSP Investments Policy PortfolioFive-year net annualized return
10.6% 9.4%
This objective is used to measure the value added by PSP Investments’ active management activities. Over the last five years, these activities generated returns that exceeded its primary benchmark, the Policy Portfolio, by 1.2% per year.
The source of the strong value added stemmed from diverse activities. Notable contributors include the solid performance of our real estate, infrastructure and natural resources portfolios against their respective benchmarks.

ANNUAL REPORT 2017 | PSP INVESTMENTS 38
On a gross basis, the portfolio delivered a 13.2% return in fiscal year 2017, compared to a 1.0% return in the previous fiscal year. The net assets of PSP Investments increased by $18.8 billion during fiscal year 2017, representing a gain of 16.1%. Net assets at the end of fiscal year 2017 were $135.6 billion, compared to $116.8 billion at the end of the previous fiscal year.
PSP Investments generated comprehensive income of $15.2 billion (i.e. net investment income less operating expenses and other comprehensive income) in the current fiscal year compared to $807 million in fiscal year 2016. PSP Investments also received net contributions of $3.6 billion in the current fiscal year compared to $4.0 billion in the previous fiscal year.
Financial markets exhibited considerable volatility during the year, with geopolitics playing an unusually important role. Significant political developments, such as the referendum vote in favour of the UK withdrawing from the European Union (“Brexit”) and the result of the US presidential election, marked key turning points for markets.
Despite these challenging market conditions, PSP Investments recorded strong results with a net rate of return of 12.8% for the fiscal year that ended on March 31, 2017, compared to our Policy Portfolio benchmark, which recorded a 11.9% gain during the same period. The difference represents the value added by PSP Investments’ active management activities. Most of our asset classes contributed to both our absolute return and excess return over the Policy Portfolio, as described on the next page.
12.8%$15.2
$3.6ONE-YEAR NET RATE OF RETURN
$135.6 BILLION NET ASSETS
BILLION COMPREHENSIVE INCOME
BILLION NET CONTRIBUTIONS
IN-DEPTH REVIEW OF FISCAL YEAR 2017 RESULTS

PSP INVESTMENTS | ANNUAL REPORT 2017 39
PUBLIC MARKETS1
After a roller coaster journey, developed market equities ended fiscal year 2017 with significant gains despite poor global growth. In this context, our investments in public equities recorded strong absolute returns during fiscal year 2017. Gains in public equities were the strongest contributor to our absolute rate of return. Relative to their benchmarks, public equities outperformed by 1.2%, with absolute return mandates being the strongest contributors to the excess return.
Equity valuations, particularly in the US, have now edged into expensive territory as they increasingly price in a rosy outlook for earnings growth. Further gains in the value of equities would require a continued improvement in earnings.
Global bond yields fell in the first half of fiscal year 2017 before rebounding strongly along with equities. Nevertheless, subdued economic growth and low inflation kept global monetary policy extremely accommodative and interest rates at historically low levels. While this environment contributed to modest returns, albeit positive, in fixed income markets, our government fixed income portfolios performed strongly against the benchmark, with an excess return of 0.9%. Our internally managed world government bonds portfolio delivered the highest relative performance.
PRIVATE MARKETS
Within this global economic context, most of our private markets portfolios generated strong returns, both in absolute and relative terms against their benchmarks. The results of our real estate and infrastructure portfolios, in particular, made a significant contribution to PSP Investments’ total performance relative to the Policy Portfolio benchmark. Our natural resources and private debt portfolios also recorded strong absolute and relative returns. As our infrastructure, natural resources and private debt portfolios continue to grow and approach their Policy Portfolio allocation targets, we expect to reap increased benefits from their contributions to total fund returns.
1 Including absolute return strategies.
Our private equity portfolio was impacted by the less favourable performance of a few assets, both in absolute terms and relative to the benchmark. The significant changes made to the strategy in fiscal year 2016 are being implemented and we expect that they will improve our performance over the next few years.
CURRENCY EXPOSURE
Given the proportion of PSP Investments’ assets that are invested abroad, currency fluctuations can have a significant impact on investment returns. This was particularly true in fiscal year 2017. The US dollar continued to strengthen as relatively stronger growth in the US, compared to that of other developed economies, kept the Federal Reserve in monetary tightening mode and forced other central banks to maintain an easing bias. The prospect of fiscal stimulus following the US presidential election further boosted the US dollar as investors revised their growth expectations higher. The British pound fell to a near all-time low in the wake of the British referendum; it declined by roughly 10% against the Canadian dollar over fiscal year 2017.
Despite this volatile environment, our currency management framework, which was implemented at the total fund level, allowed us to manage our exposure. The impact of fluctuation of foreign currencies resulted in a gain of $1,712 million in fiscal year 2017 (including a currency hedging gain of $681 million). A higher exposure to the US dollar, notably in advance of the US presidential election, and a lower exposure to the British pound and the euro amid the referendums in the UK and Italy, proved beneficial to fund returns.
ANNUAL REPORT 2017 | PSP INVESTMENTS 40
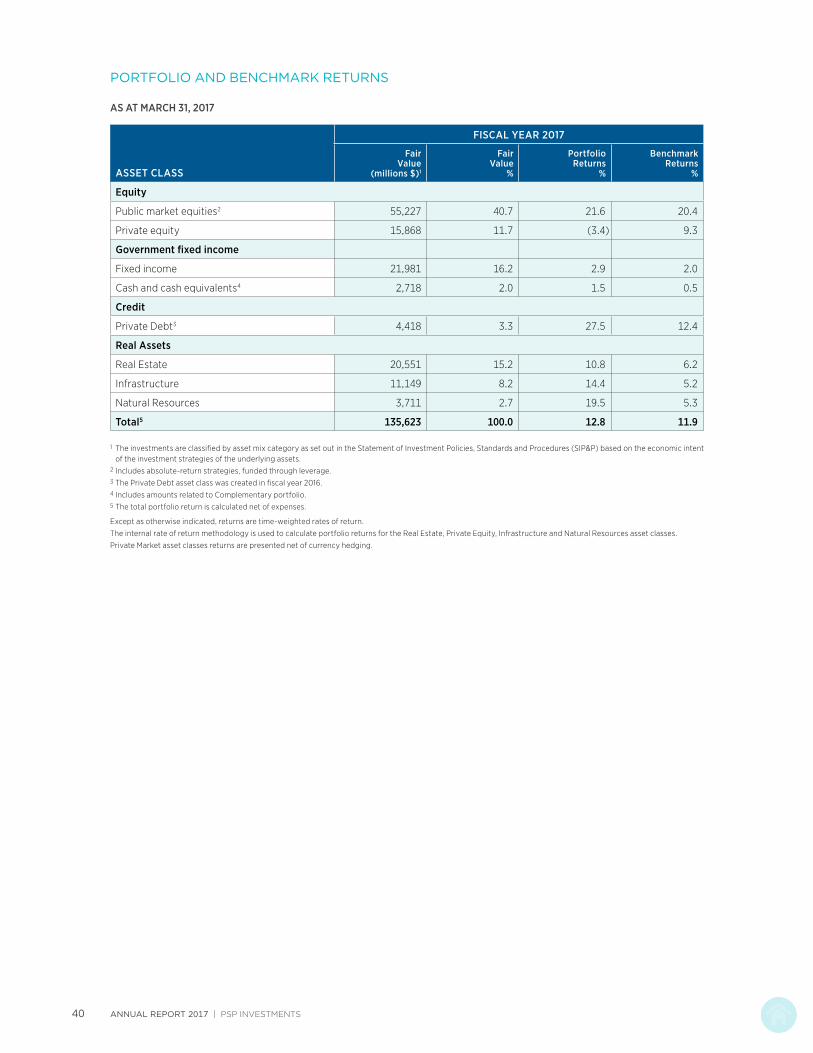
PORTFOLIO AND BENCHMARK RETURNS
AS AT MARCH 31, 2017
ASSET CLASS
FISCAL YEAR 2017
Fair Value
(millions $)1
Fair Value
%
Portfolio Returns
%
Benchmark Returns
%
Equity
Public market equities2 55,227 40.7 21.6 20.4
Private equity 15,868 11.7 (3.4) 9.3
Government fixed income
Fixed income 21,981 16.2 2.9 2.0
Cash and cash equivalents4 2,718 2.0 1.5 0.5
Credit
Private Debt3 4,418 3.3 27.5 12.4
Real Assets
Real Estate 20,551 15.2 10.8 6.2
Infrastructure 11,149 8.2 14.4 5.2
Natural Resources 3,711 2.7 19.5 5.3
Total5 135,623 100.0 12.8 11.9
1 The investments are classified by asset mix category as set out in the Statement of Investment Policies, Standards and Procedures (SIP&P) based on the economic intent of the investment strategies of the underlying assets.
2 Includes absolute-return strategies, funded through leverage.3 The Private Debt asset class was created in fiscal year 2016.4 Includes amounts related to Complementary portfolio.5 The total portfolio return is calculated net of expenses.
Except as otherwise indicated, returns are time-weighted rates of return.
The internal rate of return methodology is used to calculate portfolio returns for the Real Estate, Private Equity, Infrastructure and Natural Resources asset classes.
Private Market asset classes returns are presented net of currency hedging.

PSP INVESTMENTS | ANNUAL REPORT 2017 41
PUBLIC MARKETS
Public Markets is composed of public market equities and government fixed income. Investments are managed by both internal and external managers using a combination of active, absolute and index-replication strategies. Public Markets delivers benchmark performance within policy portfolio guidelines, adds value through active management within risk limits and accounts for close to 60% of assets under management.
Public Markets generated significant returns in fiscal year 2017 despite the market volatility resulting from the political uncertainties prompted by the Brexit referendum in the UK and the US presidential and euro zone elections. Global macro factors positively impacted performance, especially in the second half of the fiscal year as global rates increased, credit spreads tightened, deflationary risks dissipated and global growth rebounded.
f At fiscal 2017 year end, net assets managed in active strategies totalled $38.8 billion, an increase of $4.5 billion from $34.3 billion at fiscal 2016 year end; net assets managed in internal active strategies totalled $24.6 billion, compared to $21.3 billion at fiscal 2016 year end.
f Public Market equities, which include absolute return strategies funded through leverage, benefitted from the net positive performance of world equity indices and accounted for $55.2 billion of net assets at fiscal 2017 year end, compared to $47.5 billion at fiscal 2016 year end.
f The largest contributor to overall performance was the externally managed absolute return portfolio which added more than $600 million in absolute return. Results were positive for more than 85% of mandates, and particularly for those with our Global Macro managers and our Credit manager.
f A significant contribution to overall performance was also made by the internally managed active fixed income portfolio, which was well positioned for the rise in global rates and added $158 million in relative value.
f The internally managed active multistrategy and asset management portfolio generated $77 million of value added from long/short relative value, global macro and mergers and acquisitions strategies.
f The internally managed active Europe, Australasia and Far East (EAFE) portfolio detracted $60 million compared to the benchmark, mainly because of defensive positioning in the last quarter as equity markets rallied.
f Looking forward, Public Markets will benefit from the newly-created internal Global Equity Research platform, which will provide sector and stock specific analyses. The group will also roll out a new Global Fundamental portfolio focused on core equities and will continue with the development of a new global investment partnerships portfolio.
$77.2 56.9%BILLIONNET ASSETS
OF TOTALNET ASSETS
ONE-YEAR RATE OF RETURN 16.0% FIVE-YEAR
ANNUALIZED RETURN 10.9%
Benchmark return 14.9% Benchmark return 10.5%
ANNUAL REPORT 2017 | PSP INVESTMENTS 42
REAL ESTATE
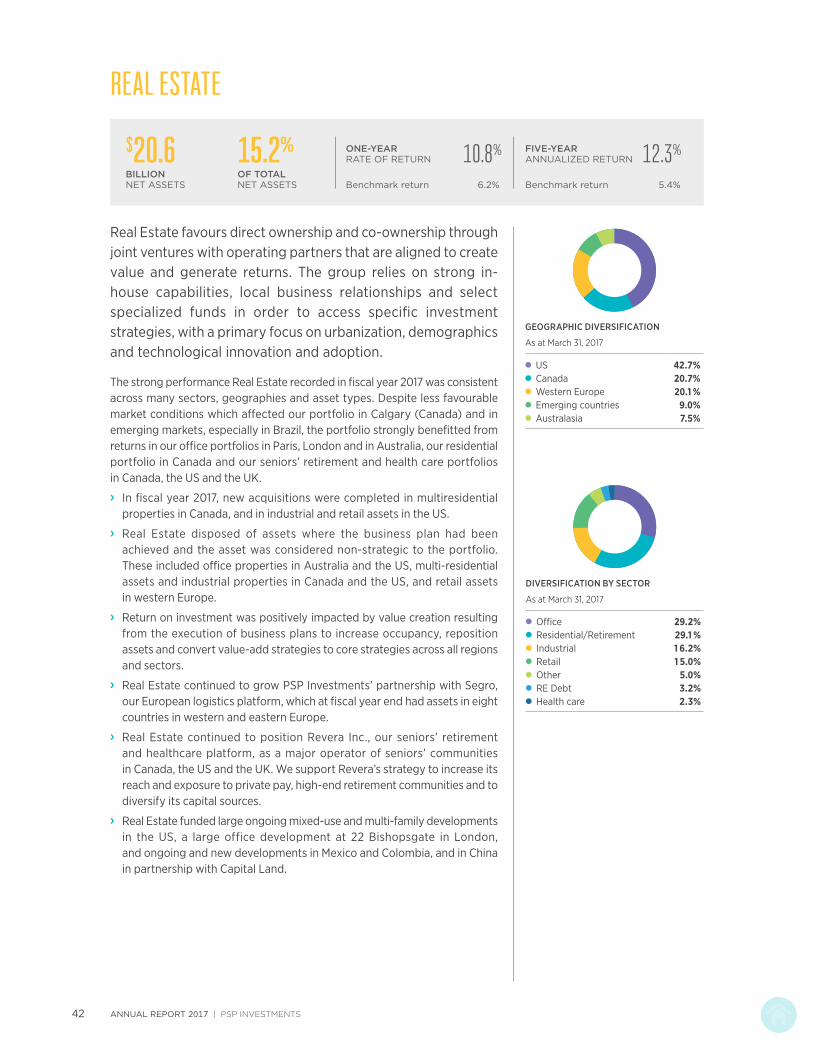
Real Estate favours direct ownership and co-ownership through joint ventures with operating partners that are aligned to create value and generate returns. The group relies on strong in-house capabilities, local business relationships and select specialized funds in order to access specific investment strategies, with a primary focus on urbanization, demographics and technological innovation and adoption.
The strong performance Real Estate recorded in fiscal year 2017 was consistent across many sectors, geographies and asset types. Despite less favourable market conditions which affected our portfolio in Calgary (Canada) and in emerging markets, especially in Brazil, the portfolio strongly benefitted from returns in our office portfolios in Paris, London and in Australia, our residential portfolio in Canada and our seniors’ retirement and health care portfolios in Canada, the US and the UK.
f In fiscal year 2017, new acquisitions were completed in multiresidential properties in Canada, and in industrial and retail assets in the US.
f Real Estate disposed of assets where the business plan had been achieved and the asset was considered non-strategic to the portfolio. These included office properties in Australia and the US, multi-residential assets and industrial properties in Canada and the US, and retail assets in western Europe.
f Return on investment was positively impacted by value creation resulting from the execution of business plans to increase occupancy, reposition assets and convert value-add strategies to core strategies across all regions and sectors.
f Real Estate continued to grow PSP Investments’ partnership with Segro, our European logistics platform, which at fiscal year end had assets in eight countries in western and eastern Europe.
f Real Estate continued to position Revera Inc., our seniors’ retirement and healthcare platform, as a major operator of seniors’ communities in Canada, the US and the UK. We support Revera’s strategy to increase its reach and exposure to private pay, high-end retirement communities and to diversify its capital sources.
f Real Estate funded large ongoing mixed-use and multi-family developments in the US, a large office development at 22 Bishopsgate in London, and ongoing and new developments in Mexico and Colombia, and in China in partnership with Capital Land.
$20.6 15.2%BILLIONNET ASSETS
OF TOTALNET ASSETS
ONE-YEAR RATE OF RETURN 10.8% FIVE-YEAR
ANNUALIZED RETURN 12.3%
Benchmark return 6.2% Benchmark return 5.4%
DIVERSIFICATION BY SECTOR
As at March 31, 2017
● Office 29.2%● Residential/Retirement 29.1 %● Industrial 1 6.2%● Retail 1 5.0%● Other 5.0%● RE Debt 3.2%● Health care 2.3%
GEOGRAPHIC DIVERSIFICATION
As at March 31, 2017
● US 42.7%● Canada 20.7%● Western Europe 20.1 %● Emerging countries 9.0%● Australasia 7.5%

PSP INVESTMENTS | ANNUAL REPORT 2017 43
PRIVATE EQUITY
Private Equity strategically builds relationships with external fund managers and investment partners, leveraging their networks, and sector and geographic expertise to source long-term direct investment and co-investment opportunities.
Private Equity is focused on creating value, generating long-term returns and providing positive elements of diversification to PSP Investments’ total fund portfolio. The group continues to expand our global footprint to identify and respond to deployment opportunities.
Private Equity’s portfolio increased by $3.4 billion in fiscal year 2017, following its largest ever annual deployment. Growth was strong across geographies. Notably, it was supported by our new investment team in London, new investing relationships resulting in the acquisition of direct interests in seven industry leaders, and the addition of seven new fund partners, which are contributing additional capacity to source co-investment opportunities. The quality of the group’s asset base was enhanced despite an overall negative return driven by markdowns in the value of certain legacy technology and communications investments.
f In fiscal year 2017, Private Equity deployed a total of $4.8 billion, including new direct investments and co-investments totalling $2.6 billion in the US and Europe, and also committed a total of $4.3 billion for deployment through 12 funds, mostly with new partners.
f At fiscal 2017 year end, direct investments and co-investments accounted for 46% of net assets, up from 40% at fiscal 2016 year end.
f New direct investments were made primarily in the consumer and healthcare sectors, including the acquisition of significant interests in:
– TeamHealth, a leading physician services organization in the US
– AlixPartners, a global advisory firm
– Keter Group, the world’s largest producer of quality resin consumer products
– Allflex Group, a leader in animal intelligence and livestock identifi cation technologies
f Private Equity also committed to acquire Cerba HealthCare, a leading European operator of clinical pathology laboratories.
f Private Equity continued to build its presence in London with the hiring of a team of experienced and dedicated investment professionals.
$15.9 11.7%BILLIONNET ASSETS
OF TOTALNET ASSETS
ONE-YEAR RATE OF RETURN (3.4)% FIVE-YEAR
ANNUALIZED RETURN 7.8%
Benchmark return 9.3% Benchmark return 11.4%
DIVERSIFICATION BY SECTOR
As at March 31, 2017
● Financials 20.5%● Consumer discretionary 1 8.6%● Communications 1 3.5%● Industrials 1 1 .7%● Technology 1 0.9%● Health care 9.9%● Consumer staples 6.2%● Other 5.6%● Energy 3.1 %
GEOGRAPHIC DIVERSIFICATION
As at March 31, 2017
● US 48.1 %● Emerging markets 20.5%● Europe 20.3%● Canada 9.0%● Asia 2.1 %
ALLFLEX GROUP: INVESTING IN A GLOBAL LEADER IN AN INNOVATIVE INDUSTRY
In fiscal year 2017, PSP Investments acquired a significant minority interest from BC Partners in Allflex Group, the world leader in animal intelligence and livestock identification and monitoring technologies. The transaction was a collaborative effort involving our Private Equity and Natural Resources asset classes that was led by our London-based investment team.

ANNUAL REPORT 2017 | PSP INVESTMENTS 44
INFRASTRUCTURE
Infrastructure invests globally on a long-term basis, primarily in the transportation, power generation, telecommunications and public utilities sectors. The group is focused on direct investments, including platforms and co-investments.
Infrastructure’s strong fiscal year 2017 performance is mainly attributable to investments in Europe and emerging markets, particularly in the transportation, communications and renewable energy sectors. Our AviAlliance airports platform benefited from notable growth in traffic at some airports. Due to strong economic conditions in the UK, our investments in ports recorded increased cargo volumes and revenues. Favourable market conditions positively influenced the performance of our investments in the telecommunications sector. During the year, several construction projects undertaken by our renewable energy platform, Cubico Sustainable Investments Limited, were completed and became operational, which had a positive impact on revenues.
f In fiscal year 2017, our Infrastructure group deployed a total of $2.6 billion, including $1.8 billion of direct investments. The two largest investments were the acquisition of a portfolio of hydroelectric assets (1.4 GW) in New England, which will be integrated into our H2O hydroelectric energy platform, and the acquisition of an additional interest with our partner, OTPP, in our Cubico renewable energy platform.
f We successfully completed the acquisition of 33% of Vantage Data Centers in partnership with TIAA, Digital Bridge LLC and company management. This was a collaborative transaction aligned with our total fund investment approach that also involved participation from the CIO Group, and the Private Equity and Real Estate asset classes.
f Infrastructure also committed to four funds which invest in a wide variety of sectors and niche markets, of which three are new partners.
f Infrastructure established representation at PSP Investments’ London office in order to develop new relationships and investment opportunities.
$11.1 8.2%BILLIONNET ASSETS
OF TOTALNET ASSETS
ONE-YEAR RATE OF RETURN 14.4% FIVE-YEAR
ANNUALIZED RETURN 11.7%
Benchmark return 5.2% Benchmark return 5.7%
DIVERSIFICATION BY SECTOR
As at March 31, 2017
● Industrials 46.9%● Utilities 39.6%● Communications 8.0%● Energy 4.8%● Other 0.7%
GEOGRAPHIC DIVERSIFICATION
As at March 31, 2017
● Europe 47.1 %● US 22.9%● Emerging markets 21.2%● Canada 5.4%● Australia 3.4%
H2O: LEVERAGING OPERATIONAL EXPERTISE TO MAXIMIZE THE BENEFITS OF OWNERSHIP
Infrastructure acquired a portfolio of hydroelectric generating assets for an enterprise value of US$1.2 billion from ENGIE Group. Located in New England, these facilities are an important component of the eastern US energy market and will be integrated into our H2O energy platform. The transaction complements our long-term strategy to invest directly in industry-specific infrastructure platforms.

PSP INVESTMENTS | ANNUAL REPORT 2017 45
NATURAL RESOURCES
POMONA FARMING: PSP INVESTMENTS’ FIRST DIRECT INVESTMENT IN PERMANENT CROPS
PSP Investments acquired approximately 10,000 acres of Californian almond orchards, including water rights, alongside an aligned partner with a strong track record. PSP Investments aims to leverage the acquisition to launch a larger platform, primarily focused on California almonds and water rights, and to build scale in the US agriculture sector.
$3.7 2.7%BILLIONNET ASSETS
OF TOTALNET ASSETS
ONE-YEAR RATE OF RETURN 19.5% FIVE-YEAR
ANNUALIZED RETURN 14.1%
Benchmark return 5.3% Benchmark return 4.6%
DIVERSIFICATION BY SECTOR
As at March 31, 2017
● Timber 60.9%● Agriculture 28.1 %● Oil and gas 1 1 .0%
GEOGRAPHIC DIVERSIFICATION
As at March 31, 2017
● Australasia 59.2%● North America 35.2%● Other 5.6%
Natural Resources invests primarily in real assets and other opportunities in timber and agriculture. These sectors are well suited to the liability profile of the pension plans for which PSP Investments manages assets. Natural Resources will continue to prioritize sizable, direct, long-term investments and building scale with like-minded partners. The group believes our partnerships with a growing number of best-in-class, local operators provide us with meaningful comparative advantages.
Natural Resources generated record investment income of almost $500 million in fiscal year 2017. This was driven by strong cash flows and valuation gains, primarily in timber and agriculture. Natural Resources also made five new investments in the US and Australia and expanded four existing agricultural platforms.
f Net assets under management grew by $1.2 billion on a year-over-year basis, resulting primarily from net deployments of $729 million and valuation gains.
f Timber and agriculture accounted for most of the increase in net assets.
f Longstanding investments in timber continued to account for most investment income and assets under management.

ANNUAL REPORT 2017 | PSP INVESTMENTS 46
PRIVATE DEBT
Private Debt focuses on direct non-investment grade primary and secondary credit investments in North America and Europe. Our group has the ability to commit to large positions and different portions of the debt capital structure in both loan and bond form. We balance credit quality, structure, deployment opportunity, risk-return profile, asset mix and portfolio diversification, among other considerations.
Private Debt’s strong fiscal 2017 performance was driven by fee and interest income and positive mark-to-market gains. The team deployed significant amounts of capital in an attractive risk reward profile and benefited from a broad market rally. Performance also benefited by the ramp up nature of the asset class, which in early years enhances the impact of fee income and mark-to-market gains from a return perspective. Notably, Private Debt’s actual asset mix, compared to initial targets set during the ramp up phase, contributed to the relative outperformance against the benchmark.
f After our first full year of operation, Private Debt – PSP Investments’ newest asset class – has completed its initial hiring plan and has established a significant presence in New York, London and Montréal.
f In fiscal year 2017, Private Debt’s allocation target was increased to 7% of PSP Investments’ total assets under management.
f During the year, the group committed a total of $4 billion across 30 transactions, including investments in first and second lien term loans, unitranche term loans, secured and unsecured bonds and a credit fund.
f Private Debt collaborated with our CIO Group and facilitated the CIO’s commitment to a senior equity investment in a point of sales and marketing data aggregator, which was allocated to the newly created Complementary Portfolio. The CIO Group’s senior equity investment was entered into alongside a Private Debt second lien investment.
f Portfolio diversification continues to improve in terms of geography, industry, equity sponsors and asset type. With the continued ramp up of our London operations, we ultimately expect approximately 75% of our portfolio to be exposed to markets in North America with the remaining portion exposed to markets in Europe.
$4.4 3.3%BILLIONNET ASSETS
OF TOTALNET ASSETS
ONE-YEAR RATE OF RETURN 27.5% SINCE INCEPTION
RATE OF RETURN (1.3 years)
23.2%
Benchmark return 12.4% Benchmark return 6.0%
DIVERSIFICATION BY SECTOR
As at March 31, 2017
● Consumer discretionary 28.2%● Technology 26.5%● Health care 1 5.8%● Industrials 1 2.1 %● Financials 6.9%● Materials 6.6%● Communications 2.2%● Consumer staples 1 .7%
PRODUCT SPLIT
As at March 31, 2017
● First Lien 45.3%● Non First Lien 54.7%
GEOGRAPHIC DIVERSIFICATION
As at March 31, 2017
● US 92.0%● Europe 8.0%

PSP INVESTMENTS | ANNUAL REPORT 2017 47
PERFORMANCE MEASUREMENT AND EVALUATION
Based on its Statement of Investment Policies, Standards and Procedures (SIP&P), PSP Investments evaluates its investment strategies, as well as individual investment mandates, through performance measurement.
The time-weighted rate of return methodology is used to calculate returns for the Public Markets and Private Debt asset classes and for the total portfolio, while the internal rate of return methodology is used to calculate returns for the Real Estate, Private Equity, Infrastructure and Natural Resources asset classes.
For the total portfolio return, performance is calculated net of expenses. The returns for private market asset classes are presented net of currency hedging. The performance for each investment strategy and mandate is compared to an appropriate benchmark.
BENCHMARKS A combined Policy Portfolio benchmark (“Policy Benchmark”) is constructed using the asset class benchmarks weighted by the actual portfolio asset class weightings. The return for each asset class is compared to the relevant benchmark return, while PSP Investments’ overall return is compared to the Policy Benchmark return.
The following benchmarks were used to measure relative performance for each asset class and for the Policy Benchmark return for fiscal year 2017.
ASSET CLASS BENCHMARK
Equity
Canadian equity S&P/TSX Composite Index
US large cap equity S&P 500 Index
EAFE large cap equity MSCI EAFE Index
Small cap equity S&P 600 Index
Emerging markets equity MSCI EMF Index
Private equityPrivate Equity Fund Universe and Private Equity Cost of Capital1
Government fixed income
Cash and cash equivalents FTSE TMX Canada 91 Day T Bill Index
Fixed income
JP Morgan World Government Bonds, Barclays World Government Four Country ILB Index1, FTSE TMX Canada Government Bonds, FTSE TMX Canada Corporate Bonds, and FTSE TMX Canada Universe Bond Index
Credit
Private Debt2 Private Debt Indexes1
Real assets
Real Estate Real Estate Cost of Capital1
Infrastructure Inflation Adjusted Infrastructure Risk Premium and Infrastructure Cost of Capital1
Natural Resources Natural Resources Cost of Capital1
1 Customized benchmark.2 The Private Debt asset class was created in fiscal year 2016.
During fiscal year 2017, as part of the review of our compensation framework, we reviewed the benchmarks of many asset classes in order to improve their alignment with their respective investment strategies and market performance. The revised benchmarks came into effect on April 1, 2017 and will be used to evaluate our performance for fiscal year 2018.
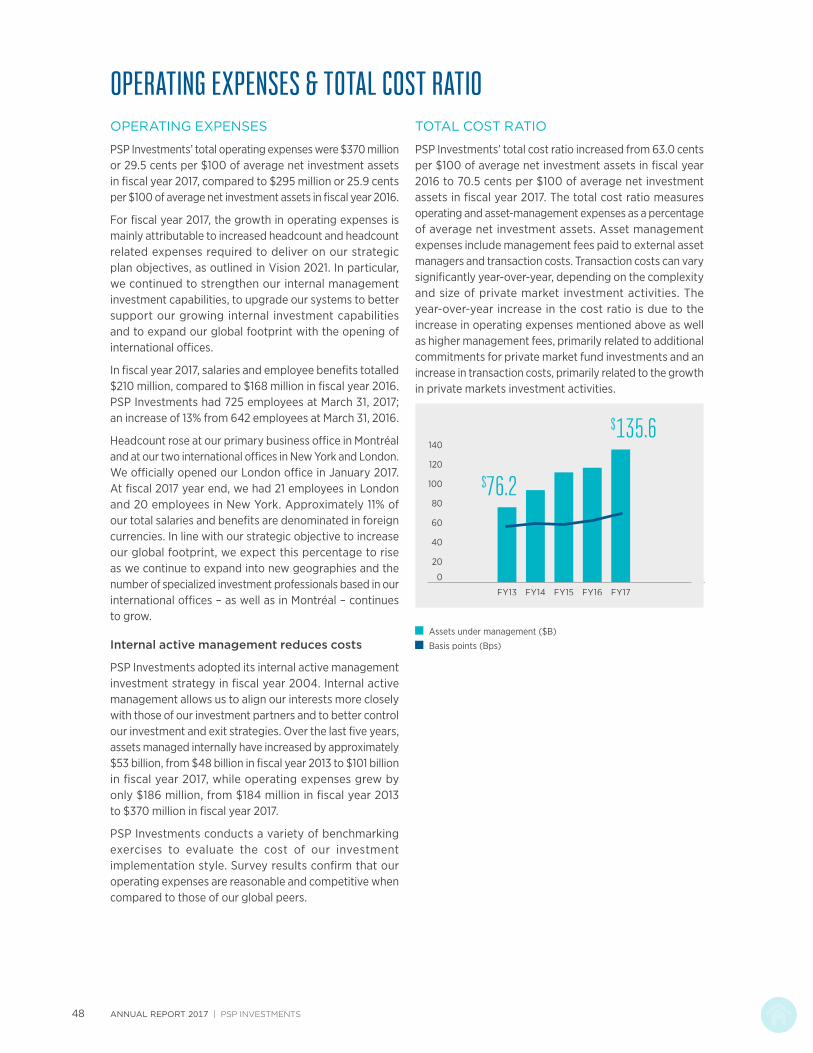
ANNUAL REPORT 2017 | PSP INVESTMENTS 48
OPERATING EXPENSES & TOTAL COST RATIOOPERATING EXPENSES
PSP Investments’ total operating expenses were $370 million or 29.5 cents per $100 of average net investment assets in fiscal year 2017, compared to $295 million or 25.9 cents per $100 of average net investment assets in fiscal year 2016.
For fiscal year 2017, the growth in operating expenses is mainly attributable to increased headcount and headcount related expenses required to deliver on our strategic plan objectives, as outlined in Vision 2021. In particular, we continued to strengthen our internal management investment capabilities, to upgrade our systems to better support our growing internal investment capabilities and to expand our global footprint with the opening of international offices.
In fiscal year 2017, salaries and employee benefits totalled $210 million, compared to $168 million in fiscal year 2016. PSP Investments had 725 employees at March 31, 2017; an increase of 13% from 642 employees at March 31, 2016.
Headcount rose at our primary business office in Montréal and at our two international offices in New York and London. We officially opened our London office in January 2017. At fiscal 2017 year end, we had 21 employees in London and 20 employees in New York. Approximately 11% of our total salaries and benefits are denominated in foreign currencies. In line with our strategic objective to increase our global footprint, we expect this percentage to rise as we continue to expand into new geographies and the number of specialized investment professionals based in our international offices – as well as in Montréal – continues to grow.
Internal active management reduces costs
PSP Investments adopted its internal active management investment strategy in fiscal year 2004. Internal active management allows us to align our interests more closely with those of our investment partners and to better control our investment and exit strategies. Over the last five years, assets managed internally have increased by approximately $53 billion, from $48 billion in fiscal year 2013 to $101 billion in fiscal year 2017, while operating expenses grew by only $186 million, from $184 million in fiscal year 2013 to $370 million in fiscal year 2017.
PSP Investments conducts a variety of benchmarking exercises to evaluate the cost of our investment implementation style. Survey results confirm that our operating expenses are reasonable and competitive when compared to those of our global peers.
TOTAL COST RATIO
PSP Investments’ total cost ratio increased from 63.0 cents per $100 of average net investment assets in fiscal year 2016 to 70.5 cents per $100 of average net investment assets in fiscal year 2017. The total cost ratio measures operating and asset-management expenses as a percentage of average net investment assets. Asset management expenses include management fees paid to external asset managers and transaction costs. Transaction costs can vary significantly year-over-year, depending on the complexity and size of private market investment activities. The year-over-year increase in the cost ratio is due to the increase in operating expenses mentioned above as well as higher management fees, primarily related to additional commitments for private market fund investments and an increase in transaction costs, primarily related to the growth in private markets investment activities.
40
20
0
60
80
100
120
140
FY13 FY14 FY15 FY16 FY17
$76.2
$135.6
Assets under management ($B)
Basis points (Bps)

PSP INVESTMENTS | ANNUAL REPORT 2017 49
ENTERPRISE RISK MANAGEMENTRISK MANAGEMENT
PSP Investments strives to maintain a risk-aware culture in which undue risks are avoided and calculated risks are taken in order to pursue investment objectives. All employees are active participants in risk identification, as well as in risk evaluation, management, mitigation, monitoring and reporting.
To support PSP Investments’ efforts to achieve its five-year strategic plan, Vision 2021, a full spectrum of risks is managed on an integrated, enterprise-wide basis, reflecting our focus on the total fund.
Key policies which outline the guiding principles governing PSP Investments’ overall philosophy, values, culture and approach with respect to risk management are illustrated below.
KEY RISK POLICIES
STATEMENT OF INVESTMENT POLICIES, STANDARDS AND PROCEDURES (SIP&P)
Describes the composition of the Policy Portfolio, how PSP Investments is to carry out its investment activities and its risk management framework
ENTERPRISE RISK MANAGEMENT (ERM) POLICY
Provides a framework for identifying, evaluating, managing, mitigating,
monitoring and reporting investment and non-investment risks
LEVERAGE POLICY
Ensures the best use of PSP Investments’ borrowing
capabilities and safeguards its AAA credit rating
OPERATIONAL RISK MANAGEMENT (ORM) POLICY
Defines the framework and requirements for implementing e�ective practices to identify,
evaluate, manage, monitor and report operational risks
INVESTMENT RISK MANAGEMENT (IRM) POLICY
Defines guiding principles and frames boundaries for the prudent and proactive
management of investment risks
RISK APPETITE
STATEMENT
On behalf of PSP Investments, J.-F. Bureau, Senior Vice President and Chief Risk Officer, won the 2016 Institutional Investor Intelligence Award for Public Plan Sponsors (North America) in the Risk Culture category.
The Institutional Investor Intelligence Awards recognize the exceptional work of the most outstanding and innovative public plan sponsors in North America.
“Implementing our Risk Appetite Statement was a great accomplishment. We created a PSP Investments’ specific product that is both extremely useful in real life and a powerful tool for educating employees and spreading our risk awareness culture within the organization.”
– J.-F. Bureau

ANNUAL REPORT 2017 | PSP INVESTMENTS 50
RISK APPETITE STATEMENT
The Risk Appetite Statement (RAS), approved by the Board of Directors and summarized in the Risk Appetite Overview, articulates PSP Investments’ appetite for, and attitude and tolerance to, risk in pursuit of our mandate.
The RAS also distinguishes the role of the Board in relation to that of management and defines PSP Investments’ overall risk governance structure. The RAS sets basic goals, benchmarks, parameters and limits for the risks assumed, and provides thresholds for PSP Investments’ ongoing investment activities.
ENTERPRISE RISK MANAGEMENT POLICY
The Enterprise Risk Management (ERM) Policy defines and categorizes the enterprise risks inherent to our activities and facilitates an understanding of them. The following table identifies various categories of risk and the corresponding risk policy frameworks to manage them.
ENTERPRISE RISK MANAGEMENT POLICY
ENTERPRISE RISK CATEGORY APPLICABLE RISK POLICY FRAMEWORK
Investment risk − Market risk
− Liquidity risk
− Credit and counterparty risk
− Concentration risk
Investment Risk Management Policy
− Leverage risk Leverage Policy
Non-investment risk − Strategic risk
− Governance risk
− Stakeholder risk
− Legal and regulatory risk
− Operational risk
− Reputational risk
Enterprise Risk Management Policy
Operational Risk Management Policy
RISK MANAGEMENT GOVERNANCE
Sound internal governance with clear roles and responsibilities is the foundation of an effective enterprise risk management framework. To ensure appropriate accountability and clarify responsibilities, both the ERM and ORM policies incorporate a “Three lines of defence risk management framework”, as illustrated:
BOARD OF DIRECTORS AND BOARD COMMITTEES
SENIOR MANAGEMENT COMMITTEESE
xter
nal a
udit
Risk and Investment Senior Management Group Valuation
New Business Activity Portfolio Construction and Management
Operations Coordination
First line of defence
− Business units
− Corporate services
Second line of defence
− Risk Management
− Compliance
− Others (e.g. Finance and Administration)
Third line of defence
− Internal Audit
PSP INVESTMENTS | ANNUAL REPORT 2017 51
RISK MANAGEMENT GROUP
Risk Management is headed by the Senior Vice President and Chief Risk Officer who reports directly to the President and CEO. On a quarterly basis, the Investment Committee of the Board of Directors has an individual in-camera meeting with the Chief Risk Officer.
MANDATE
− Independent oversight of both investment and non-investment risks within the boundaries of PSP Investments’ risk appetite.
− Supporting enterprise-wide activities by establishing effective risk management practices, procedures and processes.
The Risk Management group supports PSP Investments’ activities and is responsible for the independent oversight of both investment and non-investment risks within the boundaries of PSP Investments’ risk appetite, by establishing effective practices and processes.
The use of risk data and information is key to the group’s ability to provide the monitoring and reporting capabilities required to support daily risk management activities. Metrics are monitored for both public and private markets and at a total portfolio level on an ongoing basis, and brought to the attention of senior management and the Board of Directors as required. The current structure is aligned to support a total portfolio management total risk view.
f For Public Markets, the group monitors and reports on all aspects of investment risk for publicly-traded securities. Aligned with best industry practices, market risk activities include quantitatively measuring risk at the total portfolio and active management program level, performing portfolio stress tests, sensitivity analyses and monitoring risk metrics relevant to specific portfolios. In addition to aggregated risk figures, a thorough decomposition of various risk factors is performed for Public Markets portfolios for continuous improvement of portfolio analytics and reporting.
f Our Credit and Counterparty team performs formal fundamental credit analysis on all counterparties and brokers, and reviews external credit ratings of all counterparties and brokers/dealers. The team also monitors and reports on liquidity and ensures that investments held meet high standards in terms of liquidity and credit profiles within limits and guidelines established by PSP Investments.
f A Risk Management team dedicated to Private Markets performs fundamental analysis for Private Markets and assigns an internal risk ratings and covenants to these transactions. The team performs regular risk rating reviews of the existing Private Markets investments, monitors the compliance of existing covenants and participates in the valuation process of existing investments. It also monitors and reports on a quarterly basis private market investment risks to PSP Investments’ Management.
In addition, the group maintains a timely awareness of changing market conditions and emerging risks to proactively respond to the needs of PSP Investments’ Board and senior management.
In accordance with its mandate derived from the ERM Policy and established by the Board of Directors, Risk Management:
f Reports independently on total fund and specific investment risks.
f Advises the President and CEO, the Board of Directors, and investment professionals of key risks in the total fund and individual positions.
f Suggests proactive opportunities to manage risk.
RISK IDENTIFICATION AND ASSESSMENT
In conformity with industry best practices, PSP Investments undertakes an annual risk and control self-assessment exercise. The exercise is a core component of the ERM framework and contributes to its ongoing refinement. The exercise provides a current view of both the internal and external risks inherent to PSP Investments’ activities. It also serves to raise risk awareness on an enterprise-wide level by initiating a discussion on risk and clearly defining risk ownership, mitigation effectiveness and accountability.
ANNUAL REPORT 2017 | PSP INVESTMENTS 52
INTERNAL AUDITInternal Audit enhances and protects organizational value by providing risk-based and objective assurance, advice and insight.
The Internal Audit group assists PSP Investments in accomplishing its objectives by bringing a systematic and disciplined approach to evaluate and improve the effectiveness of risk management, controls and governance processes. The group supports the Audit Committee in effectively discharging its responsibilities. It provides recommendations to management and the Audit Committee in order to support decision making at the operational and strategic levels. The duties of Internal Audit also comprise auditing all of PSP Investments’ activities by focusing on high-risk areas and promoting sound governance, risk management and control processes.
Over the normal course of business in fiscal year 2017, Internal Audit continued to perform a variety of risk-based, recurring and non-recurring internal audit mandates with the support of external consultants. At the request of management and the Audit Committee, advisory activities undertaken in fiscal year 2017 led to recommendations to help PSP Investments continuously strengthen its controls and improve the efficiency of its processes.
COMPLIANCECompliance acts to ensure that all employees, business practices and behaviours are fully aligned with internal policies, procedures and regulatory requirements. It also monitors PSP Investments’ investment activities.
ETHICS
PSP Investments’ standards of integrity and ethics are outlined in our Code of Conduct, which is available on our website. A whistleblowing and non-retaliation provision protects those who report fraudulent or inappropriate activities; violators are subject to appropriate disciplinary measures. The Compliance Officer reports on a quarterly basis to the Governance Committee of the Board.
EMPLOYEE CODE GUIDELINES
Personal and professional conduct
Conflicts of interest
Gifts and other benefits
Fraud and corruption
Protection of assets and information
Personal trading
INVESTMENT COMPLIANCE, OVERSIGHT AND ADVISORY
In addition to its responsibilities for monitoring daily trading activity, overseeing regulatory filings and providing periodic reports to the Board’s Audit Committee, Compliance works in conjunction with Legal Affairs to keep abreast of regulatory changes and implement the controls required to support PSP Investments’ operations.
FRAUD PREVENTION
Integrity is one of PSP Investments’ core values and we have a zero tolerance policy with respect to corruption and fraud, including insider trading, collusion, falsification of records or information, asset misappropriation, abuse of position and bribery.

PSP INVESTMENTS | ANNUAL REPORT 2017 53
MESSAGE FROM THE CHAIR OF THE GOVERNANCE COMMITTEEAt PSP Investments, we are committed to high standards of corporate governance. Effective governance is essential to ensure that appropriate objectives are pursued and achieved.
For PSP Investments, governance begins with our legislative mandate. We are the exclusive provider of investment management services to the Government of Canada for the amounts transferred to PSP Investments for the pension plans of the Public Service of Canada, the Canadian Forces, the Royal Canadian Mounted Police and the Reserve Force. PSP Investments is a professional investment manager that makes independent investment decisions. We operate at arm’s length from the Government but have reporting obligations to the Government and to contributors and beneficiaries.
The Governance Committee of the Board of Directors regularly reviews PSP Investments’ corporate governance framework to ensure that it meets robust standards of corporate governance while serving the interests of all stakeholders. Several governance-related initiatives were led by the Governance Committee in fiscal year 2017, in preparation for the expected changes on the Board in the coming years. This included a thoughtful succession planning process.
The following section provides an overview of the roles and composition of the Board of Directors and its committees, and describes the key governance policies and practices that guide PSP Investments’ activities and behaviour.
Garnet Garven
GOVERNANCE
Governance

ANNUAL REPORT 2017 | PSP INVESTMENTS 54
ACCOUNTABILITY
PSP Investments is a Crown corporation with a unique governance and accountability regime that is set out in the Public Sector Pension Investment Board Act. The Act provides that PSP Investments operates at arm’s length from the Government of Canada and imposes on it reporting obligations to the Government, and to contributors and beneficiaries of the pension plans.
The Board of Directors is responsible for the selection, appointment, performance evaluation and compensation of the President and CEO, who reports to the Board. PSP Investments reports to the ministers responsible for the pension plans through its quarterly financial statements and annual report. The annual report must be made available to contributors to the pension plans and is tabled in each House of Parliament by the President of the Treasury Board.
The President and CEO, and the Board Chair are required to meet once a year with advisory committees appointed to oversee the Plans. PSP Investments is also required to hold an annual public meeting. The most recent annual meeting was held in Ottawa on November 24, 2016. In the execution of its statutory mandate, PSP Investments also communicates on an ongoing basis with the Chief Actuary of the Office of the Superintendent of Financial Institutions, the Treasury Board of Canada Secretariat and other Government officials.
Pursuant to the Financial Administration Act (FAA), the Auditor General of Canada and Deloitte LLP were appointed to serve as joint external auditors of PSP Investments for fiscal year 2017. The Office of the Auditor General of Canada is funded directly by Parliament and its costs and expenses are paid from an annual appropriation. This funding mechanism ensures its independence from the organizations it audits. For Deloitte LLP, PSP Investments has a formal process to evaluate the impacts of non-audit services on auditor independence. In fiscal year 2017, fees paid to Deloitte LLP totalled approximately $2.1 million, of which $1.5 million was for audit and audit-related services and $0.6 million for non-audit services. PSP Investments has implemented procedures when hiring current and former employees of the external auditors to ensure that auditor independence is maintained.
As stipulated in the FAA, the external auditors are responsible for conducting a special examination at least once every 10 years. PSP Investments’ last special examination was conducted in fiscal year 2011 to determine the organization’s financial and management controls, information systems and management practices were maintained in a manner that provides reasonable assurance that they met FAA requirements. As required by the Act, the report on such Special Examination formed part of the annual report for fiscal year 2011.
ROLE OF THE BOARD
According to the Act, PSP Investments’ operations and activities are overseen by a Board of Directors composed of 11 members, including the Board Chair. Directors are appointed by the Governor in Council on the recommendation of the President of the Treasury Board to hold office during good behaviour for a term not exceeding four years. Pursuant to the Act, candidates for directorships are selected from a list of qualified Canadian residents proposed by an external nominating committee (“External Nominating Committee”), as established by the President of the Treasury Board.
The External Nominating Committee operates separately from the Board of Directors, the President of the Treasury Board and the Treasury Board Secretariat. Members of the Senate, the House of Commons and provincial legislatures, employees of PSP Investments and the Government, and any individual entitled to benefits from the Plans are disqualified from serving as directors. On the recommendation of the President of the Treasury Board, and after consultation with members of the Board of Directors, and with the Minister of National Defence and the Minister of Public Safety and Emergency Preparedness, the Governor in Council appoints the Board Chair. On the expiry of the term of an incumbent director, the incumbent may be reappointed; in any event, he or she continues in office until a successor is appointed.
The Board has delegated to the President and Chief Executive Officer the authority to manage and direct the day-to-day affairs of PSP Investments. In fulfilling its responsibilities, the Board defines its role to include three fundamental elements: decision making, oversight and insight.
ROLE DESCRIPTION
Decision making The Act provides for a number of decisions that cannot be delegated to management. Where appropriate, the Board makes such decisions with advice from management.
Oversight The Board provides oversight by supervising the management and overseeing risks of PSP Investments.
Insight The Board provides insight by advising management on such matters as markets, strategy, stakeholder relations, human resources and negotiating tactics.

PSP INVESTMENTS | ANNUAL REPORT 2017 55
STATEMENT OF INVESTMENT POLICIES, STANDARDS AND PROCEDURES (SIP&P)
In accordance with paragraph 7(2)(a) of the Public Sector Pension Investment Board Act, the Board of Directors must approve the Statement of Investment Policies, Standards and Procedures (SIP&P), which describes our investment approach, and review it at least annually. In addition to the allocation of assets under the Policy Portfolio, the SIP&P addresses matters such as categories of investments and loans; risk management and diversification; liquidity of investments; pledging of assets, permitted borrowings and leverage; securities lending and borrowing; valuation of investments; and proxy voting and responsible investment.
A key Board responsibility is to approve a strategic plan. PSP Investments is scaling in an increasingly competitive marketplace. In fiscal year 2016, senior management – with Board support – undertook a comprehensive organizational review to define PSP Investments’ investment and operational philosophies. The review culminated in a five-year strategic plan, Vision 2021, that was approved by the Board in fiscal year 2016. The Board acts as a strategic partner to senior management by overseeing the implementation of corporate initiatives developed to achieve Vision 2021.
Other key Board responsibilities include:
f Appointment and termination of the President and CEO.
f Approval of the Statement of Investment Policies, Standards and Procedures (SIP&P) for each pension plan account.
f Approval of strategies for achieving investment objectives and benchmarks against which to measure performance.
f Approval of appropriate policies for the proper conduct and management of PSP Investments.
f Approval of a Risk Appetite Statement as well as risk management policies on enterprise, investment and operational risk.
f Approval of human resources and compensation policies, and establishment of appropriate performance evaluation processes for Board members, the President and CEO, and other senior management members.
f Approval of quarterly and annual financial statements for each Pension Plan Account and for PSP Investments as a whole.
For details: Board of Directors, Terms of Reference.
BOARD COMMITTEES
The Board of Directors has four standing committees to assist in the fulfillment of its obligations:
BOARD COMMITTEE MANDATE OVERVIEW KEY ACTIVITIES IN FISCAL YEAR 2017
Investment Committee Oversees PSP Investments’ investment management function.
− Reviewed and approved 21 investments.
− Oversaw the creation of new total fund portfolios.
Audit Committee Reviews financial statements and the adequacy and effectiveness of internal control systems.
− Assisted in the successful transition of auditing partners at Deloitte LLP and at the Office of the Auditor General, as well as the onboarding of a new Vice President, Internal Audit and Vice President, Finance and Administration.
− Approved two Canadian domestic debt term issuances.
Governance Committee Monitors governance matters and develops related policies.
Oversees the application of the Director Code of Conduct and of the Employee Code of Conduct.
− Reviewed director succession planning.
− Implemented a new onboarding program for directors.
− Conducted an extensive review of Board remuneration.
Human Resources and Compensation Committee
Ensures policies and procedures are in place to manage the human resources function efficiently and effectively, and to offer all employees fair and competitive compensation aligned with performance and risk targets.
− With the assistance of the Investment Committee, undertook a special review of performance benchmarks, threshold levels of performance and value-added objectives.
For details: Board committees, Terms of Reference.
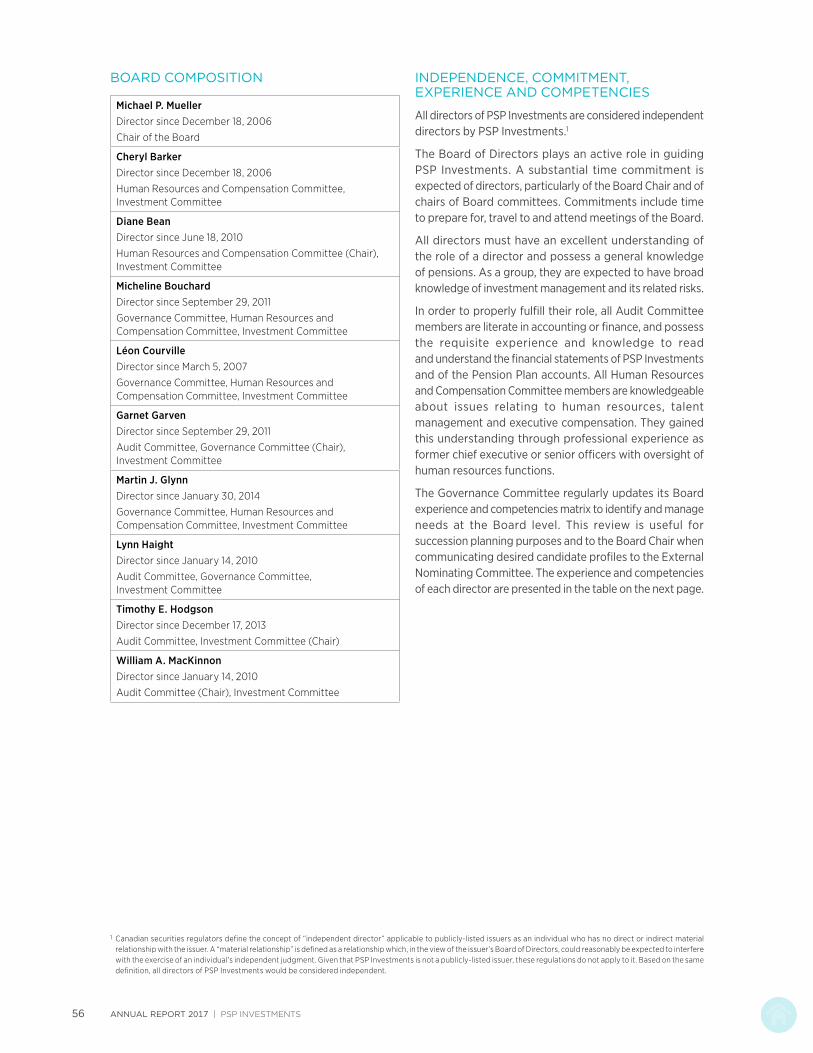
ANNUAL REPORT 2017 | PSP INVESTMENTS 56
BOARD COMPOSITION
Michael P. MuellerDirector since December 18, 2006
Chair of the Board
Cheryl BarkerDirector since December 18, 2006
Human Resources and Compensation Committee, Investment Committee
Diane BeanDirector since June 18, 2010
Human Resources and Compensation Committee (Chair), Investment Committee
Micheline BouchardDirector since September 29, 2011
Governance Committee, Human Resources and Compensation Committee, Investment Committee
Léon CourvilleDirector since March 5, 2007
Governance Committee, Human Resources and Compensation Committee, Investment Committee
Garnet GarvenDirector since September 29, 2011
Audit Committee, Governance Committee (Chair), Investment Committee
Martin J. GlynnDirector since January 30, 2014
Governance Committee, Human Resources and Compensation Committee, Investment Committee
Lynn HaightDirector since January 14, 2010
Audit Committee, Governance Committee, Investment Committee
Timothy E. HodgsonDirector since December 17, 2013
Audit Committee, Investment Committee (Chair)
William A. MacKinnonDirector since January 14, 2010
Audit Committee (Chair), Investment Committee
INDEPENDENCE, COMMITMENT, EXPERIENCE AND COMPETENCIES
All directors of PSP Investments are considered independent directors by PSP Investments.1
The Board of Directors plays an active role in guiding PSP Investments. A substantial time commitment is expected of directors, particularly of the Board Chair and of chairs of Board committees. Commitments include time to prepare for, travel to and attend meetings of the Board.
All directors must have an excellent understanding of the role of a director and possess a general knowledge of pensions. As a group, they are expected to have broad knowledge of investment management and its related risks.
In order to properly fulfill their role, all Audit Committee members are literate in accounting or finance, and possess the requisite experience and knowledge to read and understand the financial statements of PSP Investments and of the Pension Plan accounts. All Human Resources and Compensation Committee members are knowledgeable about issues relating to human resources, talent management and executive compensation. They gained this understanding through professional experience as former chief executive or senior officers with oversight of human resources functions.
The Governance Committee regularly updates its Board experience and competencies matrix to identify and manage needs at the Board level. This review is useful for succession planning purposes and to the Board Chair when communicating desired candidate profiles to the External Nominating Committee. The experience and competencies of each director are presented in the table on the next page.
1 Canadian securities regulators define the concept of “independent director” applicable to publicly-listed issuers as an individual who has no direct or indirect material relationship with the issuer. A “material relationship” is defined as a relationship which, in the view of the issuer’s Board of Directors, could reasonably be expected to interfere with the exercise of an individual’s independent judgment. Given that PSP Investments is not a publicly-listed issuer, these regulations do not apply to it. Based on the same definition, all directors of PSP Investments would be considered independent.

PSP INVESTMENTS | ANNUAL REPORT 2017 57
DIRECTORS’ EXPERIENCE AND COMPETENCIES
CEO
C-Su
ite
or e
quiv
alen
t po
siti
on
Oth
er D
irec
tors
hips
Inte
rnat
iona
l Ex
peri
ence
Rea
l Est
ate
Infr
astr
uctu
re
Priv
ate
Equi
ty
Publ
ic M
arke
ts
Priv
ate
Deb
t
Nat
ural
Res
ourc
es
Inve
stm
ent
Ris
k M
anag
emen
t
Cre
dit
Ris
k M
anag
emen
t
Ope
rati
ons
Ris
k M
anag
emen
t
Fina
nce
Acc
ount
ing
Hum
an R
esou
rces
Gov
erna
nce
Pens
ion
Gov
erna
nce
Pens
ion
Fina
nce
Cheryl Barker • • • • • • • • • • •
Diane Bean • • • • • • • • •
Micheline Bouchard • • • • • • • • • • •
Léon Courville • • • • • • • • • •
Garnet Garven • • • • • • • • •
Martin J. Glynn • • • • • • • • • • • • • • •
Lynn Haight • • • • • • • • • • • • • •
Timothy E. Hodgson • • • • • • • • • • • • • • • • • •
William A. MacKinnon • • • • • • • • • •
Michael P. Mueller • • • • • • • • • • •
CONDUCT OF BOARD AND BOARD COMMITTEE MEETINGS
Board members have in-depth knowledge of PSP Investments and are able to exercise management oversight and to provide strategic insight, when appropriate. There is active discussion at the Board and Board committee levels between directors and management. Upon request, Board members have access to PSP Investments’ records and employees.
All regular Board and committee meetings include in-camera sessions which no members of management attend. The Board has individual in-camera meetings with the President and CEO.
The Audit Committee has individual in-camera meetings with each of the internal and external auditors, and with the Chief Financial Officer. The Investment Committee has individual in-camera meetings with the Chief Risk Officer.
Once a year, a strategic session for members of the Board and senior management is organized to hold in-depth discussions on investments and risk-related topics.
To fulfill the duties set out in the Act and in their respective Terms of Reference, the Board and its committees may consult with external advisors. During fiscal year 2017, the Board, as well as the Governance Committee and the Human Resources and Compensation Committee, sought the services of external consultants. The Board and its committees may consider the recommendations of independent advisors on a case-by-case basis but are solely responsible for any decisions taken.
ASSESSMENT OF BOARD PERFORMANCE
The Governance Committee oversees the formal process for evaluating the performance of the Board Chair, the chairs of Board committees, individual directors and the Board as a whole. All directors, as well as the President and CEO, and certain senior management members, participate in the evaluation process. The Chair of the Governance Committee presents evaluation results to the Board of Directors. The ensuing discussions focus on achievements and expectations, and on concerns and opportunities for improvement, following which any measures deemed necessary are implemented.

ANNUAL REPORT 2017 | PSP INVESTMENTS 58
DIRECTORS’ CODE OF CONDUCT
The Director Code was developed to provide a practical framework to help directors better understand PSP Investments’ principles and values. In addition to ensuring compliance with minimum statutory requirements, the Code reflects the expectation that directors have the highest levels of integrity and ethical standards. The Director Code outlines a workable process for identifying, minimizing and resolving potential conflicts of interest. It is derived from the Act and the Conflict of Interest Act, and details the statutory and fiduciary duties of directors in relation to conflicts of interest. The Director Code also ensures that directors have a thorough understanding and appreciation of PSP Investments’ principles and values. In sum, it assists directors in determining appropriate business practices and behaviour.
Among other stipulations, the Director Code:
f Requires directors to make full and immediate disclosure of the nature and extent of their interest in an investment transaction or proposed investment transaction.
f Prohibits directors from voting on a resolution or participating in a discussion about a matter or in any circumstance in which they may have a conflict of interest.
f Requires the disclosure of any business activity in which they participate that directly or indirectly affects or is in competition with PSP Investments’ activities.
f Prohibits the acceptance of certain types of gifts.
f Prohibits any form of fraud, bribery or corrupt practice and requires the immediate reporting of any knowledge of such activity.
f Requires directors to pre-clear all personal trading of securities, except exempt trades, and to report all personal trading activities on a quarterly basis.
For details: Governance Committee, Director Code.
DIRECTOR EDUCATION AND ONBOARDING
To enhance directors’ financial knowledge and skills, PSP Investments created a director education program. Through this program, directors are allocated an education and training budget to be used primarily to take individual courses, attend conferences and procure reading material to strengthen their understanding of investment management. Directors are required to report on their individual development plans on an annual basis. On occasion, the director education program provides for educational forums to be held during Board meetings to which speakers are invited to make presentations that contribute to the individual and collective expertise of Board members. During fiscal year 2017, presentations were made on such topics as thematic investments, global emerging markets strategies and the outlook of global financial markets.
Newly-appointed directors are expected to complete an in-house onboarding program that provides information about PSP Investments’ culture and operations. The program is designed so directors can contribute effectively as Board members. In preparation for the expected arrival of a new director, the Governance Committee reviewed and revised the onboarding program in fiscal year 2017 in order to facilitate the integration of new directors.
The Governance Committee oversees the director education and the onboarding programs.

PSP INVESTMENTS | ANNUAL REPORT 2017 59
Directors’ remuneration
The approach to directors’ remuneration adopted by the Board reflects the requirements of the Act. The first requirement is that the Board should include a sufficient number of directors with proven financial ability or relevant work experience such that PSP Investments is able to achieve its mandate effectively. The second requirement is that directors’ remuneration should be set “having regard to the remuneration received by persons having similar responsibilities and engaged in similar activities”.
The Board reviews directors’ remuneration once every two years and considers any warranted changes based on a report and recommendations provided to it by the Governance Committee.
During fiscal year 2017, directors were remunerated, as follows:
DIRECTORS’ REMUNERATION FOR FISCAL YEAR 2017
Annual retainer for the Board Chair $160,000
Annual retainer for each director other than the Board Chair $35,000
Annual retainer for each Board Committee Chair $15,000
Attendance fee for each Board meeting $1,5001, 2
Attendance fee for each committee meeting $1,5001, 2
Travel fees for a director attending a Board meeting in person, if his or her primary residence is outside Québec or Ontario, or when a Board of Directors or Board committee meeting is held in a location outside Québec and a director is required to travel more than three hours from his or her primary residence to attend it. $1,500
1 For a meeting that lasts less than one hour – $500.2 A single meeting fee will be paid to a director who attends concurrent meetings of the Board of Directors and a committee.
Directors are not entitled to additional remuneration in the form of retirement benefits or short-term or long-term incentives.
In fiscal year 2017, the Board of Directors met 11 times and its committees held 29 meetings. Total 2017 remuneration for Directors was $912,000.
The following tables provide further details:
ATTENDANCE AT MEETINGS OF THE BOARD OF DIRECTORS AND BOARD COMMITTEES
Board ofDirectors
InvestmentCommittee
AuditCommittee
GovernanceCommittee
Human Resources and Compensation
Committee
Regular Special Regular Special Regular Special Regular Special Regular Special
Number of meetings Fiscal Year 20171 9 2 5 5 6 4 5 4
Cheryl Barker 9/9 2/2 4/5 5/5 4/5 4/4
Diane Bean 8/9 2/2 4/5 5/5 4/5 4/4
Micheline Bouchard 9/9 2/2 5/5 5/5 4/4 5/5 4/4
Léon Courville 9/9 2/2 5/5 4/5 4/4 5/5 4/4
Garnet Garven 9/9 2/2 5/5 5/5 6/6 4/4
Martin J. Glynn 9/9 2/2 5/5 4/5 3/4 4/5 4/4
Lynn Haight 9/9 2/2 5/5 5/5 6/6 4/4
Timothy E. Hodgson2 9/9 2/2 5/5 5/5 6/6 4/4
William A. MacKinnon 9/9 2/2 5/5 5/5 6/6
Michael P. Mueller3 9/9 2/2 5/5 5/5 6/6 4/4 5/5 4/4
1 Certain Committee meetings were held concurrently with Board of Directors meetings.2 As part of the review of the benchmarks, thresholds and value-added objectives for performance measurement and incentive compensation purposes, Mr. Hodgson, as
Chair of the Investment Committee, attended certain meetings of the Human Resources and Compensation Committee.3 Mr. Mueller is an ex-officio member of the Audit Committee, Governance Committee and Human Resources and Compensation Committee.
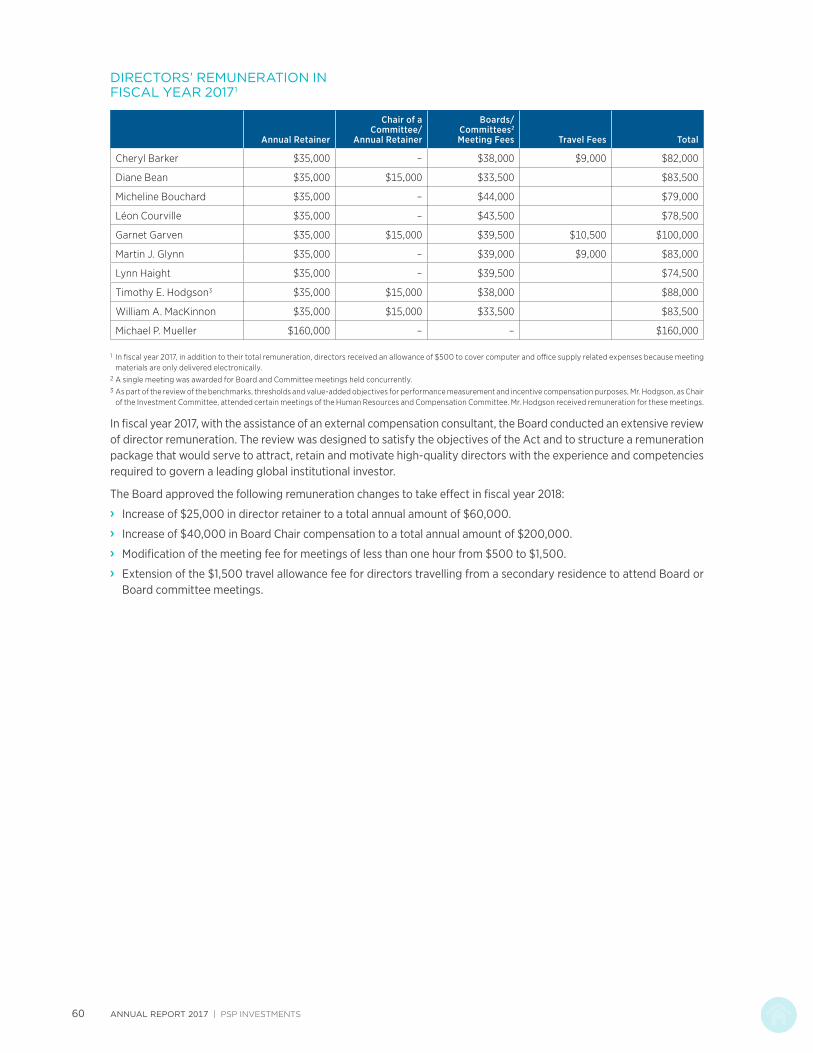
ANNUAL REPORT 2017 | PSP INVESTMENTS 60
DIRECTORS’ REMUNERATION IN FISCAL YEAR 20171
Annual Retainer
Chair of a Committee/
Annual Retainer
Boards/ Committees2 Meeting Fees Travel Fees Total
Cheryl Barker $35,000 – $38,000 $9,000 $82,000
Diane Bean $35,000 $15,000 $33,500 $83,500
Micheline Bouchard $35,000 – $44,000 $79,000
Léon Courville $35,000 – $43,500 $78,500
Garnet Garven $35,000 $15,000 $39,500 $10,500 $100,000
Martin J. Glynn $35,000 – $39,000 $9,000 $83,000
Lynn Haight $35,000 – $39,500 $74,500
Timothy E. Hodgson3 $35,000 $15,000 $38,000 $88,000
William A. MacKinnon $35,000 $15,000 $33,500 $83,500
Michael P. Mueller $160,000 – – $160,000
1 In fiscal year 2017, in addition to their total remuneration, directors received an allowance of $500 to cover computer and office supply related expenses because meeting materials are only delivered electronically.
2 A single meeting was awarded for Board and Committee meetings held concurrently.3 As part of the review of the benchmarks, thresholds and value-added objectives for performance measurement and incentive compensation purposes, Mr. Hodgson, as Chair
of the Investment Committee, attended certain meetings of the Human Resources and Compensation Committee. Mr. Hodgson received remuneration for these meetings.
In fiscal year 2017, with the assistance of an external compensation consultant, the Board conducted an extensive review of director remuneration. The review was designed to satisfy the objectives of the Act and to structure a remuneration package that would serve to attract, retain and motivate high-quality directors with the experience and competencies required to govern a leading global institutional investor.
The Board approved the following remuneration changes to take effect in fiscal year 2018:
f Increase of $25,000 in director retainer to a total annual amount of $60,000.
f Increase of $40,000 in Board Chair compensation to a total annual amount of $200,000.
f Modification of the meeting fee for meetings of less than one hour from $500 to $1,500.
f Extension of the $1,500 travel allowance fee for directors travelling from a secondary residence to attend Board or Board committee meetings.

PSP INVESTMENTS | ANNUAL REPORT 2017 61
I have had the pleasure to chair the Human Resources and Compensation Committee (HRCC) for three consecutive years. The members of the HRCC assist the Board of Directors with human resources strategy, policies and procedures targeting compensation, pensions, talent management, succession planning and workforce diversity and inclusion.
In fiscal year 2017, our efforts focused on continuing to align human resources strategy and policies with the transformational changes recommended in Vision 2021, PSP Investments’ five-year strategic plan.
GROWTH AND TRANSITION
To successfully fulfil its mandate, PSP Investments will continue to strive to attract, develop and retain top talent from the investment and finance industries. We expect the organization’s rapid growth – and ambitious hiring trend – to continue over the short to medium term. At March 31, 2017, PSP Investments had 725 employees, an increase of 13% from 642 employees at March 31, 2016.
Our employee value proposition, with compensation as a cornerstone, must be compelling if we are to successfully compete for highly-skilled professionals with the right capabilities. It must also reflect industry practices and seek alignment with our obligations to stakeholders.
The HRCC is apprised of industry standards and employment trends among our Canadian peers and uses this information to ensure our employment offer is attractive and balanced. As PSP Investments expands its global footprint, the committee supports organizational efforts to implement a compensation and benefits structure for international employees, including a global mobility policy for expatriate assignments that is consistent with our compensation philosophy.
COMPENSATION
Over the past two years, with the arrival of our new President and CEO, the Board and management set out to redesign the compensation program with the overriding goals of creating one that is less formulaic, less volatile and less levered, as well as being better aligned with the long-term interests of our stakeholders: the Government of Canada and Plan contributors and beneficiaries. The Board and management also wanted to ensure that rewards could be differentiated by performance, and that performance goes beyond investment results to meaningfully include corporate, group and individual objectives, as well. Shifting investment performance measurement from primarily relative medium-term asset class results to a mix of relative and absolute long-term total fund results is key to aligning individual success with the success of the entire enterprise, and to encouraging collaboration across it. For the purpose of retention and alignment, a significant portion of compensation at the most senior levels is to be deferred subject to total fund performance and for a portion to performance conditions.
The HRCC believes that the incentive compensation framework implemented at the beginning of fiscal year 2017 achieves these goals. The revised design will pay appropriately for work well done, recognize outstanding performance, discourage undue risk taking and give the Board and management the tools and flexibility they need to make effective reward decisions.
To support our commitment for outperformance, during fiscal year 2017, PSP Investments undertook a comprehensive review of investment performance benchmarks and set target performance at competitive levels in relation to our peers. The new benchmarks and value-added objectives will be implemented at the beginning of fiscal year 2018.
REPORT OF THE HUMAN RESOURCESand Compensation Committee
Report of the Human Resources and Compensation Committee

ANNUAL REPORT 2017 | PSP INVESTMENTS 62
WORKFORCE DIVERSITY AND INCLUSION
PSP Investments is committed to employment equity and HRCC members commend President and CEO, André Bourbonnais, for taking steps to foster increased workplace diversity and inclusion. Most notable is the continuing rise in the percentage of women occupying managerial positions. Three of nine senior vice presidents are women: two were named in fiscal year 2016 and one was named in fiscal year 2017. The HRCC also supported a review of employment systems to identify and address representation gaps in hiring and employee development practices.
TALENT MANAGEMENT AND SUCCESSION PLANNING
The HRCC concurs with management’s focus on succession planning, talent attraction, learning and development and career growth. The Student Program, which provides entry-level summer positions and four-month internships to university students, continues to be successful. It strategically positions PSP Investments as an employer of choice on campus.
The HRCC will continue to discharge its mandate and offer sound judgment on human resources matters to management. I wish to thank my fellow committee members for their contributions in fiscal year 2017. I also wish to express my gratitude to PSP Investments’ human resources professionals for their work and dedication. It has been a busy year of accomplishment for all of us. Congratulations to everyone for a job well done.
Diane Bean Chair, Human Resources and Compensation Committee
PSP INVESTMENTS | ANNUAL REPORT 2017 63
HRCC GOVERNANCE PROCESSThe Human Resources and Compensation Committee (HRCC) assists the Board of Directors with human resources matters, including talent management and compensation.
The HRCC is composed of directors who are knowledgeable about these issues. In fiscal year 2017, committee members were:
f Diane Bean (Chair)
f Cheryl Barker
f Micheline Bouchard
f Léon Courville
f Martin J. Glynn
The Board of Directors ensures that PSP Investments’ executive compensation and incentives are consistent with PSP Investments’ Compensation Policy. In fiscal year 2016 and in fiscal year 2017, the services of an independent compensation consulting firm were retained to assist the HRCC in its review of executive compensation and the incentive compensation framework. The compensation consulting firm reports solely to the HRCC.
NEW COMPENSATION PROGRAM
In a highly competitive market for qualified personnel, the Compensation Policy is designed to attract and retain talented employees, reward performance and reinforce business strategies and priorities. The Board recognizes the fundamental value of a motivated and committed team, and strongly believes that the recruitment and retention of high-performing employees is critical to PSP Investments’ ongoing success.
PSP Investments completed a comprehensive review of its short-term and long-term incentive plans in fiscal year 2016. In terms of incentives, the review was designed to achieve three primary objectives:
f To make incentives less formulaic and more subject to informed discretion.
f To solidify alignment with long-term stakeholders’ interests.
f To ensure alignment with our five-year corporate strategy, Vision 2021.
The new incentive plan, which includes annual and deferred payout components, is described on the next page. The plan’s first annual payouts were determined at fiscal 2017 year end.
PSP Investments’ compensation framework is driven by a pay for performance approach that focuses on both absolute and relative performance assessments and:
f Rewards long-term performance.
f Discourages short-term decision making and undue risk taking.
f Ensures that total fund investment performance is a component of incentives at all organizational levels in order to encourage and reinforce the benefits of enterprise-wide collaboration and to align efforts to achieve PSP Investments’ mandate.
f Establishes incentives as a significant component of target total compensation for senior management.
To implement the pay for performance approach, the Board established a Compensation Policy that aims to maintain total compensation at a fair and competitive level. Compensation is aligned with PSP Investments’ strategic plan and integrated with business performance measurement. The Compensation Policy provides balanced performance-based compensation to reward responsible risk taking. Total compensation includes base salary, annual cash and deferred cash, benefits, pension and other forms of compensation.
COMPENSATION DISCUSSION AND ANALYSIS
Compensation discussion and analysis summarizes the foundational principles of our compensation and incentive plans, reviews the elements of our new compensation program and provides details on performance results and remuneration paid to Named Executive Officers (NEOs), including:
f André Bourbonnais – President and CEO
f Neil Cunningham – Senior Vice President, Global Head of Real Estate Investments
f Daniel Garant – Executive Vice President and Chief Investment Officer
f Anik Lanthier – Senior Vice President, Public Markets and Absolute Return Strategies
f David J. Scudellari – Senior Vice President, Head of Principal Debt and Credit Investments
f Guthrie Stewart – Senior Vice President, Global Head of Private Investments

ANNUAL REPORT 2017 | PSP INVESTMENTS 64
PRINCIPLES OF OUR COMPENSATION FRAMEWORK
In a highly competitive market for qualified personnel, PSP Investments’ compensation framework is designed to attract and retain talented employees, reward performance and reinforce the business strategies and priorities outlined in Vision 2021. Specifically, the framework is designed to:
Promote enterprise-wide collaboration
All employees participate in the same incentive plan, although performance measure weights are aligned with the ability to impact results and may vary based on level and group.
This ensures that total fund investment performance is a component of incentive compensation at all levels and that it encourages and reinforces the benefits of collaboration while aligning efforts to achieve the organization’s mandate.
Be sufficiently competitive to attract and retain the right people
The compensation and incentives structure is aligned with relevant markets for talent, based on level and group.
Total direct compensation is to be paid at the competitive market median for successfully achieving target performance levels, and above the competitive market median for exceptional performance.
The design tends to offer salaries at median with incentive targets at or above median.
Enable individual differentiation
The new compensation and incentives framework places more emphasis on individual and group performance and allows for an evaluation of behaviours aligned with PSP Investments’ vision and values, in addition to performance outcomes.
Discretion can be applied at every level of evaluation.
Adapt to changing circumstances
The new compensation and incentives framework allows the HRCC, Board, and President and CEO to ensure pay for performance outcomes are adapted to PSP Investments’ changing environment and unique conditions.
Align pay with performance
The new compensation and incentives framework provides enhanced alignment with the stakeholders’ key measure of success, including the long-term rate of return objective (currently set at CPI+4.1%).
The new compensation and incentives framework balances relative and absolute total fund performance.
For senior management, a significant portion of total compensation is deferred and “at risk”, or subject to performance conditions.
Discourage short-term risk taking
Investment performance is measured over five- and seven-year retrospective periods. A deferred component extends the period for incentives “at risk” for an additional three years after the grant date.
The realignment of PSP Investments’ compensation framework with Vision 2021 is expected to span several years. In fiscal year 2017, investment performance benchmarks and value added objectives were reviewed to ensure they are consistent with our corporate strategy. The adjusted benchmarks were used to ensure compensation levels are aligned and competitive with market.
PAY LEVEL BENCHMARKING PROCESS
Given the diversity in skills, capabilities and competencies PSP Investments requires to fulfil its mandate, executive and non-executive compensation levels, programs and practices are periodically evaluated by comparing them with those of peer organizations operating in similar markets. We strive to be competitive with organizations with which we compete for talent, although comparisons may vary by employee group and country of residence. For target levels of investment performance, we position total direct compensation near the median of our peers. We have the option to pay above this level for exceptional performance or below it for less than optimal performance. Depending on the employee group, our peers include Canadian pension funds, banks, insurance companies and investment managers, as well as other relevant employers in Montréal and elsewhere in Canada. For certain positions based outside Canada, such as in the US and the UK, we compare compensation to investment management organizations in local markets.

PSP INVESTMENTS | ANNUAL REPORT 2017 65
RISK MANAGEMENT
Our compensation program continues to reflect our responsibility to our sponsor and to Plan contributors and beneficiaries. Incentives are aligned with our long-term investment mandate and strategy, and were developed in consideration of our target return and risk appetite.
Key risk mitigating features in our compensation program include:
f Significant pay “at risk” – A large portion of pay for senior management and other senior employees comes in the form of compensation and incentives. All deferred compensation is adjusted upward or downward based on total fund return over the vesting period.
f Long-term horizon – Investment performance is measured over retrospective five- and seven-year periods and aligned with PSP Investments’ long-term total fund return objectives. Once granted, the deferred portion continues to vest over a subsequent three-year period; this effectively aligns pay with performance over an eight to ten year period.
f Maximum payouts – Each performance measure in the total incentive formula is subject to an absolute maximum of 1.5x target. The total incentive multiplier is subject to an absolute maximum of 2.0x target.
f Robust benchmark investment return targets – Benchmarks and value-added objectives, which are used to calculate performance within the total incentive plan, reflect an appropriate balance of risk and return and are aligned with the Board-approved investment strategy and risk limits.
f HRCC discretion to govern pay – The HRCC uses its discretion to adjudicate annual and longer-term performance compared to pre-defined targets and expectations. It also has the ultimate discretion to adjust pay levels to ensure they are aligned with PSP Investments’ performance and are reasonable from an overall cost perspective.
COMPENSATION FRAMEWORK
Salary
Purpose:
f To provide a base level of compensation for services rendered.
Reviewed annually and increased, as necessary, based on a variety of factors, including competitiveness with market, importance to the organization, scarcity of talent, experience and scope of responsibilities.
Total incentive
Purpose:
f To reward individual contributions to the achievement of superior and sustained organizational performance.
f To attract and retain talent.
f To align the interests of employees with PSP Investments’ stakeholders.
The new incentive program produces one annual incentive award that is split into an annual cash payment and a deferred cash award.
The annual incentive is based on performance relating to three components: group objectives, total fund investment performance and asset class investment performance. (Asset class investment performance does not apply to business partners, only to investment employees.) The three performance components are weighted according to level and position. Individual performance is used as a modifier and individual performance factors are determined upon review of individual objectives relative to predetermined goals. For more senior employees, significantly more emphasis is put on total fund investment performance.
PSP Investments’ overall performance scores are determined at the end of each fiscal year. They are based on the achievement of each component, as well as discretionary adjustments for other relevant factors that are decided by the President and CEO, and the HRCC.
All employees participate in the same incentive structure and each employee has a target total incentive opportunity based on his or her group and level. All employees can earn up to a maximum of two times the target total incentive opportunity before the total fund rate of return and additional performance conditioning are applied to the deferred cash.

ANNUAL REPORT 2017 | PSP INVESTMENTS 66
Once the total incentive award for each employee has been determined, the value is split between annual and deferred cash. The split between annual and deferred cash is based on position level, accordingly: from cash only for lower position levels to both cash and deferred for higher position levels.
The value of deferred cash fluctuates with the annual rate of return on the total fund and is distributed on a one third per year basis over three years. For senior management, a portion of deferred cash is subject to additional performance conditioning and paid out at the end of three fiscal years, based on the achievement of absolute total fund return.
Below is an illustration of the framework of the total incentive program:
TOTAL INCENTIVE PLAN FRAMEWORK1:
STEP 1
+ +
×
=
=
STEP 2
STEP 3
PSP Investments’ performance
PSP Investments’ performance
Annual individual performance Total incentive award
Group objectives Total fund investment performance
Asset class investment performance
Annual business plan key performance indicators (KPIs)
Paid at fiscal year end
Vests equally over 3 years, adjusted by total fund return
Vests at the end of 3 years, based on absolute total fund performance (0x-1.5x target), and adjusted by total fund return
More weight on deferred for senior employees
5-year relative and 7-year absolute performance
5-year relativeperformance
0.0x to 1.5x target
0.0x to 1.5x target 0.0x to 1.5x target 0.0x to 2.0x target
0.0x to 1.5x target 0.0x to 1.5x target
Specific guideline weightings based on group / levels
PSP Investments’ Performance Factor determined by applying the outcomes plus discretion, as appropriate
Sum of total incentive awards is calculated and discretion is applied, as appropriate
Annual cash
Total incentive award
Deferred cash
Deferred fund units
Performance deferred fund units (VP/MD+)
1 The incentive amounts and the payment thereof are subject to restrictions and conditions as per the incentive plan provisions.
Note: During the transition to the new incentive program, additional payments may be made to honour historical grants, such as those authorized prior to fiscal year 2017, and other entitlements.

PSP INVESTMENTS | ANNUAL REPORT 2017 67
Restricted Fund Units
Purpose:
f To retain key employees.
Restricted Fund Units (RFUs) may be awarded in special circumstances warranted by extraordinary performance or market-related considerations, such as the demand for talent.
RFUs vest and are paid in three equal annual instalments, unless the employee elects to defer payment until the end of the three-year period.
The ultimate value paid to participants is adjusted to reflect the total fund return over the vesting period.
Other benefits
Purpose:
f To provide competitive group benefits and retirement savings programs.
Group benefits:
f All employees have the same benefits, including health and dental care, long-term disability, critical illness, life insurance, accidental death and dismemberment, and access to an employee-assistance program.
Retirement savings:
Defined Benefit (DB) Pension Plan – Closed to new entrants as of January 1, 2014. Canada-based eligible employees contribute 7.25% of base salary as of January 1, 2017. The benefit is calculated on the basis of 2.0% of the average of the employee’s three best consecutive years of salary.
Defined Contribution (DC) Pension Plan – Canada-based eligible employees hired on or after January 1, 2014, are automatically enrolled in the DC Pension Plan, to which they may contribute between 5.0% and 7.0% of base salary (which is fully matched by PSP Investments).
Canadian employees may contribute up to the maximum contribution allowable under the Canadian Income Tax Act (ITA).
DB or DC Supplemental Employee Retirement Plan (the “SERPs”) – The SERPs have been established for Canada-based eligible employees enrolled in either the DB Pension Plan or the DC Pension Plan, as unfunded arrangements, to provide benefits in excess of the DB Pension Plan or the DC Pension Plan, where such benefits are limited under the ITA.
Employees based outside Canada are eligible to participate in pension plans that were established based on local regulations and are aligned with market practices.
Perquisites:
f Executives are provided with a perquisites allowance, including a health-and-lifestyle assessment.
PAY MIX
Based on the compensation framework, the target pay mix for the President and CEO and senior vice presidents in asset classes is weighted significantly toward variable compensation, as outlined in the table below.
The President & CEO’s target incentive is 325% of base salary, split 40% into annual cash (paid out in the current year), and 60% into deferred awards. Within the deferred portion, 50% is allocated to performance-based deferred fund units that cliff-vest and payout after 3 years (while earning total fund return). The other 50% is allocated to time-vested deferred fund units that vest one-third per year over 3 years (while earning total fund return).
For senior vice presidents in asset classes, the target incentive is 300% of base salary, split 50% into annual cash (paid out in the current year), and 50% into deferred awards. Within the deferred portion, 40% is allocated to performance-based deferred fund units that cliff-vest and payout after 3 years (while earning total fund return). The other 60% is allocated to time-vested deferred fund units that vest one-third per year over 3 years (while earning total fund return).
Base salaryShort-term
incentiveLong-term
incentive
President and CEO 23% 31% 46%
Senior Vice Presidents in Asset Classes 24% 38% 38%
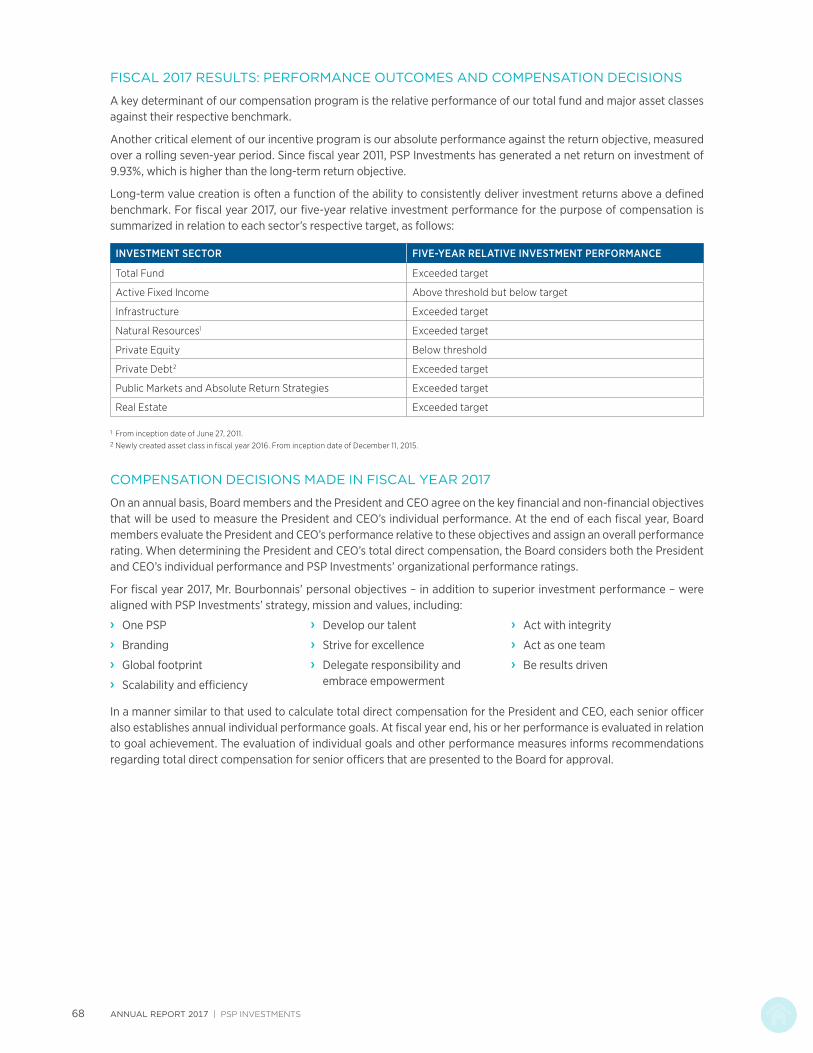
ANNUAL REPORT 2017 | PSP INVESTMENTS 68
FISCAL 2017 RESULTS: PERFORMANCE OUTCOMES AND COMPENSATION DECISIONS
A key determinant of our compensation program is the relative performance of our total fund and major asset classes against their respective benchmark.
Another critical element of our incentive program is our absolute performance against the return objective, measured over a rolling seven-year period. Since fiscal year 2011, PSP Investments has generated a net return on investment of 9.93%, which is higher than the long-term return objective.
Long-term value creation is often a function of the ability to consistently deliver investment returns above a defined benchmark. For fiscal year 2017, our five-year relative investment performance for the purpose of compensation is summarized in relation to each sector’s respective target, as follows:
INVESTMENT SECTOR FIVE-YEAR RELATIVE INVESTMENT PERFORMANCE
Total Fund Exceeded target
Active Fixed Income Above threshold but below target
Infrastructure Exceeded target
Natural Resources1 Exceeded target
Private Equity Below threshold
Private Debt2 Exceeded target
Public Markets and Absolute Return Strategies Exceeded target
Real Estate Exceeded target
1 From inception date of June 27, 2011.2 Newly created asset class in fiscal year 2016. From inception date of December 11, 2015.
COMPENSATION DECISIONS MADE IN FISCAL YEAR 2017
On an annual basis, Board members and the President and CEO agree on the key financial and non-financial objectives that will be used to measure the President and CEO’s individual performance. At the end of each fiscal year, Board members evaluate the President and CEO’s performance relative to these objectives and assign an overall performance rating. When determining the President and CEO’s total direct compensation, the Board considers both the President and CEO’s individual performance and PSP Investments’ organizational performance ratings.
For fiscal year 2017, Mr. Bourbonnais’ personal objectives – in addition to superior investment performance – were aligned with PSP Investments’ strategy, mission and values, including:
f One PSP
f Branding
f Global footprint
f Scalability and efficiency
f Develop our talent
f Strive for excellence
f Delegate responsibility and embrace empowerment
f Act with integrity
f Act as one team
f Be results driven
In a manner similar to that used to calculate total direct compensation for the President and CEO, each senior officer also establishes annual individual performance goals. At fiscal year end, his or her performance is evaluated in relation to goal achievement. The evaluation of individual goals and other performance measures informs recommendations regarding total direct compensation for senior officers that are presented to the Board for approval.
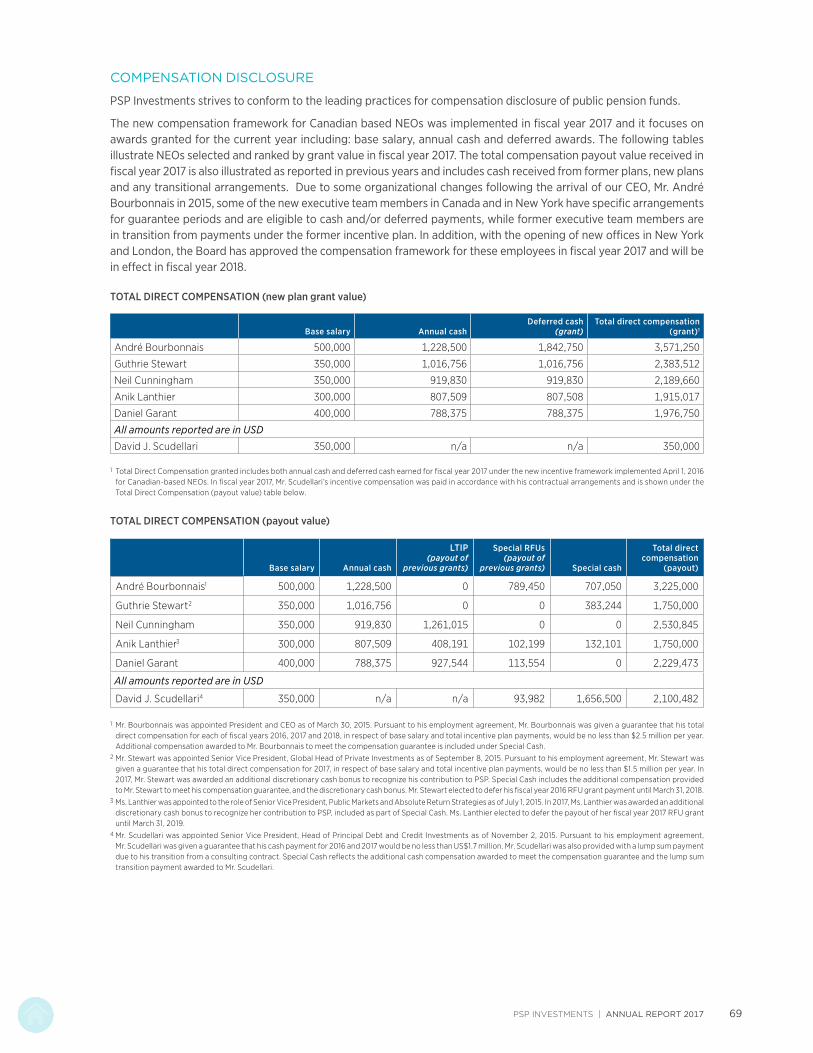
PSP INVESTMENTS | ANNUAL REPORT 2017 69
COMPENSATION DISCLOSURE
PSP Investments strives to conform to the leading practices for compensation disclosure of public pension funds.
The new compensation framework for Canadian based NEOs was implemented in fiscal year 2017 and it focuses on awards granted for the current year including: base salary, annual cash and deferred awards. The following tables illustrate NEOs selected and ranked by grant value in fiscal year 2017. The total compensation payout value received in fiscal year 2017 is also illustrated as reported in previous years and includes cash received from former plans, new plans and any transitional arrangements. Due to some organizational changes following the arrival of our CEO, Mr. André Bourbonnais in 2015, some of the new executive team members in Canada and in New York have specific arrangements for guarantee periods and are eligible to cash and/or deferred payments, while former executive team members are in transition from payments under the former incentive plan. In addition, with the opening of new offices in New York and London, the Board has approved the compensation framework for these employees in fiscal year 2017 and will be in effect in fiscal year 2018.
TOTAL DIRECT COMPENSATION (new plan grant value)
Base salary Annual cashDeferred cash
(grant)Total direct compensation
(grant)1
André Bourbonnais 500,000 1,228,500 1,842,750 3,571,250
Guthrie Stewart 350,000 1,016,756 1,016,756 2,383,512
Neil Cunningham 350,000 919,830 919,830 2,189,660
Anik Lanthier 300,000 807,509 807,508 1,915,017
Daniel Garant 400,000 788,375 788,375 1,976,750
All amounts reported are in USD
David J. Scudellari 350,000 n/a n/a 350,000
1 Total Direct Compensation granted includes both annual cash and deferred cash earned for fiscal year 2017 under the new incentive framework implemented April 1, 2016 for Canadian-based NEOs. In fiscal year 2017, Mr. Scudellari’s incentive compensation was paid in accordance with his contractual arrangements and is shown under the Total Direct Compensation (payout value) table below.
TOTAL DIRECT COMPENSATION (payout value)
Base salary Annual cash
LTIP (payout of
previous grants)
Special RFUs (payout of
previous grants) Special cash
Total direct compensation
(payout)
André Bourbonnais1 500,000 1,228,500 0 789,450 707,050 3,225,000
Guthrie Stewart2 350,000 1,016,756 0 0 383,244 1,750,000
Neil Cunningham 350,000 919,830 1,261,015 0 0 2,530,845
Anik Lanthier3 300,000 807,509 408,191 102,199 132,101 1,750,000
Daniel Garant 400,000 788,375 927,544 113,554 0 2,229,473
All amounts reported are in USD
David J. Scudellari4 350,000 n/a n/a 93,982 1,656,500 2,100,482
1 Mr. Bourbonnais was appointed President and CEO as of March 30, 2015. Pursuant to his employment agreement, Mr. Bourbonnais was given a guarantee that his total direct compensation for each of fiscal years 2016, 2017 and 2018, in respect of base salary and total incentive plan payments, would be no less than $2.5 million per year. Additional compensation awarded to Mr. Bourbonnais to meet the compensation guarantee is included under Special Cash.
2 Mr. Stewart was appointed Senior Vice President, Global Head of Private Investments as of September 8, 2015. Pursuant to his employment agreement, Mr. Stewart was given a guarantee that his total direct compensation for 2017, in respect of base salary and total incentive plan payments, would be no less than $1.5 million per year. In 2017, Mr. Stewart was awarded an additional discretionary cash bonus to recognize his contribution to PSP. Special Cash includes the additional compensation provided to Mr. Stewart to meet his compensation guarantee, and the discretionary cash bonus. Mr. Stewart elected to defer his fiscal year 2016 RFU grant payment until March 31, 2018.
3 Ms. Lanthier was appointed to the role of Senior Vice President, Public Markets and Absolute Return Strategies as of July 1, 2015. In 2017, Ms. Lanthier was awarded an additional discretionary cash bonus to recognize her contribution to PSP, included as part of Special Cash. Ms. Lanthier elected to defer the payout of her fiscal year 2017 RFU grant until March 31, 2019.
4 Mr. Scudellari was appointed Senior Vice President, Head of Principal Debt and Credit Investments as of November 2, 2015. Pursuant to his employment agreement, Mr. Scudellari was given a guarantee that his cash payment for 2016 and 2017 would be no less than US$1.7 million. Mr. Scudellari was also provided with a lump sum payment due to his transition from a consulting contract. Special Cash reflects the additional cash compensation awarded to meet the compensation guarantee and the lump sum transition payment awarded to Mr. Scudellari.

ANNUAL REPORT 2017 | PSP INVESTMENTS 70
COMPREHENSIVE FISCAL YEAR 2017 TOTAL COMPENSATION
Fisc
al y
ear
Bas
e s
alar
y
STIP
/ A
nnua
l cas
h pa
yout
Def
erre
d ca
sh /
LTI
P gr
ant
Sub
-tot
al c
ompe
nsat
ion
(gra
nt v
alue
)
Res
tric
ted
fund
uni
t/Sp
ecia
l cas
h gr
ants
Pens
ion
and
SER
P pl
ans
Tota
l com
pens
atio
n
(gra
nt v
alue
)
Oth
er c
ompe
nsat
ion1
LTIP
+ R
FU p
ayou
t
Tota
l com
pens
atio
n
(pay
out
valu
e)
(A) (B) (C) (A+B+C) (D) (E) (A+B+ C+D+E)
(F) (G) (A+B+F+G)
André Bourbonnais2
President and Chief Executive Officer
2017 500,000 1,228,500 1,842,750 3,571,250 898,703 25,962 4,495,915 746,793 789,450 3,264,743
2016 500,000 691,933 500,000 1,691,933 0 24,519 1,716,452 2,069,350 0 3,261,283
2015 3,846 0 0 3,846 0 0 3,846 3,057,481 0 3,061,327
Guthrie Stewart3
Senior Vice President, Global Head of Private Investments
2017 350,000 1,016,756 1,016,756 2,383,512 250,000 18,130 2,651,642 413,172 0 1,779,928
2016 173,750 255,187 165,750 594,687 325,000 8,688 928,375 335,568 0 764,505
2015
Neil CunninghamSenior Vice President, Global Head of Real Estate Investments
2017 350,000 919,830 919,830 2,189,660 0 145,500 2,335,160 31,918 1,261,015 2,562,763
2016 320,000 679,376 288,000 1,287,376 0 54,500 1,341,876 27,468 1,296,000 2,322,844
2015 320,000 849,584 288,000 1,457,584 0 48,900 1,506,484 26,145 1,309,370 2,505,099
Anik Lanthier4
Senior Vice President, Public Markets and Absolute Return Strategies
2017 300,000 807,509 807,508 1,915,017 382,101 26,500 2,323,618 160,344 510,390 1,778,243
2016 285,082 286,391 246,037 817,510 370,000 198,800 1,386,310 127,480 507,643 1,206,596
2015
Daniel GarantExecutive Vice President and Chief Investment Officer
2017 400,000 788,375 788,375 1,976,750 0 61,900 2,038,650 32,276 1,041,098 2,261,750
2016 380,615 487,919 344,408 1,212,942 300,000 197,600 1,710,542 23,720 964,960 1,857,214
2015 330,000 667,921 297,000 1,294,921 0 42,200 1,337,121 24,627 1,223,529 2,246,077
All amounts reported are in USD
David J. Scudellari5
Senior Vice President, Head of Principal Debt and Credit Investments
2017 350,000 n/a n/a 350,000 250,000 22,274 622,274 1,678,029 93,982 2,122,011
2016 144,399 n/a n/a 144,399 0 808 145,207 1,637,425 0 1,781,824
2015
1 Other compensation includes the perquisites allowance, the annual flexible dollar allocation, the annual health-and-lifestyle assessment and the employer-paid premiums for life, accidental death and dismemberment, disability, health and dental care coverage, as well as other amounts as per contractual arrangements, where applicable.
2 Mr. Bourbonnais was appointed President and CEO as of March 30, 2015. Pursuant to his employment agreement, Mr. Bourbonnais was given a guarantee that his total direct compensation for each of fiscal years 2016, 2017 and 2018, in respect of base salary and total incentive plan payments, would be no less than $2.5 million per year. Other Compensation includes the additional compensation awarded to Mr. Bourbonnais to meet the compensation guarantee.
3 Mr. Stewart was appointed Senior Vice President, Global Head of Private Investments as of September 8, 2015. Pursuant to his employment agreement, Mr. Stewart was given a guarantee that his total direct compensation for 2017, in respect of base salary and total incentive plan payments, would be no less than $1.5 million per year. In 2017, Mr. Stewart was awarded an additional discretionary cash bonus to recognize his contribution to PSP. Other Compensation includes the additional compensation provided to Mr. Stewart to meet his compensation guarantee, and the discretionary cash bonus. Mr. Stewart elected to defer his fiscal year 2016 RFU grant until March 31, 2018.
4 Ms. Lanthier was appointed to the role of Senior Vice President, Public Markets and Absolute Return Strategies as of July 1, 2015. In 2017, Ms. Lanthier was awarded an additional discretionary cash bonus to recognize her contribution to PSP, included as part of Other Compensation. Ms. Lanthier elected to defer the payout of her fiscal year 2017 RFU grant until March 31, 2019.
5 Mr. Scudellari was appointed Senior Vice President, Head of Principal Debt and Credit Investments as of November 2, 2015. Pursuant to his employment agreement, Mr. Scudellari was given a guarantee that his cash payment for 2016 and 2017 would be no less than US$1.7 million. Mr. Scudellari was also provided with a lump sum payment due to his transition from a consulting contract. Other compensation reflects the additional cash compensation awarded to meet the compensation guarantee and the lump sum transition payment awarded to Mr. Scudellari.
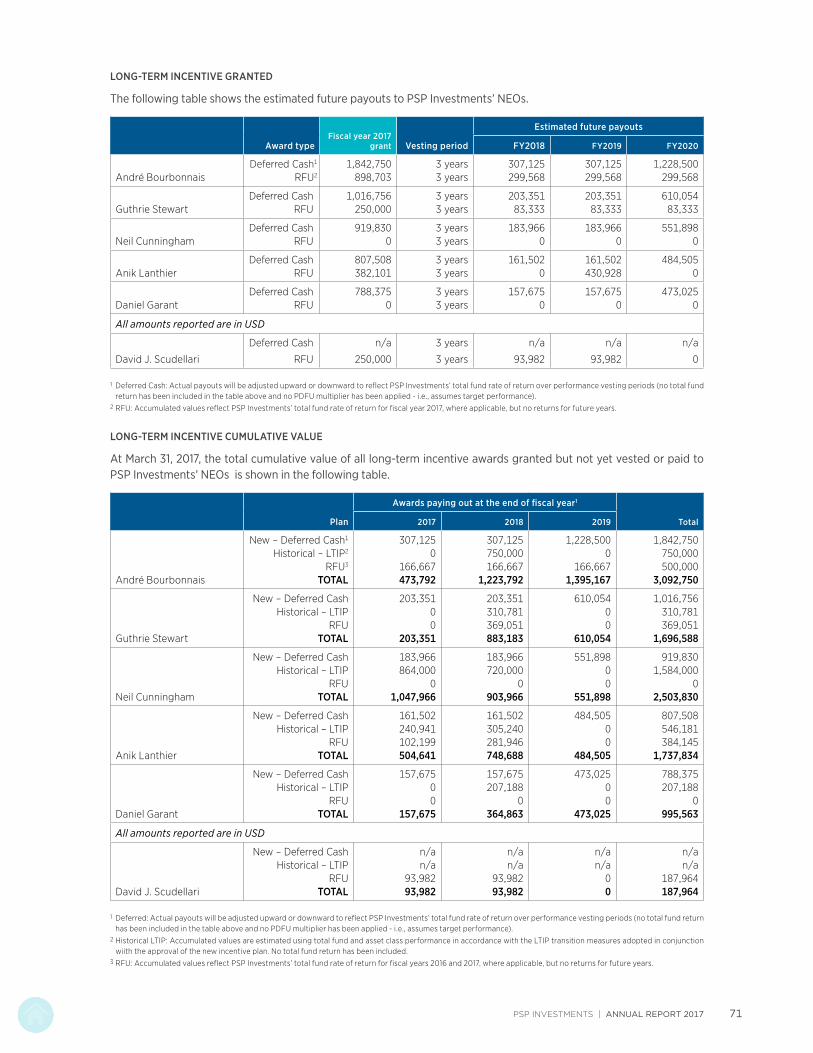
PSP INVESTMENTS | ANNUAL REPORT 2017 71
LONG-TERM INCENTIVE GRANTED
The following table shows the estimated future payouts to PSP Investments’ NEOs.
Award typeFiscal year 2017
grant Vesting period
Estimated future payouts
FY2018 FY2019 FY2020
André BourbonnaisDeferred Cash1 1,842,750 3 years 307,125 307,125 1,228,500
RFU2 898,703 3 years 299,568 299,568 299,568
Guthrie StewartDeferred Cash 1,016,756 3 years 203,351 203,351 610,054
RFU 250,000 3 years 83,333 83,333 83,333
Neil CunninghamDeferred Cash 919,830 3 years 183,966 183,966 551,898
RFU 0 3 years 0 0 0
Anik LanthierDeferred Cash 807,508 3 years 161,502 161,502 484,505
RFU 382,101 3 years 0 430,928 0
Daniel GarantDeferred Cash 788,375 3 years 157,675 157,675 473,025
RFU 0 3 years 0 0 0
All amounts reported are in USD
David J. Scudellari
Deferred Cash n/a 3 years n/a n/a n/a
RFU 250,000 3 years 93,982 93,982 0
1 Deferred Cash: Actual payouts will be adjusted upward or downward to reflect PSP Investments’ total fund rate of return over performance vesting periods (no total fund return has been included in the table above and no PDFU multiplier has been applied - i.e., assumes target performance).
2 RFU: Accumulated values reflect PSP Investments’ total fund rate of return for fiscal year 2017, where applicable, but no returns for future years.
LONG-TERM INCENTIVE CUMULATIVE VALUE
At March 31, 2017, the total cumulative value of all long-term incentive awards granted but not yet vested or paid to PSP Investments’ NEOs is shown in the following table.
Plan
Awards paying out at the end of fiscal year1
Total2017 2018 2019
André Bourbonnais
New – Deferred Cash1 307,125 307,125 1,228,500 1,842,750Historical – LTIP2 0 750,000 0 750,000
RFU3 166,667 166,667 166,667 500,000TOTAL 473,792 1,223,792 1,395,167 3,092,750
Guthrie Stewart
New – Deferred Cash 203,351 203,351 610,054 1,016,756Historical – LTIP 0 310,781 0 310,781
RFU 0 369,051 0 369,051TOTAL 203,351 883,183 610,054 1,696,588
Neil Cunningham
New – Deferred Cash 183,966 183,966 551,898 919,830Historical – LTIP 864,000 720,000 0 1,584,000
RFU 0 0 0 0TOTAL 1,047,966 903,966 551,898 2,503,830
Anik Lanthier
New – Deferred Cash 161,502 161,502 484,505 807,508Historical – LTIP 240,941 305,240 0 546,181
RFU 102,199 281,946 0 384,145TOTAL 504,641 748,688 484,505 1,737,834
Daniel Garant
New – Deferred Cash 157,675 157,675 473,025 788,375Historical – LTIP 0 207,188 0 207,188
RFU 0 0 0 0TOTAL 157,675 364,863 473,025 995,563
All amounts reported are in USD
David J. Scudellari
New – Deferred Cash n/a n/a n/a n/aHistorical – LTIP n/a n/a n/a n/a
RFU 93,982 93,982 0 187,964TOTAL 93,982 93,982 0 187,964
1 Deferred: Actual payouts will be adjusted upward or downward to reflect PSP Investments’ total fund rate of return over performance vesting periods (no total fund return has been included in the table above and no PDFU multiplier has been applied - i.e., assumes target performance).
2 Historical LTIP: Accumulated values are estimated using total fund and asset class performance in accordance with the LTIP transition measures adopted in conjunction wiith the approval of the new incentive plan. No total fund return has been included.
3 RFU: Accumulated values reflect PSP Investments’ total fund rate of return for fiscal years 2016 and 2017, where applicable, but no returns for future years.

ANNUAL REPORT 2017 | PSP INVESTMENTS 72
RETIREMENT BENEFITS
CANADIAN DEFINED CONTRIBUTION PENSION PLAN AND SAFE HARBOR 401(K) PLAN
Plan typeAccumulated value at
beginning of yearCompensatory
increase1Non-compensatory
increase2Accumulated value at
year end
André BourbonnaisDefined
Contribution 49,007 25,962 33,410 108,379
Guthrie StewartDefined
Contribution 17,534 18,130 21,034 56,698
All amounts reported are in USD
David J. ScudellariSafe Harbor
401(k) 1,891 22,274 31,973 56,138
1 Includes employer contributions, which for Canadian NEOs, apply to both the DC Pension Plan and the DC Supplemental Employee Retirement Plan.2 Includes employee contributions and regular investment earnings on employer and employee contributions, which for Canadian NEOs, apply both to the DC Pension Plan
and the DC Supplemental Employee Retirement Plan for Canadian NEOs.
CANADIAN DEFINED BENEFIT PENSION PLAN
Number of years
of credited service1
Annual BenefitAccrued
obligation at beginning
of year2,4Compensatory
increase5
Non- compensatory
increase6
Accrued obligation at
year end2,7At year end2,3 At age 652,3
Neil Cunningham 9.4 61,700 105,900 894,600 145,500 100,300 1,140,400
Anik Lanthier 10.9 58,400 172,900 780,500 26,500 129,600 936,600
Daniel Garant 8.6 62,600 166,000 924,900 61,900 126,800 1,113,600
1 Number of credited years of service used for both the DB Employee Pension Plan and the DB Supplemental Employee Retirement Plan.2 Sum of benefits accrued under the DB Employee Pension Plan and the DB Supplemental Employee Retirement Plan.3 For the purpose of calculating the annual benefits payable at age 65, the final average earnings are calculated as at March 31, 2017.4 Accrued obligation using a discount rate of 4.3%. The obligations are calculated as at March 31, 2016 using the assumptions and methods that were used for the accounting
disclosures as at December 31, 2015.5 Includes employer service cost at the beginning of the year, the impact arising from the difference between actual pensionable earnings and those anticipated at the prior
year end and the impact of amendments to the pension plans if any.6 Includes employee contributions and benefit payments made in the year, change in assumptions, non-pay-related experience and the interest cost for the year.7 Accrued obligation using a discount rate of 4.1%. The obligations are calculated as at March 31, 2017 using the assumptions and methods that were used for the accounting
disclosures as at December 31, 2016.

PSP INVESTMENTS | ANNUAL REPORT 2017 73
POST-EMPLOYMENT POLICIES
Pursuant to his employment agreement, in the event of dismissal other than for “serious reason”, the President and CEO’s severance pay is set at 24 months of base salary at the time of departure and includes target annual incentive (“base termination pay”) plus $60,000 which is equivalent to 24 months of perquisites. Severance pay also includes a lump-sum amount equivalent to two times the percentage of his annual base salary that the President and CEO elected to contribute to the DC Pension Plan. With the exception of disability coverage, the group insurance plan is maintained during the 24-month severance period. Should such a dismissal occur in fiscal year 2018, base termination pay shall be the greater of the amount set out above or of any unpaid amounts of the Compensation Guarantee as disclosed in the compensation disclosure section. On a voluntary departure, no severance amounts are payable to the President and CEO.
For senior vice presidents, severance pay is set at 12 months of base salary and target annual cash award, plus one month of salary and target annual cash award (one-twelfth of the full-year target annual cash award) for each year of service, up to a maximum of 18 months. Insured benefits, such as health, dental and life insurance, are continued during the severance period.
The table below shows the potential payments that would be made upon termination (without cause) for PSP Investments’ highest-paid NEOs, excluding any amounts that would become payable as per applicable incentive plan provisions.
Years of service1 Severance Resignation
André Bourbonnais 2.0 2,500,000 0
Guthrie Stewart 1.6 990,368 0
Neil Cunningham 12.8 1,312,500 0
Anik Lanthier 10.9 1,125,000 0
Daniel Garant 8.6 1,650,000 0
All amounts reported are in USD
David J. Scudellari 1.4 1,902,662 0
1 Assumes a notional termination as at March 31, 2017.

ANNUAL REPORT 2017 | PSP INVESTMENTS 74
Michael P. MuellerChair of the Board
Board member since December 18, 2006
Committee Membership
Investment Committee
Michael P. Mueller is a member of the Board of Directors of Pediapharm Inc., Smarter Alloys, Emily’s House Children’s Hospice in Toronto and Mercal Capital Corporation. From 2003 to 2005, he was President and CEO of MDS Capital Corporation. Mr. Mueller previously held a series of senior executive positions at TD Bank Financial Group, including that of Vice Chairman and Global Head of Investment and Corporate Banking. He is a former Board member of the Scarborough Hospital (past Chair), the Scarborough Hospital Foundation, AIM Therapeutics Inc., Biovest Corp. 1, Budco, Tm BioScience Corp., MDS Capital Corporation and the Canadian Medical Discoveries Funds I and II. Mr. Mueller holds a BSc from Western University and an MBA from York University.
Cheryl BarkerBoard member since December 18, 2006
Committee Membership
Human Resources and Compensation Committee, Investment Committee
Cheryl Barker is a Board member and Chair of the Audit Committee of Canada Media Fund. She was President of Manitoba Telecom Services Inc. (MTS) from 2004 until her retirement in 2006. Ms. Barker’s career at MTS spanned 19 years, during which time she served in a variety of key positions, including: President and COO of MTS Communications Inc.; Chair, President and CEO of Bell Intrigna Inc.; and CFO and Treasurer of MTS. She is a Fellow of the Chartered Professional Accountants of Canada (FCPA, FCA) and holds a BSc and a General Certificate of Education from the University of Manitoba.
Diane BeanBoard member since June 18, 2010
Committee Membership
Human Resources and Compensation Committee (Chair), Investment Committee
Diane Bean is a member of the Board of Directors of Manulife International Ltd. (Asia) and of The Insurance Company of the West Indies Ltd., and was founding Co-Chair of the Toronto Region Immigrant Employment Council. At the time of her retirement in 2011, she was Executive Vice President of Corporate Affairs and Human Resources, with responsibility for global HR, at Manulife Financial Corp. During her 30-year career with the company, she also served as Regional Executive in Canada, the US, Asia and Europe, and held senior positions in IT and Business Development. Ms. Bean holds a BCom from the University of Toronto.
DIRECTORS’ BIOGRAPHIES
Directors’ Biographies

PSP INVESTMENTS | ANNUAL REPORT 2017 75
Micheline BouchardBoard member since September 29, 2011
Committee Membership
Governance Committee, Human Resources and Compensation Committee, Investment Committee
Micheline Bouchard is a member of the Board of Directors of the Canada Foundation for Innovation. She has extensive experience as a director with public and private companies and volunteer boards. Past Board memberships include TELUS Corporation, Banque Nationale de Paris, Ford Motor Company of Canada, London Insurance Group Inc. and Home Capital Group Inc./Home Trust Company. Ms. Bouchard was Global Corporate Vice President of Motorola, Inc. in the US after having served as President and CEO of Motorola, Inc. (Canada). She holds a BSc (Engineering Physics) and an MASc (Electrical Engineering) from the École Polytechnique, the engineering school affiliated with the Université de Montréal. She has been awarded five honourary doctorates from Canadian universities and been named one of the top 100 women of influence in Canada. Ms. Bouchard is a Member of the Order of Canada and of the Ordre national du Québec, and a Certified Member of the Institute of Corporate Directors.
Léon CourvilleBoard member since March 5, 2007
Committee Membership
Governance Committee, Human Resources and Compensation Committee, Investment Committee
Léon Courville has devoted his entire career to the sciences of management and finance, serving as a professor and researcher at universities in Canada and the US before being appointed President of the National Bank of Canada. He enjoys an active “retirement” as a corporate director, an Associate Professor at the École des Hautes Études Commerciales, the business school affiliated with the Université de Montréal, and as proprietor of the vineyard, LÉON COURVILLE, he founded in 1999. Mr. Courville is a Board member of the Institut de tourisme et d’hôtellerie du Québec and of the Institut économique de Montréal, and Chairman of the Montréal Institute of Structured Finance and Derivative Instruments (IFSID). His research and publications have garnered awards and bursaries in Canada and abroad, including the Coopers & Lybrand Award for The Storm: Navigating the New Economy. Mr. Courville holds a PhD (Economics) from Carnegie Mellon University.

ANNUAL REPORT 2017 | PSP INVESTMENTS 76
Garnet GarvenBoard member since September 29, 2011
Committee Membership
Audit Committee, Governance Committee (Chair), Investment Committee
Garnet Garven is Dean Emeritus of the Paul J. Hill School of Business and of the Kenneth Levene Graduate School of Business at the University of Regina. He is a Management Board member of the Pension Budget and Reserve Fund at the Organization for Economic Co-operation and Development (OECD) in Paris, and a voting member of the Accounting Standards Board (Canada). More recently, he was a Senior Fellow at Canada’s Public Policy Forum, a national Ottawa-based think tank. He has served as Deputy Minister to the Premier of Saskatchewan, Cabinet Secretary and Head of the Saskatchewan Public Service. He holds a BBA from the University of Regina, an MBA (Finance) from the University of Saskatchewan and an Honorary CPA from the Chartered Professional Accountants of Canada. Mr. Garven was a Research Fellow in Corporate Governance at the Ivey Business School, Western University. A founding Director of Greystone Managed Investments Inc. and former Chair and CEO of the Saskatchewan Workers’ Compensation Board, he has also served on a variety of other public, private and not-for-profit boards.
Martin J. GlynnBoard member since January 30, 2014
Committee Membership
Governance Committee, Human Resources and Compensation Committee, Investment Committee
Martin J. Glynn is a Board member of two public companies: Sun Life Financial Inc. and Husky Energy Inc. He also serves as Chair of UBC Investment Management Trust Inc., and as a Board member of SOI Group Limited, a subsidiary of the University of St. Andrews associated with the Scottish Oceans Institute. Mr. Glynn is also a member of the advisory board of Balfour Pacific Real Estate Fund IV and Second City Real Estate II. Until his retirement in 2006, Mr. Glynn held progressively senior positions with HSBC, including President and CEO of HSBC Bank Canada from 1999 to 2003, and President and CEO of HSBC Bank USA from 2003 to 2006. He remains active in professional and community circles. From 2009 to 2010, he was the Jarislowsky Fellow in Business Management at the Haskayne School of Business, University of Calgary. Mr. Glynn holds a BA Honours (Economics) from Carleton University and an MBA (Finance and International Business) from the University of British Columbia.
DIRECTORS’ BIOGRAPHIES

PSP INVESTMENTS | ANNUAL REPORT 2017 77
Lynn HaightBoard member since January 14, 2010
Committee Membership
Audit Committee, Governance Committee, Investment Committee
Lynn Haight is a member of the Board of Directors and Chair of the Consultative Group on International Agricultural Research (CGIAR) at the World Bank, and a Board member of Green Shield Canada. She is also Chair of the Independent Audit and Oversight Panel of the Office of the United Nations High Commissioner for Refugees (UNHCR). Ms. Haight sits on the Board of the Somerville College Foundation at the University of Oxford. In 2009, she retired as COO and CFO of the Foresters International Insurance Organization. She previously served as Vice President, US Fixed Annuities, and as Chief Accountant of Manulife Financial Corp. She has served as a Trustee and Chair of the Audit Committee of the Ontario Arts Council, and as Chair of Foresters Holdings Europe, of Tafelmusik Baroque Orchestra, of the World Agroforestry Centre in Nairobi and of the Sectoral Advisory Group for business services to the Canadian Minister of International Trade. Ms. Haight holds an MA Honours from the University of Oxford. She is a Fellow of the Chartered Professional Accountants of Canada (FCPA, FCA), of the Institute of Chartered Accountants in England and Wales, and of the Canadian Association of Management Consultants. She is also a Certified Corporate Director.
Timothy E. HodgsonBoard member since December 17, 2013
Committee Membership
Audit Committee, Investment Committee (Chair)
Timothy E. Hodgson is Managing Partner of Alignvest Management Corporation. He was Special Advisor to Bank of Canada Governor Mark Carney from 2010 to 2012. Mr. Hodgson spent much of his early career with Goldman Sachs Group, Inc. and served as CEO at Goldman Sachs Canada, Inc. from 2005 to 2010. He sits on the Boards of KGS-Alpha Capital Markets, LP, the Global Risk Institute in Financial Services, the Ivey Business School at Western University, Next Canada and MEG Energy Corp. He is a past Board member of Goldman Sachs Canada, Inc. Mr. Hodgson holds an MBA from the Ivey Business School, and a BCom from the University of Manitoba. He is a Chartered Professional Accountant (CPA, CA) and a member of the Institute of Corporate Directors.
William A. MackinnonBoard member since January 14, 2010
Committee Membership
Audit Committee (Chair), Investment Committee
William A. MacKinnon is a Board member of TELUS Corporation, Pioneer Energy LP and Novadaq Technologies Inc. He is very active in professional and community circles and serves on the Boards of the Toronto Community Foundation and of Roy Thomson Hall in Toronto. An accountant by profession, Mr. MacKinnon joined KPMG LLP Canada in 1968, became a Partner in 1977 and was CEO from 1999 until his retirement at the end of 2008. For several years, he served on the KPMG International Board of Directors. Mr. MacKinnon holds a BCom from the University of Manitoba. He obtained his CPA, CA designation in 1971 and, in 1994, was named a Fellow of the Chartered Professional Accountants of Canada (FCPA, FCA).

ANNUAL REPORT 2017 | PSP INVESTMENTS 78
SENIOR MANAGEMENTAND OFFICERS
Senior Management and Officers
André Bourbonnais | 1President and Chief Executive Officer
Darren Baccus | 2Senior Vice President and Chief Legal Officer
Nathalie Bernier | 3Senior Vice President, Strategic and Business Planning and Chief Financial Officer
Alison Breen | 4Vice President, Corporate Secretary and Chief Regulatory Officer
J.-F. Bureau | 5Senior Vice President and Chief Risk Officer
Giulia Cirillo | 6Senior Vice President and Chief Human Resources Officer
Neil Cunningham | 7Senior Vice President, Global Head of Real Estate and Natural Resources
Alain Deschênes | 8Senior Vice President and Chief Operations Officer
Daniel Garant | 9Executive Vice President and Chief Investment Officer
Anik Lanthier | 10Senior Vice President, Public Markets and Absolute Return Strategies
David J. Scudellari | 11Senior Vice President, Head of Principal Debt and Credit Investments
Guthrie Stewart | 12Senior Vice President and Global Head of Private Investments
Investing is the very core of our vision, our mandate and our business. It’s about seizing opportunities and making the most of them for the funding of the public sector pension plans, in the best interests of contributors and beneficiaries – the men and women who have served Canada throughout their careers.

PSP INVESTMENTS | ANNUAL REPORT 2017 79
9
11
5
12
10
6
2
3
8
4
7
1
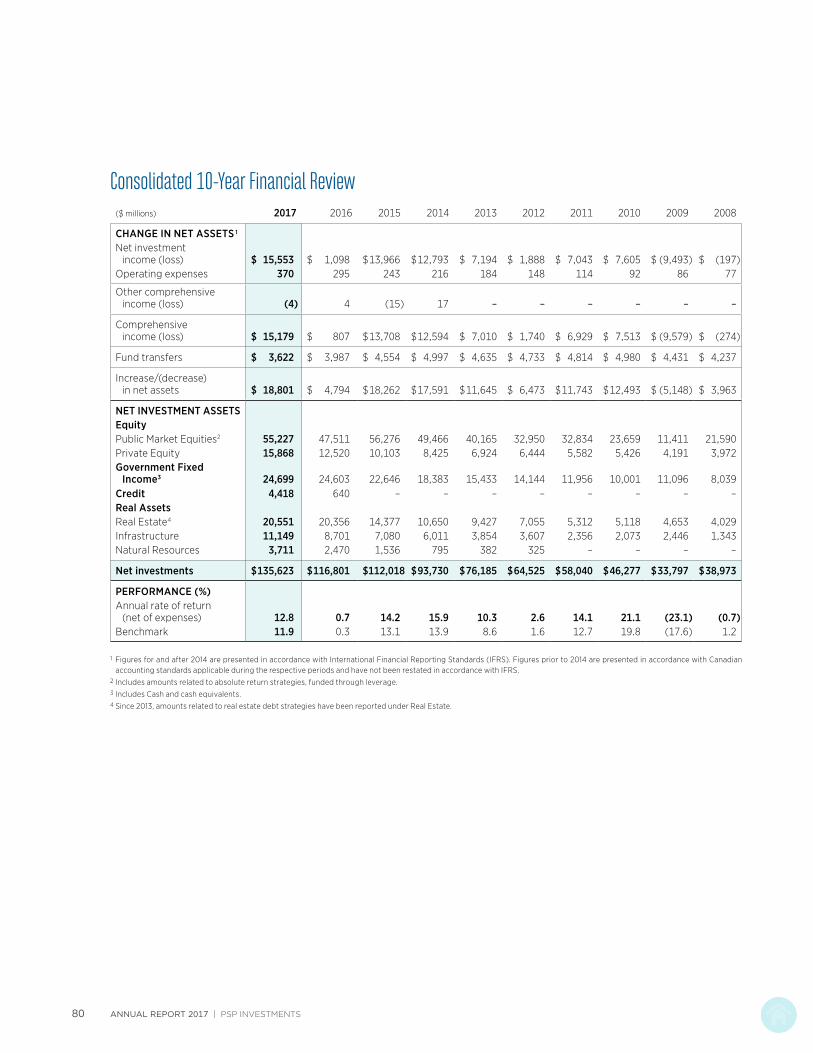
ANNUAL REPORT 2017 | PSP INVESTMENTS 80
Consolidated 10-Year Financial Review($ millions) 2017 2016 2015 2014 2013 2012 2011 2010 2009 2008
CHANGE IN NET ASSETS 1
Net investment income (loss) $ 15,553 $ 1,098 $ 13,966 $ 12,793 $ 7,194 $ 1,888 $ 7,043 $ 7,605 $ (9,493) $ (197)
Operating expenses 370 295 243 216 184 148 114 92 86 77
Other comprehensive income (loss) (4) 4 (15) 17 – – – – – –
Comprehensive income (loss) $ 15,179 $ 807 $ 13,708 $ 12,594 $ 7,010 $ 1,740 $ 6,929 $ 7,513 $ (9,579) $ (274)
Fund transfers $ 3,622 $ 3,987 $ 4,554 $ 4,997 $ 4,635 $ 4,733 $ 4,814 $ 4,980 $ 4,431 $ 4,237
Increase/(decrease) in net assets $ 18,801 $ 4,794 $ 18,262 $ 17,591 $ 11,645 $ 6,473 $ 11,743 $ 12,493 $ (5,148) $ 3,963
NET INVESTMENT ASSETSEquityPublic Market Equities2 55,227 47,511 56,276 49,466 40,165 32,950 32,834 23,659 11,411 21,590Private Equity 15,868 12,520 10,103 8,425 6,924 6,444 5,582 5,426 4,191 3,972Government Fixed
Income3 24,699 24,603 22,646 18,383 15,433 14,144 11,956 10,001 11,096 8,039Credit 4,418 640 – – – – – – – –Real AssetsReal Estate4 20,551 20,356 14,377 10,650 9,427 7,055 5,312 5,118 4,653 4,029 Infrastructure 11,149 8,701 7,080 6,011 3,854 3,607 2,356 2,073 2,446 1,343 Natural Resources 3,711 2,470 1,536 795 382 325 – – – –
Net investments $ 135,623 $ 116,801 $ 112,018 $ 93,730 $ 76,185 $ 64,525 $ 58,040 $ 46,277 $ 33,797 $ 38,973
PERFORMANCE (%)Annual rate of return
(net of expenses) 12.8 0.7 14.2 15.9 10.3 2.6 14.1 21.1 (23.1) (0.7)Benchmark 11.9 0.3 13.1 13.9 8.6 1.6 12.7 19.8 (17.6) 1.2
1 Figures for and after 2014 are presented in accordance with International Financial Reporting Standards (IFRS). Figures prior to 2014 are presented in accordance with Canadian accounting standards applicable during the respective periods and have not been restated in accordance with IFRS.
2 Includes amounts related to absolute return strategies, funded through leverage.3 Includes Cash and cash equivalents.4 Since 2013, amounts related to real estate debt strategies have been reported under Real Estate.
Consolidated 10-Year Financial Review

FINANCIAL STATEMENTSand Notes to the Financial Statements
Financial Statements and Notes to the Financial Statements
PUBLIC SECTOR PENSION INVESTMENT BOARD | ANNUAL REPORT 2017 81

TABLE OF CONTENTS
MANAGEMENT’S RESPONSIBILITY FOR FINANCIAL REPORTING 83
INVESTMENT CERTIFICATE 84
PUBLIC SECTOR PENSION INVESTMENT BOARDIndependent Auditors’ Report 85
Consolidated Statements of Financial Position 86
Consolidated Statements of Comprehensive Income 87
Consolidated Statements of Changes in Equity 87
Consolidated Statements of Cash Flows 88
Notes to the Consolidated Financial Statements 89
PUBLIC SERVICE PENSION PLAN ACCOUNTIndependent Auditors’ Report 121
Statements of Financial Position 122
Statements of Comprehensive Income 123
Statements of Changes in Equity 123
Statements of Cash Flows 124
Notes to the Financial Statements 125
CANADIAN FORCES PENSION PLAN ACCOUNTIndependent Auditors’ Report 157
Statements of Financial Position 158
Statements of Comprehensive Income 159
Statements of Changes in Equity 159
Statements of Cash Flows 160
Notes to the Financial Statements 161
ROYAL CANADIAN MOUNTED POLICE PENSION PLAN ACCOUNTIndependent Auditors’ Report 193
Statements of Financial Position 194
Statements of Comprehensive Income 195
Statements of Changes in Equity 195
Statements of Cash Flows 196
Notes to the Financial Statements 197
RESERVE FORCE PENSION PLAN ACCOUNTIndependent Auditors’ Report 229
Statements of Financial Position 230
Statements of Comprehensive Income 231
Statements of Changes in Equity 231
Statements of Cash Flows 232
Notes to the Financial Statements 233
ANNUAL REPORT 2017 | PUBLIC SECTOR PENSION INVESTMENT BOARD82

André Bourbonnais Nathalie Bernier President and Senior Vice President, Strategic and Business Planning Chief Executive Officer and Chief Financial Officer May 12th, 2017 May 12th, 2017
The consolidated financial statements of the Public Sector Pension Investment Board (“PSP Investments”) as well as the financial statements of the Public Service, the Canadian Forces, the Royal Canadian Mounted Police, and the Reserve Forces Pension Plan Accounts (the “financial statements”) have been prepared by management and approved by the Board of Directors. These financial statements have been prepared in accordance with International Financial Reporting Standards (IFRS), as issued by the International Accounting Standards Board (IASB) and incorporated into the CPA Canada Handbook. Management is responsible for the contents of these financial statements and the financial information contained in the annual report.
On a yearly basis, we certify that the design of the internal control regarding financial information is sufficient and that the design and functioning of the financial information disclosure controls and procedures are effective. We report any significant deficiencies to the Audit Committee (“Committee”) of the Board of Directors of PSP Investments.
In this regard, investments of PSP Investments held during the years ended March 31, 2017 and March 31,2016 were in accordance with the Public Sector Pension Investment Board Act (the “Act”) and the Statement of Investment Policies, Standards and Procedures (the “SIP&P”).
In addition, PSP Investments maintains records and systems of internal control and supporting procedures to provide reasonable assurance that PSP Investments’ assets are safeguarded and controlled, and that transactions are in accordance with the applicable provisions of Part X of the Financial Administration Act and, as appropriate, the Act, the accompanying regulations, the by-laws, and the SIP&P.
The Committee assists the Board of Directors in discharging its responsibility to approve the annual financial statements. The Committee meets regularly with both management and the external auditors to discuss the scope and findings of audits and other work that the external auditors may be requested to perform from time to time, to review financial information, and to discuss the adequacy of internal controls. The Committee reviews the annual financial statements and recommends them to the Board of Directors for approval.
PSP Investments’ external “joint” auditors, the Office of the Auditor General of Canada and Deloitte LLP (the “External Auditors”), have conducted independent audits of the financial statements in accordance with Canadian generally accepted auditing standards, performing such tests and other procedures as they consider necessary to express an opinion in their Auditors’ Report. The External Auditors have full and unrestricted access to management and the Committee to discuss findings related to the integrity of PSP Investments’ financial reporting and the adequacy of internal control systems.
MANAGEMENT’S RESPONSIBILITY for Financial Reporting
Management’s Responsibility for Financial Reporting
PUBLIC SECTOR PENSION INVESTMENT BOARD | ANNUAL REPORT 2017 83

The Public Sector Pension Investment Board Act (the “Act”) requires that a certificate be signed by a director on behalf of the Board of Directors, stating that the investments of the Public Sector Pension Investment Board (“PSP Investments”) held during the financial year were in accordance with the Act and PSP Investments’ investment policies, standards and procedures. Accordingly, the Investment Certificate follows:
“The investments of PSP Investments held during the year ended March 31, 2017, were in accordance with the Act and PSP Investments’ Statement of Investment Policies, Standards and Procedures”.
Michael P. Mueller Chair of the Board May 12, 2017
INVESTMENT CERTIFICATE
Investment Certificate
ANNUAL REPORT 2017 | PUBLIC SECTOR PENSION INVESTMENT BOARD84

Public Sector Pension Investment Board
CONSOLIDATED FINANCIAL STATEMENTSIndependent Auditors’ ReportTo the President of the Treasury Board
Report on the Consolidated Financial Statements
We have audited the accompanying consolidated financial statements of the Public Sector Pension Investment Board (PSP Investments), which comprise the consolidated statements of financial position as at March 31, 2017 and March 31, 2016, and the consolidated statements of comprehensive income, consolidated statements of changes in equity and consolidated statements of cash flows for the years then ended, and a summary of significant accounting policies and other explanatory information.
Management’s Responsibility for the Consolidated Financial Statements
Management is responsible for the preparation and fair presentation of these consolidated financial statements in accordance with International Financial Reporting Standards as issued by the International Accounting Standards Board, and for such internal control as management determines is necessary to enable the preparation of consolidated financial statements that are free from material misstatement, whether due to fraud or error.
Auditor’s Responsibility
Our responsibility is to express an opinion on these consolidated financial statements based on our audits. We conducted our audits in accordance with Canadian generally accepted auditing standards. Those standards require that we comply with ethical requirements and plan and perform the audit to obtain reasonable assurance about whether the consolidated financial statements are free from material misstatement.
An audit involves performing procedures to obtain audit evidence about the amounts and disclosures in the consolidated financial statements. The procedures selected depend on the auditor’s judgment, including the assessment of the risks of material misstatement of the consolidated financial statements, whether due to fraud or error. In making those risk assessments, the auditor
considers internal control relevant to the entity’s preparation and fair presentation of the consolidated financial statements in order to design audit procedures that are appropriate in the circumstances, but not for the purpose of expressing an opinion on the effectiveness of the entity’s internal control. An audit also includes evaluating the appropriateness of accounting policies used and the reasonableness of accounting estimates made by management, as well as evaluating the overall presentation of the consolidated financial statements.
We believe that the audit evidence we have obtained in our audits is sufficient and appropriate to provide a basis for our audit opinion.
Opinion
In our opinion, the consolidated financial statements present fairly, in all material respects, the financial position of PSP Investments as at March 31, 2017 and March 31, 2016, and its financial performance and its cash flows for the years then ended in accordance with International Financial Reporting Standards as issued by the International Accounting Standards Board.
Report on Other Legal and Regulatory Requirements
As required by the Financial Administration Act, we report that, in our opinion, the accounting principles in International Financial Reporting Standards as issued by the International Accounting Standards Board have been applied on a basis consistent with that of the preceding year.
Further, in our opinion, the transactions of PSP Investments and its wholly-owned subsidiaries that have come to our notice during our audits of the consolidated financial statements have, in all significant respects, been in accordance with the applicable provisions of Part X of the Financial Administration Act and regulations, the Public Sector Pension Investment Board Act and regulations and the by-laws of PSP Investments and its wholly-owned subsidiaries.
Public Sector Pension Investment Board Consolidated Financial Statements
PUBLIC SECTOR PENSION INVESTMENT BOARD | ANNUAL REPORT 2017 85
Margaret Haire, CPA, CA Principal for the Auditor General of Canada
May 12, 2017 Ottawa, Canada
1 CPA auditor, CA, public accountancy permit No. A121444
May 12, 2017 Montréal, Canada

PUBLIC SECTOR PENSION INVESTMENT BOARD
Consolidated Statements of Financial PositionAs at
(Canadian $ millions) March 31, 2017 March 31, 2016
AssetsInvestments (Note 4.1) $ 158,803 $ 131,513Other assets 170 147
Total assets $ 158,973 $ 131,660
LiabilitiesTrade payable and other liabilities $ 231 $ 187Investment-related liabilities (Note 4.1) 12,373 5,861Borrowings (Notes 4.1, 8.2) 10,807 8,851
Total liabilities $ 23,411 $ 14,899
Net assets $ 135,562 $ 116,761
EquityStatutory rights held by the Government of Canada with respect to: (Note 9.1)
Public Service Pension Plan Account $ 98,447 $ 84,723Canadian Forces Pension Plan Account 26,653 22,999Royal Canadian Mounted Police Pension Plan Account 9,835 8,483Reserve Force Pension Plan Account 627 556
Total equity $ 135,562 $ 116,761
Total liabilities and equity $ 158,973 $ 131,660
The accompanying notes are an integral part of the Consolidated Financial Statements.
On behalf of the Board of Directors:
Michael P. Mueller William A. MacKinnon Chair of the Board Chair of the Audit Committee
ANNUAL REPORT 2017 | PUBLIC SECTOR PENSION INVESTMENT BOARD86
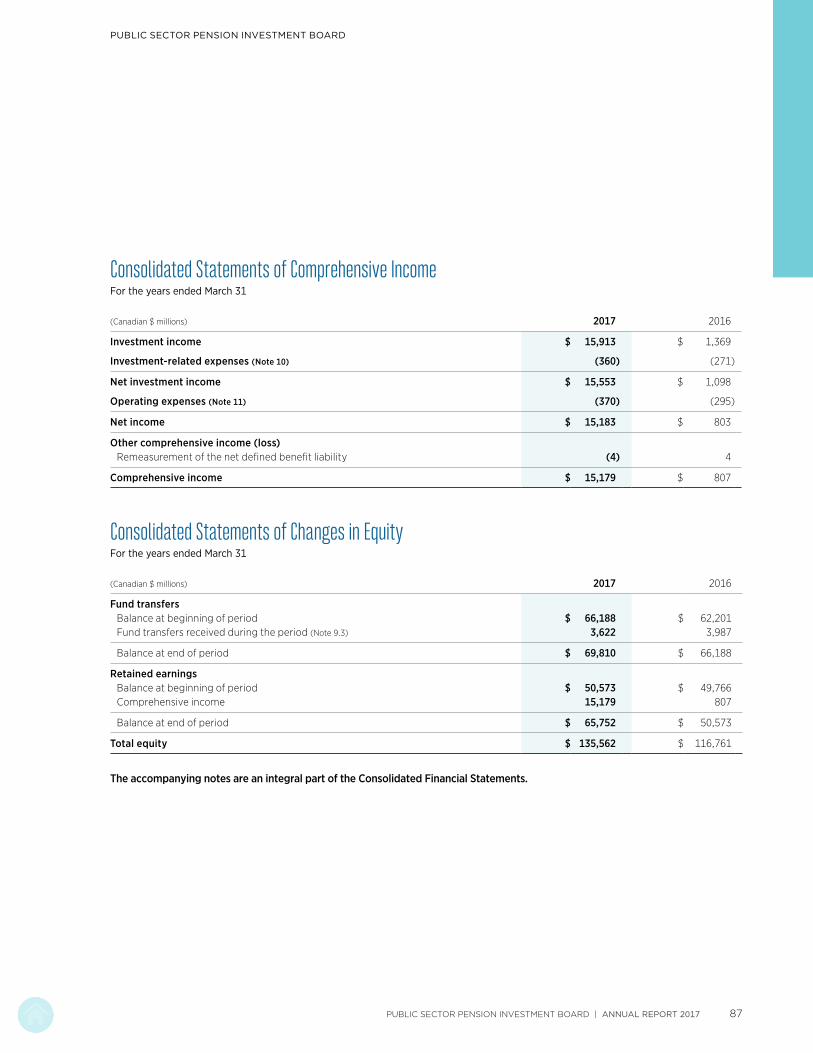
PUBLIC SECTOR PENSION INVESTMENT BOARD
Consolidated Statements of Comprehensive Income For the years ended March 31
(Canadian $ millions) 2017 2016
Investment income $ 15,913 $ 1,369
Investment-related expenses (Note 10) (360) (271)
Net investment income $ 15,553 $ 1,098
Operating expenses (Note 11) (370) (295)
Net income $ 15,183 $ 803
Other comprehensive income (loss)Remeasurement of the net defined benefit liability (4) 4
Comprehensive income $ 15,179 $ 807
Consolidated Statements of Changes in Equity For the years ended March 31
(Canadian $ millions) 2017 2016
Fund transfersBalance at beginning of period $ 66,188 $ 62,201Fund transfers received during the period (Note 9.3) 3,622 3,987
Balance at end of period $ 69,810 $ 66,188
Retained earningsBalance at beginning of period $ 50,573 $ 49,766Comprehensive income 15,179 807
Balance at end of period $ 65,752 $ 50,573
Total equity $ 135,562 $ 116,761
The accompanying notes are an integral part of the Consolidated Financial Statements.
PUBLIC SECTOR PENSION INVESTMENT BOARD | ANNUAL REPORT 2017 87

PUBLIC SECTOR PENSION INVESTMENT BOARD
Consolidated Statements of Cash Flows For the years ended March 31
(Canadian $ millions) 2017 2016
Cash flows from operating activitiesNet income $ 15,183 $ 803Adjustments for non-cash items:
Depreciation of equipment (Note 11) 30 26Effect of exchange rate changes on cash and cash equivalents (48) 9Unrealized losses (gains) on borrowings 416 (545)
$ 15,581 $ 293
Net changes in operating assets and liabilitiesIncrease in investments $ (24,864) $ (6,499)Decrease (increase) in other assets 9 (6)Increase (decrease) in trade payable and other liabilities 40 (4)Increase in investment-related liabilities 6,512 799
Net cash flows used in operating activities $ (2,722) $ (5,417)
Cash flow from financing activitiesProceeds from borrowings $ 26,760 $ 23,966Repayment of borrowings (25,220) (21,983)Fund transfers received 3,622 3,987
Net cash flows provided by financing activities $ 5,162 $ 5,970
Cash flow from investing activitiesAcquisitions of equipment $ (46) $ (27)
Net cash flows used in investing activities $ (46) $ (27)
Net change in cash and cash equivalents $ 2,394 $ 526Effect of exchange rate changes on cash and cash equivalents 48 (9)Cash and cash equivalents at the beginning of the period 1,388 871
Cash and cash equivalents at the end of the periodA $ 3,830 $ 1,388
Supplementary disclosure of cash flow informationInterest paid $ (139) $ (121)
A As at March 31, 2017, cash and cash equivalents were comprised of $3,805 million (March 31, 2016 – $1,379 million) held for investment purposes and included in Note 4.1, as well as $25 million (March 31, 2016 – $9 million) held for administrative purposes and included in Other assets.
The accompanying notes are an integral part of the Consolidated Financial Statements.
ANNUAL REPORT 2017 | PUBLIC SECTOR PENSION INVESTMENT BOARD88
1 CORPORATE INFORMATION
The Public Sector Pension Investment Board (“PSP Investments”) is a Crown corporation created under the Public Sector Pension Investment Board Act (the “Act”) to manage and invest amounts that are transferred to it pursuant to the Superannuation Acts (defined below), for the funds (as defined in the Act) of the pension plans established under the Public Service Superannuation Act, the Canadian Forces Superannuation Act (“CFSA”), the Royal Canadian Mounted Police Superannuation Act (collectively the “Superannuation Acts”), and certain regulations under the CFSA (the “CFSA Regulations”). The pension plans established under the Superannuation Acts consist of the Public Service pension plan, the Canadian Forces pension plan, and the Royal Canadian Mounted Police pension plan, and the pension plan established under the CFSA Regulations is the Reserve Force pension plan. They are herein referred to individually as a “Plan” and collectively as the “Plans”.
The funds for which amounts are currently transferred to PSP Investments by the Government of Canada (individually a “Fund” and collectively the “Funds”) relate to pension obligations under the Plans for service on or after April 1, 2000, and in the case of the Reserve Force Plan, for service on or after March 1, 2007 (collectively “Post-2000 Service”). The accounts managed by PSP Investments for the Funds are herein referred to individually as a “Plan Account” and collectively as the “Plan Accounts”.
PSP Investments is responsible for managing amounts that are transferred to it in the best interests of the beneficiaries and contributors under the Superannuation Acts. The amounts are to be invested with a view of achieving a maximum rate of return, without undue risk of loss, having regard to the funding, policies and requirements of the Plans and the ability of the Plans to meet their financial obligations.
Pursuant to the Superannuation Acts, the Government of Canada, which administers the Plans and their respective Funds, may at any time call upon the net assets of PSP Investments allocated to each Fund’s Plan Account for amounts required for the purpose of paying benefits under the relevant Plan in respect of Post-2000 Service, or generally, for the purpose of reducing any non-permitted surplus in the Fund of such Plan.
PSP Investments and the majority of its subsidiaries are exempt from Part I tax under paragraphs 149(1)(d) and 149(1)(d.2) of the Income Tax Act (Canada), respectively.
PSP Investments’ registered office is located at 1 Rideau Street, Ottawa, Ontario, Canada and its principal business office is at 1250 René Lévesque Boulevard West, Montreal, Quebec, Canada.
2 SIGNIFICANT ACCOUNTING POLICIES
The significant accounting policies that have been applied in the preparation of these Consolidated Financial Statements are summarized below and have been used throughout all periods presented.
2.1. BASIS OF PRESENTATION
The Consolidated Financial Statements of PSP Investments have been prepared in accordance with International Financial Reporting Standards (“IFRS”) as issued by the International Accounting Standards Board (“IASB”).
PSP Investments qualifies as an investment entity as defined under IFRS 10 Consolidated Financial Statements and, consequently, does not consolidate its subsidiaries other than those that solely provide it with services that relate to its investment activities. Instead, PSP Investments measures its investments in subsidiaries at fair value through profit or loss (“FVTPL”) in accordance with IFRS 9 Financial Instruments (“IFRS 9”), including those that are formed by PSP Investments and that qualify as investment entities (“investment entity subsidiaries”). PSP Investments also measures its investments in associates, joint ventures and financial assets and financial liabilities at FVTPL in accordance with IAS 28 Investments in Associates and Joint Ventures and IFRS 9.
These Consolidated Financial Statements present the financial position and results of operations of PSP Investments and its subsidiaries that solely provide it with services that relate to its investment activities. They reflect the economic activity of PSP Investments as it pertains to the investment of the net contributions transferred to it for the Funds. Accordingly, they do not reflect all of the assets or the details of the pension contributions, payments and liabilities under the Plans.
These Consolidated Financial Statements were authorized for issue in accordance with a resolution of the Board of Directors on May 12, 2017.
Plan Accounts
PSP Investments maintains records of net contributions for each Fund, as well as the allocation of its investments and the results of its operations to each of the Plan Accounts. Separate financial statements for each Plan Account are prepared.
Notes to the Consolidated Financial StatementsFor the years ended March 31, 2017 and 2016
PUBLIC SECTOR PENSION INVESTMENT BOARD
PUBLIC SECTOR PENSION INVESTMENT BOARD | ANNUAL REPORT 2017 89

PUBLIC SECTOR PENSION INVESTMENT BOARDNotes to the Consolidated Financial Statements for the years ended March 31, 2017 and 2016
2 SIGNIFICANT ACCOUNTING POLICIES (continued)
2.2. INVESTMENT ENTITY STATUS
PSP Investments has determined that it meets the mandatory items of the definition of an investment entity under IFRS 10 on the basis of the facts and circumstances as at the end of the period. They are as follows:
(i) Mandate and business purpose
As further described in Note 1, PSP Investments’ mandate is to manage and invest the amounts that are transferred to it in the best interests of the beneficiaries and contributors under the Superannuation Acts. Consequently, PSP Investments’ business purpose is to invest with a view of achieving a maximum rate of return from capital appreciation and income from investments, without undue risk of loss.
(ii) Performance evaluation
PSP Investments measures and evaluates the performance of its investments on a fair value basis.
In addition to the mandatory items of the definition, IFRS 10 also outlines certain typical characteristics of an investment entity, the absence of any of which does not necessarily preclude an entity from qualifying as an investment entity. One of these characteristics is that an investment entity should have investors that are not related parties of the entity.
As described in Note 13, since PSP Investments is a Crown corporation, it is considered to be related to the Government of Canada as well as other entities that are controlled or jointly controlled by the Government of Canada or entities over which the latter has significant influence. Consequently, since the funds managed by PSP Investments originate from related parties, it may be considered not to meet the typical characteristic outlined above. However, the Act provides a framework to ensure that PSP Investments operates at arm’s length from the Government of Canada. Accordingly, it meets all of the mandatory items of the definition described above and qualifies as an investment entity.
Should any changes occur in the facts and circumstances, PSP Investments will evaluate the impact of any such changes on its investment entity status.
2.3. SUMMARY OF SIGNIFICANT ACCOUNTING POLICIES
The principal accounting policies applied in the preparation of these Consolidated Financial Statements are set out below.
2.3.1. Financial Instruments
(i) Classification
Financial assets representing investments are managed, together with related financial liabilities, according to the entity’s business model to maximize the rate of return. The performance of such financial instruments is evaluated on a fair value basis and they are classified at FVTPL. They are described in detail in Note 4.1.
Borrowings as described under Note 8, are financial liabilities that are designated to be measured at FVTPL since they are part of the portfolios of investments that are managed together and whose performance is evaluated on a fair value basis.
(ii) Recognition
Financial assets and financial liabilities are recorded at the date upon which PSP Investments becomes a party to the associated contractual provisions. In the case of traded financial assets, they are recorded as of the trade date.
(iii) Initial and subsequent measurement
All financial assets and financial liabilities are recorded in the Consolidated Statements of Financial Position at fair value and continue to be measured as such on a recurring basis. After initial measurement, subsequent changes in the fair value of financial assets and financial liabilities classified at FVTPL are recorded in the Consolidated Statements of Comprehensive Income.
If fair value changes in financial liabilities designated to be measured at FVTPL result from fluctuations in PSP Investments’ own credit risk, they are recorded in other comprehensive income. All other changes in fair value are recorded in investment income.
(iv) Derecognition
A financial asset (or, where applicable, a part thereof) is derecognized when the following conditions are met:
· The rights to receive cash flows from the asset have expired, or
· PSP Investments has transferred its rights to receive cash flows from the asset or has assumed an obligation to pay the received cash flows to a third party,
and
· PSP Investments has transferred substantially all the risks and rewards of the asset, or
· In cases where PSP Investments has neither transferred nor retained substantially all the risks and rewards of the asset, it has transferred control of the asset.
A financial liability is derecognized when the obligation under the liability is discharged, cancelled or expired.
ANNUAL REPORT 2017 | PUBLIC SECTOR PENSION INVESTMENT BOARD90

PUBLIC SECTOR PENSION INVESTMENT BOARDNotes to the Consolidated Financial Statements for the years ended March 31, 2017 and 2016
2 SIGNIFICANT ACCOUNTING POLICIES (continued)
2.3. SUMMARY OF SIGNIFICANT ACCOUNTING POLICIES (continued)
2.3.2. Determination of Fair Value
Fair value is the price that would be received to sell an asset or paid to transfer a liability in an orderly transaction between market participants at the measurement date.
At initial recognition, PSP Investments evaluates the facts and circumstances related to a transaction to confirm that the transaction price represents the fair value of an asset or a liability. At each subsequent reporting date, market prices are used to determine fair value where an active market exists (such as a recognized securities exchange), as they reflect actual and regularly occurring market transactions on an arm’s length basis. If quoted market prices are not available, then fair value is estimated using valuation techniques based on inputs existing at the end of the reporting period that are derived from observable market data.
Valuation techniques are generally applied to investments in Private Markets, over-the-counter (OTC) derivatives and certain fixed income securities. The values derived from applying these techniques are impacted by the choice of valuation model and the underlying assumptions made concerning factors such as the amounts and timing of future cash flows, discount rates, volatility and credit risk. In certain cases, such assumptions are not supported by market observable data.
The determination of fair value of all financial assets and financial liabilities is described in Note 4.
2.3.3. Functional and Presentation Currency
The functional and presentation currency of PSP Investments and its consolidated subsidiaries is the Canadian dollar, which is the currency of the primary economic environment in which each entity within the consolidated group operates. PSP Investments’ performance and that of its consolidated subsidiaries is evaluated and its liquidity is managed in Canadian dollars.
2.3.4. Foreign Currency Translation
Foreign currency transactions during the period, including purchases and sales of securities, income and expenses, are translated at the rate of exchange prevailing on the date of the transaction.
Monetary assets and liabilities that are denominated in foreign currencies are translated at the functional currency rate of exchange prevailing at the end of the reporting period.
Foreign currency transaction gains and losses on all monetary assets and liabilities are included in investment income.
2.3.5. Securities Lending and Securities Borrowing and Related Collateral
PSP Investments participates in securities lending and borrowing programs whereby it lends and borrows securities in order to enhance portfolio returns. Lending and borrowing transactions including related collateral under such programs do not transfer the risks or rewards of ownership of the securities to the counterparty. Consequently, PSP Investments does not derecognize securities lent or pledged as collateral, or recognize securities borrowed or received as collateral. Cash collateral received is recognized as described in Note 4.1.8.
The securities lending and borrowing programs require collateral in cash, high-quality debt instruments or securities. Collateral transactions are conducted under terms that are usual and customary in standard securities lending and borrowing programs. PSP Investments and its counterparties are authorized to sell, repledge or otherwise use collateral held. The same securities or equivalent securities must be returned to the counterparty at the end of the contract, unless an event of default occurs.
2.3.6. Securities sold under Repurchase Agreements and purchased under Reverse Repurchase Agreements and Related Collateral
PSP Investments is party to repurchase and reverse repurchase agreements. Such agreements involve the sale of securities by one counterparty with a simultaneous agreement to repurchase such securities at a specified price and at a specified future date.
Securities sold or purchased under the repurchase and reverse repurchase agreements respectively, including related collateral, are not derecognized or recognized as all risks and rewards of ownership related to such securities are not transferred. As such, in the case where PSP Investments is the counterparty selling securities under such agreements, all income (loss) related to such securities continues to be reported in investment income and obligations to repurchase the securities sold are accounted for as investment-related liabilities. The difference between the fair value of the securities sold and the repurchase price is recorded as interest expense. In the case where PSP Investments is the counterparty purchasing securities under such agreements, no income (loss) related to such securities is recognized and obligations to resell the securities are accounted for as investment-related receivables. The difference between the fair value of the securities purchased and resale price is recorded in investment income.
Transactions under repurchase and reverse repurchase agreements involve pledging collateral consisting of cash or securities deemed acceptable by the counterparties. Collateral transactions are conducted under terms that are usual and customary in standard repurchase arrangements. Such terms require the relevant counterparty to pledge additional collateral based on the changes in the fair value of the existing collateral pledged as well as the related securities sold or purchased. The counterparties are authorized to sell, repledge or otherwise use collateral held. The securities pledged as collateral must be returned to the relevant counterparty at the end of the contract, unless an event of default occurs.
PUBLIC SECTOR PENSION INVESTMENT BOARD | ANNUAL REPORT 2017 91

PUBLIC SECTOR PENSION INVESTMENT BOARDNotes to the Consolidated Financial Statements for the years ended March 31, 2017 and 2016
2 SIGNIFICANT ACCOUNTING POLICIES (continued)
2.3. SUMMARY OF SIGNIFICANT ACCOUNTING POLICIES (continued)
2.3.7. Offsetting of Financial Instruments
Financial assets and financial liabilities are offset with the net amount reported in the Consolidated Statements of Financial Position only if PSP Investments has a current legally enforceable right to offset the recognized amounts and the intent to settle on a net basis, or to realize the assets and settle the liabilities simultaneously.
2.3.8. Equity
The statutory rights of the Government of Canada pursuant to the Superannuation Acts are described under Note 1 and are classified as equity instruments on the following basis:
· Under such rights the Government of Canada is entitled to PSP Investments’ net assets at any time for the purposes set out in the Superannuation Acts. Such rights do not contain any additional obligations for PSP Investments to deliver amounts to the Government of Canada.
· Such rights are the most subordinate claim on PSP Investments’ net assets.
· The total expected cash flows attributable to such rights, at any time, is solely based on the fair value of the net assets of PSP Investments at that time. Further, the fair value of the net assets of PSP Investments in its entirety represents the amounts that the Government of Canada may call upon at any time.
2.3.9. Investment Income
Investment income is made up of interest, dividends, gains (losses) on the disposal of financial assets and financial liabilities as well as gains (losses) which reflect the change in unrealized appreciation (depreciation) of financial assets held and financial liabilities outstanding at the end of the reporting period. Interest is recognized, on a consistent basis, using the prescribed rates until maturity. Dividends are recognized when the right to receive them has been obtained, generally on the ex-dividend date.
2.3.10. Investment-Related Expenses
Investment-related expenses are made up of interest expense, as described in Note 4.1.7, transaction costs, external investment management fees and other (net).
Transaction costs are incremental costs directly attributable to the acquisition, due diligence, issue, or disposal of a financial asset or financial liability, and they are expensed as incurred.
External investment management fees are directly attributable to the external management of assets on behalf of PSP Investments. These fees are paid directly by PSP Investments and comprise base fees accrued as a percentage of the fair value of the assets managed externally and performance fees accrued as a function of various performance indicators. This excludes amounts not paid directly by PSP Investments for certain pooled fund investments classified under alternative investments and for investments in private markets and other fixed income securities as outlined in Note 10.
2.3.11. Fund Transfers
Amounts are received from the Government of Canada for the Funds and are recorded in their respective Plan Account.
2.4. SIGNIFICANT ACCOUNTING JUDGMENTS, ESTIMATES AND ASSUMPTIONS
In preparing the Consolidated Financial Statements, management makes certain judgments, estimates and assumptions that can affect the amounts reported therein. Significant judgments include those related to the determination of the investment entity status as described in Note 2.2.
Management also makes estimates and assumptions in the measurement, risk assessment and related disclosures surrounding investments in private markets and certain fixed income securities. The main assumptions made by management regarding measurement of financial instruments are outlined in Note 4.2.3 and those regarding the assessment of risk are outlined in Note 7.
Although estimates and assumptions reflect management’s best judgment, actual results may differ from such estimates due to the uncertainties involved in using them.
ANNUAL REPORT 2017 | PUBLIC SECTOR PENSION INVESTMENT BOARD92

PUBLIC SECTOR PENSION INVESTMENT BOARDNotes to the Consolidated Financial Statements for the years ended March 31, 2017 and 2016
3 CURRENT AND FUTURE CHANGES IN ACCOUNTING STANDARDS
3.1. ACCOUNTING STANDARDS ADOPTED IN THE CURRENT YEAR
IFRS 11 Joint Arrangements
IFRS 11 was amended, effective for annual periods beginning on or after January 1, 2016, to add new guidance on the accounting for acquisitions of interests in a joint operation that constitutes a business. Acquirers of such interests shall apply all of the principles in business combinations accounting in IFRS 3 Business Combinations, and other IFRS, that do not conflict with the guidance in IFRS 11 and disclose the information that is required in those IFRS in relation to business combinations. On April 1, 2016, PSP Investments adopted this amendment with no impact on the presentation of the Consolidated Financial Statements.
3.2. ACCOUNTING STANDARDS ADOPTED BEFORE THE EFFECTIVE DATE
IFRS 9 Financial Instruments
In 2014, the IASB completed its project to replace IAS 39 Financial Instruments: Recognition and Measurement with IFRS 9. The Standard includes requirements for recognition, derecognition, classification and measurement of financial assets and liabilities. IFRS 9 is effective for annual periods beginning on or after January 1, 2018 with early application permitted.
PSP Investments initially adopted IFRS 9 (2014) in the Consolidated Financial Statements for the year ended March 31, 2016. Significant accounting policies in connection with IFRS 9 are described under Note 2.3.1.
3.3. FUTURE ACCOUNTING STANDARDS
A number of new standards, amendments and interpretations have been issued by the IASB, but are not yet effective. The following relates to one or more of PSP Investments’ significant accounting policies or disclosures:
IAS 7 Statement of Cash Flows
IAS 7 was amended, effective for annual periods beginning on or after January 1, 2017, to add new guidance on disclosures that enable users of financial statements to evaluate changes in liabilities arising from financing activities, including both changes arising from cash flows and non-cash changes. PSP Investments will apply the amendments starting from April 1, 2017 and will make the required note disclosures in its Consolidated Financial Statements.
IAS 28 Investment in Associates and Joint Ventures
IAS 28 was amended, effective for annual periods beginning on or after January 1, 2018, to add a clarification that serves to elaborate and clarify that the election to measure investees at fair value is available on an investment by investment basis and is not an election that must be applied consistently to the measurement of all associates and joint ventures. Management has determined that the amendment will not have an impact on PSP Investments’ Consolidated Financial Statements.
PUBLIC SECTOR PENSION INVESTMENT BOARD | ANNUAL REPORT 2017 93
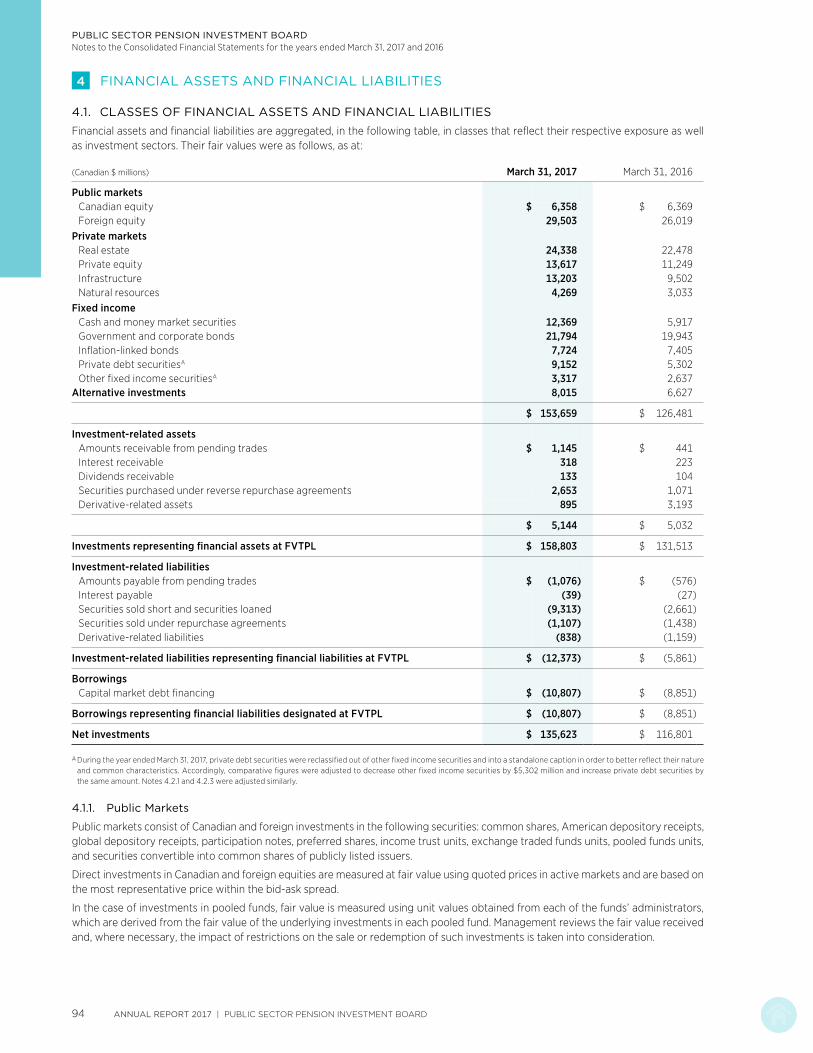
PUBLIC SECTOR PENSION INVESTMENT BOARDNotes to the Consolidated Financial Statements for the years ended March 31, 2017 and 2016
4 FINANCIAL ASSETS AND FINANCIAL LIABILITIES
4.1. CLASSES OF FINANCIAL ASSETS AND FINANCIAL LIABILITIES
Financial assets and financial liabilities are aggregated, in the following table, in classes that reflect their respective exposure as well as investment sectors. Their fair values were as follows, as at:
(Canadian $ millions) March 31, 2017 March 31, 2016
Public marketsCanadian equity $ 6,358 $ 6,369Foreign equity 29,503 26,019
Private marketsReal estate 24,338 22,478Private equity 13,617 11,249Infrastructure 13,203 9,502Natural resources 4,269 3,033
Fixed incomeCash and money market securities 12,369 5,917Government and corporate bonds 21,794 19,943Inflation-linked bonds 7,724 7,405Private debt securitiesA 9,152 5,302Other fixed income securitiesA 3,317 2,637
Alternative investments 8,015 6,627
$ 153,659 $ 126,481
Investment-related assetsAmounts receivable from pending trades $ 1,145 $ 441Interest receivable 318 223Dividends receivable 133 104Securities purchased under reverse repurchase agreements 2,653 1,071Derivative-related assets 895 3,193
$ 5,144 $ 5,032
Investments representing financial assets at FVTPL $ 158,803 $ 131,513
Investment-related liabilitiesAmounts payable from pending trades $ (1,076) $ (576)Interest payable (39) (27)Securities sold short and securities loaned (9,313) (2,661)Securities sold under repurchase agreements (1,107) (1,438)Derivative-related liabilities (838) (1,159)
Investment-related liabilities representing financial liabilities at FVTPL $ (12,373) $ (5,861)
BorrowingsCapital market debt financing $ (10,807) $ (8,851)
Borrowings representing financial liabilities designated at FVTPL $ (10,807) $ (8,851)
Net investments $ 135,623 $ 116,801
A During the year ended March 31, 2017, private debt securities were reclassified out of other fixed income securities and into a standalone caption in order to better reflect their nature and common characteristics. Accordingly, comparative figures were adjusted to decrease other fixed income securities by $5,302 million and increase private debt securities by the same amount. Notes 4.2.1 and 4.2.3 were adjusted similarly.
4.1.1. Public Markets
Public markets consist of Canadian and foreign investments in the following securities: common shares, American depository receipts, global depository receipts, participation notes, preferred shares, income trust units, exchange traded funds units, pooled funds units, and securities convertible into common shares of publicly listed issuers.
Direct investments in Canadian and foreign equities are measured at fair value using quoted prices in active markets and are based on the most representative price within the bid-ask spread.
In the case of investments in pooled funds, fair value is measured using unit values obtained from each of the funds’ administrators, which are derived from the fair value of the underlying investments in each pooled fund. Management reviews the fair value received and, where necessary, the impact of restrictions on the sale or redemption of such investments is taken into consideration.
ANNUAL REPORT 2017 | PUBLIC SECTOR PENSION INVESTMENT BOARD94

PUBLIC SECTOR PENSION INVESTMENT BOARDNotes to the Consolidated Financial Statements for the years ended March 31, 2017 and 2016
4 FINANCIAL ASSETS AND FINANCIAL LIABILITIES (continued)
4.1. CLASSES OF FINANCIAL ASSETS AND FINANCIAL LIABILITIES (continued)
4.1.2. Private Markets
Private markets consist of investments in real estate, private equity, infrastructure and natural resources.
Real estate investments are comprised of direct equity positions in various private entities, fund investments, as well as properties in the real estate sector. Real estate investments focus on partnerships, companies and properties operating mainly in the retirement and residential, office, retail, and industrial sectors, as well as private funds invested in real estate assets. Real estate investments are presented net of all third-party financing. As at March 31, 2017, leverage in the form of third-party financing undertaken by investment entity subsidiaries and direct real estate investments controlled by PSP Investments was $6,957 million (March 31, 2016 – $6,286 million).
Private equity investments are comprised of fund investments with similar objectives, co-investments in private entities as well as direct equity positions.
Infrastructure investments are comprised of direct equity positions, fund investments and co-investments in various private entities. Infrastructure investments focus on entities engaged in the management, ownership or operation of assets in energy, transportation and other regulated businesses. Infrastructure investments are presented net of all third-party financing. As at March 31, 2017, leverage in the form of third-party financing undertaken by direct infrastructure investments controlled by PSP Investments was $3,946 million (March 31, 2016 – $1,594 million).
Natural resources investments are comprised of direct equity positions, fund investments and partnerships. Natural resources investments focus on entities engaged in the management, ownership or operation of assets in timberlands, agriculture and upstream oil and gas.
The process for fair value measurement of private markets investments is described in Note 4.2.2 and the valuation techniques together with the significant inputs used are described in Note 4.2.3.
4.1.3. Fixed Income
Fixed income consists of cash and money market securities, government and corporate bonds, inflation-linked bonds, private debt securities and other fixed income securities.
Cash and money market securities include instruments having a maximum term to maturity of one year, such as treasury bills, certificates of deposit and bankers’ acceptances. A portion of such instruments has maturities of 90 days or less and is held to meet short-term financial commitments. Such instruments are readily convertible into known amounts of cash and have an insignificant risk of change in value. They are considered cash and cash equivalents for purposes of the Consolidated Statements of Cash Flows and amounted to $3,805 million as at March 31, 2017 (March 31, 2016 – $1,379 million). Treasury bills are valued based on prices obtained from third-party pricing sources. Such prices are determined using the most representative price within a spread of dealer quotations. Certificates of deposit and bankers’ acceptances are recorded at cost plus accrued interest, which approximates their fair value given their short-term nature. Government and corporate bonds include Canadian and foreign, federal, provincial, territorial and municipal bonds. Inflation-linked bonds are fixed income securities that earn inflation-adjusted returns.
Private debt securities are fixed income securities of private companies held directly or through private funds. Such debt securities take the form of senior debt, mezzanine and distressed debt and primary and secondary investments in leveraged loans. Private debt securities also include third-party loans such as junior and senior debts, construction loans, bridge loans, income-participating loans, as well as other structured finance products in the real estate sector.
Other fixed income securities consist of asset-backed securities and floating rate notes.
Fair values of government and most corporate bonds, inflation-linked bonds, floating rate notes and mortgage-backed securities are based on prices obtained from third-party pricing sources. Such prices are determined using either an appropriate interest rate curve with a spread associated with the credit quality of the issuer or other generally accepted pricing methodologies.
Asset-backed securities consist mainly of asset-backed term notes (ABTNs) and mortgage-backed securities. The ABTNs were received in exchange for third-party or non-bank sponsored asset-backed commercial paper (ABCP) that suffered a liquidity disruption in mid-August 2007 and were subsequently restructured in January 2009.
The fair values of certain corporate bonds, private debt securities and ABTNs are determined using valuation techniques. Such techniques, together with the significant inputs used, are described in Note 4.2.3.
The fair value measurement of fund investments included as part of private debt securities is described in Note 4.2.2.
PUBLIC SECTOR PENSION INVESTMENT BOARD | ANNUAL REPORT 2017 95

PUBLIC SECTOR PENSION INVESTMENT BOARDNotes to the Consolidated Financial Statements for the years ended March 31, 2017 and 2016
4 FINANCIAL ASSETS AND FINANCIAL LIABILITIES (continued)
4.1. CLASSES OF FINANCIAL ASSETS AND FINANCIAL LIABILITIES (continued)
4.1.4. Alternative Investments
Alternative investments consist mainly of units of funds that hold a mix of equity, fixed income and derivative instruments as well as hedge funds. The fair value of these investments is determined based on the fair values reported by the funds’ administrators or general partners and reflects the fair value of the underlying equity, fixed income or derivative instruments, as applicable. Management reviews the fair value received and, where necessary, the impact of restrictions on the sale or redemption of such investments is taken into consideration.
4.1.5. Amounts Receivable and Payable from Pending Trades
Amounts receivable from pending trades consist of proceeds on sales of investments, excluding derivative financial instruments, which have been traded but remain unsettled at the end of the reporting period.
Amounts payable from pending trades consist of the cost of purchases of investments, excluding derivative financial instruments, which have been traded but remain unsettled at the end of the reporting period.
The fair value of amounts receivable and payable from pending trades reflects the value at which their underlying original sale or purchase transactions were undertaken.
4.1.6. Interest and Dividends Receivable
Interest and dividends are recorded at the amounts expected to be received at the end of the reporting period, which approximates fair value.
4.1.7. Interest Payable
With respect to the borrowings described in Note 4.1.10, interest is accrued at the amount expected to be paid at the end of the reporting period, which approximates fair value.
4.1.8. Securities Sold Short and Securities Loaned
Securities sold short reflect PSP Investments’ obligation to purchase securities pursuant to short selling transactions. In such transactions, PSP Investments sells securities it does not own with an obligation to purchase similar securities on the market to cover its position.
Using quoted market prices that are based on the most representative price within the bid-ask spread, the fair value of securities sold short is measured using the same method as the similar long positions presented within public markets and fixed income.
As part of securities lending and certain OTC derivative transactions, cash collateral is received and reinvested by PSP Investments. PSP Investments recognizes cash collateral received with a corresponding payable. The payable balance reflects the obligation of the transferee to return cash collateral to the transferor at the end of the transaction in the absence of an event of default by the transferor.
4.1.9. Securities Sold under Repurchase Agreements and Purchased under Reverse Repurchase Agreements
As described in Note 2.3.6, PSP Investments is party to repurchase and reverse repurchase agreements. Obligations to repurchase or resell the securities sold or purchased under such agreements are recorded at cost plus accrued interest, which approximates fair value.
4.1.10. Borrowings under the Capital Market Debt Program
PSP Investments’ capital market debt program is described in Note 8.2. Short-term promissory notes are recorded at cost plus accrued interest, which approximates fair value. The fair value of PSP Investments’ medium-term notes is based on prices that are obtained from third-party pricing sources. Such prices are determined using an interest rate curve with a spread consistent with PSP Investments’ credit quality.
ANNUAL REPORT 2017 | PUBLIC SECTOR PENSION INVESTMENT BOARD96

PUBLIC SECTOR PENSION INVESTMENT BOARDNotes to the Consolidated Financial Statements for the years ended March 31, 2017 and 2016
4 FINANCIAL ASSETS AND FINANCIAL LIABILITIES (continued)
4.1. CLASSES OF FINANCIAL ASSETS AND FINANCIAL LIABILITIES (continued)
4.1.11. Derivative-Related Assets and Liabilities
Derivative financial instruments are financial contracts that are settled at a future date. The value of such instruments is derived from changes in the value of the underlying assets, interest or exchange rates. Derivative financial instruments do not, typically, require an initial net investment. In certain cases, they require an initial net investment that is less than what would be required to hold the underlying position directly. Derivative financial instruments can be listed or traded OTC. OTC instruments consist of those that are bilaterally negotiated and settled, and those that are cleared (OTC-cleared) by a central clearing party (CCP).
PSP Investments uses derivative financial instruments to enhance returns or to replicate investments synthetically. Derivatives are also used to reduce the risk associated with existing investments.
PSP Investments uses the following types of derivative financial instruments:
Swaps
Swaps are transactions whereby two counterparties exchange cash flow streams with each other based on predetermined conditions that include a notional amount and a term. Swaps are used to increase returns or to adjust exposures of certain assets without directly purchasing or selling the underlying assets.
Futures
Futures are standardized contracts to take or make delivery of an asset (buy or sell) at a predefined price and predefined future date. Futures are used to adjust exposures to specified assets without directly purchasing or selling the underlying assets.
Forwards
Forwards are contracts involving the sale by one party and the purchase by another party of a predefined amount of an underlying instrument, at a predefined price and at a predefined date in the future. Forwards are used to adjust exposures to specified assets without directly purchasing or selling the underlying assets.
Options
Options are contracts where the seller gives the purchaser the right, but not the obligation, to buy or sell a given amount of an underlying security, index, or commodity, at an agreed-upon price stipulated in advance, either at a determined date or at any time before the predefined maturity date.
Warrants and Rights
Warrants are options to purchase an underlying asset which is in the form of a transferable security and which can be listed on an exchange.
Rights are securities giving shareholders entitlement to purchase new shares issued by a corporation at a predetermined price (normally less than the current market price) in proportion to the number of shares already owned. Rights are issued only for a short period of time, after which they expire.
Determination of Fair Value of Derivative Financial Instruments
Listed derivative financial instruments are recorded at fair value using quoted market prices that are based on the most representative price within the bid-ask spread. OTC-cleared derivatives are recorded at fair value using prices obtained from the CCP. OTC derivatives are valued using appropriate valuation techniques such as discounted cash flows. These techniques use significant inputs that are observable in the market such as current market yields.
Notional Values and Fair Values of Derivative-Related Assets and Liabilities
Notional values of derivative financial instruments are not recorded as assets or liabilities as they represent the face amount of the contract. Except for credit derivatives, notional values do not represent the potential gain or loss associated with the market or credit risk of such transactions disclosed below. Rather, they serve as the basis upon which the cash flows and the fair value of the contracts are determined.
PUBLIC SECTOR PENSION INVESTMENT BOARD | ANNUAL REPORT 2017 97

PUBLIC SECTOR PENSION INVESTMENT BOARDNotes to the Consolidated Financial Statements for the years ended March 31, 2017 and 2016
4 FINANCIAL ASSETS AND FINANCIAL LIABILITIES (continued)
4.1. CLASSES OF FINANCIAL ASSETS AND FINANCIAL LIABILITIES (continued)
4.1.11. Derivative-Related Assets and Liabilities (continued)
The following table summarizes the derivatives portfolio as at:
March 31, 2017 March 31, 2016
(Canadian $ millions) Notional Value
Fair Value
Notional Value
Fair Value
Assets Liabilities Assets Liabilities
Equity and commodity derivativesListed
Futures $ 1,404 $ – $ – $ 670 $ – $ –Warrants and rights 3 8 – 3 4 –Options: Purchased 3,871 31 – 1,506 20 –
Written 3,243 – (27) 1,397 – (23)OTC
Total return swaps 28,932 253 (108) 20,880 947 (33)Variance swaps 4 4 (5) – – –Options: Purchased 1,908 49 – 5,822 66 –
Written 1,856 – (44) 5,876 – (54)Currency derivatives
ListedFutures 137 – – 175 – –
OTCForwards 28,152 99 (304) 43,501 1,694 (234)Swaps 4,590 17 (43) 3,251 19 (316)Options: Purchased 9,600 89 – 8,783 102 –
Written 9,754 – (69) 10,744 – (87)Interest rate derivatives
ListedFutures 7,939 – – 7,473 – –Options: Purchased 34,398 6 – 2,371 1 –
Written 37,959 – (3) 20,470 – (2)OTC
Bond forwards – – – 326 1 –Interest rate swaps 12,425 157 (95) 11,231 162 (198)Inflation swaps – – – 543 4 (6)Swaptions 28,125 143 (92) 29,111 152 (151)Options: Purchased 22,838 35 – 8,462 10 –
Written 31,639 – (30) 12,629 – (12)OTC-cleared
Interest rate swaps 39,099 – – 7,949 – –Inflation swaps 62 – – – – –
Credit derivativesA
OTCCredit default swaps: Purchased 1,086 – (18) 1,794 8 (23)
Sold 297 4 – 514 3 (20)OTC-cleared
Credit default swaps: Purchased 831 – – 628 – –Sold 1,187 – – 1,441 – –
Total $ 895 $ (838) $ 3,193 $ (1,159)
A PSP Investments, through sold credit derivatives, indirectly guarantees the underlying reference obligations. The maximum potential exposure is the notional amount of the sold credit derivatives as shown in the table above.
ANNUAL REPORT 2017 | PUBLIC SECTOR PENSION INVESTMENT BOARD98
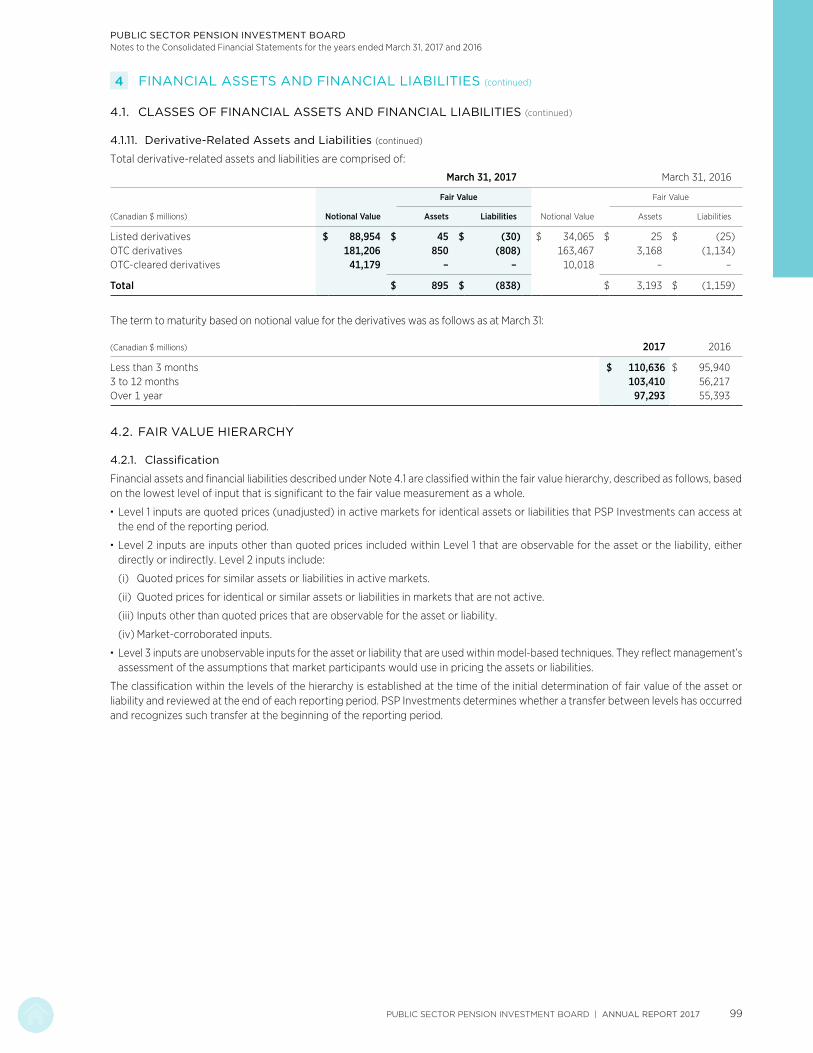
PUBLIC SECTOR PENSION INVESTMENT BOARDNotes to the Consolidated Financial Statements for the years ended March 31, 2017 and 2016
4 FINANCIAL ASSETS AND FINANCIAL LIABILITIES (continued)
4.1. CLASSES OF FINANCIAL ASSETS AND FINANCIAL LIABILITIES (continued)
4.1.11. Derivative-Related Assets and Liabilities (continued)
Total derivative-related assets and liabilities are comprised of:
March 31, 2017 March 31, 2016
(Canadian $ millions) Notional Value
Fair Value
Notional Value
Fair Value
Assets Liabilities Assets Liabilities
Listed derivatives $ 88,954 $ 45 $ (30) $ 34,065 $ 25 $ (25)OTC derivatives 181,206 850 (808) 163,467 3,168 (1,134)OTC-cleared derivatives 41,179 – – 10,018 – –
Total $ 895 $ (838) $ 3,193 $ (1,159)
The term to maturity based on notional value for the derivatives was as follows as at March 31:
(Canadian $ millions) 2017 2016
Less than 3 months $ 110,636 $ 95,9403 to 12 months 103,410 56,217Over 1 year 97,293 55,393
4.2. FAIR VALUE HIERARCHY
4.2.1. Classification
Financial assets and financial liabilities described under Note 4.1 are classified within the fair value hierarchy, described as follows, based on the lowest level of input that is significant to the fair value measurement as a whole.
· Level 1 inputs are quoted prices (unadjusted) in active markets for identical assets or liabilities that PSP Investments can access at the end of the reporting period.
· Level 2 inputs are inputs other than quoted prices included within Level 1 that are observable for the asset or the liability, either directly or indirectly. Level 2 inputs include:
(i) Quoted prices for similar assets or liabilities in active markets.
(ii) Quoted prices for identical or similar assets or liabilities in markets that are not active.
(iii) Inputs other than quoted prices that are observable for the asset or liability.
(iv) Market-corroborated inputs.
· Level 3 inputs are unobservable inputs for the asset or liability that are used within model-based techniques. They reflect management’s assessment of the assumptions that market participants would use in pricing the assets or liabilities.
The classification within the levels of the hierarchy is established at the time of the initial determination of fair value of the asset or liability and reviewed at the end of each reporting period. PSP Investments determines whether a transfer between levels has occurred and recognizes such transfer at the beginning of the reporting period.
PUBLIC SECTOR PENSION INVESTMENT BOARD | ANNUAL REPORT 2017 99

PUBLIC SECTOR PENSION INVESTMENT BOARDNotes to the Consolidated Financial Statements for the years ended March 31, 2017 and 2016
4 FINANCIAL ASSETS AND FINANCIAL LIABILITIES (continued)
4.2. FAIR VALUE HIERARCHY (continued)
4.2.1. Classification (continued)
The following table shows the fair value of financial assets and financial liabilities as at March 31, 2017 classified within the fair value hierarchy:
(Canadian $ millions) Level 1 Level 2 Level 3Total
Fair Value
Public marketsCanadian equity $ 5,475 $ 883 $ – $ 6,358Foreign equity 25,728 3,480 295 29,503
Private marketsReal estate – – 24,338 24,338Private equity – – 13,617 13,617Infrastructure – – 13,203 13,203Natural resources – – 4,269 4,269
Fixed incomeCash and money market securities – 12,369 – 12,369Government and corporate bonds – 21,537 257 21,794Inflation-linked bonds – 7,724 – 7,724Private debt securities – – 9,152 9,152Other fixed income securities – 3,300 17 3,317
Alternative investments – 1,524 6,491 8,015
$ 31,203 $ 50,817 $ 71,639 $ 153,659
Investment-related assetsAmounts receivable from pending trades $ – $ 1,145 $ – $ 1,145Interest receivable – 318 – 318Dividends receivable – 133 – 133Securities purchased under reverse repurchase agreements – 2,653 – 2,653Derivative-related assets 45 850 – 895
$ 45 $ 5,099 $ – $ 5,144
Investments representing financial assets at FVTPL $ 31,248 $ 55,916 $ 71,639 $ 158,803
Investment-related liabilitiesAmounts payable from pending trades $ – $ (1,076) $ – $ (1,076)Interest payable – (39) – (39)Securities sold short and securities loaned (2,867) (6,446) – (9,313)Securities sold under repurchase agreements – (1,107) – (1,107)Derivative-related liabilities (30) (808) – (838)
Investment-related liabilities representing financial liabilities at FVTPL $ (2,897) $ (9,476) $ – $ (12,373)
BorrowingsCapital market debt financing $ – $ (10,807) $ – $ (10,807)
Borrowings representing financial liabilities designated at FVTPL $ – $ (10,807) $ – $ (10,807)
Net investments $ 28,351 $ 35,633 $ 71,639 $ 135,623
ANNUAL REPORT 2017 | PUBLIC SECTOR PENSION INVESTMENT BOARD100

PUBLIC SECTOR PENSION INVESTMENT BOARDNotes to the Consolidated Financial Statements for the years ended March 31, 2017 and 2016
4 FINANCIAL ASSETS AND FINANCIAL LIABILITIES (continued)
4.2. FAIR VALUE HIERARCHY (continued)
4.2.1. Classification (continued)
The following table shows the fair value of financial assets and financial liabilities as at March 31, 2016 classified within the fair value hierarchy:
(Canadian $ millions) Level 1 Level 2 Level 3Total
Fair Value
Public marketsCanadian equity $ 5,644 $ 725 $ – $ 6,369Foreign equity 21,485 4,534 – 26,019
Private marketsReal estate – – 22,478 22,478Private equity – – 11,249 11,249Infrastructure – – 9,502 9,502Natural resources – – 3,033 3,033
Fixed incomeCash and money market securities – 5,917 – 5,917Government and corporate bonds – 19,660 283 19,943Inflation-linked bonds – 7,405 – 7,405Private debt securities – – 5,302 5,302Other fixed income securities – 1,935 702 2,637
Alternative investments – 1,229 5,398 6,627
$ 27,129 $ 41,405 $ 57,947 $ 126,481
Investment-related assetsAmounts receivable from pending trades $ – $ 441 $ – $ 441Interest receivable – 223 – 223Dividends receivable – 104 – 104Securities purchased under reverse repurchase agreements – 1,071 – 1,071Derivative-related assets 25 3,168 – 3,193
$ 25 $ 5,007 $ – $ 5,032
Investments representing financial assets at FVTPL $ 27,154 $ 46,412 $ 57,947 $ 131,513
Investment-related liabilitiesAmounts payable from pending trades $ – $ (576) $ – $ (576)Interest payable – (27) – (27)Securities sold short (2,207) (454) – (2,661)Securities sold under repurchase agreements – (1,438) – (1,438)Derivative-related liabilities (25) (1,134) – (1,159)
Investment-related liabilities representing financial liabilities at FVTPL $ (2,232) $ (3,629) $ – $ (5,861)
BorrowingsCapital market debt financing $ – $ (8,851) $ – $ (8,851)
Borrowings representing financial liabilities designated at FVTPL $ – $ (8,851) $ – $ (8,851)
Net investments $ 24,922 $ 33,932 $ 57,947 $ 116,801
PUBLIC SECTOR PENSION INVESTMENT BOARD | ANNUAL REPORT 2017 101

PUBLIC SECTOR PENSION INVESTMENT BOARDNotes to the Consolidated Financial Statements for the years ended March 31, 2017 and 2016
4 FINANCIAL ASSETS AND FINANCIAL LIABILITIES (continued)
4.2. FAIR VALUE HIERARCHY (continued)
4.2.2. Process for Level 3 Fair Value Determination
The valuation process is monitored and governed by an internal valuation committee (“VC”). This committee is responsible for overseeing all aspects of fair value determination. This includes establishing valuation methodologies and procedures for each type of investment and ensuring they are complied with. Valuation methodologies established are based on widely recognized practices that are consistent with professional appraisal standards. Such standards include, among others, the International Private Equity and Venture Capital Valuation Guidelines, the Canadian Uniform Standards of Professional Appraisal Practice and the Uniform Standards of Professional Appraisal Practice in the United States of America.
The fair value of investments classified as Level 3 is determined at least annually. Quarterly, the fair value is reviewed and adjusted, as appropriate, to reflect the impact of any significant market or investment-specific events or circumstances. For each investment, the relevant valuation methodology is applied consistently over time as appropriate in the prevailing circumstances. The appropriateness of significant changes in valuation methodologies is reviewed by the VC.
In cases where the services of third-party appraisers are used, management ensures their independence and that valuation methods used are consistent with professional appraisal standards outlined above. In validating the work performed by appraisers, management ensures that the assumptions used correspond to financial information and forecasts of the underlying investment.
With respect to fund investments classified as Level 3, the annual fair value is generally determined based on audited financial statements received from the fund’s general partner. In certain cases fair value is obtained from information provided by the fund’s administrators and is reviewed by Management to ensure reasonableness and adherence to acceptable industry valuation methods. Where necessary, the impact of restrictions on the sale or redemption of such investments is taken into consideration in determining fair value.
ANNUAL REPORT 2017 | PUBLIC SECTOR PENSION INVESTMENT BOARD102
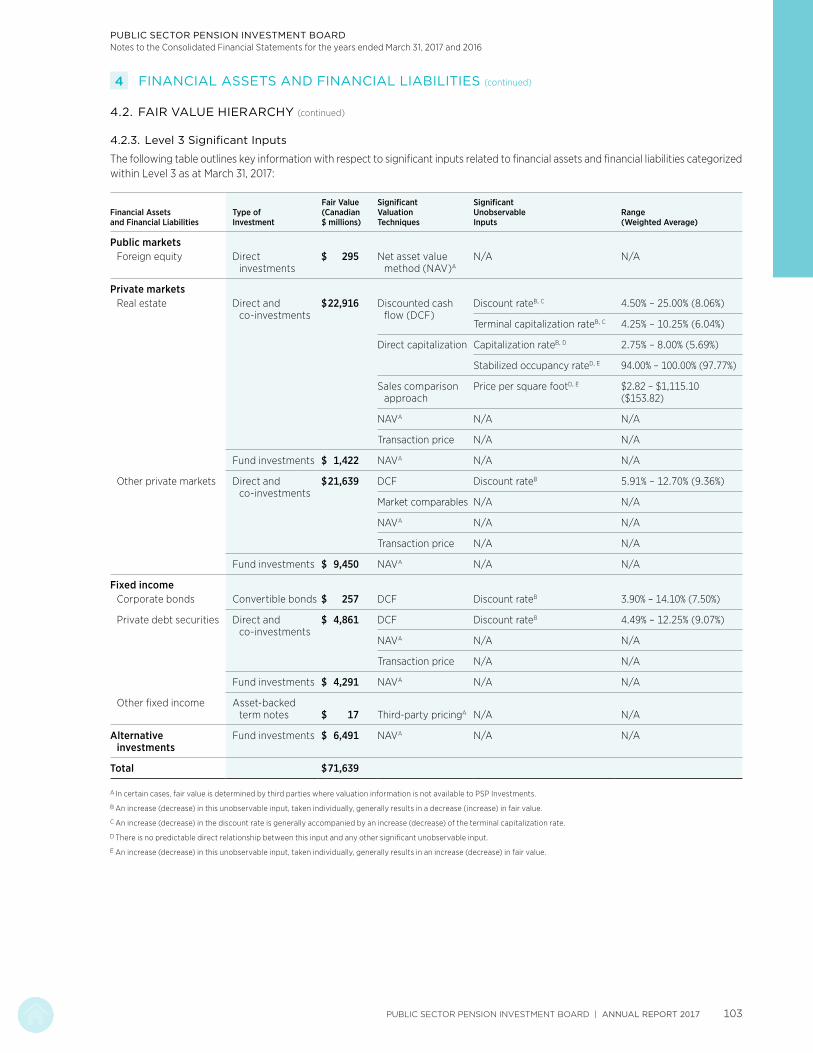
PUBLIC SECTOR PENSION INVESTMENT BOARDNotes to the Consolidated Financial Statements for the years ended March 31, 2017 and 2016
4 FINANCIAL ASSETS AND FINANCIAL LIABILITIES (continued)
4.2. FAIR VALUE HIERARCHY (continued)
4.2.3. Level 3 Significant Inputs
The following table outlines key information with respect to significant inputs related to financial assets and financial liabilities categorized within Level 3 as at March 31, 2017:
Financial Assets and Financial Liabilities
Type of Investment
Fair Value (Canadian $ millions)
Significant Valuation Techniques
Significant Unobservable Inputs
Range (Weighted Average)
Public marketsForeign equity Direct
investments$ 295 Net asset value
method (NAV)AN/A N/A
Private marketsReal estate Direct and
co-investments$22,916 Discounted cash
flow (DCF)Discount rateB, C 4.50% – 25.00% (8.06%)
Terminal capitalization rateB, C 4.25% – 10.25% (6.04%)
Direct capitalization Capitalization rateB, D 2.75% – 8.00% (5.69%)
Stabilized occupancy rateD, E 94.00% – 100.00% (97.77%)
Sales comparison approach
Price per square footD, E $2.82 – $1,115.10 ($153.82)
NAVA N/A N/A
Transaction price N/A N/A
Fund investments $ 1,422 NAVA N/A N/A
Other private markets Direct and co-investments
$21,639 DCF Discount rateB 5.91% – 12.70% (9.36%)
Market comparables N/A N/A
NAVA N/A N/A
Transaction price N/A N/A
Fund investments $ 9,450 NAVA N/A N/A
Fixed incomeCorporate bonds Convertible bonds $ 257 DCF Discount rateB 3.90% – 14.10% (7.50%)
Private debt securities Direct and co-investments
$ 4,861 DCF Discount rateB 4.49% – 12.25% (9.07%)
NAVA N/A N/A
Transaction price N/A N/A
Fund investments $ 4,291 NAVA N/A N/A
Other fixed income Asset-backed term notes $ 17 Third-party pricingA N/A N/A
Alternative investments
Fund investments $ 6,491 NAVA N/A N/A
Total $71,639
A In certain cases, fair value is determined by third parties where valuation information is not available to PSP Investments.
B An increase (decrease) in this unobservable input, taken individually, generally results in a decrease (increase) in fair value.
C An increase (decrease) in the discount rate is generally accompanied by an increase (decrease) of the terminal capitalization rate.
D There is no predictable direct relationship between this input and any other significant unobservable input.
E An increase (decrease) in this unobservable input, taken individually, generally results in an increase (decrease) in fair value.
PUBLIC SECTOR PENSION INVESTMENT BOARD | ANNUAL REPORT 2017 103

PUBLIC SECTOR PENSION INVESTMENT BOARDNotes to the Consolidated Financial Statements for the years ended March 31, 2017 and 2016
4 FINANCIAL ASSETS AND FINANCIAL LIABILITIES (continued)
4.2. FAIR VALUE HIERARCHY (continued)
4.2.3. Level 3 Significant Inputs (continued)
The following table outlines key information with respect to significant inputs related to financial assets and financial liabilities categorized within Level 3 as at March 31, 2016:
Financial Assets and Financial Liabilities
Type of Investment
Fair Value (Canadian $ millions)
Significant Valuation Techniques
Significant Unobservable Inputs
Range (Weighted Average)
Private marketsReal estate Direct and
co-investments$21,034 DCF Discount rateB, C 5.25% – 25.00% (8.27%)
Terminal capitalization rateB, C 4.25% – 14.00% (6.29%)
Direct capitalization Capitalization rateB, D 3.25% – 7.50% (5.91%)
Stabilized occupancy rateD, E 93.00% – 100.00% (96.84%)
Sales comparison approach
Price per square footD, E $25.00 – $665.89 ($170.43)
NAVA N/A N/A
Transaction price N/A N/A
Fund investments $ 1,444 NAVA N/A N/A
Other private markets Direct and co-investments
$16,079 DCF Discount rateB 5.20% – 12.50% (9.70%)
Market comparables N/A N/A
NAVA N/A N/A
Transaction price N/A N/A
Fund investments $ 7,705 NAVA N/A N/A
Fixed incomeCorporate bonds Convertible bonds $ 283 DCF Discount rateB 3.70% – 13.50% (6.30%)
Private debt securities Direct and co-investments
$ 1,813 DCF Discount rateB 8.00% – 13.50% (11.09%)
NAVA N/A N/A
Transaction price N/A N/A
Fund investments $ 3,489 NAVA N/A N/A
Other fixed income Asset-backed term notes
$ 702 Third-party pricingA N/A N/A
Alternative investments
Fund investments $ 5,398 NAVA N/A N/A
Total $57,947
A In certain cases, fair value is determined by third parties where valuation information is not available to PSP Investments.
B An increase (decrease) in this unobservable input, taken individually, generally results in a decrease (increase) in fair value.
C An increase (decrease) in the discount rate is generally accompanied by an increase (decrease) of the terminal capitalization rate.
D There is no predictable direct relationship between this input and any other significant unobservable input.
E An increase (decrease) in this unobservable input, taken individually, generally results in an increase (decrease) in fair value.
ANNUAL REPORT 2017 | PUBLIC SECTOR PENSION INVESTMENT BOARD104
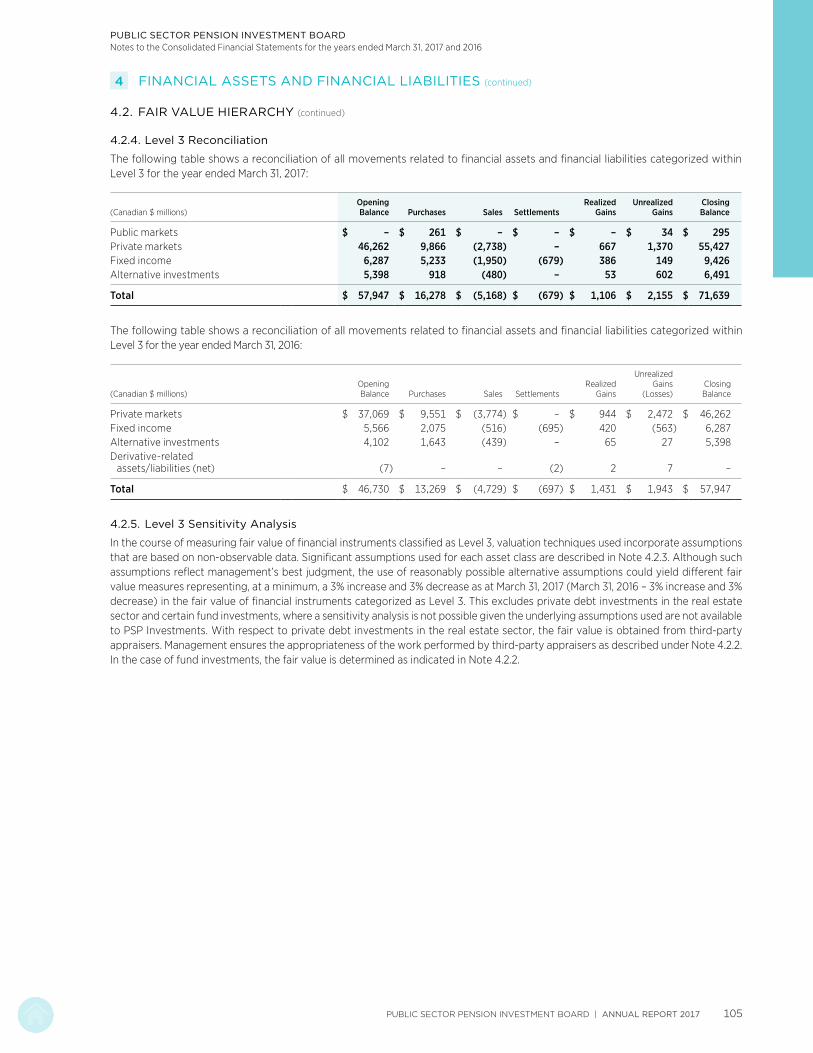
PUBLIC SECTOR PENSION INVESTMENT BOARDNotes to the Consolidated Financial Statements for the years ended March 31, 2017 and 2016
4 FINANCIAL ASSETS AND FINANCIAL LIABILITIES (continued)
4.2. FAIR VALUE HIERARCHY (continued)
4.2.4. Level 3 Reconciliation
The following table shows a reconciliation of all movements related to financial assets and financial liabilities categorized within Level 3 for the year ended March 31, 2017:
(Canadian $ millions)Opening Balance Purchases Sales Settlements
Realized Gains
Unrealized Gains
Closing Balance
Public markets $ – $ 261 $ – $ – $ – $ 34 $ 295Private markets 46,262 9,866 (2,738) – 667 1,370 55,427Fixed income 6,287 5,233 (1,950) (679) 386 149 9,426Alternative investments 5,398 918 (480) – 53 602 6,491
Total $ 57,947 $ 16,278 $ (5,168) $ (679) $ 1,106 $ 2,155 $ 71,639
The following table shows a reconciliation of all movements related to financial assets and financial liabilities categorized within Level 3 for the year ended March 31, 2016:
(Canadian $ millions)Opening Balance Purchases Sales Settlements
Realized Gains
Unrealized Gains
(Losses)Closing Balance
Private markets $ 37,069 $ 9,551 $ (3,774) $ – $ 944 $ 2,472 $ 46,262Fixed income 5,566 2,075 (516) (695) 420 (563) 6,287Alternative investments 4,102 1,643 (439) – 65 27 5,398Derivative-related
assets/liabilities (net) (7) – – (2) 2 7 –
Total $ 46,730 $ 13,269 $ (4,729) $ (697) $ 1,431 $ 1,943 $ 57,947
4.2.5. Level 3 Sensitivity Analysis
In the course of measuring fair value of financial instruments classified as Level 3, valuation techniques used incorporate assumptions that are based on non-observable data. Significant assumptions used for each asset class are described in Note 4.2.3. Although such assumptions reflect management’s best judgment, the use of reasonably possible alternative assumptions could yield different fair value measures representing, at a minimum, a 3% increase and 3% decrease as at March 31, 2017 (March 31, 2016 – 3% increase and 3% decrease) in the fair value of financial instruments categorized as Level 3. This excludes private debt investments in the real estate sector and certain fund investments, where a sensitivity analysis is not possible given the underlying assumptions used are not available to PSP Investments. With respect to private debt investments in the real estate sector, the fair value is obtained from third-party appraisers. Management ensures the appropriateness of the work performed by third-party appraisers as described under Note 4.2.2. In the case of fund investments, the fair value is determined as indicated in Note 4.2.2.
PUBLIC SECTOR PENSION INVESTMENT BOARD | ANNUAL REPORT 2017 105

PUBLIC SECTOR PENSION INVESTMENT BOARDNotes to the Consolidated Financial Statements for the years ended March 31, 2017 and 2016
5 COLLATERAL PLEDGED AND RECEIVED
PSP Investments is party to agreements that involve pledging and holding collateral, as outlined in Notes 2.3.5, 2.3.6 and 7.2.1. The following table illustrates the fair values of such collateral, as well as the securities under the lending and borrowing programs and the securities under the repurchase and reverse repurchase agreements, as at:
(Canadian $ millions) March 31, 2017 March 31, 2016
Securities lending and borrowingSecurities lent $ 13,241 $ 9,163Collateral heldA 14,103 9,782Securities borrowed 2,882 2,290Collateral pledgedB 3,021 2,405
Securities repurchase and reverse repurchase agreements Securities sold under repurchase agreements 1,110 1,443Collateral pledged 1,109 1,438Securities purchased under reverse repurchase agreements 2,661 1,071Collateral heldC 2,655 1,071
Derivative contracts Collateral pledged 309 287Collateral heldD 228 2,181
A The minimum fair value of cash collateral required is equal to 102% of the fair value of the securities lent, and in the case of securities collateral 105%. As part of collateral held, cash amounted to $5,080 million as at March 31, 2017 (March 31, 2016 – $2,083 million) and securities amounted to $9,023 million as at March 31, 2017 (March 31, 2016 – $7,699 million). All cash collateral is reinvested.
B The minimum fair value of collateral required is equal to 100% of the fair value of the securities borrowed.
C The collateral received is in the form of securities of which $1,355 million has been used in connection with short selling transactions as at March 31, 2017 (March 31, 2016 – $453 million) and $207 million has been used in connection with securities sold under repurchase agreements (March 31, 2016 – nil).
D As part of collateral held, cash amounted to $10 million as at March 31, 2017 (March 31, 2016 – nil) and securities amounted to $218 million as at March 31, 2017 (March 31, 2016 – $2,181 million). All cash collateral is reinvested.
ANNUAL REPORT 2017 | PUBLIC SECTOR PENSION INVESTMENT BOARD106
PUBLIC SECTOR PENSION INVESTMENT BOARDNotes to the Consolidated Financial Statements for the years ended March 31, 2017 and 2016
6 INTERESTS IN OTHER ENTITIES
6.1. SUBSIDIARIES, JOINT VENTURES AND ASSOCIATES
As an investment entity, PSP Investments does not consolidate its subsidiaries other than those that solely provide it with services that relate to its investment activities. PSP Investments measures its investments in its subsidiaries, joint ventures and associates at FVTPL as described in Note 2.1.
For purposes of preparing this note, management assesses control, joint control and significant influence as follows:
(i) Control and significant influence
PSP Investments determines that it has control over an investee when it is exposed, or has rights, to variable returns from its investment in an entity and has the ability to affect those returns through its power over the investee.
In certain cases, PSP Investments does not have control over an investee but has the power to participate in the financial and operating policy decisions of the investee. In such cases, PSP Investments determines that it has significant influence over the investee.
In the context of control or significant influence, power over an investee is obtained through voting rights conveyed by PSP Investments’ ownership interest, other contractual arrangements, or a combination thereof.
(ii) Joint control
PSP Investments determines that it is party to a joint venture arrangement when it has joint control over an investee and has rights to the net assets of the investee. Joint control is established through a contractual arrangement which requires the unanimous consent of the parties sharing control for the activities that significantly affect the returns of the arrangement.
Generally, decision making regarding such activities is governed through voting rights conveyed by the ownership interest of each party. In certain cases, it is governed solely through contractual arrangements or in conjunction with the ownership interest of each party.
In the normal course of business, investments in private markets are commonly held through investment entity subsidiaries formed by PSP Investments. As at March 31, 2017, 103 investment entity subsidiaries were incorporated in North America, 23 in Europe, 10 in Oceania, 4 in Central and South America, 1 in Africa and 1 in Asia (March 31, 2016 – 102 in North America, 19 in Europe, 10 in Oceania, 4 in Central and South America and 1 in Africa).
In addition, PSP Investments controlled 77 investees directly or through its investment entity subsidiaries as at March 31, 2017 (March 31, 2016 – 73 investees).
PUBLIC SECTOR PENSION INVESTMENT BOARD | ANNUAL REPORT 2017 107
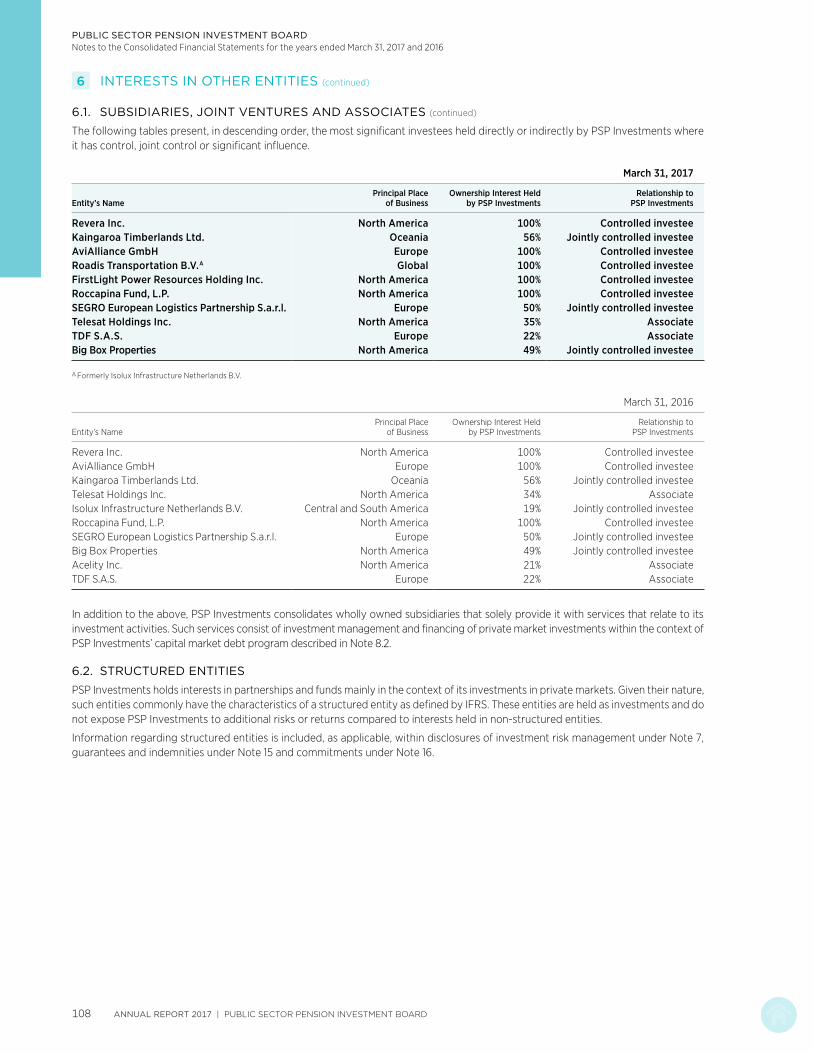
PUBLIC SECTOR PENSION INVESTMENT BOARDNotes to the Consolidated Financial Statements for the years ended March 31, 2017 and 2016
6 INTERESTS IN OTHER ENTITIES (continued)
6.1. SUBSIDIARIES, JOINT VENTURES AND ASSOCIATES (continued)
The following tables present, in descending order, the most significant investees held directly or indirectly by PSP Investments where it has control, joint control or significant influence.
March 31, 2017
Entity’s NamePrincipal Place
of BusinessOwnership Interest Held
by PSP InvestmentsRelationship to
PSP Investments
Revera Inc. North America 100% Controlled investeeKaingaroa Timberlands Ltd. Oceania 56% Jointly controlled investeeAviAlliance GmbH Europe 100% Controlled investeeRoadis Transportation B.V.A Global 100% Controlled investeeFirstLight Power Resources Holding Inc. North America 100% Controlled investeeRoccapina Fund, L.P. North America 100% Controlled investeeSEGRO European Logistics Partnership S.a.r.l. Europe 50% Jointly controlled investeeTelesat Holdings Inc. North America 35% AssociateTDF S.A.S. Europe 22% AssociateBig Box Properties North America 49% Jointly controlled investee
A Formerly Isolux Infrastructure Netherlands B.V.
March 31, 2016
Entity’s NamePrincipal Place
of BusinessOwnership Interest Held
by PSP InvestmentsRelationship to
PSP Investments
Revera Inc. North America 100% Controlled investeeAviAlliance GmbH Europe 100% Controlled investeeKaingaroa Timberlands Ltd. Oceania 56% Jointly controlled investeeTelesat Holdings Inc. North America 34% AssociateIsolux Infrastructure Netherlands B.V. Central and South America 19% Jointly controlled investeeRoccapina Fund, L.P. North America 100% Controlled investeeSEGRO European Logistics Partnership S.a.r.l. Europe 50% Jointly controlled investeeBig Box Properties North America 49% Jointly controlled investeeAcelity Inc. North America 21% AssociateTDF S.A.S. Europe 22% Associate
In addition to the above, PSP Investments consolidates wholly owned subsidiaries that solely provide it with services that relate to its investment activities. Such services consist of investment management and financing of private market investments within the context of PSP Investments’ capital market debt program described in Note 8.2.
6.2. STRUCTURED ENTITIES
PSP Investments holds interests in partnerships and funds mainly in the context of its investments in private markets. Given their nature, such entities commonly have the characteristics of a structured entity as defined by IFRS. These entities are held as investments and do not expose PSP Investments to additional risks or returns compared to interests held in non-structured entities.
Information regarding structured entities is included, as applicable, within disclosures of investment risk management under Note 7, guarantees and indemnities under Note 15 and commitments under Note 16.
ANNUAL REPORT 2017 | PUBLIC SECTOR PENSION INVESTMENT BOARD108

PUBLIC SECTOR PENSION INVESTMENT BOARDNotes to the Consolidated Financial Statements for the years ended March 31, 2017 and 2016
7 INVESTMENT RISK MANAGEMENT
PSP Investments is required to act in the best interests of the contributors and beneficiaries under the Plans and for maximizing returns without undue risk of loss. In pursuit of this objective, PSP Investments established an Enterprise Risk Management Policy (ERM Policy). The ERM Policy provides a framework for identifying, evaluating, managing, mitigating, monitoring and reporting the investment and non-investment risks to which PSP Investments is exposed.
As part of the overall ERM policy, the Investment Risk Management Policy (IRM Policy) supports the management of risk inherent to the investment decision making process. The IRM Policy outlines a framework that is designed to ensure that investment activities respect PSP Investments’ risk philosophy and align with the tolerance and limits of its risk appetite. The IRM Policy also supplements the Statement of Investment Policies, Standards and Procedures (SIP&P), whose objective is to effectively manage investment risks related to the implementation of PSP Investments’ various investment strategies. Investment risks include market, credit and liquidity risks.
7.1. MARKET RISK
Market risk is the risk that the value of an investment will fluctuate as a result of an adverse financial outcome due to changes in the factors that drive that value, such as changes in market prices, changes caused by factors specific to the individual investment, volatility in share and commodity prices, interest rate, foreign exchange or other factors affecting similar securities traded in the market.
7.1.1. Measurement of Market Risk
Effective April 1, 2016, the absolute annualized volatility of the total portfolio was implemented as the primary measure of market risk. The absolute volatility is a statistical measure of the size of changes in investment returns of a given investment or portfolio of investments. It is used to illustrate the potential loss of value in an investment or portfolio of investments as a result of fluctuations in market prices. Prior to April 1, 2016, PSP Investments used the Value at Risk (VaR) as the primary measure of market risk.
PSP Investments uses seven years’ worth of market returns scaled to a twelve-month holding period to calculate the absolute volatility. For investments that are not actively traded, the calculation of the absolute volatility uses securities with similar risk attributes as a proxy.
The absolute volatility is statistically valid under normal market conditions and does not specifically consider losses from severe market events. It also assumes that the future will behave in a pattern similar to the past. Consequently, if future market conditions differ significantly from those of the past, potential losses may differ from those originally estimated.
The following table shows the absolute volatility of the total portfolio expressed as a percentage of net investments as at the end of the period:
March 31, 2017 March 31, 2016
Absolute volatility 7.6% 8.5%A
A Since the absolute volatility was used effective April 1, 2016, the market risk measure as at March 31, 2016 was changed in the above table for comparability purposes. Prior to April 1, 2016, PSP Investments used the VaR as the primary measure of market risk. The total portfolio VaR as at March 31, 2016 was 23.6%.
Stress Testing
Although the absolute volatility is a widely accepted risk measure, it is complemented by other risk measurement methodologies that provide greater insight on market risk. PSP Investments uses stress testing and scenario analysis to examine the impact on financial results of abnormally large movements in risk factors. Such techniques are used to test a portfolio’s sensitivity to various risk factors and key model assumptions. These methods also use historically stressed periods to evaluate how a current portfolio reacts under such circumstances. Stress testing and scenario analysis are also deployed to assess new product performance.
PUBLIC SECTOR PENSION INVESTMENT BOARD | ANNUAL REPORT 2017 109

PUBLIC SECTOR PENSION INVESTMENT BOARDNotes to the Consolidated Financial Statements for the years ended March 31, 2017 and 2016
7 INVESTMENT RISK MANAGEMENT (continued)
7.1. MARKET RISK (continued)
7.1.2. Interest Rate Risk
Interest rate risk refers to the risk that fluctuations in interest rates will directly affect the fair value of PSP Investments’ net asset values.
The terms to maturity of the classes of financial instruments, outlined in Note 4.1, with the most significant exposure to interest rate risk were as follows as at:
March 31, 2017
(Canadian $ millions)Less than
1 Year1 to 5 Years
5 to 10 Years
Over 10 Years Other Total
Cash and money market securities $ – $ – $ – $ – $ 12,369A $ 12,369Government and corporate bonds 2,443 9,430 6,093 3,828 – 21,794Inflation-linked bonds 4 1,813 2,866 3,041 – 7,724Private debt securities 79 894 3,553 – 4,626B 9,152Other fixed income securities 17 21 – – 3,279C 3,317
Total fixed income $ 2,543 $ 12,158 $ 12,512 $ 6,869 $ 20,274 $ 54,356
March 31, 2016
(Canadian $ millions)Less than
1 Year1 to 5 Years
5 to 10 Years
Over 10 Years Other Total
Cash and money market securities $ – $ – $ – $ – $ 5,917A $ 5,917Government and corporate bonds 1,106 9,721 4,988 4,128 – 19,943Inflation-linked bonds 24 1,650 2,465 3,266 – 7,405Private debt securities 5 1,213 308 – 3,776B 5,302Other fixed income securities 727 201 1 – 1,708C 2,637
Total fixed income $ 1,862 $ 12,785 $ 7,762 $ 7,394 $ 11,401 $ 41,204
A Due to their nature, these investments are not significantly exposed to interest rate risk.
B Information in connection with the terms to maturity of fund and certain directly held investments included as part of private debt securities is not available.
C Certain corporate bonds, asset-backed securities and floating rate notes are not significantly exposed to interest rate risk as their prescribed rates are variable.
The terms to maturity of PSP Investments’ capital market debt financing are disclosed in Note 8.2.
Alternative investments, reverse repurchase agreements, as well as derivative contracts described in Notes 4.1.4, 4.1.9 and 4.1.11, respectively, are also subject to interest rate risk exposures. These exposures are reflected in the absolute volatility calculation described in Note 7.1.1.
ANNUAL REPORT 2017 | PUBLIC SECTOR PENSION INVESTMENT BOARD110

PUBLIC SECTOR PENSION INVESTMENT BOARDNotes to the Consolidated Financial Statements for the years ended March 31, 2017 and 2016
7 INVESTMENT RISK MANAGEMENT (continued)
7.1. MARKET RISK (continued)
7.1.3. Foreign Currency Risk
PSP Investments is exposed to currency risk through holding of investments (i.e. direct and indirect holdings of securities, units in pooled funds and units in limited partnerships) or investment-related liabilities in various currencies. Fluctuations in the relative value of the Canadian dollar against these foreign currencies can result in a positive or a negative effect on the fair value of the investments. To mitigate this risk, PSP Investments may take, through foreign forward contracts or cross currency swaps, positions in foreign currencies.
The underlying foreign currency exposures of net investments were as follows as at:
Currency March 31, 2017 March 31, 2016
(Canadian $ millions) Fair Value % of Total Fair Value % of Total
US Dollar $ 63,698 70.5% $ 30,325 60.3%Euro 5,677 6.3 3,581 7.1Japanese Yen 3,301 3.6 1,701 3.4British Pound 2,781 3.1 2,056 4.1South Korean Won 2,394 2.6 2,146 4.3Brazilian Real 2,040 2.3 1,555 3.1Indian Rupee 1,234 1.4 996 2.0Hong Kong Dollar 1,194 1.3 1,798 3.6Australian Dollar 1,167 1.3 623 1.2Taiwanese New Dollar 996 1.1 909 1.8Swiss Franc 930 1.0 993 2.0Mexican Peso 791 0.9 648 1.3Others 4,196 4.6 2,927 5.8
Total $ 90,399 100.0% $ 50,258 100.0%
As at March 31, 2017, PSP Investments and its investment entity subsidiaries also had commitments, denominated in foreign currencies of $20,185 million (US$12,532 million, €2,088 million, £190 million, 22 million South African rands, 58 million Brazilian reals, 13,553 million Colombian pesos, 232 million Mexican pesos and 126 million Australian dollars) which were not included in the foreign currency exposure table above.
As at March 31, 2016, PSP Investments and its investment entity subsidiaries also had commitments, denominated in foreign currencies of $19,799 million (US$13,901 million, €919 million, £204 million, 182 million South African rands, 83 million Brazilian reals, 19,415 million Colombian pesos and 391 million Mexican pesos) which were not included in the foreign currency exposure table above.
PUBLIC SECTOR PENSION INVESTMENT BOARD | ANNUAL REPORT 2017 111

PUBLIC SECTOR PENSION INVESTMENT BOARDNotes to the Consolidated Financial Statements for the years ended March 31, 2017 and 2016
7 INVESTMENT RISK MANAGEMENT (continued)
7.2. CREDIT RISK
PSP Investments is exposed to credit risk, which is the risk of non-performance of a debtor on whom PSP Investments relies to fulfill contractual or financial obligations. That is, the risk that the issuer of a debt security or that the counterparty to a derivative contract, to a securities lending and borrowing transaction or to securities purchased under reverse repurchase agreements, is unable to meet its financial obligations.
Credit risk encompasses the risk of a deterioration of creditworthiness and the relevant concentration risk. Credit risk monitoring entails an evaluation of the credit quality of each issuer and counterparty that transacts with PSP Investments. To perform this evaluation for public issuers and counterparties, PSP Investments relies on four recognized credit rating agencies. A minimum of two credit ratings are used to classify each security. If the agencies disagree as to a security’s credit quality, PSP Investments uses the lowest of the available ratings. For private issuers, PSP Investments assigns internal credit ratings to issuers and measures the combined risk profile against set targets. To assign risk ratings to issuers, PSP Investments uses methodologies comparable to those used by recognized rating agencies.
As at March 31, 2017, PSP Investments’ maximum exposure to credit risk amounted to $55 billion (March 31, 2016 – $44 billion). This amount is presented before collateral held and netting arrangements that do not qualify for offsetting under IFRS. The maximum credit exposure excludes guarantees disclosed in Note 15 as well as investments in funds classified as alternative investments in note 4.1. Such funds hold fixed income securities among other types of instruments.
To monitor the evolution of credit risk, PSP Investments periodically produces a concentration report by credit rating for credit-sensitive securities. The concentration of credit risk by credit rating was as follows as at March 31:
Credit Rating 2017 2016
AAA-AA 54.2% 50.7%A 20.0 27.9BBB 4.5 9.1BB or below 19.9 10.5No ratingA 1.4 1.8
Total 100.0% 100.0%
A Includes securities for public issuers and counterparties, that are either not rated by credit rating agencies or rated by a single credit rating agency. ABTNs are rated by a single agency and are classified according to their rating within the table.
ANNUAL REPORT 2017 | PUBLIC SECTOR PENSION INVESTMENT BOARD112

PUBLIC SECTOR PENSION INVESTMENT BOARDNotes to the Consolidated Financial Statements for the years ended March 31, 2017 and 2016
7 INVESTMENT RISK MANAGEMENT (continued)
7.2. CREDIT RISK (continued)
7.2.1. Counterparty Risk
Counterparty risk represents the credit risk from current and potential exposure related to transactions involving derivative contracts, securities lending and borrowing as well as securities repurchase and reverse repurchase agreements. In order to minimize counterparty risk, PSP Investments requires that counterparties provide adequate collateral and meet its credit rating requirements. PSP Investments frequently monitors the credit rating of its counterparties as determined by recognized credit rating agencies. With respect to derivative contracts, PSP Investments has the ability to terminate all trades with most counterparties whose credit rating is downgraded below its requirements.
For OTC derivatives, PSP Investments’ policy also requires the use of the International Swaps and Derivative Association (ISDA) Master Agreement with all counterparties to derivative contracts. The ISDA Master Agreement provides the contractual framework within which dealing activities across a full range of OTC products are conducted. In the case of OTC-cleared derivatives, trading activities are regulated between parties under terms that are customary to such transactions.
As a credit mitigation technique, the ISDA Master Agreement contractually binds counterparties to close-out netting provisions in the case of default by one of the counterparties. Additionally, the Credit Support Annex (CSA) to the ISDA Master Agreement enables PSP Investments to realize any collateral placed with it in the case of default of the counterparty. The CSA also requires PSP Investments to contribute further collateral when requested. All collateral transactions under the CSA are in cash, high-quality debt instruments or securities. The CSA also regulates the exchange of collateral when the credit exposure to a counterparty exceeds a predetermined threshold. Counterparties are generally authorized to sell, repledge or otherwise use collateral held. Similarly, in the case of OTC-cleared derivatives, collateral is required in cash, high quality debt instruments or securities and can be sold, repledged or otherwise used. PSP Investments does not sell, repledge or otherwise use any collateral held in the form of securities but does reinvest all cash collateral, with respect to derivative contracts.
With respect to transactions involving securities lending and borrowing agreements as well as securities repurchase and reverse repurchase agreements, collateral requirements are in place to mitigate counterparty risk. Notes 2.3.5 and 2.3.6 describe collateral requirements in securities lending and borrowing programs as well as securities repurchase and reverse repurchase agreements.
Information in connection with collateral pledged by PSP Investments and its counterparties is disclosed in Note 5.
In the case of the securities lending program, PSP Investments’ exposure to counterparty risk is further mitigated as the custodian of the securities lent assumes the risk that a counterparty will be unable to meet its obligations associated with the collateral requirements.
Management is responsible for counterparty risk monitoring and mitigation as well as maintaining a comprehensive, disciplined, and enterprise-wide process for tracking and managing counterparty risk. As such, management measures counterparty risk on an ongoing basis, evaluates and tracks the creditworthiness of current counterparties and mitigates counterparty risk through collateral management.
PUBLIC SECTOR PENSION INVESTMENT BOARD | ANNUAL REPORT 2017 113
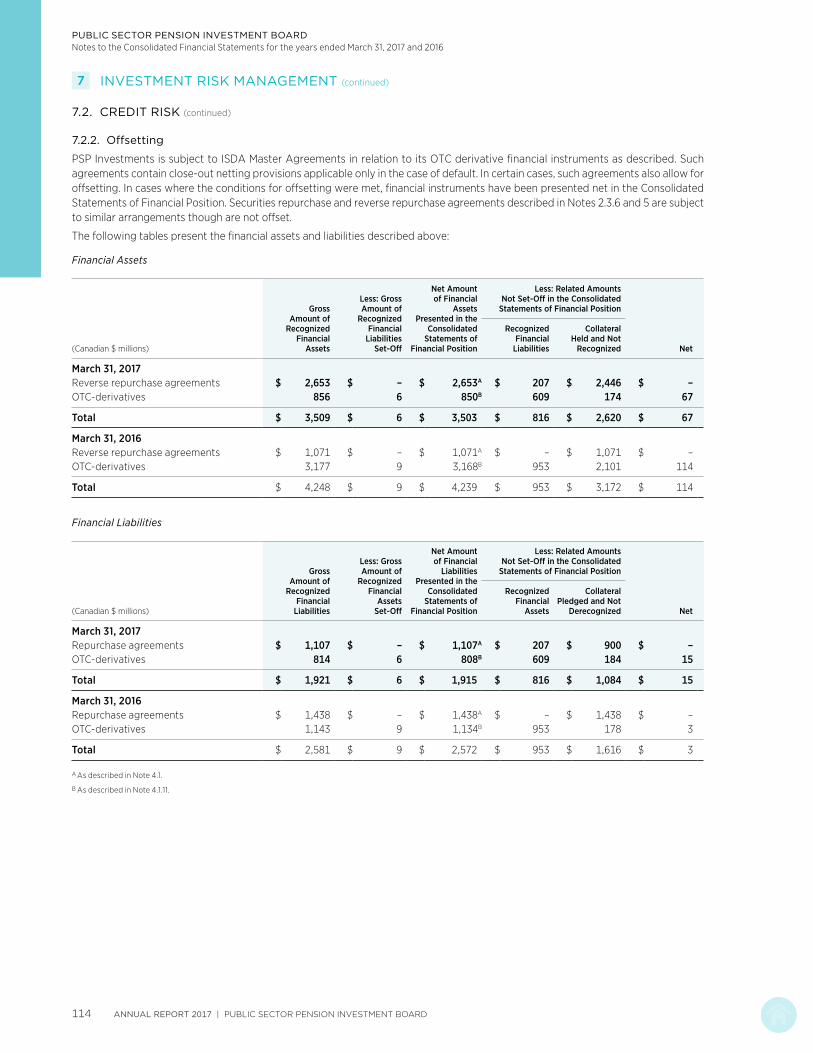
PUBLIC SECTOR PENSION INVESTMENT BOARDNotes to the Consolidated Financial Statements for the years ended March 31, 2017 and 2016
7 INVESTMENT RISK MANAGEMENT (continued)
7.2. CREDIT RISK (continued)
7.2.2. Offsetting
PSP Investments is subject to ISDA Master Agreements in relation to its OTC derivative financial instruments as described. Such agreements contain close-out netting provisions applicable only in the case of default. In certain cases, such agreements also allow for offsetting. In cases where the conditions for offsetting were met, financial instruments have been presented net in the Consolidated Statements of Financial Position. Securities repurchase and reverse repurchase agreements described in Notes 2.3.6 and 5 are subject to similar arrangements though are not offset.
The following tables present the financial assets and liabilities described above:
Financial Assets
(Canadian $ millions)
Gross Amount of
Recognized Financial
Assets
Less: Gross Amount of
Recognized Financial
Liabilities Set-Off
Net Amount of Financial
Assets Presented in the
Consolidated Statements of
Financial Position
Less: Related Amounts Not Set-Off in the Consolidated
Statements of Financial Position
Net
Recognized Financial
Liabilities
Collateral Held and Not
Recognized
March 31, 2017Reverse repurchase agreements $ 2,653 $ – $ 2,653A $ 207 $ 2,446 $ –OTC-derivatives 856 6 850B 609 174 67
Total $ 3,509 $ 6 $ 3,503 $ 816 $ 2,620 $ 67
March 31, 2016Reverse repurchase agreements $ 1,071 $ – $ 1,071A $ – $ 1,071 $ –OTC-derivatives 3,177 9 3,168B 953 2,101 114
Total $ 4,248 $ 9 $ 4,239 $ 953 $ 3,172 $ 114
Financial Liabilities
(Canadian $ millions)
Gross Amount of
Recognized Financial
Liabilities
Less: Gross Amount of
Recognized Financial
Assets Set-Off
Net Amount of Financial
Liabilities Presented in the
Consolidated Statements of
Financial Position
Less: Related Amounts Not Set-Off in the Consolidated
Statements of Financial Position
Net
Recognized Financial
Assets
Collateral Pledged and Not
Derecognized
March 31, 2017Repurchase agreements $ 1,107 $ – $ 1,107A $ 207 $ 900 $ –OTC-derivatives 814 6 808B 609 184 15
Total $ 1,921 $ 6 $ 1,915 $ 816 $ 1,084 $ 15
March 31, 2016Repurchase agreements $ 1,438 $ – $ 1,438A $ – $ 1,438 $ –OTC-derivatives 1,143 9 1,134B 953 178 3
Total $ 2,581 $ 9 $ 2,572 $ 953 $ 1,616 $ 3
A As described in Note 4.1.
B As described in Note 4.1.11.
ANNUAL REPORT 2017 | PUBLIC SECTOR PENSION INVESTMENT BOARD114

PUBLIC SECTOR PENSION INVESTMENT BOARDNotes to the Consolidated Financial Statements for the years ended March 31, 2017 and 2016
7 INVESTMENT RISK MANAGEMENT (continued)
7.3. LIQUIDITY RISK
Liquidity risk corresponds to the risk that PSP Investments will not be able to meet its financial obligations on a timely basis, with sufficient and readily available cash resources. PSP Investments’ cash position is monitored on a daily basis. In general, investments in cash, money market securities, floating rate notes, bonds and public equities are expected to be highly liquid as they will be invested in securities that are actively traded. Management utilizes appropriate measures and controls to monitor liquidity risk in order to ensure that there is sufficient liquidity to meet financial obligations as they come due. A liquidity report taking into consideration future forecasted cash flows is prepared and presented to senior management on a weekly basis. This ensures that sufficient cash reserves are available to meet forecasted cash outflows. Additionally, sufficient sources of liquidity are maintained for deployment in case of market disruption.
PSP Investments has the ability to raise additional capital through the use of its capital market debt program. This program allows PSP Investments to issue short-term promissory notes and medium-term notes. Note 8.2 provides additional information on the usage of the capital market debt program. Furthermore, PSP Investments maintains credit facilities for general corporate purposes. Note 8.1 provides additional information with respect to such credit facilities.
The terms to maturity of the notional amount of derivatives are disclosed in Note 4.1.11.
Financial Liabilities
The following tables present the fair value of non-derivative-related financial liabilities as well as derivative-related financial instruments, aggregated according to their maturities as at March 31, 2017 and excluding the impact of guarantees and indemnities disclosed in Note 15:
(Canadian $ millions)Less than 3 Months
3 to 12 Months
Over 1 Year Total
Non-derivative-related financial liabilitiesA
Amounts payable from pending trades $ (1,076) $ – $ – $ (1,076)Interest payable (37) (2) – (39)Securities sold short and securities loaned (9,313) – – (9,313)Securities sold under repurchase agreements (1,107) – – (1,107)Capital market debt financing (5,771) (1,240) (3,796) (10,807)Trade payable and other liabilities (154) (2) (75) (231)
Total $ (17,458) $ (1,244) $ (3,871) $ (22,573)
(Canadian $ millions)Less than 3 Months
3 to 12 Months
Over 1 Year Total
Derivative-related financial instrumentsDerivative-related assets $ 236 $ 337 $ 322 $ 895Derivative-related liabilitiesA (392) (180) (266) (838)
Total $ (156) $ 157 $ 56 $ 57
A Liabilities are presented in the earliest period in which the counterparty can request payment.
PUBLIC SECTOR PENSION INVESTMENT BOARD | ANNUAL REPORT 2017 115

PUBLIC SECTOR PENSION INVESTMENT BOARDNotes to the Consolidated Financial Statements for the years ended March 31, 2017 and 2016
7 INVESTMENT RISK MANAGEMENT (continued)
7.3. LIQUIDITY RISK (continued)
Financial Liabilities (continued)
The following tables present the fair value of non-derivative-related financial liabilities as well as derivative-related financial instruments, aggregated according to their maturities as at March 31, 2016 and excluding the impact of guarantees and indemnities disclosed in Note 15:
(Canadian $ millions)Less than 3 Months
3 to 12 Months
Over 1 Year Total
Non-derivative-related financial liabilitiesA
Amounts payable from pending trades $ (576) $ – $ – $ (576)Interest payable (25) (2) – (27)Securities sold short (2,661) – – (2,661)Securities sold under repurchase agreements (1,438) – – (1,438)Capital market debt financing (5,211) (2,016) (1,624) (8,851)Trade payable and other liabilities (123) (2) (62) (187)
Total $ (10,034) $ (2,020) $ (1,686) $ (13,740)
(Canadian $ millions)Less than 3 Months
3 to 12 Months
Over 1 Year Total
Derivative-related financial instrumentsDerivative-related assets $ 1,861 $ 789 $ 543 $ 3,193Derivative-related liabilitiesA (314) (202) (643) (1,159)
Total $ 1,547 $ 587 $ (100) $ 2,034
A Liabilities are presented in the earliest period in which the counterparty can request payment.
ANNUAL REPORT 2017 | PUBLIC SECTOR PENSION INVESTMENT BOARD116
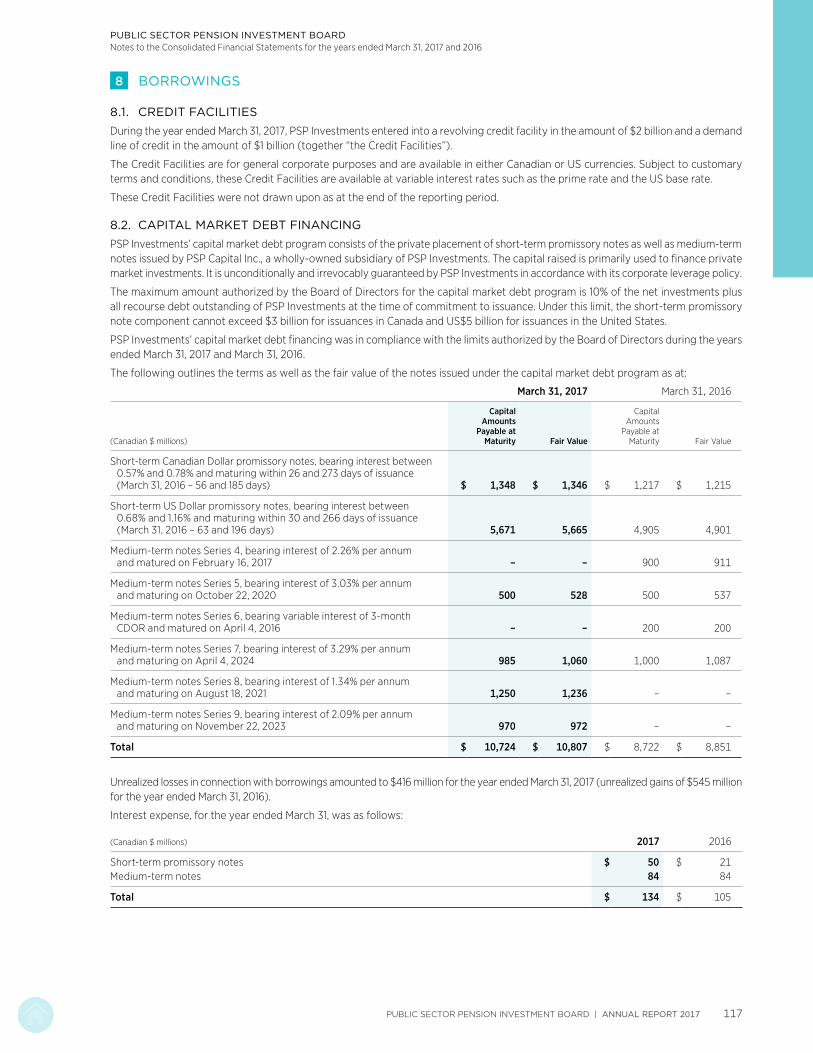
PUBLIC SECTOR PENSION INVESTMENT BOARDNotes to the Consolidated Financial Statements for the years ended March 31, 2017 and 2016
8 BORROWINGS
8.1. CREDIT FACILITIES
During the year ended March 31, 2017, PSP Investments entered into a revolving credit facility in the amount of $2 billion and a demand line of credit in the amount of $1 billion (together “the Credit Facilities”).
The Credit Facilities are for general corporate purposes and are available in either Canadian or US currencies. Subject to customary terms and conditions, these Credit Facilities are available at variable interest rates such as the prime rate and the US base rate.
These Credit Facilities were not drawn upon as at the end of the reporting period.
8.2. CAPITAL MARKET DEBT FINANCING
PSP Investments’ capital market debt program consists of the private placement of short-term promissory notes as well as medium-term notes issued by PSP Capital Inc., a wholly-owned subsidiary of PSP Investments. The capital raised is primarily used to finance private market investments. It is unconditionally and irrevocably guaranteed by PSP Investments in accordance with its corporate leverage policy.
The maximum amount authorized by the Board of Directors for the capital market debt program is 10% of the net investments plus all recourse debt outstanding of PSP Investments at the time of commitment to issuance. Under this limit, the short-term promissory note component cannot exceed $3 billion for issuances in Canada and US$5 billion for issuances in the United States.
PSP Investments’ capital market debt financing was in compliance with the limits authorized by the Board of Directors during the years ended March 31, 2017 and March 31, 2016.
The following outlines the terms as well as the fair value of the notes issued under the capital market debt program as at:
March 31, 2017 March 31, 2016
(Canadian $ millions)
Capital Amounts
Payable at Maturity Fair Value
Capital Amounts
Payable at Maturity Fair Value
Short-term Canadian Dollar promissory notes, bearing interest between 0.57% and 0.78% and maturing within 26 and 273 days of issuance (March 31, 2016 – 56 and 185 days) $ 1,348 $ 1,346 $ 1,217 $ 1,215
Short-term US Dollar promissory notes, bearing interest between 0.68% and 1.16% and maturing within 30 and 266 days of issuance (March 31, 2016 – 63 and 196 days) 5,671 5,665 4,905 4,901
Medium-term notes Series 4, bearing interest of 2.26% per annum and matured on February 16, 2017 – – 900 911
Medium-term notes Series 5, bearing interest of 3.03% per annum and maturing on October 22, 2020 500 528 500 537
Medium-term notes Series 6, bearing variable interest of 3-month CDOR and matured on April 4, 2016 – – 200 200
Medium-term notes Series 7, bearing interest of 3.29% per annum and maturing on April 4, 2024 985 1,060 1,000 1,087
Medium-term notes Series 8, bearing interest of 1.34% per annum and maturing on August 18, 2021 1,250 1,236 – –
Medium-term notes Series 9, bearing interest of 2.09% per annum and maturing on November 22, 2023 970 972 – –
Total $ 10,724 $ 10,807 $ 8,722 $ 8,851
Unrealized losses in connection with borrowings amounted to $416 million for the year ended March 31, 2017 (unrealized gains of $545 million for the year ended March 31, 2016).
Interest expense, for the year ended March 31, was as follows:
(Canadian $ millions) 2017 2016
Short-term promissory notes $ 50 $ 21Medium-term notes 84 84
Total $ 134 $ 105
PUBLIC SECTOR PENSION INVESTMENT BOARD | ANNUAL REPORT 2017 117
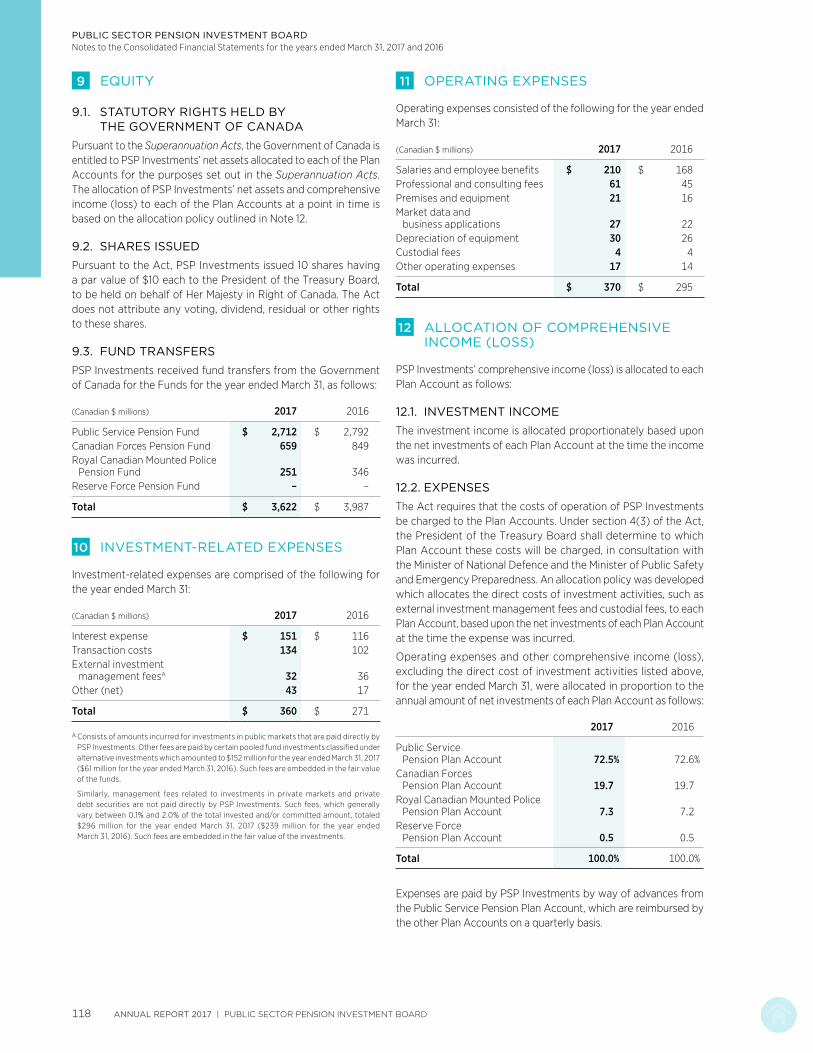
PUBLIC SECTOR PENSION INVESTMENT BOARDNotes to the Consolidated Financial Statements for the years ended March 31, 2017 and 2016
9 EQUITY
9.1. STATUTORY RIGHTS HELD BY THE GOVERNMENT OF CANADA
Pursuant to the Superannuation Acts, the Government of Canada is entitled to PSP Investments’ net assets allocated to each of the Plan Accounts for the purposes set out in the Superannuation Acts. The allocation of PSP Investments’ net assets and comprehensive income (loss) to each of the Plan Accounts at a point in time is based on the allocation policy outlined in Note 12.
9.2. SHARES ISSUED
Pursuant to the Act, PSP Investments issued 10 shares having a par value of $10 each to the President of the Treasury Board, to be held on behalf of Her Majesty in Right of Canada. The Act does not attribute any voting, dividend, residual or other rights to these shares.
9.3. FUND TRANSFERS
PSP Investments received fund transfers from the Government of Canada for the Funds for the year ended March 31, as follows:
(Canadian $ millions) 2017 2016
Public Service Pension Fund $ 2,712 $ 2,792Canadian Forces Pension Fund 659 849Royal Canadian Mounted Police
Pension Fund 251 346Reserve Force Pension Fund – –
Total $ 3,622 $ 3,987
10 INVESTMENT-RELATED EXPENSES
Investment-related expenses are comprised of the following for the year ended March 31:
(Canadian $ millions) 2017 2016
Interest expense $ 151 $ 116Transaction costs 134 102External investment
management feesA 32 36Other (net) 43 17
Total $ 360 $ 271
A Consists of amounts incurred for investments in public markets that are paid directly by PSP Investments. Other fees are paid by certain pooled fund investments classified under alternative investments which amounted to $152 million for the year ended March 31, 2017 ($61 million for the year ended March 31, 2016). Such fees are embedded in the fair value of the funds.
Similarly, management fees related to investments in private markets and private debt securities are not paid directly by PSP Investments. Such fees, which generally vary between 0.1% and 2.0% of the total invested and/or committed amount, totaled $296 million for the year ended March 31, 2017 ($239 million for the year ended March 31, 2016). Such fees are embedded in the fair value of the investments.
11 OPERATING EXPENSES
Operating expenses consisted of the following for the year ended March 31:
(Canadian $ millions) 2017 2016
Salaries and employee benefits $ 210 $ 168Professional and consulting fees 61 45Premises and equipment 21 16Market data and
business applications 27 22Depreciation of equipment 30 26Custodial fees 4 4Other operating expenses 17 14
Total $ 370 $ 295
12 ALLOCATION OF COMPREHENSIVE INCOME (LOSS)
PSP Investments’ comprehensive income (loss) is allocated to each Plan Account as follows:
12.1. INVESTMENT INCOME
The investment income is allocated proportionately based upon the net investments of each Plan Account at the time the income was incurred.
12.2. EXPENSES
The Act requires that the costs of operation of PSP Investments be charged to the Plan Accounts. Under section 4(3) of the Act, the President of the Treasury Board shall determine to which Plan Account these costs will be charged, in consultation with the Minister of National Defence and the Minister of Public Safety and Emergency Preparedness. An allocation policy was developed which allocates the direct costs of investment activities, such as external investment management fees and custodial fees, to each Plan Account, based upon the net investments of each Plan Account at the time the expense was incurred.
Operating expenses and other comprehensive income (loss), excluding the direct cost of investment activities listed above, for the year ended March 31, were allocated in proportion to the annual amount of net investments of each Plan Account as follows:
2017 2016
Public Service Pension Plan Account 72.5% 72.6%
Canadian Forces Pension Plan Account 19.7 19.7
Royal Canadian Mounted Police Pension Plan Account 7.3 7.2
Reserve Force Pension Plan Account 0.5 0.5
Total 100.0% 100.0%
Expenses are paid by PSP Investments by way of advances from the Public Service Pension Plan Account, which are reimbursed by the other Plan Accounts on a quarterly basis.
ANNUAL REPORT 2017 | PUBLIC SECTOR PENSION INVESTMENT BOARD118

PUBLIC SECTOR PENSION INVESTMENT BOARDNotes to the Consolidated Financial Statements for the years ended March 31, 2017 and 2016
13 RELATED PARTY TRANSACTIONS
13.1. CERTAIN INVESTEES
As outlined in Note 2.1, investments in unconsolidated subsidiaries, jointly controlled investees and associates are measured at FVTPL. Transactions between PSP Investments and such entities or subsidiaries of such entities are related party transactions. PSP Investments enters into investment transactions with such related parties in the normal course of its business, more specifically, as part of private markets and certain fixed income investments described under Note 4.1 as well as guarantees, indemnities and commitments described under Notes 15 and 16, respectively. Since balances in connection with all investment transactions are measured at FVTPL, those transactions undertaken with related parties have the same impact on net assets and comprehensive income (loss) as those with unrelated parties.
Transactions between PSP Investments and its consolidated subsidiaries as well as related balances are eliminated upon consolidation and, therefore, are not disclosed in this note.
13.2. THE GOVERNMENT OF CANADA AND GOVERNMENT-RELATED ENTITIES
Since PSP Investments is a Crown corporation as described in Note 1, it is considered to be related to the Government of Canada as well as other entities that are controlled, jointly controlled or significantly influenced by the Government of Canada (together “government-related entities”).
(i) The Government of Canada
The only transactions undertaken between PSP Investments and the Government of Canada consist of the funds transfers outlined in Note 9.3.
(ii) Government-Related Entities
PSP Investments may enter into investment transactions with government-related entities in the normal course of its business, more specifically, as part of private markets and certain fixed income investments described under Note 4.1. Such investment transactions are carried out on terms that are equivalent to those that may prevail in transactions with unrelated parties and are subject to the same internal processes. In this respect, transactions with such related parties have the same impact on net assets and comprehensive income (loss) as those with unrelated parties. Consequently, PSP Investments is availing itself of the exemption under IAS 24 Related Parties from making specific disclosures on transactions and balances with such government-related entities.
13.3. COMPENSATION OF KEY MANAGEMENT PERSONNEL
Members of key management personnel are related parties of PSP Investments. Key management personnel are those persons having authority and responsibility for planning, directing and controlling PSP Investments’ activities, directly or indirectly and consist of members of the Board of Directors, PSP Investments’ senior management team and officers. Compensation earned by key management personnel for the year ended March 31 was recorded in the Consolidated Statements of Comprehensive Income and was as follows:
(Canadian $ millions) 2017 2016
Short-term compensation and other benefits $ 16 $ 16
Long-term compensation and other benefits 8 4
Total $ 24 $ 20
As disclosed in Note 15, PSP Investments may also be required to indemnify certain members of key management personnel for costs incurred, such as claims, actions or litigations in connection with the exercise of specific aspects of their duties.
14 CAPITAL MANAGEMENT
As an investment company, PSP Investments’ objectives in managing its capital are:
· To invest fund transfers, outlined in Note 9.3, in the best interests of the beneficiaries and contributors under the Superannuation Acts. The funds received are invested with a view of achieving a maximum rate of return, without undue risk of loss, having regard to the funding, policies and requirements of the Plans established under the Superannuation Acts and the ability of the Plans to meet their financial obligations. The funds are also invested in accordance with the Investment Risk Management policies which are outlined in Note 7.
· To maintain an appropriate credit rating to achieve access to the capital markets at the lowest cost of capital. Through PSP Capital Inc. and its leverage policies, PSP Investments has the ability to raise capital by issuing short-term promissory notes and medium-term notes. Note 8.2 provides information on the capital market debt financing and Note 7.3 provides information on PSP Investments’ liquidity.
The capital structure of PSP Investments consists of fund transfers and capital market debt financing. PSP Investments has no externally imposed restrictions on capital.
PUBLIC SECTOR PENSION INVESTMENT BOARD | ANNUAL REPORT 2017 119

PUBLIC SECTOR PENSION INVESTMENT BOARDNotes to the Consolidated Financial Statements for the years ended March 31, 2017 and 2016
15 GUARANTEES AND INDEMNITIES
PSP Investments provides indemnification to its Directors, its Officers, its vice-presidents and to certain PSP Investments representatives who are asked to serve on boards of directors (or like bodies) or investment advisory boards (or like bodies) of entities in which PSP Investments or its investment entity subsidiaries have made an investment or have a financial interest. As a result, but subject to the Act, PSP Investments may be required to indemnify these representatives for costs incurred, such as claims, actions or litigation in connection with the exercise of their duties, unless the liability of such a representative relates to a failure to act honestly and in good faith. To date, PSP Investments has not received any claims or made any payment for such indemnities.
In certain cases, PSP Investments also provides indemnification to third parties in the normal course of business. As a result, PSP Investments may be required to indemnify such third parties in connection with the performance of their contractual obligations. To date, PSP Investments has not received any claims nor made any payments for such indemnities.
PSP Investments unconditionally and irrevocably guarantees all credit facilities, as well as short-term promissory notes and medium-term notes issued by PSP Capital Inc., as described in Note 8.
In certain investment transactions, PSP Investments and its investment entity subsidiaries provided guarantees, indemnifications or issued letters of credit to third parties, the most significant of which are as follows:
· As at March 31, 2017, PSP Investments and its investment entity subsidiaries agreed to guarantee and, in some cases, provide indemnification for the performance of certain investees under contractual agreements. The majority of these agreements are borrowing arrangements. In the event a default occurs under such agreements, which is of limited recourse in certain cases, PSP Investments or its investment entity subsidiaries could assume obligations of up to $2,077 million as at March 31, 2017 (March 31, 2016 – $1,891 million) plus applicable interest and other related costs. The arrangements mature between May 2017 and September 2028.
· Additionally, PSP Investments and its investment entity subsidiaries issued letters of credit totalling $35 million as at March 31, 2017 (March 31, 2016 – $29 million) in relation to investment transactions.
16 COMMITMENTS
PSP Investments and its investment entity subsidiaries have committed to enter into investment transactions, which will be funded over the next several years in accordance with agreed terms and conditions. The commitments were as follows as at March 31:
(Canadian $ millions) 2017 2016
Real estate $ 2,826 $ 2,411Private equity 9,062 7,088Infrastructure 3,750 3,991Natural resources 755 848Private debt securities 3,110 4,514Alternative investments 1,242 1,900
Total $ 20,745 $ 20,752
Funding in connection with the above commitments can be called upon at various dates extending until 2035 as at March 31, 2017 (March 31, 2016 – 2032).
ANNUAL REPORT 2017 | PUBLIC SECTOR PENSION INVESTMENT BOARD120
Public Service Pension Plan Account
FINANCIAL STATEMENTS
Independent Auditors’ ReportTo the President of the Treasury Board
Report on the Financial Statements
We have audited the accompanying financial statements of the Public Sector Pension Investment Board — Public Service Pension Plan Account (the Public Service Pension Plan Account), which comprise the statements of financial position as at March 31, 2017 and March 31, 2016, and the statements of comprehensive income, statements of changes in equity and statements of cash flows for the years then ended, and a summary of significant accounting policies and other explanatory information.
Management’s Responsibility for the Financial Statements
Management is responsible for the preparation and fair presentation of these financial statements in accordance with International Financial Reporting Standards as issued by the International Accounting Standards Board, and for such internal control as management determines is necessary to enable the preparation of financial statements that are free from material misstatement, whether due to fraud or error.
Auditor’s Responsibility
Our responsibility is to express an opinion on these financial statements based on our audits. We conducted our audits in accordance with Canadian generally accepted auditing standards. Those standards require that we comply with ethical requirements and plan and perform the audit to obtain reasonable assurance about whether the financial statements are free from material misstatement.
An audit involves performing procedures to obtain audit evidence about the amounts and disclosures in the financial statements. The procedures selected depend on the auditor’s judgment, including the assessment of the risks of material misstatement of the financial statements, whether due to fraud or error. In making those risk assessments, the auditor considers internal
control relevant to the entity’s preparation and fair presentation of the financial statements in order to design audit procedures that are appropriate in the circumstances, but not for the purpose of expressing an opinion on the effectiveness of the entity’s internal control. An audit also includes evaluating the appropriateness of accounting policies used and the reasonableness of accounting estimates made by management, as well as evaluating the overall presentation of the financial statements.
We believe that the audit evidence we have obtained in our audits is sufficient and appropriate to provide a basis for our audit opinion.
Opinion
In our opinion, the financial statements present fairly, in all material respects, the financial position of the Public Service Pension Plan Account as at March 31, 2017 and March 31, 2016, and its financial performance and its cash flows for the years then ended in accordance with International Financial Reporting Standards as issued by the International Accounting Standards Board.
Report on Other Legal and Regulatory Requirements
As required by the Financial Administration Act, we report that, in our opinion, the accounting principles in International Financial Reporting Standards as issued by the International Accounting Standards Board have been applied on a basis consistent with that of the preceding year.
Further, in our opinion, the transactions in the Public Service Pension Plan Account that have come to our notice during our audits of the financial statements have, in all significant respects, been in accordance with the applicable provisions of Part X of the Financial Administration Act and regulations, the Public Sector Pension Investment Board Act and regulations and the by-laws of the Public Sector Pension Investment Board and its wholly-owned subsidiaries.
Margaret Haire, CPA, CA Principal for the Auditor General of Canada
May 12, 2017 Ottawa, Canada
1 CPA auditor, CA, public accountancy permit No. A121444
May 12, 2017 Montréal, Canada
Public Service Pension Plan Account
PUBLIC SECTOR PENSION INVESTMENT BOARD | ANNUAL REPORT 2017 121

PUBLIC SERVICE PENSION PLAN ACCOUNT
Statements of Financial PositionAs at
(Canadian $ millions) March 31, 2017 March 31, 2016
AssetsInvestments (Note 4.1) $ 115,296 $ 95,400Other assets 118 108Due from the Canadian Forces Pension Plan Account 21 17Due from the Royal Canadian Mounted Police Pension Plan Account 8 6Due from the Reserve Force Pension Plan Account 1 –
Total assets $ 115,444 $ 95,531
LiabilitiesTrade payable and other liabilities $ 168 $ 136Investment-related liabilities (Note 4.1) 8,983 4,251Borrowings (Notes 4.1, 8.2) 7,846 6,421
Total liabilities $ 16,997 $ 10,808
Net assets $ 98,447 $ 84,723
Equity (Note 9) $ 98,447 $ 84,723
Total liabilities and equity $ 115,444 $ 95,531
The accompanying notes are an integral part of the Financial Statements.
On behalf of the Board of Directors:
Michael P. Mueller William A. MacKinnon Chair of the Board Chair of the Audit Committee
ANNUAL REPORT 2017 | PUBLIC SECTOR PENSION INVESTMENT BOARD122

PUBLIC SERVICE PENSION PLAN ACCOUNT
Statements of Comprehensive Income For the years ended March 31
(Canadian $ millions) 2017 2016
Investment income $ 11,544 $ 991
Investment-related expenses (Note 10) (261) (196)
Net investment income $ 11,283 $ 795
Operating expenses (Note 11) (268) (215)
Net income $ 11,015 $ 580
Other comprehensive income (loss)Remeasurement of the net defined benefit liability (3) 3
Comprehensive income $ 11,012 $ 583
Statements of Changes in Equity For the years ended March 31
(Canadian $ millions) 2017 2016
Fund transfersBalance at beginning of period $ 47,972 $ 45,180Fund transfers received during the period (Note 9.2) 2,712 2,792
Balance at end of period $ 50,684 $ 47,972
Retained earningsBalance at beginning of period $ 36,751 $ 36,168Comprehensive income 11,012 583
Balance at end of period $ 47,763 $ 36,751
Total equity $ 98,447 $ 84,723
The accompanying notes are an integral part of the Financial Statements.
PUBLIC SECTOR PENSION INVESTMENT BOARD | ANNUAL REPORT 2017 123

PUBLIC SERVICE PENSION PLAN ACCOUNT
Statements of Cash Flows For the years ended March 31
(Canadian $ millions) 2017 2016
Cash flows from operating activitiesNet income $ 11,015 $ 580Adjustments for non-cash items:
Depreciation of equipment (Note 11) 22 19Effect of exchange rate changes on cash and cash equivalents (35) 6Unrealized losses (gains) on borrowings 302 (396)
$ 11,304 $ 209
Net changes in operating assets and liabilitiesIncrease in investments $ (18,136) $ (4,596)Decrease (increase) in other assets 7 (5)Increase (decrease) in trade payable and other liabilities 29 (4)Increase in investment-related liabilities 4,732 573
Net cash flows used in operating activities $ (2,064) $ (3,823)
Cash flow from financing activitiesRepayments of amounts due from:
Canadian Forces Pension Plan Account $ 83 $ 76Royal Canadian Mounted Police Pension Plan Account 30 28Reserve Force Pension Plan Account 2 2
Advances to:Canadian Forces Pension Plan Account (87) (77)Royal Canadian Mounted Police Pension Plan Account (32) (28)Reserve Force Pension Plan Account (2) (2)
Proceeds from borrowings 19,528 17,310Repayment of borrowings (18,405) (15,877)Fund transfers received 2,712 2,792
Net cash flows provided by financing activities $ 3,829 $ 4,224
Cash flow from investing activitiesAcquisitions of equipment $ (33) $ (20)
Net cash flows used in investing activities $ (33) $ (20)
Net change in cash and cash equivalents $ 1,732 $ 381Effect of exchange rate changes on cash and cash equivalents 35 (6)Cash and cash equivalents at the beginning of the period 1,007 632
Cash and cash equivalents at the end of the periodA $ 2,774 $ 1,007
Supplementary disclosure of cash flow informationInterest paid $ (100) $ (89)
A As at March 31, 2017, cash and cash equivalents were comprised of $2,761 million (March 31, 2016 – $1,001 million) held for investment purposes and included in Note 4.1, as well as $13 million (March 31, 2016 – $6 million) held for administrative purposes and included in Other assets.
The accompanying notes are an integral part of the Financial Statements.
ANNUAL REPORT 2017 | PUBLIC SECTOR PENSION INVESTMENT BOARD124

PUBLIC SERVICE PENSION PLAN ACCOUNT
1 CORPORATE INFORMATION
The Public Sector Pension Investment Board (“PSP Investments”) is a Crown corporation created under the Public Sector Pension Investment Board Act (the “Act”) to manage and invest amounts that are transferred to it pursuant to the Superannuation Acts (defined below), for the funds (as defined in the Act) of the pension plans established under the Public Service Superannuation Act, the Canadian Forces Superannuation Act (“CFSA”), the Royal Canadian Mounted Police Superannuation Act (collectively the “Superannuation Acts”), and certain regulations under the CFSA (the “CFSA Regulations”). The pension plans established under the Superannuation Acts consist of the Public Service pension plan (the “Plan”), the Canadian Forces pension plan, and the Royal Canadian Mounted Police pension plan, and the pension plan established under the CFSA Regulations is the Reserve Force pension plan. The Plan and the other pension plans are herein referred to collectively as the “Plans”.
The fund for which amounts are currently transferred to PSP Investments by the Government of Canada (the “Fund”) relates to pension obligations under the Plan for service on or after April 1, 2000 (“Post-2000 Service”). The account managed by PSP Investments for the Fund is herein referred to as the “Plan Account”. PSP Investments maintains records of the net contributions for the Fund, as well as the allocation of its investments and the results of its operations for the Fund in the Plan Account. PSP Investments also manages a plan account for the funds of the other Plans, and these and the Plan Account are collectively referred to herein as the “Plan Accounts”.
PSP Investments is responsible for managing amounts that are transferred to it for the Fund in the best interests of the beneficiaries and contributors under the Public Service Superannuation Act. The amounts are to be invested with a view of achieving a maximum rate of return, without undue risk of loss, having regard to the funding, policies and requirements of the Plan and the Plan’s ability to meet its financial obligations.
Pursuant to the Public Service Superannuation Act, the Government of Canada, which administers the Plan and the Fund, may at any time call upon the net assets of PSP Investments allocated to the Fund’s Plan Account for amounts required for the purpose of paying benefits under the Plan in respect of Post-2000 Service, or generally, for the purpose of reducing any non-permitted surplus in the Fund.
PSP Investments and the majority of its subsidiaries are exempt from Part I tax under paragraphs 149(1)(d) and 149(1)(d.2) of the Income Tax Act (Canada), respectively.
PSP Investments’ registered office is located at 1 Rideau Street, Ottawa, Ontario, Canada and its principal business office is at 1250 René Lévesque Boulevard West, Montreal, Quebec, Canada.
2 SIGNIFICANT ACCOUNTING POLICIES
The significant accounting policies that have been applied in the preparation of these Financial Statements are summarized below and have been used throughout all periods presented.
2.1. BASIS OF PRESENTATION
These Financial Statements have been prepared in accordance with International Financial Reporting Standards (“IFRS”) as issued by the International Accounting Standards Board (“IASB”).
PSP Investments qualifies as an investment entity as defined under IFRS 10 Consolidated Financial Statements and, consequently, does not consolidate its subsidiaries other than those that solely provide it with services that relate to its investment activities. Instead, PSP Investments measures its investments in subsidiaries at fair value through profit or loss (“FVTPL”) in accordance with IFRS 9 Financial Instruments (“IFRS 9”), including those that are formed by PSP Investments and that qualify as investment entities (“investment entity subsidiaries”). PSP Investments also measures its investments in associates, joint ventures and financial assets and financial liabilities at FVTPL in accordance with IAS 28 Investments in Associates and Joint Ventures and IFRS 9.
These Financial Statements present the Plan Account’s financial position and results of operations of PSP Investments and its subsidiaries that solely provide it with services that relate to its investment activities, as allocated to the Plan Account. They reflect the economic activity of PSP Investments as it pertains to the investment of the net contributions transferred to it for the Fund in respect of Post-2000 Service. Accordingly, they do not reflect all of the assets or the details of the pension contributions, payments and liabilities under the Plan.
These Financial Statements were authorized for issue in accordance with a resolution of the Board of Directors on May 12, 2017.
Notes to the Financial StatementsFor the years ended March 31, 2017 and 2016
PUBLIC SECTOR PENSION INVESTMENT BOARD | ANNUAL REPORT 2017 125

PUBLIC SERVICE PENSION PLAN ACCOUNTNotes to the Financial Statements for the years ended March 31, 2017 and 2016
2 SIGNIFICANT ACCOUNTING POLICIES (continued)
2.2. INVESTMENT ENTITY STATUS
PSP Investments has determined that it meets the mandatory items of the definition of an investment entity under IFRS 10 on the basis of the facts and circumstances as at the end of the period. They are as follows:
(i) Mandate and business purpose
As further described in Note 1, PSP Investments’ mandate is to manage and invest the amounts that are transferred to it in the best interests of the beneficiaries and contributors under the Superannuation Acts. Consequently, PSP Investments’ business purpose is to invest with a view of achieving a maximum rate of return from capital appreciation and income from investments, without undue risk of loss.
(ii) Performance evaluation
PSP Investments measures and evaluates the performance of its investments on a fair value basis.
In addition to the mandatory items of the definition, IFRS 10 also outlines certain typical characteristics of an investment entity, the absence of any of which does not necessarily preclude an entity from qualifying as an investment entity. One of these characteristics is that an investment entity should have investors that are not related parties of the entity.
As described in Note 13, since PSP Investments is a Crown corporation, it is considered to be related to the Government of Canada as well as other entities that are controlled or jointly controlled by the Government of Canada or entities over which the latter has significant influence. Consequently, since the funds managed by PSP Investments originate from related parties, it may be considered not to meet the typical characteristic outlined above. However, the Act provides a framework to ensure that PSP Investments operates at arm’s length from the Government of Canada. Accordingly, it meets all of the mandatory items of the definition described above and qualifies as an investment entity.
Should any changes occur in the facts and circumstances, PSP Investments will evaluate the impact of any such changes on its investment entity status.
2.3. SUMMARY OF SIGNIFICANT ACCOUNTING POLICIES
The principal accounting policies applied in the preparation of these Financial Statements are set out below.
2.3.1. Financial Instruments
(i) Classification
Financial assets representing investments are managed, together with related financial liabilities, according to the entity’s business model to maximize the rate of return. The performance of such financial instruments is evaluated on a fair value basis and they are classified at FVTPL. They are described in detail in Note 4.1.
Borrowings as described under Note 8, are financial liabilities that are designated to be measured at FVTPL since they are part of the portfolios of investments that are managed together and whose performance is evaluated on a fair value basis.
(ii) Recognition
Financial assets and financial liabilities are recorded at the date upon which PSP Investments becomes a party to the associated contractual provisions. In the case of traded financial assets, they are recorded as of the trade date.
(iii) Initial and subsequent measurement
All financial assets and financial liabilities are recorded in the Statements of Financial Position at fair value and continue to be measured as such on a recurring basis. After initial measurement, subsequent changes in the fair value of financial assets and financial liabilities classified at FVTPL are recorded in the Statements of Comprehensive Income.
If fair value changes in financial liabilities designated to be measured at FVTPL result from fluctuations in PSP Investments’ own credit risk, they are recorded in other comprehensive income. All other changes in fair value are recorded in investment income.
(iv) Derecognition
A financial asset (or, where applicable, a part thereof) is derecognized when the following conditions are met:
· The rights to receive cash flows from the asset have expired, or
· PSP Investments has transferred its rights to receive cash flows from the asset or has assumed an obligation to pay the received cash flows to a third party,
and
· PSP Investments has transferred substantially all the risks and rewards of the asset, or
· In cases where PSP Investments has neither transferred nor retained substantially all the risks and rewards of the asset, it has transferred control of the asset.
A financial liability is derecognized when the obligation under the liability is discharged, cancelled or expired.
ANNUAL REPORT 2017 | PUBLIC SECTOR PENSION INVESTMENT BOARD126

PUBLIC SERVICE PENSION PLAN ACCOUNTNotes to the Financial Statements for the years ended March 31, 2017 and 2016
2 SIGNIFICANT ACCOUNTING POLICIES (continued)
2.3. SUMMARY OF SIGNIFICANT ACCOUNTING POLICIES (continued)
2.3.2. Determination of Fair Value
Fair value is the price that would be received to sell an asset or paid to transfer a liability in an orderly transaction between market participants at the measurement date.
At initial recognition, PSP Investments evaluates the facts and circumstances related to a transaction to confirm that the transaction price represents the fair value of an asset or a liability. At each subsequent reporting date, market prices are used to determine fair value where an active market exists (such as a recognized securities exchange), as they reflect actual and regularly occurring market transactions on an arm’s length basis. If quoted market prices are not available, then fair value is estimated using valuation techniques based on inputs existing at the end of the reporting period that are derived from observable market data.
Valuation techniques are generally applied to investments in Private Markets, over-the-counter (OTC) derivatives and certain fixed income securities. The values derived from applying these techniques are impacted by the choice of valuation model and the underlying assumptions made concerning factors such as the amounts and timing of future cash flows, discount rates, volatility and credit risk. In certain cases, such assumptions are not supported by market observable data.
The determination of fair value of all financial assets and financial liabilities is described in Note 4.
2.3.3. Functional and Presentation Currency
The functional and presentation currency of PSP Investments and its consolidated subsidiaries is the Canadian dollar, which is the currency of the primary economic environment in which each entity within the consolidated group operates. PSP Investments’ performance and that of its consolidated subsidiaries is evaluated and its liquidity is managed in Canadian dollars.
2.3.4. Foreign Currency Translation
Foreign currency transactions during the period, including purchases and sales of securities, income and expenses, are translated at the rate of exchange prevailing on the date of the transaction.
Monetary assets and liabilities that are denominated in foreign currencies are translated at the functional currency rate of exchange prevailing at the end of the reporting period.
Foreign currency transaction gains and losses on all monetary assets and liabilities are included in investment income.
2.3.5. Securities Lending and Securities Borrowing and Related Collateral
PSP Investments participates in securities lending and borrowing programs whereby it lends and borrows securities in order to enhance portfolio returns. Lending and borrowing transactions including related collateral under such programs do not transfer the risks or rewards of ownership of the securities to the counterparty. Consequently, PSP Investments does not derecognize securities lent or pledged as collateral, or recognize securities borrowed or received as collateral. Cash collateral received is recognized as described in Note 4.1.8.
The securities lending and borrowing programs require collateral in cash, high-quality debt instruments or securities. Collateral transactions are conducted under terms that are usual and customary in standard securities lending and borrowing programs. PSP Investments and its counterparties are authorized to sell, repledge or otherwise use collateral held. The same securities or equivalent securities must be returned to the counterparty at the end of the contract, unless an event of default occurs.
2.3.6. Securities sold under Repurchase Agreements and purchased under Reverse Repurchase Agreements and Related Collateral
PSP Investments is party to repurchase and reverse repurchase agreements. Such agreements involve the sale of securities by one counterparty with a simultaneous agreement to repurchase such securities at a specified price and at a specified future date.
Securities sold or purchased under the repurchase and reverse repurchase agreements respectively, including related collateral, are not derecognized or recognized as all risks and rewards of ownership related to such securities are not transferred. As such, in the case where PSP Investments is the counterparty selling securities under such agreements, all income (loss) related to such securities continues to be reported in investment income and obligations to repurchase the securities sold are accounted for as investment-related liabilities. The difference between the fair value of the securities sold and the repurchase price is recorded as interest expense. In the case where PSP Investments is the counterparty purchasing securities under such agreements, no income (loss) related to such securities is recognized and obligations to resell the securities are accounted for as investment-related receivables. The difference between the fair value of the securities purchased and resale price is recorded in investment income.
Transactions under repurchase and reverse repurchase agreements involve pledging collateral consisting of cash or securities deemed acceptable by the counterparties. Collateral transactions are conducted under terms that are usual and customary in standard repurchase arrangements. Such terms require the relevant counterparty to pledge additional collateral based on the changes in the fair value of the existing collateral pledged as well as the related securities sold or purchased. The counterparties are authorized to sell, repledge or otherwise use collateral held. The securities pledged as collateral must be returned to the relevant counterparty at the end of the contract, unless an event of default occurs.
PUBLIC SECTOR PENSION INVESTMENT BOARD | ANNUAL REPORT 2017 127

PUBLIC SERVICE PENSION PLAN ACCOUNTNotes to the Financial Statements for the years ended March 31, 2017 and 2016
2 SIGNIFICANT ACCOUNTING POLICIES (continued)
2.3. SUMMARY OF SIGNIFICANT ACCOUNTING POLICIES (continued)
2.3.7. Offsetting of Financial Instruments
Financial assets and financial liabilities are offset with the net amount reported in the Statements of Financial Position only if PSP Investments has a current legally enforceable right to offset the recognized amounts and the intent to settle on a net basis, or to realize the assets and settle the liabilities simultaneously.
2.3.8. Equity
The statutory rights of the Government of Canada pursuant to the Superannuation Acts are described under Note 1 and are classified as equity instruments on the following basis:
· Under such rights the Government of Canada is entitled to PSP Investments’ net assets at any time for the purposes set out in the Superannuation Acts. Such rights do not contain any additional obligations for PSP Investments to deliver amounts to the Government of Canada.
· Such rights are the most subordinate claim on PSP Investments’ net assets.
· The total expected cash flows attributable to such rights, at any time, is solely based on the fair value of the net assets of PSP Investments at that time. Further, the fair value of the net assets of PSP Investments in its entirety represents the amounts that the Government of Canada may call upon at any time.
2.3.9. Investment Income
Investment income is made up of interest, dividends, gains (losses) on the disposal of financial assets and financial liabilities as well as gains (losses) which reflect the change in unrealized appreciation (depreciation) of financial assets held and financial liabilities outstanding at the end of the reporting period. Interest is recognized, on a consistent basis, using the prescribed rates until maturity. Dividends are recognized when the right to receive them has been obtained, generally on the ex-dividend date.
2.3.10. Investment-Related Expenses
Investment-related expenses are made up of interest expense, as described in Note 4.1.7, transaction costs, external investment management fees and other (net).
Transaction costs are incremental costs directly attributable to the acquisition, due diligence, issue, or disposal of a financial asset or financial liability, and they are expensed as incurred.
External investment management fees are directly attributable to the external management of assets on behalf of PSP Investments. These fees are paid directly by PSP Investments and comprise base fees accrued as a percentage of the fair value of the assets managed externally and performance fees accrued as a function of various performance indicators. This excludes amounts not paid directly by PSP Investments for certain pooled fund investments classified under alternative investments and for investments in private markets and other fixed income securities as outlined in Note 10.
2.3.11. Fund Transfers
Amounts are received from the Government of Canada for the Fund and are recorded in the Plan Account.
2.4. SIGNIFICANT ACCOUNTING JUDGMENTS, ESTIMATES AND ASSUMPTIONS
In preparing the Financial Statements, management makes certain judgments, estimates and assumptions that can affect the amounts reported therein. Significant judgments include those related to the determination of the investment entity status as described in Note 2.2.
Management also makes estimates and assumptions in the measurement, risk assessment and related disclosures surrounding investments in private markets and certain fixed income securities. The main assumptions made by management regarding measurement of financial instruments are outlined in Note 4.2.3 and those regarding the assessment of risk are outlined in Note 7.
Although estimates and assumptions reflect management’s best judgment, actual results may differ from such estimates due to the uncertainties involved in using them.
ANNUAL REPORT 2017 | PUBLIC SECTOR PENSION INVESTMENT BOARD128

PUBLIC SERVICE PENSION PLAN ACCOUNTNotes to the Financial Statements for the years ended March 31, 2017 and 2016
3 CURRENT AND FUTURE CHANGES IN ACCOUNTING STANDARDS
3.1. ACCOUNTING STANDARDS ADOPTED IN THE CURRENT YEAR
IFRS 11 Joint Arrangements
IFRS 11 was amended, effective for annual periods beginning on or after January 1, 2016, to add new guidance on the accounting for acquisitions of interests in a joint operation that constitutes a business. Acquirers of such interests shall apply all of the principles in business combinations accounting in IFRS 3 Business Combinations, and other IFRS, that do not conflict with the guidance in IFRS 11 and disclose the information that is required in those IFRS in relation to business combinations. On April 1, 2016, PSP Investments adopted this amendment with no impact on the presentation of the Financial Statements.
3.2. ACCOUNTING STANDARDS ADOPTED BEFORE THE EFFECTIVE DATE
IFRS 9 Financial Instruments
In 2014, the IASB completed its project to replace IAS 39 Financial Instruments: Recognition and Measurement with IFRS 9. The Standard includes requirements for recognition, derecognition, classification and measurement of financial assets and liabilities. IFRS 9 is effective for annual periods beginning on or after January 1, 2018 with early application permitted.
PSP Investments initially adopted IFRS 9 (2014) in its Consolidated Financial Statements for the year ended March 31, 2016. Significant accounting policies in connection with IFRS 9 are described under Note 2.3.1.
3.3. FUTURE ACCOUNTING STANDARDS
A number of new standards, amendments and interpretations have been issued by the IASB, but are not yet effective. The following relates to one or more of PSP Investments’ significant accounting policies or disclosures:
IAS 7 Statement of Cash Flows
IAS 7 was amended, effective for annual periods beginning on or after January 1, 2017, to add new guidance on disclosures that enable users of financial statements to evaluate changes in liabilities arising from financing activities, including both changes arising from cash flows and non-cash changes. PSP Investments will apply the amendments starting from April 1, 2017 and will make the required note disclosures in the Financial Statements.
IAS 28 Investment in Associates and Joint Ventures
IAS 28 was amended, effective for annual periods beginning on or after January 1, 2018, to add a clarification that serves to elaborate and clarify that the election to measure investees at fair value is available on an investment by investment basis and is not an election that must be applied consistently to the measurement of all associates and joint ventures. Management has determined that the amendment will not have an impact on the Financial Statements.
PUBLIC SECTOR PENSION INVESTMENT BOARD | ANNUAL REPORT 2017 129

PUBLIC SERVICE PENSION PLAN ACCOUNTNotes to the Financial Statements for the years ended March 31, 2017 and 2016
4 FINANCIAL ASSETS AND FINANCIAL LIABILITIES
4.1. CLASSES OF FINANCIAL ASSETS AND FINANCIAL LIABILITIES
Financial assets and financial liabilities are aggregated, in the following table, in classes that reflect their respective exposure as well as investment sectors. Their fair values were as follows, as at:
(Canadian $ millions) March 31, 2017 March 31, 2016
Public marketsCanadian equity $ 4,616 $ 4,620Foreign equity 21,420 18,874
Private marketsReal estate 17,670 16,306Private equity 9,886 8,160Infrastructure 9,586 6,893Natural resources 3,100 2,200
Fixed incomeCash and money market securities 8,980 4,293Government and corporate bonds 15,823 14,466Inflation-linked bonds 5,608 5,372Private debt securitiesA 6,645 3,846Other fixed income securitiesA 2,408 1,913
Alternative investments 5,819 4,807
$ 111,561 $ 91,750
Investment-related assetsAmounts receivable from pending trades $ 832 $ 320Interest receivable 231 162Dividends receivable 96 75Securities purchased under reverse repurchase agreements 1,926 777Derivative-related assets 650 2,316
$ 3,735 $ 3,650
Investments representing financial assets at FVTPL $ 115,296 $ 95,400
Investment-related liabilitiesAmounts payable from pending trades $ (781) $ (418)Interest payable (28) (19)Securities sold short and securities loaned (6,761) (1,930)Securities sold under repurchase agreements (804) (1,043)Derivative-related liabilities (609) (841)
Investment-related liabilities representing financial liabilities at FVTPL $ (8,983) $ (4,251)
BorrowingsCapital market debt financing $ (7,846) $ (6,421)
Borrowings representing financial liabilities designated at FVTPL $ (7,846) $ (6,421)
Net investments $ 98,467 $ 84,728
A During the year ended March 31, 2017, private debt securities were reclassified out of other fixed income securities and into a standalone caption in order to better reflect their nature and common characteristics. Accordingly, comparative figures were adjusted to decrease other fixed income securities by $3,846 million and increase private debt securities by the same amount. Notes 4.2.1 and 4.2.3 were adjusted similarly.
4.1.1. Public Markets
Public markets consist of Canadian and foreign investments in the following securities: common shares, American depository receipts, global depository receipts, participation notes, preferred shares, income trust units, exchange traded funds units, pooled funds units, and securities convertible into common shares of publicly listed issuers.
Direct investments in Canadian and foreign equities are measured at fair value using quoted prices in active markets and are based on the most representative price within the bid-ask spread.
In the case of investments in pooled funds, fair value is measured using unit values obtained from each of the funds’ administrators, which are derived from the fair value of the underlying investments in each pooled fund. Management reviews the fair value received and, where necessary, the impact of restrictions on the sale or redemption of such investments is taken into consideration.
ANNUAL REPORT 2017 | PUBLIC SECTOR PENSION INVESTMENT BOARD130

PUBLIC SERVICE PENSION PLAN ACCOUNTNotes to the Financial Statements for the years ended March 31, 2017 and 2016
4 FINANCIAL ASSETS AND FINANCIAL LIABILITIES (continued)
4.1. CLASSES OF FINANCIAL ASSETS AND FINANCIAL LIABILITIES (continued)
4.1.2. Private Markets
Private markets consist of investments in real estate, private equity, infrastructure and natural resources.
Real estate investments are comprised of direct equity positions in various private entities, fund investments, as well as properties in the real estate sector. Real estate investments focus on partnerships, companies and properties operating mainly in the retirement and residential, office, retail, and industrial sectors, as well as private funds invested in real estate assets. Real estate investments are presented net of all third-party financing. As at March 31, 2017, leverage in the form of third-party financing undertaken by investment entity subsidiaries and direct real estate investments controlled by PSP Investments was $5,051 million for the Plan Account (March 31, 2016 – $4,560 million).
Private equity investments are comprised of fund investments with similar objectives, co-investments in private entities as well as direct equity positions.
Infrastructure investments are comprised of direct equity positions, fund investments and co-investments in various private entities. Infrastructure investments focus on entities engaged in the management, ownership or operation of assets in energy, transportation and other regulated businesses. Infrastructure investments are presented net of all third-party financing. As at March 31, 2017, leverage in the form of third-party financing undertaken by direct infrastructure investments controlled by PSP Investments was $2,865 million for the Plan Account (March 31, 2016 – $1,156 million).
Natural resources investments are comprised of direct equity positions, fund investments and partnerships. Natural resources investments focus on entities engaged in the management, ownership or operation of assets in timberlands, agriculture and upstream oil and gas.
The process for fair value measurement of private markets investments is described in Note 4.2.2 and the valuation techniques together with the significant inputs used are described in Note 4.2.3.
4.1.3. Fixed Income
Fixed income consists of cash and money market securities, government and corporate bonds, inflation-linked bonds, private debt securities and other fixed income securities.
Cash and money market securities include instruments having a maximum term to maturity of one year, such as treasury bills, certificates of deposit and bankers’ acceptances. A portion of such instruments has maturities of 90 days or less and is held to meet short-term financial commitments. Such instruments are readily convertible into known amounts of cash and have an insignificant risk of change in value. They are considered cash and cash equivalents for purposes of the Statements of Cash Flows and amounted to $2,761 million as at March 31, 2017 (March 31, 2016 – $1,001 million). Treasury bills are valued based on prices obtained from third-party pricing sources. Such prices are determined using the most representative price within a spread of dealer quotations. Certificates of deposit and bankers’ acceptances are recorded at cost plus accrued interest, which approximates their fair value given their short-term nature.
Government and corporate bonds include Canadian and foreign, federal, provincial, territorial and municipal bonds. Inflation-linked bonds are fixed income securities that earn inflation-adjusted returns.
Private debt securities are fixed income securities of private companies held directly or through private funds. Such debt securities take the form of senior debt, mezzanine and distressed debt and primary and secondary investments in leveraged loans. Private debt securities also include third-party loans such as junior and senior debts, construction loans, bridge loans, income-participating loans, as well as other structured finance products in the real estate sector.
Other fixed income securities consist of asset-backed securities and floating rate notes.
Fair values of government and most corporate bonds, inflation-linked bonds, floating rate notes and mortgage-backed securities are based on prices obtained from third-party pricing sources. Such prices are determined using either an appropriate interest rate curve with a spread associated with the credit quality of the issuer or other generally accepted pricing methodologies.
Asset-backed securities consist mainly of asset-backed term notes (ABTNs) and mortgage-backed securities. The ABTNs were received in exchange for third-party or non-bank sponsored asset-backed commercial paper (ABCP) that suffered a liquidity disruption in mid-August 2007 and were subsequently restructured in January 2009.
The fair values of certain corporate bonds, private debt securities and ABTNs are determined using valuation techniques. Such techniques, together with the significant inputs used, are described in Note 4.2.3.
The fair value measurement of fund investments included as part of private debt securities is described in Note 4.2.2.
PUBLIC SECTOR PENSION INVESTMENT BOARD | ANNUAL REPORT 2017 131

PUBLIC SERVICE PENSION PLAN ACCOUNTNotes to the Financial Statements for the years ended March 31, 2017 and 2016
4 FINANCIAL ASSETS AND FINANCIAL LIABILITIES (continued)
4.1. CLASSES OF FINANCIAL ASSETS AND FINANCIAL LIABILITIES (continued)
4.1.4. Alternative Investments
Alternative investments consist mainly of units of funds that hold a mix of equity, fixed income and derivative instruments as well as hedge funds. The fair value of these investments is determined based on the fair values reported by the funds’ administrators or general partners and reflects the fair value of the underlying equity, fixed income or derivative instruments, as applicable. Management reviews the fair value received and, where necessary, the impact of restrictions on the sale or redemption of such investments is taken into consideration.
4.1.5. Amounts Receivable and Payable from Pending Trades
Amounts receivable from pending trades consist of proceeds on sales of investments, excluding derivative financial instruments, which have been traded but remain unsettled at the end of the reporting period.
Amounts payable from pending trades consist of the cost of purchases of investments, excluding derivative financial instruments, which have been traded but remain unsettled at the end of the reporting period.
The fair value of amounts receivable and payable from pending trades reflects the value at which their underlying original sale or purchase transactions were undertaken.
4.1.6. Interest and Dividends Receivable
Interest and dividends are recorded at the amounts expected to be received at the end of the reporting period, which approximates fair value.
4.1.7. Interest Payable
With respect to the borrowings described in Note 4.1.10, interest is accrued at the amount expected to be paid at the end of the reporting period, which approximates fair value.
4.1.8. Securities Sold Short and Securities Loaned
Securities sold short reflect PSP Investments’ obligation to purchase securities pursuant to short selling transactions. In such transactions, PSP Investments sells securities it does not own with an obligation to purchase similar securities on the market to cover its position.
Using quoted market prices that are based on the most representative price within the bid-ask spread, the fair value of securities sold short is measured using the same method as the similar long positions presented within public markets and fixed income.
As part of securities lending and certain OTC derivative transactions, cash collateral is received and reinvested by PSP Investments. PSP Investments recognizes cash collateral received with a corresponding payable. The payable balance reflects the obligation of the transferee to return cash collateral to the transferor at the end of the transaction in the absence of an event of default by the transferor.
4.1.9. Securities Sold under Repurchase Agreements and Purchased under Reverse Repurchase Agreements
As described in Note 2.3.6, PSP Investments is party to repurchase and reverse repurchase agreements. Obligations to repurchase or resell the securities sold or purchased under such agreements are recorded at cost plus accrued interest, which approximates fair value.
4.1.10. Borrowings under the Capital Market Debt Program
PSP Investments’ capital market debt program is described in Note 8.2. Short-term promissory notes are recorded at cost plus accrued interest, which approximates fair value. The fair value of PSP Investments’ medium-term notes is based on prices that are obtained from third-party pricing sources. Such prices are determined using an interest rate curve with a spread consistent with PSP Investments’ credit quality.
ANNUAL REPORT 2017 | PUBLIC SECTOR PENSION INVESTMENT BOARD132
PUBLIC SERVICE PENSION PLAN ACCOUNTNotes to the Financial Statements for the years ended March 31, 2017 and 2016
4 FINANCIAL ASSETS AND FINANCIAL LIABILITIES (continued)
4.1. CLASSES OF FINANCIAL ASSETS AND FINANCIAL LIABILITIES (continued)
4.1.11. Derivative-Related Assets and Liabilities
Derivative financial instruments are financial contracts that are settled at a future date. The value of such instruments is derived from changes in the value of the underlying assets, interest or exchange rates. Derivative financial instruments do not, typically, require an initial net investment. In certain cases, they require an initial net investment that is less than what would be required to hold the underlying position directly. Derivative financial instruments can be listed or traded OTC. OTC instruments consist of those that are bilaterally negotiated and settled, and those that are cleared (OTC-cleared) by a central clearing party (CCP).
PSP Investments uses derivative financial instruments to enhance returns or to replicate investments synthetically. Derivatives are also used to reduce the risk associated with existing investments.
PSP Investments uses the following types of derivative financial instruments:
Swaps
Swaps are transactions whereby two counterparties exchange cash flow streams with each other based on predetermined conditions that include a notional amount and a term. Swaps are used to increase returns or to adjust exposures of certain assets without directly purchasing or selling the underlying assets.
Futures
Futures are standardized contracts to take or make delivery of an asset (buy or sell) at a predefined price and predefined future date. Futures are used to adjust exposures to specified assets without directly purchasing or selling the underlying assets.
Forwards
Forwards are contracts involving the sale by one party and the purchase by another party of a predefined amount of an underlying instrument, at a predefined price and at a predefined date in the future. Forwards are used to adjust exposures to specified assets without directly purchasing or selling the underlying assets.
Options
Options are contracts where the seller gives the purchaser the right, but not the obligation, to buy or sell a given amount of an underlying security, index, or commodity, at an agreed-upon price stipulated in advance, either at a determined date or at any time before the predefined maturity date.
Warrants and Rights
Warrants are options to purchase an underlying asset which is in the form of a transferable security and which can be listed on an exchange.
Rights are securities giving shareholders entitlement to purchase new shares issued by a corporation at a predetermined price (normally less than the current market price) in proportion to the number of shares already owned. Rights are issued only for a short period of time, after which they expire.
Determination of Fair Value of Derivative Financial Instruments
Listed derivative financial instruments are recorded at fair value using quoted market prices that are based on the most representative price within the bid-ask spread. OTC-cleared derivatives are recorded at fair value using prices obtained from the CCP. OTC derivatives are valued using appropriate valuation techniques such as discounted cash flows. These techniques use significant inputs that are observable in the market such as current market yields.
Notional Values and Fair Values of Derivative-Related Assets and Liabilities
Notional values of derivative financial instruments are not recorded as assets or liabilities as they represent the face amount of the contract. Except for credit derivatives, notional values do not represent the potential gain or loss associated with the market or credit risk of such transactions disclosed below. Rather, they serve as the basis upon which the cash flows and the fair value of the contracts are determined.
PUBLIC SECTOR PENSION INVESTMENT BOARD | ANNUAL REPORT 2017 133

PUBLIC SERVICE PENSION PLAN ACCOUNTNotes to the Financial Statements for the years ended March 31, 2017 and 2016
4 FINANCIAL ASSETS AND FINANCIAL LIABILITIES (continued)
4.1. CLASSES OF FINANCIAL ASSETS AND FINANCIAL LIABILITIES (continued)
4.1.11. Derivative-Related Assets and Liabilities (continued)
The following table summarizes the derivatives portfolio as at:
March 31, 2017 March 31, 2016
(Canadian $ millions) Notional Value
Fair Value
Notional Value
Fair Value
Assets Liabilities Assets Liabilities
Equity and commodity derivativesListed
Futures $ 1,019 $ – $ – $ 486 $ – $ –Warrants and rights 2 6 – 2 3 –Options: Purchased 2,810 23 – 1,092 14 –
Written 2,355 – (20) 1,013 – (17)OTC
Total return swaps 21,006 184 (78) 15,146 687 (24)Variance swaps 3 3 (4) – – –Options: Purchased 1,385 35 – 4,223 48 –
Written 1,348 – (32) 4,263 – (39)Currency derivatives
ListedFutures 99 – – 127 – –
OTCForwards 20,439 72 (220) 31,556 1,229 (170)Swaps 3,333 12 (32) 2,359 14 (229)Options: Purchased 6,970 65 – 6,371 75 –
Written 7,082 – (50) 7,794 – (63)Interest rate derivatives
ListedFutures 5,764 – – 5,421 – –Options: Purchased 24,974 4 – 1,721 1 –
Written 27,559 – (2) 14,849 – (2)OTC
Bond forwards – – – 236 1 –Interest rate swaps 9,021 114 (69) 8,146 117 (144)Inflation swaps – – – 394 3 (4)Swaptions 20,420 104 (67) 21,117 110 (110)Options: Purchased 16,581 25 – 6,139 7 –
Written 22,971 – (22) 9,161 – (9)OTC-cleared
Interest rate swaps 28,388 – – 5,766 – –Inflation swaps 45 – – – – –
Credit derivativesA
OTCCredit default swaps: Purchased 788 – (13) 1,301 5 (16)
Sold 216 3 – 373 2 (14)OTC-cleared
Credit default swaps: Purchased 603 – – 455 – –Sold 862 – – 1,046 – –
Total $ 650 $ (609) $ 2,316 $ (841)
A PSP Investments, through sold credit derivatives, indirectly guarantees the underlying reference obligations. The maximum potential exposure is the notional amount of the sold credit derivatives as shown in the table above.
ANNUAL REPORT 2017 | PUBLIC SECTOR PENSION INVESTMENT BOARD134

PUBLIC SERVICE PENSION PLAN ACCOUNTNotes to the Financial Statements for the years ended March 31, 2017 and 2016
4 FINANCIAL ASSETS AND FINANCIAL LIABILITIES (continued)
4.1. CLASSES OF FINANCIAL ASSETS AND FINANCIAL LIABILITIES (continued)
4.1.11. Derivative-Related Assets and Liabilities (continued)
Total derivative-related assets and liabilities are comprised of:
March 31, 2017 March 31, 2016
(Canadian $ millions) Notional Value
Fair Value
Notional Value
Fair Value
Assets Liabilities Assets Liabilities
Listed derivatives $ 64,582 $ 33 $ (22) $ 24,711 $ 18 $ (19)OTC derivatives 131,563 617 (587) 118,579 2,298 (822)OTC-cleared derivatives 29,898 – – 7,267 – –
Total $ 650 $ (609) $ 2,316 $ (841)
The term to maturity based on notional value for the derivatives was as follows as at March 31:
(Canadian $ millions) 2017 2016
Less than 3 months $ 80,326 $ 69,5953 to 12 months 75,079 40,780Over 1 year 70,638 40,182
4.2. FAIR VALUE HIERARCHY
4.2.1. Classification
Financial assets and financial liabilities described under Note 4.1 are classified within the fair value hierarchy, described as follows, based on the lowest level of input that is significant to the fair value measurement as a whole.
· Level 1 inputs are quoted prices (unadjusted) in active markets for identical assets or liabilities that PSP Investments can access at the end of the reporting period.
· Level 2 inputs are inputs other than quoted prices included within Level 1 that are observable for the asset or the liability, either directly or indirectly. Level 2 inputs include:
(i) Quoted prices for similar assets or liabilities in active markets.
(ii) Quoted prices for identical or similar assets or liabilities in markets that are not active.
(iii) Inputs other than quoted prices that are observable for the asset or liability.
(iv) Market-corroborated inputs.
· Level 3 inputs are unobservable inputs for the asset or liability that are used within model-based techniques. They reflect management’s assessment of the assumptions that market participants would use in pricing the assets or liabilities.
The classification within the levels of the hierarchy is established at the time of the initial determination of fair value of the asset or liability and reviewed at the end of each reporting period. PSP Investments determines whether a transfer between levels has occurred and recognizes such transfer at the beginning of the reporting period.
PUBLIC SECTOR PENSION INVESTMENT BOARD | ANNUAL REPORT 2017 135

PUBLIC SERVICE PENSION PLAN ACCOUNTNotes to the Financial Statements for the years ended March 31, 2017 and 2016
4 FINANCIAL ASSETS AND FINANCIAL LIABILITIES (continued)
4.2. FAIR VALUE HIERARCHY (continued)
4.2.1. Classification (continued)
The following table shows the fair value of financial assets and financial liabilities as at March 31, 2017 classified within the fair value hierarchy:
(Canadian $ millions) Level 1 Level 2 Level 3Total
Fair Value
Public marketsCanadian equity $ 3,975 $ 641 $ – $ 4,616Foreign equity 18,679 2,526 215 21,420
Private marketsReal estate – – 17,670 17,670Private equity – – 9,886 9,886Infrastructure – – 9,586 9,586Natural resources – – 3,100 3,100
Fixed incomeCash and money market securities – 8,980 – 8,980Government and corporate bonds – 15,636 187 15,823Inflation-linked bonds – 5,608 – 5,608Private debt securities – – 6,645 6,645Other fixed income securities – 2,396 12 2,408
Alternative investments – 1,107 4,712 5,819
$ 22,654 $ 36,894 $ 52,013 $ 111,561
Investment-related assetsAmounts receivable from pending trades $ – $ 832 $ – $ 832Interest receivable – 231 – 231Dividends receivable – 96 – 96Securities purchased under reverse repurchase agreements – 1,926 – 1,926Derivative-related assets 33 617 – 650
$ 33 $ 3,702 $ – $ 3,735
Investments representing financial assets at FVTPL $ 22,687 $ 40,596 $ 52,013 $ 115,296
Investment-related liabilitiesAmounts payable from pending trades $ – $ (781) $ – $ (781)Interest payable – (28) – (28)Securities sold short and securities loaned (2,082) (4,679) – (6,761)Securities sold under repurchase agreements – (804) – (804)Derivative-related liabilities (22) (587) – (609)
Investment-related liabilities representing financial liabilities at FVTPL $ (2,104) $ (6,879) $ – $ (8,983)
BorrowingsCapital market debt financing $ – $ (7,846) $ – $ (7,846)
Borrowings representing financial liabilities designated at FVTPL $ – $ (7,846) $ – $ (7,846)
Net investments $ 20,583 $ 25,871 $ 52,013 $ 98,467
ANNUAL REPORT 2017 | PUBLIC SECTOR PENSION INVESTMENT BOARD136

PUBLIC SERVICE PENSION PLAN ACCOUNTNotes to the Financial Statements for the years ended March 31, 2017 and 2016
4 FINANCIAL ASSETS AND FINANCIAL LIABILITIES (continued)
4.2. FAIR VALUE HIERARCHY (continued)
4.2.1. Classification (continued)
The following table shows the fair value of financial assets and financial liabilities as at March 31, 2016 classified within the fair value hierarchy:
(Canadian $ millions) Level 1 Level 2 Level 3Total
Fair Value
Public marketsCanadian equity $ 4,094 $ 526 $ – $ 4,620Foreign equity 15,586 3,288 – 18,874
Private marketsReal estate – – 16,306 16,306Private equity – – 8,160 8,160Infrastructure – – 6,893 6,893Natural resources – – 2,200 2,200
Fixed incomeCash and money market securities – 4,293 – 4,293Government and corporate bonds – 14,261 205 14,466Inflation-linked bonds – 5,372 – 5,372Private debt securities – – 3,846 3,846Other fixed income securities – 1,404 509 1,913
Alternative investments – 891 3,916 4,807
$ 19,680 $ 30,035 $ 42,035 $ 91,750
Investment-related assetsAmounts receivable from pending trades $ – $ 320 $ – $ 320Interest receivable – 162 – 162Dividends receivable – 75 – 75Securities purchased under reverse repurchase agreements – 777 – 777Derivative-related assets 18 2,298 – 2,316
$ 18 $ 3,632 $ – $ 3,650
Investments representing financial assets at FVTPL $ 19,698 $ 33,667 $ 42,035 $ 95,400
Investment-related liabilitiesAmounts payable from pending trades $ – $ (418) $ – $ (418)Interest payable – (19) – (19)Securities sold short (1,600) (330) – (1,930)Securities sold under repurchase agreements – (1,043) – (1,043)Derivative-related liabilities (19) (822) – (841)
Investment-related liabilities representing financial liabilities at FVTPL $ (1,619) $ (2,632) $ – $ (4,251)
BorrowingsCapital market debt financing $ – $ (6,421) $ – $ (6,421)
Borrowings representing financial liabilities designated at FVTPL $ – $ (6,421) $ – $ (6,421)
Net investments $ 18,079 $ 24,614 $ 42,035 $ 84,728
PUBLIC SECTOR PENSION INVESTMENT BOARD | ANNUAL REPORT 2017 137

PUBLIC SERVICE PENSION PLAN ACCOUNTNotes to the Financial Statements for the years ended March 31, 2017 and 2016
4 FINANCIAL ASSETS AND FINANCIAL LIABILITIES (continued)
4.2. FAIR VALUE HIERARCHY (continued)
4.2.2. Process for Level 3 Fair Value Determination
The valuation process is monitored and governed by an internal valuation committee (“VC”). This committee is responsible for overseeing all aspects of fair value determination. This includes establishing valuation methodologies and procedures for each type of investment and ensuring they are complied with. Valuation methodologies established are based on widely recognized practices that are consistent with professional appraisal standards. Such standards include, among others, the International Private Equity and Venture Capital Valuation Guidelines, the Canadian Uniform Standards of Professional Appraisal Practice and the Uniform Standards of Professional Appraisal Practice in the United States of America.
The fair value of investments classified as Level 3 is determined at least annually. Quarterly, the fair value is reviewed and adjusted, as appropriate, to reflect the impact of any significant market or investment-specific events or circumstances. For each investment, the relevant valuation methodology is applied consistently over time as appropriate in the prevailing circumstances. The appropriateness of significant changes in valuation methodologies is reviewed by the VC.
In cases where the services of third-party appraisers are used, management ensures their independence and that valuation methods used are consistent with professional appraisal standards outlined above. In validating the work performed by appraisers, management ensures that the assumptions used correspond to financial information and forecasts of the underlying investment.
With respect to fund investments classified as Level 3, the annual fair value is generally determined based on audited financial statements received from the fund’s general partner. In certain cases fair value is obtained from information provided by the fund’s administrators and is reviewed by Management to ensure reasonableness and adherence to acceptable industry valuation methods. Where necessary, the impact of restrictions on the sale or redemption of such investments is taken into consideration in determining fair value.
ANNUAL REPORT 2017 | PUBLIC SECTOR PENSION INVESTMENT BOARD138

PUBLIC SERVICE PENSION PLAN ACCOUNTNotes to the Financial Statements for the years ended March 31, 2017 and 2016
4 FINANCIAL ASSETS AND FINANCIAL LIABILITIES (continued)
4.2. FAIR VALUE HIERARCHY (continued)
4.2.3. Level 3 Significant Inputs
The following table outlines key information with respect to significant inputs related to financial assets and financial liabilities categorized within Level 3 as at March 31, 2017:
Financial Assets and Financial Liabilities
Type of Investment
Fair Value (Canadian $ millions)
Significant Valuation Techniques
Significant Unobservable Inputs
Range (Weighted Average)
Public marketsForeign equity Direct
investments$ 215 Net asset value
method (NAV)AN/A N/A
Private marketsReal estate Direct and
co-investments$16,638 Discounted cash
flow (DCF)Discount rateB, C 4.50% – 25.00% (8.06%)
Terminal capitalization rateB, C 4.25% – 10.25% (6.04%)
Direct capitalization Capitalization rateB, D 2.75% – 8.00% (5.69%)
Stabilized occupancy rateD, E 94.00% – 100.00% (97.77%)
Sales comparison approach
Price per square footD, E $2.82 – $1,115.10 ($153.82)
NAVA N/A N/A
Transaction price N/A N/A
Fund investments $ 1,032 NAVA N/A N/A
Other private markets Direct and co-investments
$15,711 DCF Discount rateB 5.91% – 12.70% (9.36%)
Market comparables N/A N/A
NAVA N/A N/A
Transaction price N/A N/A
Fund investments $ 6,861 NAVA N/A N/A
Fixed incomeCorporate bonds Convertible bonds $ 187 DCF Discount rateB 3.90% – 14.10% (7.50%)
Private debt securities Direct and co-investments
$ 3,529 DCF Discount rateB 4.49% – 12.25% (9.07%)
NAVA N/A N/A
Transaction price N/A N/A
Fund investments $ 3,116 NAVA N/A N/A
Other fixed income Asset-backed term notes
$ 12 Third-party pricingA N/A N/A
Alternative investments
Fund investments $ 4,712 NAVA N/A N/A
Total $52,013
A In certain cases, fair value is determined by third parties where valuation information is not available to PSP Investments.
B An increase (decrease) in this unobservable input, taken individually, generally results in a decrease (increase) in fair value.
C An increase (decrease) in the discount rate is generally accompanied by an increase (decrease) of the terminal capitalization rate.
D There is no predictable direct relationship between this input and any other significant unobservable input.
E An increase (decrease) in this unobservable input, taken individually, generally results in an increase (decrease) in fair value.
PUBLIC SECTOR PENSION INVESTMENT BOARD | ANNUAL REPORT 2017 139

PUBLIC SERVICE PENSION PLAN ACCOUNTNotes to the Financial Statements for the years ended March 31, 2017 and 2016
4 FINANCIAL ASSETS AND FINANCIAL LIABILITIES (continued)
4.2. FAIR VALUE HIERARCHY (continued)
4.2.3. Level 3 Significant Inputs (continued)
The following table outlines key information with respect to significant inputs related to financial assets and financial liabilities categorized within Level 3 as at March 31, 2016:
Financial Assets and Financial Liabilities
Type of Investment
Fair Value (Canadian $ millions)
Significant Valuation Techniques
Significant Unobservable Inputs
Range (Weighted Average)
Private marketsReal estate Direct and
co-investments$15,258 DCF Discount rateB, C 5.25% – 25.00% (8.27%)
Terminal capitalization rateB, C 4.25% – 14.00% (6.29%)
Direct capitalization Capitalization rateB, D 3.25% – 7.50% (5.91%)
Stabilized occupancy rateD, E 93.00% – 100.00% (96.84%)
Sales comparison approach
Price per square footD, E $25.00 – $665.89 ($170.43)
NAVA N/A N/A
Transaction price N/A N/A
Fund investments $ 1,048 NAVA N/A N/A
Other private markets Direct and co-investments
$11,664 DCF Discount rateB 5.20% – 12.50% (9.70%)
Market comparables N/A N/A
NAVA N/A N/A
Transaction price N/A N/A
Fund investments $ 5,589 NAVA N/A N/A
Fixed incomeCorporate bonds Convertible bonds $ 205 DCF Discount rateB 3.70% – 13.50% (6.30%)
Private debt securities Direct and co-investments
$ 1,315 DCF Discount rateB 8.00% – 13.50% (11.09%)
NAVA N/A N/A
Transaction price N/A N/A
Fund investments $ 2,531 NAVA N/A N/A
Other fixed income Asset-backed term notes
$ 509 Third-party pricingA N/A N/A
Alternative investments
Fund investments $ 3,916 NAVA N/A N/A
Total $42,035
A In certain cases, fair value is determined by third parties where valuation information is not available to PSP Investments.
B An increase (decrease) in this unobservable input, taken individually, generally results in a decrease (increase) in fair value.
C An increase (decrease) in the discount rate is generally accompanied by an increase (decrease) of the terminal capitalization rate.
D There is no predictable direct relationship between this input and any other significant unobservable input.
E An increase (decrease) in this unobservable input, taken individually, generally results in an increase (decrease) in fair value.
ANNUAL REPORT 2017 | PUBLIC SECTOR PENSION INVESTMENT BOARD140
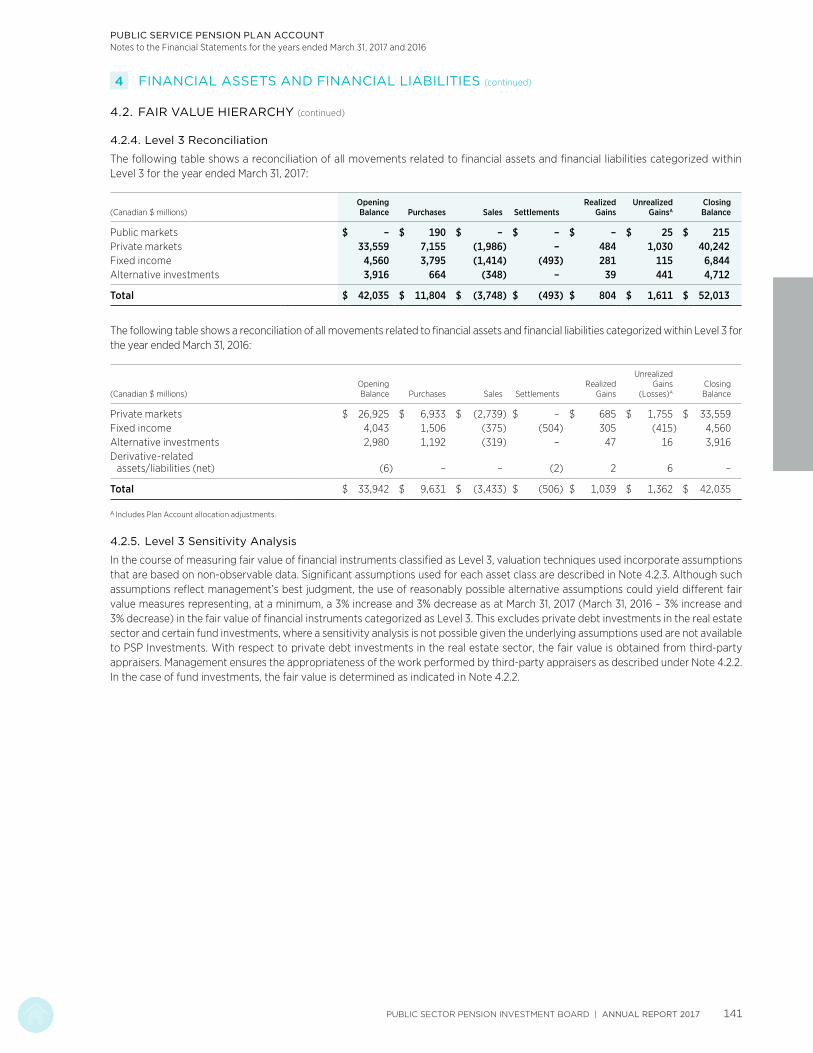
PUBLIC SERVICE PENSION PLAN ACCOUNTNotes to the Financial Statements for the years ended March 31, 2017 and 2016
4 FINANCIAL ASSETS AND FINANCIAL LIABILITIES (continued)
4.2. FAIR VALUE HIERARCHY (continued)
4.2.4. Level 3 Reconciliation
The following table shows a reconciliation of all movements related to financial assets and financial liabilities categorized within Level 3 for the year ended March 31, 2017:
(Canadian $ millions)OpeningBalance Purchases Sales Settlements
Realized Gains
Unrealized GainsA
Closing Balance
Public markets $ – $ 190 $ – $ – $ – $ 25 $ 215Private markets 33,559 7,155 (1,986) – 484 1,030 40,242Fixed income 4,560 3,795 (1,414) (493) 281 115 6,844Alternative investments 3,916 664 (348) – 39 441 4,712
Total $ 42,035 $ 11,804 $ (3,748) $ (493) $ 804 $ 1,611 $ 52,013
The following table shows a reconciliation of all movements related to financial assets and financial liabilities categorized within Level 3 for the year ended March 31, 2016:
(Canadian $ millions)Opening Balance Purchases Sales Settlements
Realized Gains
Unrealized Gains
(Losses)AClosing Balance
Private markets $ 26,925 $ 6,933 $ (2,739) $ – $ 685 $ 1,755 $ 33,559Fixed income 4,043 1,506 (375) (504) 305 (415) 4,560Alternative investments 2,980 1,192 (319) – 47 16 3,916Derivative-related
assets/liabilities (net) (6) – – (2) 2 6 –
Total $ 33,942 $ 9,631 $ (3,433) $ (506) $ 1,039 $ 1,362 $ 42,035
A Includes Plan Account allocation adjustments.
4.2.5. Level 3 Sensitivity Analysis
In the course of measuring fair value of financial instruments classified as Level 3, valuation techniques used incorporate assumptions that are based on non-observable data. Significant assumptions used for each asset class are described in Note 4.2.3. Although such assumptions reflect management’s best judgment, the use of reasonably possible alternative assumptions could yield different fair value measures representing, at a minimum, a 3% increase and 3% decrease as at March 31, 2017 (March 31, 2016 – 3% increase and 3% decrease) in the fair value of financial instruments categorized as Level 3. This excludes private debt investments in the real estate sector and certain fund investments, where a sensitivity analysis is not possible given the underlying assumptions used are not available to PSP Investments. With respect to private debt investments in the real estate sector, the fair value is obtained from third-party appraisers. Management ensures the appropriateness of the work performed by third-party appraisers as described under Note 4.2.2. In the case of fund investments, the fair value is determined as indicated in Note 4.2.2.
PUBLIC SECTOR PENSION INVESTMENT BOARD | ANNUAL REPORT 2017 141

PUBLIC SERVICE PENSION PLAN ACCOUNTNotes to the Financial Statements for the years ended March 31, 2017 and 2016
5 COLLATERAL PLEDGED AND RECEIVED
PSP Investments is party to agreements that involve pledging and holding collateral, as outlined in Notes 2.3.5, 2.3.6 and 7.2.1. The following table illustrates the fair values of the Plan Account’s allocated collateral, as well as the securities under the lending and borrowing programs and the securities under the repurchase and reverse repurchase agreements, as at:
(Canadian $ millions) March 31, 2017 March 31, 2016
Securities lending and borrowingSecurities lent $ 9,613 $ 6,647Collateral heldA 10,239 7,096Securities borrowed 2,093 1,661Collateral pledgedB 2,193 1,745
Securities repurchase and reverse repurchase agreements Securities sold under repurchase agreements 806 1,047Collateral pledged 805 1,043Securities purchased under reverse repurchase agreements 1,932 777Collateral heldC 1,928 777
Derivative contracts Collateral pledged 224 208Collateral heldD 165 1,582
A The minimum fair value of cash collateral required is equal to 102% of the fair value of the securities lent, and in the case of securities collateral 105%. As part of collateral held, cash amounted to $3,688 million for the Plan Account as at March 31, 2017 (March 31, 2016 – $1,511 million) and securities amounted to $6,551 million as at March 31, 2017 (March 31, 2016 – $5,585 million). All cash collateral is reinvested.
B The minimum fair value of collateral required is equal to 100% of the fair value of the securities borrowed.
C The collateral received is in the form of securities of which $984 million has been used in connection with short selling transactions as at March 31, 2017 (March 31, 2016 – $329 million) and $150 million has been used in connection with securities sold under repurchase agreements (March 31, 2016 – nil).
D As part of collateral held, cash amounted to $7 million as at March 31, 2017 (March 31, 2016 – nil) and securities amounted to $158 million as at March 31, 2017 (March 31, 2016 – $1,582 million). All cash collateral is reinvested.
ANNUAL REPORT 2017 | PUBLIC SECTOR PENSION INVESTMENT BOARD142

PUBLIC SERVICE PENSION PLAN ACCOUNTNotes to the Financial Statements for the years ended March 31, 2017 and 2016
6 INTERESTS IN OTHER ENTITIES
6.1. SUBSIDIARIES, JOINT VENTURES AND ASSOCIATES
As an investment entity, PSP Investments does not consolidate its subsidiaries other than those that solely provide it with services that relate to its investment activities. PSP Investments measures its investments in its subsidiaries, joint ventures and associates at FVTPL as described in Note 2.1.
For purposes of preparing this note, management assesses control, joint control and significant influence as follows:
(i) Control and significant influence
PSP Investments determines that it has control over an investee when it is exposed, or has rights, to variable returns from its investment in an entity and has the ability to affect those returns through its power over the investee.
In certain cases, PSP Investments does not have control over an investee but has the power to participate in the financial and operating policy decisions of the investee. In such cases, PSP Investments determines that it has significant influence over the investee.
In the context of control or significant influence, power over an investee is obtained through voting rights conveyed by PSP Investments’ ownership interest, other contractual arrangements, or a combination thereof.
(ii) Joint control
PSP Investments determines that it is party to a joint venture arrangement when it has joint control over an investee and has rights to the net assets of the investee. Joint control is established through a contractual arrangement which requires the unanimous consent of the parties sharing control for the activities that significantly affect the returns of the arrangement.
Generally, decision making regarding such activities is governed through voting rights conveyed by the ownership interest of each party. In certain cases, it is governed solely through contractual arrangements or in conjunction with the ownership interest of each party.
In the normal course of business, investments in private markets are commonly held through investment entity subsidiaries formed by PSP Investments. As at March 31, 2017, 103 investment entity subsidiaries were incorporated in North America, 23 in Europe, 10 in Oceania, 4 in Central and South America, 1 in Africa and 1 in Asia (March 31, 2016 – 102 in North America, 19 in Europe, 10 in Oceania, 4 in Central and South America and 1 in Africa).
In addition, PSP Investments controlled 77 investees directly or through its investment entity subsidiaries as at March 31, 2017 (March 31, 2016 – 73 investees).
PUBLIC SECTOR PENSION INVESTMENT BOARD | ANNUAL REPORT 2017 143
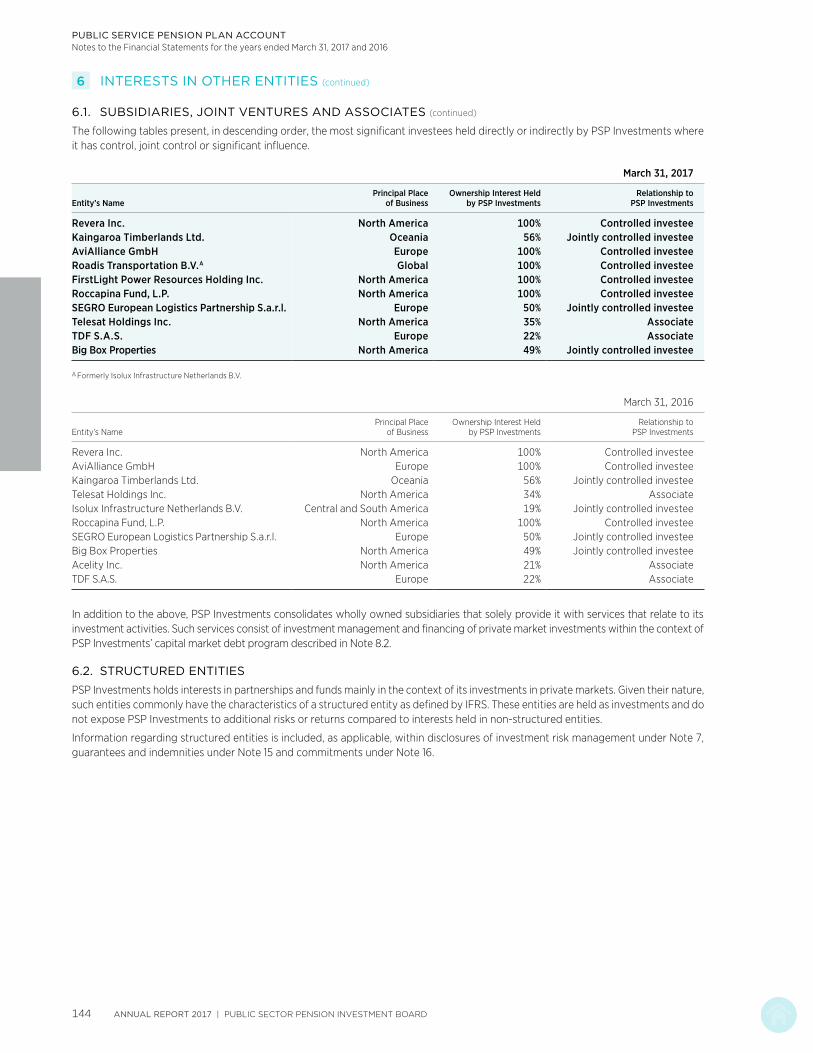
PUBLIC SERVICE PENSION PLAN ACCOUNTNotes to the Financial Statements for the years ended March 31, 2017 and 2016
6 INTERESTS IN OTHER ENTITIES (continued)
6.1. SUBSIDIARIES, JOINT VENTURES AND ASSOCIATES (continued)
The following tables present, in descending order, the most significant investees held directly or indirectly by PSP Investments where it has control, joint control or significant influence.
March 31, 2017
Entity’s NamePrincipal Place
of BusinessOwnership Interest Held
by PSP InvestmentsRelationship to
PSP Investments
Revera Inc. North America 100% Controlled investeeKaingaroa Timberlands Ltd. Oceania 56% Jointly controlled investeeAviAlliance GmbH Europe 100% Controlled investeeRoadis Transportation B.V.A Global 100% Controlled investeeFirstLight Power Resources Holding Inc. North America 100% Controlled investeeRoccapina Fund, L.P. North America 100% Controlled investeeSEGRO European Logistics Partnership S.a.r.l. Europe 50% Jointly controlled investeeTelesat Holdings Inc. North America 35% AssociateTDF S.A.S. Europe 22% AssociateBig Box Properties North America 49% Jointly controlled investee
A Formerly Isolux Infrastructure Netherlands B.V.
March 31, 2016
Entity’s NamePrincipal Place
of BusinessOwnership Interest Held
by PSP InvestmentsRelationship to
PSP Investments
Revera Inc. North America 100% Controlled investeeAviAlliance GmbH Europe 100% Controlled investeeKaingaroa Timberlands Ltd. Oceania 56% Jointly controlled investeeTelesat Holdings Inc. North America 34% AssociateIsolux Infrastructure Netherlands B.V. Central and South America 19% Jointly controlled investeeRoccapina Fund, L.P. North America 100% Controlled investeeSEGRO European Logistics Partnership S.a.r.l. Europe 50% Jointly controlled investeeBig Box Properties North America 49% Jointly controlled investeeAcelity Inc. North America 21% AssociateTDF S.A.S. Europe 22% Associate
In addition to the above, PSP Investments consolidates wholly owned subsidiaries that solely provide it with services that relate to its investment activities. Such services consist of investment management and financing of private market investments within the context of PSP Investments’ capital market debt program described in Note 8.2.
6.2. STRUCTURED ENTITIES
PSP Investments holds interests in partnerships and funds mainly in the context of its investments in private markets. Given their nature, such entities commonly have the characteristics of a structured entity as defined by IFRS. These entities are held as investments and do not expose PSP Investments to additional risks or returns compared to interests held in non-structured entities.
Information regarding structured entities is included, as applicable, within disclosures of investment risk management under Note 7, guarantees and indemnities under Note 15 and commitments under Note 16.
ANNUAL REPORT 2017 | PUBLIC SECTOR PENSION INVESTMENT BOARD144

PUBLIC SERVICE PENSION PLAN ACCOUNTNotes to the Financial Statements for the years ended March 31, 2017 and 2016
7 INVESTMENT RISK MANAGEMENT
PSP Investments is required to act in the best interests of the contributors and beneficiaries under the Plans and for maximizing returns without undue risk of loss. In pursuit of this objective, PSP Investments established an Enterprise Risk Management Policy (ERM Policy). The ERM Policy provides a framework for identifying, evaluating, managing, mitigating, monitoring and reporting the investment and non-investment risks to which PSP Investments is exposed.
As part of the overall ERM policy, the Investment Risk Management Policy (IRM Policy) supports the management of risk inherent to the investment decision making process. The IRM Policy outlines a framework that is designed to ensure that investment activities respect PSP Investments’ risk philosophy and align with the tolerance and limits of its risk appetite. The IRM Policy also supplements the Statement of Investment Policies, Standards and Procedures (SIP&P), whose objective is to effectively manage investment risks related to the implementation of PSP Investments’ various investment strategies. Investment risks include market, credit and liquidity risks.
7.1. MARKET RISK
Market risk is the risk that the value of an investment will fluctuate as a result of an adverse financial outcome due to changes in the factors that drive that value, such as changes in market prices, changes caused by factors specific to the individual investment, volatility in share and commodity prices, interest rate, foreign exchange or other factors affecting similar securities traded in the market.
7.1.1. Measurement of Market Risk
Effective April 1, 2016, the absolute annualized volatility of the total portfolio was implemented as the primary measure of market risk. The absolute volatility is a statistical measure of the size of changes in investment returns of a given investment or portfolio of investments. It is used to illustrate the potential loss of value in an investment or portfolio of investments as a result of fluctuations in market prices. Prior to April 1, 2016, PSP Investments used the Value at Risk (VaR) as the primary measure of market risk.
PSP Investments uses seven years’ worth of market returns scaled to a twelve-month holding period to calculate the absolute volatility. For investments that are not actively traded, the calculation of the absolute volatility uses securities with similar risk attributes as a proxy.
The absolute volatility is statistically valid under normal market conditions and does not specifically consider losses from severe market events. It also assumes that the future will behave in a pattern similar to the past. Consequently, if future market conditions differ significantly from those of the past, potential losses may differ from those originally estimated.
The following table shows the absolute volatility of the total portfolio expressed as a percentage of net investments as at the end of the period:
March 31, 2017 March 31, 2016
Absolute volatility 7.6% 8.5%A
A Since the absolute volatility was used effective April 1, 2016, the market risk measure as at March 31, 2016 was changed in the above table for comparability purposes. Prior to April 1, 2016, PSP Investments used the VaR as the primary measure of market risk. The total portfolio VaR as at March 31, 2016 was 23.6%.
Stress Testing
Although the absolute volatility is a widely accepted risk measure, it is complemented by other risk measurement methodologies that provide greater insight on market risk. PSP Investments uses stress testing and scenario analysis to examine the impact on financial results of abnormally large movements in risk factors. Such techniques are used to test a portfolio’s sensitivity to various risk factors and key model assumptions. These methods also use historically stressed periods to evaluate how a current portfolio reacts under such circumstances. Stress testing and scenario analysis are also deployed to assess new product performance.
PUBLIC SECTOR PENSION INVESTMENT BOARD | ANNUAL REPORT 2017 145

PUBLIC SERVICE PENSION PLAN ACCOUNTNotes to the Financial Statements for the years ended March 31, 2017 and 2016
7 INVESTMENT RISK MANAGEMENT (continued)
7.1. MARKET RISK (continued)
7.1.2. Interest Rate Risk
Interest rate risk refers to the risk that fluctuations in interest rates will directly affect the fair value of the Plan Account’s net asset values.
The terms to maturity of the classes of financial instruments, outlined in Note 4.1, with the most significant exposure to interest rate risk were as follows as at:
March 31, 2017
(Canadian $ millions)Less than
1 Year1 to 5 Years
5 to 10 Years
Over 10 Years Other Total
Cash and money market securities $ – $ – $ – $ – $ 8,980A $ 8,980Government and corporate bonds 1,774 6,846 4,424 2,779 – 15,823Inflation-linked bonds 3 1,316 2,081 2,208 – 5,608Private debt securities 57 650 2,579 – 3,359B 6,645Other fixed income securities 13 15 – – 2,380C 2,408
Total fixed income $ 1,847 $ 8,827 $ 9,084 $ 4,987 $ 14,719 $ 39,464
March 31, 2016
(Canadian $ millions)Less than
1 Year1 to 5 Years
5 to 10 Years
Over 10 Years Other Total
Cash and money market securities $ – $ – $ – $ – $ 4,293A $ 4,293Government and corporate bonds 802 7,053 3,617 2,994 – 14,466Inflation-linked bonds 18 1,197 1,788 2,369 – 5,372Private debt securities 3 880 224 – 2,739B 3,846Other fixed income securities 528 145 1 – 1,239C 1,913
Total fixed income $ 1,351 $ 9,275 $ 5,630 $ 5,363 $ 8,271 $ 29,890
A Due to their nature, these investments are not significantly exposed to interest rate risk.
B Information in connection with the terms to maturity of fund and certain directly held investments included as part of private debt securities is not available.
C Certain corporate bonds, asset-backed securities and floating rate notes are not significantly exposed to interest rate risk as their prescribed rates are variable.
The terms to maturity of PSP Investments’ capital market debt financing are disclosed in Note 8.2.
Alternative investments, reverse repurchase agreements, as well as derivative contracts described in Notes 4.1.4, 4.1.9 and 4.1.11, respectively, are also subject to interest rate risk exposures. These exposures are reflected in the absolute volatility calculation described in Note 7.1.1.
ANNUAL REPORT 2017 | PUBLIC SECTOR PENSION INVESTMENT BOARD146
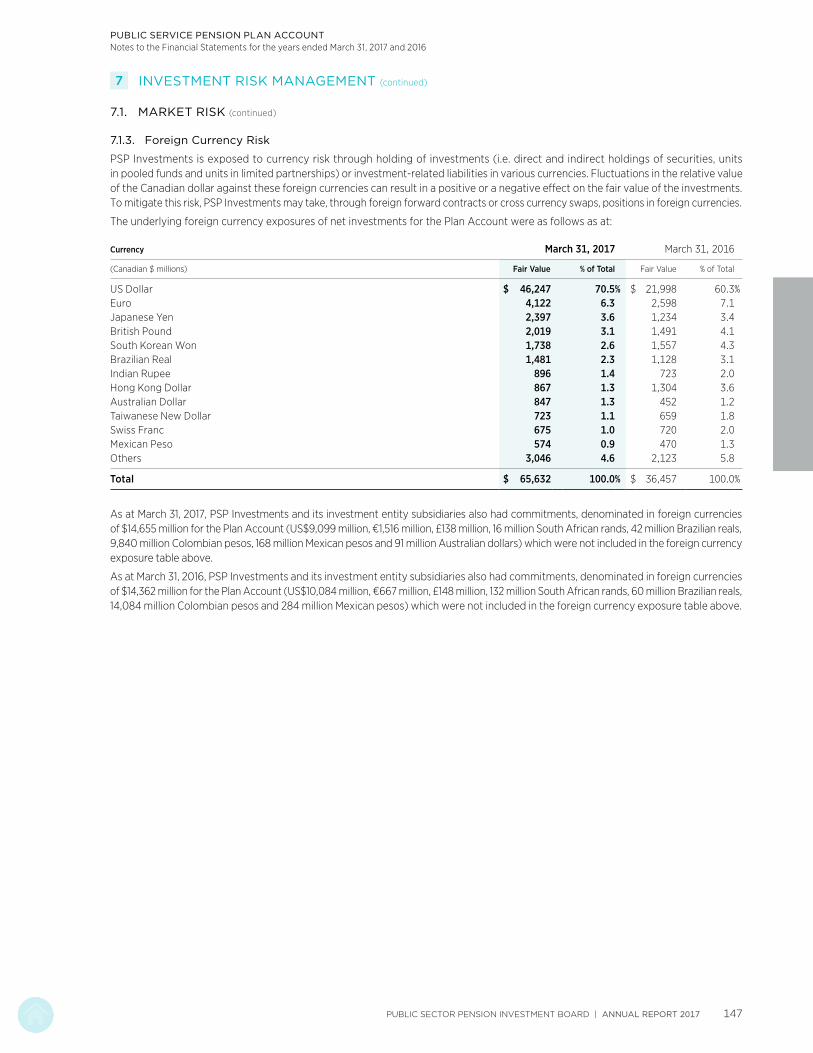
PUBLIC SERVICE PENSION PLAN ACCOUNTNotes to the Financial Statements for the years ended March 31, 2017 and 2016
7 INVESTMENT RISK MANAGEMENT (continued)
7.1. MARKET RISK (continued)
7.1.3. Foreign Currency Risk
PSP Investments is exposed to currency risk through holding of investments (i.e. direct and indirect holdings of securities, units in pooled funds and units in limited partnerships) or investment-related liabilities in various currencies. Fluctuations in the relative value of the Canadian dollar against these foreign currencies can result in a positive or a negative effect on the fair value of the investments. To mitigate this risk, PSP Investments may take, through foreign forward contracts or cross currency swaps, positions in foreign currencies.
The underlying foreign currency exposures of net investments for the Plan Account were as follows as at:
Currency March 31, 2017 March 31, 2016
(Canadian $ millions) Fair Value % of Total Fair Value % of Total
US Dollar $ 46,247 70.5% $ 21,998 60.3%Euro 4,122 6.3 2,598 7.1Japanese Yen 2,397 3.6 1,234 3.4British Pound 2,019 3.1 1,491 4.1South Korean Won 1,738 2.6 1,557 4.3Brazilian Real 1,481 2.3 1,128 3.1Indian Rupee 896 1.4 723 2.0Hong Kong Dollar 867 1.3 1,304 3.6Australian Dollar 847 1.3 452 1.2Taiwanese New Dollar 723 1.1 659 1.8Swiss Franc 675 1.0 720 2.0Mexican Peso 574 0.9 470 1.3Others 3,046 4.6 2,123 5.8
Total $ 65,632 100.0% $ 36,457 100.0%
As at March 31, 2017, PSP Investments and its investment entity subsidiaries also had commitments, denominated in foreign currencies of $14,655 million for the Plan Account (US$9,099 million, €1,516 million, £138 million, 16 million South African rands, 42 million Brazilian reals, 9,840 million Colombian pesos, 168 million Mexican pesos and 91 million Australian dollars) which were not included in the foreign currency exposure table above.
As at March 31, 2016, PSP Investments and its investment entity subsidiaries also had commitments, denominated in foreign currencies of $14,362 million for the Plan Account (US$10,084 million, €667 million, £148 million, 132 million South African rands, 60 million Brazilian reals, 14,084 million Colombian pesos and 284 million Mexican pesos) which were not included in the foreign currency exposure table above.
PUBLIC SECTOR PENSION INVESTMENT BOARD | ANNUAL REPORT 2017 147

PUBLIC SERVICE PENSION PLAN ACCOUNTNotes to the Financial Statements for the years ended March 31, 2017 and 2016
7 INVESTMENT RISK MANAGEMENT (continued)
7.2. CREDIT RISK
PSP Investments is exposed to credit risk, which is the risk of non-performance of a debtor on whom PSP Investments relies to fulfill contractual or financial obligations. That is, the risk that the issuer of a debt security or that the counterparty to a derivative contract, to a securities lending and borrowing transaction or to securities purchased under reverse repurchase agreements, is unable to meet its financial obligations.
Credit risk encompasses the risk of a deterioration of creditworthiness and the relevant concentration risk. Credit risk monitoring entails an evaluation of the credit quality of each issuer and counterparty that transacts with PSP Investments. To perform this evaluation for public issuers and counterparties, PSP Investments relies on four recognized credit rating agencies. A minimum of two credit ratings are used to classify each security. If the agencies disagree as to a security’s credit quality, PSP Investments uses the lowest of the available ratings. For private issuers, PSP Investments assigns internal credit ratings to issuers and measures the combined risk profile against set targets. To assign risk ratings to issuers, PSP Investments uses methodologies comparable to those used by recognized rating agencies.
As at March 31, 2017, the Plan Account’s maximum exposure to credit risk amounted to $40 billion (March 31, 2016 – $32 billion). This amount is presented before collateral held and netting arrangements that do not qualify for offsetting under IFRS. The maximum credit exposure excludes guarantees disclosed in Note 15 as well as investments in funds classified as alternative investments in note 4.1. Such funds hold fixed income securities among other types of instruments.
To monitor the evolution of credit risk, PSP Investments periodically produces a concentration report by credit rating for credit-sensitive securities. The concentration of credit risk by credit rating was as follows as at March 31:
Credit Rating 2017 2016
AAA-AA 54.2% 50.7%A 20.0 27.9BBB 4.5 9.1BB or below 19.9 10.5No ratingA 1.4 1.8
Total 100.0% 100.0%
A Includes securities for public issuers and counterparties, that are either not rated by credit rating agencies or rated by a single credit rating agency. ABTNs are rated by a single agency and are classified according to their rating within the table.
ANNUAL REPORT 2017 | PUBLIC SECTOR PENSION INVESTMENT BOARD148

PUBLIC SERVICE PENSION PLAN ACCOUNTNotes to the Financial Statements for the years ended March 31, 2017 and 2016
7 INVESTMENT RISK MANAGEMENT (continued)
7.2. CREDIT RISK (continued)
7.2.1. Counterparty Risk
Counterparty risk represents the credit risk from current and potential exposure related to transactions involving derivative contracts, securities lending and borrowing as well as securities repurchase and reverse repurchase agreements. In order to minimize counterparty risk, PSP Investments requires that counterparties provide adequate collateral and meet its credit rating requirements. PSP Investments frequently monitors the credit rating of its counterparties as determined by recognized credit rating agencies. With respect to derivative contracts, PSP Investments has the ability to terminate all trades with most counterparties whose credit rating is downgraded below its requirements.
For OTC derivatives, PSP Investments’ policy also requires the use of the International Swaps and Derivative Association (ISDA) Master Agreement with all counterparties to derivative contracts. The ISDA Master Agreement provides the contractual framework within which dealing activities across a full range of OTC products are conducted. In the case of OTC-cleared derivatives, trading activities are regulated between parties under terms that are customary to such transactions.
As a credit mitigation technique, the ISDA Master Agreement contractually binds counterparties to close-out netting provisions in the case of default by one of the counterparties. Additionally, the Credit Support Annex (CSA) to the ISDA Master Agreement enables PSP Investments to realize any collateral placed with it in the case of default of the counterparty. The CSA also requires PSP Investments to contribute further collateral when requested. All collateral transactions under the CSA are in cash, high-quality debt instruments or securities. The CSA also regulates the exchange of collateral when the credit exposure to a counterparty exceeds a predetermined threshold. Counterparties are generally authorized to sell, repledge or otherwise use collateral held. Similarly, in the case of OTC-cleared derivatives, collateral is required in cash, high quality debt instruments or securities and can be sold, repledged or otherwise used. PSP Investments does not sell, repledge or otherwise use any collateral held in the form of securities but does reinvest all cash collateral, with respect to derivative contracts.
With respect to transactions involving securities lending and borrowing agreements as well as securities repurchase and reverse repurchase agreements, collateral requirements are in place to mitigate counterparty risk. Notes 2.3.5 and 2.3.6 describe collateral requirements in securities lending and borrowing programs as well as securities repurchase and reverse repurchase agreements.
Information in connection with collateral pledged by PSP Investments and its counterparties is disclosed in Note 5.
In the case of the securities lending program, PSP Investments’ exposure to counterparty risk is further mitigated as the custodian of the securities lent assumes the risk that a counterparty will be unable to meet its obligations associated with the collateral requirements.
Management is responsible for counterparty risk monitoring and mitigation as well as maintaining a comprehensive, disciplined, and enterprise-wide process for tracking and managing counterparty risk. As such, management measures counterparty risk on an ongoing basis, evaluates and tracks the creditworthiness of current counterparties and mitigates counterparty risk through collateral management.
PUBLIC SECTOR PENSION INVESTMENT BOARD | ANNUAL REPORT 2017 149

PUBLIC SERVICE PENSION PLAN ACCOUNTNotes to the Financial Statements for the years ended March 31, 2017 and 2016
7 INVESTMENT RISK MANAGEMENT (continued)
7.2. CREDIT RISK (continued)
7.2.2. Offsetting
PSP Investments is subject to ISDA Master Agreements in relation to its OTC derivative financial instruments as described. Such agreements contain close-out netting provisions applicable only in the case of default. In certain cases, such agreements also allow for offsetting. In cases where the conditions for offsetting were met, financial instruments have been presented net in the Statements of Financial Position. Securities repurchase and reverse repurchase agreements described in Notes 2.3.6 and 5 are subject to similar arrangements though are not offset.
The following tables present the financial assets and liabilities described above:
Financial Assets
(Canadian $ millions)
Gross Amount of
Recognized Financial
Assets
Less: Gross Amount of
Recognized Financial
Liabilities Set-Off
Net Amount of Financial
Assets Presented in the
Statements of Financial Position
Less: Related Amounts Not Set-Off in the Statements
of Financial Position
Net
Recognized Financial
Liabilities
Collateral Held and Not
Recognized
March 31, 2017Reverse repurchase agreements $ 1,926 $ – $ 1,926A $ 150 $ 1,776 $ –OTC-derivatives 622 5 617B 442 126 49
Total $ 2,548 $ 5 $ 2,543 $ 592 $ 1,902 $ 49
March 31, 2016Reverse repurchase agreements $ 777 $ – $ 777A $ – $ 777 $ –OTC-derivatives 2,305 7 2,298B 691 1,524 83
Total $ 3,082 $ 7 $ 3,075 $ 691 $ 2,301 $ 83
Financial Liabilities
(Canadian $ millions)
Gross Amount of
Recognized Financial
Liabilities
Less: Gross Amount of
Recognized Financial
Assets Set-Off
Net Amount of Financial
Liabilities Presented in the
Statements ofFinancial Position
Less: Related Amounts Not Set-Off in the Statements
of Financial Position
Net
Recognized Financial
Assets
Collateral Pledged and Not
Derecognized
March 31, 2017Repurchase agreements $ 804 $ – $ 804A $ 150 $ 654 $ –OTC-derivatives 592 5 587B 442 134 11
Total $ 1,396 $ 5 $ 1,391 $ 592 $ 788 $ 11
March 31, 2016Repurchase agreements $ 1,043 $ – $ 1,043A $ – $ 1,043 $ –OTC-derivatives 829 7 822B 691 129 2
Total $ 1,872 $ 7 $ 1,865 $ 691 $ 1,172 $ 2
A As described in Note 4.1.
B As described in Note 4.1.11.
ANNUAL REPORT 2017 | PUBLIC SECTOR PENSION INVESTMENT BOARD150

PUBLIC SERVICE PENSION PLAN ACCOUNTNotes to the Financial Statements for the years ended March 31, 2017 and 2016
7 INVESTMENT RISK MANAGEMENT (continued)
7.3. LIQUIDITY RISK
Liquidity risk corresponds to the risk that PSP Investments will not be able to meet its financial obligations on a timely basis, with sufficient and readily available cash resources. PSP Investments’ cash position is monitored on a daily basis. In general, investments in cash, money market securities, floating rate notes, bonds and public equities are expected to be highly liquid as they will be invested in securities that are actively traded. Management utilizes appropriate measures and controls to monitor liquidity risk in order to ensure that there is sufficient liquidity to meet financial obligations as they come due. A liquidity report taking into consideration future forecasted cash flows is prepared and presented to senior management on a weekly basis. This ensures that sufficient cash reserves are available to meet forecasted cash outflows. Additionally, sufficient sources of liquidity are maintained for deployment in case of market disruption.
PSP Investments has the ability to raise additional capital through the use of its capital market debt program. This program allows PSP Investments to issue short-term promissory notes and medium-term notes. Note 8.2 provides additional information on the usage of the capital market debt program. Furthermore, PSP Investments maintains credit facilities for general corporate purposes. Note 8.1 provides additional information with respect to such credit facilities.
The terms to maturity of the notional amount of derivatives are disclosed in Note 4.1.11.
Financial Liabilities
The following tables present the fair value of non-derivative-related financial liabilities as well as derivative-related financial instruments, aggregated according to their maturities as at March 31, 2017 and excluding the impact of guarantees and indemnities disclosed in Note 15:
(Canadian $ millions)Less than 3 Months
3 to 12 Months
Over 1 Year Total
Non-derivative-related financial liabilitiesA
Amounts payable from pending trades $ (781) $ – $ – $ (781)Interest payable (26) (2) – (28)Securities sold short and securities loaned (6,761) – – (6,761)Securities sold under repurchase agreements (804) – – (804)Capital market debt financing (4,190) (900) (2,756) (7,846)Trade payable and other liabilities (112) (2) (54) (168)
Total $ (12,674) $ (904) $ (2,810) $ (16,388)
(Canadian $ millions)Less than 3 Months
3 to 12 Months
Over 1 Year Total
Derivative-related financial instrumentsDerivative-related assets $ 171 $ 245 $ 234 $ 650Derivative-related liabilitiesA (285) (131) (193) (609)
Total $ (114) $ 114 $ 41 $ 41
A Liabilities are presented in the earliest period in which the counterparty can request payment.
PUBLIC SECTOR PENSION INVESTMENT BOARD | ANNUAL REPORT 2017 151
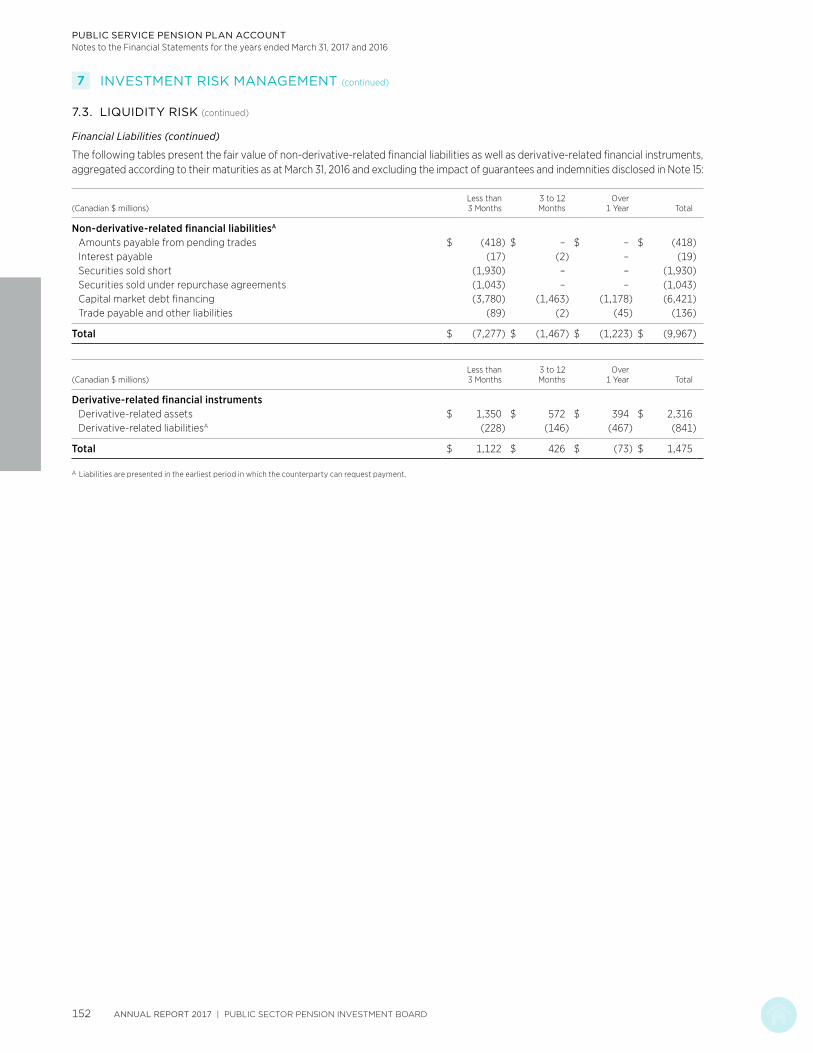
PUBLIC SERVICE PENSION PLAN ACCOUNTNotes to the Financial Statements for the years ended March 31, 2017 and 2016
7 INVESTMENT RISK MANAGEMENT (continued)
7.3. LIQUIDITY RISK (continued)
Financial Liabilities (continued)
The following tables present the fair value of non-derivative-related financial liabilities as well as derivative-related financial instruments, aggregated according to their maturities as at March 31, 2016 and excluding the impact of guarantees and indemnities disclosed in Note 15:
(Canadian $ millions)Less than 3 Months
3 to 12 Months
Over 1 Year Total
Non-derivative-related financial liabilitiesA
Amounts payable from pending trades $ (418) $ – $ – $ (418)Interest payable (17) (2) – (19)Securities sold short (1,930) – – (1,930)Securities sold under repurchase agreements (1,043) – – (1,043)Capital market debt financing (3,780) (1,463) (1,178) (6,421)Trade payable and other liabilities (89) (2) (45) (136)
Total $ (7,277) $ (1,467) $ (1,223) $ (9,967)
(Canadian $ millions)Less than 3 Months
3 to 12 Months
Over 1 Year Total
Derivative-related financial instrumentsDerivative-related assets $ 1,350 $ 572 $ 394 $ 2,316Derivative-related liabilitiesA (228) (146) (467) (841)
Total $ 1,122 $ 426 $ (73) $ 1,475
A Liabilities are presented in the earliest period in which the counterparty can request payment.
ANNUAL REPORT 2017 | PUBLIC SECTOR PENSION INVESTMENT BOARD152

PUBLIC SERVICE PENSION PLAN ACCOUNTNotes to the Financial Statements for the years ended March 31, 2017 and 2016
8 BORROWINGS
8.1. CREDIT FACILITIES
During the year ended March 31, 2017, PSP Investments entered into a revolving credit facility in the amount of $2 billion and a demand line of credit in the amount of $1 billion (together “the Credit Facilities”).
The Credit Facilities are for general corporate purposes and are available in either Canadian or US currencies. Subject to customary terms and conditions, these Credit Facilities are available at variable interest rates such as the prime rate and the US base rate.
These Credit Facilities were not drawn upon as at the end of the reporting period.
8.2. CAPITAL MARKET DEBT FINANCING
PSP Investments’ capital market debt program consists of the private placement of short-term promissory notes as well as medium-term notes issued by PSP Capital Inc., a wholly-owned subsidiary of PSP Investments. The capital raised is primarily used to finance private market investments. It is unconditionally and irrevocably guaranteed by PSP Investments in accordance with its corporate leverage policy.
The maximum amount authorized by the Board of Directors for the capital market debt program is 10% of the net investments plus all recourse debt outstanding of PSP Investments at the time of commitment to issuance. Under this limit, the short-term promissory note component cannot exceed $3 billion for issuances in Canada and US$5 billion for issuances in the United States.
PSP Investments’ capital market debt financing was in compliance with the limits authorized by the Board of Directors during the years ended March 31, 2017 and March 31, 2016.
The following outlines the terms as well as the fair value of the notes issued under the capital market debt program allocated to the Plan Account as at:
March 31, 2017 March 31, 2016
(Canadian $ millions)
Capital Amounts
Payable at Maturity Fair Value
Capital Amounts
Payable at Maturity Fair Value
Short-term Canadian Dollar promissory notes, bearing interest between 0.57% and 0.78% and maturing within 26 and 273 days of issuance (March 31, 2016 – 56 and 185 days) $ 979 $ 977 $ 883 $ 881
Short-term US Dollar promissory notes, bearing interest between 0.68% and 1.16% and maturing within 30 and 266 days of issuance (March 31, 2016 – 63 and 196 days) 4,118 4,113 3,558 3,556
Medium-term notes Series 4, bearing interest of 2.26% per annum and matured on February 16, 2017 – – 653 661
Medium-term notes Series 5, bearing interest of 3.03% per annum and maturing on October 22, 2020 363 383 363 389
Medium-term notes Series 6, bearing variable interest of 3-month CDOR and matured on April 4, 2016 – – 145 145
Medium-term notes Series 7, bearing interest of 3.29% per annum and maturing on April 4, 2024 715 770 725 789
Medium-term notes Series 8, bearing interest of 1.34% per annum and maturing on August 18, 2021 907 897 – –
Medium-term notes Series 9, bearing interest of 2.09% per annum and maturing on November 22, 2023 704 706 – –
Total $ 7,786 $ 7,846 $ 6,327 $ 6,421
Unrealized losses in connection with borrowings amounted to $302 million for the year ended March 31, 2017 (unrealized gains of $396 million for the year ended March 31, 2016).
Interest expense, for the year ended March 31, was as follows:
(Canadian $ millions) 2017 2016
Short-term promissory notes $ 36 $ 15Medium-term notes 61 62
Total $ 97 $ 77
PUBLIC SECTOR PENSION INVESTMENT BOARD | ANNUAL REPORT 2017 153

PUBLIC SERVICE PENSION PLAN ACCOUNTNotes to the Financial Statements for the years ended March 31, 2017 and 2016
9 EQUITY
9.1. STATUTORY RIGHTS HELD BY THE GOVERNMENT OF CANADA
Pursuant to the Superannuation Acts, the Government of Canada is entitled to PSP Investments’ net assets allocated to each of the Plan Accounts for the purposes set out in the Superannuation Acts. The allocation of PSP Investments’ net assets and comprehensive income (loss) to each of the Plan Accounts at a point in time is based on the allocation policy outlined in Note 12.
9.2. FUND TRANSFERS
PSP Investments received fund transfers from the Government of Canada of $2,712 million for the year ended March 31, 2017 ($2,792 million for the year ended March 31, 2016) for the Fund, recorded in the Plan Account.
10 INVESTMENT-RELATED EXPENSES
Investment-related expenses allocated to the Plan Account are comprised of the following for the year ended March 31:
(Canadian $ millions) 2017 2016
Interest expense $ 109 $ 84Transaction costs 97 74External investment
management feesA 24 26Other (net) 31 12
Total $ 261 $ 196
A Consists of amounts incurred for investments in public markets that are paid directly by PSP Investments. Other fees are paid by certain pooled fund investments classified under alternative investments which amounted to $110 million for the year ended March 31, 2017 ($44 million for the year ended March 31, 2016). Such fees are embedded in the fair value of the funds.
Similarly, management fees related to investments in private markets and private debt securities are not paid directly by PSP Investments. Such fees, which generally vary between 0.1% and 2.0% of the total invested and/or committed amount, totaled $215 million for the year ended March 31, 2017 ($174 million for the year ended March 31, 2016). Such fees are embedded in the fair value of the investments.
11 OPERATING EXPENSES
Operating expenses allocated to the Plan Account consisted of the following for the year ended March 31:
(Canadian $ millions) 2017 2016
Salaries and employee benefits $ 152 $ 122Professional and consulting fees 45 33Premises and equipment 15 12Market data and
business applications 19 16Depreciation of equipment 22 19Custodial fees 3 3Other operating expenses 12 10
Total $ 268 $ 215
12 ALLOCATION OF COMPREHENSIVE INCOME (LOSS)
PSP Investments’ comprehensive income (loss) is allocated to each Plan Account as follows:
12.1. INVESTMENT INCOME
The investment income is allocated proportionately based upon the net investments of each Plan Account at the time the income was incurred.
12.2. EXPENSES
The Act requires that the costs of operation of PSP Investments be charged to the Plan Accounts. Under section 4(3) of the Act, the President of the Treasury Board shall determine to which Plan Account these costs will be charged, in consultation with the Minister of National Defence and the Minister of Public Safety and Emergency Preparedness. An allocation policy was developed which allocates the direct costs of investment activities, such as external investment management fees and custodial fees, to each Plan Account, based upon the net investments of each Plan Account at the time the expense was incurred.
Operating expenses and other comprehensive income (loss), excluding the direct cost of investment activities listed above, for the year ended March 31, were allocated in proportion to the annual amount of net investments of each Plan Account as follows:
2017 2016
Public Service Pension Plan Account 72.5% 72.6%
Canadian Forces Pension Plan Account 19.7 19.7
Royal Canadian Mounted Police Pension Plan Account 7.3 7.2
Reserve Force Pension Plan Account 0.5 0.5
Total 100.0% 100.0%
Expenses are paid by PSP Investments by way of advances from the Public Service Pension Plan Account, which are reimbursed by the other Plan Accounts on a quarterly basis.
ANNUAL REPORT 2017 | PUBLIC SECTOR PENSION INVESTMENT BOARD154
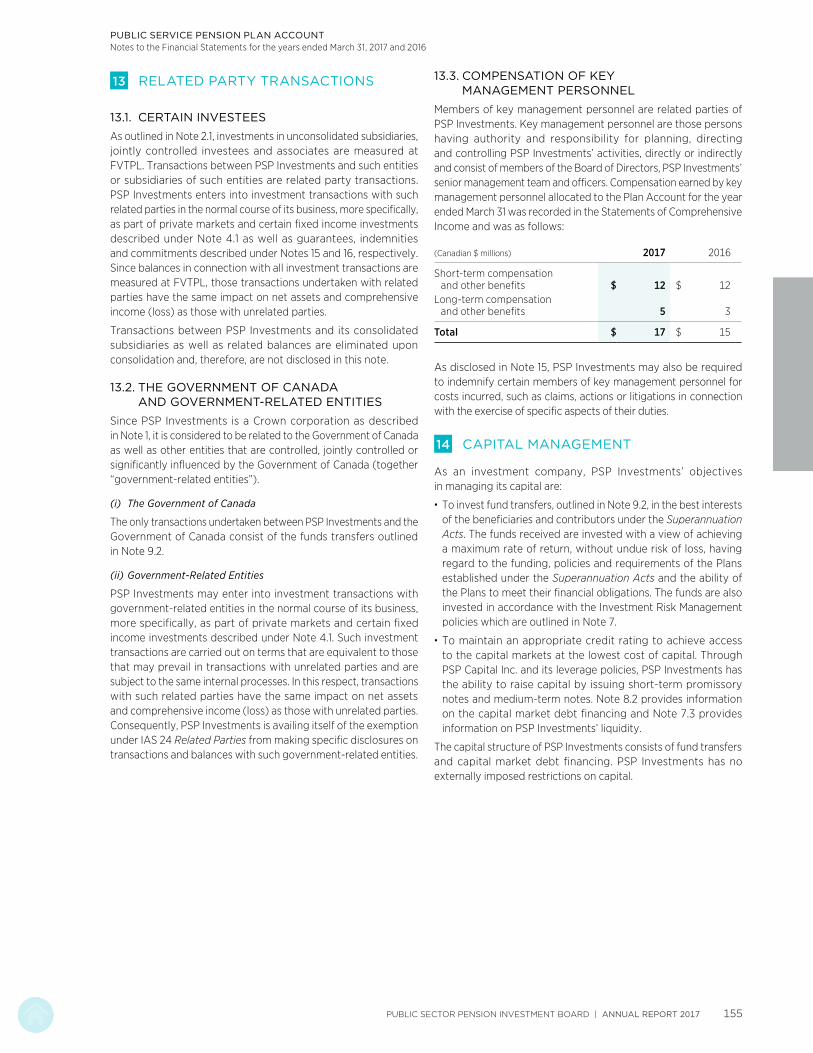
PUBLIC SERVICE PENSION PLAN ACCOUNTNotes to the Financial Statements for the years ended March 31, 2017 and 2016
13 RELATED PARTY TRANSACTIONS
13.1. CERTAIN INVESTEES
As outlined in Note 2.1, investments in unconsolidated subsidiaries, jointly controlled investees and associates are measured at FVTPL. Transactions between PSP Investments and such entities or subsidiaries of such entities are related party transactions. PSP Investments enters into investment transactions with such related parties in the normal course of its business, more specifically, as part of private markets and certain fixed income investments described under Note 4.1 as well as guarantees, indemnities and commitments described under Notes 15 and 16, respectively. Since balances in connection with all investment transactions are measured at FVTPL, those transactions undertaken with related parties have the same impact on net assets and comprehensive income (loss) as those with unrelated parties.
Transactions between PSP Investments and its consolidated subsidiaries as well as related balances are eliminated upon consolidation and, therefore, are not disclosed in this note.
13.2. THE GOVERNMENT OF CANADA AND GOVERNMENT-RELATED ENTITIES
Since PSP Investments is a Crown corporation as described in Note 1, it is considered to be related to the Government of Canada as well as other entities that are controlled, jointly controlled or significantly influenced by the Government of Canada (together “government-related entities”).
(i) The Government of Canada
The only transactions undertaken between PSP Investments and the Government of Canada consist of the funds transfers outlined in Note 9.2.
(ii) Government-Related Entities
PSP Investments may enter into investment transactions with government-related entities in the normal course of its business, more specifically, as part of private markets and certain fixed income investments described under Note 4.1. Such investment transactions are carried out on terms that are equivalent to those that may prevail in transactions with unrelated parties and are subject to the same internal processes. In this respect, transactions with such related parties have the same impact on net assets and comprehensive income (loss) as those with unrelated parties. Consequently, PSP Investments is availing itself of the exemption under IAS 24 Related Parties from making specific disclosures on transactions and balances with such government-related entities.
13.3. COMPENSATION OF KEY MANAGEMENT PERSONNEL
Members of key management personnel are related parties of PSP Investments. Key management personnel are those persons having authority and responsibility for planning, directing and controlling PSP Investments’ activities, directly or indirectly and consist of members of the Board of Directors, PSP Investments’ senior management team and officers. Compensation earned by key management personnel allocated to the Plan Account for the year ended March 31 was recorded in the Statements of Comprehensive Income and was as follows:
(Canadian $ millions) 2017 2016
Short-term compensation and other benefits $ 12 $ 12
Long-term compensation and other benefits 5 3
Total $ 17 $ 15
As disclosed in Note 15, PSP Investments may also be required to indemnify certain members of key management personnel for costs incurred, such as claims, actions or litigations in connection with the exercise of specific aspects of their duties.
14 CAPITAL MANAGEMENT
As an investment company, PSP Investments’ objectives in managing its capital are:
· To invest fund transfers, outlined in Note 9.2, in the best interests of the beneficiaries and contributors under the Superannuation Acts. The funds received are invested with a view of achieving a maximum rate of return, without undue risk of loss, having regard to the funding, policies and requirements of the Plans established under the Superannuation Acts and the ability of the Plans to meet their financial obligations. The funds are also invested in accordance with the Investment Risk Management policies which are outlined in Note 7.
· To maintain an appropriate credit rating to achieve access to the capital markets at the lowest cost of capital. Through PSP Capital Inc. and its leverage policies, PSP Investments has the ability to raise capital by issuing short-term promissory notes and medium-term notes. Note 8.2 provides information on the capital market debt financing and Note 7.3 provides information on PSP Investments’ liquidity.
The capital structure of PSP Investments consists of fund transfers and capital market debt financing. PSP Investments has no externally imposed restrictions on capital.
PUBLIC SECTOR PENSION INVESTMENT BOARD | ANNUAL REPORT 2017 155

PUBLIC SERVICE PENSION PLAN ACCOUNTNotes to the Financial Statements for the years ended March 31, 2017 and 2016
15 GUARANTEES AND INDEMNITIES
PSP Investments provides indemnification to its Directors, its Officers, its vice-presidents and to certain PSP Investments representatives who are asked to serve on boards of directors (or like bodies) or investment advisory boards (or like bodies) of entities in which PSP Investments or its investment entity subsidiaries have made an investment or have a financial interest. As a result, but subject to the Act, PSP Investments may be required to indemnify these representatives for costs incurred, such as claims, actions or litigation in connection with the exercise of their duties, unless the liability of such a representative relates to a failure to act honestly and in good faith. To date, PSP Investments has not received any claims or made any payment for such indemnities.
In certain cases, PSP Investments also provides indemnification to third parties in the normal course of business. As a result, PSP Investments may be required to indemnify such third parties in connection with the performance of their contractual obligations. To date, PSP Investments has not received any claims nor made any payments for such indemnities.
PSP Investments unconditionally and irrevocably guarantees all credit facilities, as well as short-term promissory notes and medium-term notes issued by PSP Capital Inc., as described in Note 8.
In certain investment transactions, PSP Investments and its investment entity subsidiaries provided guarantees, indemnifications or issued letters of credit to third parties, the most significant of which are as follows:
· As at March 31, 2017, PSP Investments and its investment entity subsidiaries agreed to guarantee and, in some cases, provide indemnification for the performance of certain investees under contractual agreements. The majority of these agreements are borrowing arrangements. In the event a default occurs under such agreements, which is of limited recourse in certain cases, PSP Investments or its investment entity subsidiaries could assume obligations of up to $2,077 million as at March 31, 2017 (March 31, 2016 – $1,891 million), of which $1,508 million has been allocated to the Plan Account (March 31, 2016 – $1,372 million) plus applicable interest and other related costs. The arrangements mature between May 2017 and September 2028.
· Additionally, PSP Investments and its investment entity subsidiaries issued letters of credit totalling $35 million as at March 31, 2017 (March 31, 2016 – $29 million), of which $25 million has been allocated to the Plan Account (March 31, 2016 – $21 million) in relation to investment transactions.
16 COMMITMENTS
PSP Investments and its investment entity subsidiaries have committed to enter into investment transactions, which will be funded over the next several years in accordance with agreed terms and conditions. The portion of PSP Investments’ commitments that would be assumed by the Plan Account was as follows as at March 31:
(Canadian $ millions) 2017 2016
Real estate $ 2,052 $ 1,749Private equity 6,580 5,142Infrastructure 2,723 2,895Natural resources 548 615Private debt securities 2,258 3,274Alternative investments 901 1,378
Total $ 15,062 $ 15,053
Funding in connection with the above commitments can be called upon at various dates extending until 2035 as at March 31, 2017 (March 31, 2016 – 2032).
ANNUAL REPORT 2017 | PUBLIC SECTOR PENSION INVESTMENT BOARD156

Canadian Forces Pension Plan Account
FINANCIAL STATEMENTS
Independent Auditors’ ReportTo the Minister of National Defence
Report on the Financial Statements
We have audited the accompanying financial statements of the Public Sector Pension Investment Board — Canadian Forces Pension Plan Account (the Canadian Forces Pension Plan Account), which comprise the statements of financial position as at March 31, 2017 and March 31, 2016, and the statements of comprehensive income, statements of changes in equity and statements of cash flows for the years then ended, and a summary of significant accounting policies and other explanatory information.
Management’s Responsibility for the Financial Statements
Management is responsible for the preparation and fair presentation of these financial statements in accordance with International Financial Reporting Standards as issued by the International Accounting Standards Board, and for such internal control as management determines is necessary to enable the preparation of financial statements that are free from material misstatement, whether due to fraud or error.
Auditor’s Responsibility
Our responsibility is to express an opinion on these financial statements based on our audits. We conducted our audits in accordance with Canadian generally accepted auditing standards. Those standards require that we comply with ethical requirements and plan and perform the audit to obtain reasonable assurance about whether the financial statements are free from material misstatement.
An audit involves performing procedures to obtain audit evidence about the amounts and disclosures in the financial statements. The procedures selected depend on the auditor’s judgment, including the assessment of the risks of material misstatement of the financial statements, whether due to fraud or error. In making those risk assessments, the auditor considers internal
control relevant to the entity’s preparation and fair presentation of the financial statements in order to design audit procedures that are appropriate in the circumstances, but not for the purpose of expressing an opinion on the effectiveness of the entity’s internal control. An audit also includes evaluating the appropriateness of accounting policies used and the reasonableness of accounting estimates made by management, as well as evaluating the overall presentation of the financial statements.
We believe that the audit evidence we have obtained in our audits is sufficient and appropriate to provide a basis for our audit opinion.
Opinion
In our opinion, the financial statements present fairly, in all material respects, the financial position of the Canadian Forces Pension Plan Account as at March 31, 2017 and March 31, 2016, and its financial performance and its cash flows for the years then ended in accordance with International Financial Reporting Standards as issued by the International Accounting Standards Board.
Report on Other Legal and Regulatory Requirements
As required by the Financial Administration Act, we report that, in our opinion, the accounting principles in International Financial Reporting Standards as issued by the International Accounting Standards Board have been applied on a basis consistent with that of the preceding year.
Further, in our opinion, the transactions in the Canadian Forces Pension Plan Account that have come to our notice during our audits of the financial statements have, in all significant respects, been in accordance with the applicable provisions of Part X of the Financial Administration Act and regulations, the Public Sector Pension Investment Board Act and regulations and the by-laws of the Public Sector Pension Investment Board and its wholly-owned subsidiaries.
Margaret Haire, CPA, CA Principal for the Auditor General of Canada
May 12, 2017 Ottawa, Canada
1 CPA auditor, CA, public accountancy permit No. A121444
May 12, 2017 Montréal, Canada
Canadian Forces Pension Plan Account
PUBLIC SECTOR PENSION INVESTMENT BOARD | ANNUAL REPORT 2017 157

CANADIAN FORCES PENSION PLAN ACCOUNT
Statements of Financial PositionAs at
(Canadian $ millions) March 31, 2017 March 31, 2016
AssetsInvestments (Note 4.1) $ 31,250 $ 25,925Other assets 32 28
Total assets $ 31,282 $ 25,953
LiabilitiesTrade payable and other liabilities $ 46 $ 37Investment-related liabilities (Note 4.1) 2,435 1,155Borrowings (Notes 4.1, 8.2) 2,127 1,745Due to the Public Service Pension Plan Account 21 17
Total liabilities $ 4,629 $ 2,954
Net assets $ 26,653 $ 22,999
Equity (Note 9) $ 26,653 $ 22,999
Total liabilities and equity $ 31,282 $ 25,953
The accompanying notes are an integral part of the Financial Statements.
On behalf of the Board of Directors:
Michael P. Mueller William A. MacKinnon Chair of the Board Chair of the Audit Committee
ANNUAL REPORT 2017 | PUBLIC SECTOR PENSION INVESTMENT BOARD158

CANADIAN FORCES PENSION PLAN ACCOUNT
Statements of Comprehensive Income For the years ended March 31
(Canadian $ millions) 2017 2016
Investment income $ 3,140 $ 270
Investment-related expenses (Note 10) (71) (54)
Net investment income $ 3,069 $ 216
Operating expenses (Note 11) (73) (58)
Net income $ 2,996 $ 158
Other comprehensive income (loss)Remeasurement of the net defined benefit liability (1) 1
Comprehensive income $ 2,995 $ 159
Statements of Changes in Equity For the years ended March 31
(Canadian $ millions) 2017 2016
Fund transfersBalance at beginning of period $ 13,017 $ 12,168Fund transfers received during the period (Note 9.2) 659 849
Balance at end of period $ 13,676 $ 13,017
Retained earningsBalance at beginning of period $ 9,982 $ 9,823Comprehensive income 2,995 159
Balance at end of period $ 12,977 $ 9,982
Total equity $ 26,653 $ 22,999
The accompanying notes are an integral part of the Financial Statements.
PUBLIC SECTOR PENSION INVESTMENT BOARD | ANNUAL REPORT 2017 159

CANADIAN FORCES PENSION PLAN ACCOUNT
Statements of Cash Flows For the years ended March 31
(Canadian $ millions) 2017 2016
Cash flows from operating activitiesNet income $ 2,996 $ 158Adjustments for non-cash items:
Depreciation of equipment (Note 11) 6 5Effect of exchange rate changes on cash and cash equivalents (9) 2Unrealized losses (gains) on borrowings 82 (107)
$ 3,075 $ 58
Net changes in operating assets and liabilitiesIncrease in investments $ (4,848) $ (1,354)Decrease in other assets 2 –Increase in trade payable and other liabilities 8 –Decrease (increase) in investment-related liabilities (1,280) 160
Net cash flows used in operating activities $ (3,043) $ (1,136)
Cash flow from financing activitiesProceeds from borrowings $ 5,211 $ 4,771Repayment of borrowings (4,911) (4,376)Repayment to the Public Service Pension Plan Account (83) (76)Advances from the Public Service Pension Plan Account 87 77Fund transfers received 659 849
Net cash flows provided by financing activities $ 963 $ 1,245
Cash flow from investing activitiesAcquisitions of equipment $ (9) $ (6)
Net cash flows used in investing activities $ (9) $ (6)
Net change in cash and cash equivalents $ 471 $ 103Effect of exchange rate changes on cash and cash equivalents 9 (2)Cash and cash equivalents at the beginning of the period 273 172
Cash and cash equivalents at the end of the periodA $ 753 $ 273
Supplementary disclosure of cash flow informationInterest paid $ (28) $ (23)
A As at March 31, 2017, cash and cash equivalents were comprised of $749 million (March 31, 2016 – $272 million) held for investment purposes and included in Note 4.1, as well as $4 million (March 31, 2016 – $1 million) held for administrative purposes and included in Other assets.
The accompanying notes are an integral part of the Financial Statements.
ANNUAL REPORT 2017 | PUBLIC SECTOR PENSION INVESTMENT BOARD160
1 CORPORATE INFORMATION
The Public Sector Pension Investment Board (“PSP Investments”) is a Crown corporation created under the Public Sector Pension Investment Board Act (the “Act”) to manage and invest amounts that are transferred to it pursuant to the Superannuation Acts (defined below), for the funds (as defined in the Act) of the pension plans established under the Public Service Superannuation Act, the Canadian Forces Superannuation Act (“CFSA”), the Royal Canadian Mounted Police Superannuation Act (collectively the “Superannuation Acts”), and certain regulations under the CFSA (the “CFSA Regulations”). The pension plans established under the Superannuation Acts consist of the Public Service pension plan, the Canadian Forces pension plan (the “Plan”), and the Royal Canadian Mounted Police pension plan, and the pension plan established under the CFSA Regulations is the Reserve Force pension plan. The Plan and the other pension plans are herein referred to collectively as the “Plans”.
The fund for which amounts are currently transferred to PSP Investments by the Government of Canada (the “Fund”) relates to pension obligations under the Plan for service on or after April 1, 2000 (“Post-2000 Service”). The account managed by PSP Investments for the Fund is herein referred to as the “Plan Account”. PSP Investments maintains records of the net contributions for the Fund, as well as the allocation of its investments and the results of its operations for the Fund in the Plan Account. PSP Investments also manages a plan account for the funds of the other Plans, and these and the Plan Account are collectively referred to herein as the “Plan Accounts”.
PSP Investments is responsible for managing amounts that are transferred to it for the Fund in the best interests of the beneficiaries and contributors under the Canadian Forces Superannuation Act. The amounts are to be invested with a view of achieving a maximum rate of return, without undue risk of loss, having regard to the funding, policies and requirements of the Plan and the Plan’s ability to meet its financial obligations.
Pursuant to the Canadian Forces Superannuation Act, the Government of Canada, which administers the Plan and the Fund, may at any time call upon the net assets of PSP Investments allocated to the Fund’s Plan Account for amounts required for the purpose of paying benefits under the Plan in respect of Post-2000 Service, or generally, for the purpose of reducing any non-permitted surplus in the Fund.
PSP Investments and the majority of its subsidiaries are exempt from Part I tax under paragraphs 149(1)(d) and 149(1)(d.2) of the Income Tax Act (Canada), respectively.
PSP Investments’ registered office is located at 1 Rideau Street, Ottawa, Ontario, Canada and its principal business office is at 1250 René Lévesque Boulevard West, Montreal, Quebec, Canada.
2 SIGNIFICANT ACCOUNTING POLICIES
The significant accounting policies that have been applied in the preparation of these Financial Statements are summarized below and have been used throughout all periods presented.
2.1. BASIS OF PRESENTATION
These Financial Statements have been prepared in accordance with International Financial Reporting Standards (“IFRS”) as issued by the International Accounting Standards Board (“IASB”).
PSP Investments qualifies as an investment entity as defined under IFRS 10 Consolidated Financial Statements and, consequently, does not consolidate its subsidiaries other than those that solely provide it with services that relate to its investment activities. Instead, PSP Investments measures its investments in subsidiaries at fair value through profit or loss (“FVTPL”) in accordance with IFRS 9 Financial Instruments (“IFRS 9”), including those that are formed by PSP Investments and that qualify as investment entities (“investment entity subsidiaries”). PSP Investments also measures its investments in associates, joint ventures and financial assets and financial liabilities at FVTPL in accordance with IAS 28 Investments in Associates and Joint Ventures and IFRS 9.
These Financial Statements present the Plan Account’s financial position and results of operations of PSP Investments and its subsidiaries that solely provide it with services that relate to its investment activities, as allocated to the Plan Account. They reflect the economic activity of PSP Investments as it pertains to the investment of the net contributions transferred to it for the Fund in respect of Post-2000 Service. Accordingly, they do not reflect all of the assets or the details of the pension contributions, payments and liabilities under the Plan.
These Financial Statements were authorized for issue in accordance with a resolution of the Board of Directors on May 12, 2017.
Notes to the Financial StatementsFor the years ended March 31, 2017 and 2016
CANADIAN FORCES PENSION PLAN ACCOUNT
PUBLIC SECTOR PENSION INVESTMENT BOARD | ANNUAL REPORT 2017 161
CANADIAN FORCES PENSION PLAN ACCOUNTNotes to the Financial Statements for the years ended March 31, 2017 and 2016
2 SIGNIFICANT ACCOUNTING POLICIES (continued)
2.2. INVESTMENT ENTITY STATUS
PSP Investments has determined that it meets the mandatory items of the definition of an investment entity under IFRS 10 on the basis of the facts and circumstances as at the end of the period. They are as follows:
(i) Mandate and business purpose
As further described in Note 1, PSP Investments’ mandate is to manage and invest the amounts that are transferred to it in the best interests of the beneficiaries and contributors under the Superannuation Acts. Consequently, PSP Investments’ business purpose is to invest with a view of achieving a maximum rate of return from capital appreciation and income from investments, without undue risk of loss.
(ii) Performance evaluation
PSP Investments measures and evaluates the performance of its investments on a fair value basis.
In addition to the mandatory items of the definition, IFRS 10 also outlines certain typical characteristics of an investment entity, the absence of any of which does not necessarily preclude an entity from qualifying as an investment entity. One of these characteristics is that an investment entity should have investors that are not related parties of the entity.
As described in Note 13, since PSP Investments is a Crown corporation, it is considered to be related to the Government of Canada as well as other entities that are controlled or jointly controlled by the Government of Canada or entities over which the latter has significant influence. Consequently, since the funds managed by PSP Investments originate from related parties, it may be considered not to meet the typical characteristic outlined above. However, the Act provides a framework to ensure that PSP Investments operates at arm’s length from the Government of Canada. Accordingly, it meets all of the mandatory items of the definition described above and qualifies as an investment entity.
Should any changes occur in the facts and circumstances, PSP Investments will evaluate the impact of any such changes on its investment entity status.
2.3. SUMMARY OF SIGNIFICANT ACCOUNTING POLICIES
The principal accounting policies applied in the preparation of these Financial Statements are set out below.
2.3.1. Financial Instruments
(i) Classification
Financial assets representing investments are managed, together with related financial liabilities, according to the entity’s business model to maximize the rate of return. The performance of such financial instruments is evaluated on a fair value basis and they are classified at FVTPL. They are described in detail in Note 4.1.
Borrowings as described under Note 8, are financial liabilities that are designated to be measured at FVTPL since they are part of the portfolios of investments that are managed together and whose performance is evaluated on a fair value basis.
(ii) Recognition
Financial assets and financial liabilities are recorded at the date upon which PSP Investments becomes a party to the associated contractual provisions. In the case of traded financial assets, they are recorded as of the trade date.
(iii) Initial and subsequent measurement
All financial assets and financial liabilities are recorded in the Statements of Financial Position at fair value and continue to be measured as such on a recurring basis. After initial measurement, subsequent changes in the fair value of financial assets and financial liabilities classified at FVTPL are recorded in the Statements of Comprehensive Income.
If fair value changes in financial liabilities designated to be measured at FVTPL result from fluctuations in PSP Investments’ own credit risk, they are recorded in other comprehensive income. All other changes in fair value are recorded in investment income.
(iv) Derecognition
A financial asset (or, where applicable, a part thereof) is derecognized when the following conditions are met:
· The rights to receive cash flows from the asset have expired, or
· PSP Investments has transferred its rights to receive cash flows from the asset or has assumed an obligation to pay the received cash flows to a third party,
and
· PSP Investments has transferred substantially all the risks and rewards of the asset, or
· In cases where PSP Investments has neither transferred nor retained substantially all the risks and rewards of the asset, it has transferred control of the asset.
A financial liability is derecognized when the obligation under the liability is discharged, cancelled or expired.
ANNUAL REPORT 2017 | PUBLIC SECTOR PENSION INVESTMENT BOARD162

CANADIAN FORCES PENSION PLAN ACCOUNTNotes to the Financial Statements for the years ended March 31, 2017 and 2016
2 SIGNIFICANT ACCOUNTING POLICIES (continued)
2.3. SUMMARY OF SIGNIFICANT ACCOUNTING POLICIES (continued)
2.3.2. Determination of Fair Value
Fair value is the price that would be received to sell an asset or paid to transfer a liability in an orderly transaction between market participants at the measurement date.
At initial recognition, PSP Investments evaluates the facts and circumstances related to a transaction to confirm that the transaction price represents the fair value of an asset or a liability. At each subsequent reporting date, market prices are used to determine fair value where an active market exists (such as a recognized securities exchange), as they reflect actual and regularly occurring market transactions on an arm’s length basis. If quoted market prices are not available, then fair value is estimated using valuation techniques based on inputs existing at the end of the reporting period that are derived from observable market data.
Valuation techniques are generally applied to investments in Private Markets, over-the-counter (OTC) derivatives and certain fixed income securities. The values derived from applying these techniques are impacted by the choice of valuation model and the underlying assumptions made concerning factors such as the amounts and timing of future cash flows, discount rates, volatility and credit risk. In certain cases, such assumptions are not supported by market observable data.
The determination of fair value of all financial assets and financial liabilities is described in Note 4.
2.3.3. Functional and Presentation Currency
The functional and presentation currency of PSP Investments and its consolidated subsidiaries is the Canadian dollar, which is the currency of the primary economic environment in which each entity within the consolidated group operates. PSP Investments’ performance and that of its consolidated subsidiaries is evaluated and its liquidity is managed in Canadian dollars.
2.3.4. Foreign Currency Translation
Foreign currency transactions during the period, including purchases and sales of securities, income and expenses, are translated at the rate of exchange prevailing on the date of the transaction.
Monetary assets and liabilities that are denominated in foreign currencies are translated at the functional currency rate of exchange prevailing at the end of the reporting period.
Foreign currency transaction gains and losses on all monetary assets and liabilities are included in investment income.
2.3.5. Securities Lending and Securities Borrowing and Related Collateral
PSP Investments participates in securities lending and borrowing programs whereby it lends and borrows securities in order to enhance portfolio returns. Lending and borrowing transactions including related collateral under such programs do not transfer the risks or rewards of ownership of the securities to the counterparty. Consequently, PSP Investments does not derecognize securities lent or pledged as collateral, or recognize securities borrowed or received as collateral. Cash collateral received is recognized as described in Note 4.1.8.
The securities lending and borrowing programs require collateral in cash, high-quality debt instruments or securities. Collateral transactions are conducted under terms that are usual and customary in standard securities lending and borrowing programs. PSP Investments and its counterparties are authorized to sell, repledge or otherwise use collateral held. The same securities or equivalent securities must be returned to the counterparty at the end of the contract, unless an event of default occurs.
2.3.6. Securities sold under Repurchase Agreements and purchased under Reverse Repurchase Agreements and Related Collateral
PSP Investments is party to repurchase and reverse repurchase agreements. Such agreements involve the sale of securities by one counterparty with a simultaneous agreement to repurchase such securities at a specified price and at a specified future date.
Securities sold or purchased under the repurchase and reverse repurchase agreements respectively, including related collateral, are not derecognized or recognized as all risks and rewards of ownership related to such securities are not transferred. As such, in the case where PSP Investments is the counterparty selling securities under such agreements, all income (loss) related to such securities continues to be reported in investment income and obligations to repurchase the securities sold are accounted for as investment-related liabilities. The difference between the fair value of the securities sold and the repurchase price is recorded as interest expense. In the case where PSP Investments is the counterparty purchasing securities under such agreements, no income (loss) related to such securities is recognized and obligations to resell the securities are accounted for as investment-related receivables. The difference between the fair value of the securities purchased and resale price is recorded in investment income.
Transactions under repurchase and reverse repurchase agreements involve pledging collateral consisting of cash or securities deemed acceptable by the counterparties. Collateral transactions are conducted under terms that are usual and customary in standard repurchase arrangements. Such terms require the relevant counterparty to pledge additional collateral based on the changes in the fair value of the existing collateral pledged as well as the related securities sold or purchased. The counterparties are authorized to sell, repledge or otherwise use collateral held. The securities pledged as collateral must be returned to the relevant counterparty at the end of the contract, unless an event of default occurs.
PUBLIC SECTOR PENSION INVESTMENT BOARD | ANNUAL REPORT 2017 163

CANADIAN FORCES PENSION PLAN ACCOUNTNotes to the Financial Statements for the years ended March 31, 2017 and 2016
2 SIGNIFICANT ACCOUNTING POLICIES (continued)
2.3. SUMMARY OF SIGNIFICANT ACCOUNTING POLICIES (continued)
2.3.7. Offsetting of Financial Instruments
Financial assets and financial liabilities are offset with the net amount reported in the Statements of Financial Position only if PSP Investments has a current legally enforceable right to offset the recognized amounts and the intent to settle on a net basis, or to realize the assets and settle the liabilities simultaneously.
2.3.8. Equity
The statutory rights of the Government of Canada pursuant to the Superannuation Acts are described under Note 1 and are classified as equity instruments on the following basis:
· Under such rights the Government of Canada is entitled to PSP Investments’ net assets at any time for the purposes set out in the Superannuation Acts. Such rights do not contain any additional obligations for PSP Investments to deliver amounts to the Government of Canada.
· Such rights are the most subordinate claim on PSP Investments’ net assets.
· The total expected cash flows attributable to such rights, at any time, is solely based on the fair value of the net assets of PSP Investments at that time. Further, the fair value of the net assets of PSP Investments in its entirety represents the amounts that the Government of Canada may call upon at any time.
2.3.9. Investment Income
Investment income is made up of interest, dividends, gains (losses) on the disposal of financial assets and financial liabilities as well as gains (losses) which reflect the change in unrealized appreciation (depreciation) of financial assets held and financial liabilities outstanding at the end of the reporting period. Interest is recognized, on a consistent basis, using the prescribed rates until maturity. Dividends are recognized when the right to receive them has been obtained, generally on the ex-dividend date.
2.3.10. Investment-Related Expenses
Investment-related expenses are made up of interest expense, as described in Note 4.1.7, transaction costs, external investment management fees and other (net).
Transaction costs are incremental costs directly attributable to the acquisition, due diligence, issue, or disposal of a financial asset or financial liability, and they are expensed as incurred.
External investment management fees are directly attributable to the external management of assets on behalf of PSP Investments. These fees are paid directly by PSP Investments and comprise base fees accrued as a percentage of the fair value of the assets managed externally and performance fees accrued as a function of various performance indicators. This excludes amounts not paid directly by PSP Investments for certain pooled fund investments classified under alternative investments and for investments in private markets and other fixed income securities as outlined in Note 10.
2.3.11. Fund Transfers
Amounts are received from the Government of Canada for the Fund and are recorded in the Plan Account.
2.4. SIGNIFICANT ACCOUNTING JUDGMENTS, ESTIMATES AND ASSUMPTIONS
In preparing the Financial Statements, management makes certain judgments, estimates and assumptions that can affect the amounts reported therein. Significant judgments include those related to the determination of the investment entity status as described in Note 2.2.
Management also makes estimates and assumptions in the measurement, risk assessment and related disclosures surrounding investments in private markets and certain fixed income securities. The main assumptions made by management regarding measurement of financial instruments are outlined in Note 4.2.3 and those regarding the assessment of risk are outlined in Note 7.
Although estimates and assumptions reflect management’s best judgment, actual results may differ from such estimates due to the uncertainties involved in using them.
ANNUAL REPORT 2017 | PUBLIC SECTOR PENSION INVESTMENT BOARD164

CANADIAN FORCES PENSION PLAN ACCOUNTNotes to the Financial Statements for the years ended March 31, 2017 and 2016
3 CURRENT AND FUTURE CHANGES IN ACCOUNTING STANDARDS
3.1. ACCOUNTING STANDARDS ADOPTED IN THE CURRENT YEAR
IFRS 11 Joint Arrangements
IFRS 11 was amended, effective for annual periods beginning on or after January 1, 2016, to add new guidance on the accounting for acquisitions of interests in a joint operation that constitutes a business. Acquirers of such interests shall apply all of the principles in business combinations accounting in IFRS 3 Business Combinations, and other IFRS, that do not conflict with the guidance in IFRS 11 and disclose the information that is required in those IFRS in relation to business combinations. On April 1, 2016, PSP Investments adopted this amendment with no impact on the presentation of the Financial Statements.
3.2. ACCOUNTING STANDARDS ADOPTED BEFORE THE EFFECTIVE DATE
IFRS 9 Financial Instruments
In 2014, the IASB completed its project to replace IAS 39 Financial Instruments: Recognition and Measurement with IFRS 9. The Standard includes requirements for recognition, derecognition, classification and measurement of financial assets and liabilities. IFRS 9 is effective for annual periods beginning on or after January 1, 2018 with early application permitted.
PSP Investments initially adopted IFRS 9 (2014) in its Consolidated Financial Statements for the year ended March 31, 2016. Significant accounting policies in connection with IFRS 9 are described under Note 2.3.1.
3.3. FUTURE ACCOUNTING STANDARDS
A number of new standards, amendments and interpretations have been issued by the IASB, but are not yet effective. The following relates to one or more of PSP Investments’ significant accounting policies or disclosures:
IAS 7 Statement of Cash Flows
IAS 7 was amended, effective for annual periods beginning on or after January 1, 2017, to add new guidance on disclosures that enable users of financial statements to evaluate changes in liabilities arising from financing activities, including both changes arising from cash flows and non-cash changes. PSP Investments will apply the amendments starting from April 1, 2017 and will make the required note disclosures in the Financial Statements.
IAS 28 Investment in Associates and Joint Ventures
IAS 28 was amended, effective for annual periods beginning on or after January 1, 2018, to add a clarification that serves to elaborate and clarify that the election to measure investees at fair value is available on an investment by investment basis and is not an election that must be applied consistently to the measurement of all associates and joint ventures. Management has determined that the amendment will not have an impact on the Financial Statements.
PUBLIC SECTOR PENSION INVESTMENT BOARD | ANNUAL REPORT 2017 165

CANADIAN FORCES PENSION PLAN ACCOUNTNotes to the Financial Statements for the years ended March 31, 2017 and 2016
4 FINANCIAL ASSETS AND FINANCIAL LIABILITIES
4.1. CLASSES OF FINANCIAL ASSETS AND FINANCIAL LIABILITIES
Financial assets and financial liabilities are aggregated, in the following table, in classes that reflect their respective exposure as well as investment sectors. Their fair values were as follows, as at:
(Canadian $ millions) March 31, 2017 March 31, 2016
Public marketsCanadian equity $ 1,252 $ 1,256Foreign equity 5,806 5,129
Private marketsReal estate 4,789 4,431Private equity 2,680 2,217Infrastructure 2,598 1,873Natural resources 840 598
Fixed incomeCash and money market securities 2,434 1,166Government and corporate bonds 4,289 3,932Inflation-linked bonds 1,520 1,459Private debt securitiesA 1,801 1,045Other fixed income securitiesA 653 520
Alternative investments 1,577 1,306
$ 30,239 $ 24,932
Investment-related assetsAmounts receivable from pending trades $ 225 $ 87Interest receivable 62 44Dividends receivable 26 21Securities purchased under reverse repurchase agreements 522 211Derivative-related assets 176 630
$ 1,011 $ 993
Investments representing financial assets at FVTPL $ 31,250 $ 25,925
Investment-related liabilitiesAmounts payable from pending trades $ (212) $ (113)Interest payable (8) (6)Securities sold short and securities loaned (1,833) (525)Securities sold under repurchase agreements (218) (283)Derivative-related liabilities (164) (228)
Investment-related liabilities representing financial liabilities at FVTPL $ (2,435) $ (1,155)
BorrowingsCapital market debt financing $ (2,127) $ (1,745)
Borrowings representing financial liabilities designated at FVTPL $ (2,127) $ (1,745)
Net investments $ 26,688 $ 23,025
A During the year ended March 31, 2017, private debt securities were reclassified out of other fixed income securities and into a standalone caption in order to better reflect their nature and common characteristics. Accordingly, comparative figures were adjusted to decrease other fixed income securities by $1,045 million and increase private debt securities by the same amount. Notes 4.2.1 and 4.2.3 were adjusted similarly.
4.1.1. Public Markets
Public markets consist of Canadian and foreign investments in the following securities: common shares, American depository receipts, global depository receipts, participation notes, preferred shares, income trust units, exchange traded funds units, pooled funds units, and securities convertible into common shares of publicly listed issuers.
Direct investments in Canadian and foreign equities are measured at fair value using quoted prices in active markets and are based on the most representative price within the bid-ask spread.
In the case of investments in pooled funds, fair value is measured using unit values obtained from each of the funds’ administrators, which are derived from the fair value of the underlying investments in each pooled fund. Management reviews the fair value received and, where necessary, the impact of restrictions on the sale or redemption of such investments is taken into consideration.
ANNUAL REPORT 2017 | PUBLIC SECTOR PENSION INVESTMENT BOARD166

CANADIAN FORCES PENSION PLAN ACCOUNTNotes to the Financial Statements for the years ended March 31, 2017 and 2016
4 FINANCIAL ASSETS AND FINANCIAL LIABILITIES (continued)
4.1. CLASSES OF FINANCIAL ASSETS AND FINANCIAL LIABILITIES (continued)
4.1.2. Private Markets
Private markets consist of investments in real estate, private equity, infrastructure and natural resources.
Real estate investments are comprised of direct equity positions in various private entities, fund investments, as well as properties in the real estate sector. Real estate investments focus on partnerships, companies and properties operating mainly in the retirement and residential, office, retail, and industrial sectors, as well as private funds invested in real estate assets. Real estate investments are presented net of all third-party financing. As at March 31, 2017, leverage in the form of third-party financing undertaken by investment entity subsidiaries and direct real estate investments controlled by PSP Investments was $1,369 million for the Plan Account (March 31, 2016 – $1,239 million).
Private equity investments are comprised of fund investments with similar objectives, co-investments in private entities as well as direct equity positions.
Infrastructure investments are comprised of direct equity positions, fund investments and co-investments in various private entities. Infrastructure investments focus on entities engaged in the management, ownership or operation of assets in energy, transportation and other regulated businesses. Infrastructure investments are presented net of all third-party financing. As at March 31, 2017, leverage in the form of third-party financing undertaken by direct infrastructure investments controlled by PSP Investments was $777 million for the Plan Account (March 31, 2016 – $314 million).
Natural resources investments are comprised of direct equity positions, fund investments and partnerships. Natural resources investments focus on entities engaged in the management, ownership or operation of assets in timberlands, agriculture and upstream oil and gas.
The process for fair value measurement of private markets investments is described in Note 4.2.2 and the valuation techniques together with the significant inputs used are described in Note 4.2.3.
4.1.3. Fixed Income
Fixed income consists of cash and money market securities, government and corporate bonds, inflation-linked bonds, private debt securities and other fixed income securities.
Cash and money market securities include instruments having a maximum term to maturity of one year, such as treasury bills, certificates of deposit and bankers’ acceptances. A portion of such instruments has maturities of 90 days or less and is held to meet short-term financial commitments. Such instruments are readily convertible into known amounts of cash and have an insignificant risk of change in value. They are considered cash and cash equivalents for purposes of the Statements of Cash Flows and amounted to $749 million as at March 31, 2017 (March 31, 2016 – $272 million). Treasury bills are valued based on prices obtained from third-party pricing sources. Such prices are determined using the most representative price within a spread of dealer quotations. Certificates of deposit and bankers’ acceptances are recorded at cost plus accrued interest, which approximates their fair value given their short-term nature.
Government and corporate bonds include Canadian and foreign, federal, provincial, territorial and municipal bonds. Inflation-linked bonds are fixed income securities that earn inflation-adjusted returns.
Private debt securities are fixed income securities of private companies held directly or through private funds. Such debt securities take the form of senior debt, mezzanine and distressed debt and primary and secondary investments in leveraged loans. Private debt securities also include third-party loans such as junior and senior debts, construction loans, bridge loans, income-participating loans, as well as other structured finance products in the real estate sector.
Other fixed income securities consist of asset-backed securities and floating rate notes.
Fair values of government and most corporate bonds, inflation-linked bonds, floating rate notes and mortgage-backed securities are based on prices obtained from third-party pricing sources. Such prices are determined using either an appropriate interest rate curve with a spread associated with the credit quality of the issuer or other generally accepted pricing methodologies.
Asset-backed securities consist mainly of asset-backed term notes (ABTNs) and mortgage-backed securities. The ABTNs were received in exchange for third-party or non-bank sponsored asset-backed commercial paper (ABCP) that suffered a liquidity disruption in mid-August 2007 and were subsequently restructured in January 2009.
The fair values of certain corporate bonds, private debt securities and ABTNs are determined using valuation techniques. Such techniques, together with the significant inputs used, are described in Note 4.2.3.
The fair value measurement of fund investments included as part of private debt securities is described in Note 4.2.2.
PUBLIC SECTOR PENSION INVESTMENT BOARD | ANNUAL REPORT 2017 167

CANADIAN FORCES PENSION PLAN ACCOUNTNotes to the Financial Statements for the years ended March 31, 2017 and 2016
4 FINANCIAL ASSETS AND FINANCIAL LIABILITIES (continued)
4.1. CLASSES OF FINANCIAL ASSETS AND FINANCIAL LIABILITIES (continued)
4.1.4. Alternative Investments
Alternative investments consist mainly of units of funds that hold a mix of equity, fixed income and derivative instruments as well as hedge funds. The fair value of these investments is determined based on the fair values reported by the funds’ administrators or general partners and reflects the fair value of the underlying equity, fixed income or derivative instruments, as applicable. Management reviews the fair value received and, where necessary, the impact of restrictions on the sale or redemption of such investments is taken into consideration.
4.1.5. Amounts Receivable and Payable from Pending Trades
Amounts receivable from pending trades consist of proceeds on sales of investments, excluding derivative financial instruments, which have been traded but remain unsettled at the end of the reporting period.
Amounts payable from pending trades consist of the cost of purchases of investments, excluding derivative financial instruments, which have been traded but remain unsettled at the end of the reporting period.
The fair value of amounts receivable and payable from pending trades reflects the value at which their underlying original sale or purchase transactions were undertaken.
4.1.6. Interest and Dividends Receivable
Interest and dividends are recorded at the amounts expected to be received at the end of the reporting period, which approximates fair value.
4.1.7. Interest Payable
With respect to the borrowings described in Note 4.1.10, interest is accrued at the amount expected to be paid at the end of the reporting period, which approximates fair value.
4.1.8. Securities Sold Short and Securities Loaned
Securities sold short reflect PSP Investments’ obligation to purchase securities pursuant to short selling transactions. In such transactions, PSP Investments sells securities it does not own with an obligation to purchase similar securities on the market to cover its position.
Using quoted market prices that are based on the most representative price within the bid-ask spread, the fair value of securities sold short is measured using the same method as the similar long positions presented within public markets and fixed income.
As part of securities lending and certain OTC derivative transactions, cash collateral is received and reinvested by PSP Investments. PSP Investments recognizes cash collateral received with a corresponding payable. The payable balance reflects the obligation of the transferee to return cash collateral to the transferor at the end of the transaction in the absence of an event of default by the transferor.
4.1.9. Securities Sold under Repurchase Agreements and Purchased under Reverse Repurchase Agreements
As described in Note 2.3.6, PSP Investments is party to repurchase and reverse repurchase agreements. Obligations to repurchase or resell the securities sold or purchased under such agreements are recorded at cost plus accrued interest, which approximates fair value.
4.1.10. Borrowings under the Capital Market Debt Program
PSP Investments’ capital market debt program is described in Note 8.2 Short-term promissory notes are recorded at cost plus accrued interest, which approximates fair value. The fair value of PSP Investments’ medium-term notes is based on prices that are obtained from third-party pricing sources. Such prices are determined using an interest rate curve with a spread consistent with PSP Investments’ credit quality.
ANNUAL REPORT 2017 | PUBLIC SECTOR PENSION INVESTMENT BOARD168
CANADIAN FORCES PENSION PLAN ACCOUNTNotes to the Financial Statements for the years ended March 31, 2017 and 2016
4 FINANCIAL ASSETS AND FINANCIAL LIABILITIES (continued)
4.1. CLASSES OF FINANCIAL ASSETS AND FINANCIAL LIABILITIES (continued)
4.1.11. Derivative-Related Assets and Liabilities
Derivative financial instruments are financial contracts that are settled at a future date. The value of such instruments is derived from changes in the value of the underlying assets, interest or exchange rates. Derivative financial instruments do not, typically, require an initial net investment. In certain cases, they require an initial net investment that is less than what would be required to hold the underlying position directly. Derivative financial instruments can be listed or traded OTC. OTC instruments consist of those that are bilaterally negotiated and settled, and those that are cleared (OTC-cleared) by a central clearing party (CCP).
PSP Investments uses derivative financial instruments to enhance returns or to replicate investments synthetically. Derivatives are also used to reduce the risk associated with existing investments.
PSP Investments uses the following types of derivative financial instruments:
Swaps
Swaps are transactions whereby two counterparties exchange cash flow streams with each other based on predetermined conditions that include a notional amount and a term. Swaps are used to increase returns or to adjust exposures of certain assets without directly purchasing or selling the underlying assets.
Futures
Futures are standardized contracts to take or make delivery of an asset (buy or sell) at a predefined price and predefined future date. Futures are used to adjust exposures to specified assets without directly purchasing or selling the underlying assets.
Forwards
Forwards are contracts involving the sale by one party and the purchase by another party of a predefined amount of an underlying instrument, at a predefined price and at a predefined date in the future. Forwards are used to adjust exposures to specified assets without directly purchasing or selling the underlying assets.
Options
Options are contracts where the seller gives the purchaser the right, but not the obligation, to buy or sell a given amount of an underlying security, index, or commodity, at an agreed-upon price stipulated in advance, either at a determined date or at any time before the predefined maturity date.
Warrants and Rights
Warrants are options to purchase an underlying asset which is in the form of a transferable security and which can be listed on an exchange.
Rights are securities giving shareholders entitlement to purchase new shares issued by a corporation at a predetermined price (normally less than the current market price) in proportion to the number of shares already owned. Rights are issued only for a short period of time, after which they expire.
Determination of Fair Value of Derivative Financial Instruments
Listed derivative financial instruments are recorded at fair value using quoted market prices that are based on the most representative price within the bid-ask spread. OTC-cleared derivatives are recorded at fair value using prices obtained from the CCP. OTC derivatives are valued using appropriate valuation techniques such as discounted cash flows. These techniques use significant inputs that are observable in the market such as current market yields.
Notional Values and Fair Values of Derivative-Related Assets and Liabilities
Notional values of derivative financial instruments are not recorded as assets or liabilities as they represent the face amount of the contract. Except for credit derivatives, notional values do not represent the potential gain or loss associated with the market or credit risk of such transactions disclosed below. Rather, they serve as the basis upon which the cash flows and the fair value of the contracts are determined.
PUBLIC SECTOR PENSION INVESTMENT BOARD | ANNUAL REPORT 2017 169
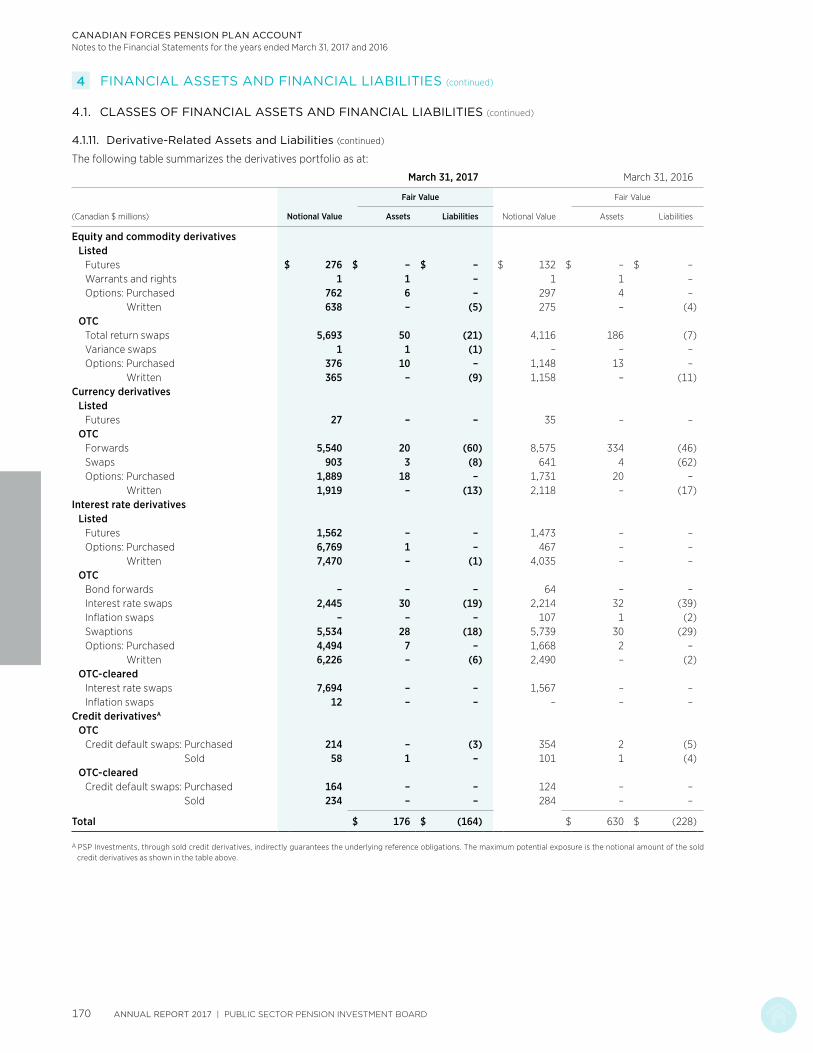
CANADIAN FORCES PENSION PLAN ACCOUNTNotes to the Financial Statements for the years ended March 31, 2017 and 2016
4 FINANCIAL ASSETS AND FINANCIAL LIABILITIES (continued)
4.1. CLASSES OF FINANCIAL ASSETS AND FINANCIAL LIABILITIES (continued)
4.1.11. Derivative-Related Assets and Liabilities (continued)
The following table summarizes the derivatives portfolio as at:
March 31, 2017 March 31, 2016
(Canadian $ millions) Notional Value
Fair Value
Notional Value
Fair Value
Assets Liabilities Assets Liabilities
Equity and commodity derivativesListed
Futures $ 276 $ – $ – $ 132 $ – $ –Warrants and rights 1 1 – 1 1 –Options: Purchased 762 6 – 297 4 –
Written 638 – (5) 275 – (4)OTC
Total return swaps 5,693 50 (21) 4,116 186 (7)Variance swaps 1 1 (1) – – –Options: Purchased 376 10 – 1,148 13 –
Written 365 – (9) 1,158 – (11)Currency derivatives
ListedFutures 27 – – 35 – –
OTCForwards 5,540 20 (60) 8,575 334 (46)Swaps 903 3 (8) 641 4 (62)Options: Purchased 1,889 18 – 1,731 20 –
Written 1,919 – (13) 2,118 – (17)Interest rate derivatives
ListedFutures 1,562 – – 1,473 – –Options: Purchased 6,769 1 – 467 – –
Written 7,470 – (1) 4,035 – –OTC
Bond forwards – – – 64 – –Interest rate swaps 2,445 30 (19) 2,214 32 (39)Inflation swaps – – – 107 1 (2)Swaptions 5,534 28 (18) 5,739 30 (29)Options: Purchased 4,494 7 – 1,668 2 –
Written 6,226 – (6) 2,490 – (2)OTC-cleared
Interest rate swaps 7,694 – – 1,567 – –Inflation swaps 12 – – – – –
Credit derivativesA
OTCCredit default swaps: Purchased 214 – (3) 354 2 (5)
Sold 58 1 – 101 1 (4)OTC-cleared
Credit default swaps: Purchased 164 – – 124 – –Sold 234 – – 284 – –
Total $ 176 $ (164) $ 630 $ (228)
A PSP Investments, through sold credit derivatives, indirectly guarantees the underlying reference obligations. The maximum potential exposure is the notional amount of the sold credit derivatives as shown in the table above.
ANNUAL REPORT 2017 | PUBLIC SECTOR PENSION INVESTMENT BOARD170
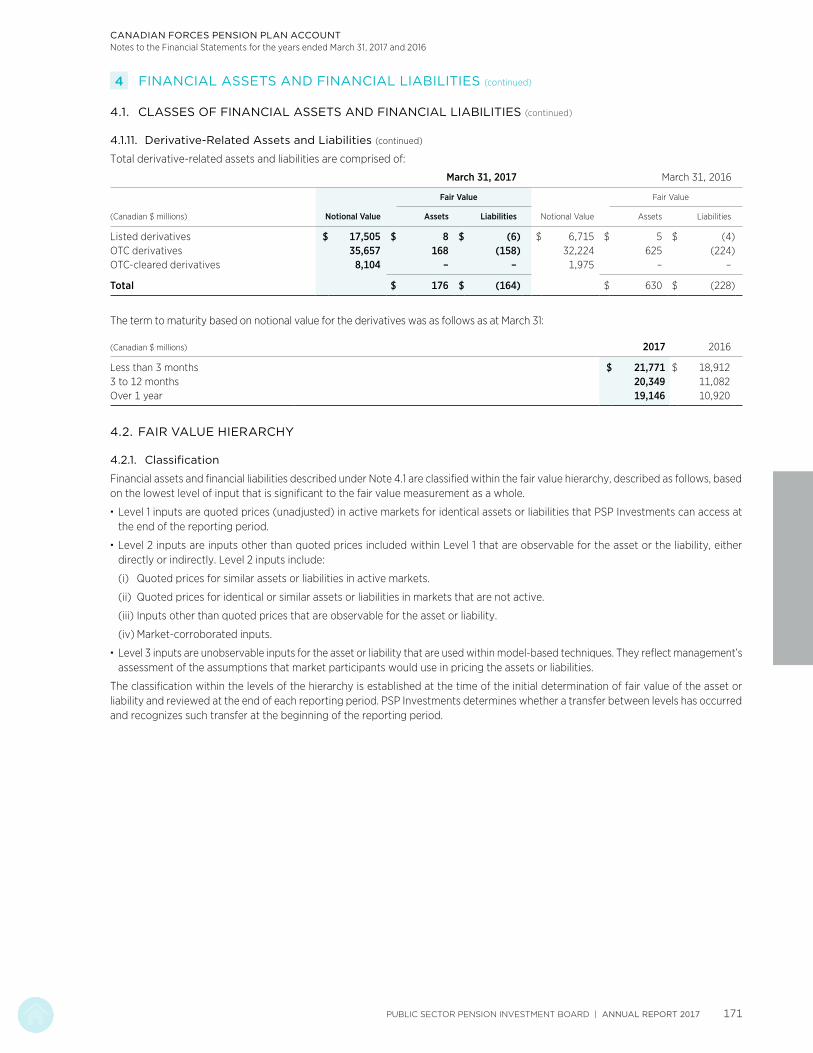
CANADIAN FORCES PENSION PLAN ACCOUNTNotes to the Financial Statements for the years ended March 31, 2017 and 2016
4 FINANCIAL ASSETS AND FINANCIAL LIABILITIES (continued)
4.1. CLASSES OF FINANCIAL ASSETS AND FINANCIAL LIABILITIES (continued)
4.1.11. Derivative-Related Assets and Liabilities (continued)
Total derivative-related assets and liabilities are comprised of:
March 31, 2017 March 31, 2016
(Canadian $ millions) Notional Value
Fair Value
Notional Value
Fair Value
Assets Liabilities Assets Liabilities
Listed derivatives $ 17,505 $ 8 $ (6) $ 6,715 $ 5 $ (4)OTC derivatives 35,657 168 (158) 32,224 625 (224)OTC-cleared derivatives 8,104 – – 1,975 – –
Total $ 176 $ (164) $ 630 $ (228)
The term to maturity based on notional value for the derivatives was as follows as at March 31:
(Canadian $ millions) 2017 2016
Less than 3 months $ 21,771 $ 18,9123 to 12 months 20,349 11,082Over 1 year 19,146 10,920
4.2. FAIR VALUE HIERARCHY
4.2.1. Classification
Financial assets and financial liabilities described under Note 4.1 are classified within the fair value hierarchy, described as follows, based on the lowest level of input that is significant to the fair value measurement as a whole.
· Level 1 inputs are quoted prices (unadjusted) in active markets for identical assets or liabilities that PSP Investments can access at the end of the reporting period.
· Level 2 inputs are inputs other than quoted prices included within Level 1 that are observable for the asset or the liability, either directly or indirectly. Level 2 inputs include:
(i) Quoted prices for similar assets or liabilities in active markets.
(ii) Quoted prices for identical or similar assets or liabilities in markets that are not active.
(iii) Inputs other than quoted prices that are observable for the asset or liability.
(iv) Market-corroborated inputs.
· Level 3 inputs are unobservable inputs for the asset or liability that are used within model-based techniques. They reflect management’s assessment of the assumptions that market participants would use in pricing the assets or liabilities.
The classification within the levels of the hierarchy is established at the time of the initial determination of fair value of the asset or liability and reviewed at the end of each reporting period. PSP Investments determines whether a transfer between levels has occurred and recognizes such transfer at the beginning of the reporting period.
PUBLIC SECTOR PENSION INVESTMENT BOARD | ANNUAL REPORT 2017 171

CANADIAN FORCES PENSION PLAN ACCOUNTNotes to the Financial Statements for the years ended March 31, 2017 and 2016
4 FINANCIAL ASSETS AND FINANCIAL LIABILITIES (continued)
4.2. FAIR VALUE HIERARCHY (continued)
4.2.1. Classification (continued)
The following table shows the fair value of financial assets and financial liabilities as at March 31, 2017 classified within the fair value hierarchy:
(Canadian $ millions) Level 1 Level 2 Level 3Total
Fair Value
Public marketsCanadian equity $ 1,078 $ 174 $ – $ 1,252Foreign equity 5,062 686 58 5,806
Private marketsReal estate – – 4,789 4,789Private equity – – 2,680 2,680Infrastructure – – 2,598 2,598Natural resources – – 840 840
Fixed incomeCash and money market securities – 2,434 – 2,434Government and corporate bonds – 4,238 51 4,289Inflation-linked bonds – 1,520 – 1,520Private debt securities – – 1,801 1,801Other fixed income securities – 650 3 653
Alternative investments – 300 1,277 1,577
$ 6,140 $ 10,002 $ 14,097 $ 30,239
Investment-related assetsAmounts receivable from pending trades $ – $ 225 $ – $ 225Interest receivable – 62 – 62Dividends receivable – 26 – 26Securities purchased under reverse repurchase agreements – 522 – 522Derivative-related assets 8 168 – 176
$ 8 $ 1,003 $ – $ 1,011
Investments representing financial assets at FVTPL $ 6,148 $ 11,005 $ 14,097 $ 31,250
Investment-related liabilitiesAmounts payable from pending trades $ – $ (212) $ – $ (212)Interest payable – (8) – (8)Securities sold short and securities loaned (564) (1,269) – (1,833)Securities sold under repurchase agreements – (218) – (218)Derivative-related liabilities (6) (158) – (164)
Investment-related liabilities representing financial liabilities at FVTPL $ (570) $ (1,865) $ – $ (2,435)
BorrowingsCapital market debt financing $ – $ (2,127) $ – $ (2,127)
Borrowings representing financial liabilities designated at FVTPL $ – $ (2,127) $ – $ (2,127)
Net investments $ 5,578 $ 7,013 $ 14,097 $ 26,688
ANNUAL REPORT 2017 | PUBLIC SECTOR PENSION INVESTMENT BOARD172

CANADIAN FORCES PENSION PLAN ACCOUNTNotes to the Financial Statements for the years ended March 31, 2017 and 2016
4 FINANCIAL ASSETS AND FINANCIAL LIABILITIES (continued)
4.2. FAIR VALUE HIERARCHY (continued)
4.2.1. Classification (continued)
The following table shows the fair value of financial assets and financial liabilities as at March 31, 2016 classified within the fair value hierarchy:
(Canadian $ millions) Level 1 Level 2 Level 3Total
Fair Value
Public marketsCanadian equity $ 1,113 $ 143 $ – $ 1,256Foreign equity 4,235 894 – 5,129
Private marketsReal estate – – 4,431 4,431Private equity – – 2,217 2,217Infrastructure – – 1,873 1,873Natural resources – – 598 598
Fixed incomeCash and money market securities – 1,166 – 1,166Government and corporate bonds – 3,876 56 3,932Inflation-linked bonds – 1,459 – 1,459Private debt securities – – 1,045 1,045Other fixed income securities – 381 139 520
Alternative investments – 242 1,064 1,306
$ 5,348 $ 8,161 $ 11,423 $ 24,932
Investment-related assetsAmounts receivable from pending trades $ – $ 87 $ – $ 87Interest receivable – 44 – 44Dividends receivable – 21 – 21Securities purchased under reverse repurchase agreements – 211 – 211Derivative-related assets 5 625 – 630
$ 5 $ 988 $ – $ 993
Investments representing financial assets at FVTPL $ 5,353 $ 9,149 $ 11,423 $ 25,925
Investment-related liabilitiesAmounts payable from pending trades $ – $ (113) $ – $ (113)Interest payable – (6) – (6)Securities sold short (436) (89) – (525)Securities sold under repurchase agreements – (283) – (283)Derivative-related liabilities (4) (224) – (228)
Investment-related liabilities representing financial liabilities at FVTPL $ (440) $ (715) $ – $ (1,155)
BorrowingsCapital market debt financing $ – $ (1,745) $ – $ (1,745)
Borrowings representing financial liabilities designated at FVTPL $ – $ (1,745) $ – $ (1,745)
Net investments $ 4,913 $ 6,689 $ 11,423 $ 23,025
PUBLIC SECTOR PENSION INVESTMENT BOARD | ANNUAL REPORT 2017 173

CANADIAN FORCES PENSION PLAN ACCOUNTNotes to the Financial Statements for the years ended March 31, 2017 and 2016
4 FINANCIAL ASSETS AND FINANCIAL LIABILITIES (continued)
4.2. FAIR VALUE HIERARCHY (continued)
4.2.2. Process for Level 3 Fair Value Determination
The valuation process is monitored and governed by an internal valuation committee (“VC”). This committee is responsible for overseeing all aspects of fair value determination. This includes establishing valuation methodologies and procedures for each type of investment and ensuring they are complied with. Valuation methodologies established are based on widely recognized practices that are consistent with professional appraisal standards. Such standards include, among others, the International Private Equity and Venture Capital Valuation Guidelines, the Canadian Uniform Standards of Professional Appraisal Practice and the Uniform Standards of Professional Appraisal Practice in the United States of America.
The fair value of investments classified as Level 3 is determined at least annually. Quarterly, the fair value is reviewed and adjusted, as appropriate, to reflect the impact of any significant market or investment-specific events or circumstances. For each investment, the relevant valuation methodology is applied consistently over time as appropriate in the prevailing circumstances. The appropriateness of significant changes in valuation methodologies is reviewed by the VC.
In cases where the services of third-party appraisers are used, management ensures their independence and that valuation methods used are consistent with professional appraisal standards outlined above. In validating the work performed by appraisers, management ensures that the assumptions used correspond to financial information and forecasts of the underlying investment.
With respect to fund investments classified as Level 3, the annual fair value is generally determined based on audited financial statements received from the fund’s general partner. In certain cases fair value is obtained from information provided by the fund’s administrators and is reviewed by Management to ensure reasonableness and adherence to acceptable industry valuation methods. Where necessary, the impact of restrictions on the sale or redemption of such investments is taken into consideration in determining fair value.
ANNUAL REPORT 2017 | PUBLIC SECTOR PENSION INVESTMENT BOARD174
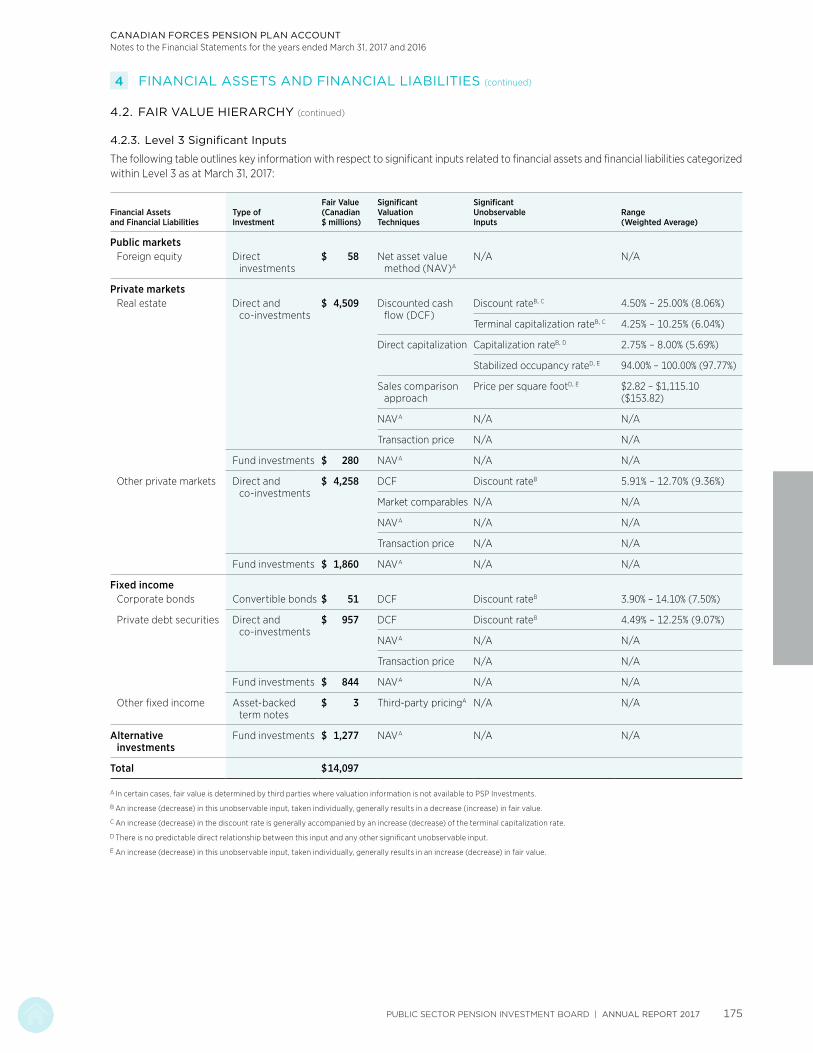
CANADIAN FORCES PENSION PLAN ACCOUNTNotes to the Financial Statements for the years ended March 31, 2017 and 2016
4 FINANCIAL ASSETS AND FINANCIAL LIABILITIES (continued)
4.2. FAIR VALUE HIERARCHY (continued)
4.2.3. Level 3 Significant Inputs
The following table outlines key information with respect to significant inputs related to financial assets and financial liabilities categorized within Level 3 as at March 31, 2017:
Financial Assets and Financial Liabilities
Type of Investment
Fair Value (Canadian $ millions)
Significant Valuation Techniques
Significant Unobservable Inputs
Range (Weighted Average)
Public marketsForeign equity Direct
investments$ 58 Net asset value
method (NAV)AN/A N/A
Private marketsReal estate Direct and
co-investments$ 4,509 Discounted cash
flow (DCF)Discount rateB, C 4.50% – 25.00% (8.06%)
Terminal capitalization rateB, C 4.25% – 10.25% (6.04%)
Direct capitalization Capitalization rateB, D 2.75% – 8.00% (5.69%)
Stabilized occupancy rateD, E 94.00% – 100.00% (97.77%)
Sales comparison approach
Price per square footD, E $2.82 – $1,115.10 ($153.82)
NAVA N/A N/A
Transaction price N/A N/A
Fund investments $ 280 NAVA N/A N/A
Other private markets Direct and co-investments
$ 4,258 DCF Discount rateB 5.91% – 12.70% (9.36%)
Market comparables N/A N/A
NAVA N/A N/A
Transaction price N/A N/A
Fund investments $ 1,860 NAVA N/A N/A
Fixed incomeCorporate bonds Convertible bonds $ 51 DCF Discount rateB 3.90% – 14.10% (7.50%)
Private debt securities Direct and co-investments
$ 957 DCF Discount rateB 4.49% – 12.25% (9.07%)
NAVA N/A N/A
Transaction price N/A N/A
Fund investments $ 844 NAVA N/A N/A
Other fixed income Asset-backed term notes
$ 3 Third-party pricingA N/A N/A
Alternative investments
Fund investments $ 1,277 NAVA N/A N/A
Total $14,097
A In certain cases, fair value is determined by third parties where valuation information is not available to PSP Investments.
B An increase (decrease) in this unobservable input, taken individually, generally results in a decrease (increase) in fair value.
C An increase (decrease) in the discount rate is generally accompanied by an increase (decrease) of the terminal capitalization rate.
D There is no predictable direct relationship between this input and any other significant unobservable input.
E An increase (decrease) in this unobservable input, taken individually, generally results in an increase (decrease) in fair value.
PUBLIC SECTOR PENSION INVESTMENT BOARD | ANNUAL REPORT 2017 175

CANADIAN FORCES PENSION PLAN ACCOUNTNotes to the Financial Statements for the years ended March 31, 2017 and 2016
4 FINANCIAL ASSETS AND FINANCIAL LIABILITIES (continued)
4.2. FAIR VALUE HIERARCHY (continued)
4.2.3. Level 3 Significant Inputs (continued)
The following table outlines key information with respect to significant inputs related to financial assets and financial liabilities categorized within Level 3 as at March 31, 2016:
Financial Assets and Financial Liabilities
Type of Investment
Fair Value (Canadian $ millions)
Significant Valuation Techniques
Significant Unobservable Inputs
Range (Weighted Average)
Private marketsReal estate Direct and
co-investments$ 4,147 DCF Discount rateB, C 5.25% – 25.00% (8.27%)
Terminal capitalization rateB, C 4.25% – 14.00% (6.29%)
Direct capitalization Capitalization rateB, D 3.25% – 7.50% (5.91%)
Stabilized occupancy rateD, E 93.00% – 100.00% (96.84%)
Sales comparison approach
Price per square footD, E $25.00 – $665.89 ($170.43)
NAVA N/A N/A
Transaction price N/A N/A
Fund investments $ 284 NAVA N/A N/A
Other private markets Direct and co-investments
$ 3,169 DCF Discount rateB 5.20% – 12.50% (9.70%)
Market comparables N/A N/A
NAVA N/A N/A
Transaction price N/A N/A
Fund investments $ 1,519 NAVA N/A N/A
Fixed incomeCorporate bonds Convertible bonds $ 56 DCF Discount rateB 3.70% – 13.50% (6.30%)
Private debt securities Direct and co-investments
$ 357 DCF Discount rateB 8.00% – 13.50% (11.09%)
NAVA N/A N/A
Transaction price N/A N/A
Fund investments $ 688 NAVA N/A N/A
Other fixed income Asset-backed term notes
$ 139 Third-party pricingA N/A N/A
Alternative investments
Fund investments $ 1,064 NAVA N/A N/A
Total $11,423
A In certain cases, fair value is determined by third parties where valuation information is not available to PSP Investments.
B An increase (decrease) in this unobservable input, taken individually, generally results in a decrease (increase) in fair value.
C An increase (decrease) in the discount rate is generally accompanied by an increase (decrease) of the terminal capitalization rate.
D There is no predictable direct relationship between this input and any other significant unobservable input.
E An increase (decrease) in this unobservable input, taken individually, generally results in an increase (decrease) in fair value.
ANNUAL REPORT 2017 | PUBLIC SECTOR PENSION INVESTMENT BOARD176

CANADIAN FORCES PENSION PLAN ACCOUNTNotes to the Financial Statements for the years ended March 31, 2017 and 2016
4 FINANCIAL ASSETS AND FINANCIAL LIABILITIES (continued)
4.2. FAIR VALUE HIERARCHY (continued)
4.2.4. Level 3 Reconciliation
The following table shows a reconciliation of all movements related to financial assets and financial liabilities categorized within Level 3 for the year ended March 31, 2017:
(Canadian $ millions)OpeningBalance Purchases Sales Settlements
Realized Gains
Unrealized GainsA
Closing Balance
Public markets $ – $ 51 $ – $ – $ – $ 7 $ 58Private markets 9,119 1,949 (541) – 132 248 10,907Fixed income 1,240 1,034 (385) (134) 75 25 1,855Alternative investments 1,064 182 (95) – 10 116 1,277
Total $ 11,423 $ 3,216 $ (1,021) $ (134) $ 217 $ 396 $ 14,097
The following table shows a reconciliation of all movements related to financial assets and financial liabilities categorized within Level 3 for the year ended March 31, 2016:
(Canadian $ millions)Opening Balance Purchases Sales Settlements
Realized Gains
Unrealized Gains
(Losses)AClosing Balance
Private markets $ 7,287 $ 1,886 $ (746) $ – $ 186 $ 506 $ 9,119Fixed income 1,094 410 (101) (138) 83 (108) 1,240Alternative investments 805 325 (86) – 13 7 1,064Derivative-related
assets/liabilities (net) (1) – – – – 1 –
Total $ 9,185 $ 2,621 $ (933) $ (138) $ 282 $ 406 $ 11,423
A Includes Plan Account allocation adjustments.
4.2.5. Level 3 Sensitivity Analysis
In the course of measuring fair value of financial instruments classified as Level 3, valuation techniques used incorporate assumptions that are based on non-observable data. Significant assumptions used for each asset class are described in Note 4.2.3. Although such assumptions reflect management’s best judgment, the use of reasonably possible alternative assumptions could yield different fair value measures representing, at a minimum, a 3% increase and 3% decrease as at March 31, 2017 (March 31, 2016 – 3% increase and 3% decrease) in the fair value of financial instruments categorized as Level 3. This excludes private debt investments in the real estate sector and certain fund investments, where a sensitivity analysis is not possible given the underlying assumptions used are not available to PSP Investments. With respect to private debt investments in the real estate sector, the fair value is obtained from third-party appraisers. Management ensures the appropriateness of the work performed by third-party appraisers as described under Note 4.2.2. In the case of fund investments, the fair value is determined as indicated in Note 4.2.2.
PUBLIC SECTOR PENSION INVESTMENT BOARD | ANNUAL REPORT 2017 177

CANADIAN FORCES PENSION PLAN ACCOUNTNotes to the Financial Statements for the years ended March 31, 2017 and 2016
5 COLLATERAL PLEDGED AND RECEIVED
PSP Investments is party to agreements that involve pledging and holding collateral, as outlined in Notes 2.3.5, 2.3.6 and 7.2.1. The following table illustrates the fair values of the Plan Account’s allocated collateral, as well as the securities under the lending and borrowing programs and the securities under the repurchase and reverse repurchase agreements, as at:
(Canadian $ millions) March 31, 2017 March 31, 2016
Securities lending and borrowingSecurities lent $ 2,606 $ 1,806Collateral heldA 2,775 1,928Securities borrowed 567 451Collateral pledgedB 595 474
Securities repurchase and reverse repurchase agreements Securities sold under repurchase agreements 218 284Collateral pledged 218 283Securities purchased under reverse repurchase agreements 524 211Collateral heldC 522 211
Derivative contracts Collateral pledged 61 57Collateral heldD 45 430
A The minimum fair value of cash collateral required is equal to 102% of the fair value of the securities lent, and in the case of securities collateral 105%. As part of collateral held, cash amounted to $1,000 million for the Plan Account as at March 31, 2017 (March 31, 2016 – $411 million) and securities amounted to $1,775 million as at March 31, 2017 (March 31, 2016 – $1,517 million). All cash collateral is reinvested.
B The minimum fair value of collateral required is equal to 100% of the fair value of the securities borrowed.
C The collateral received is in the form of securities of which $267 million has been used in connection with short selling transactions as at March 31, 2017 (March 31, 2016 – $89 million) and $41 million has been used in connection with securities sold under repurchase agreements (March 31, 2016 – nil).
D As part of collateral held, cash amounted to $2 million as at March 31, 2017 (March 31, 2016 – nil) and securities amounted to $43 milion as at March 31, 2017 (March 31, 2016 – $430 million). All cash collateral is reinvested.
ANNUAL REPORT 2017 | PUBLIC SECTOR PENSION INVESTMENT BOARD178
CANADIAN FORCES PENSION PLAN ACCOUNTNotes to the Financial Statements for the years ended March 31, 2017 and 2016
6 INTERESTS IN OTHER ENTITIES
6.1. SUBSIDIARIES, JOINT VENTURES AND ASSOCIATES
As an investment entity, PSP Investments does not consolidate its subsidiaries other than those that solely provide it with services that relate to its investment activities. PSP Investments measures its investments in its subsidiaries, joint ventures and associates at FVTPL as described in Note 2.1.
For purposes of preparing this note, management assesses control, joint control and significant influence as follows:
(i) Control and significant influence
PSP Investments determines that it has control over an investee when it is exposed, or has rights, to variable returns from its investment in an entity and has the ability to affect those returns through its power over the investee.
In certain cases, PSP Investments does not have control over an investee but has the power to participate in the financial and operating policy decisions of the investee. In such cases, PSP Investments determines that it has significant influence over the investee.
In the context of control or significant influence, power over an investee is obtained through voting rights conveyed by PSP Investments’ ownership interest, other contractual arrangements, or a combination thereof.
(ii) Joint control
PSP Investments determines that it is party to a joint venture arrangement when it has joint control over an investee and has rights to the net assets of the investee. Joint control is established through a contractual arrangement which requires the unanimous consent of the parties sharing control for the activities that significantly affect the returns of the arrangement.
Generally, decision making regarding such activities is governed through voting rights conveyed by the ownership interest of each party. In certain cases, it is governed solely through contractual arrangements or in conjunction with the ownership interest of each party.
In the normal course of business, investments in private markets are commonly held through investment entity subsidiaries formed by PSP Investments. As at March 31, 2017, 103 investment entity subsidiaries were incorporated in North America, 23 in Europe, 10 in Oceania, 4 in Central and South America, 1 in Africa and 1 in Asia (March 31, 2016 – 102 in North America, 19 in Europe, 10 in Oceania, 4 in Central and South America and 1 in Africa).
In addition, PSP Investments controlled 77 investees directly or through its investment entity subsidiaries as at March 31, 2017 (March 31, 2016 – 73 investees).
PUBLIC SECTOR PENSION INVESTMENT BOARD | ANNUAL REPORT 2017 179

CANADIAN FORCES PENSION PLAN ACCOUNTNotes to the Financial Statements for the years ended March 31, 2017 and 2016
6 INTERESTS IN OTHER ENTITIES (continued)
6.1. SUBSIDIARIES, JOINT VENTURES AND ASSOCIATES (continued)
The following tables present, in descending order, the most significant investees held directly or indirectly by PSP Investments where it has control, joint control or significant influence.
March 31, 2017
Entity’s NamePrincipal Place
of BusinessOwnership Interest Held
by PSP InvestmentsRelationship to
PSP Investments
Revera Inc. North America 100% Controlled investeeKaingaroa Timberlands Ltd. Oceania 56% Jointly controlled investeeAviAlliance GmbH Europe 100% Controlled investeeRoadis Transportation B.V.A Global 100% Controlled investeeFirstLight Power Resources Holding Inc. North America 100% Controlled investeeRoccapina Fund, L.P. North America 100% Controlled investeeSEGRO European Logistics Partnership S.a.r.l. Europe 50% Jointly controlled investeeTelesat Holdings Inc. North America 35% AssociateTDF S.A.S. Europe 22% AssociateBig Box Properties North America 49% Jointly controlled investee
A Formerly Isolux Infrastructure Netherlands B.V.
March 31, 2016
Entity’s NamePrincipal Place
of BusinessOwnership Interest Held
by PSP InvestmentsRelationship to
PSP Investments
Revera Inc. North America 100% Controlled investeeAviAlliance GmbH Europe 100% Controlled investeeKaingaroa Timberlands Ltd. Oceania 56% Jointly controlled investeeTelesat Holdings Inc. North America 34% AssociateIsolux Infrastructure Netherlands B.V. Central and South America 19% Jointly controlled investeeRoccapina Fund, L.P. North America 100% Controlled investeeSEGRO European Logistics Partnership S.a.r.l. Europe 50% Jointly controlled investeeBig Box Properties North America 49% Jointly controlled investeeAcelity Inc. North America 21% AssociateTDF S.A.S. Europe 22% Associate
In addition to the above, PSP Investments consolidates wholly owned subsidiaries that solely provide it with services that relate to its investment activities. Such services consist of investment management and financing of private market investments within the context of PSP Investments’ capital market debt program described in Note 8.2.
6.2. STRUCTURED ENTITIES
PSP Investments holds interests in partnerships and funds mainly in the context of its investments in private markets. Given their nature, such entities commonly have the characteristics of a structured entity as defined by IFRS. These entities are held as investments and do not expose PSP Investments to additional risks or returns compared to interests held in non-structured entities.
Information regarding structured entities is included, as applicable, within disclosures of investment risk management under Note 7, guarantees and indemnities under Note 15 and commitments under Note 16.
ANNUAL REPORT 2017 | PUBLIC SECTOR PENSION INVESTMENT BOARD180

CANADIAN FORCES PENSION PLAN ACCOUNTNotes to the Financial Statements for the years ended March 31, 2017 and 2016
7 INVESTMENT RISK MANAGEMENT
PSP Investments is required to act in the best interests of the contributors and beneficiaries under the Plans and for maximizing returns without undue risk of loss. In pursuit of this objective, PSP Investments established an Enterprise Risk Management Policy (ERM Policy). The ERM Policy provides a framework for identifying, evaluating, managing, mitigating, monitoring and reporting the investment and non-investment risks to which PSP Investments is exposed.
As part of the overall ERM policy, the Investment Risk Management Policy (IRM Policy) supports the management of risk inherent to the investment decision making process. The IRM Policy outlines a framework that is designed to ensure that investment activities respect PSP Investments’ risk philosophy and align with the tolerance and limits of its risk appetite. The IRM Policy also supplements the Statement of Investment Policies, Standards and Procedures (SIP&P), whose objective is to effectively manage investment risks related to the implementation of PSP Investments’ various investment strategies. Investment risks include market, credit and liquidity risks.
7.1. MARKET RISK
Market risk is the risk that the value of an investment will fluctuate as a result of an adverse financial outcome due to changes in the factors that drive that value, such as changes in market prices, changes caused by factors specific to the individual investment, volatility in share and commodity prices, interest rate, foreign exchange or other factors affecting similar securities traded in the market.
7.1.1. Measurement of Market Risk
Effective April 1, 2016, the absolute annualized volatility of the total portfolio was implemented as the primary measure of market risk. The absolute volatility is a statistical measure of the size of changes in investment returns of a given investment or portfolio of investments. It is used to illustrate the potential loss of value in an investment or portfolio of investments as a result of fluctuations in market prices. Prior to April 1, 2016, PSP Investments used the Value at Risk (VaR) as the primary measure of market risk.
PSP Investments uses seven years’ worth of market returns scaled to a twelve-month holding period to calculate the absolute volatility. For investments that are not actively traded, the calculation of the absolute volatility uses securities with similar risk attributes as a proxy.
The absolute volatility is statistically valid under normal market conditions and does not specifically consider losses from severe market events. It also assumes that the future will behave in a pattern similar to the past. Consequently, if future market conditions differ significantly from those of the past, potential losses may differ from those originally estimated.
The following table shows the absolute volatility of the total portfolio expressed as a percentage of net investments as at the end of the period:
March 31, 2017 March 31, 2016
Absolute volatility 7.6% 8.5%A
A Since the absolute volatility was used effective April 1, 2016, the market risk measure as at March 31, 2016 was changed in the above table for comparability purposes. Prior to April 1, 2016, PSP Investments used the VaR as the primary measure of market risk. The total portfolio VaR as at March 31, 2016 was 23.6%.
Stress Testing
Although the absolute volatility is a widely accepted risk measure, it is complemented by other risk measurement methodologies that provide greater insight on market risk. PSP Investments uses stress testing and scenario analysis to examine the impact on financial results of abnormally large movements in risk factors. Such techniques are used to test a portfolio’s sensitivity to various risk factors and key model assumptions. These methods also use historically stressed periods to evaluate how a current portfolio reacts under such circumstances. Stress testing and scenario analysis are also deployed to assess new product performance.
PUBLIC SECTOR PENSION INVESTMENT BOARD | ANNUAL REPORT 2017 181

CANADIAN FORCES PENSION PLAN ACCOUNTNotes to the Financial Statements for the years ended March 31, 2017 and 2016
7 INVESTMENT RISK MANAGEMENT (continued)
7.1. MARKET RISK (continued)
7.1.2. Interest Rate Risk
Interest rate risk refers to the risk that fluctuations in interest rates will directly affect the fair value of the Plan Account’s net asset values.
The terms to maturity of the classes of financial instruments, outlined in Note 4.1, with the most significant exposure to interest rate risk were as follows as at:
March 31, 2017
(Canadian $ millions)Less than
1 Year1 to 5 Years
5 to 10 Years
Over 10 Years Other Total
Cash and money market securities $ – $ – $ – $ – $ 2,434A $ 2,434Government and corporate bonds 481 1,856 1,199 753 – 4,289Inflation-linked bonds 1 357 564 598 – 1,520Private debt securities 16 176 699 – 910B 1,801Other fixed income securities 3 4 – – 646C 653
Total fixed income $ 501 $ 2,393 $ 2,462 $ 1,351 $ 3,990 $ 10,697
March 31, 2016
(Canadian $ millions)Less than
1 Year1 to 5 Years
5 to 10 Years
Over 10 Years Other Total
Cash and money market securities $ – $ – $ – $ – $ 1,166A $ 1,166Government and corporate bonds 218 1,916 984 814 – 3,932Inflation-linked bonds 4 325 486 644 – 1,459Private debt securities 1 239 61 – 744B 1,045Other fixed income securities 143 40 – – 337C 520
Total fixed income $ 366 $ 2,520 $ 1,531 $ 1,458 $ 2,247 $ 8,122
A Due to their nature, these investments are not significantly exposed to interest rate risk.
B Information in connection with the terms to maturity of fund and certain directly held investments included as part of private debt securities is not available.
C Certain corporate bonds, asset-backed securities and floating rate notes are not significantly exposed to interest rate risk as their prescribed rates are variable.
The terms to maturity of PSP Investments’ capital market debt financing are disclosed in Note 8.2.
Alternative investments, reverse repurchase agreements, as well as derivative contracts described in Notes 4.1.4, 4.1.9 and 4.1.11, respectively, are also subject to interest rate risk exposures. These exposures are reflected in the absolute volatility calculation described in Note 7.1.1.
ANNUAL REPORT 2017 | PUBLIC SECTOR PENSION INVESTMENT BOARD182
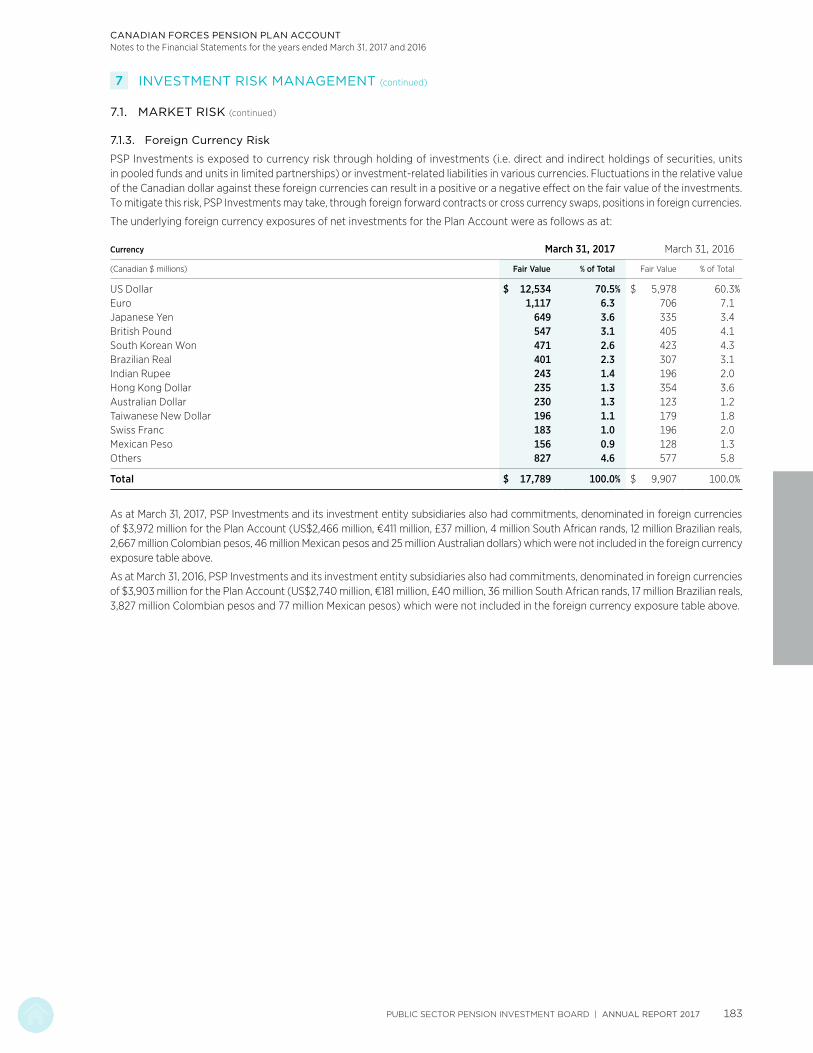
CANADIAN FORCES PENSION PLAN ACCOUNTNotes to the Financial Statements for the years ended March 31, 2017 and 2016
7 INVESTMENT RISK MANAGEMENT (continued)
7.1. MARKET RISK (continued)
7.1.3. Foreign Currency Risk
PSP Investments is exposed to currency risk through holding of investments (i.e. direct and indirect holdings of securities, units in pooled funds and units in limited partnerships) or investment-related liabilities in various currencies. Fluctuations in the relative value of the Canadian dollar against these foreign currencies can result in a positive or a negative effect on the fair value of the investments. To mitigate this risk, PSP Investments may take, through foreign forward contracts or cross currency swaps, positions in foreign currencies.
The underlying foreign currency exposures of net investments for the Plan Account were as follows as at:
Currency March 31, 2017 March 31, 2016
(Canadian $ millions) Fair Value % of Total Fair Value % of Total
US Dollar $ 12,534 70.5% $ 5,978 60.3%Euro 1,117 6.3 706 7.1Japanese Yen 649 3.6 335 3.4British Pound 547 3.1 405 4.1South Korean Won 471 2.6 423 4.3Brazilian Real 401 2.3 307 3.1Indian Rupee 243 1.4 196 2.0Hong Kong Dollar 235 1.3 354 3.6Australian Dollar 230 1.3 123 1.2Taiwanese New Dollar 196 1.1 179 1.8Swiss Franc 183 1.0 196 2.0Mexican Peso 156 0.9 128 1.3Others 827 4.6 577 5.8
Total $ 17,789 100.0% $ 9,907 100.0%
As at March 31, 2017, PSP Investments and its investment entity subsidiaries also had commitments, denominated in foreign currencies of $3,972 million for the Plan Account (US$2,466 million, €411 million, £37 million, 4 million South African rands, 12 million Brazilian reals, 2,667 million Colombian pesos, 46 million Mexican pesos and 25 million Australian dollars) which were not included in the foreign currency exposure table above.
As at March 31, 2016, PSP Investments and its investment entity subsidiaries also had commitments, denominated in foreign currencies of $3,903 million for the Plan Account (US$2,740 million, €181 million, £40 million, 36 million South African rands, 17 million Brazilian reals, 3,827 million Colombian pesos and 77 million Mexican pesos) which were not included in the foreign currency exposure table above.
PUBLIC SECTOR PENSION INVESTMENT BOARD | ANNUAL REPORT 2017 183

CANADIAN FORCES PENSION PLAN ACCOUNTNotes to the Financial Statements for the years ended March 31, 2017 and 2016
7 INVESTMENT RISK MANAGEMENT (continued)
7.2. CREDIT RISK
PSP Investments is exposed to credit risk, which is the risk of non-performance of a debtor on whom PSP Investments relies to fulfill contractual or financial obligations. That is, the risk that the issuer of a debt security or that the counterparty to a derivative contract, to a securities lending and borrowing transaction or to securities purchased under reverse repurchase agreements, is unable to meet its financial obligations.
Credit risk encompasses the risk of a deterioration of creditworthiness and the relevant concentration risk. Credit risk monitoring entails an evaluation of the credit quality of each issuer and counterparty that transacts with PSP Investments. To perform this evaluation for public issuers and counterparties, PSP Investments relies on four recognized credit rating agencies. A minimum of two credit ratings are used to classify each security. If the agencies disagree as to a security’s credit quality, PSP Investments uses the lowest of the available ratings. For private issuers, PSP Investments assigns internal credit ratings to issuers and measures the combined risk profile against set targets. To assign risk ratings to issuers, PSP Investments uses methodologies comparable to those used by recognized rating agencies.
As at March 31, 2017, the Plan Account’s maximum exposure to credit risk amounted to $11 billion (March 31, 2016 – $9 billion). This amount is presented before collateral held and netting arrangements that do not qualify for offsetting under IFRS. The maximum credit exposure excludes guarantees disclosed in Note 15 as well as investments in funds classified as alternative investments in note 4.1. Such funds hold fixed income securities among other types of instruments.
To monitor the evolution of credit risk, PSP Investments periodically produces a concentration report by credit rating for credit-sensitive securities. The concentration of credit risk by credit rating was as follows as at March 31:
Credit Rating 2017 2016
AAA-AA 54.2% 50.7%A 20.0 27.9BBB 4.5 9.1BB or below 19.9 10.5No ratingA 1.4 1.8
Total 100.0% 100.0%
A Includes securities for public issuers and counterparties, that are either not rated by credit rating agencies or rated by a single credit rating agency. ABTNs are rated by a single agency and are classified according to their rating within the table.
ANNUAL REPORT 2017 | PUBLIC SECTOR PENSION INVESTMENT BOARD184

CANADIAN FORCES PENSION PLAN ACCOUNTNotes to the Financial Statements for the years ended March 31, 2017 and 2016
7 INVESTMENT RISK MANAGEMENT (continued)
7.2. CREDIT RISK (continued)
7.2.1. Counterparty Risk
Counterparty risk represents the credit risk from current and potential exposure related to transactions involving derivative contracts, securities lending and borrowing as well as securities repurchase and reverse repurchase agreements. In order to minimize counterparty risk, PSP Investments requires that counterparties provide adequate collateral and meet its credit rating requirements. PSP Investments frequently monitors the credit rating of its counterparties as determined by recognized credit rating agencies. With respect to derivative contracts, PSP Investments has the ability to terminate all trades with most counterparties whose credit rating is downgraded below its requirements.
For OTC derivatives, PSP Investments’ policy also requires the use of the International Swaps and Derivative Association (ISDA) Master Agreement with all counterparties to derivative contracts. The ISDA Master Agreement provides the contractual framework within which dealing activities across a full range of OTC products are conducted. In the case of OTC-cleared derivatives, trading activities are regulated between parties under terms that are customary to such transactions.
As a credit mitigation technique, the ISDA Master Agreement contractually binds counterparties to close-out netting provisions in the case of default by one of the counterparties. Additionally, the Credit Support Annex (CSA) to the ISDA Master Agreement enables PSP Investments to realize any collateral placed with it in the case of default of the counterparty. The CSA also requires PSP Investments to contribute further collateral when requested. All collateral transactions under the CSA are in cash, high-quality debt instruments or securities. The CSA also regulates the exchange of collateral when the credit exposure to a counterparty exceeds a predetermined threshold. Counterparties are generally authorized to sell, repledge or otherwise use collateral held. Similarly, in the case of OTC-cleared derivatives, collateral is required in cash, high quality debt instruments or securities and can be sold, repledged or otherwise used. PSP Investments does not sell, repledge or otherwise use any collateral held in the form of securities but does reinvest all cash collateral, with respect to derivative contracts.
With respect to transactions involving securities lending and borrowing agreements as well as securities repurchase and reverse repurchase agreements, collateral requirements are in place to mitigate counterparty risk. Notes 2.3.5 and 2.3.6 describe collateral requirements in securities lending and borrowing programs as well as securities repurchase and reverse repurchase agreements.
Information in connection with collateral pledged by PSP Investments and its counterparties is disclosed in Note 5.
In the case of the securities lending program, PSP Investments’ exposure to counterparty risk is further mitigated as the custodian of the securities lent assumes the risk that a counterparty will be unable to meet its obligations associated with the collateral requirements.
Management is responsible for counterparty risk monitoring and mitigation as well as maintaining a comprehensive, disciplined, and enterprise-wide process for tracking and managing counterparty risk. As such, management measures counterparty risk on an ongoing basis, evaluates and tracks the creditworthiness of current counterparties and mitigates counterparty risk through collateral management.
PUBLIC SECTOR PENSION INVESTMENT BOARD | ANNUAL REPORT 2017 185
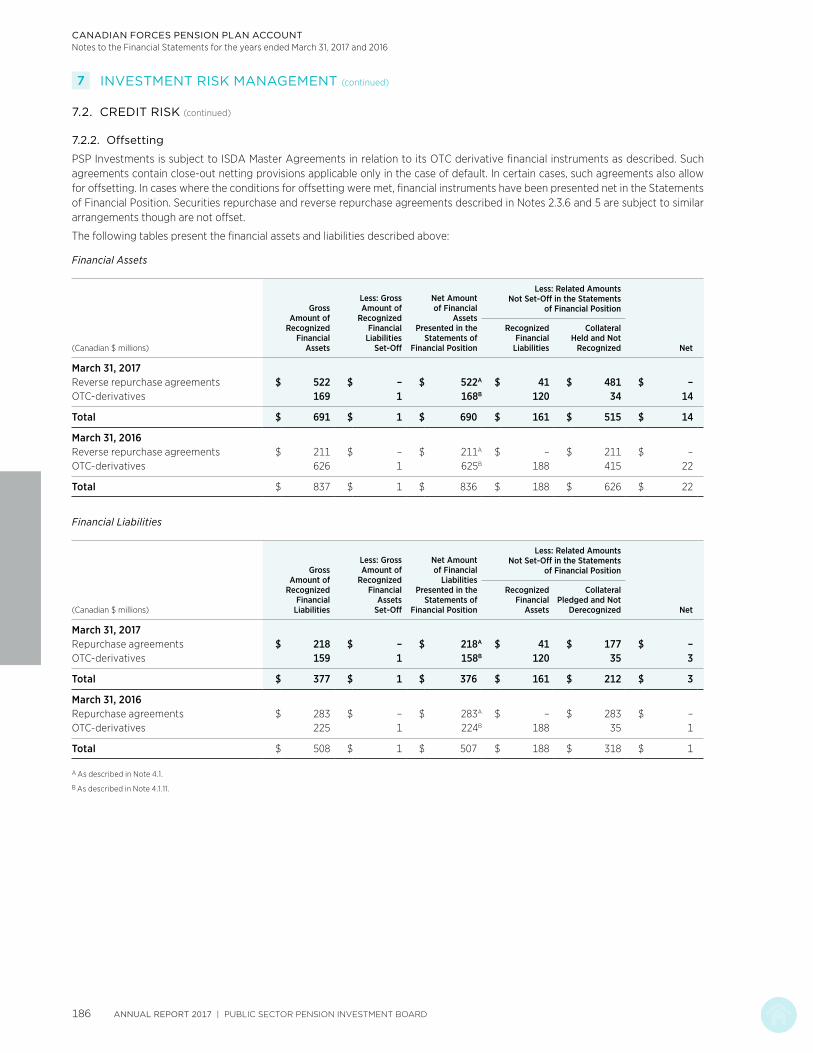
CANADIAN FORCES PENSION PLAN ACCOUNTNotes to the Financial Statements for the years ended March 31, 2017 and 2016
7 INVESTMENT RISK MANAGEMENT (continued)
7.2. CREDIT RISK (continued)
7.2.2. Offsetting
PSP Investments is subject to ISDA Master Agreements in relation to its OTC derivative financial instruments as described. Such agreements contain close-out netting provisions applicable only in the case of default. In certain cases, such agreements also allow for offsetting. In cases where the conditions for offsetting were met, financial instruments have been presented net in the Statements of Financial Position. Securities repurchase and reverse repurchase agreements described in Notes 2.3.6 and 5 are subject to similar arrangements though are not offset.
The following tables present the financial assets and liabilities described above:
Financial Assets
(Canadian $ millions)
Gross Amount of
Recognized Financial
Assets
Less: Gross Amount of
Recognized Financial
Liabilities Set-Off
Net Amount of Financial
Assets Presented in the
Statements of Financial Position
Less: Related Amounts Not Set-Off in the Statements
of Financial Position
Net
Recognized Financial
Liabilities
Collateral Held and Not
Recognized
March 31, 2017Reverse repurchase agreements $ 522 $ – $ 522A $ 41 $ 481 $ –OTC-derivatives 169 1 168B 120 34 14
Total $ 691 $ 1 $ 690 $ 161 $ 515 $ 14
March 31, 2016Reverse repurchase agreements $ 211 $ – $ 211A $ – $ 211 $ –OTC-derivatives 626 1 625B 188 415 22
Total $ 837 $ 1 $ 836 $ 188 $ 626 $ 22
Financial Liabilities
(Canadian $ millions)
Gross Amount of
Recognized Financial
Liabilities
Less: Gross Amount of
Recognized Financial
Assets Set-Off
Net Amount of Financial
Liabilities Presented in the
Statements ofFinancial Position
Less: Related Amounts Not Set-Off in the Statements
of Financial Position
Net
Recognized Financial
Assets
Collateral Pledged and Not
Derecognized
March 31, 2017Repurchase agreements $ 218 $ – $ 218A $ 41 $ 177 $ –OTC-derivatives 159 1 158B 120 35 3
Total $ 377 $ 1 $ 376 $ 161 $ 212 $ 3
March 31, 2016Repurchase agreements $ 283 $ – $ 283A $ – $ 283 $ –OTC-derivatives 225 1 224B 188 35 1
Total $ 508 $ 1 $ 507 $ 188 $ 318 $ 1
A As described in Note 4.1.
B As described in Note 4.1.11.
ANNUAL REPORT 2017 | PUBLIC SECTOR PENSION INVESTMENT BOARD186

CANADIAN FORCES PENSION PLAN ACCOUNTNotes to the Financial Statements for the years ended March 31, 2017 and 2016
7 INVESTMENT RISK MANAGEMENT (continued)
7.3. LIQUIDITY RISK
Liquidity risk corresponds to the risk that PSP Investments will not be able to meet its financial obligations on a timely basis, with sufficient and readily available cash resources. PSP Investments’ cash position is monitored on a daily basis. In general, investments in cash, money market securities, floating rate notes, bonds and public equities are expected to be highly liquid as they will be invested in securities that are actively traded. Management utilizes appropriate measures and controls to monitor liquidity risk in order to ensure that there is sufficient liquidity to meet financial obligations as they come due. A liquidity report taking into consideration future forecasted cash flows is prepared and presented to senior management on a weekly basis. This ensures that sufficient cash reserves are available to meet forecasted cash outflows. Additionally, sufficient sources of liquidity are maintained for deployment in case of market disruption.
PSP Investments has the ability to raise additional capital through the use of its capital market debt program. This program allows PSP Investments to issue short-term promissory notes and medium-term notes. Note 8.2 provides additional information on the usage of the capital market debt program. Furthermore, PSP Investments maintains credit facilities for general corporate purposes. Note 8.1 provides additional information with respect to such credit facilities.
The terms to maturity of the notional amount of derivatives are disclosed in Note 4.1.11.
Financial Liabilities
The following tables present the fair value of non-derivative-related financial liabilities as well as derivative-related financial instruments, aggregated according to their maturities as at March 31, 2017 and excluding the impact of guarantees and indemnities disclosed in Note 15:
(Canadian $ millions)Less than 3 Months
3 to 12 Months
Over 1 Year Total
Non-derivative-related financial liabilitiesA
Amounts payable from pending trades $ (212) $ – $ – $ (212)Interest payable (8) – – (8)Securities sold short and securities loaned (1,833) – – (1,833)Securities sold under repurchase agreements (218) – – (218)Capital market debt financing (1,136) (244) (747) (2,127)Trade payable and other liabilities (30) – (16) (46)
Total $ (3,437) $ (244) $ (763) $ (4,444)
(Canadian $ millions)Less than 3 Months
3 to 12 Months
Over 1 Year Total
Derivative-related financial instrumentsDerivative-related assets $ 46 $ 66 $ 64 $ 176Derivative-related liabilitiesA (77) (35) (52) (164)
Total $ (31) $ 31 $ 12 $ 12
A Liabilities are presented in the earliest period in which the counterparty can request payment.
PUBLIC SECTOR PENSION INVESTMENT BOARD | ANNUAL REPORT 2017 187

CANADIAN FORCES PENSION PLAN ACCOUNTNotes to the Financial Statements for the years ended March 31, 2017 and 2016
7 INVESTMENT RISK MANAGEMENT (continued)
7.3. LIQUIDITY RISK (continued)
Financial Liabilities (continued)
The following tables present the fair value of non-derivative-related financial liabilities as well as derivative-related financial instruments, aggregated according to their maturities as at March 31, 2016 and excluding the impact of guarantees and indemnities disclosed in Note 15:
(Canadian $ millions)Less than 3 Months
3 to 12 Months
Over 1 Year Total
Non-derivative-related financial liabilitiesA
Amounts payable from pending trades $ (113) $ – $ – $ (113)Interest payable (6) – – (6)Securities sold short (525) – – (525)Securities sold under repurchase agreements (283) – – (283)Capital market debt financing (1,027) (398) (320) (1,745)Trade payable and other liabilities (24) – (13) (37)
Total $ (1,978) $ (398) $ (333) $ (2,709)
(Canadian $ millions)Less than 3 Months
3 to 12 Months
Over 1 Year Total
Derivative-related financial instrumentsDerivative-related assets $ 367 $ 156 $ 107 $ 630Derivative-related liabilitiesA (62) (39) (127) (228)
Total $ 305 $ 117 $ (20) $ 402
A Liabilities are presented in the earliest period in which the counterparty can request payment.
ANNUAL REPORT 2017 | PUBLIC SECTOR PENSION INVESTMENT BOARD188

CANADIAN FORCES PENSION PLAN ACCOUNTNotes to the Financial Statements for the years ended March 31, 2017 and 2016
8 BORROWINGS
8.1. CREDIT FACILITIES
During the year ended March 31, 2017, PSP Investments entered into a revolving credit facility in the amount of $2 billion and a demand line of credit in the amount of $1 billion (together “the Credit Facilities”).
The Credit Facilities are for general corporate purposes and are available in either Canadian or US currencies. Subject to customary terms and conditions, these Credit Facilities are available at variable interest rates such as the prime rate and the US base rate.
These Credit Facilities were not drawn upon as at the end of the reporting period.
8.2. CAPITAL MARKET DEBT FINANCING
PSP Investments’ capital market debt program consists of the private placement of short-term promissory notes as well as medium-term notes issued by PSP Capital Inc., a wholly-owned subsidiary of PSP Investments. The capital raised is primarily used to finance private market investments. It is unconditionally and irrevocably guaranteed by PSP Investments in accordance with its corporate leverage policy.
The maximum amount authorized by the Board of Directors for the capital market debt program is 10% of the net investments plus all recourse debt outstanding of PSP Investments at the time of commitment to issuance. Under this limit, the short-term promissory note component cannot exceed $3 billion for issuances in Canada and US$5 billion for issuances in the United States.
PSP Investments’ capital market debt financing was in compliance with the limits authorized by the Board of Directors during the years ended March 31, 2017 and March 31, 2016.
The following outlines the terms as well as the fair value of the notes issued under the capital market debt program allocated to the Plan Account as at:
March 31, 2017 March 31, 2016
(Canadian $ millions)
Capital Amounts
Payable at Maturity Fair Value
Capital Amounts
Payable at Maturity Fair Value
Short-term Canadian Dollar promissory notes, bearing interest between 0.57% and 0.78% and maturing within 26 and 273 days of issuance (March 31, 2016 – 56 and 185 days) $ 265 $ 265 $ 240 $ 240
Short-term US Dollar promissory notes, bearing interest between 0.68% and 1.16% and maturing within 30 and 266 days of issuance (March 31, 2016 – 63 and 196 days) 1,116 1,115 967 966
Medium-term notes Series 4, bearing interest of 2.26% per annum and matured on February 16, 2017 – – 177 180
Medium-term notes Series 5, bearing interest of 3.03% per annum and maturing on October 22, 2020 99 104 99 106
Medium-term notes Series 6, bearing variable interest of 3-month CDOR and matured on April 4, 2016 – – 39 39
Medium-term notes Series 7, bearing interest of 3.29% per annum and maturing on April 4, 2024 194 209 197 214
Medium-term notes Series 8, bearing interest of 1.34% per annum and maturing on August 18, 2021 245 243 – –
Medium-term notes Series 9, bearing interest of 2.09% per annum and maturing on November 22, 2023 191 191 – –
Total $ 2,110 $ 2,127 $ 1,719 $ 1,745
Unrealized losses in connection with borrowings amounted to $82 million for the year ended March 31, 2017 (unrealized gains of $107 million for the year ended March 31, 2016).
Interest expense, for the year ended March 31, was as follows:
(Canadian $ millions) 2017 2016
Short-term promissory notes $ 10 $ 4Medium-term notes 16 16
Total $ 26 $ 20
PUBLIC SECTOR PENSION INVESTMENT BOARD | ANNUAL REPORT 2017 189

CANADIAN FORCES PENSION PLAN ACCOUNTNotes to the Financial Statements for the years ended March 31, 2017 and 2016
9 EQUITY
9.1. STATUTORY RIGHTS HELD BY THE GOVERNMENT OF CANADA
Pursuant to the Superannuation Acts, the Government of Canada is entitled to PSP Investments’ net assets allocated to each of the Plan Accounts for the purposes set out in the Superannuation Acts. The allocation of PSP Investments’ net assets and comprehensive income (loss) to each of the Plan Accounts at a point in time is based on the allocation policy outlined in Note 12.
9.2. FUND TRANSFERS
PSP Investments received fund transfers from the Government of Canada of $659 million for the year ended March 31, 2017 ($849 million for the year ended March 31, 2016) for the Fund, recorded in the Plan Account.
10 INVESTMENT-RELATED EXPENSES
Investment-related expenses allocated to the Plan Account are comprised of the following for the year ended March 31:
(Canadian $ millions) 2017 2016
Interest expense $ 30 $ 23Transaction costs 26 20External investment
management feesA 6 7Other (net) 9 4
Total $ 71 $ 54
A Consists of amounts incurred for investments in public markets that are paid directly by PSP Investments. Other fees are paid by certain pooled fund investments classified under alternative investments which amounted to $30 million for the year ended March 31, 2017 ($12 million for the year ended March 31, 2016). Such fees are embedded in the fair value of the funds.
Similarly, management fees related to investments in private markets and private debt securities are not paid directly by PSP Investments. Such fees, which generally vary between 0.1% and 2.0% of the total invested and/or committed amount, totaled $58 million for the year ended March 31, 2017 ($47 million for the year ended March 31, 2016). Such fees are embedded in the fair value of the investments.
11 OPERATING EXPENSES
Operating expenses allocated to the Plan Account consisted of the following for the year ended March 31:
(Canadian $ thousands) 2017 2016
Salaries and employee benefits $ 41,301 $ 32,935Professional and consulting fees 12,103 8,913Premises and equipment 4,115 3,138Market data and
business applications 5,240 4,408Depreciation of equipment 6,009 5,096Custodial fees 766 855Other operating expenses 3,302 2,642
Total $ 72,836 $ 57,987
12 ALLOCATION OF COMPREHENSIVE INCOME (LOSS)
PSP Investments’ comprehensive income (loss) is allocated to each Plan Account as follows:
12.1. INVESTMENT INCOME
The investment income is allocated proportionately based upon the net investments of each Plan Account at the time the income was incurred.
12.2. EXPENSES
The Act requires that the costs of operation of PSP Investments be charged to the Plan Accounts. Under section 4(3) of the Act, the President of the Treasury Board shall determine to which Plan Account these costs will be charged, in consultation with the Minister of National Defence and the Minister of Public Safety and Emergency Preparedness. An allocation policy was developed which allocates the direct costs of investment activities, such as external investment management fees and custodial fees, to each Plan Account, based upon the net investments of each Plan Account at the time the expense was incurred.
Operating expenses and other comprehensive income (loss), excluding the direct cost of investment activities listed above, for the year ended March 31, were allocated in proportion to the annual amount of net investments of each Plan Account as follows:
2017 2016
Public Service Pension Plan Account 72.5% 72.6%
Canadian Forces Pension Plan Account 19.7 19.7
Royal Canadian Mounted Police Pension Plan Account 7.3 7.2
Reserve Force Pension Plan Account 0.5 0.5
Total 100.0% 100.0%
Expenses are paid by PSP Investments by way of advances from the Public Service Pension Plan Account, which are reimbursed by the other Plan Accounts on a quarterly basis.
ANNUAL REPORT 2017 | PUBLIC SECTOR PENSION INVESTMENT BOARD190
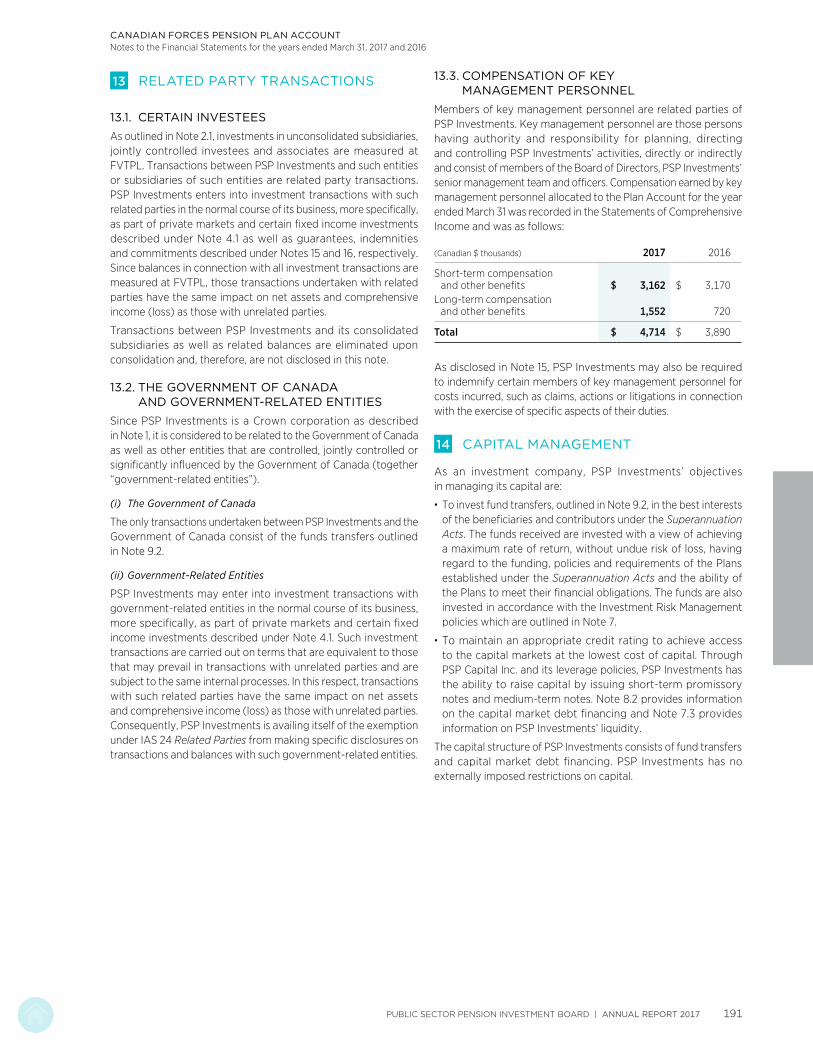
CANADIAN FORCES PENSION PLAN ACCOUNTNotes to the Financial Statements for the years ended March 31, 2017 and 2016
13 RELATED PARTY TRANSACTIONS
13.1. CERTAIN INVESTEES
As outlined in Note 2.1, investments in unconsolidated subsidiaries, jointly controlled investees and associates are measured at FVTPL. Transactions between PSP Investments and such entities or subsidiaries of such entities are related party transactions. PSP Investments enters into investment transactions with such related parties in the normal course of its business, more specifically, as part of private markets and certain fixed income investments described under Note 4.1 as well as guarantees, indemnities and commitments described under Notes 15 and 16, respectively. Since balances in connection with all investment transactions are measured at FVTPL, those transactions undertaken with related parties have the same impact on net assets and comprehensive income (loss) as those with unrelated parties.
Transactions between PSP Investments and its consolidated subsidiaries as well as related balances are eliminated upon consolidation and, therefore, are not disclosed in this note.
13.2. THE GOVERNMENT OF CANADA AND GOVERNMENT-RELATED ENTITIES
Since PSP Investments is a Crown corporation as described in Note 1, it is considered to be related to the Government of Canada as well as other entities that are controlled, jointly controlled or significantly influenced by the Government of Canada (together “government-related entities”).
(i) The Government of Canada
The only transactions undertaken between PSP Investments and the Government of Canada consist of the funds transfers outlined in Note 9.2.
(ii) Government-Related Entities
PSP Investments may enter into investment transactions with government-related entities in the normal course of its business, more specifically, as part of private markets and certain fixed income investments described under Note 4.1. Such investment transactions are carried out on terms that are equivalent to those that may prevail in transactions with unrelated parties and are subject to the same internal processes. In this respect, transactions with such related parties have the same impact on net assets and comprehensive income (loss) as those with unrelated parties. Consequently, PSP Investments is availing itself of the exemption under IAS 24 Related Parties from making specific disclosures on transactions and balances with such government-related entities.
13.3. COMPENSATION OF KEY MANAGEMENT PERSONNEL
Members of key management personnel are related parties of PSP Investments. Key management personnel are those persons having authority and responsibility for planning, directing and controlling PSP Investments’ activities, directly or indirectly and consist of members of the Board of Directors, PSP Investments’ senior management team and officers. Compensation earned by key management personnel allocated to the Plan Account for the year ended March 31 was recorded in the Statements of Comprehensive Income and was as follows:
(Canadian $ thousands) 2017 2016
Short-term compensation and other benefits $ 3,162 $ 3,170
Long-term compensation and other benefits 1,552 720
Total $ 4,714 $ 3,890
As disclosed in Note 15, PSP Investments may also be required to indemnify certain members of key management personnel for costs incurred, such as claims, actions or litigations in connection with the exercise of specific aspects of their duties.
14 CAPITAL MANAGEMENT
As an investment company, PSP Investments’ objectives in managing its capital are:
· To invest fund transfers, outlined in Note 9.2, in the best interests of the beneficiaries and contributors under the Superannuation Acts. The funds received are invested with a view of achieving a maximum rate of return, without undue risk of loss, having regard to the funding, policies and requirements of the Plans established under the Superannuation Acts and the ability of the Plans to meet their financial obligations. The funds are also invested in accordance with the Investment Risk Management policies which are outlined in Note 7.
· To maintain an appropriate credit rating to achieve access to the capital markets at the lowest cost of capital. Through PSP Capital Inc. and its leverage policies, PSP Investments has the ability to raise capital by issuing short-term promissory notes and medium-term notes. Note 8.2 provides information on the capital market debt financing and Note 7.3 provides information on PSP Investments’ liquidity.
The capital structure of PSP Investments consists of fund transfers and capital market debt financing. PSP Investments has no externally imposed restrictions on capital.
PUBLIC SECTOR PENSION INVESTMENT BOARD | ANNUAL REPORT 2017 191
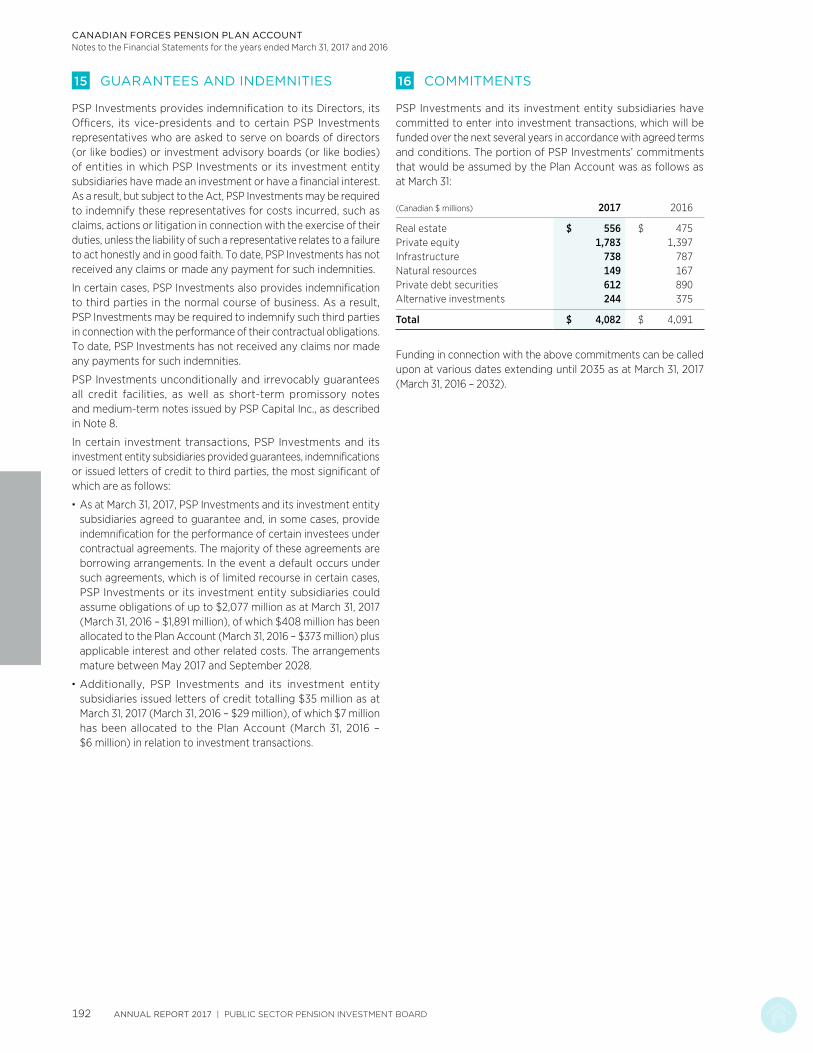
CANADIAN FORCES PENSION PLAN ACCOUNTNotes to the Financial Statements for the years ended March 31, 2017 and 2016
15 GUARANTEES AND INDEMNITIES
PSP Investments provides indemnification to its Directors, its Officers, its vice-presidents and to certain PSP Investments representatives who are asked to serve on boards of directors (or like bodies) or investment advisory boards (or like bodies) of entities in which PSP Investments or its investment entity subsidiaries have made an investment or have a financial interest. As a result, but subject to the Act, PSP Investments may be required to indemnify these representatives for costs incurred, such as claims, actions or litigation in connection with the exercise of their duties, unless the liability of such a representative relates to a failure to act honestly and in good faith. To date, PSP Investments has not received any claims or made any payment for such indemnities.
In certain cases, PSP Investments also provides indemnification to third parties in the normal course of business. As a result, PSP Investments may be required to indemnify such third parties in connection with the performance of their contractual obligations. To date, PSP Investments has not received any claims nor made any payments for such indemnities.
PSP Investments unconditionally and irrevocably guarantees all credit facilities, as well as short-term promissory notes and medium-term notes issued by PSP Capital Inc., as described in Note 8.
In certain investment transactions, PSP Investments and its investment entity subsidiaries provided guarantees, indemnifications or issued letters of credit to third parties, the most significant of which are as follows:
· As at March 31, 2017, PSP Investments and its investment entity subsidiaries agreed to guarantee and, in some cases, provide indemnification for the performance of certain investees under contractual agreements. The majority of these agreements are borrowing arrangements. In the event a default occurs under such agreements, which is of limited recourse in certain cases, PSP Investments or its investment entity subsidiaries could assume obligations of up to $2,077 million as at March 31, 2017 (March 31, 2016 – $1,891 million), of which $408 million has been allocated to the Plan Account (March 31, 2016 – $373 million) plus applicable interest and other related costs. The arrangements mature between May 2017 and September 2028.
· Additionally, PSP Investments and its investment entity subsidiaries issued letters of credit totalling $35 million as at March 31, 2017 (March 31, 2016 – $29 million), of which $7 million has been allocated to the Plan Account (March 31, 2016 – $6 million) in relation to investment transactions.
16 COMMITMENTS
PSP Investments and its investment entity subsidiaries have committed to enter into investment transactions, which will be funded over the next several years in accordance with agreed terms and conditions. The portion of PSP Investments’ commitments that would be assumed by the Plan Account was as follows as at March 31:
(Canadian $ millions) 2017 2016
Real estate $ 556 $ 475Private equity 1,783 1,397Infrastructure 738 787Natural resources 149 167Private debt securities 612 890Alternative investments 244 375
Total $ 4,082 $ 4,091
Funding in connection with the above commitments can be called upon at various dates extending until 2035 as at March 31, 2017 (March 31, 2016 – 2032).
ANNUAL REPORT 2017 | PUBLIC SECTOR PENSION INVESTMENT BOARD192

Royal Canadian Mounted Police Pension Plan Account
FINANCIAL STATEMENTS
Independent Auditors’ ReportTo the Minister of Public Safety and Emergency Preparedness
Report on the Financial Statements
We have audited the accompanying financial statements of the Public Sector Pension Investment Board — Royal Canadian Mounted Police Pension Plan Account (the Royal Canadian Mounted Police Pension Plan Account), which comprise the statements of financial position as at March 31, 2017 and March 31, 2016, and the statements of comprehensive income, statements of changes in equity and statements of cash flows for the years then ended, and a summary of significant accounting policies and other explanatory information.
Management’s Responsibility for the Financial Statements
Management is responsible for the preparation and fair presentation of these financial statements in accordance with International Financial Reporting Standards as issued by the International Accounting Standards Board, and for such internal control as management determines is necessary to enable the preparation of financial statements that are free from material misstatement, whether due to fraud or error.
Auditor’s Responsibility
Our responsibility is to express an opinion on these financial statements based on our audits. We conducted our audits in accordance with Canadian generally accepted auditing standards. Those standards require that we comply with ethical requirements and plan and perform the audit to obtain reasonable assurance about whether the financial statements are free from material misstatement.
An audit involves performing procedures to obtain audit evidence about the amounts and disclosures in the financial statements. The procedures selected depend on the auditor’s judgment, including the assessment of the risks of material misstatement of the financial statements, whether due to fraud or error. In making those risk assessments, the auditor considers internal control
relevant to the entity’s preparation and fair presentation of the financial statements in order to design audit procedures that are appropriate in the circumstances, but not for the purpose of expressing an opinion on the effectiveness of the entity’s internal control. An audit also includes evaluating the appropriateness of accounting policies used and the reasonableness of accounting estimates made by management, as well as evaluating the overall presentation of the financial statements.
We believe that the audit evidence we have obtained in our audits is sufficient and appropriate to provide a basis for our audit opinion.
Opinion
In our opinion, the financial statements present fairly, in all material respects, the financial position of the Royal Canadian Mounted Police Pension Plan Account as at March 31, 2017 and March 31, 2016, and its financial performance and its cash flows for the years then ended in accordance with International Financial Reporting Standards as issued by the International Accounting Standards Board.
Report on Other Legal and Regulatory Requirements
As required by the Financial Administration Act, we report that, in our opinion, the accounting principles in International Financial Reporting Standards as issued by the International Accounting Standards Board have been applied on a basis consistent with that of the preceding year.
Further, in our opinion, the transactions in the Royal Canadian Mounted Police Pension Plan Account that have come to our notice during our audits of the financial statements have, in all significant respects, been in accordance with the applicable provisions of Part X of the Financial Administration Act and regulations, the Public Sector Pension Investment Board Act and regulations and the by-laws of the Public Sector Pension Investment Board and its wholly-owned subsidiaries.
Margaret Haire, CPA, CA Principal for the Auditor General of Canada
May 12, 2017 Ottawa, Canada
1 CPA auditor, CA, public accountancy permit No. A121444
May 12, 2017 Montréal, Canada
Royal Canadian Mounted Police Pension Plan Account
PUBLIC SECTOR PENSION INVESTMENT BOARD | ANNUAL REPORT 2017 193

ROYAL CANADIAN MOUNTED POLICE PENSION PLAN ACCOUNT
Statements of Financial PositionAs at
(Canadian $ millions) March 31, 2017 March 31, 2016
AssetsInvestments (Note 4.1) $ 11,522 $ 9,561Other assets 19 11
Total assets $ 11,541 $ 9,572
LiabilitiesTrade payable and other liabilities $ 16 $ 13Investment-related liabilities (Note 4.1) 898 427Borrowings (Notes 4.1, 8.2) 784 643Due to the Public Service Pension Plan Account 8 6
Total liabilities $ 1,706 $ 1,089
Net assets $ 9,835 $ 8,483
Equity (Note 9) $ 9,835 $ 8,483
Total liabilities and equity $ 11,541 $ 9,572
The accompanying notes are an integral part of the Financial Statements.
On behalf of the Board of Directors:
Michael P. Mueller William A. MacKinnon Chair of the Board Chair of the Audit Committee
ANNUAL REPORT 2017 | PUBLIC SECTOR PENSION INVESTMENT BOARD194

ROYAL CANADIAN MOUNTED POLICE PENSION PLAN ACCOUNT
Statements of Comprehensive Income For the years ended March 31
(Canadian $ millions) 2017 2016
Investment income $ 1,154 $ 102
Investment-related expenses (Note 10) (26) (20)
Net investment income $ 1,128 $ 82
Operating expenses (Note 11) (27) (21)
Net income $ 1,101 $ 61
Other comprehensive incomeRemeasurement of the net defined benefit liability – –
Comprehensive income $ 1,101 $ 61
Statements of Changes in Equity For the years ended March 31
(Canadian $ millions) 2017 2016
Fund transfersBalance at beginning of period $ 4,869 $ 4,523Fund transfers received during the period (Note 9.2) 251 346
Balance at end of period $ 5,120 $ 4,869
Retained earningsBalance at beginning of period $ 3,614 $ 3,553Comprehensive income 1,101 61
Balance at end of period $ 4,715 $ 3,614
Total equity $ 9,835 $ 8,483
The accompanying notes are an integral part of the Financial Statements.
PUBLIC SECTOR PENSION INVESTMENT BOARD | ANNUAL REPORT 2017 195

ROYAL CANADIAN MOUNTED POLICE PENSION PLAN ACCOUNT
Statements of Cash Flows For the years ended March 31
(Canadian $ millions) 2017 2016
Cash flows from operating activitiesNet income $ 1,101 $ 61Adjustments for non-cash items:
Depreciation of equipment (Note 11) 2 2Effect of exchange rate changes on cash and cash equivalents (4) 1Unrealized losses (gains) on borrowings 30 (39)
$ 1,129 $ 25
Net changes in operating assets and liabilitiesIncrease in investments $ (1,784) $ (539)Increase in other assets – (1)Increase in trade payable and other liabilities 3 –Increase in investment-related liabilities 471 63
Net cash flows used in operating activities $ (181) $ (452)
Cash flow from financing activitiesProceeds from borrowings $ 1,919 $ 1,785Repayment of borrowings (1,808) (1,638)Repayment to the Public Service Pension Plan Account (30) (28)Advances from the Public Service Pension Plan Account 32 28Fund transfers received 251 346
Net cash flows provided by financing activities $ 364 $ 493
Cash flow from investing activitiesAcquisitions of equipment $ (3) $ (2)
Net cash flows used in investing activities $ (3) $ (2)
Net change in cash and cash equivalents $ 180 $ 39Effect of exchange rate changes on cash and cash equivalents 4 (1)Cash and cash equivalents at the beginning of the period 101 63
Cash and cash equivalents at the end of the periodA $ 285 $ 101
Supplementary disclosure of cash flow informationInterest paid $ (10) $ (8)
A As at March 31, 2017, cash and cash equivalents were comprised of $277 million (March 31, 2016 – $100 million) held for investment purposes and included in Note 4.1, as well as $8 million (March 31, 2016 – $1 million) held for administrative purposes and included in Other assets.
The accompanying notes are an integral part of the Financial Statements.
ANNUAL REPORT 2017 | PUBLIC SECTOR PENSION INVESTMENT BOARD196

ROYAL CANADIAN MOUNTED POLICE PENSION PLAN ACCOUNT
1 CORPORATE INFORMATION
The Public Sector Pension Investment Board (“PSP Investments”) is a Crown corporation created under the Public Sector Pension Investment Board Act (the “Act”) to manage and invest amounts that are transferred to it pursuant to the Superannuation Acts (defined below), for the funds (as defined in the Act) of the pension plans established under the Public Service Superannuation Act, the Canadian Forces Superannuation Act (“CFSA”), the Royal Canadian Mounted Police Superannuation Act (collectively the “Superannuation Acts”), and certain regulations under the CFSA (the “CFSA Regulations”). The pension plans established under the Superannuation Acts consist of the Public Service pension plan, the Canadian Forces pension plan, and the Royal Canadian Mounted Police pension plan (the “Plan”), and the pension plan established under the CFSA Regulations is the Reserve Force pension plan. The Plan and the other pension plans are herein referred to collectively as the “Plans”.
The fund for which amounts are currently transferred to PSP Investments by the Government of Canada (the “Fund”) relates to pension obligations under the Plan for service on or after April 1, 2000 (“Post-2000 Service”). The account managed by PSP Investments for the Fund is herein referred to as the “Plan Account”. PSP Investments maintains records of the net contributions for the Fund, as well as the allocation of its investments and the results of its operations for the Fund in the Plan Account. PSP Investments also manages a plan account for the funds of the other Plans, and these and the Plan Account are collectively referred to herein as the “Plan Accounts”.
PSP Investments is responsible for managing amounts that are transferred to it for the Fund in the best interests of the beneficiaries and contributors under the Royal Canadian Mounted Police Superannuation Act. The amounts are to be invested with a view of achieving a maximum rate of return, without undue risk of loss, having regard to the funding, policies and requirements of the Plan and the Plan’s ability to meet its financial obligations.
Pursuant to the Royal Canadian Mounted Police Superannuation Act, the Government of Canada, which administers the Plan and the Fund, may at any time call upon the net assets of PSP Investments allocated to the Fund’s Plan Account for amounts required for the purpose of paying benefits under the Plan in respect of Post-2000 Service, or generally, for the purpose of reducing any non-permitted surplus in the Fund.
PSP Investments and the majority of its subsidiaries are exempt from Part I tax under paragraphs 149(1)(d) and 149(1)(d.2) of the Income Tax Act (Canada), respectively.
PSP Investments’ registered office is located at 1 Rideau Street, Ottawa, Ontario, Canada and its principal business office is at 1250 René Lévesque Boulevard West, Montreal, Quebec, Canada.
2 SIGNIFICANT ACCOUNTING POLICIES
The significant accounting policies that have been applied in the preparation of these Financial Statements are summarized below and have been used throughout all periods presented.
2.1. BASIS OF PRESENTATION
These Financial Statements have been prepared in accordance with International Financial Reporting Standards (“IFRS”) as issued by the International Accounting Standards Board (“IASB”).
PSP Investments qualifies as an investment entity as defined under IFRS 10 Consolidated Financial Statements and, consequently, does not consolidate its subsidiaries other than those that solely provide it with services that relate to its investment activities. Instead, PSP Investments measures its investments in subsidiaries at fair value through profit or loss (“FVTPL”) in accordance with IFRS 9 Financial Instruments (“IFRS 9”), including those that are formed by PSP Investments and that qualify as investment entities (“investment entity subsidiaries”). PSP Investments also measures its investments in associates, joint ventures and financial assets and financial liabilities at FVTPL in accordance with IAS 28 Investments in Associates and Joint Ventures and IFRS 9.
These Financial Statements present the Plan Account’s financial position and results of operations of PSP Investments and its subsidiaries that solely provide it with services that relate to its investment activities, as allocated to the Plan Account. They reflect the economic activity of PSP Investments as it pertains to the investment of the net contributions transferred to it for the Fund in respect of Post-2000 Service. Accordingly, they do not reflect all of the assets or the details of the pension contributions, payments and liabilities under the Plan.
These Financial Statements were authorized for issue in accordance with a resolution of the Board of Directors on May 12, 2017.
Notes to the Financial StatementsFor the years ended March 31, 2017 and 2016
PUBLIC SECTOR PENSION INVESTMENT BOARD | ANNUAL REPORT 2017 197

ROYAL CANADIAN MOUNTED POLICE PENSION PLAN ACCOUNTNotes to the Financial Statements for the years ended March 31, 2017 and 2016
2 SIGNIFICANT ACCOUNTING POLICIES (continued)
2.2. INVESTMENT ENTITY STATUS
PSP Investments has determined that it meets the mandatory items of the definition of an investment entity under IFRS 10 on the basis of the facts and circumstances as at the end of the period. They are as follows:
(i) Mandate and business purpose
As further described in Note 1, PSP Investments’ mandate is to manage and invest the amounts that are transferred to it in the best interests of the beneficiaries and contributors under the Superannuation Acts. Consequently, PSP Investments’ business purpose is to invest with a view of achieving a maximum rate of return from capital appreciation and income from investments, without undue risk of loss.
(ii) Performance evaluation
PSP Investments measures and evaluates the performance of its investments on a fair value basis.
In addition to the mandatory items of the definition, IFRS 10 also outlines certain typical characteristics of an investment entity, the absence of any of which does not necessarily preclude an entity from qualifying as an investment entity. One of these characteristics is that an investment entity should have investors that are not related parties of the entity.
As described in Note 13, since PSP Investments is a Crown corporation, it is considered to be related to the Government of Canada as well as other entities that are controlled or jointly controlled by the Government of Canada or entities over which the latter has significant influence. Consequently, since the funds managed by PSP Investments originate from related parties, it may be considered not to meet the typical characteristic outlined above. However, the Act provides a framework to ensure that PSP Investments operates at arm’s length from the Government of Canada. Accordingly, it meets all of the mandatory items of the definition described above and qualifies as an investment entity.
Should any changes occur in the facts and circumstances, PSP Investments will evaluate the impact of any such changes on its investment entity status.
2.3. SUMMARY OF SIGNIFICANT ACCOUNTING POLICIES
The principal accounting policies applied in the preparation of these Financial Statements are set out below.
2.3.1. Financial Instruments
(i) Classification
Financial assets representing investments are managed, together with related financial liabilities, according to the entity’s business model to maximize the rate of return. The performance of such financial instruments is evaluated on a fair value basis and they are classified at FVTPL. They are described in detail in Note 4.1.
Borrowings as described under Note 8, are financial liabilities that are designated to be measured at FVTPL since they are part of the portfolios of investments that are managed together and whose performance is evaluated on a fair value basis.
(ii) Recognition
Financial assets and financial liabilities are recorded at the date upon which PSP Investments becomes a party to the associated contractual provisions. In the case of traded financial assets, they are recorded as of the trade date.
(iii) Initial and subsequent measurement
All financial assets and financial liabilities are recorded in the Statements of Financial Position at fair value and continue to be measured as such on a recurring basis. After initial measurement, subsequent changes in the fair value of financial assets and financial liabilities classified at FVTPL are recorded in the Statements of Comprehensive Income.
If fair value changes in financial liabilities designated to be measured at FVTPL result from fluctuations in PSP Investments’ own credit risk, they are recorded in other comprehensive income. All other changes in fair value are recorded in investment income.
(iv) Derecognition
A financial asset (or, where applicable, a part thereof) is derecognized when the following conditions are met:
· The rights to receive cash flows from the asset have expired, or
· PSP Investments has transferred its rights to receive cash flows from the asset or has assumed an obligation to pay the received cash flows to a third party,
and
· PSP Investments has transferred substantially all the risks and rewards of the asset, or
· In cases where PSP Investments has neither transferred nor retained substantially all the risks and rewards of the asset, it has transferred control of the asset.
A financial liability is derecognized when the obligation under the liability is discharged, cancelled or expired.
ANNUAL REPORT 2017 | PUBLIC SECTOR PENSION INVESTMENT BOARD198

ROYAL CANADIAN MOUNTED POLICE PENSION PLAN ACCOUNTNotes to the Financial Statements for the years ended March 31, 2017 and 2016
2 SIGNIFICANT ACCOUNTING POLICIES (continued)
2.3. SUMMARY OF SIGNIFICANT ACCOUNTING POLICIES (continued)
2.3.2. Determination of Fair Value
Fair value is the price that would be received to sell an asset or paid to transfer a liability in an orderly transaction between market participants at the measurement date.
At initial recognition, PSP Investments evaluates the facts and circumstances related to a transaction to confirm that the transaction price represents the fair value of an asset or a liability. At each subsequent reporting date, market prices are used to determine fair value where an active market exists (such as a recognized securities exchange), as they reflect actual and regularly occurring market transactions on an arm’s length basis. If quoted market prices are not available, then fair value is estimated using valuation techniques based on inputs existing at the end of the reporting period that are derived from observable market data.
Valuation techniques are generally applied to investments in Private Markets, over-the-counter (OTC) derivatives and certain fixed income securities. The values derived from applying these techniques are impacted by the choice of valuation model and the underlying assumptions made concerning factors such as the amounts and timing of future cash flows, discount rates, volatility and credit risk. In certain cases, such assumptions are not supported by market observable data.
The determination of fair value of all financial assets and financial liabilities is described in Note 4.
2.3.3. Functional and Presentation Currency
The functional and presentation currency of PSP Investments and its consolidated subsidiaries is the Canadian dollar, which is the currency of the primary economic environment in which each entity within the consolidated group operates. PSP Investments’ performance and that of its consolidated subsidiaries is evaluated and its liquidity is managed in Canadian dollars.
2.3.4. Foreign Currency Translation
Foreign currency transactions during the period, including purchases and sales of securities, income and expenses, are translated at the rate of exchange prevailing on the date of the transaction.
Monetary assets and liabilities that are denominated in foreign currencies are translated at the functional currency rate of exchange prevailing at the end of the reporting period.
Foreign currency transaction gains and losses on all monetary assets and liabilities are included in investment income.
2.3.5. Securities Lending and Securities Borrowing and Related Collateral
PSP Investments participates in securities lending and borrowing programs whereby it lends and borrows securities in order to enhance portfolio returns. Lending and borrowing transactions including related collateral under such programs do not transfer the risks or rewards of ownership of the securities to the counterparty. Consequently, PSP Investments does not derecognize securities lent or pledged as collateral, or recognize securities borrowed or received as collateral. Cash collateral received is recognized as described in Note 4.1.8.
The securities lending and borrowing programs require collateral in cash, high-quality debt instruments or securities. Collateral transactions are conducted under terms that are usual and customary in standard securities lending and borrowing programs. PSP Investments and its counterparties are authorized to sell, repledge or otherwise use collateral held. The same securities or equivalent securities must be returned to the counterparty at the end of the contract, unless an event of default occurs.
2.3.6. Securities sold under Repurchase Agreements and purchased under Reverse Repurchase Agreements and Related Collateral
PSP Investments is party to repurchase and reverse repurchase agreements. Such agreements involve the sale of securities by one counterparty with a simultaneous agreement to repurchase such securities at a specified price and at a specified future date.
Securities sold or purchased under the repurchase and reverse repurchase agreements respectively, including related collateral, are not derecognized or recognized as all risks and rewards of ownership related to such securities are not transferred. As such, in the case where PSP Investments is the counterparty selling securities under such agreements, all income (loss) related to such securities continues to be reported in investment income and obligations to repurchase the securities sold are accounted for as investment-related liabilities. The difference between the fair value of the securities sold and the repurchase price is recorded as interest expense. In the case where PSP Investments is the counterparty purchasing securities under such agreements, no income (loss) related to such securities is recognized and obligations to resell the securities are accounted for as investment-related receivables. The difference between the fair value of the securities purchased and resale price is recorded in investment income.
Transactions under repurchase and reverse repurchase agreements involve pledging collateral consisting of cash or securities deemed acceptable by the counterparties. Collateral transactions are conducted under terms that are usual and customary in standard repurchase arrangements. Such terms require the relevant counterparty to pledge additional collateral based on the changes in the fair value of the existing collateral pledged as well as the related securities sold or purchased. The counterparties are authorized to sell, repledge or otherwise use collateral held. The securities pledged as collateral must be returned to the relevant counterparty at the end of the contract, unless an event of default occurs.
PUBLIC SECTOR PENSION INVESTMENT BOARD | ANNUAL REPORT 2017 199

ROYAL CANADIAN MOUNTED POLICE PENSION PLAN ACCOUNTNotes to the Financial Statements for the years ended March 31, 2017 and 2016
2 SIGNIFICANT ACCOUNTING POLICIES (continued)
2.3. SUMMARY OF SIGNIFICANT ACCOUNTING POLICIES (continued)
2.3.7. Offsetting of Financial Instruments
Financial assets and financial liabilities are offset with the net amount reported in the Statements of Financial Position only if PSP Investments has a current legally enforceable right to offset the recognized amounts and the intent to settle on a net basis, or to realize the assets and settle the liabilities simultaneously.
2.3.8. Equity
The statutory rights of the Government of Canada pursuant to the Superannuation Acts are described under Note 1 and are classified as equity instruments on the following basis:
· Under such rights the Government of Canada is entitled to PSP Investments’ net assets at any time for the purposes set out in the Superannuation Acts. Such rights do not contain any additional obligations for PSP Investments to deliver amounts to the Government of Canada.
· Such rights are the most subordinate claim on PSP Investments’ net assets.
· The total expected cash flows attributable to such rights, at any time, is solely based on the fair value of the net assets of PSP Investments at that time. Further, the fair value of the net assets of PSP Investments in its entirety represents the amounts that the Government of Canada may call upon at any time.
2.3.9. Investment Income
Investment income is made up of interest, dividends, gains (losses) on the disposal of financial assets and financial liabilities as well as gains (losses) which reflect the change in unrealized appreciation (depreciation) of financial assets held and financial liabilities outstanding at the end of the reporting period. Interest is recognized, on a consistent basis, using the prescribed rates until maturity. Dividends are recognized when the right to receive them has been obtained, generally on the ex-dividend date.
2.3.10. Investment-Related Expenses
Investment-related expenses are made up of interest expense, as described in Note 4.1.7, transaction costs, external investment management fees and other (net).
Transaction costs are incremental costs directly attributable to the acquisition, due diligence, issue, or disposal of a financial asset or financial liability, and they are expensed as incurred.
External investment management fees are directly attributable to the external management of assets on behalf of PSP Investments. These fees are paid directly by PSP Investments and comprise base fees accrued as a percentage of the fair value of the assets managed externally and performance fees accrued as a function of various performance indicators. This excludes amounts not paid directly by PSP Investments for certain pooled fund investments classified under alternative investments and for investments in private markets and other fixed income securities as outlined in Note 10.
2.3.11. Fund Transfers
Amounts are received from the Government of Canada for the Fund and are recorded in the Plan Account.
2.4. SIGNIFICANT ACCOUNTING JUDGMENTS, ESTIMATES AND ASSUMPTIONS
In preparing the Financial Statements, management makes certain judgments, estimates and assumptions that can affect the amounts reported therein. Significant judgments include those related to the determination of the investment entity status as described in Note 2.2.
Management also makes estimates and assumptions in the measurement, risk assessment and related disclosures surrounding investments in private markets and certain fixed income securities. The main assumptions made by management regarding measurement of financial instruments are outlined in Note 4.2.3 and those regarding the assessment of risk are outlined in Note 7.
Although estimates and assumptions reflect management’s best judgment, actual results may differ from such estimates due to the uncertainties involved in using them.
ANNUAL REPORT 2017 | PUBLIC SECTOR PENSION INVESTMENT BOARD200

ROYAL CANADIAN MOUNTED POLICE PENSION PLAN ACCOUNTNotes to the Financial Statements for the years ended March 31, 2017 and 2016
3 CURRENT AND FUTURE CHANGES IN ACCOUNTING STANDARDS
3.1. ACCOUNTING STANDARDS ADOPTED IN THE CURRENT YEAR
IFRS 11 Joint Arrangements
IFRS 11 was amended, effective for annual periods beginning on or after January 1, 2016, to add new guidance on the accounting for acquisitions of interests in a joint operation that constitutes a business. Acquirers of such interests shall apply all of the principles in business combinations accounting in IFRS 3 Business Combinations, and other IFRS, that do not conflict with the guidance in IFRS 11 and disclose the information that is required in those IFRS in relation to business combinations. On April 1, 2016, PSP Investments adopted this amendment with no impact on the presentation of the Financial Statements.
3.2. ACCOUNTING STANDARDS ADOPTED BEFORE THE EFFECTIVE DATE
IFRS 9 Financial Instruments
In 2014, the IASB completed its project to replace IAS 39 Financial Instruments: Recognition and Measurement with IFRS 9. The Standard includes requirements for recognition, derecognition, classification and measurement of financial assets and liabilities. IFRS 9 is effective for annual periods beginning on or after January 1, 2018 with early application permitted.
PSP Investments initially adopted IFRS 9 (2014) in its Consolidated Financial Statements for the year ended March 31, 2016. Significant accounting policies in connection with IFRS 9 are described under Note 2.3.1.
3.3. FUTURE ACCOUNTING STANDARDS
A number of new standards, amendments and interpretations have been issued by the IASB, but are not yet effective. The following relates to one or more of PSP Investments’ significant accounting policies or disclosures:
IAS 7 Statement of Cash Flows
IAS 7 was amended, effective for annual periods beginning on or after January 1, 2017, to add new guidance on disclosures that enable users of financial statements to evaluate changes in liabilities arising from financing activities, including both changes arising from cash flows and non-cash changes. PSP Investments will apply the amendments starting from April 1, 2017 and will make the required note disclosures in the Financial Statements.
IAS 28 Investment in Associates and Joint Ventures
IAS 28 was amended, effective for annual periods beginning on or after January 1, 2018, to add a clarification that serves to elaborate and clarify that the election to measure investees at fair value is available on an investment by investment basis and is not an election that must be applied consistently to the measurement of all associates and joint ventures. Management has determined that the amendment will not have an impact on the Financial Statements.
PUBLIC SECTOR PENSION INVESTMENT BOARD | ANNUAL REPORT 2017 201

ROYAL CANADIAN MOUNTED POLICE PENSION PLAN ACCOUNTNotes to the Financial Statements for the years ended March 31, 2017 and 2016
4 FINANCIAL ASSETS AND FINANCIAL LIABILITIES
4.1. CLASSES OF FINANCIAL ASSETS AND FINANCIAL LIABILITIES
Financial assets and financial liabilities are aggregated, in the following table, in classes that reflect their respective exposure as well as investment sectors. Their fair values were as follows, as at:
(Canadian $ millions) March 31, 2017 March 31, 2016
Public marketsCanadian equity $ 461 $ 463Foreign equity 2,140 1,892
Private marketsReal estate 1,766 1,634Private equity 988 818Infrastructure 958 691Natural resources 309 221
Fixed incomeCash and money market securities 898 430Government and corporate bonds 1,581 1,450Inflation-linked bonds 560 538Private debt securitiesA 664 385Other fixed income securitiesA 241 192
Alternative investments 582 482
$ 11,148 $ 9,196
Investment-related assetsAmounts receivable from pending trades $ 83 $ 32Interest receivable 23 16Dividends receivable 10 7Securities purchased under reverse repurchase agreements 193 78Derivative-related assets 65 232
$ 374 $ 365
Investments representing financial assets at FVTPL $ 11,522 $ 9,561
Investment-related liabilitiesAmounts payable from pending trades $ (78) $ (42)Interest payable (3) (2)Securities sold short and securities loaned (676) (194)Securities sold under repurchase agreements (80) (105)Derivative-related liabilities (61) (84)
Investment-related liabilities representing financial liabilities at FVTPL $ (898) $ (427)
BorrowingsCapital market debt financing $ (784) $ (643)
Borrowings representing financial liabilities designated at FVTPL $ (784) $ (643)
Net investments $ 9,840 $ 8,491
A During the year ended March 31, 2017, private debt securities were reclassified out of other fixed income securities and into a standalone caption in order to better reflect their nature and common characteristics. Accordingly, comparative figures were adjusted to decrease other fixed income securities by $385 million and increase private debt securities by the same amount. Notes 4.2.1 and 4.2.3 were adjusted similarly.
4.1.1. Public Markets
Public markets consist of Canadian and foreign investments in the following securities: common shares, American depository receipts, global depository receipts, participation notes, preferred shares, income trust units, exchange traded funds units, pooled funds units, and securities convertible into common shares of publicly listed issuers.
Direct investments in Canadian and foreign equities are measured at fair value using quoted prices in active markets and are based on the most representative price within the bid-ask spread.
In the case of investments in pooled funds, fair value is measured using unit values obtained from each of the funds’ administrators, which are derived from the fair value of the underlying investments in each pooled fund. Management reviews the fair value received and, where necessary, the impact of restrictions on the sale or redemption of such investments is taken into consideration.
ANNUAL REPORT 2017 | PUBLIC SECTOR PENSION INVESTMENT BOARD202

ROYAL CANADIAN MOUNTED POLICE PENSION PLAN ACCOUNTNotes to the Financial Statements for the years ended March 31, 2017 and 2016
4 FINANCIAL ASSETS AND FINANCIAL LIABILITIES (continued)
4.1. CLASSES OF FINANCIAL ASSETS AND FINANCIAL LIABILITIES (continued)
4.1.2. Private Markets
Private markets consist of investments in real estate, private equity, infrastructure and natural resources.
Real estate investments are comprised of direct equity positions in various private entities, fund investments, as well as properties in the real estate sector. Real estate investments focus on partnerships, companies and properties operating mainly in the retirement and residential, office, retail, and industrial sectors, as well as private funds invested in real estate assets. Real estate investments are presented net of all third-party financing. As at March 31, 2017, leverage in the form of third-party financing undertaken by investment entity subsidiaries and direct real estate investments controlled by PSP Investments was $505 million for the Plan Account (March 31, 2016 – $457 million).
Private equity investments are comprised of fund investments with similar objectives, co-investments in private entities as well as direct equity positions.
Infrastructure investments are comprised of direct equity positions, fund investments and co-investments in various private entities. Infrastructure investments focus on entities engaged in the management, ownership or operation of assets in energy, transportation and other regulated businesses. Infrastructure investments are presented net of all third-party financing. As at March 31, 2017, leverage in the form of third-party financing undertaken by direct infrastructure investments controlled by PSP Investments was $286 million for the Plan Account (March 31, 2016 – $116 million).
Natural resources investments are comprised of direct equity positions, fund investments and partnerships. Natural resources investments focus on entities engaged in the management, ownership or operation of assets in timberlands, agriculture and upstream oil and gas.
The process for fair value measurement of private markets investments is described in Note 4.2.2 and the valuation techniques together with the significant inputs used are described in Note 4.2.3.
4.1.3. Fixed Income
Fixed income consists of cash and money market securities, government and corporate bonds, inflation-linked bonds, private debt securities and other fixed income securities.
Cash and money market securities include instruments having a maximum term to maturity of one year, such as treasury bills, certificates of deposit and bankers’ acceptances. A portion of such instruments has maturities of 90 days or less and is held to meet short-term financial commitments. Such instruments are readily convertible into known amounts of cash and have an insignificant risk of change in value. They are considered cash and cash equivalents for purposes of the Statements of Cash Flows and amounted to $277 million as at March 31, 2017 (March 31, 2016 – $100 million). Treasury bills are valued based on prices obtained from third-party pricing sources. Such prices are determined using the most representative price within a spread of dealer quotations. Certificates of deposit and bankers’ acceptances are recorded at cost plus accrued interest, which approximates their fair value given their short-term nature.
Government and corporate bonds include Canadian and foreign, federal, provincial, territorial and municipal bonds. Inflation-linked bonds are fixed income securities that earn inflation-adjusted returns.
Private debt securities are fixed income securities of private companies held directly or through private funds. Such debt securities take the form of senior debt, mezzanine and distressed debt and primary and secondary investments in leveraged loans. Private debt securities also include third-party loans such as junior and senior debts, construction loans, bridge loans, income-participating loans, as well as other structured finance products in the real estate sector.
Other fixed income securities consist of asset-backed securities and floating rate notes.
Fair values of government and most corporate bonds, inflation-linked bonds, floating rate notes and mortgage-backed securities are based on prices obtained from third-party pricing sources. Such prices are determined using either an appropriate interest rate curve with a spread associated with the credit quality of the issuer or other generally accepted pricing methodologies.
Asset-backed securities consist mainly of asset-backed term notes (ABTNs) and mortgage-backed securities. The ABTNs were received in exchange for third-party or non-bank sponsored asset-backed commercial paper (ABCP) that suffered a liquidity disruption in mid-August 2007 and were subsequently restructured in January 2009.
The fair values of certain corporate bonds, private debt securities and ABTNs are determined using valuation techniques. Such techniques, together with the significant inputs used, are described in Note 4.2.3.
The fair value measurement of fund investments included as part of private debt securities is described in Note 4.2.2.
PUBLIC SECTOR PENSION INVESTMENT BOARD | ANNUAL REPORT 2017 203

ROYAL CANADIAN MOUNTED POLICE PENSION PLAN ACCOUNTNotes to the Financial Statements for the years ended March 31, 2017 and 2016
4 FINANCIAL ASSETS AND FINANCIAL LIABILITIES (continued)
4.1. CLASSES OF FINANCIAL ASSETS AND FINANCIAL LIABILITIES (continued)
4.1.4. Alternative Investments
Alternative investments consist mainly of units of funds that hold a mix of equity, fixed income and derivative instruments as well as hedge funds. The fair value of these investments is determined based on the fair values reported by the funds’ administrators or general partners and reflects the fair value of the underlying equity, fixed income or derivative instruments, as applicable. Management reviews the fair value received and, where necessary, the impact of restrictions on the sale or redemption of such investments is taken into consideration.
4.1.5. Amounts Receivable and Payable from Pending Trades
Amounts receivable from pending trades consist of proceeds on sales of investments, excluding derivative financial instruments, which have been traded but remain unsettled at the end of the reporting period.
Amounts payable from pending trades consist of the cost of purchases of investments, excluding derivative financial instruments, which have been traded but remain unsettled at the end of the reporting period.
The fair value of amounts receivable and payable from pending trades reflects the value at which their underlying original sale or purchase transactions were undertaken.
4.1.6. Interest and Dividends Receivable
Interest and dividends are recorded at the amounts expected to be received at the end of the reporting period, which approximates fair value.
4.1.7. Interest Payable
With respect to the borrowings described in Note 4.1.10, interest is accrued at the amount expected to be paid at the end of the reporting period, which approximates fair value.
4.1.8. Securities Sold Short and Securities Loaned
Securities sold short reflect PSP Investments’ obligation to purchase securities pursuant to short selling transactions. In such transactions, PSP Investments sells securities it does not own with an obligation to purchase similar securities on the market to cover its position.
Using quoted market prices that are based on the most representative price within the bid-ask spread, the fair value of securities sold short is measured using the same method as the similar long positions presented within public markets and fixed income.
As part of securities lending and certain OTC derivative transactions, cash collateral is received and reinvested by PSP Investments. PSP Investments recognizes cash collateral received with a corresponding payable. The payable balance reflects the obligation of the transferee to return cash collateral to the transferor at the end of the transaction in the absence of an event of default by the transferor.
4.1.9. Securities Sold under Repurchase Agreements and Purchased under Reverse Repurchase Agreements
As described in Note 2.3.6, PSP Investments is party to repurchase and reverse repurchase agreements. Obligations to repurchase or resell the securities sold or purchased under such agreements are recorded at cost plus accrued interest, which approximates fair value.
4.1.10. Borrowings under the Capital Market Debt Program
PSP Investments’ capital market debt program is described in Note 8.2. Short-term promissory notes are recorded at cost plus accrued interest, which approximates fair value. The fair value of PSP Investments’ medium-term notes is based on prices that are obtained from third-party pricing sources. Such prices are determined using an interest rate curve with a spread consistent with PSP Investments’ credit quality.
ANNUAL REPORT 2017 | PUBLIC SECTOR PENSION INVESTMENT BOARD204

ROYAL CANADIAN MOUNTED POLICE PENSION PLAN ACCOUNTNotes to the Financial Statements for the years ended March 31, 2017 and 2016
4 FINANCIAL ASSETS AND FINANCIAL LIABILITIES (continued)
4.1. CLASSES OF FINANCIAL ASSETS AND FINANCIAL LIABILITIES (continued)
4.1.11. Derivative-Related Assets and Liabilities
Derivative financial instruments are financial contracts that are settled at a future date. The value of such instruments is derived from changes in the value of the underlying assets, interest or exchange rates. Derivative financial instruments do not, typically, require an initial net investment. In certain cases, they require an initial net investment that is less than what would be required to hold the underlying position directly. Derivative financial instruments can be listed or traded OTC. OTC instruments consist of those that are bilaterally negotiated and settled, and those that are cleared (OTC-cleared) by a central clearing party (CCP).
PSP Investments uses derivative financial instruments to enhance returns or to replicate investments synthetically. Derivatives are also used to reduce the risk associated with existing investments.
PSP Investments uses the following types of derivative financial instruments:
Swaps
Swaps are transactions whereby two counterparties exchange cash flow streams with each other based on predetermined conditions that include a notional amount and a term. Swaps are used to increase returns or to adjust exposures of certain assets without directly purchasing or selling the underlying assets.
Futures
Futures are standardized contracts to take or make delivery of an asset (buy or sell) at a predefined price and predefined future date. Futures are used to adjust exposures to specified assets without directly purchasing or selling the underlying assets.
Forwards
Forwards are contracts involving the sale by one party and the purchase by another party of a predefined amount of an underlying instrument, at a predefined price and at a predefined date in the future. Forwards are used to adjust exposures to specified assets without directly purchasing or selling the underlying assets.
Options
Options are contracts where the seller gives the purchaser the right, but not the obligation, to buy or sell a given amount of an underlying security, index, or commodity, at an agreed-upon price stipulated in advance, either at a determined date or at any time before the predefined maturity date.
Warrants and Rights
Warrants are options to purchase an underlying asset which is in the form of a transferable security and which can be listed on an exchange.
Rights are securities giving shareholders entitlement to purchase new shares issued by a corporation at a predetermined price (normally less than the current market price) in proportion to the number of shares already owned. Rights are issued only for a short period of time, after which they expire.
Determination of Fair Value of Derivative Financial Instruments
Listed derivative financial instruments are recorded at fair value using quoted market prices that are based on the most representative price within the bid-ask spread. OTC-cleared derivatives are recorded at fair value using prices obtained from the CCP. OTC derivatives are valued using appropriate valuation techniques such as discounted cash flows. These techniques use significant inputs that are observable in the market such as current market yields.
Notional Values and Fair Values of Derivative-Related Assets and Liabilities
Notional values of derivative financial instruments are not recorded as assets or liabilities as they represent the face amount of the contract. Except for credit derivatives, notional values do not represent the potential gain or loss associated with the market or credit risk of such transactions disclosed below. Rather, they serve as the basis upon which the cash flows and the fair value of the contracts are determined.
PUBLIC SECTOR PENSION INVESTMENT BOARD | ANNUAL REPORT 2017 205

ROYAL CANADIAN MOUNTED POLICE PENSION PLAN ACCOUNTNotes to the Financial Statements for the years ended March 31, 2017 and 2016
4 FINANCIAL ASSETS AND FINANCIAL LIABILITIES (continued)
4.1. CLASSES OF FINANCIAL ASSETS AND FINANCIAL LIABILITIES (continued)
4.1.11. Derivative-Related Assets and Liabilities (continued)
The following table summarizes the derivatives portfolio as at:
March 31, 2017 March 31, 2016
(Canadian $ millions) Notional Value
Fair Value
Notional Value
Fair Value
Assets Liabilities Assets Liabilities
Equity and commodity derivativesListed
Futures $ 102 $ – $ – $ 49 $ – $ –Warrants and rights – 1 – – – –Options: Purchased 281 2 – 110 2 –
Written 235 – (2) 102 – (2)OTC
Total return swaps 2,099 18 (8) 1,518 69 (2)Options: Purchased 138 4 – 423 5 –
Written 134 – (3) 427 – (4)Currency derivatives
ListedFutures 10 – – 12 – –
OTCForwards 2,043 7 (22) 3,163 123 (17)Swaps 333 1 (3) 236 1 (23)Options: Purchased 697 6 – 639 7 –
Written 708 – (5) 781 – (6)Interest rate derivatives
ListedFutures 576 – – 544 – –Options: Purchased 2,496 1 – 172 – –
Written 2,754 – – 1,488 – –OTC
Bond forwards – – – 24 – –Interest rate swaps 901 12 (7) 817 12 (14)Inflation swaps – – – 39 – –Swaptions 2,041 10 (7) 2,116 11 (11)Options: Purchased 1,657 3 – 615 1 –
Written 2,296 – (2) 918 – (1)OTC-cleared
Interest rate swaps 2,836 – – 578 – –Inflation swaps 5 – – – – –
Credit derivativesA
OTCCredit default swaps: Purchased 79 – (2) 131 1 (2)
Sold 22 – – 38 – (2)OTC-cleared
Credit default swaps: Purchased 60 – – 46 – –Sold 86 – – 104 – –
Total $ 65 $ (61) $ 232 $ (84)
A PSP Investments, through sold credit derivatives, indirectly guarantees the underlying reference obligations. The maximum potential exposure is the notional amount of the sold credit derivatives as shown in the table above.
ANNUAL REPORT 2017 | PUBLIC SECTOR PENSION INVESTMENT BOARD206

ROYAL CANADIAN MOUNTED POLICE PENSION PLAN ACCOUNTNotes to the Financial Statements for the years ended March 31, 2017 and 2016
4 FINANCIAL ASSETS AND FINANCIAL LIABILITIES (continued)
4.1. CLASSES OF FINANCIAL ASSETS AND FINANCIAL LIABILITIES (continued)
4.1.11. Derivative-Related Assets and Liabilities (continued)
Total derivative-related assets and liabilities are comprised of:
March 31, 2017 March 31, 2016
(Canadian $ millions) Notional Value
Fair Value
Notional Value
Fair Value
Assets Liabilities Assets Liabilities
Listed derivatives $ 6,454 $ 4 $ (2) $ 2,477 $ 2 $ (2)OTC derivatives 13,148 61 (59) 11,885 230 (82)OTC-cleared derivatives 2,987 – – 728 – –
Total $ 65 $ (61) $ 232 $ (84)
The term to maturity based on notional value for the derivatives was as follows as at March 31:
(Canadian $ millions) 2017 2016
Less than 3 months $ 8,027 $ 6,9763 to 12 months 7,503 4,087Over 1 year 7,059 4,027
4.2. FAIR VALUE HIERARCHY
4.2.1. Classification
Financial assets and financial liabilities described under Note 4.1 are classified within the fair value hierarchy, described as follows, based on the lowest level of input that is significant to the fair value measurement as a whole.
· Level 1 inputs are quoted prices (unadjusted) in active markets for identical assets or liabilities that PSP Investments can access at the end of the reporting period.
· Level 2 inputs are inputs other than quoted prices included within Level 1 that are observable for the asset or the liability, either directly or indirectly. Level 2 inputs include:
(i) Quoted prices for similar assets or liabilities in active markets.
(ii) Quoted prices for identical or similar assets or liabilities in markets that are not active.
(iii) Inputs other than quoted prices that are observable for the asset or liability.
(iv) Market-corroborated inputs.
· Level 3 inputs are unobservable inputs for the asset or liability that are used within model-based techniques. They reflect management’s assessment of the assumptions that market participants would use in pricing the assets or liabilities.
The classification within the levels of the hierarchy is established at the time of the initial determination of fair value of the asset or liability and reviewed at the end of each reporting period. PSP Investments determines whether a transfer between levels has occurred and recognizes such transfer at the beginning of the reporting period.
PUBLIC SECTOR PENSION INVESTMENT BOARD | ANNUAL REPORT 2017 207

ROYAL CANADIAN MOUNTED POLICE PENSION PLAN ACCOUNTNotes to the Financial Statements for the years ended March 31, 2017 and 2016
4 FINANCIAL ASSETS AND FINANCIAL LIABILITIES (continued)
4.2. FAIR VALUE HIERARCHY (continued)
4.2.1. Classification (continued)
The following table shows the fair value of financial assets and financial liabilities as at March 31, 2017 classified within the fair value hierarchy:
(Canadian $ millions) Level 1 Level 2 Level 3Total
Fair Value
Public marketsCanadian equity $ 397 $ 64 $ – $ 461Foreign equity 1,867 252 21 2,140
Private marketsReal estate – – 1,766 1,766Private equity – – 988 988Infrastructure – – 958 958Natural resources – – 309 309
Fixed incomeCash and money market securities – 898 – 898Government and corporate bonds – 1,563 18 1,581Inflation-linked bonds – 560 – 560Private debt securities – – 664 664Other fixed income securities – 239 2 241
Alternative investments – 110 472 582
$ 2,264 $ 3,686 $ 5,198 $ 11,148
Investment-related assetsAmounts receivable from pending trades $ – $ 83 $ – $ 83Interest receivable – 23 – 23Dividends receivable – 10 – 10Securities purchased under reverse repurchase agreements – 193 – 193Derivative-related assets 4 61 – 65
$ 4 $ 370 $ – $ 374
Investments representing financial assets at FVTPL $ 2,268 $ 4,056 $ 5,198 $ 11,522
Investment-related liabilitiesAmounts payable from pending trades $ – $ (78) $ – $ (78)Interest payable – (3) – (3)Securities sold short and securities loaned (208) (468) – (676)Securities sold under repurchase agreements – (80) – (80)Derivative-related liabilities (2) (59) – (61)
Investment-related liabilities representing financial liabilities at FVTPL $ (210) $ (688) $ – $ (898)
BorrowingsCapital market debt financing $ – $ (784) $ – $ (784)
Borrowings representing financial liabilities designated at FVTPL $ – $ (784) $ – $ (784)
Net investments $ 2,058 $ 2,584 $ 5,198 $ 9,840
ANNUAL REPORT 2017 | PUBLIC SECTOR PENSION INVESTMENT BOARD208

ROYAL CANADIAN MOUNTED POLICE PENSION PLAN ACCOUNTNotes to the Financial Statements for the years ended March 31, 2017 and 2016
4 FINANCIAL ASSETS AND FINANCIAL LIABILITIES (continued)
4.2. FAIR VALUE HIERARCHY (continued)
4.2.1. Classification (continued)
The following table shows the fair value of financial assets and financial liabilities as at March 31, 2016 classified within the fair value hierarchy:
(Canadian $ millions) Level 1 Level 2 Level 3Total
Fair Value
Public marketsCanadian equity $ 410 $ 53 $ – $ 463Foreign equity 1,562 330 – 1,892
Private marketsReal estate – – 1,634 1,634Private equity – – 818 818Infrastructure – – 691 691Natural resources – – 221 221
Fixed incomeCash and money market securities – 430 – 430Government and corporate bonds – 1,429 21 1,450Inflation-linked bonds – 538 – 538Private debt securities – – 385 385Other fixed income securities – 141 51 192
Alternative investments – 90 392 482
$ 1,972 $ 3,011 $ 4,213 $ 9,196
Investment-related assetsAmounts receivable from pending trades $ – $ 32 $ – $ 32Interest receivable – 16 – 16Dividends receivable – 7 – 7Securities purchased under reverse repurchase agreements – 78 – 78Derivative-related assets 2 230 – 232
$ 2 $ 363 $ – $ 365
Investments representing financial assets at FVTPL $ 1,974 $ 3,374 $ 4,213 $ 9,561
Investment-related liabilitiesAmounts payable from pending trades $ – $ (42) $ – $ (42)Interest payable – (2) – (2)Securities sold short (161) (33) – (194)Securities sold under repurchase agreements – (105) – (105)Derivative-related liabilities (2) (82) – (84)
Investment-related liabilities representing financial liabilities at FVTPL $ (163) $ (264) $ – $ (427)
BorrowingsCapital market debt financing $ – $ (643) $ – $ (643)
Borrowings representing financial liabilities designated at FVTPL $ – $ (643) $ – $ (643)
Net investments $ 1,811 $ 2,467 $ 4,213 $ 8,491
PUBLIC SECTOR PENSION INVESTMENT BOARD | ANNUAL REPORT 2017 209

ROYAL CANADIAN MOUNTED POLICE PENSION PLAN ACCOUNTNotes to the Financial Statements for the years ended March 31, 2017 and 2016
4 FINANCIAL ASSETS AND FINANCIAL LIABILITIES (continued)
4.2. FAIR VALUE HIERARCHY (continued)
4.2.2. Process for Level 3 Fair Value Determination
The valuation process is monitored and governed by an internal valuation committee (“VC”). This committee is responsible for overseeing all aspects of fair value determination. This includes establishing valuation methodologies and procedures for each type of investment and ensuring they are complied with. Valuation methodologies established are based on widely recognized practices that are consistent with professional appraisal standards. Such standards include, among others, the International Private Equity and Venture Capital Valuation Guidelines, the Canadian Uniform Standards of Professional Appraisal Practice and the Uniform Standards of Professional Appraisal Practice in the United States of America.
The fair value of investments classified as Level 3 is determined at least annually. Quarterly, the fair value is reviewed and adjusted, as appropriate, to reflect the impact of any significant market or investment-specific events or circumstances. For each investment, the relevant valuation methodology is applied consistently over time as appropriate in the prevailing circumstances. The appropriateness of significant changes in valuation methodologies is reviewed by the VC.
In cases where the services of third-party appraisers are used, management ensures their independence and that valuation methods used are consistent with professional appraisal standards outlined above. In validating the work performed by appraisers, management ensures that the assumptions used correspond to financial information and forecasts of the underlying investment.
With respect to fund investments classified as Level 3, the annual fair value is generally determined based on audited financial statements received from the fund’s general partner. In certain cases fair value is obtained from information provided by the fund’s administrators and is reviewed by Management to ensure reasonableness and adherence to acceptable industry valuation methods. Where necessary, the impact of restrictions on the sale or redemption of such investments is taken into consideration in determining fair value.
ANNUAL REPORT 2017 | PUBLIC SECTOR PENSION INVESTMENT BOARD210

ROYAL CANADIAN MOUNTED POLICE PENSION PLAN ACCOUNTNotes to the Financial Statements for the years ended March 31, 2017 and 2016
4 FINANCIAL ASSETS AND FINANCIAL LIABILITIES (continued)
4.2. FAIR VALUE HIERARCHY (continued)
4.2.3. Level 3 Significant Inputs
The following table outlines key information with respect to significant inputs related to financial assets and financial liabilities categorized within Level 3 as at March 31, 2017:
Financial Assets and Financial Liabilities
Type of Investment
Fair Value (Canadian $ millions)
Significant Valuation Techniques
Significant Unobservable Inputs
Range (Weighted Average)
Public marketsForeign equity Direct
investments$ 21 Net asset value
method (NAV)AN/A N/A
Private marketsReal estate Direct and
co-investments$ 1,663 Discounted cash
flow (DCF)Discount rateB, C 4.50% – 25.00% (8.06%)
Terminal capitalization rateB, C 4.25% – 10.25% (6.04%)
Direct capitalization Capitalization rateB, D 2.75% – 8.00% (5.69%)
Stabilized occupancy rateD, E 94.00% – 100.00% (97.77%)
Sales comparison approach
Price per square footD, E $2.82 – $1,115.10 ($153.82)
NAVA N/A N/A
Transaction price N/A N/A
Fund investments $ 103 NAVA N/A N/A
Other private markets Direct and co-investments
$ 1,570 DCF Discount rateB 5.91% – 12.70% (9.36%)
Market comparables N/A N/A
NAVA N/A N/A
Transaction price N/A N/A
Fund investments $ 685 NAVA N/A N/A
Fixed incomeCorporate bonds Convertible bonds $ 18 DCF Discount rateB 3.90% – 14.10% (7.50%)
Private debt securities Direct and co-investments
$ 353 DCF Discount rateB 4.49% – 12.25% (9.07%)
NAVA N/A N/A
Transaction price N/A N/A
Fund investments $ 311 NAVA N/A N/A
Other fixed income Asset-backed term notes
$ 2 Third-party pricingA N/A N/A
Alternative investments
Fund investments $ 472 NAVA N/A N/A
Total $ 5,198
A In certain cases, fair value is determined by third parties where valuation information is not available to PSP Investments.
B An increase (decrease) in this unobservable input, taken individually, generally results in a decrease (increase) in fair value.
C An increase (decrease) in the discount rate is generally accompanied by an increase (decrease) of the terminal capitalization rate.
D There is no predictable direct relationship between this input and any other significant unobservable input.
E An increase (decrease) in this unobservable input, taken individually, generally results in an increase (decrease) in fair value.
PUBLIC SECTOR PENSION INVESTMENT BOARD | ANNUAL REPORT 2017 211

ROYAL CANADIAN MOUNTED POLICE PENSION PLAN ACCOUNTNotes to the Financial Statements for the years ended March 31, 2017 and 2016
4 FINANCIAL ASSETS AND FINANCIAL LIABILITIES (continued)
4.2. FAIR VALUE HIERARCHY (continued)
4.2.3. Level 3 Significant Inputs (continued)
The following table outlines key information with respect to significant inputs related to financial assets and financial liabilities categorized within Level 3 as at March 31, 2016:
Financial Assets and Financial Liabilities
Type of Investment
Fair Value (Canadian $ millions)
Significant Valuation Techniques
Significant Unobservable Inputs
Range (Weighted Average)
Private marketsReal estate Direct and
co-investments$ 1,529 DCF Discount rateB, C 5.25% – 25.00% (8.27%)
Terminal capitalization rateB, C 4.25% – 14.00% (6.29%)
Direct capitalization Capitalization rateB, D 3.25% – 7.50% (5.91%)
Stabilized occupancy rateD, E 93.00% – 100.00% (96.84%)
Sales comparison approach
Price per square footD, E $25.00 – $665.89 ($170.43)
NAVA N/A N/A
Transaction price N/A N/A
Fund investments $ 105 NAVA N/A N/A
Other private markets Direct and co-investments
$ 1,169 DCF Discount rateB 5.20% – 12.50% (9.70%)
Market comparables N/A N/A
NAVA N/A N/A
Transaction price N/A N/A
Fund investments $ 561 NAVA N/A N/A
Fixed incomeCorporate bonds Convertible bonds $ 21 DCF Discount rateB 3.70% – 13.50% (6.30%)
Private debt securities Direct and co-investments
$ 132 DCF Discount rateB 8.00% – 13.50% (11.09%)
NAVA N/A N/A
Transaction price N/A N/A
Fund investments $ 253 NAVA N/A N/A
Other fixed income Asset-backed term notes
$ 51 Third-party pricingA N/A N/A
Alternative investments
Fund investments $ 392 NAVA N/A N/A
Total $ 4,213
A In certain cases, fair value is determined by third parties where valuation information is not available to PSP Investments.
B An increase (decrease) in this unobservable input, taken individually, generally results in a decrease (increase) in fair value.
C An increase (decrease) in the discount rate is generally accompanied by an increase (decrease) of the terminal capitalization rate.
D There is no predictable direct relationship between this input and any other significant unobservable input.
E An increase (decrease) in this unobservable input, taken individually, generally results in an increase (decrease) in fair value.
ANNUAL REPORT 2017 | PUBLIC SECTOR PENSION INVESTMENT BOARD212

ROYAL CANADIAN MOUNTED POLICE PENSION PLAN ACCOUNTNotes to the Financial Statements for the years ended March 31, 2017 and 2016
4 FINANCIAL ASSETS AND FINANCIAL LIABILITIES (continued)
4.2. FAIR VALUE HIERARCHY (continued)
4.2.4. Level 3 Reconciliation
The following table shows a reconciliation of all movements related to financial assets and financial liabilities categorized within Level 3 for the year ended March 31, 2017:
(Canadian $ millions)OpeningBalance Purchases Sales Settlements
Realized Gains
Unrealized GainsA
Closing Balance
Public markets $ – $ 19 $ – $ – $ – $ 2 $ 21Private markets 3,364 716 (199) – 48 92 4,021Fixed income 457 380 (141) (49) 28 9 684Alternative investments 392 67 (35) – 4 44 472
Total $ 4,213 $ 1,182 $ (375) $ (49) $ 80 $ 147 $ 5,198
The following table shows a reconciliation of all movements related to financial assets and financial liabilities categorized within Level 3 for the year ended March 31, 2016:
(Canadian $ millions)Opening Balance Purchases Sales Settlements
Realized Gains
Unrealized Gains
(Losses)AClosing Balance
Private markets $ 2,675 $ 686 $ (271) $ – $ 68 $ 206 $ 3,364Fixed income 402 149 (37) (50) 30 (37) 457Alternative investments 296 118 (32) – 5 5 392
Total $ 3,373 $ 953 $ (340) $ (50) $ 103 $ 174 $ 4,213
A Includes Plan Account allocation adjustments.
4.2.5. Level 3 Sensitivity Analysis
In the course of measuring fair value of financial instruments classified as Level 3, valuation techniques used incorporate assumptions that are based on non-observable data. Significant assumptions used for each asset class are described in Note 4.2.3. Although such assumptions reflect management’s best judgment, the use of reasonably possible alternative assumptions could yield different fair value measures representing, at a minimum, a 3% increase and 3% decrease as at March 31, 2017 (March 31, 2016 – 3% increase and 3% decrease) in the fair value of financial instruments categorized as Level 3. This excludes private debt investments in the real estate sector and certain fund investments, where a sensitivity analysis is not possible given the underlying assumptions used are not available to PSP Investments. With respect to private debt investments in the real estate sector, the fair value is obtained from third-party appraisers. Management ensures the appropriateness of the work performed by third-party appraisers as described under Note 4.2.2. In the case of fund investments, the fair value is determined as indicated in Note 4.2.2.
PUBLIC SECTOR PENSION INVESTMENT BOARD | ANNUAL REPORT 2017 213

ROYAL CANADIAN MOUNTED POLICE PENSION PLAN ACCOUNTNotes to the Financial Statements for the years ended March 31, 2017 and 2016
5 COLLATERAL PLEDGED AND RECEIVED
PSP Investments is party to agreements that involve pledging and holding collateral, as outlined in Notes 2.3.5, 2.3.6 and 7.2.1. The following table illustrates the fair values of the Plan Account’s allocated collateral, as well as the securities under the lending and borrowing programs and the securities under the repurchase and reverse repurchase agreements, as at:
(Canadian $ millions) March 31, 2017 March 31, 2016
Securities lending and borrowingSecurities lent $ 961 $ 666Collateral heldA 1,023 711Securities borrowed 209 167Collateral pledgedB 219 175
Securities repurchase and reverse repurchase agreements Securities sold under repurchase agreements 81 105Collateral pledged 80 105Securities purchased under reverse repurchase agreements 193 78Collateral heldC 193 78
Derivative contracts Collateral pledged 23 21Collateral heldD 17 159
A The minimum fair value of cash collateral required is equal to 102% of the fair value of the securities lent, and in the case of securities collateral 105%. As part of collateral held, cash amounted to $368 million for the Plan Account as at March 31, 2017 (March 31, 2016 – $151 million) and securities amounted to $655 million as at March 31, 2017 (March 31, 2016 – $560 million). All cash collateral is reinvested.
B The minimum fair value of collateral required is equal to 100% of the fair value of the securities borrowed.
C The collateral received is in the form of securities of which $98 million has been used in connection with short selling transactions as at March 31, 2017 (March 31, 2016 – $33 million) and $15 million has been used in connection with securities sold under repurchase agreements (March 31, 2016 – nil).
D As part of collateral held, cash amounted to $1 million as at March 31, 2017 (March 31, 2016 – nil) and securities amounted to $16 million as at March 31, 2017 (March 31, 2016 – $159 million). All cash collateral is reinvested.
ANNUAL REPORT 2017 | PUBLIC SECTOR PENSION INVESTMENT BOARD214

ROYAL CANADIAN MOUNTED POLICE PENSION PLAN ACCOUNTNotes to the Financial Statements for the years ended March 31, 2017 and 2016
6 INTERESTS IN OTHER ENTITIES
6.1. SUBSIDIARIES, JOINT VENTURES AND ASSOCIATES
As an investment entity, PSP Investments does not consolidate its subsidiaries other than those that solely provide it with services that relate to its investment activities. PSP Investments measures its investments in its subsidiaries, joint ventures and associates at FVTPL as described in Note 2.1.
For purposes of preparing this note, management assesses control, joint control and significant influence as follows:
(i) Control and significant influence
PSP Investments determines that it has control over an investee when it is exposed, or has rights, to variable returns from its investment in an entity and has the ability to affect those returns through its power over the investee.
In certain cases, PSP Investments does not have control over an investee but has the power to participate in the financial and operating policy decisions of the investee. In such cases, PSP Investments determines that it has significant influence over the investee.
In the context of control or significant influence, power over an investee is obtained through voting rights conveyed by PSP Investments’ ownership interest, other contractual arrangements, or a combination thereof.
(ii) Joint control
PSP Investments determines that it is party to a joint venture arrangement when it has joint control over an investee and has rights to the net assets of the investee. Joint control is established through a contractual arrangement which requires the unanimous consent of the parties sharing control for the activities that significantly affect the returns of the arrangement.
Generally, decision making regarding such activities is governed through voting rights conveyed by the ownership interest of each party. In certain cases, it is governed solely through contractual arrangements or in conjunction with the ownership interest of each party.
In the normal course of business, investments in private markets are commonly held through investment entity subsidiaries formed by PSP Investments. As at March 31, 2017, 103 investment entity subsidiaries were incorporated in North America, 23 in Europe, 10 in Oceania, 4 in Central and South America, 1 in Africa and 1 in Asia (March 31, 2016 – 102 in North America, 19 in Europe, 10 in Oceania, 4 in Central and South America and 1 in Africa).
In addition, PSP Investments controlled 77 investees directly or through its investment entity subsidiaries as at March 31, 2017 (March 31, 2016 – 73 investees).
PUBLIC SECTOR PENSION INVESTMENT BOARD | ANNUAL REPORT 2017 215
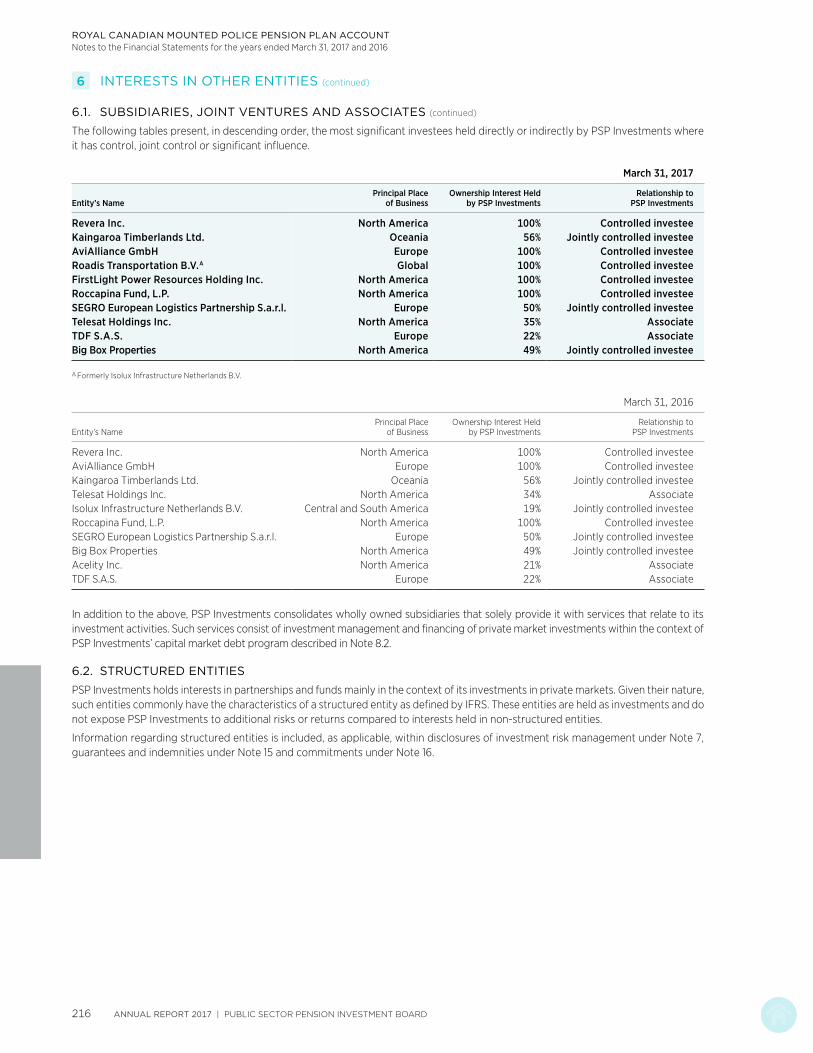
ROYAL CANADIAN MOUNTED POLICE PENSION PLAN ACCOUNTNotes to the Financial Statements for the years ended March 31, 2017 and 2016
6 INTERESTS IN OTHER ENTITIES (continued)
6.1. SUBSIDIARIES, JOINT VENTURES AND ASSOCIATES (continued)
The following tables present, in descending order, the most significant investees held directly or indirectly by PSP Investments where it has control, joint control or significant influence.
March 31, 2017
Entity’s NamePrincipal Place
of BusinessOwnership Interest Held
by PSP InvestmentsRelationship to
PSP Investments
Revera Inc. North America 100% Controlled investeeKaingaroa Timberlands Ltd. Oceania 56% Jointly controlled investeeAviAlliance GmbH Europe 100% Controlled investeeRoadis Transportation B.V.A Global 100% Controlled investeeFirstLight Power Resources Holding Inc. North America 100% Controlled investeeRoccapina Fund, L.P. North America 100% Controlled investeeSEGRO European Logistics Partnership S.a.r.l. Europe 50% Jointly controlled investeeTelesat Holdings Inc. North America 35% AssociateTDF S.A.S. Europe 22% AssociateBig Box Properties North America 49% Jointly controlled investee
A Formerly Isolux Infrastructure Netherlands B.V.
March 31, 2016
Entity’s NamePrincipal Place
of BusinessOwnership Interest Held
by PSP InvestmentsRelationship to
PSP Investments
Revera Inc. North America 100% Controlled investeeAviAlliance GmbH Europe 100% Controlled investeeKaingaroa Timberlands Ltd. Oceania 56% Jointly controlled investeeTelesat Holdings Inc. North America 34% AssociateIsolux Infrastructure Netherlands B.V. Central and South America 19% Jointly controlled investeeRoccapina Fund, L.P. North America 100% Controlled investeeSEGRO European Logistics Partnership S.a.r.l. Europe 50% Jointly controlled investeeBig Box Properties North America 49% Jointly controlled investeeAcelity Inc. North America 21% AssociateTDF S.A.S. Europe 22% Associate
In addition to the above, PSP Investments consolidates wholly owned subsidiaries that solely provide it with services that relate to its investment activities. Such services consist of investment management and financing of private market investments within the context of PSP Investments’ capital market debt program described in Note 8.2.
6.2. STRUCTURED ENTITIES
PSP Investments holds interests in partnerships and funds mainly in the context of its investments in private markets. Given their nature, such entities commonly have the characteristics of a structured entity as defined by IFRS. These entities are held as investments and do not expose PSP Investments to additional risks or returns compared to interests held in non-structured entities.
Information regarding structured entities is included, as applicable, within disclosures of investment risk management under Note 7, guarantees and indemnities under Note 15 and commitments under Note 16.
ANNUAL REPORT 2017 | PUBLIC SECTOR PENSION INVESTMENT BOARD216
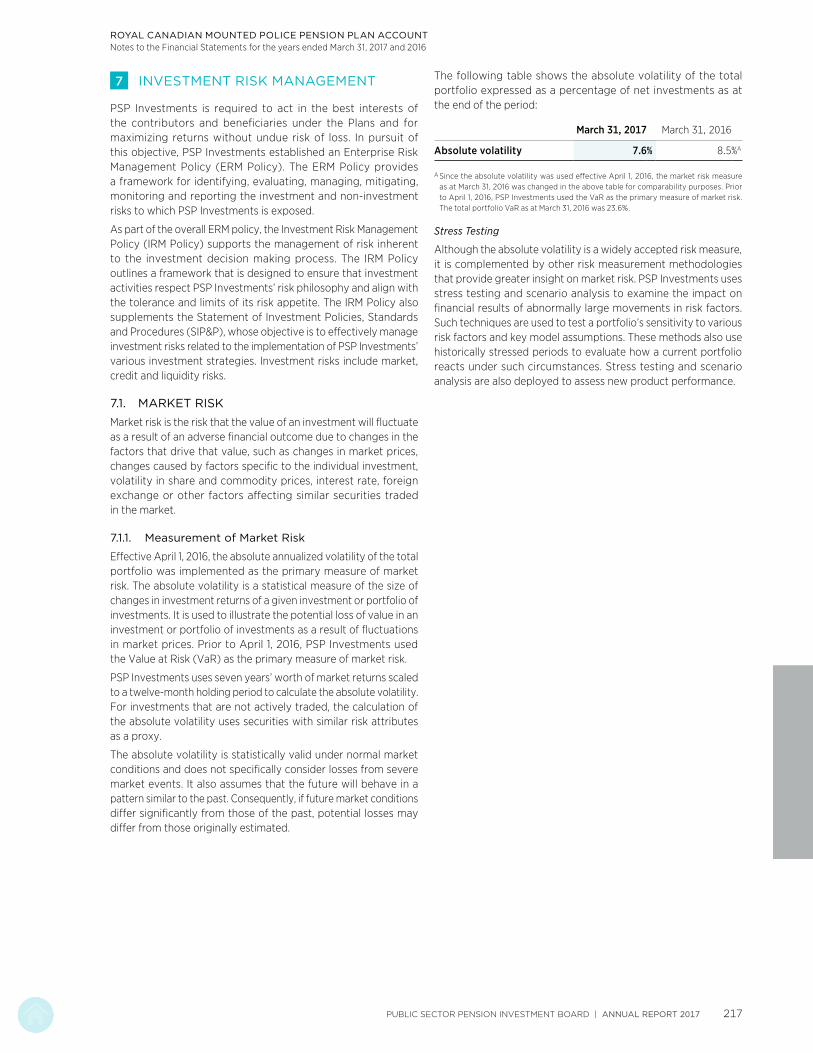
ROYAL CANADIAN MOUNTED POLICE PENSION PLAN ACCOUNTNotes to the Financial Statements for the years ended March 31, 2017 and 2016
7 INVESTMENT RISK MANAGEMENT
PSP Investments is required to act in the best interests of the contributors and beneficiaries under the Plans and for maximizing returns without undue risk of loss. In pursuit of this objective, PSP Investments established an Enterprise Risk Management Policy (ERM Policy). The ERM Policy provides a framework for identifying, evaluating, managing, mitigating, monitoring and reporting the investment and non-investment risks to which PSP Investments is exposed.
As part of the overall ERM policy, the Investment Risk Management Policy (IRM Policy) supports the management of risk inherent to the investment decision making process. The IRM Policy outlines a framework that is designed to ensure that investment activities respect PSP Investments’ risk philosophy and align with the tolerance and limits of its risk appetite. The IRM Policy also supplements the Statement of Investment Policies, Standards and Procedures (SIP&P), whose objective is to effectively manage investment risks related to the implementation of PSP Investments’ various investment strategies. Investment risks include market, credit and liquidity risks.
7.1. MARKET RISK
Market risk is the risk that the value of an investment will fluctuate as a result of an adverse financial outcome due to changes in the factors that drive that value, such as changes in market prices, changes caused by factors specific to the individual investment, volatility in share and commodity prices, interest rate, foreign exchange or other factors affecting similar securities traded in the market.
7.1.1. Measurement of Market Risk
Effective April 1, 2016, the absolute annualized volatility of the total portfolio was implemented as the primary measure of market risk. The absolute volatility is a statistical measure of the size of changes in investment returns of a given investment or portfolio of investments. It is used to illustrate the potential loss of value in an investment or portfolio of investments as a result of fluctuations in market prices. Prior to April 1, 2016, PSP Investments used the Value at Risk (VaR) as the primary measure of market risk.
PSP Investments uses seven years’ worth of market returns scaled to a twelve-month holding period to calculate the absolute volatility. For investments that are not actively traded, the calculation of the absolute volatility uses securities with similar risk attributes as a proxy.
The absolute volatility is statistically valid under normal market conditions and does not specifically consider losses from severe market events. It also assumes that the future will behave in a pattern similar to the past. Consequently, if future market conditions differ significantly from those of the past, potential losses may differ from those originally estimated.
The following table shows the absolute volatility of the total portfolio expressed as a percentage of net investments as at the end of the period:
March 31, 2017 March 31, 2016
Absolute volatility 7.6% 8.5%A
A Since the absolute volatility was used effective April 1, 2016, the market risk measure as at March 31, 2016 was changed in the above table for comparability purposes. Prior to April 1, 2016, PSP Investments used the VaR as the primary measure of market risk. The total portfolio VaR as at March 31, 2016 was 23.6%.
Stress Testing
Although the absolute volatility is a widely accepted risk measure, it is complemented by other risk measurement methodologies that provide greater insight on market risk. PSP Investments uses stress testing and scenario analysis to examine the impact on financial results of abnormally large movements in risk factors. Such techniques are used to test a portfolio’s sensitivity to various risk factors and key model assumptions. These methods also use historically stressed periods to evaluate how a current portfolio reacts under such circumstances. Stress testing and scenario analysis are also deployed to assess new product performance.
PUBLIC SECTOR PENSION INVESTMENT BOARD | ANNUAL REPORT 2017 217
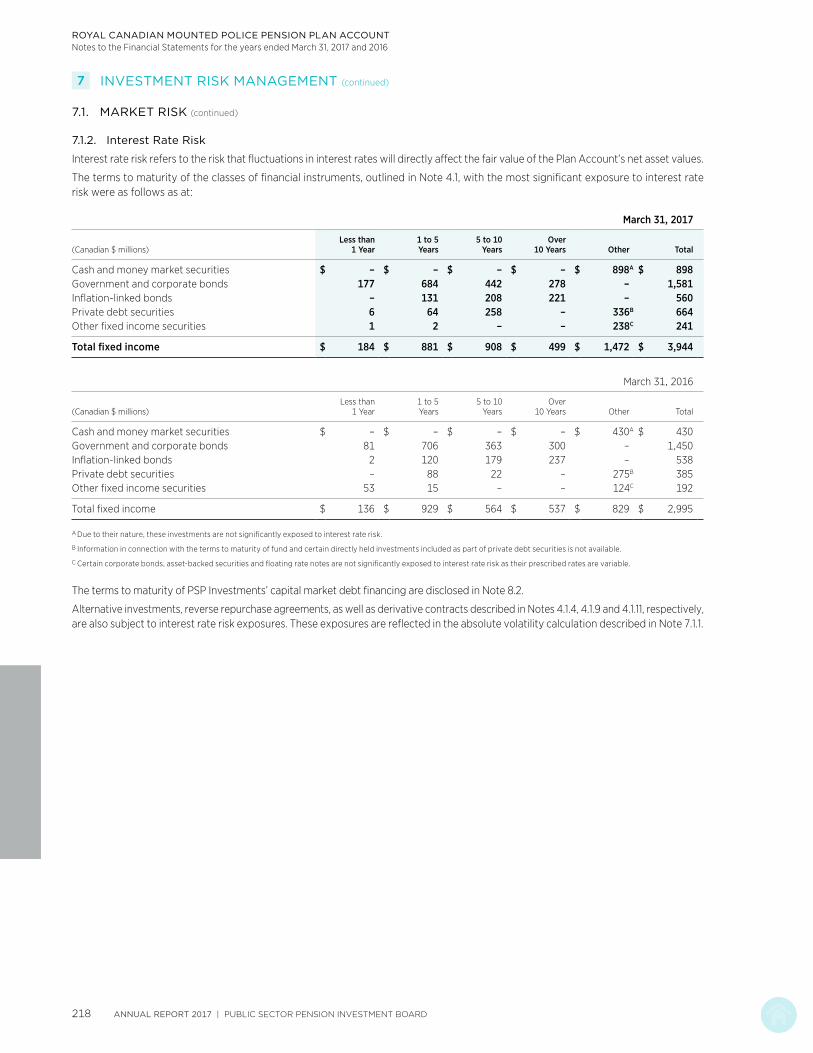
ROYAL CANADIAN MOUNTED POLICE PENSION PLAN ACCOUNTNotes to the Financial Statements for the years ended March 31, 2017 and 2016
7 INVESTMENT RISK MANAGEMENT (continued)
7.1. MARKET RISK (continued)
7.1.2. Interest Rate Risk
Interest rate risk refers to the risk that fluctuations in interest rates will directly affect the fair value of the Plan Account’s net asset values.
The terms to maturity of the classes of financial instruments, outlined in Note 4.1, with the most significant exposure to interest rate risk were as follows as at:
March 31, 2017
(Canadian $ millions)Less than
1 Year1 to 5 Years
5 to 10 Years
Over 10 Years Other Total
Cash and money market securities $ – $ – $ – $ – $ 898A $ 898Government and corporate bonds 177 684 442 278 – 1,581Inflation-linked bonds – 131 208 221 – 560Private debt securities 6 64 258 – 336B 664Other fixed income securities 1 2 – – 238C 241
Total fixed income $ 184 $ 881 $ 908 $ 499 $ 1,472 $ 3,944
March 31, 2016
(Canadian $ millions)Less than
1 Year1 to 5 Years
5 to 10 Years
Over 10 Years Other Total
Cash and money market securities $ – $ – $ – $ – $ 430A $ 430Government and corporate bonds 81 706 363 300 – 1,450Inflation-linked bonds 2 120 179 237 – 538Private debt securities – 88 22 – 275B 385Other fixed income securities 53 15 – – 124C 192
Total fixed income $ 136 $ 929 $ 564 $ 537 $ 829 $ 2,995
A Due to their nature, these investments are not significantly exposed to interest rate risk.
B Information in connection with the terms to maturity of fund and certain directly held investments included as part of private debt securities is not available.
C Certain corporate bonds, asset-backed securities and floating rate notes are not significantly exposed to interest rate risk as their prescribed rates are variable.
The terms to maturity of PSP Investments’ capital market debt financing are disclosed in Note 8.2.
Alternative investments, reverse repurchase agreements, as well as derivative contracts described in Notes 4.1.4, 4.1.9 and 4.1.11, respectively, are also subject to interest rate risk exposures. These exposures are reflected in the absolute volatility calculation described in Note 7.1.1.
ANNUAL REPORT 2017 | PUBLIC SECTOR PENSION INVESTMENT BOARD218

ROYAL CANADIAN MOUNTED POLICE PENSION PLAN ACCOUNTNotes to the Financial Statements for the years ended March 31, 2017 and 2016
7 INVESTMENT RISK MANAGEMENT (continued)
7.1. MARKET RISK (continued)
7.1.3. Foreign Currency Risk
PSP Investments is exposed to currency risk through holding of investments (i.e. direct and indirect holdings of securities, units in pooled funds and units in limited partnerships) or investment-related liabilities in various currencies. Fluctuations in the relative value of the Canadian dollar against these foreign currencies can result in a positive or a negative effect on the fair value of the investments. To mitigate this risk, PSP Investments may take, through foreign forward contracts or cross currency swaps, positions in foreign currencies.
The underlying foreign currency exposures of net investments for the Plan Account were as follows as at:
Currency March 31, 2017 March 31, 2016
(Canadian $ millions) Fair Value % of Total Fair Value % of Total
US Dollar $ 4,622 70.5% $ 2,204 60.3%Euro 412 6.3 260 7.1Japanese Yen 240 3.6 124 3.4British Pound 202 3.1 150 4.1South Korean Won 174 2.6 156 4.3Brazilian Real 148 2.3 113 3.1Indian Rupee 89 1.4 72 2.0Hong Kong Dollar 86 1.3 131 3.6Australian Dollar 85 1.3 45 1.2Taiwanese New Dollar 72 1.1 67 1.8Swiss Franc 68 1.0 72 2.0Mexican Peso 57 0.9 47 1.3Others 304 4.6 213 5.8
Total $ 6,559 100.0% $ 3,654 100.0%
As at March 31, 2017, PSP Investments and its investment entity subsidiaries also had commitments, denominated in foreign currencies of $1,465 million for the Plan Account (US$909 million, €151 million, £14 million, 2 million South African rands, 4 million Brazilian reals, 983 million Colombian pesos, 17 million Mexican pesos and 9 million Australian dollars) which were not included in the foreign currency exposure table above.
As at March 31, 2016, PSP Investments and its investment entity subsidiaries also had commitments, denominated in foreign currencies of $1,440 million for the Plan Account (US$1,011 million, €67 million, £15 million, 13 million South African rands, 6 million Brazilian reals, 1,411 million Colombian pesos and 28 million Mexican pesos) which were not included in the foreign currency exposure table above.
PUBLIC SECTOR PENSION INVESTMENT BOARD | ANNUAL REPORT 2017 219

ROYAL CANADIAN MOUNTED POLICE PENSION PLAN ACCOUNTNotes to the Financial Statements for the years ended March 31, 2017 and 2016
7 INVESTMENT RISK MANAGEMENT (continued)
7.2. CREDIT RISK
PSP Investments is exposed to credit risk, which is the risk of non-performance of a debtor on whom PSP Investments relies to fulfill contractual or financial obligations. That is, the risk that the issuer of a debt security or that the counterparty to a derivative contract, to a securities lending and borrowing transaction or to securities purchased under reverse repurchase agreements, is unable to meet its financial obligations.
Credit risk encompasses the risk of a deterioration of creditworthiness and the relevant concentration risk. Credit risk monitoring entails an evaluation of the credit quality of each issuer and counterparty that transacts with PSP Investments. To perform this evaluation for public issuers and counterparties, PSP Investments relies on four recognized credit rating agencies. A minimum of two credit ratings are used to classify each security. If the agencies disagree as to a security’s credit quality, PSP Investments uses the lowest of the available ratings. For private issuers, PSP Investments assigns internal credit ratings to issuers and measures the combined risk profile against set targets. To assign risk ratings to issuers, PSP Investments uses methodologies comparable to those used by recognized rating agencies.
As at March 31, 2017, the Plan Account’s maximum exposure to credit risk amounted to $4 billion (March 31, 2016 – $3 billion). This amount is presented before collateral held and netting arrangements that do not qualify for offsetting under IFRS. The maximum credit exposure excludes guarantees disclosed in Note 15 as well as investments in funds classified as alternative investments in note 4.1. Such funds hold fixed income securities among other types of instruments.
To monitor the evolution of credit risk, PSP Investments periodically produces a concentration report by credit rating for credit-sensitive securities. The concentration of credit risk by credit rating was as follows as at March 31:
Credit Rating 2017 2016
AAA-AA 54.2% 50.7%A 20.0 27.9BBB 4.5 9.1BB or below 19.9 10.5No ratingA 1.4 1.8
Total 100.0% 100.0%
A Includes securities for public issuers and counterparties, that are either not rated by credit rating agencies or rated by a single credit rating agency. ABTNs are rated by a single agency and are classified according to their rating within the table.
ANNUAL REPORT 2017 | PUBLIC SECTOR PENSION INVESTMENT BOARD220

ROYAL CANADIAN MOUNTED POLICE PENSION PLAN ACCOUNTNotes to the Financial Statements for the years ended March 31, 2017 and 2016
7 INVESTMENT RISK MANAGEMENT (continued)
7.2. CREDIT RISK (continued)
7.2.1. Counterparty Risk
Counterparty risk represents the credit risk from current and potential exposure related to transactions involving derivative contracts, securities lending and borrowing as well as securities repurchase and reverse repurchase agreements. In order to minimize counterparty risk, PSP Investments requires that counterparties provide adequate collateral and meet its credit rating requirements. PSP Investments frequently monitors the credit rating of its counterparties as determined by recognized credit rating agencies. With respect to derivative contracts, PSP Investments has the ability to terminate all trades with most counterparties whose credit rating is downgraded below its requirements.
For OTC derivatives, PSP Investments’ policy also requires the use of the International Swaps and Derivative Association (ISDA) Master Agreement with all counterparties to derivative contracts. The ISDA Master Agreement provides the contractual framework within which dealing activities across a full range of OTC products are conducted. In the case of OTC-cleared derivatives, trading activities are regulated between parties under terms that are customary to such transactions.
As a credit mitigation technique, the ISDA Master Agreement contractually binds counterparties to close-out netting provisions in the case of default by one of the counterparties. Additionally, the Credit Support Annex (CSA) to the ISDA Master Agreement enables PSP Investments to realize any collateral placed with it in the case of default of the counterparty. The CSA also requires PSP Investments to contribute further collateral when requested. All collateral transactions under the CSA are in cash, high-quality debt instruments or securities. The CSA also regulates the exchange of collateral when the credit exposure to a counterparty exceeds a predetermined threshold. Counterparties are generally authorized to sell, repledge or otherwise use collateral held. Similarly, in the case of OTC-cleared derivatives, collateral is required in cash, high quality debt instruments or securities and can be sold, repledged or otherwise used. PSP Investments does not sell, repledge or otherwise use any collateral held in the form of securities but does reinvest all cash collateral with respect to derivative contracts.
With respect to transactions involving securities lending and borrowing agreements as well as securities repurchase and reverse repurchase agreements, collateral requirements are in place to mitigate counterparty risk. Notes 2.3.5 and 2.3.6 describe collateral requirements in securities lending and borrowing programs as well as securities repurchase and reverse repurchase agreements.
Information in connection with collateral pledged by PSP Investments and its counterparties is disclosed in Note 5.
In the case of the securities lending program, PSP Investments’ exposure to counterparty risk is further mitigated as the custodian of the securities lent assumes the risk that a counterparty will be unable to meet its obligations associated with the collateral requirements.
Management is responsible for counterparty risk monitoring and mitigation as well as maintaining a comprehensive, disciplined, and enterprise-wide process for tracking and managing counterparty risk. As such, management measures counterparty risk on an ongoing basis, evaluates and tracks the creditworthiness of current counterparties and mitigates counterparty risk through collateral management.
PUBLIC SECTOR PENSION INVESTMENT BOARD | ANNUAL REPORT 2017 221
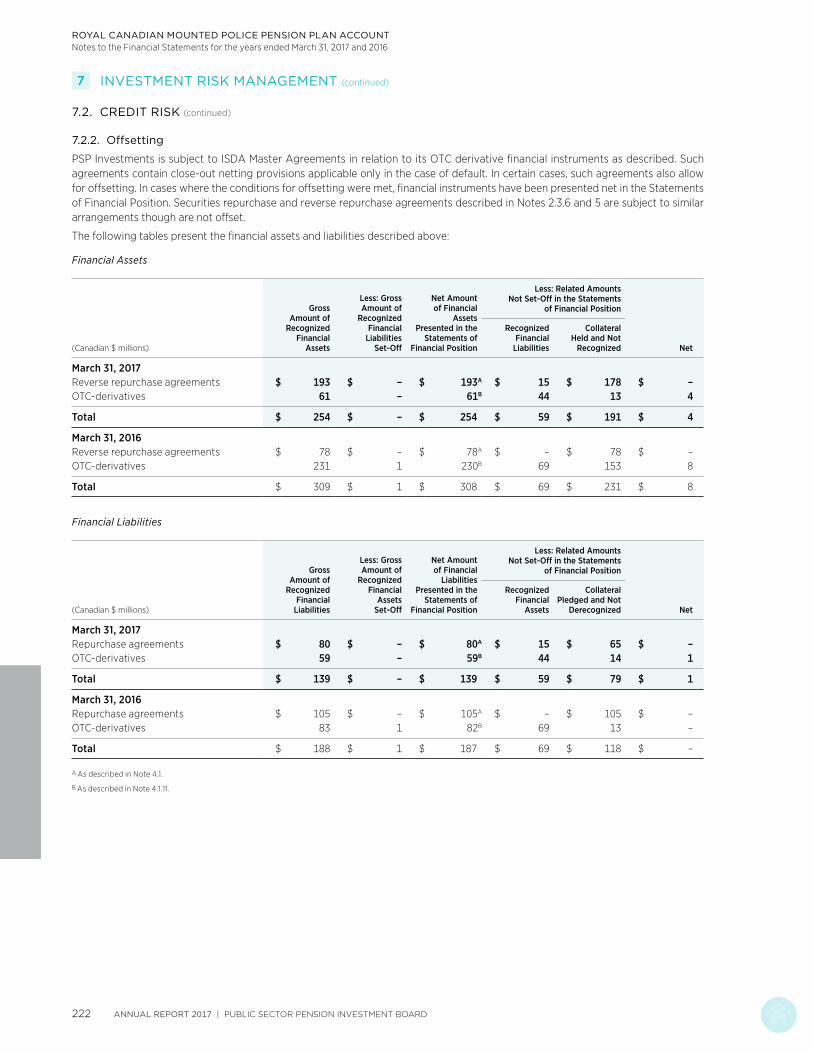
ROYAL CANADIAN MOUNTED POLICE PENSION PLAN ACCOUNTNotes to the Financial Statements for the years ended March 31, 2017 and 2016
7 INVESTMENT RISK MANAGEMENT (continued)
7.2. CREDIT RISK (continued)
7.2.2. Offsetting
PSP Investments is subject to ISDA Master Agreements in relation to its OTC derivative financial instruments as described. Such agreements contain close-out netting provisions applicable only in the case of default. In certain cases, such agreements also allow for offsetting. In cases where the conditions for offsetting were met, financial instruments have been presented net in the Statements of Financial Position. Securities repurchase and reverse repurchase agreements described in Notes 2.3.6 and 5 are subject to similar arrangements though are not offset.
The following tables present the financial assets and liabilities described above:
Financial Assets
(Canadian $ millions)
Gross Amount of
Recognized Financial
Assets
Less: Gross Amount of
Recognized Financial
Liabilities Set-Off
Net Amount of Financial
Assets Presented in the
Statements of Financial Position
Less: Related Amounts Not Set-Off in the Statements
of Financial Position
Net
Recognized Financial
Liabilities
Collateral Held and Not
Recognized
March 31, 2017Reverse repurchase agreements $ 193 $ – $ 193A $ 15 $ 178 $ –OTC-derivatives 61 – 61B 44 13 4
Total $ 254 $ – $ 254 $ 59 $ 191 $ 4
March 31, 2016Reverse repurchase agreements $ 78 $ – $ 78A $ – $ 78 $ –OTC-derivatives 231 1 230B 69 153 8
Total $ 309 $ 1 $ 308 $ 69 $ 231 $ 8
Financial Liabilities
(Canadian $ millions)
Gross Amount of
Recognized Financial
Liabilities
Less: Gross Amount of
Recognized Financial
Assets Set-Off
Net Amount of Financial
Liabilities Presented in the
Statements ofFinancial Position
Less: Related Amounts Not Set-Off in the Statements
of Financial Position
Net
Recognized Financial
Assets
Collateral Pledged and Not
Derecognized
March 31, 2017Repurchase agreements $ 80 $ – $ 80A $ 15 $ 65 $ –OTC-derivatives 59 – 59B 44 14 1
Total $ 139 $ – $ 139 $ 59 $ 79 $ 1
March 31, 2016Repurchase agreements $ 105 $ – $ 105A $ – $ 105 $ –OTC-derivatives 83 1 82B 69 13 –
Total $ 188 $ 1 $ 187 $ 69 $ 118 $ –
A As described in Note 4.1.
B As described in Note 4.1.11.
ANNUAL REPORT 2017 | PUBLIC SECTOR PENSION INVESTMENT BOARD222

ROYAL CANADIAN MOUNTED POLICE PENSION PLAN ACCOUNTNotes to the Financial Statements for the years ended March 31, 2017 and 2016
7 INVESTMENT RISK MANAGEMENT (continued)
7.3. LIQUIDITY RISK
Liquidity risk corresponds to the risk that PSP Investments will not be able to meet its financial obligations on a timely basis, with sufficient and readily available cash resources. PSP Investments’ cash position is monitored on a daily basis. In general, investments in cash, money market securities, floating rate notes, bonds and public equities are expected to be highly liquid as they will be invested in securities that are actively traded. Management utilizes appropriate measures and controls to monitor liquidity risk in order to ensure that there is sufficient liquidity to meet financial obligations as they come due. A liquidity report taking into consideration future forecasted cash flows is prepared and presented to senior management on a weekly basis. This ensures that sufficient cash reserves are available to meet forecasted cash outflows. Additionally, sufficient sources of liquidity are maintained for deployment in case of market disruption.
PSP Investments has the ability to raise additional capital through the use of its capital market debt program. This program allows PSP Investments to issue short-term promissory notes and medium-term notes. Note 8.2 provides additional information on the usage of the capital market debt program. Furthermore, PSP Investments maintains credit facilities for general corporate purposes. Note 8.1 provides additional information with respect to such credit facilities.
The terms to maturity of the notional amount of derivatives are disclosed in Note 4.1.11.
Financial Liabilities
The following tables present the fair value of non-derivative-related financial liabilities as well as derivative-related financial instruments, aggregated according to their maturities as at March 31, 2017 and excluding the impact of guarantees and indemnities disclosed in Note 15:
(Canadian $ millions)Less than 3 Months
3 to 12 Months
Over 1 Year Total
Non-derivative-related financial liabilitiesA
Amounts payable from pending trades $ (78) $ – $ – $ (78)Interest payable (3) – – (3)Securities sold short and securities loaned (676) – – (676)Securities sold under repurchase agreements (80) – – (80)Capital market debt financing (419) (90) (275) (784)Trade payable and other liabilities (11) – (5) (16)
Total $ (1,267) $ (90) $ (280) $ (1,637)
(Canadian $ millions)Less than 3 Months
3 to 12 Months
Over 1 Year Total
Derivative-related financial instrumentsDerivative-related assets $ 18 $ 24 $ 23 $ 65Derivative-related liabilitiesA (28) (13) (20) (61)
Total $ (10) $ 11 $ 3 $ 4
A Liabilities are presented in the earliest period in which the counterparty can request payment.
PUBLIC SECTOR PENSION INVESTMENT BOARD | ANNUAL REPORT 2017 223

ROYAL CANADIAN MOUNTED POLICE PENSION PLAN ACCOUNTNotes to the Financial Statements for the years ended March 31, 2017 and 2016
7 INVESTMENT RISK MANAGEMENT (continued)
7.3. LIQUIDITY RISK (continued)
Financial Liabilities (continued)
The following tables present the fair value of non-derivative-related financial liabilities as well as derivative-related financial instruments, aggregated according to their maturities as at March 31, 2016 and excluding the impact of guarantees and indemnities disclosed in Note 15:
(Canadian $ millions)Less than 3 Months
3 to 12 Months
Over 1 Year Total
Non-derivative-related financial liabilitiesA
Amounts payable from pending trades $ (42) $ – $ – $ (42)Interest payable (2) – – (2)Securities sold short (194) – – (194)Securities sold under repurchase agreements (105) – – (105)Capital market debt financing (379) (146) (118) (643)Trade payable and other liabilities (9) – (4) (13)
Total $ (731) $ (146) $ (122) $ (999)
(Canadian $ millions)Less than 3 Months
3 to 12 Months
Over 1 Year Total
Derivative-related financial instrumentsDerivative-related assets $ 136 $ 57 $ 39 $ 232Derivative-related liabilitiesA (23) (15) (46) (84)
Total $ 113 $ 42 $ (7) $ 148
A Liabilities are presented in the earliest period in which the counterparty can request payment.
ANNUAL REPORT 2017 | PUBLIC SECTOR PENSION INVESTMENT BOARD224
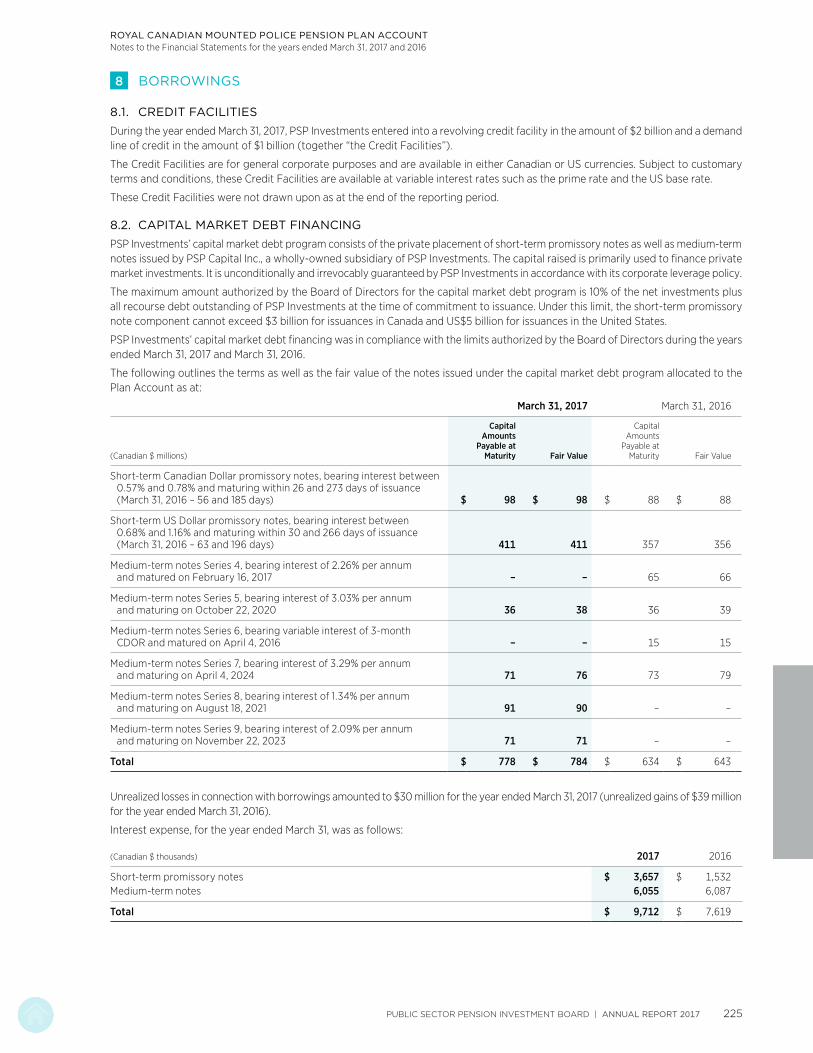
ROYAL CANADIAN MOUNTED POLICE PENSION PLAN ACCOUNTNotes to the Financial Statements for the years ended March 31, 2017 and 2016
8 BORROWINGS
8.1. CREDIT FACILITIES
During the year ended March 31, 2017, PSP Investments entered into a revolving credit facility in the amount of $2 billion and a demand line of credit in the amount of $1 billion (together “the Credit Facilities”).
The Credit Facilities are for general corporate purposes and are available in either Canadian or US currencies. Subject to customary terms and conditions, these Credit Facilities are available at variable interest rates such as the prime rate and the US base rate.
These Credit Facilities were not drawn upon as at the end of the reporting period.
8.2. CAPITAL MARKET DEBT FINANCING
PSP Investments’ capital market debt program consists of the private placement of short-term promissory notes as well as medium-term notes issued by PSP Capital Inc., a wholly-owned subsidiary of PSP Investments. The capital raised is primarily used to finance private market investments. It is unconditionally and irrevocably guaranteed by PSP Investments in accordance with its corporate leverage policy.
The maximum amount authorized by the Board of Directors for the capital market debt program is 10% of the net investments plus all recourse debt outstanding of PSP Investments at the time of commitment to issuance. Under this limit, the short-term promissory note component cannot exceed $3 billion for issuances in Canada and US$5 billion for issuances in the United States.
PSP Investments’ capital market debt financing was in compliance with the limits authorized by the Board of Directors during the years ended March 31, 2017 and March 31, 2016.
The following outlines the terms as well as the fair value of the notes issued under the capital market debt program allocated to the Plan Account as at:
March 31, 2017 March 31, 2016
(Canadian $ millions)
Capital Amounts
Payable at Maturity Fair Value
Capital Amounts
Payable at Maturity Fair Value
Short-term Canadian Dollar promissory notes, bearing interest between 0.57% and 0.78% and maturing within 26 and 273 days of issuance (March 31, 2016 – 56 and 185 days) $ 98 $ 98 $ 88 $ 88
Short-term US Dollar promissory notes, bearing interest between 0.68% and 1.16% and maturing within 30 and 266 days of issuance (March 31, 2016 – 63 and 196 days) 411 411 357 356
Medium-term notes Series 4, bearing interest of 2.26% per annum and matured on February 16, 2017 – – 65 66
Medium-term notes Series 5, bearing interest of 3.03% per annum and maturing on October 22, 2020 36 38 36 39
Medium-term notes Series 6, bearing variable interest of 3-month CDOR and matured on April 4, 2016 – – 15 15
Medium-term notes Series 7, bearing interest of 3.29% per annum and maturing on April 4, 2024 71 76 73 79
Medium-term notes Series 8, bearing interest of 1.34% per annum and maturing on August 18, 2021 91 90 – –
Medium-term notes Series 9, bearing interest of 2.09% per annum and maturing on November 22, 2023 71 71 – –
Total $ 778 $ 784 $ 634 $ 643
Unrealized losses in connection with borrowings amounted to $30 million for the year ended March 31, 2017 (unrealized gains of $39 million for the year ended March 31, 2016).
Interest expense, for the year ended March 31, was as follows:
(Canadian $ thousands) 2017 2016
Short-term promissory notes $ 3,657 $ 1,532Medium-term notes 6,055 6,087
Total $ 9,712 $ 7,619
PUBLIC SECTOR PENSION INVESTMENT BOARD | ANNUAL REPORT 2017 225

ROYAL CANADIAN MOUNTED POLICE PENSION PLAN ACCOUNTNotes to the Financial Statements for the years ended March 31, 2017 and 2016
9 EQUITY
9.1. STATUTORY RIGHTS HELD BY THE GOVERNMENT OF CANADA
Pursuant to the Superannuation Acts, the Government of Canada is entitled to PSP Investments’ net assets allocated to each of the Plan Accounts for the purposes set out in the Superannuation Acts. The allocation of PSP Investments’ net assets and comprehensive income (loss) to each of the Plan Accounts at a point in time is based on the allocation policy outlined in Note 12.
9.2. FUND TRANSFERS
PSP Investments received fund transfers from the Government of Canada of $251 million for the year ended March 31, 2017 ($346 million for the year ended March 31, 2016) for the Fund, recorded in the Plan Account.
10 INVESTMENT-RELATED EXPENSES
Investment-related expenses allocated to the Plan Account are comprised of the following for the year ended March 31:
(Canadian $ millions) 2017 2016
Interest expense $ 11 $ 8Transaction costs 10 8External investment
management feesA 2 3Other (net) 3 1
Total $ 26 $ 20
A Consists of amounts incurred for investments in public markets that are paid directly by PSP Investments. Other fees are paid by certain pooled fund investments classified under alternative investments which amounted to $11 million for the year ended March 31, 2017 ($5 million for the year ended March 31, 2016). Such fees are embedded in the fair value of the funds.
Similarly, management fees related to investments in private markets and private debt securities are not paid directly by PSP Investments. Such fees, which generally vary between 0.1% and 2.0% of the total invested and/or committed amount, totaled $22 million for the year ended March 31, 2017 ($17 million for the year ended March 31, 2016). Such fees are embedded in the fair value of the investments.
11 OPERATING EXPENSES
Operating expenses allocated to the Plan Account consisted of the following for the year ended March 31:
(Canadian $ thousands) 2017 2016
Salaries and employee benefits $ 15,234 $ 12,101Professional and consulting fees 4,464 3,275Premises and equipment 1,518 1,153Market data and
business applications 1,933 1,620Depreciation of equipment 2,216 1,872Custodial fees 282 314Other operating expenses 1,218 971
Total $ 26,865 $ 21,306
12 ALLOCATION OF COMPREHENSIVE INCOME (LOSS)
PSP Investments’ comprehensive income (loss) is allocated to each Plan Account as follows:
12.1. INVESTMENT INCOME
The investment income is allocated proportionately based upon the net investments of each Plan Account at the time the income was incurred.
12.2. EXPENSES
The Act requires that the costs of operation of PSP Investments be charged to the Plan Accounts. Under section 4(3) of the Act, the President of the Treasury Board shall determine to which Plan Account these costs will be charged, in consultation with the Minister of National Defence and the Minister of Public Safety and Emergency Preparedness. An allocation policy was developed which allocates the direct costs of investment activities, such as external investment management fees and custodial fees, to each Plan Account, based upon the net investments of each Plan Account at the time the expense was incurred.
Operating expenses and other comprehensive income (loss), excluding the direct cost of investment activities listed above, for the year ended March 31, were allocated in proportion to the annual amount of net investments of each Plan Account as follows:
2017 2016
Public Service Pension Plan Account 72.5% 72.6%
Canadian Forces Pension Plan Account 19.7 19.7
Royal Canadian Mounted Police Pension Plan Account 7.3 7.2
Reserve Force Pension Plan Account 0.5 0.5
Total 100.0% 100.0%
Expenses are paid by PSP Investments by way of advances from the Public Service Pension Plan Account, which are reimbursed by the other Plan Accounts on a quarterly basis.
ANNUAL REPORT 2017 | PUBLIC SECTOR PENSION INVESTMENT BOARD226
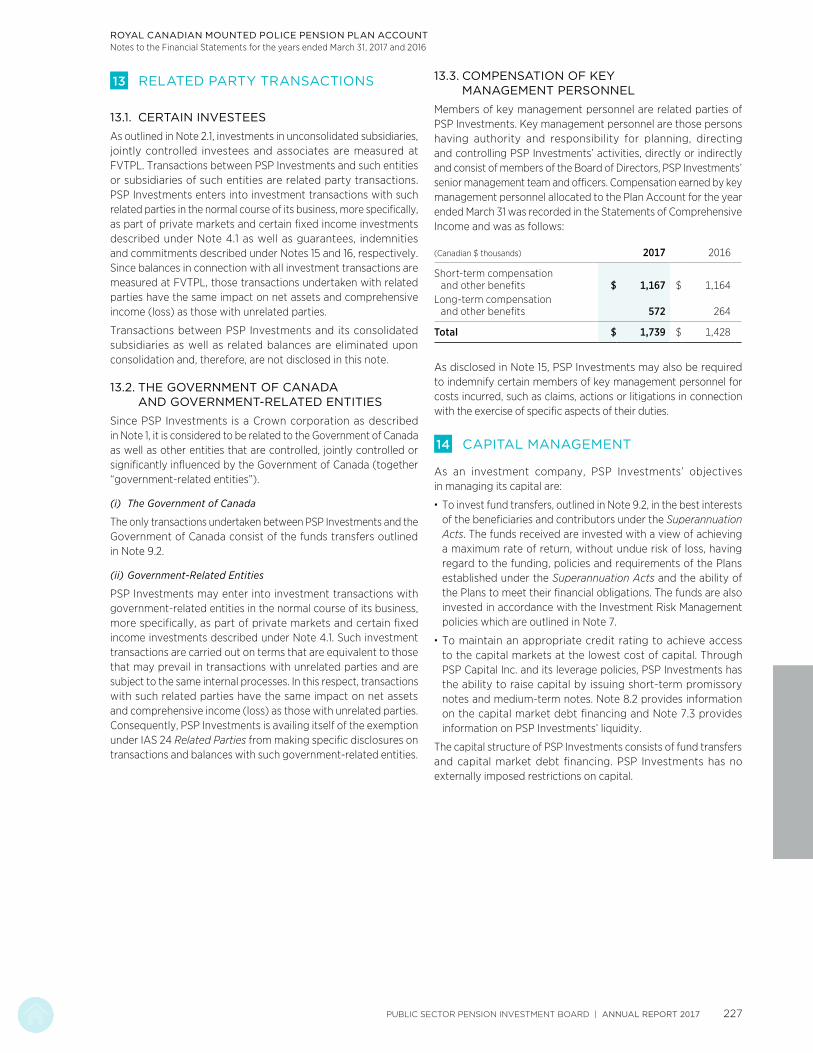
ROYAL CANADIAN MOUNTED POLICE PENSION PLAN ACCOUNTNotes to the Financial Statements for the years ended March 31, 2017 and 2016
13 RELATED PARTY TRANSACTIONS
13.1. CERTAIN INVESTEES
As outlined in Note 2.1, investments in unconsolidated subsidiaries, jointly controlled investees and associates are measured at FVTPL. Transactions between PSP Investments and such entities or subsidiaries of such entities are related party transactions. PSP Investments enters into investment transactions with such related parties in the normal course of its business, more specifically, as part of private markets and certain fixed income investments described under Note 4.1 as well as guarantees, indemnities and commitments described under Notes 15 and 16, respectively. Since balances in connection with all investment transactions are measured at FVTPL, those transactions undertaken with related parties have the same impact on net assets and comprehensive income (loss) as those with unrelated parties.
Transactions between PSP Investments and its consolidated subsidiaries as well as related balances are eliminated upon consolidation and, therefore, are not disclosed in this note.
13.2. THE GOVERNMENT OF CANADA AND GOVERNMENT-RELATED ENTITIES
Since PSP Investments is a Crown corporation as described in Note 1, it is considered to be related to the Government of Canada as well as other entities that are controlled, jointly controlled or significantly influenced by the Government of Canada (together “government-related entities”).
(i) The Government of Canada
The only transactions undertaken between PSP Investments and the Government of Canada consist of the funds transfers outlined in Note 9.2.
(ii) Government-Related Entities
PSP Investments may enter into investment transactions with government-related entities in the normal course of its business, more specifically, as part of private markets and certain fixed income investments described under Note 4.1. Such investment transactions are carried out on terms that are equivalent to those that may prevail in transactions with unrelated parties and are subject to the same internal processes. In this respect, transactions with such related parties have the same impact on net assets and comprehensive income (loss) as those with unrelated parties. Consequently, PSP Investments is availing itself of the exemption under IAS 24 Related Parties from making specific disclosures on transactions and balances with such government-related entities.
13.3. COMPENSATION OF KEY MANAGEMENT PERSONNEL
Members of key management personnel are related parties of PSP Investments. Key management personnel are those persons having authority and responsibility for planning, directing and controlling PSP Investments’ activities, directly or indirectly and consist of members of the Board of Directors, PSP Investments’ senior management team and officers. Compensation earned by key management personnel allocated to the Plan Account for the year ended March 31 was recorded in the Statements of Comprehensive Income and was as follows:
(Canadian $ thousands) 2017 2016
Short-term compensation and other benefits $ 1,167 $ 1,164
Long-term compensation and other benefits 572 264
Total $ 1,739 $ 1,428
As disclosed in Note 15, PSP Investments may also be required to indemnify certain members of key management personnel for costs incurred, such as claims, actions or litigations in connection with the exercise of specific aspects of their duties.
14 CAPITAL MANAGEMENT
As an investment company, PSP Investments’ objectives in managing its capital are:
· To invest fund transfers, outlined in Note 9.2, in the best interests of the beneficiaries and contributors under the Superannuation Acts. The funds received are invested with a view of achieving a maximum rate of return, without undue risk of loss, having regard to the funding, policies and requirements of the Plans established under the Superannuation Acts and the ability of the Plans to meet their financial obligations. The funds are also invested in accordance with the Investment Risk Management policies which are outlined in Note 7.
· To maintain an appropriate credit rating to achieve access to the capital markets at the lowest cost of capital. Through PSP Capital Inc. and its leverage policies, PSP Investments has the ability to raise capital by issuing short-term promissory notes and medium-term notes. Note 8.2 provides information on the capital market debt financing and Note 7.3 provides information on PSP Investments’ liquidity.
The capital structure of PSP Investments consists of fund transfers and capital market debt financing. PSP Investments has no externally imposed restrictions on capital.
PUBLIC SECTOR PENSION INVESTMENT BOARD | ANNUAL REPORT 2017 227
ROYAL CANADIAN MOUNTED POLICE PENSION PLAN ACCOUNTNotes to the Financial Statements for the years ended March 31, 2017 and 2016
15 GUARANTEES AND INDEMNITIES
PSP Investments provides indemnification to its Directors, its Officers, its vice-presidents and to certain PSP Investments representatives who are asked to serve on boards of directors (or like bodies) or investment advisory boards (or like bodies) of entities in which PSP Investments or its investment entity subsidiaries have made an investment or have a financial interest. As a result, but subject to the Act, PSP Investments may be required to indemnify these representatives for costs incurred, such as claims, actions or litigation in connection with the exercise of their duties, unless the liability of such a representative relates to a failure to act honestly and in good faith. To date, PSP Investments has not received any claims or made any payment for such indemnities.
In certain cases, PSP Investments also provides indemnification to third parties in the normal course of business. As a result, PSP Investments may be required to indemnify such third parties in connection with the performance of their contractual obligations. To date, PSP Investments has not received any claims nor made any payments for such indemnities.
PSP Investments unconditionally and irrevocably guarantees all credit facilities, as well as short-term promissory notes and medium-term notes issued by PSP Capital Inc., as described in Note 8.
In certain investment transactions, PSP Investments and its investment entity subsidiaries provided guarantees, indemnifications or issued letters of credit to third parties, the most significant of which are as follows:
· As at March 31, 2017, PSP Investments and its investment entity subsidiaries agreed to guarantee and, in some cases, provide indemnification for the performance of certain investees under contractual agreements. The majority of these agreements are borrowing arrangements. In the event a default occurs under such agreements, which is of limited recourse in certain cases, PSP Investments or its investment entity subsidiaries could assume obligations of up to $2,077 million as at March 31, 2017 (March 31, 2016 – $1,891 million), of which $151 million has been allocated to the Plan Account (March 31, 2016 – $137 million) plus applicable interest and other related costs. The arrangements mature between May 2017 and September 2028.
· Additionally, PSP Investments and its investment entity subsidiaries issued letters of credit totalling $35 million as at March 31, 2017 (March 31, 2016 – $29 million), of which $3 million has been allocated to the Plan Account (March 31, 2016 – $2 million) in relation to investment transactions.
16 COMMITMENTS
PSP Investments and its investment entity subsidiaries have committed to enter into investment transactions, which will be funded over the next several years in accordance with agreed terms and conditions. The portion of PSP Investments’ commitments that would be assumed by the Plan Account was as follows as at March 31:
(Canadian $ millions) 2017 2016
Real estate $ 205 $ 176Private equity 657 515Infrastructure 272 290Natural resources 55 62Private debt securities 226 328Alternative investments 90 138
Total $ 1,505 $ 1,509
Funding in connection with the above commitments can be called upon at various dates extending until 2035 as at March 31, 2017 (March 31, 2016 – 2032).
ANNUAL REPORT 2017 | PUBLIC SECTOR PENSION INVESTMENT BOARD228

Reserve Force Pension Plan Account
FINANCIAL STATEMENTS
Independent Auditors’ ReportTo the Minister of National Defence
Report on the Financial Statements
We have audited the accompanying financial statements of the Public Sector Pension Investment Board – Reserve Force Pension Plan Account (the Reserve Force Pension Plan Account), which comprise the statements of financial position as at March 31, 2017 and March 31, 2016, and the statements of comprehensive income, statements of changes in equity and statements of cash flows for the years then ended, and a summary of significant accounting policies and other explanatory information.
Management’s Responsibility for the Financial Statements
Management is responsible for the preparation and fair presentation of these financial statements in accordance with International Financial Reporting Standards as issued by the International Accounting Standards Board, and for such internal control as management determines is necessary to enable the preparation of financial statements that are free from material misstatement, whether due to fraud or error.
Auditor’s Responsibility
Our responsibility is to express an opinion on these financial statements based on our audits. We conducted our audits in accordance with Canadian generally accepted auditing standards. Those standards require that we comply with ethical requirements and plan and perform the audit to obtain reasonable assurance about whether the financial statements are free from material misstatement.
An audit involves performing procedures to obtain audit evidence about the amounts and disclosures in the financial statements. The procedures selected depend on the auditor’s judgment, including the assessment of the risks of material misstatement of the financial statements, whether due to fraud or error. In making those risk assessments, the auditor considers internal
control relevant to the entity’s preparation and fair presentation of the financial statements in order to design audit procedures that are appropriate in the circumstances, but not for the purpose of expressing an opinion on the effectiveness of the entity’s internal control. An audit also includes evaluating the appropriateness of accounting policies used and the reasonableness of accounting estimates made by management, as well as evaluating the overall presentation of the financial statements.
We believe that the audit evidence we have obtained in our audits is sufficient and appropriate to provide a basis for our audit opinion.
Opinion
In our opinion, the financial statements present fairly, in all material respects, the financial position of the Reserve Force Pension Plan Account as at March 31, 2017 and March 31, 2016, and its financial performance and its cash flows for the years then ended in accordance with International Financial Reporting Standards as issued by the International Accounting Standards Board.
Report on Other Legal and Regulatory Requirements
As required by the Financial Administration Act, we report that, in our opinion, the accounting principles in International Financial Reporting Standards as issued by the International Accounting Standards Board have been applied on a basis consistent with that of the preceding year.
Further, in our opinion, the transactions in the Reserve Force Pension Plan Account that have come to our notice during our audits of the financial statements have, in all significant respects, been in accordance with the applicable provisions of Part X of the Financial Administration Act and regulations, the Public Sector Pension Investment Board Act and regulations and the by-laws of the Public Sector Pension Investment Board and its wholly-owned subsidiaries.
Margaret Haire, CPA, CA Principal for the Auditor General of Canada
May 12, 2017 Ottawa, Canada
1 CPA auditor, CA, public accountancy permit No. A121444
May 12, 2017 Montréal, Canada
Reserve Force Pension Plan Account
PUBLIC SECTOR PENSION INVESTMENT BOARD | ANNUAL REPORT 2017 229
RESERVE FORCE PENSION PLAN ACCOUNT
Statements of Financial PositionAs at
(Canadian $ thousands) March 31, 2017 March 31, 2016
AssetsInvestments (Note 4.1) $ 735,238 $ 626,867Other assets 684 609
Total assets $ 735,922 $ 627,476
LiabilitiesTrade payable and other liabilities $ 1,038 $ 830Investment-related liabilities (Note 4.1) 57,285 27,931Borrowings (Notes 4.1, 8.2) 50,035 42,189Due to the Public Service Pension Plan Account 511 430
Total liabilities $ 108,869 $ 71,380
Net assets $ 627,053 $ 556,096
Equity (Note 9) $ 627,053 $ 556,096
Total liabilities and equity $ 735,922 $ 627,476
The accompanying notes are an integral part of the Financial Statements.
On behalf of the Board of Directors:
Michael P. Mueller William A. MacKinnon Chair of the Board Chair of the Audit Committee
ANNUAL REPORT 2017 | PUBLIC SECTOR PENSION INVESTMENT BOARD230

RESERVE FORCE PENSION PLAN ACCOUNT
Statements of Comprehensive Income For the years ended March 31
(Canadian $ thousands) 2017 2016
Investment income $ 74,432 $ 6,492
Investment-related expenses (Note 10) (1,683) (1,315)
Net investment income $ 72,749 $ 5,177
Operating expenses (Note 11) (1,773) (1,446)
Net income $ 70,976 $ 3,731
Other comprehensive income (loss)Remeasurement of the net defined benefit liability (19) 21
Comprehensive income $ 70,957 $ 3,752
Statements of Changes in Equity For the years ended March 31
(Canadian $ thousands) 2017 2016
Fund transfersBalance at beginning of period $ 329,631 $ 329,631Fund transfers received during the period (Note 9.2) – –
Balance at end of period $ 329,631 $ 329,631
Retained earningsBalance at beginning of period $ 226,465 $ 222,713Comprehensive income 70,957 3,752
Balance at end of period $ 297,422 $ 226,465
Total equity $ 627,053 $ 556,096
The accompanying notes are an integral part of the Financial Statements.
PUBLIC SECTOR PENSION INVESTMENT BOARD | ANNUAL REPORT 2017 231

RESERVE FORCE PENSION PLAN ACCOUNT
Statements of Cash Flows For the years ended March 31
(Canadian $ thousands) 2017 2016
Cash flows from operating activitiesNet income $ 70,976 $ 3,731Adjustments for non-cash items:
Depreciation of equipment (Note 11) 146 127Effect of exchange rate changes on cash and cash equivalents (231) 37Unrealized losses (gains) on borrowings 1,966 (2,645)
$ 72,857 $ 1,250
Net changes in operating assets and liabilitiesIncrease in investments $ (97,327) $ (9,931)Decrease (increase) in other assets 40 (27)Increase (decrease) in trade payable and other liabilities 189 (17)Increase in investment-related liabilities 29,354 2,938
Net cash flows provided by (used in) operating activities $ 5,113 $ (5,787)
Cash flow from financing activitiesProceeds from borrowings $ 102,174 $ 99,550Repayment of borrowings (96,294) (91,313)Repayment to the Public Service Pension Plan Account (2,023) (1,874)Advances from the Public Service Pension Plan Account 2,104 1,910
Net cash flows provided by financing activities $ 5,961 $ 8,273
Cash flow from investing activitiesAcquisitions of equipment $ (218) $ (133)
Net cash flows used in investing activities $ (218) $ (133)
Net change in cash and cash equivalents $ 10,856 $ 2,353Effect of exchange rate changes on cash and cash equivalents 231 (37)Cash and cash equivalents at the beginning of the period 6,615 4,299
Cash and cash equivalents at the end of the periodA $ 17,702 $ 6,615
Supplementary disclosure of cash flow informationInterest paid $ (652) $ (593)
A As at March 31, 2017, cash and cash equivalents were comprised of $17,616 thousand (March 31, 2016 – $6,572 thousand) held for investment purposes and included in Note 4.1, as well as $86 thousand (March 31, 2016 – $43 thousand) held for administrative purposes and included in Other assets.
The accompanying notes are an integral part of the Financial Statements.
ANNUAL REPORT 2017 | PUBLIC SECTOR PENSION INVESTMENT BOARD232

1 CORPORATE INFORMATION
The Public Sector Pension Investment Board (“PSP Investments”) is a Crown corporation created under the Public Sector Pension Investment Board Act (the “Act”) to manage and invest amounts that are transferred to it pursuant to the Superannuation Acts (defined below), for the funds (as defined in the Act) of the pension plans established under the Public Service Superannuation Act, the Canadian Forces Superannuation Act (“CFSA”), the Royal Canadian Mounted Police Superannuation Act (collectively the “Superannuation Acts”), and certain regulations under the CFSA (the “CFSA Regulations”). The pension plans established under the Superannuation Acts consist of the Public Service pension plan, the Canadian Forces pension plan, and the Royal Canadian Mounted Police pension plan, and the pension plan established under the CFSA Regulations is the Reserve Force pension plan (the “Plan”). The Plan and the other pension plans are herein referred to collectively as the “Plans”.
The fund for which amounts are currently transferred to PSP Investments by the Government of Canada (the “Fund”) relates to pension obligations under the Plan for service on or after March 1, 2007 (“Post-2007 Service”). The account managed by PSP Investments for the Fund is herein referred to as the “Plan Account”. PSP Investments maintains records of the net contributions for the Fund, as well as the allocation of its investments and the results of its operations for the Fund in the Plan Account. PSP Investments also manages a plan account for the funds of the other Plans, and these and the Plan Account are collectively referred to herein as the “Plan Accounts”.
PSP Investments is responsible for managing amounts that are transferred to it for the Fund in the best interests of the beneficiaries and contributors under the CFSA Regulations. The amounts are to be invested with a view of achieving a maximum rate of return, without undue risk of loss, having regard to the funding, policies and requirements of the Plan and the Plan’s ability to meet its financial obligations.
Pursuant to the CFSA and the CFSA Regulations, the Government of Canada, which administers the Plan and the Fund, may at any time call upon the net assets of PSP Investments allocated to the Fund’s Plan Account for amounts required for the purpose of paying benefits under the Plan in respect of Post-2007 Service.
PSP Investments and the majority of its subsidiaries are exempt from Part I tax under paragraphs 149(1)(d) and 149(1)(d.2) of the Income Tax Act (Canada), respectively.
PSP Investments’ registered office is located at 1 Rideau Street, Ottawa, Ontario, Canada and its principal business office is at 1250 René Lévesque Boulevard West, Montreal, Quebec, Canada.
2 SIGNIFICANT ACCOUNTING POLICIES
The significant accounting policies that have been applied in the preparation of these Financial Statements are summarized below and have been used throughout all periods presented.
2.1. BASIS OF PRESENTATION
These Financial Statements have been prepared in accordance with International Financial Reporting Standards (“IFRS”) as issued by the International Accounting Standards Board (“IASB”).
PSP Investments qualifies as an investment entity as defined under IFRS 10 Consolidated Financial Statements and, consequently, does not consolidate its subsidiaries other than those that solely provide it with services that relate to its investment activities. Instead, PSP Investments measures its investments in subsidiaries at fair value through profit or loss (“FVTPL”) in accordance with IFRS 9 Financial Instruments (“IFRS 9”), including those that are formed by PSP Investments and that qualify as investment entities (“investment entity subsidiaries”). PSP Investments also measures its investments in associates, joint ventures and financial assets and financial liabilities at FVTPL in accordance with IAS 28 Investments in Associates and Joint Ventures and IFRS 9.
These Financial Statements present the Plan Account’s financial position and results of operations of PSP Investments and its subsidiaries that solely provide it with services that relate to its investment activities, as allocated to the Plan Account. They reflect the economic activity of PSP Investments as it pertains to the investment of the net contributions transferred to it for the Fund in respect of Post-2007 Service. Accordingly, they do not reflect all of the assets or the details of the pension contributions, payments and liabilities under the Plan.
These Financial Statements were authorized for issue in accordance with a resolution of the Board of Directors on May 12, 2017.
Notes to the Financial StatementsFor the years ended March 31, 2017 and 2016
RESERVE FORCE PENSION PLAN ACCOUNT
PUBLIC SECTOR PENSION INVESTMENT BOARD | ANNUAL REPORT 2017 233

RESERVE FORCE PENSION PLAN ACCOUNTNotes to the Financial Statements for the years ended March 31, 2017 and 2016
2 SIGNIFICANT ACCOUNTING POLICIES (continued)
2.2. INVESTMENT ENTITY STATUS
PSP Investments has determined that it meets the mandatory items of the definition of an investment entity under IFRS 10 on the basis of the facts and circumstances as at the end of the period. They are as follows:
(i) Mandate and business purpose
As further described in Note 1, PSP Investments’ mandate is to manage and invest the amounts that are transferred to it in the best interests of the beneficiaries and contributors under the Superannuation Acts. Consequently, PSP Investments’ business purpose is to invest with a view of achieving a maximum rate of return from capital appreciation and income from investments, without undue risk of loss.
(ii) Performance evaluation
PSP Investments measures and evaluates the performance of its investments on a fair value basis.
In addition to the mandatory items of the definition, IFRS 10 also outlines certain typical characteristics of an investment entity, the absence of any of which does not necessarily preclude an entity from qualifying as an investment entity. One of these characteristics is that an investment entity should have investors that are not related parties of the entity.
As described in Note 13, since PSP Investments is a Crown corporation, it is considered to be related to the Government of Canada as well as other entities that are controlled or jointly controlled by the Government of Canada or entities over which the latter has significant influence. Consequently, since the funds managed by PSP Investments originate from related parties, it may be considered not to meet the typical characteristic outlined above. However, the Act provides a framework to ensure that PSP Investments operates at arm’s length from the Government of Canada. Accordingly, it meets all of the mandatory items of the definition described above and qualifies as an investment entity.
Should any changes occur in the facts and circumstances, PSP Investments will evaluate the impact of any such changes on its investment entity status.
2.3. SUMMARY OF SIGNIFICANT ACCOUNTING POLICIES
The principal accounting policies applied in the preparation of these Financial Statements are set out below.
2.3.1. Financial Instruments
(i) Classification
Financial assets representing investments are managed, together with related financial liabilities, according to the entity’s business model to maximize the rate of return. The performance of such financial instruments is evaluated on a fair value basis and they are classified at FVTPL. They are described in detail in Note 4.1.
Borrowings as described under Note 8, are financial liabilities that are designated to be measured at FVTPL since they are part of the portfolios of investments that are managed together and whose performance is evaluated on a fair value basis.
(ii) Recognition
Financial assets and financial liabilities are recorded at the date upon which PSP Investments becomes a party to the associated contractual provisions. In the case of traded financial assets, they are recorded as of the trade date.
(iii) Initial and subsequent measurement
All financial assets and financial liabilities are recorded in the Statements of Financial Position at fair value and continue to be measured as such on a recurring basis. After initial measurement, subsequent changes in the fair value of financial assets and financial liabilities classified at FVTPL are recorded in the Statements of Comprehensive Income.
If fair value changes in financial liabilities designated to be measured at FVTPL result from fluctuations in PSP Investments’ own credit risk, they are recorded in other comprehensive income. All other changes in fair value are recorded in investment income.
(iv) Derecognition
A financial asset (or, where applicable, a part thereof) is derecognized when the following conditions are met:
· The rights to receive cash flows from the asset have expired, or
· PSP Investments has transferred its rights to receive cash flows from the asset or has assumed an obligation to pay the received cash flows to a third party,
and
· PSP Investments has transferred substantially all the risks and rewards of the asset, or
· In cases where PSP Investments has neither transferred nor retained substantially all the risks and rewards of the asset, it has transferred control of the asset.
A financial liability is derecognized when the obligation under the liability is discharged, cancelled or expired.
ANNUAL REPORT 2017 | PUBLIC SECTOR PENSION INVESTMENT BOARD234
RESERVE FORCE PENSION PLAN ACCOUNTNotes to the Financial Statements for the years ended March 31, 2017 and 2016
2 SIGNIFICANT ACCOUNTING POLICIES (continued)
2.3. SUMMARY OF SIGNIFICANT ACCOUNTING POLICIES (continued)
2.3.2. Determination of Fair Value
Fair value is the price that would be received to sell an asset or paid to transfer a liability in an orderly transaction between market participants at the measurement date.
At initial recognition, PSP Investments evaluates the facts and circumstances related to a transaction to confirm that the transaction price represents the fair value of an asset or a liability. At each subsequent reporting date, market prices are used to determine fair value where an active market exists (such as a recognized securities exchange), as they reflect actual and regularly occurring market transactions on an arm’s length basis. If quoted market prices are not available, then fair value is estimated using valuation techniques based on inputs existing at the end of the reporting period that are derived from observable market data.
Valuation techniques are generally applied to investments in Private Markets, over-the-counter (OTC) derivatives and certain fixed income securities. The values derived from applying these techniques are impacted by the choice of valuation model and the underlying assumptions made concerning factors such as the amounts and timing of future cash flows, discount rates, volatility and credit risk. In certain cases, such assumptions are not supported by market observable data.
The determination of fair value of all financial assets and financial liabilities is described in Note 4.
2.3.3. Functional and Presentation Currency
The functional and presentation currency of PSP Investments and its consolidated subsidiaries is the Canadian dollar, which is the currency of the primary economic environment in which each entity within the consolidated group operates. PSP Investments’ performance and that of its consolidated subsidiaries is evaluated and its liquidity is managed in Canadian dollars.
2.3.4. Foreign Currency Translation
Foreign currency transactions during the period, including purchases and sales of securities, income and expenses, are translated at the rate of exchange prevailing on the date of the transaction.
Monetary assets and liabilities that are denominated in foreign currencies are translated at the functional currency rate of exchange prevailing at the end of the reporting period.
Foreign currency transaction gains and losses on all monetary assets and liabilities are included in investment income.
2.3.5. Securities Lending and Securities Borrowing and Related Collateral
PSP Investments participates in securities lending and borrowing programs whereby it lends and borrows securities in order to enhance portfolio returns. Lending and borrowing transactions including related collateral under such programs do not transfer the risks or rewards of ownership of the securities to the counterparty. Consequently, PSP Investments does not derecognize securities lent or pledged as collateral, or recognize securities borrowed or received as collateral. Cash collateral received is recognized as described in Note 4.1.8.
The securities lending and borrowing programs require collateral in cash, high-quality debt instruments or securities. Collateral transactions are conducted under terms that are usual and customary in standard securities lending and borrowing programs. PSP Investments and its counterparties are authorized to sell, repledge or otherwise use collateral held. The same securities or equivalent securities must be returned to the counterparty at the end of the contract, unless an event of default occurs.
2.3.6. Securities sold under Repurchase Agreements and purchased under Reverse Repurchase Agreements and Related Collateral
PSP Investments is party to repurchase and reverse repurchase agreements. Such agreements involve the sale of securities by one counterparty with a simultaneous agreement to repurchase such securities at a specified price and at a specified future date.
Securities sold or purchased under the repurchase and reverse repurchase agreements respectively, including related collateral, are not derecognized or recognized as all risks and rewards of ownership related to such securities are not transferred. As such, in the case where PSP Investments is the counterparty selling securities under such agreements, all income (loss) related to such securities continues to be reported in investment income and obligations to repurchase the securities sold are accounted for as investment-related liabilities. The difference between the fair value of the securities sold and the repurchase price is recorded as interest expense. In the case where PSP Investments is the counterparty purchasing securities under such agreements, no income (loss) related to such securities is recognized and obligations to resell the securities are accounted for as investment-related receivables. The difference between the fair value of the securities purchased and resale price is recorded in investment income.
Transactions under repurchase and reverse repurchase agreements involve pledging collateral consisting of cash or securities deemed acceptable by the counterparties. Collateral transactions are conducted under terms that are usual and customary in standard repurchase arrangements. Such terms require the relevant counterparty to pledge additional collateral based on the changes in the fair value of the existing collateral pledged as well as the related securities sold or purchased. The counterparties are authorized to sell, repledge or otherwise use collateral held. The securities pledged as collateral must be returned to the relevant counterparty at the end of the contract, unless an event of default occurs.
PUBLIC SECTOR PENSION INVESTMENT BOARD | ANNUAL REPORT 2017 235

RESERVE FORCE PENSION PLAN ACCOUNTNotes to the Financial Statements for the years ended March 31, 2017 and 2016
2 SIGNIFICANT ACCOUNTING POLICIES (continued)
2.3. SUMMARY OF SIGNIFICANT ACCOUNTING POLICIES (continued)
2.3.7. Offsetting of Financial Instruments
Financial assets and financial liabilities are offset with the net amount reported in the Statements of Financial Position only if PSP Investments has a current legally enforceable right to offset the recognized amounts and the intent to settle on a net basis, or to realize the assets and settle the liabilities simultaneously.
2.3.8. Equity
The statutory rights of the Government of Canada pursuant to the Superannuation Acts are described under Note 1 and are classified as equity instruments on the following basis:
· Under such rights the Government of Canada is entitled to PSP Investments’ net assets at any time for the purposes set out in the Superannuation Acts. Such rights do not contain any additional obligations for PSP Investments to deliver amounts to the Government of Canada.
· Such rights are the most subordinate claim on PSP Investments’ net assets.
· The total expected cash flows attributable to such rights, at any time, is solely based on the fair value of the net assets of PSP Investments at that time. Further, the fair value of the net assets of PSP Investments in its entirety represents the amounts that the Government of Canada may call upon at any time.
2.3.9. Investment Income
Investment income is made up of interest, dividends, gains (losses) on the disposal of financial assets and financial liabilities as well as gains (losses) which reflect the change in unrealized appreciation (depreciation) of financial assets held and financial liabilities outstanding at the end of the reporting period. Interest is recognized, on a consistent basis, using the prescribed rates until maturity. Dividends are recognized when the right to receive them has been obtained, generally on the ex-dividend date.
2.3.10. Investment-Related Expenses
Investment-related expenses are made up of interest expense, as described in Note 4.1.7, transaction costs, external investment management fees and other (net).
Transaction costs are incremental costs directly attributable to the acquisition, due diligence, issue, or disposal of a financial asset or financial liability, and they are expensed as incurred.
External investment management fees are directly attributable to the external management of assets on behalf of PSP Investments. These fees are paid directly by PSP Investments and comprise base fees accrued as a percentage of the fair value of the assets managed externally and performance fees accrued as a function of various performance indicators. This excludes amounts not paid directly by PSP Investments for certain pooled fund investments classified under alternative investments and for investments in private markets and other fixed income securities as outlined in Note 10.
2.3.11. Fund Transfers
Amounts are received from the Government of Canada for the Fund and are recorded in the Plan Account.
2.4. SIGNIFICANT ACCOUNTING JUDGMENTS, ESTIMATES AND ASSUMPTIONS
In preparing the Financial Statements, management makes certain judgments, estimates and assumptions that can affect the amounts reported therein. Significant judgments include those related to the determination of the investment entity status as described in Note 2.2.
Management also makes estimates and assumptions in the measurement, risk assessment and related disclosures surrounding investments in private markets and certain fixed income securities. The main assumptions made by management regarding measurement of financial instruments are outlined in Note 4.2.3 and those regarding the assessment of risk are outlined in Note 7.
Although estimates and assumptions reflect management’s best judgment, actual results may differ from such estimates due to the uncertainties involved in using them.
ANNUAL REPORT 2017 | PUBLIC SECTOR PENSION INVESTMENT BOARD236
RESERVE FORCE PENSION PLAN ACCOUNTNotes to the Financial Statements for the years ended March 31, 2017 and 2016
3 CURRENT AND FUTURE CHANGES IN ACCOUNTING STANDARDS
3.1. ACCOUNTING STANDARDS ADOPTED IN THE CURRENT YEAR
IFRS 11 Joint Arrangements
IFRS 11 was amended, effective for annual periods beginning on or after January 1, 2016, to add new guidance on the accounting for acquisitions of interests in a joint operation that constitutes a business. Acquirers of such interests shall apply all of the principles in business combinations accounting in IFRS 3 Business Combinations, and other IFRS, that do not conflict with the guidance in IFRS 11 and disclose the information that is required in those IFRS in relation to business combinations. On April 1, 2016, PSP Investments adopted this amendment with no impact on the presentation of the Financial Statements.
3.2. ACCOUNTING STANDARDS ADOPTED BEFORE THE EFFECTIVE DATE
IFRS 9 Financial Instruments
In 2014, the IASB completed its project to replace IAS 39 Financial Instruments: Recognition and Measurement with IFRS 9. The Standard includes requirements for recognition, derecognition, classification and measurement of financial assets and liabilities. IFRS 9 is effective for annual periods beginning on or after January 1, 2018 with early application permitted.
PSP Investments initially adopted IFRS 9 (2014) in its Consolidated Financial Statements for the year ended March 31, 2016. Significant accounting policies in connection with IFRS 9 are described under Note 2.3.1.
3.3. FUTURE ACCOUNTING STANDARDS
A number of new standards, amendments and interpretations have been issued by the IASB, but are not yet effective. The following relates to one or more of PSP Investments’ significant accounting policies or disclosures:
IAS 7 Statement of Cash Flows
IAS 7 was amended, effective for annual periods beginning on or after January 1, 2017, to add new guidance on disclosures that enable users of financial statements to evaluate changes in liabilities arising from financing activities, including both changes arising from cash flows and non-cash changes. PSP Investments will apply the amendments starting from April 1, 2017 and will make the required note disclosures in the Financial Statements.
IAS 28 Investment in Associates and Joint Ventures
IAS 28 was amended, effective for annual periods beginning on or after January 1, 2018, to add a clarification that serves to elaborate and clarify that the election to measure investees at fair value is available on an investment by investment basis and is not an election that must be applied consistently to the measurement of all associates and joint ventures. Management has determined that the amendment will not have an impact on the Financial Statements.
PUBLIC SECTOR PENSION INVESTMENT BOARD | ANNUAL REPORT 2017 237
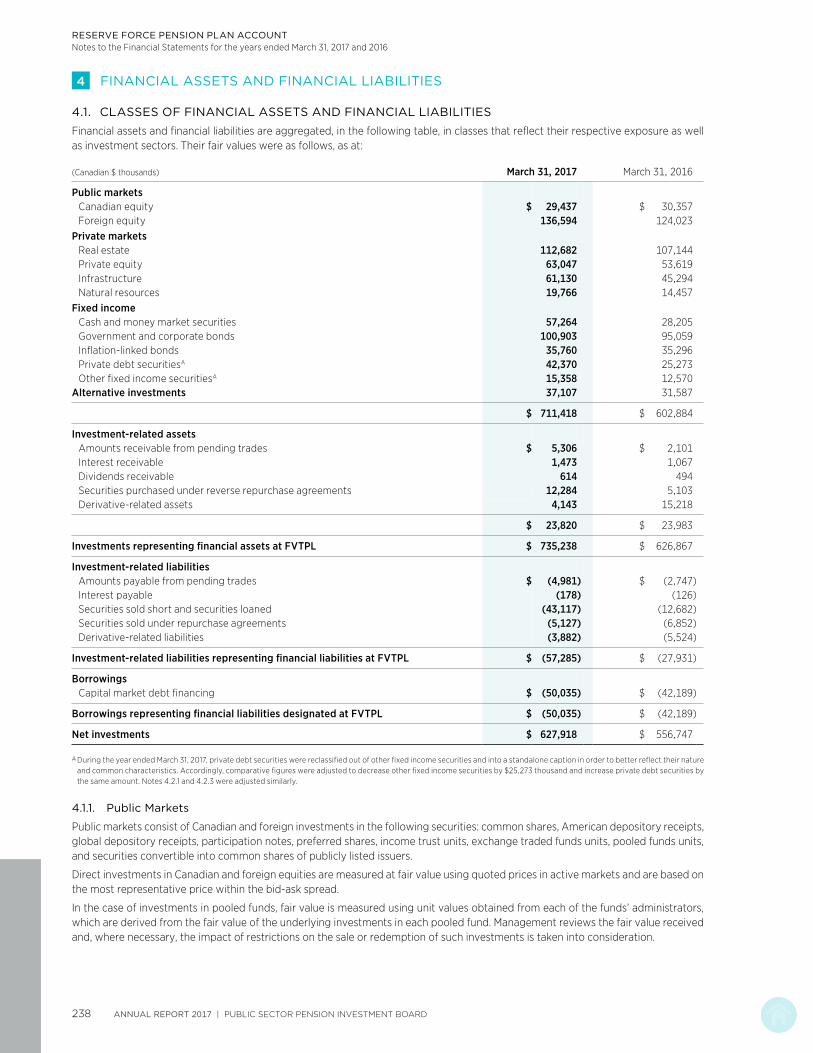
RESERVE FORCE PENSION PLAN ACCOUNTNotes to the Financial Statements for the years ended March 31, 2017 and 2016
4 FINANCIAL ASSETS AND FINANCIAL LIABILITIES
4.1. CLASSES OF FINANCIAL ASSETS AND FINANCIAL LIABILITIES
Financial assets and financial liabilities are aggregated, in the following table, in classes that reflect their respective exposure as well as investment sectors. Their fair values were as follows, as at:
(Canadian $ thousands) March 31, 2017 March 31, 2016
Public marketsCanadian equity $ 29,437 $ 30,357Foreign equity 136,594 124,023
Private marketsReal estate 112,682 107,144Private equity 63,047 53,619Infrastructure 61,130 45,294Natural resources 19,766 14,457
Fixed incomeCash and money market securities 57,264 28,205Government and corporate bonds 100,903 95,059Inflation-linked bonds 35,760 35,296Private debt securitiesA 42,370 25,273Other fixed income securitiesA 15,358 12,570
Alternative investments 37,107 31,587
$ 711,418 $ 602,884
Investment-related assetsAmounts receivable from pending trades $ 5,306 $ 2,101Interest receivable 1,473 1,067Dividends receivable 614 494Securities purchased under reverse repurchase agreements 12,284 5,103Derivative-related assets 4,143 15,218
$ 23,820 $ 23,983
Investments representing financial assets at FVTPL $ 735,238 $ 626,867
Investment-related liabilitiesAmounts payable from pending trades $ (4,981) $ (2,747)Interest payable (178) (126)Securities sold short and securities loaned (43,117) (12,682)Securities sold under repurchase agreements (5,127) (6,852)Derivative-related liabilities (3,882) (5,524)
Investment-related liabilities representing financial liabilities at FVTPL $ (57,285) $ (27,931)
BorrowingsCapital market debt financing $ (50,035) $ (42,189)
Borrowings representing financial liabilities designated at FVTPL $ (50,035) $ (42,189)
Net investments $ 627,918 $ 556,747
A During the year ended March 31, 2017, private debt securities were reclassified out of other fixed income securities and into a standalone caption in order to better reflect their nature and common characteristics. Accordingly, comparative figures were adjusted to decrease other fixed income securities by $25,273 thousand and increase private debt securities by the same amount. Notes 4.2.1 and 4.2.3 were adjusted similarly.
4.1.1. Public Markets
Public markets consist of Canadian and foreign investments in the following securities: common shares, American depository receipts, global depository receipts, participation notes, preferred shares, income trust units, exchange traded funds units, pooled funds units, and securities convertible into common shares of publicly listed issuers.
Direct investments in Canadian and foreign equities are measured at fair value using quoted prices in active markets and are based on the most representative price within the bid-ask spread.
In the case of investments in pooled funds, fair value is measured using unit values obtained from each of the funds’ administrators, which are derived from the fair value of the underlying investments in each pooled fund. Management reviews the fair value received and, where necessary, the impact of restrictions on the sale or redemption of such investments is taken into consideration.
ANNUAL REPORT 2017 | PUBLIC SECTOR PENSION INVESTMENT BOARD238

RESERVE FORCE PENSION PLAN ACCOUNTNotes to the Financial Statements for the years ended March 31, 2017 and 2016
4 FINANCIAL ASSETS AND FINANCIAL LIABILITIES (continued)
4.1. CLASSES OF FINANCIAL ASSETS AND FINANCIAL LIABILITIES (continued)
4.1.2. Private Markets
Private markets consist of investments in real estate, private equity, infrastructure and natural resources.
Real estate investments are comprised of direct equity positions in various private entities, fund investments, as well as properties in the real estate sector. Real estate investments focus on partnerships, companies and properties operating mainly in the retirement and residential, office, retail, and industrial sectors, as well as private funds invested in real estate assets. Real estate investments are presented net of all third-party financing. As at March 31, 2017, leverage in the form of third-party financing undertaken by investment entity subsidiaries and direct real estate investments controlled by PSP Investments was $32,211 thousand for the Plan Account (March 31, 2016 – $29,962 thousand).
Private equity investments are comprised of fund investments with similar objectives, co-investments in private entities as well as direct equity positions.
Infrastructure investments are comprised of direct equity positions, fund investments and co-investments in various private entities. Infrastructure investments focus on entities engaged in the management, ownership or operation of assets in energy, transportation and other regulated businesses. Infrastructure investments are presented net of all third-party financing. As at March 31, 2017, leverage in the form of third-party financing undertaken by direct infrastructure investments controlled by PSP Investments was $18,271 thousand for the Plan Account (March 31, 2016 – $7,596 thousand).
Natural resources investments are comprised of direct equity positions, fund investments and partnerships. Natural resources investments focus on entities engaged in the management, ownership or operation of assets in timberlands, agriculture and upstream oil and gas.
The process for fair value measurement of private markets investments is described in Note 4.2.2 and the valuation techniques together with the significant inputs used are described in Note 4.2.3.
4.1.3. Fixed Income
Fixed income consists of cash and money market securities, government and corporate bonds, inflation-linked bonds, private debt securities and other fixed income securities.
Cash and money market securities include instruments having a maximum term to maturity of one year, such as treasury bills, certificates of deposit and bankers’ acceptances. A portion of such instruments has maturities of 90 days or less and is held to meet short-term financial commitments. Such instruments are readily convertible into known amounts of cash and have an insignificant risk of change in value. They are considered cash and cash equivalents for purposes of the Statements of Cash Flows and amounted to $17,616 thousand as at March 31, 2017 (March 31, 2016 – $6,572 thousand). Treasury bills are valued based on prices obtained from third-party pricing sources. Such prices are determined using the most representative price within a spread of dealer quotations. Certificates of deposit and bankers’ acceptances are recorded at cost plus accrued interest, which approximates their fair value given their short-term nature.
Government and corporate bonds include Canadian and foreign, federal, provincial, territorial and municipal bonds. Inflation-linked bonds are fixed income securities that earn inflation-adjusted returns.
Private debt securities are fixed income securities of private companies held directly or through private funds. Such debt securities take the form of senior debt, mezzanine and distressed debt and primary and secondary investments in leveraged loans. Private debt securities also include third-party loans such as junior and senior debts, construction loans, bridge loans, income-participating loans, as well as other structured finance products in the real estate sector.
Other fixed income securities consist of asset-backed securities and floating rate notes.
Fair values of government and most corporate bonds, inflation-linked bonds, floating rate notes and mortgage-backed securities are based on prices obtained from third-party pricing sources. Such prices are determined using either an appropriate interest rate curve with a spread associated with the credit quality of the issuer or other generally accepted pricing methodologies.
Asset-backed securities consist mainly of asset-backed term notes (ABTNs) and mortgage-backed securities. The ABTNs were received in exchange for third-party or non-bank sponsored asset-backed commercial paper (ABCP) that suffered a liquidity disruption in mid-August 2007 and were subsequently restructured in January 2009.
The fair values of certain corporate bonds, private debt securities and ABTNs are determined using valuation techniques. Such techniques, together with the significant inputs used, are described in Note 4.2.3.
The fair value measurement of fund investments included as part of private debt securities is described in Note 4.2.2.
PUBLIC SECTOR PENSION INVESTMENT BOARD | ANNUAL REPORT 2017 239
RESERVE FORCE PENSION PLAN ACCOUNTNotes to the Financial Statements for the years ended March 31, 2017 and 2016
4 FINANCIAL ASSETS AND FINANCIAL LIABILITIES (continued)
4.1. CLASSES OF FINANCIAL ASSETS AND FINANCIAL LIABILITIES (continued)
4.1.4. Alternative Investments
Alternative investments consist mainly of units of funds that hold a mix of equity, fixed income and derivative instruments as well as hedge funds. The fair value of these investments is determined based on the fair values reported by the funds’ administrators or general partners and reflects the fair value of the underlying equity, fixed income or derivative instruments, as applicable. Management reviews the fair value received and, where necessary, the impact of restrictions on the sale or redemption of such investments is taken into consideration.
4.1.5. Amounts Receivable and Payable from Pending Trades
Amounts receivable from pending trades consist of proceeds on sales of investments, excluding derivative financial instruments, which have been traded but remain unsettled at the end of the reporting period.
Amounts payable from pending trades consist of the cost of purchases of investments, excluding derivative financial instruments, which have been traded but remain unsettled at the end of the reporting period.
The fair value of amounts receivable and payable from pending trades reflects the value at which their underlying original sale or purchase transactions were undertaken.
4.1.6. Interest and Dividends Receivable
Interest and dividends are recorded at the amounts expected to be received at the end of the reporting period, which approximates fair value.
4.1.7. Interest Payable
With respect to the borrowings described in Note 4.1.10, interest is accrued at the amount expected to be paid at the end of the reporting period, which approximates fair value.
4.1.8. Securities Sold Short and Securities Loaned
Securities sold short reflect PSP Investments’ obligation to purchase securities pursuant to short selling transactions. In such transactions, PSP Investments sells securities it does not own with an obligation to purchase similar securities on the market to cover its position.
Using quoted market prices that are based on the most representative price within the bid-ask spread, the fair value of securities sold short is measured using the same method as the similar long positions presented within public markets and fixed income.
As part of securities lending and certain OTC derivative transactions, cash collateral is received and reinvested by PSP Investments. PSP Investments recognizes cash collateral received with a corresponding payable. The payable balance reflects the obligation of the transferee to return cash collateral to the transferor at the end of the transaction in the absence of an event of default by the transferor.
4.1.9. Securities Sold under Repurchase Agreements and Purchased under Reverse Repurchase Agreements
As described in Note 2.3.6, PSP Investments is party to repurchase and reverse repurchase agreements. Obligations to repurchase or resell the securities sold or purchased under such agreements are recorded at cost plus accrued interest, which approximates fair value.
4.1.10. Borrowings under the Capital Market Debt Program
PSP Investments’ capital market debt program is described in Note 8.2. Short-term promissory notes are recorded at cost plus accrued interest, which approximates fair value. The fair value of PSP Investments’ medium-term notes is based on prices that are obtained from third-party pricing sources. Such prices are determined using an interest rate curve with a spread consistent with PSP Investments’ credit quality.
ANNUAL REPORT 2017 | PUBLIC SECTOR PENSION INVESTMENT BOARD240
RESERVE FORCE PENSION PLAN ACCOUNTNotes to the Financial Statements for the years ended March 31, 2017 and 2016
4 FINANCIAL ASSETS AND FINANCIAL LIABILITIES (continued)
4.1. CLASSES OF FINANCIAL ASSETS AND FINANCIAL LIABILITIES (continued)
4.1.11. Derivative-Related Assets and Liabilities
Derivative financial instruments are financial contracts that are settled at a future date. The value of such instruments is derived from changes in the value of the underlying assets, interest or exchange rates. Derivative financial instruments do not, typically, require an initial net investment. In certain cases, they require an initial net investment that is less than what would be required to hold the underlying position directly. Derivative financial instruments can be listed or traded OTC. OTC instruments consist of those that are bilaterally negotiated and settled, and those that are cleared (OTC-cleared) by a central clearing party (CCP).
PSP Investments uses derivative financial instruments to enhance returns or to replicate investments synthetically. Derivatives are also used to reduce the risk associated with existing investments.
PSP Investments uses the following types of derivative financial instruments:
Swaps
Swaps are transactions whereby two counterparties exchange cash flow streams with each other based on predetermined conditions that include a notional amount and a term. Swaps are used to increase returns or to adjust exposures of certain assets without directly purchasing or selling the underlying assets.
Futures
Futures are standardized contracts to take or make delivery of an asset (buy or sell) at a predefined price and predefined future date. Futures are used to adjust exposures to specified assets without directly purchasing or selling the underlying assets.
Forwards
Forwards are contracts involving the sale by one party and the purchase by another party of a predefined amount of an underlying instrument, at a predefined price and at a predefined date in the future. Forwards are used to adjust exposures to specified assets without directly purchasing or selling the underlying assets.
Options
Options are contracts where the seller gives the purchaser the right, but not the obligation, to buy or sell a given amount of an underlying security, index, or commodity, at an agreed-upon price stipulated in advance, either at a determined date or at any time before the predefined maturity date.
Warrants and Rights
Warrants are options to purchase an underlying asset which is in the form of a transferable security and which can be listed on an exchange.
Rights are securities giving shareholders entitlement to purchase new shares issued by a corporation at a predetermined price (normally less than the current market price) in proportion to the number of shares already owned. Rights are issued only for a short period of time, after which they expire.
Determination of Fair Value of Derivative Financial Instruments
Listed derivative financial instruments are recorded at fair value using quoted market prices that are based on the most representative price within the bid-ask spread. OTC-cleared derivatives are recorded at fair value using prices obtained from the CCP. OTC derivatives are valued using appropriate valuation techniques such as discounted cash flows. These techniques use significant inputs that are observable in the market such as current market yields.
Notional Values and Fair Values of Derivative-Related Assets and Liabilities
Notional values of derivative financial instruments are not recorded as assets or liabilities as they represent the face amount of the contract. Except for credit derivatives, notional values do not represent the potential gain or loss associated with the market or credit risk of such transactions disclosed below. Rather, they serve as the basis upon which the cash flows and the fair value of the contracts are determined.
PUBLIC SECTOR PENSION INVESTMENT BOARD | ANNUAL REPORT 2017 241

RESERVE FORCE PENSION PLAN ACCOUNTNotes to the Financial Statements for the years ended March 31, 2017 and 2016
4 FINANCIAL ASSETS AND FINANCIAL LIABILITIES (continued)
4.1. CLASSES OF FINANCIAL ASSETS AND FINANCIAL LIABILITIES (continued)
4.1.11. Derivative-Related Assets and Liabilities (continued)
The following table summarizes the derivatives portfolio as at:
March 31, 2017 March 31, 2016
(Canadian $ thousands) Notional Value
Fair Value
Notional Value
Fair Value
Assets Liabilities Assets Liabilities
Equity and commodity derivativesListed
Futures $ 6,500 $ – $ – $ 3,193 $ – $ –Warrants and rights 15 36 – 13 18 –Options: Purchased 17,921 145 – 7,179 94 –
Written 15,017 – (127) 6,659 – (108)OTC
Total return swaps 133,951 1,172 (500) 99,528 4,512 (159)Variance swaps 18 19 (23) – – –Options: Purchased 8,833 226 – 27,749 314 –
Written 8,595 – (207) 28,009 – (257)Currency derivatives
ListedFutures 635 – – 835 – –
OTCForwards 130,338 459 (1,405) 207,353 8,074 (1,114)Swaps 21,254 76 (202) 15,496 89 (1,508)Options: Purchased 44,448 413 – 41,865 492 –
Written 45,158 – (320) 51,214 – (415)Interest rate derivatives
ListedFutures 36,755 – – 35,621 – –Options: Purchased 159,257 27 – 11,304 3 –
Written 175,745 – (13) 97,572 – (11)OTC
Bond forwards – – – 1,556 5 –Interest rate swaps 57,526 728 (440) 53,533 773 (942)Inflation swaps – – – 2,586 17 (27)Swaptions 130,215 662 (425) 138,760 725 (720)Options: Purchased 105,736 162 – 40,333 46 –
Written 146,482 – (138) 60,198 – (57)OTC-cleared
Interest rate swaps 181,025 – – 37,889 – –Inflation swaps 289 – – – – –
Credit derivativesA
OTCCredit default swaps: Purchased 5,029 – (82) 8,551 42 (111)
Sold 1,374 18 – 2,451 14 (95)OTC-cleared
Credit default swaps: Purchased 3,846 – – 2,992 – –Sold 5,494 – – 6,870 – –
Total $ 4,143 $ (3,882) $ 15,218 $ (5,524)
A PSP Investments, through sold credit derivatives, indirectly guarantees the underlying reference obligations. The maximum potential exposure is the notional amount of the sold credit derivatives as shown in the table above.
ANNUAL REPORT 2017 | PUBLIC SECTOR PENSION INVESTMENT BOARD242

RESERVE FORCE PENSION PLAN ACCOUNTNotes to the Financial Statements for the years ended March 31, 2017 and 2016
4 FINANCIAL ASSETS AND FINANCIAL LIABILITIES (continued)
4.1. CLASSES OF FINANCIAL ASSETS AND FINANCIAL LIABILITIES (continued)
4.1.11. Derivative-Related Assets and Liabilities (continued)
Total derivative-related assets and liabilities are comprised of:
March 31, 2017 March 31, 2016
(Canadian $ thousands) Notional Value
Fair Value
Notional Value
Fair Value
Assets Liabilities Assets Liabilities
Listed derivatives $ 411,845 $ 208 $ (140) $ 162,376 $ 115 $ (119)OTC derivatives 838,957 3,935 (3,742) 779,182 15,103 (5,405)OTC-cleared derivatives 190,654 – – 47,751 – –
Total $ 4,143 $ (3,882) $ 15,218 $ (5,524)
The term to maturity based on notional value for the derivatives was as follows as at March 31:
(Canadian $ thousands) 2017 2016
Less than 3 months $ 512,228 $ 457,3083 to 12 months 478,776 267,966Over 1 year 450,452 264,035
4.2. FAIR VALUE HIERARCHY
4.2.1. Classification
Financial assets and financial liabilities described under Note 4.1 are classified within the fair value hierarchy, described as follows, based on the lowest level of input that is significant to the fair value measurement as a whole.
· Level 1 inputs are quoted prices (unadjusted) in active markets for identical assets or liabilities that PSP Investments can access at the end of the reporting period.
· Level 2 inputs are inputs other than quoted prices included within Level 1 that are observable for the asset or the liability, either directly or indirectly. Level 2 inputs include:
(i) Quoted prices for similar assets or liabilities in active markets.
(ii) Quoted prices for identical or similar assets or liabilities in markets that are not active.
(iii) Inputs other than quoted prices that are observable for the asset or liability.
(iv) Market-corroborated inputs.
· Level 3 inputs are unobservable inputs for the asset or liability that are used within model-based techniques. They reflect management’s assessment of the assumptions that market participants would use in pricing the assets or liabilities.
The classification within the levels of the hierarchy is established at the time of the initial determination of fair value of the asset or liability and reviewed at the end of each reporting period. PSP Investments determines whether a transfer between levels has occurred and recognizes such transfer at the beginning of the reporting period.
PUBLIC SECTOR PENSION INVESTMENT BOARD | ANNUAL REPORT 2017 243
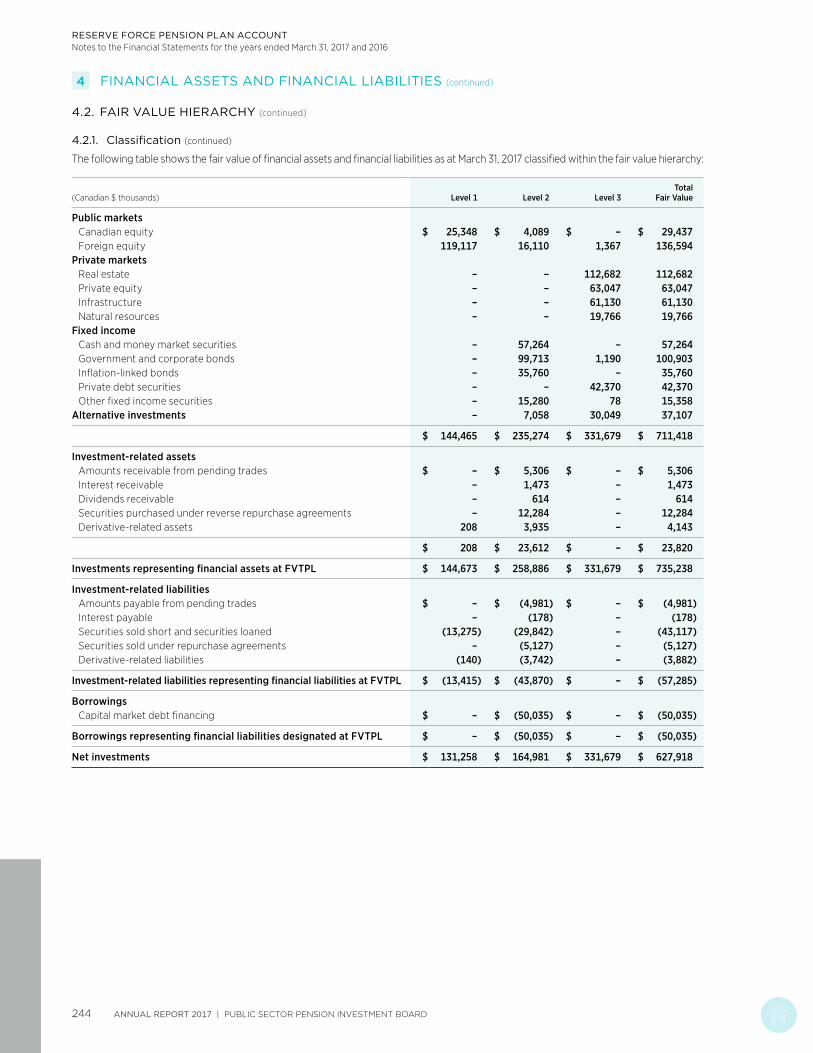
RESERVE FORCE PENSION PLAN ACCOUNTNotes to the Financial Statements for the years ended March 31, 2017 and 2016
4 FINANCIAL ASSETS AND FINANCIAL LIABILITIES (continued)
4.2. FAIR VALUE HIERARCHY (continued)
4.2.1. Classification (continued)
The following table shows the fair value of financial assets and financial liabilities as at March 31, 2017 classified within the fair value hierarchy:
(Canadian $ thousands) Level 1 Level 2 Level 3Total
Fair Value
Public marketsCanadian equity $ 25,348 $ 4,089 $ – $ 29,437Foreign equity 119,117 16,110 1,367 136,594
Private marketsReal estate – – 112,682 112,682Private equity – – 63,047 63,047Infrastructure – – 61,130 61,130Natural resources – – 19,766 19,766
Fixed incomeCash and money market securities – 57,264 – 57,264Government and corporate bonds – 99,713 1,190 100,903Inflation-linked bonds – 35,760 – 35,760Private debt securities – – 42,370 42,370Other fixed income securities – 15,280 78 15,358
Alternative investments – 7,058 30,049 37,107
$ 144,465 $ 235,274 $ 331,679 $ 711,418
Investment-related assetsAmounts receivable from pending trades $ – $ 5,306 $ – $ 5,306Interest receivable – 1,473 – 1,473Dividends receivable – 614 – 614Securities purchased under reverse repurchase agreements – 12,284 – 12,284Derivative-related assets 208 3,935 – 4,143
$ 208 $ 23,612 $ – $ 23,820
Investments representing financial assets at FVTPL $ 144,673 $ 258,886 $ 331,679 $ 735,238
Investment-related liabilitiesAmounts payable from pending trades $ – $ (4,981) $ – $ (4,981)Interest payable – (178) – (178)Securities sold short and securities loaned (13,275) (29,842) – (43,117)Securities sold under repurchase agreements – (5,127) – (5,127)Derivative-related liabilities (140) (3,742) – (3,882)
Investment-related liabilities representing financial liabilities at FVTPL $ (13,415) $ (43,870) $ – $ (57,285)
BorrowingsCapital market debt financing $ – $ (50,035) $ – $ (50,035)
Borrowings representing financial liabilities designated at FVTPL $ – $ (50,035) $ – $ (50,035)
Net investments $ 131,258 $ 164,981 $ 331,679 $ 627,918
ANNUAL REPORT 2017 | PUBLIC SECTOR PENSION INVESTMENT BOARD244

RESERVE FORCE PENSION PLAN ACCOUNTNotes to the Financial Statements for the years ended March 31, 2017 and 2016
4 FINANCIAL ASSETS AND FINANCIAL LIABILITIES (continued)
4.2. FAIR VALUE HIERARCHY (continued)
4.2.1. Classification (continued)
The following table shows the fair value of financial assets and financial liabilities as at March 31, 2016 classified within the fair value hierarchy:
(Canadian $ thousands) Level 1 Level 2 Level 3Total
Fair Value
Public marketsCanadian equity $ 26,904 $ 3,453 $ – $ 30,357Foreign equity 102,414 21,609 – 124,023
Private marketsReal estate – – 107,144 107,144Private equity – – 53,619 53,619Infrastructure – – 45,294 45,294Natural resources – – 14,457 14,457
Fixed incomeCash and money market securities – 28,205 – 28,205Government and corporate bonds – 93,713 1,346 95,059Inflation-linked bonds – 35,296 – 35,296Private debt securities – – 25,273 25,273Other fixed income securities – 9,223 3,347 12,570
Alternative investments – 5,856 25,731 31,587
$ 129,318 $ 197,355 $ 276,211 $ 602,884
Investment-related assetsAmounts receivable from pending trades $ – $ 2,101 $ – $ 2,101Interest receivable – 1,067 – 1,067Dividends receivable – 494 – 494Securities purchased under reverse repurchase agreements – 5,103 – 5,103Derivative-related assets 115 15,103 – 15,218
$ 115 $ 23,868 $ – $ 23,983
Investments representing financial assets at FVTPL $ 129,433 $ 221,223 $ 276,211 $ 626,867
Investment-related liabilitiesAmounts payable from pending trades $ – $ (2,747) $ – $ (2,747)Interest payable – (126) – (126)Securities sold short (10,521) (2,161) – (12,682)Securities sold under repurchase agreements – (6,852) – (6,852)Derivative-related liabilities (119) (5,405) – (5,524)
Investment-related liabilities representing financial liabilities at FVTPL $ (10,640) $ (17,291) $ – $ (27,931)
BorrowingsCapital market debt financing $ – $ (42,189) $ – $ (42,189)
Borrowings representing financial liabilities designated at FVTPL $ – $ (42,189) $ – $ (42,189)
Net investments $ 118,793 $ 161,743 $ 276,211 $ 556,747
PUBLIC SECTOR PENSION INVESTMENT BOARD | ANNUAL REPORT 2017 245
RESERVE FORCE PENSION PLAN ACCOUNTNotes to the Financial Statements for the years ended March 31, 2017 and 2016
4 FINANCIAL ASSETS AND FINANCIAL LIABILITIES (continued)
4.2. FAIR VALUE HIERARCHY (continued)
4.2.2. Process for Level 3 Fair Value Determination
The valuation process is monitored and governed by an internal valuation committee (“VC”). This committee is responsible for overseeing all aspects of fair value determination. This includes establishing valuation methodologies and procedures for each type of investment and ensuring they are complied with. Valuation methodologies established are based on widely recognized practices that are consistent with professional appraisal standards. Such standards include, among others, the International Private Equity and Venture Capital Valuation Guidelines, the Canadian Uniform Standards of Professional Appraisal Practice and the Uniform Standards of Professional Appraisal Practice in the United States of America.
The fair value of investments classified as Level 3 is determined at least annually. Quarterly, the fair value is reviewed and adjusted, as appropriate, to reflect the impact of any significant market or investment-specific events or circumstances. For each investment, the relevant valuation methodology is applied consistently over time as appropriate in the prevailing circumstances. The appropriateness of significant changes in valuation methodologies is reviewed by the VC.
In cases where the services of third-party appraisers are used, management ensures their independence and that valuation methods used are consistent with professional appraisal standards outlined above. In validating the work performed by appraisers, management ensures that the assumptions used correspond to financial information and forecasts of the underlying investment.
With respect to fund investments classified as Level 3, the annual fair value is generally determined based on audited financial statements received from the fund’s general partner. In certain cases fair value is obtained from information provided by the fund’s administrators and is reviewed by Management to ensure reasonableness and adherence to acceptable industry valuation methods. Where necessary, the impact of restrictions on the sale or redemption of such investments is taken into consideration in determining fair value.
ANNUAL REPORT 2017 | PUBLIC SECTOR PENSION INVESTMENT BOARD246

RESERVE FORCE PENSION PLAN ACCOUNTNotes to the Financial Statements for the years ended March 31, 2017 and 2016
4 FINANCIAL ASSETS AND FINANCIAL LIABILITIES (continued)
4.2. FAIR VALUE HIERARCHY (continued)
4.2.3. Level 3 Significant Inputs
The following table outlines key information with respect to significant inputs related to financial assets and financial liabilities categorized within Level 3 as at March 31, 2017:
Financial Assets and Financial Liabilities
Type of Investment
Fair Value (Canadian $ thousands)
Significant Valuation Techniques
Significant Unobservable Inputs
Range (Weighted Average)
Public marketsForeign equity Direct
investments$ 1,367 Net asset value
method (NAV)AN/A N/A
Private marketsReal estate Direct and
co-investments$ 106,099 Discounted cash
flow (DCF)Discount rateB, C 4.50% – 25.00% (8.06%)
Terminal capitalization rateB, C 4.25% – 10.25% (6.04%)
Direct capitalization Capitalization rateB, D 2.75% – 8.00% (5.69%)
Stabilized occupancy rateD, E 94.00% – 100.00% (97.77%)
Sales comparison approach
Price per square footD, E $2.82 – $1,115.10 ($153.82)
NAVA N/A N/A
Transaction price N/A N/A
Fund investments $ 6,583 NAVA N/A N/A
Other private markets Direct and co-investments
$ 100,187 DCF Discount rateB 5.91% – 12.70% (9.36%)
Market comparables N/A N/A
NAVA N/A N/A
Transaction price N/A N/A
Fund investments $ 43,756 NAVA N/A N/A
Fixed incomeCorporate bonds Convertible bonds $ 1,190 DCF Discount rateB 3.90% – 14.10% (7.50%)
Private debt securities Direct and co-investments
$ 22,503 DCF Discount rateB 4.49% – 12.25% (9.07%)
NAVA N/A N/A
Transaction price N/A N/A
Fund investments $ 19,867 NAVA N/A N/A
Other fixed income Asset-backed term notes
$ 78 Third-party pricingA N/A N/A
Alternative investments
Fund investments $ 30,049 NAVA N/A N/A
Total $ 331,679
A In certain cases, fair value is determined by third parties where valuation information is not available to PSP Investments.
B An increase (decrease) in this unobservable input, taken individually, generally results in a decrease (increase) in fair value.
C An increase (decrease) in the discount rate is generally accompanied by an increase (decrease) of the terminal capitalization rate.
D There is no predictable direct relationship between this input and any other significant unobservable input.
E An increase (decrease) in this unobservable input, taken individually, generally results in an increase (decrease) in fair value.
PUBLIC SECTOR PENSION INVESTMENT BOARD | ANNUAL REPORT 2017 247
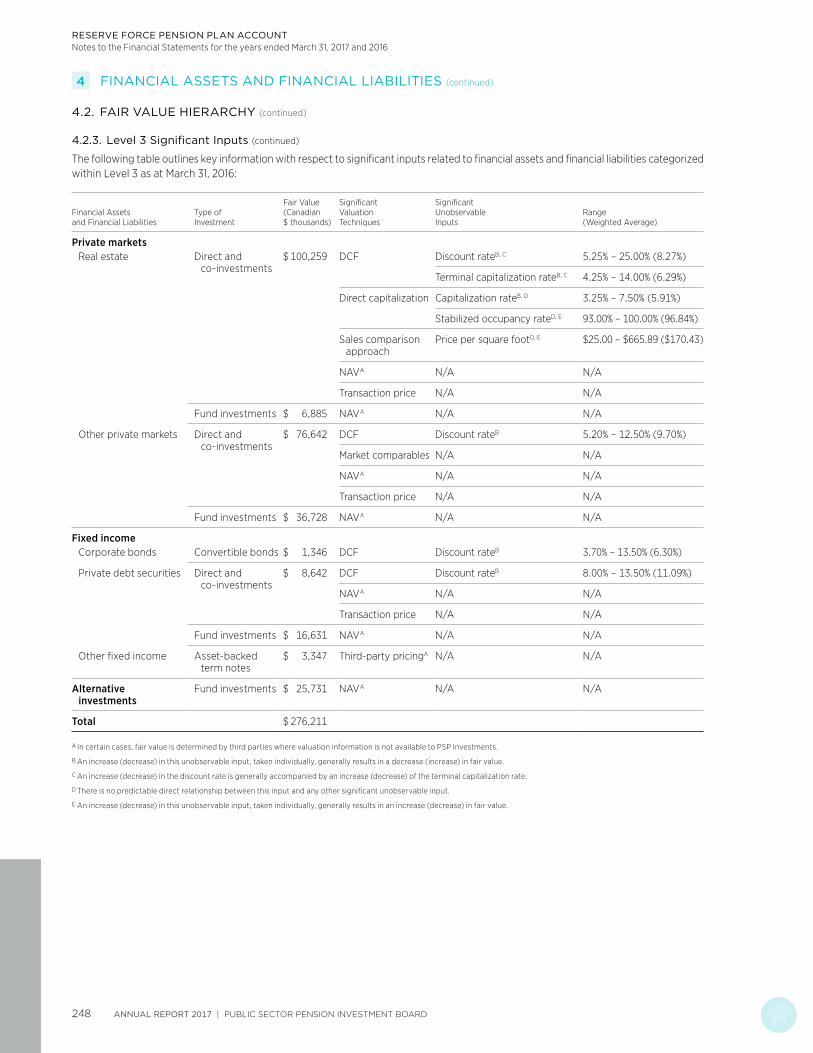
RESERVE FORCE PENSION PLAN ACCOUNTNotes to the Financial Statements for the years ended March 31, 2017 and 2016
4 FINANCIAL ASSETS AND FINANCIAL LIABILITIES (continued)
4.2. FAIR VALUE HIERARCHY (continued)
4.2.3. Level 3 Significant Inputs (continued)
The following table outlines key information with respect to significant inputs related to financial assets and financial liabilities categorized within Level 3 as at March 31, 2016:
Financial Assets and Financial Liabilities
Type of Investment
Fair Value (Canadian $ thousands)
Significant Valuation Techniques
Significant Unobservable Inputs
Range (Weighted Average)
Private marketsReal estate Direct and
co-investments$ 100,259 DCF Discount rateB, C 5.25% – 25.00% (8.27%)
Terminal capitalization rateB, C 4.25% – 14.00% (6.29%)
Direct capitalization Capitalization rateB, D 3.25% – 7.50% (5.91%)
Stabilized occupancy rateD, E 93.00% – 100.00% (96.84%)
Sales comparison approach
Price per square footD, E $25.00 – $665.89 ($170.43)
NAVA N/A N/A
Transaction price N/A N/A
Fund investments $ 6,885 NAVA N/A N/A
Other private markets Direct and co-investments
$ 76,642 DCF Discount rateB 5.20% – 12.50% (9.70%)
Market comparables N/A N/A
NAVA N/A N/A
Transaction price N/A N/A
Fund investments $ 36,728 NAVA N/A N/A
Fixed incomeCorporate bonds Convertible bonds $ 1,346 DCF Discount rateB 3.70% – 13.50% (6.30%)
Private debt securities Direct and co-investments
$ 8,642 DCF Discount rateB 8.00% – 13.50% (11.09%)
NAVA N/A N/A
Transaction price N/A N/A
Fund investments $ 16,631 NAVA N/A N/A
Other fixed income Asset-backed term notes
$ 3,347 Third-party pricingA N/A N/A
Alternative investments
Fund investments $ 25,731 NAVA N/A N/A
Total $ 276,211
A In certain cases, fair value is determined by third parties where valuation information is not available to PSP Investments.
B An increase (decrease) in this unobservable input, taken individually, generally results in a decrease (increase) in fair value.
C An increase (decrease) in the discount rate is generally accompanied by an increase (decrease) of the terminal capitalization rate.
D There is no predictable direct relationship between this input and any other significant unobservable input.
E An increase (decrease) in this unobservable input, taken individually, generally results in an increase (decrease) in fair value.
ANNUAL REPORT 2017 | PUBLIC SECTOR PENSION INVESTMENT BOARD248

RESERVE FORCE PENSION PLAN ACCOUNTNotes to the Financial Statements for the years ended March 31, 2017 and 2016
4 FINANCIAL ASSETS AND FINANCIAL LIABILITIES (continued)
4.2. FAIR VALUE HIERARCHY (continued)
4.2.4. Level 3 Reconciliation
The following table shows a reconciliation of all movements related to financial assets and financial liabilities categorized within Level 3 for the year ended March 31, 2017:
(Canadian $ thousands)OpeningBalance Purchases Sales Settlements
Realized Gains
Unrealized Gains
(Losses)AClosing Balance
Public markets $ – $ 1,224 $ – $ – $ – $ 143 $ 1,367Private markets 220,514 46,188 (12,822) – 3,117 (372) 256,625Fixed income 29,966 24,499 (9,130) (3,163) 1,805 (339) 43,638Alternative investments 25,731 4,293 (2,247) – 246 2,026 30,049
Total $ 276,211 $ 76,204 $ (24,199) $ (3,163) $ 5,168 $ 1,458 $ 331,679
The following table shows a reconciliation of all movements related to financial assets and financial liabilities categorized within Level 3 for the year ended March 31, 2016:
(Canadian $ thousands)Opening Balance Purchases Sales Settlements
Realized Gains
Unrealized Gains
(Losses)AClosing Balance
Private markets $ 183,000 $ 46,164 $ (18,290) $ – $ 4,592 $ 5,048 $ 220,514Fixed income 27,478 10,027 (2,498) (3,402) 2,039 (3,678) 29,966Alternative investments 20,254 7,941 (2,128) – 317 (653) 25,731Derivative-related
assets/liabilities (net) (33) – – (12) 12 33 –
Total $ 230,699 $ 64,132 $ (22,916) $ (3,414) $ 6,960 $ 750 $ 276,211
A Includes Plan Account allocation adjustments.
4.2.5. Level 3 Sensitivity Analysis
In the course of measuring fair value of financial instruments classified as Level 3, valuation techniques used incorporate assumptions that are based on non-observable data. Significant assumptions used for each asset class are described in Note 4.2.3. Although such assumptions reflect management’s best judgment, the use of reasonably possible alternative assumptions could yield different fair value measures representing, at a minimum, a 3% increase and 3% decrease as at March 31, 2017 (March 31, 2016 – 3% increase and 3% decrease) in the fair value of financial instruments categorized as Level 3. This excludes private debt investments in the real estate sector and certain fund investments, where a sensitivity analysis is not possible given the underlying assumptions used are not available to PSP Investments. With respect to private debt investments in the real estate sector, the fair value is obtained from third-party appraisers. Management ensures the appropriateness of the work performed by third-party appraisers as described under Note 4.2.2. In the case of fund investments, the fair value is determined as indicated in Note 4.2.2.
PUBLIC SECTOR PENSION INVESTMENT BOARD | ANNUAL REPORT 2017 249

RESERVE FORCE PENSION PLAN ACCOUNTNotes to the Financial Statements for the years ended March 31, 2017 and 2016
5 COLLATERAL PLEDGED AND RECEIVED
PSP Investments is party to agreements that involve pledging and holding collateral, as outlined in Notes 2.3.5, 2.3.6 and 7.2.1. The following table illustrates the fair values of the Plan Account’s allocated collateral, as well as the securities under the lending and borrowing programs and the securities under the repurchase and reverse repurchase agreements, as at:
(Canadian $ thousands) March 31, 2017 March 31, 2016
Securities lending and borrowingSecurities lent $ 61,305 $ 43,678Collateral heldA 65,297 46,628Securities borrowed 13,342 10,915Collateral pledgedB 13,987 11,466
Securities repurchase and reverse repurchase agreements Securities sold under repurchase agreements 5,139 6,877Collateral pledged 5,134 6,851Securities purchased under reverse repurchase agreements 12,320 5,103Collateral heldC 12,291 5,103
Derivative contracts Collateral pledged 1,429 1,370Collateral heldD 1,056 10,395
A The minimum fair value of cash collateral required is equal to 102% of the fair value of the securities lent, and in the case of securities collateral 105%. As part of collateral held, cash amounted to $23,522 thousand for the Plan Account as at March 31, 2017 (March 31, 2016 – $9,930 thousand) and securities amounted to $41,775 thousand as at March 31, 2017 (March 31, 2016 – $36,698 thousand). All cash collateral is reinvested.
B The minimum fair value of collateral required is equal to 100% of the fair value of the securities borrowed.
C The collateral received is in the form of securities of which $6,273 thousand has been used in connection with short selling transactions as at March 31, 2017 (March 31, 2016 – $2,161 thousand) and $960 thousand has been used in connection with securities sold under repurchase agreements (March 31, 2016 – nil).
D As part of collateral held, cash amounted to $47 thousand as at March 31, 2017 (March 31, 2016 – nil) and securities amounted to $1,009 thousand as at March 31, 2017 (March 31, 2016 – $10,395 thousand). All cash collateral is reinvested.
ANNUAL REPORT 2017 | PUBLIC SECTOR PENSION INVESTMENT BOARD250
RESERVE FORCE PENSION PLAN ACCOUNTNotes to the Financial Statements for the years ended March 31, 2017 and 2016
6 INTERESTS IN OTHER ENTITIES
6.1. SUBSIDIARIES, JOINT VENTURES AND ASSOCIATES
As an investment entity, PSP Investments does not consolidate its subsidiaries other than those that solely provide it with services that relate to its investment activities. PSP Investments measures its investments in its subsidiaries, joint ventures and associates at FVTPL as described in Note 2.1.
For purposes of preparing this note, management assesses control, joint control and significant influence as follows:
(i) Control and significant influence
PSP Investments determines that it has control over an investee when it is exposed, or has rights, to variable returns from its investment in an entity and has the ability to affect those returns through its power over the investee.
In certain cases, PSP Investments does not have control over an investee but has the power to participate in the financial and operating policy decisions of the investee. In such cases, PSP Investments determines that it has significant influence over the investee.
In the context of control or significant influence, power over an investee is obtained through voting rights conveyed by PSP Investments’ ownership interest, other contractual arrangements, or a combination thereof.
(ii) Joint control
PSP Investments determines that it is party to a joint venture arrangement when it has joint control over an investee and has rights to the net assets of the investee. Joint control is established through a contractual arrangement which requires the unanimous consent of the parties sharing control for the activities that significantly affect the returns of the arrangement.
Generally, decision making regarding such activities is governed through voting rights conveyed by the ownership interest of each party. In certain cases, it is governed solely through contractual arrangements or in conjunction with the ownership interest of each party.
In the normal course of business, investments in private markets are commonly held through investment entity subsidiaries formed by PSP Investments. As at March 31, 2017, 103 investment entity subsidiaries were incorporated in North America, 23 in Europe, 10 in Oceania, 4 in Central and South America, 1 in Africa and 1 in Asia (March 31, 2016 – 102 in North America, 19 in Europe, 10 in Oceania, 4 in Central and South America and 1 in Africa).
In addition, PSP Investments controlled 77 investees directly or through its investment entity subsidiaries as at March 31, 2017 (March 31, 2016 – 73 investees).
PUBLIC SECTOR PENSION INVESTMENT BOARD | ANNUAL REPORT 2017 251

RESERVE FORCE PENSION PLAN ACCOUNTNotes to the Financial Statements for the years ended March 31, 2017 and 2016
6 INTERESTS IN OTHER ENTITIES (continued)
6.1. SUBSIDIARIES, JOINT VENTURES AND ASSOCIATES (continued)
The following tables present, in descending order, the most significant investees held directly or indirectly by PSP Investments where it has control, joint control or significant influence.
March 31, 2017
Entity’s NamePrincipal Place
of BusinessOwnership Interest Held
by PSP InvestmentsRelationship to
PSP Investments
Revera Inc. North America 100% Controlled investeeKaingaroa Timberlands Ltd. Oceania 56% Jointly controlled investeeAviAlliance GmbH Europe 100% Controlled investeeRoadis Transportation B.V.A Global 100% Controlled investeeFirstLight Power Resources Holding Inc. North America 100% Controlled investeeRoccapina Fund, L.P. North America 100% Controlled investeeSEGRO European Logistics Partnership S.a.r.l. Europe 50% Jointly controlled investeeTelesat Holdings Inc. North America 35% AssociateTDF S.A.S. Europe 22% AssociateBig Box Properties North America 49% Jointly controlled investee
A Formerly Isolux Infrastructure Netherlands B.V.
March 31, 2016
Entity’s NamePrincipal Place
of BusinessOwnership Interest Held
by PSP InvestmentsRelationship to
PSP Investments
Revera Inc. North America 100% Controlled investeeAviAlliance GmbH Europe 100% Controlled investeeKaingaroa Timberlands Ltd. Oceania 56% Jointly controlled investeeTelesat Holdings Inc. North America 34% AssociateIsolux Infrastructure Netherlands B.V. Central and South America 19% Jointly controlled investeeRoccapina Fund, L.P. North America 100% Controlled investeeSEGRO European Logistics Partnership S.a.r.l. Europe 50% Jointly controlled investeeBig Box Properties North America 49% Jointly controlled investeeAcelity Inc. North America 21% AssociateTDF S.A.S. Europe 22% Associate
In addition to the above, PSP Investments consolidates wholly owned subsidiaries that solely provide it with services that relate to its investment activities. Such services consist of investment management and financing of private market investments within the context of PSP Investments’ capital market debt program described in Note 8.2.
6.2. STRUCTURED ENTITIES
PSP Investments holds interests in partnerships and funds mainly in the context of its investments in private markets. Given their nature, such entities commonly have the characteristics of a structured entity as defined by IFRS. These entities are held as investments and do not expose PSP Investments to additional risks or returns compared to interests held in non-structured entities.
Information regarding structured entities is included, as applicable, within disclosures of investment risk management under Note 7, guarantees and indemnities under Note 15 and commitments under Note 16.
ANNUAL REPORT 2017 | PUBLIC SECTOR PENSION INVESTMENT BOARD252
RESERVE FORCE PENSION PLAN ACCOUNTNotes to the Financial Statements for the years ended March 31, 2017 and 2016
7 INVESTMENT RISK MANAGEMENT
PSP Investments is required to act in the best interests of the contributors and beneficiaries under the Plans and for maximizing returns without undue risk of loss. In pursuit of this objective, PSP Investments established an Enterprise Risk Management Policy (ERM Policy). The ERM Policy provides a framework for identifying, evaluating, managing, mitigating, monitoring and reporting the investment and non-investment risks to which PSP Investments is exposed.
As part of the overall ERM policy, the Investment Risk Management Policy (IRM Policy) supports the management of risk inherent to the investment decision making process. The IRM Policy outlines a framework that is designed to ensure that investment activities respect PSP Investments’ risk philosophy and align with the tolerance and limits of its risk appetite. The IRM Policy also supplements the Statement of Investment Policies, Standards and Procedures (SIP&P), whose objective is to effectively manage investment risks related to the implementation of PSP Investments’ various investment strategies. Investment risks include market, credit and liquidity risks.
7.1. MARKET RISK
Market risk is the risk that the value of an investment will fluctuate as a result of an adverse financial outcome due to changes in the factors that drive that value, such as changes in market prices, changes caused by factors specific to the individual investment, volatility in share and commodity prices, interest rate, foreign exchange or other factors affecting similar securities traded in the market.
7.1.1. Measurement of Market Risk
Effective April 1, 2016, the absolute annualized volatility of the total portfolio was implemented as the primary measure of market risk. The absolute volatility is a statistical measure of the size of changes in investment returns of a given investment or portfolio of investments. It is used to illustrate the potential loss of value in an investment or portfolio of investments as a result of fluctuations in market prices. Prior to April 1, 2016, PSP Investments used the Value at Risk (VaR) as the primary measure of market risk.
PSP Investments uses seven years’ worth of market returns scaled to a twelve-month holding period to calculate the absolute volatility. For investments that are not actively traded, the calculation of the absolute volatility uses securities with similar risk attributes as a proxy.
The absolute volatility is statistically valid under normal market conditions and does not specifically consider losses from severe market events. It also assumes that the future will behave in a pattern similar to the past. Consequently, if future market conditions differ significantly from those of the past, potential losses may differ from those originally estimated.
The following table shows the absolute volatility of the total portfolio expressed as a percentage of net investments as at the end of the period:
March 31, 2017 March 31, 2016
Absolute volatility 7.6% 8.5%A
A Since the absolute volatility was used effective April 1, 2016, the market risk measure as at March 31, 2016 was changed in the above table for comparability purposes. Prior to April 1, 2016, PSP Investments used the VaR as the primary measure of market risk. The total portfolio VaR as at March 31, 2016 was 23.6%.
Stress Testing
Although the absolute volatility is a widely accepted risk measure, it is complemented by other risk measurement methodologies that provide greater insight on market risk. PSP Investments uses stress testing and scenario analysis to examine the impact on financial results of abnormally large movements in risk factors. Such techniques are used to test a portfolio’s sensitivity to various risk factors and key model assumptions. These methods also use historically stressed periods to evaluate how a current portfolio reacts under such circumstances. Stress testing and scenario analysis are also deployed to assess new product performance.
PUBLIC SECTOR PENSION INVESTMENT BOARD | ANNUAL REPORT 2017 253

RESERVE FORCE PENSION PLAN ACCOUNTNotes to the Financial Statements for the years ended March 31, 2017 and 2016
7 INVESTMENT RISK MANAGEMENT (continued)
7.1. MARKET RISK (continued)
7.1.2. Interest Rate Risk
Interest rate risk refers to the risk that fluctuations in interest rates will directly affect the fair value of the Plan Account’s net asset values.
The terms to maturity of the classes of financial instruments, outlined in Note 4.1, with the most significant exposure to interest rate risk were as follows as at:
March 31, 2017
(Canadian $ thousands)Less than
1 Year1 to 5 Years
5 to 10 Years
Over 10 Years Other Total
Cash and money market securities $ – $ – $ – $ – $ 57,264A $ 57,264Government and corporate bonds 11,312 43,657 28,212 17,722 – 100,903Inflation-linked bonds 21 8,392 13,270 14,077 – 35,760Private debt securities 368 4,138 16,448 – 21,416B 42,370Other fixed income securities 78 100 – – 15,180C 15,358
Total fixed income $ 11,779 $ 56,287 $ 57,930 $ 31,799 $ 93,860 $ 251,655
March 31, 2016
(Canadian $ thousands)Less than
1 Year1 to 5 Years
5 to 10 Years
Over 10 Years Other Total
Cash and money market securities $ – $ – $ – $ – $ 28,205A $ 28,205Government and corporate bonds 5,271 46,338 23,773 19,677 – 95,059Inflation-linked bonds 115 7,864 11,752 15,565 – 35,296Private debt securities 23 5,784 1,470 – 17,996B 25,273Other fixed income securities 3,463 956 5 – 8,146C 12,570
Total fixed income $ 8,872 $ 60,942 $ 37,000 $ 35,242 $ 54,347 $ 196,403
A Due to their nature, these investments are not significantly exposed to interest rate risk.
B Information in connection with the terms to maturity of fund and certain directly held investments included as part of private debt securities is not available.
C Certain corporate bonds, asset-backed securities and floating rate notes are not significantly exposed to interest rate risk as their prescribed rates are variable.
The terms to maturity of PSP Investments’ capital market debt financing are disclosed in Note 8.2.
Alternative investments, reverse repurchase agreements, as well as derivative contracts described in Notes 4.1.4, 4.1.9 and 4.1.11, respectively, are also subject to interest rate risk exposures. These exposures are reflected in the absolute volatility calculation described in Note 7.1.1.
ANNUAL REPORT 2017 | PUBLIC SECTOR PENSION INVESTMENT BOARD254

RESERVE FORCE PENSION PLAN ACCOUNTNotes to the Financial Statements for the years ended March 31, 2017 and 2016
7 INVESTMENT RISK MANAGEMENT (continued)
7.1. MARKET RISK (continued)
7.1.3. Foreign Currency Risk
PSP Investments is exposed to currency risk through holding of investments (i.e. direct and indirect holdings of securities, units in pooled funds and units in limited partnerships) or investment-related liabilities in various currencies. Fluctuations in the relative value of the Canadian dollar against these foreign currencies can result in a positive or a negative effect on the fair value of the investments. To mitigate this risk, PSP Investments may take, through foreign forward contracts or cross currency swaps, positions in foreign currencies.
The underlying foreign currency exposures of net investments for the Plan Account were as follows as at:
Currency March 31, 2017 March 31, 2016
(Canadian $ thousands) Fair Value % of Total Fair Value % of Total
US Dollar $ 294,912 70.5% $ 144,548 60.3%Euro 26,283 6.3 17,072 7.1Japanese Yen 15,285 3.6 8,107 3.4British Pound 12,875 3.1 9,799 4.1South Korean Won 11,082 2.6 10,228 4.3Brazilian Real 9,444 2.3 7,412 3.1Indian Rupee 5,713 1.4 4,749 2.0Hong Kong Dollar 5,528 1.3 8,571 3.6Australian Dollar 5,404 1.3 2,968 1.2Taiwanese New Dollar 4,613 1.1 4,332 1.8Swiss Franc 4,307 1.0 4,733 2.0Mexican Peso 3,662 0.9 3,088 1.3Others 19,425 4.6 13,955 5.8
Total $ 418,533 100.0% $ 239,562 100.0%
As at March 31, 2017, PSP Investments and its investment entity subsidiaries also had commitments, denominated in foreign currencies of $93,453 thousand for the Plan Account (US$58,020 thousand, €9,667 thousand, £879 thousand, 102 thousand South African rands, 268 thousand Brazilian reals, 62,746 thousand Colombian pesos, 1,074 thousand Mexican pesos and 582 thousand Australian dollars) which were not included in the foreign currency exposure table above.
As at March 31, 2016, PSP Investments and its investment entity subsidiaries also had commitments, denominated in foreign currencies of $94,373 thousand for the Plan Account (US$66,260 thousand, €4,383 thousand, £973 thousand, 865 thousand South African rands, 395 thousand Brazilian reals, 92,544 thousand Colombian pesos and 1,862 thousand Mexican pesos) which were not included in the foreign currency exposure table above.
PUBLIC SECTOR PENSION INVESTMENT BOARD | ANNUAL REPORT 2017 255
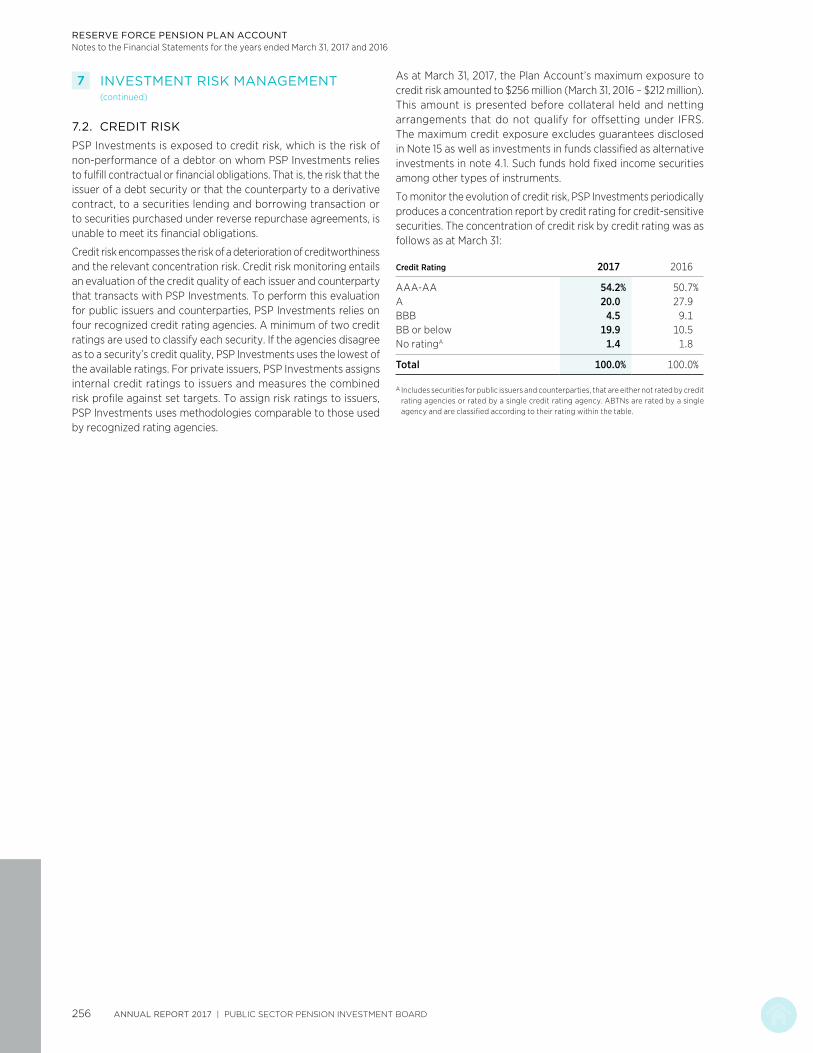
RESERVE FORCE PENSION PLAN ACCOUNTNotes to the Financial Statements for the years ended March 31, 2017 and 2016
7 INVESTMENT RISK MANAGEMENT (continued)
7.2. CREDIT RISK
PSP Investments is exposed to credit risk, which is the risk of non-performance of a debtor on whom PSP Investments relies to fulfill contractual or financial obligations. That is, the risk that the issuer of a debt security or that the counterparty to a derivative contract, to a securities lending and borrowing transaction or to securities purchased under reverse repurchase agreements, is unable to meet its financial obligations.
Credit risk encompasses the risk of a deterioration of creditworthiness and the relevant concentration risk. Credit risk monitoring entails an evaluation of the credit quality of each issuer and counterparty that transacts with PSP Investments. To perform this evaluation for public issuers and counterparties, PSP Investments relies on four recognized credit rating agencies. A minimum of two credit ratings are used to classify each security. If the agencies disagree as to a security’s credit quality, PSP Investments uses the lowest of the available ratings. For private issuers, PSP Investments assigns internal credit ratings to issuers and measures the combined risk profile against set targets. To assign risk ratings to issuers, PSP Investments uses methodologies comparable to those used by recognized rating agencies.
As at March 31, 2017, the Plan Account’s maximum exposure to credit risk amounted to $256 million (March 31, 2016 – $212 million). This amount is presented before collateral held and netting arrangements that do not qualify for offsetting under IFRS. The maximum credit exposure excludes guarantees disclosed in Note 15 as well as investments in funds classified as alternative investments in note 4.1. Such funds hold fixed income securities among other types of instruments.
To monitor the evolution of credit risk, PSP Investments periodically produces a concentration report by credit rating for credit-sensitive securities. The concentration of credit risk by credit rating was as follows as at March 31:
Credit Rating 2017 2016
AAA-AA 54.2% 50.7%A 20.0 27.9BBB 4.5 9.1BB or below 19.9 10.5No ratingA 1.4 1.8
Total 100.0% 100.0%
A Includes securities for public issuers and counterparties, that are either not rated by credit rating agencies or rated by a single credit rating agency. ABTNs are rated by a single agency and are classified according to their rating within the table.
ANNUAL REPORT 2017 | PUBLIC SECTOR PENSION INVESTMENT BOARD256

RESERVE FORCE PENSION PLAN ACCOUNTNotes to the Financial Statements for the years ended March 31, 2017 and 2016
7 INVESTMENT RISK MANAGEMENT (continued)
7.2. CREDIT RISK (continued)
7.2.1. Counterparty Risk
Counterparty risk represents the credit risk from current and potential exposure related to transactions involving derivative contracts, securities lending and borrowing as well as securities repurchase and reverse repurchase agreements. In order to minimize counterparty risk, PSP Investments requires that counterparties provide adequate collateral and meet its credit rating requirements. PSP Investments frequently monitors the credit rating of its counterparties as determined by recognized credit rating agencies. With respect to derivative contracts, PSP Investments has the ability to terminate all trades with most counterparties whose credit rating is downgraded below its requirements.
For OTC derivatives, PSP Investments’ policy also requires the use of the International Swaps and Derivative Association (ISDA) Master Agreement with all counterparties to derivative contracts. The ISDA Master Agreement provides the contractual framework within which dealing activities across a full range of OTC products are conducted. In the case of OTC-cleared derivatives, trading activities are regulated between parties under terms that are customary to such transactions.
As a credit mitigation technique, the ISDA Master Agreement contractually binds counterparties to close-out netting provisions in the case of default by one of the counterparties. Additionally, the Credit Support Annex (CSA) to the ISDA Master Agreement enables PSP Investments to realize any collateral placed with it in the case of default of the counterparty. The CSA also requires PSP Investments to contribute further collateral when requested. All collateral transactions under the CSA are in cash, high-quality debt instruments or securities. The CSA also regulates the exchange of collateral when the credit exposure to a counterparty exceeds a predetermined threshold. Counterparties are generally authorized to sell, repledge or otherwise use collateral held. Similarly, in the case of OTC-cleared derivatives, collateral is required in cash, high quality debt instruments or securities and can be sold, repledged or otherwise used. PSP Investments does not sell, repledge or otherwise use any collateral held in the form of securities but does reinvest all cash collateral, with respect to derivative contracts.
With respect to transactions involving securities lending and borrowing agreements as well as securities repurchase and reverse repurchase agreements, collateral requirements are in place to mitigate counterparty risk. Notes 2.3.5 and 2.3.6 describe collateral requirements in securities lending and borrowing programs as well as securities repurchase and reverse repurchase agreements.
Information in connection with collateral pledged by PSP Investments and its counterparties is disclosed in Note 5.
In the case of the securities lending program, PSP Investments’ exposure to counterparty risk is further mitigated as the custodian of the securities lent assumes the risk that a counterparty will be unable to meet its obligations associated with the collateral requirements.
Management is responsible for counterparty risk monitoring and mitigation as well as maintaining a comprehensive, disciplined, and enterprise-wide process for tracking and managing counterparty risk. As such, management measures counterparty risk on an ongoing basis, evaluates and tracks the creditworthiness of current counterparties and mitigates counterparty risk through collateral management.
PUBLIC SECTOR PENSION INVESTMENT BOARD | ANNUAL REPORT 2017 257

RESERVE FORCE PENSION PLAN ACCOUNTNotes to the Financial Statements for the years ended March 31, 2017 and 2016
7 INVESTMENT RISK MANAGEMENT (continued)
7.2. CREDIT RISK (continued)
7.2.2. Offsetting
PSP Investments is subject to ISDA Master Agreements in relation to its OTC derivative financial instruments as described. Such agreements contain close-out netting provisions applicable only in the case of default. In certain cases, such agreements also allow for offsetting. In cases where the conditions for offsetting were met, financial instruments have been presented net in the Statements of Financial Position. Securities repurchase and reverse repurchase agreements described in Notes 2.3.6 and 5 are subject to similar arrangements though are not offset.
The following tables present the financial assets and liabilities described above:
Financial Assets
(Canadian $ thousands)
Gross Amount of
Recognized Financial
Assets
Less: Gross Amount of
Recognized Financial
Liabilities Set-Off
Net Amount of Financial
Assets Presented in the
Statements of Financial Position
Less: Related Amounts Not Set-Off in the Statements
of Financial Position
Net
Recognized Financial
Liabilities
Collateral Held and Not
Recognized
March 31, 2017Reverse repurchase agreements $ 12,284 $ – $ 12,284A $ 957 $ 11,327 $ –OTC-derivatives 3,964 29 3,935B 2,821 807 307
Total $ 16,248 $ 29 $ 16,219 $ 3,778 $ 12,134 $ 307
March 31, 2016Reverse repurchase agreements $ 5,103 $ – $ 5,103A $ – $ 5,103 $ –OTC-derivatives 15,148 45 15,103B 4,543 10,016 544
Total $ 20,251 $ 45 $ 20,206 $ 4,543 $ 15,119 $ 544
Financial Liabilities
(Canadian $ thousands)
Gross Amount of
Recognized Financial
Liabilities
Less: Gross Amount of
Recognized Financial
Assets Set-Off
Net Amount of Financial
Liabilities Presented in the
Statements ofFinancial Position
Less: Related Amounts Not Set-Off in the Statements
of Financial Position
Net
Recognized Financial
Assets
Collateral Pledged and Not
Derecognized
March 31, 2017Repurchase agreements $ 5,127 $ – $ 5,127A $ 957 $ 4,170 $ –OTC-derivatives 3,771 29 3,742B 2,821 853 68
Total $ 8,898 $ 29 $ 8,869 $ 3,778 $ 5,023 $ 68
March 31, 2016Repurchase agreements $ 6,852 $ – $ 6,852A $ – $ 6,851 $ 1OTC-derivatives 5,450 45 5,405B 4,543 849 13
Total $ 12,302 $ 45 $ 12,257 $ 4,543 $ 7,700 $ 14
A As described in Note 4.1.
B As described in Note 4.1.11.
ANNUAL REPORT 2017 | PUBLIC SECTOR PENSION INVESTMENT BOARD258
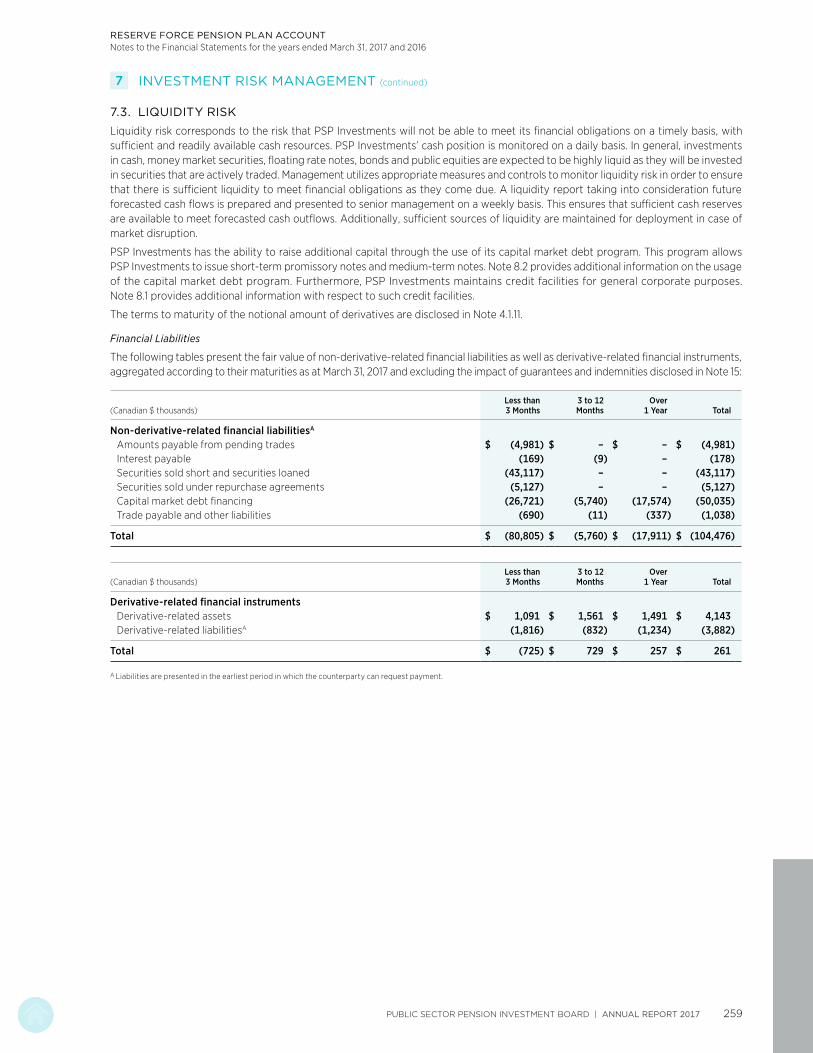
RESERVE FORCE PENSION PLAN ACCOUNTNotes to the Financial Statements for the years ended March 31, 2017 and 2016
7 INVESTMENT RISK MANAGEMENT (continued)
7.3. LIQUIDITY RISK
Liquidity risk corresponds to the risk that PSP Investments will not be able to meet its financial obligations on a timely basis, with sufficient and readily available cash resources. PSP Investments’ cash position is monitored on a daily basis. In general, investments in cash, money market securities, floating rate notes, bonds and public equities are expected to be highly liquid as they will be invested in securities that are actively traded. Management utilizes appropriate measures and controls to monitor liquidity risk in order to ensure that there is sufficient liquidity to meet financial obligations as they come due. A liquidity report taking into consideration future forecasted cash flows is prepared and presented to senior management on a weekly basis. This ensures that sufficient cash reserves are available to meet forecasted cash outflows. Additionally, sufficient sources of liquidity are maintained for deployment in case of market disruption.
PSP Investments has the ability to raise additional capital through the use of its capital market debt program. This program allows PSP Investments to issue short-term promissory notes and medium-term notes. Note 8.2 provides additional information on the usage of the capital market debt program. Furthermore, PSP Investments maintains credit facilities for general corporate purposes. Note 8.1 provides additional information with respect to such credit facilities.
The terms to maturity of the notional amount of derivatives are disclosed in Note 4.1.11.
Financial Liabilities
The following tables present the fair value of non-derivative-related financial liabilities as well as derivative-related financial instruments, aggregated according to their maturities as at March 31, 2017 and excluding the impact of guarantees and indemnities disclosed in Note 15:
(Canadian $ thousands)Less than 3 Months
3 to 12 Months
Over 1 Year Total
Non-derivative-related financial liabilitiesA
Amounts payable from pending trades $ (4,981) $ – $ – $ (4,981)Interest payable (169) (9) – (178)Securities sold short and securities loaned (43,117) – – (43,117)Securities sold under repurchase agreements (5,127) – – (5,127)Capital market debt financing (26,721) (5,740) (17,574) (50,035)Trade payable and other liabilities (690) (11) (337) (1,038)
Total $ (80,805) $ (5,760) $ (17,911) $ (104,476)
(Canadian $ thousands)Less than 3 Months
3 to 12 Months
Over 1 Year Total
Derivative-related financial instrumentsDerivative-related assets $ 1,091 $ 1,561 $ 1,491 $ 4,143Derivative-related liabilitiesA (1,816) (832) (1,234) (3,882)
Total $ (725) $ 729 $ 257 $ 261
A Liabilities are presented in the earliest period in which the counterparty can request payment.
PUBLIC SECTOR PENSION INVESTMENT BOARD | ANNUAL REPORT 2017 259

RESERVE FORCE PENSION PLAN ACCOUNTNotes to the Financial Statements for the years ended March 31, 2017 and 2016
7 INVESTMENT RISK MANAGEMENT (continued)
7.3. LIQUIDITY RISK (continued)
Financial Liabilities (continued)
The following tables present the fair value of non-derivative-related financial liabilities as well as derivative-related financial instruments, aggregated according to their maturities as at March 31, 2016 and excluding the impact of guarantees and indemnities disclosed in Note 15:
(Canadian $ thousands)Less than 3 Months
3 to 12 Months
Over 1 Year Total
Non-derivative-related financial liabilitiesA
Amounts payable from pending trades $ (2,747) $ – $ – $ (2,747)Interest payable (115) (11) – (126)Securities sold short (12,682) – – (12,682)Securities sold under repurchase agreements (6,852) – – (6,852)Capital market debt financing (24,837) (9,611) (7,741) (42,189)Trade payable and other liabilities (544) (10) (276) (830)
Total $ (47,777) $ (9,632) $ (8,017) $ (65,426)
(Canadian $ thousands)Less than 3 Months
3 to 12 Months
Over 1 Year Total
Derivative-related financial instrumentsDerivative-related assets $ 8,873 $ 3,759 $ 2,586 $ 15,218Derivative-related liabilitiesA (1,495) (962) (3,067) (5,524)
Total $ 7,378 $ 2,797 $ (481) $ 9,694
A Liabilities are presented in the earliest period in which the counterparty can request payment.
ANNUAL REPORT 2017 | PUBLIC SECTOR PENSION INVESTMENT BOARD260

RESERVE FORCE PENSION PLAN ACCOUNTNotes to the Financial Statements for the years ended March 31, 2017 and 2016
8 BORROWINGS
8.1. CREDIT FACILITIES
During the year ended March 31, 2017, PSP Investments entered into a revolving credit facility in the amount of $2 billion and a demand line of credit in the amount of $1 billion (together “the Credit Facilities”).
The Credit Facilities are for general corporate purposes and are available in either Canadian or US currencies. Subject to customary terms and conditions, these Credit Facilities are available at variable interest rates such as the prime rate and the US base rate.
These Credit Facilities were not drawn upon as at the end of the reporting period.
8.2. CAPITAL MARKET DEBT FINANCING
PSP Investments’ capital market debt program consists of the private placement of short-term promissory notes as well as medium-term notes issued by PSP Capital Inc., a wholly-owned subsidiary of PSP Investments. The capital raised is primarily used to finance private market investments. It is unconditionally and irrevocably guaranteed by PSP Investments in accordance with its corporate leverage policy.
The maximum amount authorized by the Board of Directors for the capital market debt program is 10% of the net investments plus all recourse debt outstanding of PSP Investments at the time of commitment to issuance. Under this limit, the short-term promissory note component cannot exceed $3 billion for issuances in Canada and US$5 billion for issuances in the United States.
PSP Investments’ capital market debt financing was in compliance with the limits authorized by the Board of Directors during the years ended March 31, 2017 and March 31, 2016.
The following outlines the terms as well as the fair value of the notes issued under the capital market debt program allocated to the Plan Account as at:
March 31, 2017 March 31, 2016
(Canadian $ thousands)
Capital Amounts
Payable at Maturity Fair Value
Capital Amounts
Payable at Maturity Fair Value
Short-term Canadian Dollar promissory notes, bearing interest between 0.57% and 0.78% and maturing within 26 and 273 days of issuance (March 31, 2016 – 56 and 185 days) $ 6,241 $ 6,232 $ 5,801 $ 5,792
Short-term US Dollar promissory notes, bearing interest between 0.68% and 1.16% and maturing within 30 and 266 days of issuance (March 31, 2016 – 63 and 196 days) 26,258 26,229 23,381 23,360
Medium-term notes Series 4, bearing interest of 2.26% per annum and matured on February 16, 2017 – – 4,290 4,343
Medium-term notes Series 5, bearing interest of 3.03% per annum and maturing on October 22, 2020 2,315 2,443 2,383 2,559
Medium-term notes Series 6, bearing variable interest of 3-month CDOR and matured on April 4, 2016 – – 953 953
Medium-term notes Series 7, bearing interest of 3.29% per annum and maturing on April 4, 2024 4,560 4,908 4,767 5,182
Medium-term notes Series 8, bearing interest of 1.34% per annum and maturing on August 18, 2021 5,787 5,725 – –
Medium-term notes Series 9, bearing interest of 2.09% per annum and maturing on November 22, 2023 4,491 4,498 – –
Total $ 49,652 $ 50,035 $ 41,575 $ 42,189
Unrealized losses in connection with borrowings amounted to $1,966 thousand for the year ended March 31, 2017 (unrealized gains of $2,645 thousand for the year ended March 31, 2016).
Interest expense, for the year ended March 31, was as follows:
(Canadian $ thousands) 2017 2016
Short-term promissory notes $ 235 $ 102Medium-term notes 390 407
Total $ 625 $ 509
PUBLIC SECTOR PENSION INVESTMENT BOARD | ANNUAL REPORT 2017 261

RESERVE FORCE PENSION PLAN ACCOUNTNotes to the Financial Statements for the years ended March 31, 2017 and 2016
9 EQUITY
9.1. STATUTORY RIGHTS HELD BY THE GOVERNMENT OF CANADA
Pursuant to the Superannuation Acts, the Government of Canada is entitled to PSP Investments’ net assets allocated to each of the Plan Accounts for the purposes set out in the Superannuation Acts. The allocation of PSP Investments’ net assets and comprehensive income (loss) to each of the Plan Accounts at a point in time is based on the allocation policy outlined in Note 12.
9.2. FUND TRANSFERS
PSP Investments did not receive any fund transfers from the Government of Canada for the year ended March 31, 2017 (no transfers for the year ended March 31, 2016) for the Fund.
10 INVESTMENT-RELATED EXPENSES
Investment-related expenses allocated to the Plan Account are comprised of the following for the year ended March 31:
(Canadian $ thousands) 2017 2016
Interest expense $ 704 $ 559Transaction costs 624 499External investment
management feesA 152 173Other (net) 203 84
Total $ 1,683 $ 1,315
A Consists of amounts incurred for investments in public markets that are paid directly by PSP Investments. Other fees are paid by certain pooled fund investments classified under alternative investments which amounted to $703 thousand for the year ended March 31, 2017 ($289 thousand for the year ended March 31, 2016). Such fees are embedded in the fair value of the funds.
Similarly, management fees related to investments in private markets and private debt securities are not paid directly by PSP Investments. Such fees, which generally vary between 0.1% and 2.0% of the total invested and/or committed amount, totaled $1,371 thousand for the year ended March 31, 2017 ($1,140 thousand for the year ended March 31, 2016). Such fees are embedded in the fair value of the investments.
11 OPERATING EXPENSES
Operating expenses allocated to the Plan Account consisted of the following for the year ended March 31:
(Canadian $ thousands) 2017 2016
Salaries and employee benefits $ 1,005 $ 821Professional and consulting fees 295 222Premises and equipment 100 78Market data and
business applications 128 110Depreciation of equipment 146 127Custodial fees 19 22Other operating expenses 80 66
Total $ 1,773 $ 1,446
12 ALLOCATION OF COMPREHENSIVE INCOME (LOSS)
PSP Investments’ comprehensive income (loss) is allocated to each Plan Account as follows:
12.1. INVESTMENT INCOME
The investment income is allocated proportionately based upon the net investments of each Plan Account at the time the income was incurred.
12.2. EXPENSES
The Act requires that the costs of operation of PSP Investments be charged to the Plan Accounts. Under section 4(3) of the Act, the President of the Treasury Board shall determine to which Plan Account these costs will be charged, in consultation with the Minister of National Defence and the Minister of Public Safety and Emergency Preparedness. An allocation policy was developed which allocates the direct costs of investment activities, such as external investment management fees and custodial fees, to each Plan Account, based upon the net investments of each Plan Account at the time the expense was incurred.
Operating expenses and other comprehensive income (loss), excluding the direct cost of investment activities listed above, for the year ended March 31, were allocated in proportion to the annual amount of net investments of each Plan Account as follows:
2017 2016
Public Service Pension Plan Account 72.5% 72.6%
Canadian Forces Pension Plan Account 19.7 19.7
Royal Canadian Mounted Police Pension Plan Account 7.3 7.2
Reserve Force Pension Plan Account 0.5 0.5
Total 100.0% 100.0%
Expenses are paid by PSP Investments by way of advances from the Public Service Pension Plan Account, which are reimbursed by the other Plan Accounts on a quarterly basis.
ANNUAL REPORT 2017 | PUBLIC SECTOR PENSION INVESTMENT BOARD262

RESERVE FORCE PENSION PLAN ACCOUNTNotes to the Financial Statements for the years ended March 31, 2017 and 2016
13 RELATED PARTY TRANSACTIONS
13.1. CERTAIN INVESTEES
As outlined in Note 2.1, investments in unconsolidated subsidiaries, jointly controlled investees and associates are measured at FVTPL. Transactions between PSP Investments and such entities or subsidiaries of such entities are related party transactions. PSP Investments enters into investment transactions with such related parties in the normal course of its business, more specifically, as part of private markets and certain fixed income investments described under Note 4.1 as well as guarantees, indemnities and commitments described under Notes 15 and 16, respectively. Since balances in connection with all investment transactions are measured at FVTPL, those transactions undertaken with related parties have the same impact on net assets and comprehensive income (loss) as those with unrelated parties.
Transactions between PSP Investments and its consolidated subsidiaries as well as related balances are eliminated upon consolidation and, therefore, are not disclosed in this note.
13.2. THE GOVERNMENT OF CANADA AND GOVERNMENT-RELATED ENTITIES
Since PSP Investments is a Crown corporation as described in Note 1, it is considered to be related to the Government of Canada as well as other entities that are controlled, jointly controlled or significantly influenced by the Government of Canada (together “government-related entities”).
(i) The Government of Canada
The only transactions undertaken between PSP Investments and the Government of Canada consist of the funds transfers outlined in Note 9.2.
(ii) Government-Related Entities
PSP Investments may enter into investment transactions with government-related entities in the normal course of its business, more specifically, as part of private markets and certain fixed income investments described under Note 4.1. Such investment transactions are carried out on terms that are equivalent to those that may prevail in transactions with unrelated parties and are subject to the same internal processes. In this respect, transactions with such related parties have the same impact on net assets and comprehensive income (loss) as those with unrelated parties. Consequently, PSP Investments is availing itself of the exemption under IAS 24 Related Parties from making specific disclosures on transactions and balances with such government-related entities.
13.3. COMPENSATION OF KEY MANAGEMENT PERSONNEL
Members of key management personnel are related parties of PSP Investments. Key management personnel are those persons having authority and responsibility for planning, directing and controlling PSP Investments’ activities, directly or indirectly and consist of members of the Board of Directors, PSP Investments’ senior management team and officers. Compensation earned by key management personnel allocated to the Plan Account for the year ended March 31 was recorded in the Statements of Comprehensive Income and was as follows:
(Canadian $ thousands) 2017 2016
Short-term compensation and other benefits $ 76 $ 80
Long-term compensation and other benefits 38 18
Total $ 114 $ 98
As disclosed in Note 15, PSP Investments may also be required to indemnify certain members of key management personnel for costs incurred, such as claims, actions or litigations in connection with the exercise of specific aspects of their duties.
14 CAPITAL MANAGEMENT
As an investment company, PSP Investments’ objectives in managing its capital are:
· To invest fund transfers, outlined in Note 9.2, in the best interests of the beneficiaries and contributors under the Superannuation Acts. The funds received are invested with a view of achieving a maximum rate of return, without undue risk of loss, having regard to the funding, policies and requirements of the Plans established under the Superannuation Acts and the ability of the Plans to meet their financial obligations. The funds are also invested in accordance with the Investment Risk Management policies which are outlined in Note 7.
· To maintain an appropriate credit rating to achieve access to the capital markets at the lowest cost of capital. Through PSP Capital Inc. and its leverage policies, PSP Investments has the ability to raise capital by issuing short-term promissory notes and medium-term notes. Note 8.2 provides information on the capital market debt financing and Note 7.3 provides information on PSP Investments’ liquidity.
The capital structure of PSP Investments consists of fund transfers and capital market debt financing. PSP Investments has no externally imposed restrictions on capital.
PUBLIC SECTOR PENSION INVESTMENT BOARD | ANNUAL REPORT 2017 263

RESERVE FORCE PENSION PLAN ACCOUNTNotes to the Financial Statements for the years ended March 31, 2017 and 2016
15 GUARANTEES AND INDEMNITIES
PSP Investments provides indemnification to its Directors, its Officers, its vice-presidents and to certain PSP Investments representatives who are asked to serve on boards of directors (or like bodies) or investment advisory boards (or like bodies) of entities in which PSP Investments or its investment entity subsidiaries have made an investment or have a financial interest. As a result, but subject to the Act, PSP Investments may be required to indemnify these representatives for costs incurred, such as claims, actions or litigation in connection with the exercise of their duties, unless the liability of such a representative relates to a failure to act honestly and in good faith. To date, PSP Investments has not received any claims or made any payment for such indemnities.
In certain cases, PSP Investments also provides indemnification to third parties in the normal course of business. As a result, PSP Investments may be required to indemnify such third parties in connection with the performance of their contractual obligations. To date, PSP Investments has not received any claims nor made any payments for such indemnities.
PSP Investments unconditionally and irrevocably guarantees all credit facilities, as well as short-term promissory notes and medium-term notes issued by PSP Capital Inc., as described in Note 8.
In certain investment transactions, PSP Investments and its investment entity subsidiaries provided guarantees, indemnifications or issued letters of credit to third parties, the most significant of which are as follows:
· As at March 31, 2017, PSP Investments and its investment entity subsidiaries agreed to guarantee and, in some cases, provide indemnification for the performance of certain investees under contractual agreements. The majority of these agreements are borrowing arrangements. In the event a default occurs under such agreements, which is of limited recourse in certain cases, PSP Investments or its investment entity subsidiaries could assume obligations of up to $2,077 million as at March 31, 2017 (March 31, 2016 – $1,891 million), of which $9,618 thousand has been allocated to the Plan Account (March 31, 2016 – $9,016 thousand) plus applicable interest and other related costs. The arrangements mature between May 2017 and September 2028.
· Additionally, PSP Investments and its investment entity subsidiaries issued letters of credit totalling $35 million as at March 31, 2017 (March 31, 2016 – $29 million), of which $163 thousand has been allocated to the Plan Account (March 31, 2016 – $137 thousand) in relation to investment transactions.
16 COMMITMENTS
PSP Investments and its investment entity subsidiaries have committed to enter into investment transactions, which will be funded over the next several years in accordance with agreed terms and conditions. The portion of PSP Investments’ commitments that would be assumed by the Plan Account was as follows as at March 31:
(Canadian $ thousands) 2017 2016
Real estate $ 13,083 $ 11,492Private equity 41,958 33,789Infrastructure 17,363 19,021Natural resources 3,497 4,042Private debt securities 14,399 21,515Alternative investments 5,748 9,057
Total $ 96,048 $ 98,916
Funding in connection with the above commitments can be called upon at various dates extending until 2035 as at March 31, 2017 (March 31, 2016 – 2032).
ANNUAL REPORT 2017 | PUBLIC SECTOR PENSION INVESTMENT BOARD264

investpsp.com
BUSINESS OFFICESMONTREAL (Main office)1250 René-Lévesque Blvd. West, Suite 1400Montréal, Québec H3B 5E9Canada
T. +1 514.937.2772
NEW YORK450 Lexington Avenue, Suite 3750New York, NY 10017USA
T. +1 212.317.8879
LONDON10 Bressenden Place 8th floorLondon, United KingdomSW1E 5DH
T. +44 20 37 39 51 00
HEAD OFFICEOTTAWA1 Rideau Street 7th floorOttawa, Ontario K1N 8S7Canada
T. +1 613.782.3095