inventory of hydrological measurements in sweden · inventory of hydrological measurements in...
TRANSCRIPT

W 14043
Examensarbete 30 hpNovember 2014
Inventory of hydrological measurements in Sweden Inventering av hydrologiska mätningar i
Sverige
Ida Enjebo

i
ABSTRACT
Inventory of hydrological measurements in Sweden
Ida Enjebo
This thesis aimed to study how different actors perform hydrological observations in
Sweden. Target groups for the study were institutions that regularly measure water stage
and river discharge, including water councils, water- and wastewater departments in
municipalities, water authorities and hydropower companies. After the identification of
the different actors, the study investigated how, where and why they perform
hydrological observations as well as the way actors perceive the accuracy of these
measurements.
Information was collected through interviews and the development of a number of
questionnaires. A total of 447 actors were contacted and 260 replied. The majority of
them, 209, answered that they do not perform any hydrological measurements while the
remaining 51 answered that they measure water stage. One of the main reasons for
measuring is that many actors are facing water-rights court ruling. There were also
several actors that stated that they perform hydrological measurements to make sure that
the water body where water from wastewater treatment plants and storm water is
emitted has sufficient water stage for environmental concerns. The hydropower
companies replied that they, in addition to maintaining a water-rights court ruling, used
water stage data to control the functioning of the plant. They also calculate river
discharge based on production, floodgate position and stage.
There were also seven municipalities, which stated that they had implemented a flood-
monitoring model and that water stage data were used as input to the model. These
municipalities and two other actors stated that they measure discharge or use a stage-
discharge relationship (rating curve) to derive discharge data. However, in some cases,
control measurements were lacking. Most actors used pressure sensors to measure stage.
Their perceived levels of accuracy varied from ± 1 mm to ± 5 cm. Only five actors
stated that they level their instruments regularly, which is a precondition for maintaining
a correct data series.
The results are useful for SMHI’s continued review of their hydrological network,
although continued attempts to receive answers from all contacted actors would provide
a more complete overview of hydrological observations. A study that thoroughly
investigates how actors perceive the accuracy of their measurements would also give
further knowledge in this field.
Keywords: Hydrological observations, water stage, river discharge, accuracy
Department of Earth Sciences, Uppsala University,
Villavägen 16, SE-752 36 Uppsala, Sweden

ii
REFERAT
Inventering av hydrologiska mätningar i Sverige
Ida Enjebo
Examensarbetet syftade till att undersöka hur olika aktörer genomför hydrologiska
mätningar i Sverige. Målgrupper för studien var aktörer vars verksamhet innefattar
mätningar av vattenföring och vattenstånd. De målgrupper som identifierades var
vattenråd, kommunala VA-avdelningar, vattenmyndigheter och vattenkraftbolag. När
aktörerna identifierats undersöktes hur, var och varför aktörerna mäter samt hur de
uppfattar noggrannheter i sina mätningar.
Informationen samlades in genom frågeformulär och intervjuer. Totalt kontaktades 447
aktörer varav 260 svarade på frågorna som ställdes. Majoriteten, 209 aktörer svarade att
de inte utför några hydrologiska mätningar medan resterande svarande att de mäter
vattenstånd. Den anledning som flest aktörer gav till att de mäter var att de har en
vattendom. Det var även flera aktörer som mätte för att försäkra sig om att recipienter
för dagvatten och avloppsreningsverk hade tillräckligt högt vattenstånd för utsläpp.
Vattenkraftproducenterna svarade att de, utöver att de har vattendomar, använder
vattenståndsdata för att reglera kraftverken. De beräknade också vattenföringen utifrån
lucköppningsgrad, vattenstånd och producerad effekt.
Det var även sju kommuner som svarade att de hade implementerat modeller för
översvämningsövervakning och använde vattenståndsmätningar som indata i
prognosmodellerna. Dessa kommuner och två ytterligare aktörer svarade att de mäter
vattenföring eller använder avbördningskurvor men i flera fall är kontrollmätningar av
vattenföringen bristande. De flesta aktörerna använde tryckgivare för att mäta
vattenståndet och de gav noggrannhetsintervall mellan ± 1 mm och ± 5 cm. Endast fem
aktörer uppgav att de avväger mätinstrumentet vilket är en förutsättning för att
upprätthålla en korrekt mätserie.
Resultaten är användbar information i SMHIs utvärdering av sitt nätverk av
hydrologiska mätstationer, dock skulle fortsatta försök att få svar från samtliga
kontaktade aktörer ge en mer heltäckande bild av hydrologiska mätningar utförda av de
olika målgrupperna. Det vore även intressant med en studie som går djupare in på hur
noggrannhet uppskattas och uppfattas av de olika aktörerna.
Nyckelord: Hydrologiska mätningar, vattenstånd, vattenföring, noggrannhet
Institutionen för geovetenskaper, Uppsala universitet,
Villavägen 16, SE-752 36 Uppsala, Sverige

iii
PREFACE
This thesis is the final project of the Master Programme in Environmental and Water
Engineering at Uppsala University. The project corresponds to 30 ECTS and has been
conducted at the Swedish Hydrological and Meteorological Institute, SMHI. Supervisor
at SMHI was Lena Eriksson Bram and subject reviewer was Giuliano Di Baldassarre at
the Department of Earth Sciences, Uppsala University.
I would like to thank Giuliano Di Baldassarre for the help and guidance he gave me
with the report and through the thesis work and Lena Eriksson Bram for the feedback
she gave me throughout the project. I would also like to thank Mikael Lennermark and
Gustav Sandehed, hydrologists at SMHI, for the day of field work I got to experience.
This project would not have been possible without all the employees at municipalities,
hydropower companies, water authorities etc. who have taken time to answer my
questions. Thank you all so much for your participation.
Finally I would like to thank my dear friends and my family for supporting me through
my ups and downs and double-computer-trouble, I don’t know what I would have done
without you. And David, for being there when I needed you.
Uppsala, September 2014
Ida Enjebo
Copyright © Ida Enjebo and the Department of Earth Sciences, Uppsala University
UPTEC W 14043
ISSN 1401-5765
Published digitally at the Department of Earth Sciences, Uppsala University,
Uppsala, 2014

iv
POPULÄRVETENSKAPLIG SAMMANFATTNING
Inventering av Hydrologiska mätningar i Sverige
Ida Enjebo
Vatten spelar många viktiga roller i våra liv; som livsnödvändigt livsmedel, som något
vi använder i våra hushåll till tvätt, disk och städning, i industriprocesser, som källa till
elproduktion, i jordbruket och som badplatser. Sverige har rik tillgång på färskvatten för
att tillfredsställa samhällets och naturens behov. Viljan att dokumentera förändringar i
våra vatten har funnits länge. Sedan 1700-talet har man mätt vattenstånd i de stora
svenska sjöarna och i början av 1900-talet bildades det som senare skulle bli SMHI,
Sveriges meteorologiska och hydrologiska institut, som idag bland annat har i uppdrag
att samla in data och ta fram prognoser för både väder och vattenflöden.
SMHI har idag ett nätverk av drygt 300 mätstationer som kontinuerligt registrerar
vattenytans läge i åar och älvar, det så kallade hydrologiska grundnätet. Att mäta
vattenstånd är relativt enkelt och ett vanligt sätt är att helt enkelt läsa av en pegel, en
sorts linjal, som är monterad på en lodrät yta i vattenkanten. För att vara säker på att
pegelns läge inte förändras är det viktigt att veta hur pegeln förhåller sig, i höjdled, mot
en fixpunkt i närheten; att man gör regelbundna avvägningar. Det finns också
mätinstrument som automatiskt registrerar vattenståndet antingen på papper eller
digitalt. Vid de flesta av SMHIs mätstationer registreras vattenståndet på papper som
byts en gång i månaden. Ett annat vanligt sätt att mäta vattenståndet idag är med hjälp
av tryckgivare; mätare som använder luft- och vattentryck för att få fram vattenståndet.
Det är inte möjligt att vid mätstationerna också kontinuerligt mäta vattenföring, istället
har man tagit fram samband mellan vattenstånd och vattenföring, så kallade
avbördningskurvor. Det gör man genom att mäta flödet vid olika vattenstånd uppströms
en bestämmande sektion, vilket är en plats i vattendraget där vattenståndet nedströms
den bestämmande sektionen inte påverkar vattenståndet uppströms sektionen. En
bestämmande sektion kan till exempel vara en byggd fördämning eller ett utlopp från en
sjö.
På SMHI har ett arbete med att se över det hydrologiska grundnätet påbörjats. I
samband med det arbetet genomfördes den här studien där det har undersökts vilka
andra aktörer som utför hydrologiska mätningar. Ifall SMHI i sin utvärdering kommer
fram till att nätverket behöver utökas är det värdefullt att ha information om vilka andra
aktörer som redan utför mätningar för att eventuellt kunna samarbeta. Det här projektet
har därför syftat till att ta reda på vilka som mäter vad och var samt hur och varför
mätningar sker och hur de som mäter uppfattar noggrannheten i sina mätningar.
De målgrupper som valdes för studien var kommuner, vattenråd, vattenmyndigheter och
vattenkraftbolag. Aktörerna kontaktades via epost med frågan ifall de genomför några

v
hydrologiska mätningar, till exempel vattenstånd eller vattenföring. De som svarade att
de mäter fick därefter ett formulär med frågor om hur mätningarna går till, om
mätplatsen, kontrollrutiner mm. Många hänvisade till andra aktörer i sitt närområde
varvid de också kontaktades och en ytterligare målgrupp, övriga, identifierades. I
målgruppen övriga placerades gruvbolag, fiskeriorganisationer, intressegrupper,
universitet, konsulter och pappersbruk. Totalt kontaktades 447 aktörer.
Svarsfrekvensen var 59 % och kom från aktörer från hela landet. En klar majoritet av de
som svarade, 80 %, svarade att de inte genomför några hydrologiska mätningar. Av de
som mäter gav de flesta att de har en vattendom som anledning. Vattendom är ett
begrepp som finns kvar från vattenlagstiftningen som fanns innan miljöbalken trädde i
kraft 1998. En vattendom styrde hur till exempel anläggning av dammar och
vattenkraftverk eller dränering av åkermark fick reglera vattennivåer. Det var till
exempel vanligt att den som fick en vattendom fick gränser inom vilka vattennivån
skulle hållas under olika delar av året. Även efter att miljöbalken trädde i kraft fortsätter
de gamla vattendomarna att gälla men numera är det andra regler som gäller för
vattenverksamhet.
Det var i första hand VA-avdelningar på kommunerna som kontaktades eftersom deras
verksamhet är starkt kopplad till vattnets kretslopp. Lite drygt 20 % av kommunerna
som svarade mätte vattenstånd som en del i övervakningen av sina vatten- och
avloppsnät eller avloppsreningsverk. Ungefär lika många hade system för
översvämningsövervakning som krävde mätningar för att göra flödesprognoser.
Vattenkraftproducenterna i sin tur använde vattenståndsmätningarna till att styra
kraftverken. Alla som svarade på enkäten mätte vattenstånd på olika sätt men endast ett
fåtal hade avbördningssamband för att generera vattenföringsdata också.
Trots att många aktörer använde samma teknik i form av tryckgivare för att mäta
vattenståndet hade de spridda uppfattningar om hur noggranna deras mätningar var.
Ungefär en tredjedel av de som automatiskt registrerade vattenståndet jämförde sin data
med en vanlig pegelskala för att se om de stämde överens. Dock var det bara 10 % som
svarade att de väger av sina mätinstrument för att vara säkra på att de inte rubbas.

vi
GLOSSARY
Current meter Flygel
Environmental Code Miljöbalken
Gauging station Hydrologisk mätstation
Levelling Avvägning (med avvägningsinstrument)
Rating curve Avbördningskurva
River basin Avrinningsområde
River discharge Vattenföring
Sill Tröskel
Sonar Ekolod
Staff gauge Pegel
Stilling well Mätbrunn
Water authority Vattenmyndighet
Water council Vattenråd
Water Framework Directive EUs ramdirektiv för vatten
Water-rights court ruling Vattendom
Water stage Vattenstånd

vii
CONTENT
ABSTRACT ...................................................................................................................... i
REFERAT ........................................................................................................................ ii
PREFACE ........................................................................................................................ iii
POPULÄRVETENSKAPLIG SAMMANFATTNING .................................................. iv
GLOSSARY .................................................................................................................... vi
CONTENT ..................................................................................................................... vii
1 INTRODUCTION .................................................................................................... 1
1.1 OBJECTIVES .................................................................................................... 1
2 BACKGROUND ...................................................................................................... 1
2.1 SMHI’S NETWORK OF GAUGING STATIONS ........................................... 1
2.2 WATER FRAMEWORK DIRECTIVE ............................................................ 3
2.3 WATER-RIGHTS COURT RULING ............................................................... 3
3 THEORY .................................................................................................................. 4
3.1 MEASURING STAGE ...................................................................................... 4
3.1.1 Non-recording techniques........................................................................... 4
3.1.2 Recording techniques ................................................................................. 5
3.1.3 Stilling wells ............................................................................................... 5
3.1.4 Pressure Transducers .................................................................................. 6
3.1.5 Acoustic instruments .................................................................................. 6
3.2 MEASURING DISCHARGE ............................................................................ 6
3.2.1 Velocity-area methods ................................................................................ 6
3.2.2 Techniques using the Doppler Effect ......................................................... 9
3.2.3 Weirs ......................................................................................................... 12
3.2.4 Other methods .......................................................................................... 12
3.3 RATING CURVES .......................................................................................... 12
3.3.1 Uncertainty in stage-discharge relationship ............................................. 14
3.3.2 Three types of errors ................................................................................. 15
4 MATERIAL AND METHODS.............................................................................. 15
4.1 INTERVIEWEES ............................................................................................ 15
4.2 QUESTIONNAIRE ......................................................................................... 16
4.2.1 The four different questionnaires ............................................................. 16
5 RESULTS ............................................................................................................... 16

viii
5.1 Reasons for measuring ..................................................................................... 20
5.2 Stage measurements ......................................................................................... 20
5.3 Discharge measurements ................................................................................. 22
6 DISCUSSION ......................................................................................................... 23
6.1 THE METHOD ................................................................................................ 23
6.1.1 Questionnaire design ................................................................................ 23
6.1.2 Who were contacted ................................................................................. 24
6.2 THE RESULTS ............................................................................................... 24
6.2.1 Perceived accuracy ................................................................................... 24
6.2.2 Reasons for measuring ............................................................................. 25
6.2.3 Cooperation and coordination .................................................................. 25
7 CONCLUSIONS .................................................................................................... 26
BIBLIOGRAPHY .......................................................................................................... 27
Appendix A – Contacted actors ...................................................................................... 29
Appendix B – Questionnaire .......................................................................................... 34
Appendix C – Measurement sites ................................................................................... 40

1
1 INTRODUCTION
Our modern society is certainly affected by weather, water and climate. Urban planning
relies on prognoses of high and low water flows. In the same sense, farmers who use
irrigation need to know that their water source has sufficient water storage to make
extractions. Hydrological observations and hydrometric measurements are essential to
model and forecast when and where, for instance, high (or low) flow will occur.
Nowadays, as climate change is likely to lead to more extreme weather, it is more
important than ever to have hydrological observations. They can provide basis for
adaptations that are to be made to cope with a changing climate.
The Swedish Meteorological and Hydrological Institute (SMHI) has a mission to
provide information on water, weather and climate to serve the general public and
public and private sectors. Within the hydrological field they make observations of
water stage and river discharge around the country. The gauging stations that are in the
network today were built during the 1970’s and 1980’s but many sites have time series
reaching back to the early 1900’s. SMHI is now in the process of evaluating their
network of hydrometric stations to see if it matches the requirements of today. To
supplement the evaluation it is valuable to collect information on other actors who
conduct hydrometric measurements. If there is need to expand the existing hydrometric
network, knowledge of other observation sites is useful in the decision-making process.
1.1 OBJECTIVES
This thesis aims to explore how different actors perform hydrological observations in
Sweden. To this end, the first step was the identification of the actors that measure river
discharge and water stages. Secondly, the study investigated how (and where) different
actors perform hydrological observations as well as how they perceive the accuracy of
their measurements. Information was collected mainly through the development of
questionnaires and the implementation of interviews.
2 BACKGROUND
This study’s focus is on actors that perform hydrological measurements. When
collecting information about other actors it is also important to have an understanding of
SMHI’s activities in this field. SMHI’s network of gauging stations is therefore
presented in this section. Furthermore, the legislation regarding water and water
activities play a role when it comes to hydrometric activities and are hence also
presented.
2.1 SMHI’S NETWORK OF GAUGING STATIONS
SMHI’s network of hydrological stations consists of circa 320 gauging stations of
which 220 are their own. In addition, SMHI receives hydrological data from 20 stations
that are co-owned with other actors and from 80 stations owned by mostly hydropower
plants (Nyman & Lennermark, 2013). This network covers most of Sweden, in the
northern parts you find the majority of the external gauging stations and in the south

2
SMHI’s stations dominate (Figure 1). At the gauging stations stage is measured
continuously in stilling wells using floats and either digital angle sensors or horizontal
drum recorders. Each gauging station has a rating curve for translating stage data into
discharge data (Eriksson Bram, 2014). Stage-measurement techniques and rating curves
will be further described in section 3. Data is collected in real time from 70 stations and
from the remaining stations data is collected and digitized monthly. The data are mainly
used to calibrate SMHI’s hydrological models (Eriksson Bram, 2014). The stations are
inspected every other year or more frequently if required. At the inspection it is made
sure that the stilling well is in working order, the sill is not dammed and the gauge is
levelled with local benchmarks (Sandehed, 2013).
Figure 1. SMHI’s network of gauging stations. Blue triangles represent SMHI’s own
stations and red squares external actors (SMHI, 2013) (SMHI, 2012).

3
2.2 WATER FRAMEWORK DIRECTIVE
The water framework directive came into force in the
year 2000 and was implemented in Swedish legislation
in 2004. The aim of the directive is to achieve good
ecological and chemical status in all ground- and
surface waters by 2015 or 2027 (Vattenmyndigheterna,
2014). Overall goals of water management are, in
addition to good status by 2015, to relieve effects of
floods and droughts, ensure access to water with good
quality and a sustainable and fair water use, address
impacts from acidification and eutrophication and
involve interested parties in the planning process
(Länsstyrelsen Västernorrland, 2014).
The directive introduces river-basin districts as a mean
to reach good status. The boarders between the
districts are not administrative but the same as the
boarders between river basins (European Parliament &
Counil of the European Union, 2000). In Sweden this
means that the municipalities and counties are
collaborating in five water authorities that see to the
groundwater, lakes, rivers, streams and coastal waters
in their districts (Figure 2) (Vattenmyndigheterna,
2014).
Article 14 in the directive concerns the involvement of interested parties and that the
member states are required to encourage participation (European Parliament & Counil
of the European Union, 2000). Within the five water districts in Sweden there are
several water councils that consist of different stakeholders such as forestry-,
hydropower- and mining companies, municipalities, local-interest groups and
individuals. These councils are meant to capture local knowledge of the area and issues
related to the waters (Vattenmyndigheten Bottenviken, 2014).
2.3 WATER-RIGHTS COURT RULING
In the early 1900’s many rivers were exploited for hydropower. Around the same time,
the desire to have more arable land led to drainage of large areas of land. These
activities were regulated in water legislation from 1918 and earlier. When the
Environmental Code took effect in 1998, water-rights court rulings already in effect
would stay so, even though the new legislation had stricter demands. The water-rights
court ruling typically stated the allowed upper and lower limits for water levels of a
regulated river, lake or dam. These limits are often specified to the centimetre and vary
throughout the year, typically to cope with spring floods and summers’ lower flows
(Scholz, 2011).
Figure 2. The five water
authorities in Sweden (SMHI,
2012)

4
3 THEORY
Hydrological observations of water stage and river discharge can be performed using
several different techniques. A common way to collect river-discharge data is to
establish a stage-discharge relationship, a rating curve. In all types of measurements it is
important to minimize uncertainty and error.
3.1 MEASURING STAGE
Techniques for measuring stage can be divided into two main groups; non-recording
and recording techniques. In this section some of the most common stage-measuring
techniques will be described. Regardless of which stage-measurement technique is used,
it is necessary to level the instrument from local benchmarks and to repeat the procedure
regularly. It is also necessary to keep the same datum throughout the recording period
(WMO, 2008). SMHI requires levelling every two years (Sandehed, 2013). Stage data
that is used to calculate discharge should have a level of accuracy of 3 mm or 0.2 % of
the effective stage, i.e. vertical distance between the water surface and the point of the
sensor that is exposed to the water body (WMO, 2010).
3.1.1 Non-recording techniques
Non-recording techniques can be very straightforward with a simple staff gauge; a scale
attached to a vertical service (Figure 3). Similar to a staff gauge is a ramp gauge. Instead
of a vertical graduated staff, a scale is mounted on a surface that inclines similarly to the
bank of the stream. It is important that the ramp gauge lies on a line perpendicular to the
flow direction (SIS, 2008).
Tape or wire gauges have a weight attached to it which is lowered to the surface, hence
determining the water level relative a benchmark above the surface. The staff-, ramp-,
tape- and wire gauges all have triangularly distributed uncertainty that can be calculated
as
𝑢(𝑥𝑚𝑒𝑎𝑛) =1
√16∙
𝑥𝑚𝑎𝑥−𝑥𝑚𝑖𝑛
2 (1)
where
𝑥𝑚𝑎𝑥= the discernible upper limit
𝑥𝑚𝑖𝑛= the discernible lower limit.
A stage-measurement technique often used in wells and boreholes is a dipper. It is a
device that it lowered from a local benchmark and signals when it is in contact with the
water surface. It requires a degree of conductivity of the water in order to work (SIS,
2008).

5
3.1.2 Recording techniques
The technique used in most of SMHI’s gauging stations is mechanical gauges with a
float and counterweight (Eriksson Bram, 2014). When the water level changes the
pulley rotates and the displacement can be read on a graduated tape or wire. The most
common recorder at SMHI’s gauging stations is a horizontal drum recorder (Figure 4)
(Eriksson Bram, 2014). A pen is connected to the pulley and draws on a paper placed on
a rotating drum (SIS, 2008).
3.1.3 Stilling wells
The water level can change rapidly in rivers and streams. The use of stilling wells
makes the changes in level smoother and removes the measurement noise that would
otherwise be found in the data. At SMHI’s gauging stations stage is measured in stilling
wells. The stilling well construction consists of one or two intake pipes that connect the
well with the stream, a measuring device connected to a recorder and a protective and
supportive building structure (Figure 4). SMHI’s stations that report stage in real time
have recorders with shaft encoder that record the stage digitally (Eriksson Bram, 2014).
Figure 4. Sketch of a stilling well (left) and an example of a horizontal drum recorder
(right).
Figure 3. Sketch of a staff gauge (left) and of the concept of a ramp gauge (right).

6
The intake pipes in the stilling wells have a tendency to clog with sediments. This
requires maintenance and a typical act is to pump water into the well in order to rinse
the pipes (Sandehed, 2013). Because of the risk of clogging it is useful to place a staff
gauge directly in the stream as a reference measurement (WMO, 2010).
3.1.4 Pressure Transducers
Another type of stage recorder is the pressure sensors. These transducers are based on
the relationship between the head of liquid above a point and the static pressure at that
point. This relationship is typically assumed to be linear and can be described as
𝑊 = (𝑃𝑠𝑡𝑎𝑡𝑖𝑐 − 𝑃𝑎𝑡𝑚𝑜𝑠𝑝ℎ𝑒𝑟𝑖𝑐) ∙ 𝐶 (2)
where 𝑊 is the water stage, 𝑃𝑠𝑡𝑎𝑡𝑖𝑐 is the pressure in a fix point in the water,
𝑃𝑎𝑡𝑚𝑜𝑠𝑝ℎ𝑒𝑟𝑖𝑐 is the atmospheric pressure at the water surface and 𝐶 a factor of the
water’s weight (WMO, 2008).
3.1.5 Acoustic instruments
Instruments that use ultrasound measures the time elapsed from transmission to
reception of the echo from the water surface. This time is then converted into a distance.
This technique can be used in two types of instruments; either mounted above maximal
water level transmitting down to the water surface or mounted below minimum water
level transmitting upward. Since speed of sound is very dependent on temperature these
instruments are also equipped with a thermistor (SIS, 2008). Similar devices can be
used to measure water velocity. This is useful since it does not require a stage-discharge
relationship (WMO, 2008).
3.2 MEASURING DISCHARGE
There are no easy and practical ways to continuously measure water velocity in rivers
and streams to determine discharge. With help from a few discharge measurements it is
relatively easy to establish a rating curve (Section 3.3) to calculate discharge from
continuous measurements of water stage (White, 2014). There are several different
ways to measure discharge and many of them are based on measuring water velocity
and cross-section area and using the equation
𝑄 = 𝐴 ∙ 𝑣 (3)
where 𝑄 is the discharge, 𝐴 the cross-section area and 𝑣 the mean velocity in the cross
section. The average velocity can be determined with different methods. The following
sections describe some of these methods.
3.2.1 Velocity-area methods
The water velocity is not constant through the cross section and profile. This makes it
necessary to measure the water velocity at several points in the cross section and at
several depths. The velocity is generally lowest at the bed and banks and highest at the
surface in the middle of the river. The cross section is divided into multiple vertical
segments, how many depends on the width of the river, at which the velocity is

7
measured. International standards suggest that for streams wider than five meters the
segments should be such that, if possible, <5% of the total discharge passes through a
single segment, but never more than 10%. The recommendations for smaller streams are
presented in Table 1 (ISO, 2007).
Table 1. Recommended number of verticals for different channel widths
Channel width Number of verticals
<0.5 m 5 to 6
>0.5 and <1 m 6 to 7
>1 and <3 m 7 to 12
>3 and <5 m 13 to 13
>5 m ≥22
The velocity should also be measured at several depths in each segment as long as the
total depth is sufficient. A seldom used method is the integration method, when the
current meter is lowered and raised through the profile while continuously measuring
velocity (ISO, 2007). More common is point measurements at specific depths; one, two,
three, five or six different ones. The velocity difference through the profile makes it
suitable to measure at 0.6 of the total depth if only one measurement is made in each
segment. When two points are used, international standards says that 0.2 and 0.8 of the
total depth is most suitable and for three points 0.2, 0.6 and 0.8 are used. With five
points as near as possible to the surface and bed are added and for six points 0.4 of the
total depths is added as well. The mean velocity in each segment is then calculated by
weighting the different depths (Table 2).
Table 2. Equations for calculating mean velocity in vertical segment of cross section
(ISO, 2007)
One point �̅� = 𝑣0.6
Two point �̅� =𝑣0.2 + 𝑣0.8
2
Three point �̅� =𝑣0.2 + 2𝑣0.6 + 𝑣0.8
4
Five point �̅� =𝑣𝑠𝑢𝑟𝑓𝑎𝑐𝑒 + 3𝑣0.2 + 3𝑣0.6 + 2𝑣0.8 + 𝑣𝑏𝑒𝑑
10
Six point �̅� =𝑣𝑠𝑢𝑟𝑓𝑎𝑐𝑒 + 2𝑣0.2 + 2𝑣0.4 + 2𝑣0.6 + 2𝑣0.8 + 𝑣𝑏𝑒𝑑
10

8
The discharge of each segment is calculated either with the mean-section method or the
mid-section method. In the mean-section method the velocity is measured on the
boarders between two segments and in the mid-section method the velocity is measured
in the middle (Figure 5). The discharge is calculated as
𝑞 = (𝑏𝑛+1 − 𝑏𝑛) (𝑑𝑛+1+𝑑𝑛
2) (
�̅�𝑛+1+�̅�𝑛
2) (4)
using the mean-section method and
𝑞 = �̅�𝑛𝑑𝑛 (𝑏𝑛+1−𝑏𝑛−1
2) (5)
using the mid-section method. In equation 4 and 5
𝑞 is discharge through a section
𝑏𝑛 is the distance from a fixed point on the bank to vertical 𝑛
𝑑𝑛 is the depth at vertical 𝑛
�̅�𝑛 is the mean velocity in section 𝑛.
Sources for error when measuring velocity are unsteady flow, suspended material in the
channel, skew flow, use of a measuring device outside its calibration range, disturbance
by wind and that the measuring device is not held/mounted properly (ISO, 2007).
3.2.1.1 Mechanical current meter
The velocity-measuring instrument used during most of the 20th
century is a current meter (Figure 6). It can have either a horizontal
axis and a propeller that rotates or a vertical axis with several
revolving cups around it. When used in smaller streams, the current
meter is mounted on a wading rod and placed in each vertical
segment and the set depths. It measures the number of rounds and
the elapsed time to determine the velocity (WMO, 2010).
3.2.1.2 Uncertainties in velocity-area methods
The total uncertainty of discharge measurements is a combination of the uncertainty in
all components; measurement of width and depth, interpolation of depth between
verticals and in each velocity measurement. The random and systematic uncertainty in
width measurements is less than ±1 %. For depth measurements the random uncertainty
Figure 5. Mean-section method (left) and mid-section method (right).
Figure 6. Mechanical
current meter.

9
is between ±1 % and ±3 % and the systematic less than ±1 (Pelletier, 1988). Depth can
be difficult to assess due to variation in stage throughout the measurement. If velocity is
measured at two depths in 20 to 25 verticals under non-extreme conditions, the standard
error in the discharge measurement is about 5 % with the 95 % confidence level (WMO,
2008).
The uncertainty in depths measurements is usually negligible if it was done by using a
reference point on the bank and a tag line or when using a moving trolley and
measuring the movement of the wire. If an optical method is used the uncertainty
depends on the distance measured. The uncertainty in depths measurements is
determined by the person who performs the measurement. It can be difficult to assess
due to variation in stage throughout the measurement. Additional sources of error when
assessing depth are that the river bed can be soft hence making it hard to determine
where the bed is and also rocks and boulders on the bed giving a false image of the
topography. Additional uncertainty comes from the interpolation of depths between
verticals. Not using a sufficient number of verticals greatly contributes to uncertainty in
discharge measurements. In the case that a mechanical current meter is used there are
also the exposure time and instrument calibration to consider (Turnipseed & Sauer,
2010) (ISO, 2007).
3.2.2 Techniques using the Doppler Effect
The Doppler Effect is the change in frequency when a sound wave is reflected on or
originating from an object in motion. An example of this is the sound from the sirens on
an ambulance (Figure 7). When it comes towards the observer the sound has a higher
pitch than when it is moving away from the observer. The sound wave coming to the
observer is pressed together as the ambulance approaches, hence the wavelength is
shortened and vice versa when it is moving away.
Figure 7. A stationary object emits sound at a certain frequency. When the object is set
in motion the observed frequency is different if the object moves towards or away from
the observer. This is the basic concept of the Doppler Effect (Tutor Vista, 2014).
Measuring devices that use the Doppler Effect to determine the velocity of the water
transmit a sound pulse with a known frequency that hits particles suspended in the water
and registers the reflected pulse and its new frequency.

10
3.2.2.1 Acoustic Doppler Velocity meter (ADV)
An alternative to the mechanical current meter is an Acoustic Doppler Velocity meter
(ADV). Similarly to the mechanical current meter, it is mounted on a wading rod and
used in streams where wading is possible and therefore not deep enough for using a
profiling measuring method such as an Acoustic Doppler Current profiler (ADCP) that
is describe later in this section.
ADVs can measure in either 2D or 3D, depending on the device. A 2D meter, which is
what SMHI uses, has one transducer and two receivers (Figure 8). The signal received
in the upstream receiver is used to calculate the velocity component perpendicular to the
stream direction and the downstream is used for the velocity component in the stream
direction (Jonsson & Lennermark, 2009).
Figure 8. A sketch of a Flowtracker, a type of Acoustic Doppler Velocity meter (ADV).
The red marking indicates which receiver is to be placed downstream in the flow
direction (Jonsson & Lennermark, 2009).
Speed of sound in water depends on temperature and salinity. According to US
Geological Survey (USGS) an error in temperature of 3 oC and a 5 ‰ error in salinity
measurement both result in a 1 % error in the velocity measurement respectively. USGS
recalibrate their ADVs every three years (Turnipseed & Sauer, 2010).
3.2.2.2 Acoustic Doppler Profilers
In rivers too deep to wade it is more practical to use profiling measuring devices. There
are two types of acoustic Doppler profilers: mounted on boats and mounted on the river
bed or bank (under the surface). SMHI mostly uses boat-mounted profilers, ADCPs, but
they also have a few stations with bed-mounted profilers, ADVMs, where they use an
index method to calculate discharge. Both types emit signal with known frequency and
receive signals reflected on suspended particles.
11
From the Doppler shift the velocity can be calculated as
𝑉 =𝐶𝐹𝐷
2𝐹𝑠 (6)
where
𝑉 is the water velocity in the same direction as the sound pulse
𝐶 is the speed of sound in water
𝐹𝐷 is the Doppler shift, i.e. the change in frequency cause by the Doppler Effect
(𝐹𝐵 − 𝐹𝑆)
𝐹𝑆 is the transmitted signal’s frequency
𝐹𝐵 is the received signal’s frequency, also known as backscatter).
The speed of sound is highly dependent on the temperature in the water and the ADCP
has therefore a thermistor to enable the use of (6). To be able to measure the water
velocity there has to be a sufficient concentration of suspended matter in the water for
the sound pulses to reflect on. Large objects in the water, such as branches or fish, do
not give the correct Doppler shift and cause incorrect observations of water velocity.
Most ADCP software has algorithms that can detect such disturbances (Mueller &
Wagner, 2009).
The size of the boat on which the ADCP is mounted depends on the size of the river.
The boat then moves across the river with a known velocity and direction. The
technique is sensitive to rapid spatial variations and ideally it requires homogenous
flow. The ADCP is also equipped with sonar to determine the profile of the cross
section when the boat crosses the river.
To determine the water velocity in the flow direction it is necessary to know the
velocity in three directions. The ADCP has either three or four transducers evenly
spaced in a circle, hence the angle between them is known. The offset angle from the
vertical is also necessary for the calculation. Depending on how many transducers the
ADCP has, they are to be placed in different directions relative the flow (WMO, 2010).
The discharge is calculated in real-time but since the instrument is slightly submerged it
cannot measure all the way to the surface. Nor is it possible to accurately measure all
the way to the stream bed due to side-lobe interference. However, by measuring the
return time for the signal, the depths of the stream can be determined as well (Mueller &
Wagner, 2009). SMHI use ADCP to measure river discharge and they assess that
uncertainty in these measurements is 3-7 %. The uncertainty is mainly due to the
extrapolations made at the river banks and natural fluctuations in river flow (Eriksson
Bram, 2014).
The bed-mounted profiler, ADVM, is based on the same principle as the boat mounted:
determining water velocity through the Doppler shift. The main different between
ADCP and ADVM is that the ADVM is stationary and can therefore only give the
velocity in a part of the cross section. However, these devices also measure the vertical

12
profile and by applying velocity distribution models a reasonable estimation of flow can
be made. To estimate the discharge, the relationship between the mean velocity at any
stage and the measured velocity has to be known as well as the relationship between
water stage and cross-section area. The relation between measured velocity (index
velocity) and mean-cross sectional velocity is called velocity-index rating and the
method to determine discharge is therefore called the index method. The mean cross-
sectional velocity is determined by performing discharge measurement with another
device and dividing the discharge with the cross-section area (ISO, 2010 a).
3.2.3 Weirs
In small streams it can be necessary to build a weir in order to be able to measure
discharge. The most common kinds in Sweden are the triangular weirs but there are also
rectangular weirs (Marklund & Westman, 2008). The discharge over a weir is calculated
from the height of the water column and the known angle of the weir crest for a
triangular weir and width of the weir for a rectangular weir as
𝑄 =8
15∙ 𝐶 ∙ √2𝑔 ∙ tan
𝛼
2∙ 𝑊2.5 (7)
𝑄 =2
3∙ 𝐶 ∙ 𝑏 ∙ √2𝑔 ∙ 𝑊1.5 (8)
where
𝑄 = Discharge [m3/s]
𝐶 = Dimensionless coefficient
𝑏 = Width of the rectangular weir [m]
𝑔 = Acceleration due to gravity [m/s2]
𝛼 = Angle of weir crest (triangular weir)
𝑊 = Height of water column above weir crest [m]
When the weir-crest angle is 90o the weir is a Thompson weir (Shesha Prakash &
Shivapur, 2003).
3.2.4 Other methods
There are other techniques to measure water velocity as well, such as electromagnetic
current meter, tracer methods etc. that are not described in this report.
3.3 RATING CURVES
Most river-discharge data are based on stage measurements used in combination with an
approximated stage-discharge relationship: the so-called rating curve. The rating curve
is determined to simplify the collection of continuous time series of discharge data from
a specific river cross section. Discharge measurements are carried out for a number of
different stages at a control point, i.e. a cross section of a river or stream where it is
plausible to assume the existence of a unique, one-to-one stage-discharge relationship
(Figure 9). Rating curves are constructed by interpolating a number of contemporaneous
measurements of discharge and stages by using analytical expressions (Di Baldassarre
& Montanari, 2009), such as the power function:

13
𝑄 = 𝑎 ∙ (ℎ − 𝑏)𝑐 (9)
or a polynomial function:
𝑄 = 𝑎 ∙ ℎ + 𝑏 ∙ ℎ2 + 𝑐 ∙ ℎ3 (10)
where 𝑄 is the discharge, ℎ the stage and 𝑎, 𝑏 and 𝑐 are calibration parameters. SMHI
uses power functions and usually 1-2 equations for each rating curve. The parameters
are estimated by applying regression analysis. As a guideline, the function that
describes the highest stages should not have the 𝑐-value in (9) higher than 3.When the
function is established, the curve is extrapolated to zero discharge as the lowest and the
calculated maximum daily mean within 100 years as the highest. SMHI requires at least
seven measurements to build a new rating curve (Blomgren, 2013) although the
international standard recommends 12-15 measurements (ISO, 2010 b). At SMHI the
rating curves are calibrated by doing discharge measurements at their stations
periodically. How often these measurements are required is determined for each
gauging station. The frequency depends on the stability of the sill and the time elapsed
since the last measurement at that water stage (Eriksson Bram, 2014). WMO (World
Meteorological Organization) recommends a minimum of ten discharge measurements
per year (WMO, 2008).
In rivers with unstable banks, which are exposed to significant erosion as they transport
a lot of sediments, it is difficult to find a cross section that does not change with time. A
study under such conditions in Honduras explored the possibility of using time-variable
rating curves. They found that changing the parameters after every measurement
partially solved the problem of inaccurate rating curves, but that the lack of continuous
data to a high degree contributed to the inaccuracy of the estimation (Guerrero, et al.,
2012).

14
Figure 9. Example of a rating curve from SMHI. Water stage, W, is on the vertical axis
and river discharge, Q, is on the horizontal axis. The red circles with blue crosses show
the discharge measurements that are used to create the rating curve. The -·- and -··-
lines mark the intervals where the rating curve has been extrapolated.
3.3.1 Uncertainty in stage-discharge relationship
Discharge data are derived from stage measurement through a stage-discharge
relationship, as described in section 3.1. The uncertainty in the derived discharge can be
written as
𝑢2(𝑄𝑡) = 𝑢𝑅𝐶2 (𝑄) + 𝑢𝐻𝐶
2 (𝑄𝑡) + (𝜕𝑄
𝜕ℎ)
2
𝑢2(ℎ𝑡) (11)
where
𝑢𝑅𝐶2 (𝑄) is uncertainty related to the extrapolation of the rating curve to include high
and low flows,
𝑢𝐻𝐶2 (𝑄𝑡) is the uncertainty due to difficult conditions at the time of measuring such as
hysteresis, vegetation grows or change in geometry at the control section and
𝑢2(ℎ𝑡) is the uncertainty related to the stage measurement at the time of the
discharge measurement.
The conditions at the control section may vary during the year due to vegetation or
downstream boundary conditions and it may therefore be necessary to have different
rating curves for different time periods. It is also important to take into account the
uncertainty related to discharge measurement techniques used to establish the rating
curve (Le Coz, 2012).

15
Ideally stage should be constant while a discharge measurement is being conducted but
such conditions are rarely found in nature (Di Baldassarre & Montanari, 2009).
Therefore, uncertainty is established through identifying different sources to uncertainty
(WMO, 2008).
Hydrological measurements are not strictly random since each measurement depends on
previous values. Statistical analyses can reduce systematic and spurious error from data.
Although such analyses can improve data, taking precautions to ensure that data are
correct from the start will give more reliable results. Random errors can be
characterized with statistical analysis (WMO, 2008).
3.3.2 Three types of errors
There are three main types of errors in measured data; spurious, systematic and random.
Spurious errors are typically caused by human mistakes or equipment malfunctioning
and should be eliminated by discarding those values. Spurious errors can be identified
by an outlier test such as a box plot. Systematic errors cannot be reduced by making
more measurements. A systematic error can be that the measured value is continuously
two units higher than the true value. This can be caused by the instrument not being
properly adjusted or an instrument not suitable for the present conditions being used. If
the systematic error is known the measurements can be corrected. A random error,
unlike a systematic, can be reduced by increasing the number of measurements. More
measurements reduces the uncertainty in the computed mean value (Di Baldassarre &
Montanari, 2009).
4 MATERIAL AND METHODS
To explore which actors there are that carry out hydrological measurements, and how
they measure, several interviews were held via email or telephone. All contact with
actors was in Swedish. The following sections describe the interviewees and the
questionnaires used.
4.1 INTERVIEWEES
The interviews were carried out for the following target groups: water councils,
municipalities, counties and hydropower companies (Table 3). The interviewees were
contacted via email with an invitation to reply either by email or telephone. The water
councils were contacted through their coordinator, secretary or chairperson depending
on what contact information was available. The municipalities were contacted through
the water- and wastewater departments. In some cases the water- and wastewater
department referred to another department, mainly the department of environment and
health. In several areas two or more municipalities collaborated over the water- and
wastewater management. In those cases the shared organization was contacted. The
water authorities were contacted and through them the different counties. The last
group, the hydropower companies, were selected from the list of members in the trade
association Svensk energi - Swedenergy and companies that were referred to by other
actors.

16
Actors in all groups referred to other actors in their surroundings, such as paper- and
mining industry, government agencies, interest groups, fishery-management
organisations, consultants, and hydropower companies. These actors were placed in an
additional target group called Others (Table 3). If the actor had not replied within 2-4
weeks a second email was sent. Thereafter, no further attempts to contact the actor were
made due to the time limits of the project.
Table 3. Number of actors contacted in each target group
Water councils Municipalities Water
authorities
Hydropower
companies Others
100 288 5 29 25
A list of all contacted actors can be found in Appendix A – Contacted actors.
4.2 QUESTIONNAIRE
The actors were initially asked if they do any hydrological measurements. When the
answer was affirmative, a questionnaire was sent with more specific questions regarding
the measurements. The questionnaire had five sections. The first one was for contact
information for the interviewee and the second one contained general questions about
the measurements: reason for measuring, requirements of the data, inspections, review
of data etc. The third part concerned the measurement sites: name of the lake or stream,
catchment, coordinates etc. Section four contained questions about stage and discharge
measurements: technique, frequency, duration, collection of data, calibration etc. The
final part addressed rating curves.
4.2.1 The four different questionnaires
The original questionnaire was adapted in three different ways to make it easier to fill
in. This report refers to the original questionnaire as questionnaire 1. Questionnaire 2
only contained questions about water stage measurements, while questions about
discharge measurements were deleted. Questionnaire 3 was the same as the original
except for extra rows to fill in information about more than one measurement site. Most
adaptation was made for questionnaire 4. It was adapted to make it easier to fill in for
actors with many measurement sites. Hence, all questionnaire 4 were slightly different,
adapted for each actor. During the study it was discovered that a question about data
storage wold have benefitted the questionnaire. However, no further adaptations of the
questionnaire once the interviews had started. Questionnaire 1 can be found in
Appendix B – Questionnaire.
5 RESULTS
In total, 447 actors were contacted. Of these, 47 % replied that they did not measure or
that they did not know of any measurements (Table 4). From all the target groups, 51
actors answered the questionnaire fully or partly. The highest response rate was from
the water councils, however, out of the 66 that replied 64 councils stated that they did
not perform any measurements. 53 % of the municipalities replied and 20 % of those

17
answered the questionnaire. The answering municipalities were well distributed
throughout the country (Figure 10). The five different water authorities were asked to
forward the question to the county administrative boards and it is therefore the replies
from the county administrative boards that are shown in Table 4 marked with *. Of the
hydropower companies that replied half answered that they did not perform any
measurements and the other half answered the questionnaire.
Table 4. Actors contacted in the different target groups, number of answers in each
group and number of questionnaire answers
Water
councils Municipalities
Water
authorities
Hydropower
companies Others Total
Contacted 100 288 5 29 25 447
Total replies 66 165 6* 19 11 267
Answered no 64 134 4* 9 4 215
Questionnaire
answers 2 31 2* 10 7 52

18
From the questionnaire answers, 269 measurement sites are defined. Of the defined
sites, 113 had either information about coordinates and reference system or other
information about the site that was enough to identify them on a map (Figure 11). In
addition to the actors that answered the questionnaires, 97 site were described via email
from different actors who did not answer the questionnaire. The sites shown in Figure
11 are categorized based on target group. Two actors in the group Others gave enough
information to plot the sites on a map, Luleå University of Technology and
Vallentunasjöns fiskevårdsområdesförening. Their sites are marked with purple and
pink circles respectively The cluster of sites in South Baltic and Skagerakk & Kattegatt
show actors with many measurement sites located in a small area. Some of clusters of
yellow circles represent municipalities that have developed flood-monitoring systems
Figure 10. Swedish municipalities’ contact status shown by different-coloured areas. The
circles represent contacted hydropower companies and the squares other actors who were
contacted.

19
and therefore use hydrometric data as input in their models. The turquoise circles in
South Baltic represent Emåförbundet, a water council with 27 sites and the green cluster
in Skagerakk & Kattegatt represent Karlskoga Energi, a hydropower company with 58
sites. The blue circles in Bothnian Bay and Bothnian Sea, with the exception of the one
furthest to the north in Bothnian Bay, represent measurement sites that are part of the
liming program of the county administrative board of Västerbotten.
Figure 11. Hydrometric sites identified through questionnaires or email
communication.

20
A few identified sites are located very close to SMHI sites but the majority of the
identified sites are located in areas that are not covered by SMHI’s hydrometric
network. In all five districts there are sites located in the same rivers or streams as
SMHI gauging stations, both upstream and downstream, but there are also many actors
that measure in other streams and some in tributaries to rivers where SMHI measure.
Maps showing all sites, SMHI’s and the ones identified in this study can be found in
Appendix C – Measurement sites.
5.1 Reasons for measuring
The answer most frequently given to the question why the actors measure is that they
have a water-rights court ruling that requires it (Table 5). Other common answers were
related to management of water- and wastewater systems, flood monitoring, controlling
hydropower plants and managing drinking-water production. Not all answered the
question why and a few gave more than one answer. In those cases, all reasons are
presented in Table 5.
Table 5. Reasons the interviewed actors gave in the questionnaires for measuring
Reason Number of actors
Water-rights court ruling 20
Managing water- and wastewater systems 7
Managing flood risks 4
Control hydropower plants 5
Drinking water production 3
Control liming 2
Statistics of levels at high flow 2
For urban planning 1
Fishery 1
Research 2
Environmental protection & water quality 3
Sävsjö municipality in the south part of Sweden and the county administrative board in
Västerbotten were the two actors that gave liming control as their reason for measuring.
Nybro and Härjedalen municipalities also mentioned liming in emails but did not
answer the questionnaire. These two stated that they use a liming company that is active
in Kalmar, Kronoberg, Halland and Jämtland County.
5.2 Stage measurements
The techniques the actors used to measure stage can be sorted into three groups:
recording techniques, non-recording techniques and temporary/simple techniques (Table
6). 32 actors use recording techniques and the most common is pressure sensors. Nine
actors collect stage data by reading a staff gauge and four use a temporary measuring
device such as a folding ruler or a temporary staff. Some actors answered that they use
different techniques at different sites. In those cases all techniques are counted in Table
6.
21
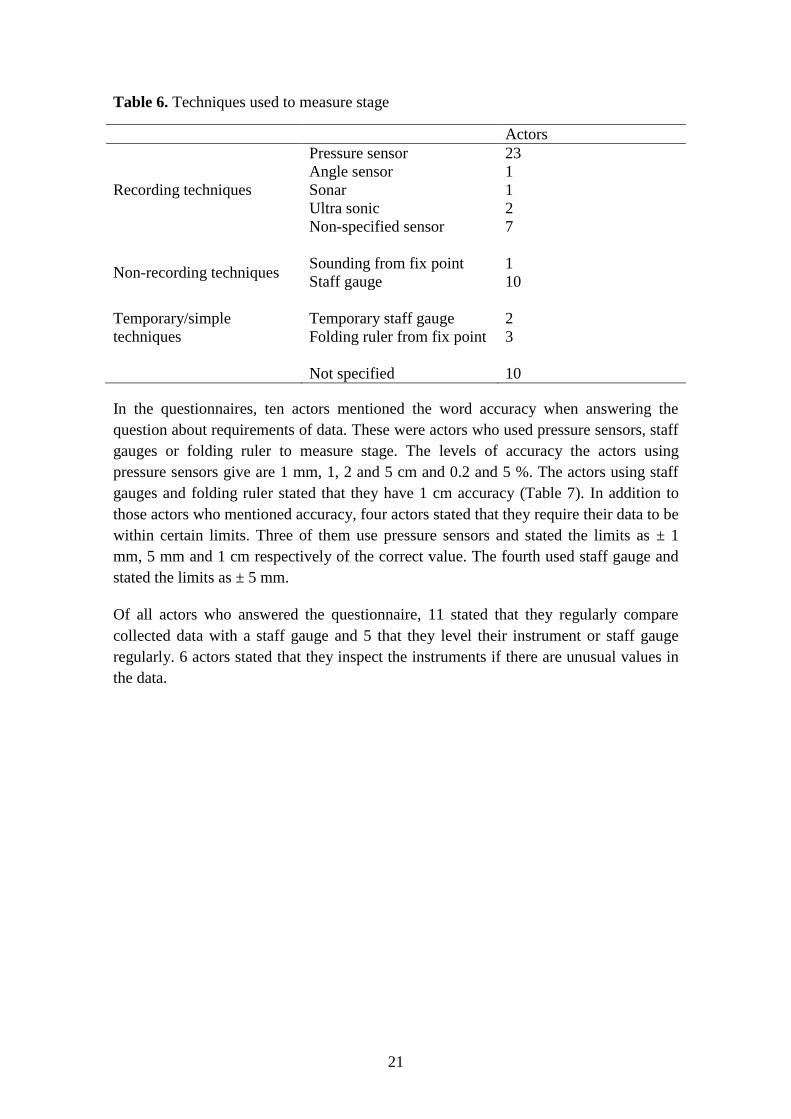
Table 6. Techniques used to measure stage
Actors
Recording techniques
Pressure sensor 23
Angle sensor 1
Sonar 1
Ultra sonic 2
Non-specified sensor 7
Non-recording techniques Sounding from fix point 1
Staff gauge 10
Temporary/simple
techniques
Temporary staff gauge 2
Folding ruler from fix point 3
Not specified 10
In the questionnaires, ten actors mentioned the word accuracy when answering the
question about requirements of data. These were actors who used pressure sensors, staff
gauges or folding ruler to measure stage. The levels of accuracy the actors using
pressure sensors give are 1 mm, 1, 2 and 5 cm and 0.2 and 5 %. The actors using staff
gauges and folding ruler stated that they have 1 cm accuracy (Table 7). In addition to
those actors who mentioned accuracy, four actors stated that they require their data to be
within certain limits. Three of them use pressure sensors and stated the limits as ± 1
mm, 5 mm and 1 cm respectively of the correct value. The fourth used staff gauge and
stated the limits as ± 5 mm.
Of all actors who answered the questionnaire, 11 stated that they regularly compare
collected data with a staff gauge and 5 that they level their instrument or staff gauge
regularly. 6 actors stated that they inspect the instruments if there are unusual values in
the data.

22
Table 7. Actors who have stated either an interval of accuracy or that they level their
instrument regularly
Actor Technique to
register stage
Stated
accuracy Control routines
Piteå Renhållning och
vatten Pressure sensor ± 5 % -
Luleå University of
Technology Pressure sensor - Levelling regularly
Falu energi Pressure sensor 5 cm Compare with staff gauge
Botkyrka municipality Staff gauge 1 cm -
Nybro municipality Pressure sensor 1 cm Compare with staff gauge
Oskarshamn municipality Staff gauge 1 cm Levelling after damage
Tranås municipality Folding ruler 1 cm -
Arvika municipality Pressure sensor ± 0.2 % Compare with staff gauge
Göteborg Vatten Pressure sensor ± 2 cm Levelling 3 times/year
Malungs Elverk Pressure sensor 1 mm Compare with staff gauge
Karlskoga Vattenkraft Pressure sensor - Levelling every 5 years
Vallentunasjön Fishery
organization Staff gauge -
Levelling several
times/year
5.3 Discharge measurements
Most answering actors, 94 %, measure stage in rivers, stream, lakes or dams. Of those,
20 % also measure water temperature and 30 % also keep a record of discharge. The
hydropower companies calculate discharge based on production, floodgate position and
stage. Two municipalities, Härnösand and Tyresö, use constructed controls where they
use stage measurements to derive discharge data. Härnösand also has a Thompson weir
that has a marking at the stage for the lowest accepted flow.
Kristianstad municipality, Kungsbacka municipality and Växjö together with Alvesta
municipalities use a flood-monitoring software developed by DHI. Their measurements
are input parameters in the flood modelling. Kungsbacka municipality has a stage-
discharge relationship based on three discharge measurements that they use to derive
discharge.
On the west coast three municipalities; Göteborg, Mölndal and Härryda have another
monitoring system for River Mölndalsån. The information is used for regulation of
dams along the river. Discharge from the larger dams is estimated based on calibrated
equations. Discharge is also measured using Doppler technique at two sites in the lower
part on the river.
23
Two actors, VA Syd (a water and wasterwater collaboration in Skåne) and the County
Administrative Board of Västerbotten, stated that they use rating curves that were not
very good. VA Syd also stated that they don’t have the resources to check the rating
curve.
6 DISCUSSION
This study focused on interviews with different types of actors who perform
hydrological measurements. The preparations for the interviews consisted of designing
the questionnaires and selecting actors to contact. Throughout the project, questions
regarding both processes came up; these are discussed in this section. Furthermore, the
results from the interviews were interoperated and are also discussed in this section.
6.1 THE METHOD
The approach of using email as the main form of communication was on the whole
successful. All actors were given the opportunity to reply via telephone if they wished
to and some did. Initially the plan was to contact the actors by phone. However, when
compiling the list of actors it was evident that such an approach would be too time
consuming.
6.1.1 Questionnaire design
The design of the questionnaire probably had an impact on the results. The most
noticeable was that many actors did not answer all the questions. A few of them
commented that they did not have the time, while others said that they answered all the
questions they knew how to answer.
The four versions of the questionnaire contained the same questions with the exception
of questionnaire 2 in which the questions about river discharge had been removed and
questionnaire 4 that was adapted for actors with many sites. Despite the adaptations in
questionnaire 4, none of the actors who received it answered all the questions.
Early in the interview process the choice was made not to edit the questionnaires further
during the project. The main reason was that it was desirable that all actors answered the
same questions to get comparable results. Another reason for not altering the
questionnaire was that, even though it could be seen that all questions were not
answered, it was not evident what types of changes would improve the questionnaire.
There were two topics that would have improved the results if they had been included in
the questionnaire: data storage and perception of accuracy. In all questionnaires, the
question “for how long have measurements been conducted?” was asked. A follow-up
question such as “for how long is data stored” would have added information relevant
for SMHI if and when they want to investigate the site further. The topic of perceived
accuracy would have enabled further analysis of difference between calculated and
perceived accuracy. The questionnaires as they were contained the question “what
requirement do you have of the data?”. It is difficult to interpret the answers since the
actors probably thought of different aspects when answering the questions. Some of

24
them answered with the accuracy for the instrument given by the manufacturer, while
others gave their estimations of the accuracy and yet others answered that they did not
have any defined requirements. Perhaps the results would have been clearer if a
question such as “What is the level of accuracy on your data?” had been added.
6.1.2 Who were contacted
The municipalities were the main focus when contacting actors. The first choice was to
contact the water- and wastewater departments. As mentioned in section 4.1 they
sometimes referred to other departments in which case those were contacted. However,
there were several cases when the person replying to the initial contact answered I don’t
know of any such measurements or similar. Since all initial emails included a question
such as To whom should I address this question, those replies were categorized as no-
answers. It is possible, however, that some of these municipalities do in fact measure
hydrological parameters, but the question was simply addressed to the wrong person.
The hydropower companies that were contacted were mainly found in the members list
of the trade association Svensk energi – Swedenergy. Svensk vattenkraftförening is
another hydropower trade association with members who are mainly small scale
hydropower companies and could have provided interesting information to this project.
Their members list is not accessible on their website and Svensk vattenkraftförening did
not reply to attempted contact. It would have been valuable for the results to have had
answers from their members as well.
Had there been more time, it would probably have been valuable to contact each of the
county administrative boards directly as well as through the water authorities. By not
receiving replies from them, some information about measurements related to liming
might have been missed.
6.2 THE RESULTS
Out of 447 contacted organizations, about half replied. Even though it was desirable to
receive as many replies as possible, the response rate is still satisfactory since none of
the actors had any obligations to participate in this study. The information collected in
this study about who does what (and where) is a good foundation for further inquiries
for SMHI. As mentioned in section 6.1.1, an alternative formulation of the question
about requirements or an additional question about accuracy could have improved the
possibility to analyse the perceived accuracy. Although only nine actors mentioned the
word accuracy when answering the requirement question, it is possible that others also
thought of their perceived accuracy when answering.
6.2.1 Perceived accuracy
The actors’ perception of the accuracy of their data varies from maximum error of 1 mm
to 5 cm for pressure sensors and 1 cm for staff gauges. To assess the accuracy in stage
measurements, it is necessary to have knowledge of levelling of the instruments.
Assuming that the measuring devices have been installed properly, controlling the
levelling is important to maintain a correct time series of data. 5 actors stated that they
level their instruments and 15 that they check automatically logged data against

25
readings of a staff gauge. These actions increase the level of certainty that the data is
correct. Moreover, further inquiries in how the accuracy was assessed would have given
more background to the analysis. One actor stated the accuracy given by the
manufacturer but without controlling the levelling of the instrument it doesn’t say much
about the true accuracy of the data.
The level of required accuracy depends on what the data is to be used for. Most of the
answering actors gave water-rights court ruling as the reason for measuring. Most
water-rights court ruling state limits that are specified to the centimetre which suggest
that an error margin of ± 5 mm is often sufficient. It is difficult to determine the level of
accuracy required for controlling hydropower plants or flood monitoring since those
practices have not been studied in this project. Regardless of reason for measuring,
being aware of what level of accuracy is required and having a strategy for maintaining
it is important.
Only a few actors measured discharge and they gave various views of the accuracy. The
actors that commented on accuracy in discharge observations were either not content
with the rating curves they had or thought it too complicated to make additional
discharge measurements to improve them. The actors who expressed concern about
their rating curves were probably more realistic in their perception of accuracy then
those who stated that they did not check their stage-discharge relationship to make sure
it is still correct. To base a stage-discharge relationship on only three discharge
measurements opens for significant uncertainty, especially at high- and low water
stages. Discharge data are valuable and it would be desirable that these actors received
support in their efforts to produce discharge data.
6.2.2 Reasons for measuring
The reasons for measuring can be sorted into two categories; proactive and reactive.
Measuring to maintain the stage within set limits is a reaction to water-rights court
ruling. The proactive reasons can also be categorized with regards to what the
knowledge intends to benefit: the environment or society. Measuring to control liming
or to make sure there is enough water in the recipient to storm water are actions that
intend to serve the environment whereas flood monitoring and collecting data for urban
planning are for the benefit of people and the built structures.
6.2.3 Cooperation and coordination
Several municipalities have collaborated with hydropower companies to receive stage
and discharge information and some have built monitoring systems together with other
municipalities. There could be a lot to gain for municipalities connected by a river by
sharing hydrological information. Some already do this through water councils, but
more cooperation and exchange of information would improve the knowledge of
hydrological measurements. In small organizations it is difficult to maintain high
competence regarding hydrological measurements, which in many cases makes the
uncertainty unnecessarily high. By coordinating measurements performed by different
actors, some of the errors could be limited.

26
The measurement sites identified in this study are generally quite far from each other
and none of the actors have sites located in the same rivers or streams. However, many
municipalities did not reply and still others answered that they do not perform any
hydrological measurements. It is therefore possible that there are actors who could
benefit from each other’s hydrometric activities. Storing data at SMHI could be a way
to achieve more coordination of measurements.
The municipalities invest in measuring systems without knowing how accurate their
data is. By coordinating with other departments in the municipality and with other
similar organizations the data could come to use to more purposes. Another important
aspect of the investment the municipalities make is the storing of data. To evaluate the
measurements or to expand the use of the data, long time series are vital. Data are
valuable and it takes investment and maintenance to store it in a way that it is still
accessible.
7 CONCLUSIONS
Many municipalities, companies, interest groups and other actors were willing to
contribute to this inventory. 59 % of the contacted actors replied and 80 % of them
answered that they do not perform any measurements. The remaining 20 % answered
that they do measure and hence answered the questions in the questionnaire.
The most common reason for measuring is to maintain the given upper- and lower stage
limits given in water-rights court rulings. Other reasons were: control of hydropower
plants, management of water- and wastewater systems, and flood monitoring.
Only a few actors were found that collect discharge data, and none of them measure
discharge regularly to calibrate their stage-discharge relationship. However, two actors
expressed a wish to improve their rating curves.
By storing collected data the actors would enable expansion of the use of field
observations. There is also a lot to gain by a better coordination of the measurements
performed by different actors in terms of competence and knowledge of hydrological
measurements.
Continued attempts to obtain replies from all contacted actors would give a more
complete overview of the present situation. Especially, contact with the members of
Svensk vattenkraftförening would allow a better inventory of the hydrological
measurements performed by small-scale hydropower companies. A supplementing
approach for continued study would be to make further inquiries into the activities of
the actors who answered that they do hydrometric measurements. Such studies would
give a deeper understanding of the reasons behind measuring and the actions taken to
maintain accuracy.

27
BIBLIOGRAPHY
Blomgren, K., 2013. Instruktion - Ta fram, godkänna och lagra en ny
avbördningskurva, Norrköping: SMHI.
Di Baldassarre, G. & Montanari, A., 2009. Uncertainty in river discharge observations:
a quantitative analysis. Hydrology and Earth System Sciences, Issue 13, pp. 913-921.
European Parliament & Counil of the European Union, 2000. Directive 2000/60/EC.
Brussels: Official Journal of the European Communities.
Guerrero, J.-L.o.a., 2012. Temporal variability in stage-discharge relationships. Journal
of Hydrology, Volym 446-447, pp. 90-102.
ISO, 2007. 748 Hydrometry - Measurement of liquid flow in open channels using
current-meters or floats, Geneva: ISO.
ISO, 2010 a. 15769 Hydrometry - Guidelines for theapplication of acoustic velocity
meters using the Doppler and echo correlation methods, Geneva: ISO.
ISO, 2010 b. 1100-2 Hydrometry - Measurement of liquid flow in open channels - Part
2: Determination of the stage-discharge relationship, Geneva: ISO.
Jonsson, C. & Lennermark, M., 2009. Flowtracker för användning på SMHI
Observationsenhet. Norrköping: SMHI.
Le Coz, J., 2012. A literature review of methods for estimating the uncertainty
associated with stage-discharge relations - Draft version, u.o.: World Meteorological
Oranization.
Levesque, V. A. & Oberg, K. A., 2012. Computing discharge using the index velocity
method. i: U.S. Geoogical Survey Techniques and Methods 3. Reston, Virginia: U.S.
Geological Survey, p. 148.
Länsstyrelsen Västernorrland, 2014. Svensk vattenförvaltning/vattendirektivet. [Online]
Available at: http://www.lansstyrelsen.se/vasternorrland/Sv/miljo-och-klimat/vatten-
och-vattenanvandning/svensk-vattenforvaltning-vattendirektivet/Pages/default.aspx
[Used 15 September 2014].
Marklund, H. & Westman, S.-E., 2008. Handledning: Vattenföringsbestämning inom
miljöövervakning, Stockholm: Naturvårdsverket.
Mueller, D. S. & Wagner, C. R., 2009. Measuring Discharge with Acoustic Doppler
Current Profilers from a Moving Boat. i: Techniques and Methods book 3. u.o.:U.S
Geological Survey, p. 72.
Nyman, S. & Lennermark, M., 2013. Flödesmätningar med hydroakustik. Norrköping:
SMHI.

28
Pelletier, P. M., 1988. Uncertainties in the determination of river discharge: a literature
review. Canadian Journal of civil engineering, 15(5), pp. 834-850.
Sandehed, G., 2013. Instruktion för inspektion av peglar. Norrköping: SMHI.
Scholz, C., 2011. Examensarbete Juristprogrammet: Vattenförvaltning i Sverige och
Alsterån. Överensstämmer äldre vattenrättliga tillstånd med nutidens miljökrav?,
Uppsala: Department of Law, Uppsala University.
Shesha Prakash, M. N. & Shivapur, A. V., 2003. Flow over inclined sharp crested
triangular weir. ISH Journal of Hydraulic Engineering, 9(2), pp. 80-88.
SIS, 2008. Hydrometry - Water level measuring devices (ISO 4373:2008), Stockholm:
SIS, Swedish Standard Institute.
SMHI, 2012. Huvudavrinningsområden SVAR 2012_2. Norrköping: SMHI.
SMHI, 2013. Vattenföring. [Online]
Available at: http://www.smhi.se/klimatdata/hydrologi/vattenforing
[Used 17 September 2014].
Turnipseed, D. & Sauer, V., 2010. Discharge measurement at gauging stations. in:
Techniques and Methods book 3. Reston, Virginia: U.S. Geological Survey, p. 87.
Tutor Vista, 2014. Doppler shift formula. [Online]
Available at: http://formulas.tutorvista.com/physics/doppler-shift-formula.html
[Used 17 September 2014].
Vattenmyndigheten Bottenviken, 2014. Vattenråd. [Online]
Available at: http://www.vattenmyndigheterna.se/Sv/bottenviken/deltagande-och-
dialog/vattenrad/Pages/default.aspx
[Used 15 September 2014].
Vattenmyndigheterna, 2014. Vattenmyndigheterna. [Online]
Available at: http://www.vattenmyndigheterna.se/En/Pages/default.aspx
[Used 15 September 2014].
White, W. R., 2014. The Measurement of Free Surface Flows - A Review of Current
Knowledge, Marlow: Foundation for Water Research.
WMO, 2008. Guide to Hydrological Practices. 6 red. Geneva: World Meteorological
Organization.
WMO, 2010. Manual of stream gauging - Volume 1 - Fieldwork, Geneva: World
Meteorologial Organization.
PERSONAL COMMUNCATIONS
Eriksson Bram, Lena, 2014. Hydrologist at SMHI. [email protected]

29
Appendix A – Contacted actors
Table A- 1. The contacted municipalities. Those marked with green replied to the
questionnaire, those marked with yellow gave some information via email and those
marked with red replied that they do not make any hydrological measurements
Ale kommun Färgelanda kommun Karlshamns kommun
Alingsås kommun Gagnefs kommun Karlskoga kommun
Alvesta kommun Gislaveds kommun Karlskrona kommun
Aneby kommun Gnesta kommun Karlstads kommun
Arboga kommun Gnosjö kommun Katrineholms kommun
Arjeplogs kommun Grums kommun Kils kommun
Arvidsjaurs kommun Grästorps kommun Kinda kommun
Arvika kommun Gullspångs kommun Kiruna kommun
Askersunds kommun Gällivare kommun Klippans kommun
Avesta kommun Gävle kommun Knivsta kommun
Bengtsfors kommun Göteborgs kommun Kramfors kommun
Bergs kommun Götene kommun Kristianstads kommun
Bjurholms kommun Habo kommun Kristinehamns kommun
Bjuvs kommun Hagfors kommun Krokoms kommun
Bodens kommun Hallsbergs kommun Kumla kommun
Bollebygds kommun Hallstahammars kommun Kungsbacka kommun
Bollnäs kommun Halmstads kommun Kungsörs kommun
Borgholms kommun Hammarö kommun Kungälvs kommun
Borlänge kommun Haninge kommun Kävlinge kommun
Borås kommun Haparanda kommun Köpings kommun
Botkyrka kommun Heby kommun Laholms kommun
Boxholms kommun Hedemora kommun Landskrona kommun
Bromölla kommun Helsingborgs kommun Laxå kommun
Bräcke kommun Herrljunga kommun Lekebergs kommun
Burlövs kommun Hjo kommun Leksands kommun
Båstads kommun Hofors kommun Lerums kommun
Dals-Eds kommun Huddinge kommun Lessebo kommun
Danderyds kommun Hudiksvalls kommun Lidingö kommun
Degerfors kommun Hultsfreds kommun Lidköpings kommun
Dorotea kommun Hylte kommun Lilla Edets kommun
Eda kommun Håbo kommun Lindesbergs kommun
Ekerö kommun Hällefors kommun Linköpings kommun
Eksjö kommun Härjedalens kommun Ljungby kommun
Emmaboda kommun Härnösands kommun Ljusdals kommun
Enköpings kommun Härryda kommun Ljusnarsbergs kommun
Eskilstuna kommun Hässleholms kommun Lomma kommun
Eslövs kommun Höganäs kommun Ludvika kommun
Essunga kommun Högsby kommun Luleå kommun
Fagersta kommun Hörby kommun Lunds kommun
Falkenbergs kommun Höörs kommun Lycksele kommun
Falköpings kommun Jokkmokks kommun Lysekils kommun
Falu kommun Järfälla kommun Malmö kommun
Filipstads kommun Jönköpings kommun Malung-Sälens kommun
Finspångs kommun Kalix kommun Malå kommun
Flens kommun Kalmar kommun Mariestads kommun
Forshaga kommun Karlsborgs kommun Markaryds kommun

30
Marks kommun Skövde kommun Upplands Väsby kommun
Melleruds kommun Smedjebackens kommun Upplands-Bro kommun
Mjölby kommun Sollefteå kommun Uppsala kommun
Mora kommun Sollentuna kommun Uppvidinge kommun
Motala kommun Solna kommun Vadstena kommun
Mullsjö kommun Sorsele kommun Vaggeryds kommun
Munkedals kommun Sotenäs kommun Valdemarsviks kommun
Munkfors kommun Staffanstorps kommun Vallentuna kommun
Mölndals kommun Stenungsunds kommun Vansbro kommun
Mönsterås kommun Stockholms kommun Vara kommun
Mörbylånga kommun Storfors kommun Varbergs kommun
Nacka kommun Storumans kommun Vaxholms kommun
Nora kommun Strängnäs kommun Vellinge kommun
Norbergs kommun Strömstads kommun Vetlanda kommun
Nordanstigs kommun Strömsunds kommun Vilhelmina kommun
Nordmalings kommun Sundbybergs kommun Vimmerby kommun
Norrköpings kommun Sundsvalls kommun Vindelns kommun
Norrtälje kommun Sunne kommun Vingåkers kommun
Norsjö kommun Surahammars kommun Vårgårda kommun
Nybro kommun Svalövs kommun Vänersborgs kommun
Nykvarns kommun Svedala kommun Vännäs kommun
Nyköpings kommun Svenljunga kommun Värmdö kommun
Nynäshamns kommun Säffle kommun Värnamo kommun
Nässjö kommun Säters kommun Västerviks kommun
Ockelbo kommun Sävsjö kommun Växjö kommun
Olofströms kommun Söderhamns kommun Ydre kommun
Orsa kommun Söderköpings kommun Ystads kommun
Orusts kommun Södertälje kommun Åmåls kommun
Osby kommun Sölvesborgs kommun Ånge kommun
Oskarshamns kommun Tanums kommun Åre kommun
Ovanåkers kommun Tibro kommun Årjängs kommun
Oxelösunds kommun Tidaholms kommun Åsele kommun
Pajala kommun Tierps kommun Åstorps kommun
Partille kommun Timrå kommun Åtvidabergs kommun
Perstorps kommun Tingsryds kommun Älmhults kommun
Piteå kommun Tjörns kommun Älvdalens kommun
Ragunda kommun Tomelilla kommun Älvkarleby kommun
Robertsfors kommun Torsby kommun Älvsbyns kommun
Ronneby kommun Torsås kommun Ängelholms kommun
Rättviks kommun Tranemo kommun Öckerö kommun
Sala kommun Tranås kommun Ödeshögs kommun
Salems kommun Trelleborgs kommun Örebro kommun
Sandvikens kommun Trollhättans kommun Örkelljunga kommun
Sigtuna kommun Trosa kommun Örnsköldsviks kommun
Simrishamns kommun Tyresö kommun Östersunds kommun
Sjöbo kommun Täby kommun Österåkers kommun
Skara kommun Töreboda kommun Östhammars kommun
Skellefteå kommun Uddevalla kommun Östra Göinge kommun
Skinnskattebergs kommun Ulricehamns kommun Överkalix kommun
Skurups kommun Umeå kommun Övertorneå kommun

31
Table A- 2. The contacted water councils in Bothnian Bay water district. Those marked
with red replied that they do not make any hydrological measurements
Water Councils – Bothnian Bay
Tornedalens Vattenparlament (VPO1) Mellanbygdens vattenråd (VRO9)
Sangisälvens och Keräsjoki VR (VRO2) Ume-och Vindelälvens vattenråd (VRO10)
Kalix- och Töreälvens vattenråd (VRO3) Södra Västerbottens vattenråd (VRO11)
Råne-/Luleälvens vattenråd (VRO4) Norra Bottenvikens kustvattenråd (VRO12)
Fyrkantens vattenråd (VRO5) Södra Bottenvikens kustvattenråd (VRO13)
Piteälvens vattenråd (VRO6) Ume-Vindelälvens vattenvårdsförbund
Åby,-Byske-och Kågeälven VR (VRO7) Torne- & Kalix älvars vattenvårdsförbund
Skellefteälvens vattenråd (VRO8)
Table A- 3. The contacted water councils in Bothnian Seas water district. Those marked
with red replied that they do not make any hydrological measurements
Water Councils – Bothnian Sea
Ljusnan och Voxnans
vattenvårdsförbund
Ljusnan och Hälsinglands skogs- och
kustvattenråd
Dalälvens Vattenvårdsförening Ångermanälven och Vapstälvens vattenråd
Table A- 4. The contacted water councils in North Baltic water district. Those marked
with yellow gave some information via email and those marked with red replied that
they do not make any hydrological measurements
Water Councils – North Baltic
Arbogaåns vattenförbund Nyköpingsåarnas Vattenvårdsförbund
Bällstaån Stockholms Vattenprogram
Tyresåns vattenvårdsförbund Trosaåns vattenvårdsförbund
Oxundaåns vattenvårdsprojekt Hjälmarens Vattenvårdsförbund
Mälarens vattenvårdsförbund Kolbäcksåns Vattenförbund
Sagåns Vattenråd Himmerfjärdens och Kaggfjärdens
Vattenråd

32
Table A- 5. The contacted water councils in Skagerakk & Kattegatt water district.
Those marked with yellow gave some information via email and those marked with red
replied that they do not make any hydrological measurements
Water Counils – Skagerakk & Kattegatt
Bohuskustens vattenvårdsförbund Mölndalsåns vattenråd
Bohuskustens vattenråd, VRBK Nissans Vattenråd
Bäveåns Vattenråd Norsälvens vattenråd
Dalbergså och Holmsåns Vattenråd Ringsjöns vattenråd
Dalslandskanals vattenråd Rönneåns vattenråd
Enningdalsälvens Vattenråd Strömsåns/Strömstads Vattenråd
Gullmarns Vattenråd Suseåns Vattenråd
Gullspångsälvens Vattenvårdsförbund Säveåns vattenråd
Göta älvs vattenråd Tidans Vattenförbund/Vattenråd
Göta älvs vattenvårdsförbund Vegeåns Vattendragsförbund
Klarälvens vattenråd Viskans vattenråd
Kungsbackaåns vattenvårdsförbund Vänerns sydöstra tillflöden
Lagans vattenråd Ätrans Vattenråd
Table A- 6. The contacted water councils in South Baltic water district. Those marked
with green answered the questionnaire and those marked with red replied that they do
not make any hydrological measurements
Water Councils – South Baltic
Alsteråns Vattenråd Tullstorpsåprojektet
Bruatorpsån-Grisbäcken-Brömsebäcken Rååns vattendragsförbund
Bräkneåns Vattenråd Alnarpsströmmen Sammarbetskommittén
Emåförbundet Saxån Braåns vattenvårdskommitté
Gotlands vattenråd Segeåns Vattendragsförbund och Vattenråd
Hagbyåns och Halltorpsåns Vattenråd Skivarpsåns och Dybäcksåns
vattendragsförbund
Helge å Kommittén för samordnad
kontroll
Skräbeåns vattenråd
Helgeåns Vattenråd Snärjebäcken, Törnebybäcken, Åbyån-
Surrebäcken och Nävraån-Danesjökanalen
Ivösjökommitten Svarteåns Vattenråd
Höje å Vattenråd Stångåns Vattenråd
Kalmar läns kustvattenkommitté Sydkustens vattenvårdsförbund
Kävlingeåns vattenvårdsförbund Trelleborgs åar
Kävlingeåns Vattenråd Hanöbukten, Vattenvårdsförbundet för
Västra Hanöbukten
Ljungbyåns Vattenråd Vegeåns vattendragsförbund
Lyckebyåns vattenförbund Vellingebäckarna
Motala ströms vattenvårdsförbund Västar Gotlands Vattenråd
Motala ströms sydvästra vattenråd Vätternvårdsförbundet
Nedre Motala ströms och Bråvikens
vattenråd Ölands Vattenråd
Mörrumsåns Vattenråd Öresunds vattenvårdsförbund
Norra Gotlands Vattenråd Österlens vattenråd
Norra Möre Vattenråd Östra Gotlands vattenråd
Nybroån, Kabusaån och Tyge å
Vattenråd

33
Table A- 7. The contacted hydropower companies. Those marked with green answered
the questionnaire, those marked with yellow gave some information via email and those
marked with red replied that they do not make any hydrological measurements
Hydropower Companies
Bodens Energi AB Malungs Elverk AB
Borlänge Energi AB Mjölby-Svartådalen Energi AB
Brittedal Elnät ek för Nässjö Affärsverk AB
Edsbyns Elverk AB Olofströms Kraft Nät AB
Envikens Elkraft ek för Sandviken Energi AB
Falkenberg Energi AB Skellefteå Kraft AB
Falu Energi & Vatten AB Skånska Energi AB
Gislaved energi Smedjebacken Energ AB
Hamra Kapellags Besparingsskog Strömfallet AB
Holmen Energi AB Tidaholms Energi AB
Jönköping Energi AB Tived Energi
Karlskoga Energi & Miljö AB Umeå Energi AB
Linde Energi AB VB Energi
Ljungby Energi AB Ålem Energi AB
Ljusdal Energi AB
Table A- 8. The other actors who were contacted. Those marked with green answered
the questionnaire and those marked with red replied that they do not make any
hydrological measurements
Other Actors
Mälarhamnar Stockholms Universitet
Vallentunasjöns
fiskevårdsområdesförening Snoderåns vattenråd
Angarngruppen Kågeälvens nedre FVO
Svensk vattenkraftförening Ekologgruppen i Landskrona
Vansjö-Nordsjöns väl Moelven Valåsen ab
Tämnaren vatten FOI
LKAB Stora Enso Nymölla
Boliden Luleå Tekniska Universitet
Alcontrol Mölndals kvarnby
Dalslands kanal
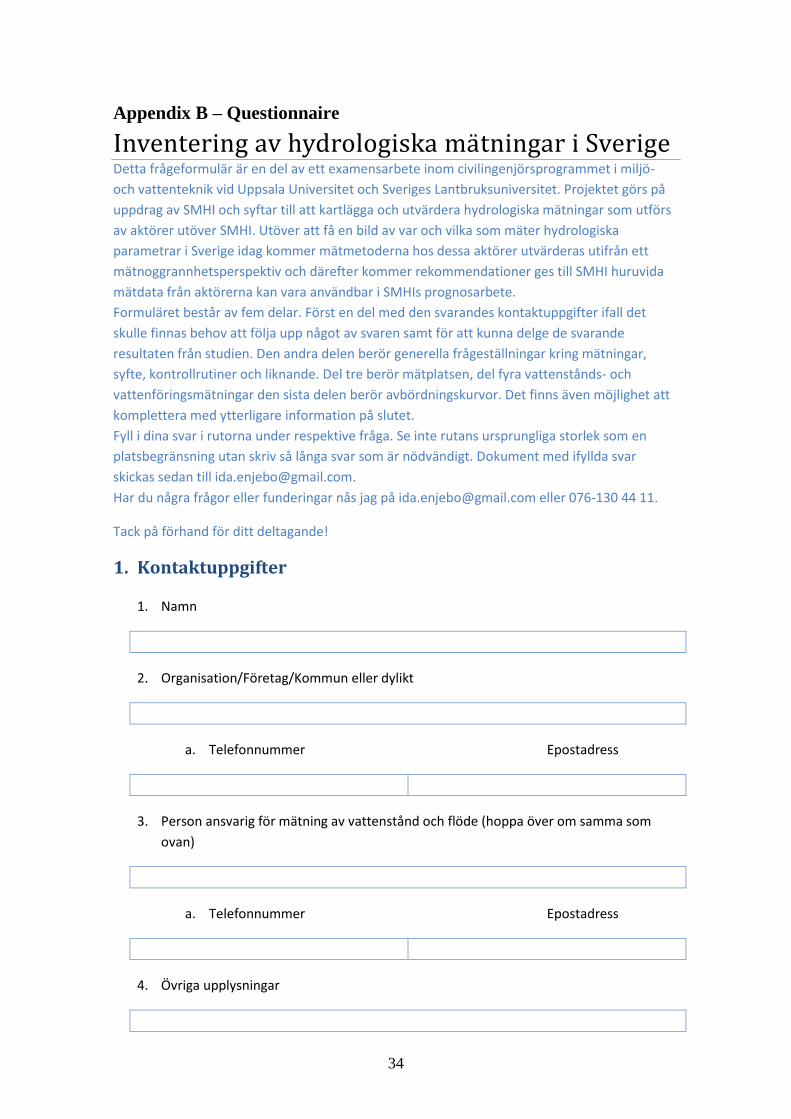
34
Appendix B – Questionnaire
Inventering av hydrologiska ma tningar i Sverige Detta frågeformulär är en del av ett examensarbete inom civilingenjörsprogrammet i miljö-
och vattenteknik vid Uppsala Universitet och Sveriges Lantbruksuniversitet. Projektet görs på
uppdrag av SMHI och syftar till att kartlägga och utvärdera hydrologiska mätningar som utförs
av aktörer utöver SMHI. Utöver att få en bild av var och vilka som mäter hydrologiska
parametrar i Sverige idag kommer mätmetoderna hos dessa aktörer utvärderas utifrån ett
mätnoggrannhetsperspektiv och därefter kommer rekommendationer ges till SMHI huruvida
mätdata från aktörerna kan vara användbar i SMHIs prognosarbete.
Formuläret består av fem delar. Först en del med den svarandes kontaktuppgifter ifall det
skulle finnas behov att följa upp något av svaren samt för att kunna delge de svarande
resultaten från studien. Den andra delen berör generella frågeställningar kring mätningar,
syfte, kontrollrutiner och liknande. Del tre berör mätplatsen, del fyra vattenstånds- och
vattenföringsmätningar den sista delen berör avbördningskurvor. Det finns även möjlighet att
komplettera med ytterligare information på slutet.
Fyll i dina svar i rutorna under respektive fråga. Se inte rutans ursprungliga storlek som en
platsbegränsning utan skriv så långa svar som är nödvändigt. Dokument med ifyllda svar
skickas sedan till [email protected].
Har du några frågor eller funderingar nås jag på [email protected] eller 076-130 44 11.
Tack på förhand för ditt deltagande!
1. Kontaktuppgifter
1. Namn
2. Organisation/Företag/Kommun eller dylikt
a. Telefonnummer Epostadress
3. Person ansvarig för mätning av vattenstånd och flöde (hoppa över om samma som
ovan)
a. Telefonnummer Epostadress
4. Övriga upplysningar

35
2. Generellt
5. Vilka paratetrar mäter ni?
Vattenföring, vattenstånd, vattentemperatur, vattenhastighet, snödensitet mm.
6. Varför mäter ni?
7. Vilka krav ställer ni på mätdata?
8. Hur inspekteras/underhålls utrustning och mätplatsen?
9. Hur granskas data som samlas in?
10. Utförs kontrollmätningar?
Om ja, hur och hur ofta? Om nej, varför inte?
11. Utförs kalibrering av mätutrustning och avbördningskurva?
Om ja, hur och hur ofta? Om nej, varför inte?
3. Mätplatser Om ni har fler än en mätplats, besvara då frågorna för platserna i de olika numrerade rutorna
för att hålla isär informationen. Om informationen är den samma för samtliga platser behöver
det bara skrivas en gång, men kommentera gärna att så är fallet. Om ni har fler än fyra
mätplatser går det jättebra att lägga till fler rader.
12. Parameter som mäts
1.
2.
3.
4.
13. Vattendragets namn
1.
2.

36
3.
4.
14. Huvudavrinningsområde alternativt ett större vattendraget som detta vattendrag
mynnar i
1.
2.
3.
4.
15. Namn på platsen där mätningarna sker
1.
2.
3.
4.
16. Kordinater för mätplatsen Referenssystem
Om detta inte finns, hoppa över.
1.
2.
3.
4.
17. Annan upplysning om platsen – adress till närliggande fastighet, riktmärken eller dylikt.
1.
2.
3.
4.
18. Hur valdes platsen? Vilka kriterier sattes upp inför val av plats?
1.
2.
3.
4.
19. Övriga upplysningar om platsen?
1.
2.
3.
4.

37
4. Vattenstånds- och vattenföringsmätningar
20. Utför ni vattenståndsmätningar?
Ja, enbart vattenstånd, ja, för att räkna ut flödet eller nej
1.
2.
3.
4.
21. Hur länge har mätningar pågått?
Ange även eventuella uppehåll, t.ex. ”1999-2001 samt 2004-2014”.
1.
2.
3.
4.
22. Vilken teknik används för att registrera vattenståndet?
1.
2.
3.
4.
23. Vilken är mätfrekvensen?
Är det alltid samma mätfrekvens eller olika beroende på årstid eller dylikt?
1.
2.
3.
4.
24. Vilken är insamlingsfrekvensen?
1.
2.
3.
4.
25. Hur sker insamlingen?
1.
2.
3.
4.

38
26. Finns det en bestämmande sektion på platsen – konstgjord eller naturlig tröskel?
1.
2.
3.
4.
27. Finns det objekt i vattnet nedström mätplatsen som kan verka dämmande vid
mätplatsen? Vad är det, i vilka situationer är det dämmande och hur långt från
mätplatsen ligger det?
1.
2.
3.
4.
28. Vilken teknik används för att mäta flödet?
1.
2.
3.
4.
29. Hur ofta sker kontrollmätningar av flödet?
1.
2.
3.
4.
30. Vilka är rutinerna för underhåll av mätinstrumenten?
1.
2.
3.
4.
31. Övrigt angående vattenföringsmätningar
1.
2.
3.
4.

39
5. Avbördningskurvan
32. Använder ni en avbördningskurva för att beräkna vattenföring från
vattenståndsmätningar?
1.
2.
3.
4.
33. Hur många mätningar ligger till grund för avbördningskurvan?
1.
2.
3.
4.
34. Har avbördningskurvan uppdaterats sedan den skapades?
Om ja, när? Varför? Om nej, varför inte?
1.
2.
3.
4.
35. Övrigt angående avbördningskurva
1.
2.
3.
4.
6. Övrigt 36. Övriga upplysningar

40
Appendix C – Measurement sites
Figure C- 1. Bothnian Bay water districts and identified measurement sites.

41
Figure C- 2. Bothnian Sea water districts and identified measurement sites.

42
Figure C- 3. North Baltic water districts and identified measurement sites.

43
Figure C- 4. South Baltic water districts and identified measurement sites.

44
Figure C- 5. Skagerakk & Kattegatt water districts and identified measurement sites.