inventory, it investment, and profitability: empirical evidence using industry … · ·...
TRANSCRIPT

Inventory, IT Investment, and Profitability: Empirical Evidence using Industry Groups
Rachna Shah Department of Operations and Management Science
Carlson School of Management University of Minnesota Minneapolis, MN 55455
612-624-4432 [email protected]
Hojung Shin*
Department of Management and Administrative Sciences Mendoza College of Business
University of Notre Dame Notre Dame, IN 46556
574-631-9021 [email protected]
June 1, 2004
* Corresponding Author Copyright © 2004.

Inventory, IT Investment, and Profitability: Empirical Evidence using Industry Groups
Abstract
This research investigates relationships among IT investment, inventory
performance, and financial performance to find the empirical evidence for the theory
that operational excellence in inventory management and relevant IT investment
enhance profitability in the long run. Using ANOVA, post hoc analysis, and
hierarchical regression, we analyze longitudinal data at the industry group level
(manufacturing, wholesale trading, and retail trading sectors) to examine inventory
trends during the last four decades, effect of IT investment on inventory performance,
and effect of IT investment on the relationship between inventory performance and
financial performance. The results indicate that 1) inventory levels have decreased
in the manufacturing sector but increased in the wholesale and retail sectors over the
last four decades; 2) increased IT investment has a positive influence on inventory
reduction in manufacturing and retail sectors; and 3) a lower inventory level is
beneficial to improving firms’ profitability. However, the positive influence of IT
investment on financial performance appears indirect and mediated by inventory
performance.
Keywords: Inventory; IT investment; Longitudinal Analysis; Hierarchical Regression
1

Inventory, IT Investment, and Profitability: Empirical Evidence using Industry Groups
1. Introduction
Firms have been trying to reduce their inventory levels for decades. The
principal focus of resource planning tools such as Material Requirements Planning
(MRP) introduced in the 1970s and Enterprise Resource Planning (ERP) in the 1990s
was on providing timely signals for efficient management of inventories and material
flows (Benton and Shin, 1998). Moreover, increased focus on operational efficiency
exemplified by Toyota Motor Company’s lean production system and its extensive
implementation in the United States has intensified emphasis on reducing inventories.
More recently, inventory reduction efforts of independent firms have been integrated,
leveraged by rapid progress of supply chain management.
Yet, it is rather surprising that little empirical evidence exists to support the
conventional wisdom that inventory levels have reduced significantly over time in
the US. Anecdotal evidence also suggests that inventory reduction may improve
financial performance, but this relationship is even less established empirically.
Lack of strong empirical support in the literature could be associated with challenges
in longitudinal data collection. Indeed, collecting historical inventory and financial
data at the business unit or firm level requires a great deal of time and expenses.
Examining inventory trend and its impact on financial performance is further
complicated by the rapid deployment of information technology (IT). IT allows a
firm to acquire, share, and disseminate information of customer orders and inventory
positions within the firm and across its business partners outside the firm. Such
2

facilitation of information sharing by IT should help manage inventories more
effectively and streamline operations, leading to a greater impact on financial
performance. However, to our knowledge, empirical evidence to support the
contention that IT affects the relationship between inventory performance and
financial performance does not exist.
In an attempt to resolve these issues, this research evaluates relationships
among three interrelated constructs – inventory performance, financial
performance and investment in information technology, using longitudinal
industry group level data provided by the Bureau of Economic Analysis (BEA).
There are three industry groups under investigation, including manufacturing,
wholesale trading, and retail trading industry groups. Our rationale for conducting
analysis at the industry group level is that if individual companies in an industry
benefit from improved inventory performance and IT investment, we should be able
to find evidence for it at a macro industry group level. Inventory performance of
each industry group was measured as inventory-to-sales ratio, financial performance
as profit-to-sales ratio (profitability), and IT investment as relative rate of increase
in IT investment ratio.
For the sake of brevity and clarity, we use the term “sector” instead of
“industry group” in the rest of the paper. The terms, “industry group” and “sector”
are often used interchangeably in the economic reports created by BEA and the US
Census Bureau. Specifically, we examine the following research questions:
1) Have inventory levels decreased significantly in the manufacturing,
wholesale, and retail sectors over the last four decades?
3

2) How has IT investment affected inventory performance of the manufacturing,
wholesale, and retail sectors over the last four decades?
3) How have IT investment and inventory performance affected the financial
performance in the manufacturing, wholesale, and retail sectors?
We acknowledge the importance of finding specific causes that lead to
improvement in inventory performance and an increase in IT investment. However,
we do not specifically examine them in the present study. Instead, the main
objective is to empirically examine the nature of relationships among the three
constructs, and to find preliminary support for the theory that a managerial focus on
operational excellence measured as inventory performance supported by relevant
investment in IT enhances financial performance in the long run. We use ANOVA
and hierarchical regression to test the hypotheses derived from the research questions
above.
The rest of the paper is organized as follows: A brief review of the relevant
literature and three research hypotheses are presented in Section 2. Data, scales, and
research methods are discussed in Section 3. The statistical results are described in
Section 4, followed by discussion of the findings and their implications in Section 5.
Finally, limitations and future research directions are discussed in Section 6.
2. Literature and Hypotheses
In this section, we provide a review of the relevant literature and develop the
research hypotheses.
4

2.1. Long term nature of inventory performance
There is considerable anecdotal and limited empirical evidence that inventory
performance has improved in some manufacturing industries over time (Rajagopalan
and Malhotra, 2002). From a theoretical perspective, industry-wide inventory
performance improvements can be attributed broadly to 1) accelerating pace of
change in business environment and global competition and 2) process innovations
and implementation of improvement programs.
The increasing pace of change and intensity of global competition require
organizations to respond effectively to changing external environments (D’Aveni,
1994; Eisenhardt, 1989). The studies on “post-industrial organizations (Huber,
1984),” “industry clock speed (Fine, 1997; Mendelson and Pillai, 1999),” and
“hypercompetitive industries (D’Aveni, 1994)” converge on the notion that post-
industrial organizations face environments that are changing much faster than those
of industrial organizations.
Process innovations such as lean production systems, cycle time reduction,
and quick response are frequently credited as drivers for improving operational
performance. Although studies show that implementation of lean production or
other similar improvement programs lead to a superior operational performance,
most of these studies analyze cross-sectional data from surveys of manufacturing
firms (c.f. Shah and Ward, 2003). Shah and Ward (2003) found that implementation
of lean practices contribute substantially to improved operational performance of
plants. In addition, Im and Lee (1989), Inman and Mehra (1993) and White et al.,
(1999) provide empirical evidence that implementation of lean production systems
5

result in reduced inventory levels and increased inventory turnovers.
A few longitudinal studies have also examined the link between process
improvement programs and firms’ operational performance (Balakrishnan et al.,
1996; Billesbach and Hayen, 1994; Chang and Lee, 1995; Huson and Nanda, 1995).
However, they are constrained by short duration of data collection periods and
relatively small sample sizes. For example, Balakrishnan et al., (1996) compared a
sample of 46 manufacturing firms that publicly disclosed JIT adoption and a control
group of non-adopters over a four-year period (from 1985 to 1989). They showed
that the firms, which had adopted JIT systems, had lower raw materials, work in
process, and total inventory levels.
We found only two studies (Rajagopalan and Malhotra, 2001; Vergin, 1988)
that are similar in scope to the present study. The focus of these studies was to
examine changes in inventory turnover ratios over a period of time, but neither of the
studies explicitly specifies the causes of changes in inventory performance. Rather,
they conjectured that increased competition and improvement approaches could be
associated with higher inventory turns. In analyzing the data from 427 Fortune 500
firms, Vergin (1998) found that total inventory turns had changed significantly from
1986 to 1995. Rajagopalan and Malhotra (2001) examined inventory data from 1961
to 1994 for all manufacturing industries in the US. The results were mixed: While
raw materials and work-in-process inventories decreased in most industries at SIC
two digit level, finished goods inventories decreased only in a few industries.
Despite its extensiveness, the study (Rajagopalan and Malhotra, 2001) was limited to
the US manufacturing sector and failed to provide clear insights into inventory trends.
6

To our knowledge, the present study is the first longitudinal study, which examines
inventory performance in the manufacturing, retail, and wholesale sectors.
Additionally, this research examines the relationship between a sector’s inventory
performance trend and its financial performance.
In summary, the literature provides some evidence that process improvement
programs have contributed to improvement in inventory performance. Although
these studies mainly focus on manufacturing firms, we expect the same forces to
play out in the wholesale and retail sectors, improving inventory performance of the
two sectors as well. Therefore, we propose the following Hypothesis 1:
H1a: Average inventory per decade has decreased significantly during the last four decades in the manufacturing, retail, and wholesale sectors.
2.2. Information technology and inventory performance
The literature on “IT payoff” has progressed through two phases. During the
first phase, researchers failed to find any link between increased investments in IT
and performance improvement at the industry or firm level (Brynjolfsson, 1993;
Brynjolfsson and Hitt, 1996; Roach, 1987; Strassmann, 1985). This lack of evidence,
popularly termed “the productivity paradox,” was put to rest during the second phase.
During the second phase, a number of studies began to establish some empirical
links between investment in information technology and improved performance at
the industry and firm level (Brynjolfsson and Hitt, 2000; Jorgensen and Stiroh, 2000;
Kraemer and Dedrick, 2001; Devaraj and Kohli, 2003).
With the use of IT, firms have been able to enhance information availability
all across their supply chains. Timely access to information regarding customer
7

demand patterns and inventory positions has enabled managers to make more
informed choices and streamline inventories at each level of distribution. The
significant role of IT in supply chain management has resulted in a tremendous
increase in IT investments in all sectors of the US economy. Accordingly, we expect
to find a positive influence of IT investment on industry group-wide inventory
performance. Therefore, we propose to test the following Hypothesis 2:
H2a: There is a significant and negative association between IT investment and
inventory performance (inventory level) in the manufacturing, retail and wholesale sectors.
2.3. Information technology, inventory performance, and financial performance
As we stated in the introduction, a primary objective of the research is to
examine the relationship between IT investment, inventory performance, and
financial performance at the industry group level. With this objective in mind, we
propose three research hypotheses that will be tested, using a multiple regression
model.
IT investment and financial performance: Whether a positive relationship between
IT investment and financial performance should be found at the industry level is not
apparent. Most of the previous longitudinal IT payoff studies were conducted to
examine the impact of IT investment on firms’ operational performance such as
productivity, quality, and service (Kohli and Devaraj, 2003). Although limited in
extent, firm level studies support a positive but restrictive influence of IT investment
on financial measures (Barua et al., 1995; Dewan and Min, 1997, Devaraj and Kohli,
8

2000). For instance, Barua et al (1995) found that IT was positively associated with
some intermediate measures of profitability, but the effect size was small.
Logically thinking, if leading firms in an industry invest in IT and their
investments in IT are viewed as a source of competitive advantage, the rest of the
firms in the industry would mimic the leaders and make similar investments. Due to
this “isomorphic” behavior of firms, according to institutional theorists,
organizations come to resemble one another to gain legitimacy or achieve superior
economic performance (DiMaggio and Powell, 1983; Haunschild and Miner, 1997).
From this perspective, we can conjecture that empirical evidence for the positive
impact of IT investment on financial performance can also be found at the industry
group level. Therefore, we propose the following Hypothesis 3-1.
H3-1a: IT investment has a significant and positive association with the financial performance in the manufacturing, retail, and wholesale sectors.
Inventory performance and financial performance: The relationship between
inventory performance and financial performance is not straightforward because of
the general accounting principles, which treat inventories differently in a firm’s
balance sheet and income statement. In the balance sheet, inventory is viewed as an
asset base, which is a source of profit in the long run. In the income statement,
however, a higher inventory level may lead to a lower profit margin because the
higher inventory-related costs such as carrying, material handling, obsolescence, and
insurance costs will increase costs of goods (merchandise) sold.
The link between inventory performance and financial performance has been
9

extensively examined in the context of Just in Time (JIT) production method. This is
rooted in the belief that a lower level of inventories under JIT production will lead to
a smaller asset base and, as a result, increase Return on Asset (ROA). Nonetheless,
only a few studies have actually found support for the principle (Callen et al., 2000;
Fullerton, et al., 2003). In comparing the financial performance of JIT and non-JIT
firms, Balakrishnan et al (1996) found no difference in their ROAs. Balakrishnan et
al (1996) argued that the benefits of asset base reduction under JIT are not apparent,
especially in the short term.
The empirical evidence linking industry level operational performance to
financial performance seems to be equally conflicting. However, we expect that
improved inventory performance has a positive influence on financial performance
particularly when the inventory performance was measured as a ratio of inventories
to sales, as was in the presented study. Given a certain amount of sales, ceteris
paribus, a reduction in inventory level would directly improve profit margin in the
firms’ income statements. Therefore, we propose to test the following Hypothesis 3-
2:
H3-2a: Inventory performance (inventory level) has a significant and negative association with the financial performance in the manufacturing, retail, and wholesale sectors.
Moderation effect of IT investment on inventory performance and financial
performance: In addition to a direct effect of IT investment on financial performance,
we investigate the moderation effect of IT investment on the relation between
10

inventory performance and financial performance; see Figure 1(a). The moderating
role of IT investment on financial performance has not been investigated previously
in the literature. If the effect of inventory performance on financial performance is
dependent upon the level of IT investment, we can claim that IT investment
moderates the impact of inventory performance on financial performance (Baron and
Kenny, 1986; Venkatraman, 1989). We expect that a higher level of IT investments
and a lower inventory level may have a positive and synergistic influence on
improving financial performance. If both conditions (high IT investment and low
inventory level) are not satisfied, the corresponding financial performance may be
weaker. The net effect is an empirical question, which we propose to test through
the following Hypothesis:
H3-3a: IT investment moderates the relationship between inventory performance and financial performance in manufacturing, retail, and wholesale sectors.
Statistically, the moderating role of IT investment will be supported if the
coefficient for the interaction (moderation) term in Figure 1(a) is significant.
[Figure 1 about here]
Mediation effect of Inventory Performance on IT investment and Financial
Performance: Alternatively, inventory performance can also mediate the relationship
between IT investment and financial performance; see Figure 1(b). From a
theoretical standpoint, the mediation model resides in the classical industrial
organization paradigm (Scherer and Ross, 1990), in which the impact of structural or
11
strategic decisions (IT investment) on performance (financial performance) is
intervened (mediated) by the effectiveness of conduct (inventory performance).
Therefore, if a mediation effect of inventory performance exists, the impact of IT
investment on financial performance should be interpreted as an indirect effect.
To conduct a mediation analysis, we need to decompose the interlinked
effects among inventory performance, IT investment, and financial performance
included in the moderation model in Figure 1(a). Because this decomposition
procedure can be done in testing Hypothesis 2 and 3, we do not provide a specific
hypothesis for the test of mediation effect. Instead, the analytical results will be
reported directly in Section 4.
3. Research Methods and Scale Development
To test our hypotheses, we develop a set of ratio scales from data. The raw
data are available in “Annual Report to the President of the United States on the
Activities of the Council of Economic Advisors (1999 and 2000).” The report is part
of the “Economic Report of the President,” which is delivered each year to the
Congress of the United States. The raw data can also be obtained from BEA of the
Department of Commerce.
3.1. Unit of analysis
The unit of analysis in this research is at the level of economic sector, which
includes all companies and business establishments within the sector. For example,
“manufacturing sector” in the US economy comprises all the companies engaged in
12

the mechanical or chemical transformation of materials or substances into new
products. Similarly, all firms, businesses, and corporations that sell directly to
consumers are grouped into “retail sector” and all those involved in wholesale
trading are grouped into “wholesale sector” (See Appendix, Section I).
Employing the industry group (sector) level for analysis has the following
merits. First, we can bypass the measurement issues caused by definitional changes
in the industry classification systems (From SIC to NAIC). Second, the impact of
drastic changes in individual firms’ status and performance, which may occur due to
strategic decisions or business failures, such as mergers, acquisitions, spin-offs, and
bankruptcies, is negligible at the sector level. Lastly, this level of aggregation should
allow us to predict general trends in inventory performance.
3.2. Scales and index construction
The simplest indicators for inventory and financial performance and IT
investment are the corresponding dollar values measured at the end of each year.
However, the dollar measures are inappropriate for standard statistical analysis
because they are influenced by such economic factors as economic growth rate,
industry output level, inflation rate, and exchange rate. To lessen these problems, we
develop ratio scales for the three sector’s inventory performance, financial
performance, and IT investment during the last four decades (coverage from 1960 to
1999). Because we analyze the economic archival data, it is important to provide
clear definitions of the terms, including inventory, sales, profit, and IT investment.
Detailed definitions of the terminology are included in Appendix, Section II.
13

Inventory performance (Inv_Perf) of each sector is measured as a ratio of
the sector’s total inventory to total sales volume, which indicates the amount of
inventory that is maintained in a sector to achieve a certain sales volume. Therefore,
Inv_Perf of a sector represents the companies’ overall efficiency in inventory
management. A higher value of Inv_Perf indicates a higher level of inventories and
consequently a lower level of relative efficiency.
Financial performance (Fin_Perf) is measured as a ratio of a sector’s profit
to its sales volume. Thus, Fin_Perf of a sector is an indicator of the relative
profitability of the sector. Higher values of Fin_Perf are a sign of greater
profitability of a sector.
Investment in information technology (IT_Invest): Brynjolfsson and Hitt
(1996) conclude that “mis-measurement of IT investment” is one of the main sources
of equivocal results in the IT payoff studies. Because the measurement employed
and the calibration used to adjust the impact of time can influence the final research
outcome, it is recommended that an appropriate deflator be used to create an
unbiased ratio scale for IT investment (Brynjolfsson and Hitt, 1996). Investment in
information technology was measured as follows:
IT_Invest = [(ITRt – ITRt-1)/(ITRt-1)](ITRt)
(1)
where ITR represents the ratio of IT investment to total private investment
and
t represents the year of investment.
The term in square brackets of Equation (1) computes an annual change in IT
14

investment ratio (ITR) over consecutive years and represents a percent increase in
ITR. Then, the term in square brackets is multiplied by the current year’s ITR
(outside the brackets), which is used as a deflator to eliminate outlier effects of IT
investment in early years. In 1993, for instance, the retail sector’s nominal increase
in ITR over 1962 was 109.70%. However, the retail sector’s IT investment ratio in
1963 was only 0.38%, indicating that the actual amount of IT investment in 1963
was not so significant compared to other private investments (such as buildings,
utilities, and industrial equipment). To consider the relative importance of IT
investment amount in comparison to other investments, the nominal increase rate
was deflated to 0.42% (109.70% times 0.38%), using Equation (1). Therefore, in a
limited way, IT_Invest can represent the effect of both cumulative IT asset value and
the relative importance of net increase in IT investment.
Time (T) is an index of years where 1960 was coded as 1, 1961 was coded as
2 and so on. The index ranges from 1 to 40 for each of the 40 years included in the
dataset. The time index is included to control for the effect of time in examining the
association among other variables.
Interaction of IT Investment and Inventory Performance (IT_Invest x
Inv_Perf) is computed by multiplying IT investment with inventory performance and
standardizing the product. It is used to test the moderation effect of IT investment.
High values of IT_Invest and low values of Inv_Perf would lead to a better financial
performance. Therefore, Inv_Perf is inverse-coded so that the value of interaction
term becomes higher when Inv_Perf is low and IT_Invest is high.
15

3.3. Research Methods
3.3.1. Hypothesis 1: Inventory trends
ANOVA is used to evaluate whether or not inventories have reduced over the
last four decades. To do so, we adopt each of the last four decades (1960s, 1970s,
1980s, and 1990s) as the categorical independent variable for the ANOVA.
Specifically, H1 is modeled as follows:
H10: sInv_Perf 60 = sInv_Perf 70 = sInv_Perf 80 = sInv_Perf 90
H1a: sInv_Perf 60 > sInv_Perf 70 > sInv_Perf 80 > sInv_Perf 90
where Inv_Perf is a sector’s average inventory-to-sales ratio for each
decade.
Although any duration of time can be used as ANOVA factors, a period of
ten years is used for the following reasons. First, it is reasonable to divide the time
period into decades. While there was little emphasis on inventory reduction during
the 1960s, a distinct and dominant management program to improve inventory
performance was introduced and prevailed in each of the other decades. For
example, MRP became popular during the 70s, Just-in-time systems during the 80s,
and supply chain management practices during the 90s. Second, comparison of
average inventory levels across shorter time periods does not provide distinct and
meaningful trends in inventory performance.
To ensure that grouping the data into decades is technically valid and does
not violate the assumption of normality within the treatment cells, we conducted
Kolmogorov-Smirnov goodness of fit test (Lilliefors, 1967), and Shapiro-Wilk
normality test (Shapiro and Wilk, 1965). A total of twelve independent tests were
16

performed: 3 sectors x 4 decades. None of the treatment cells failed the
Kolmogorov-Smirnov test and only one (Inv_Perf for the retail sector) failed the
Shapiro-Wilk test. The test results indicate that our method does not violate the
normality assumption.
Based on the ANOVA results, a set of post-hoc analyses was conducted to
identify the pairs of means that significantly differ from each other. For each
sector’s data, we tested homogeneity of variance among the four treatment groups
at .05 level of significance (α), using Leverne's statistic (Leverne, 1960). We report
Dunnett's T3 pairwise mean comparisons, if the data failed in Leverne’s test,
violating the equal variance assumption. Otherwise, Tukey’s Honest Significant
Difference (HSD) is reported.
3.3.2. Hypothesis 2: Effect of investment in IT on inventory performance
Hierarchical regression analysis is used to test Hypothesis 2, which evaluates
the effect of IT investment on each sector’s inventory performance. To test
Hypothesis 2, we propose the following group of standardized regression models.
)(1)(1 :AModel tt TInv_Perf εβ +=
(2)
)()(32)(2 :AModel ttt IT_InvestTInv_Perf εββ ++=
(3)
where t is year ranging from 1960 to 1999 and ε(t) is an error term with a
mean of zero.
In the first step, as shown in Eq. (2), the time index (T) is introduced as a
17

control variable because all the variables used in this research are time-dependent to
some extent. Incorporating time (T) index into the regression models controls for the
effect of time related factors (either unknown or excluded in this study) on the
association among other variables. Therefore, the effect size of independent variable
of interest on the dependent variable can be quantified more clearly (Cohen and
Cohen, 1983, pp 88-89). In the second step, IT_Invest is entered to test its impact on
Inv_Perf as shown in Eq. (3). A negative coefficient (β3) for IT_Invest is expected
because a larger amount of IT investment should lead to a lower inventory-to-sales
ratio (Inv_Perf).
3.3.3. Hypothesis 3: Moderation effect of investment in IT on financial
performance
Hierarchical regression is also used to test Hypothesis 3. Here, we evaluate
the effect of inventory performance on the financial performance in each sector and
the moderation effect of information technology on the association between the
inventory performance and the financial performance, using the following
standardized regression models.
)(4)(1 :BModel tt TFin_Perf εβ +=
(4)
)()(7)(65)(2 :BModel tttt Inv_PerfIT_InvestTFin_Perf εβββ +++=
(5)
)()()(11)(01
)(98)(3
)(
:BModel
tttt
tt
Inv_PerfIT_InvestInv_Perf
IT_InvestTFin_Perf
εββ
ββ
+×++
+=
18

(6)
where t is year starting from 1960 to 1999 and ε(t) is a error term with mean
of zero.
In each of the regression models for three sectors, the time index (T) is
entered in the first step. In step two, IT_Invest and Inv_Perf are entered
simultaneously. Lastly, the interaction term of IT investment and inventory
performance (IT_Invest x Inv_Perf) is entered to examine the moderation effects of
IT investment on the association between inventory performance and financial
performance. The incremental F statistic and the t statistic for a coefficient provide
information of each predictor’s strength in its effect. Such variance partitioning
procedures are commonly adopted to assess incremental effects of the predictors and
moderation effects of the interaction terms (e.g. Boyer et al., 1997; Miller and Dröge,
1986; Tatikonda and Montoya-Weiss, 2001). Positive coefficients for IT_Invest (β6
and β9) and the interaction term (β11) and negative coefficients for Inv_Perf (β7 and
β10) are expected.
3.3.4. Mediation effect of inventory performance
In general, the mediation effect of Inv_Perf can be claimed to exist if 1)
IT_Invest has a significant impact on the mediator (Inv_Perf), 2) the mediator has a
significant unique impact on Fin_Perf, and 3) the effect of IT_Invest on Fin_Perf
diminishes upon the addition of Inv_Perf in the regression model. Although these
conditions can be investigated casually to judge whether or not the mediation effect
exist, the procedure does not provide a formal statistical criterion in support of
19

mediation effects. Therefore, we conduct Sobel test (Goodman 1960, Sobel, 1982)
and Goodman (I) test, two tests commonly used to examine mediation effects (Baron
and Kenny, 1986). Both tests identify mediation effects by comparing the magnitude
of unstandardized coefficients and their weighted standard error terms. It is
recommended that both tests be used when the sample size is less than 50. Test
statistics for Sobel test and Goodman (I) test converge when the sample size is
greater than 50.
4. Statistical Results
Figures 2, 3, and 4 illustrate the general trends in inventory performance, and
financial performance, and rate of changes in IT investment, respectively, for the
manufacturing, wholesale and retail sectors.
Overall, average inventory levels increased between the 60s and 70s for all
three sectors as evidenced by the increase in Inv_perf (see Figure 2). The
manufacturing sector maintained the highest inventory-to-sales ratio (Inv_perf)
during the first three decades that fell slightly below the retail sector during the 90s.
The inventory level for the manufacturing sector exhibits a sharp decline only after
the 80s perhaps due to the implementation of improvement programs, such as JIT,
and the increased focus on efficiency during the 80s and 90s. The average inventory
level for the wholesale sector remained unchanged during the 70s and 80s, but it has
been inching upwards during the 90s. The retail sector’s average inventory level
also increased during the first three decades and has seen a small decline in the 90s.
[Figure 2 about here]
20

Figure 3 shows the financial performance measured as profit-to-sales ratio for
the three sectors. Although the manufacturing sector has enjoyed the highest profit
levels among the three sectors, it has also seen the sharpest decline between the 60s
and 80s. Because of a steep decline in profit-to-sales ratio in the manufacturing
sector, the gap between the manufacturing sector and the other sectors has narrowed
in recent years. The retail sector also experienced a decrease during the period, with
a pattern similar to that of the manufacturing sector. However, the retail sector
recovered the lost ground during the 90s. The wholesale sector’s financial
performance shows a mixed trend.
[Figure 3 about here]
The average rate of change in IT investment has increased for all three
sectors significantly over the last four decades; see Figure 4. Not surprisingly, the
steepest increase occurred in the 90s. The increase appears most prominent in the
wholesale sector partly because total private investment in the wholesale sector has
observed the smallest increase compared to the other sectors, resulting in a large IT
investment increase rates. On average, the wholesale sector’s relative IT investment
increase rate was 4.2 % in the 90s, compared to 2.2% for both manufacturing and
retail sectors.
[Figure 4 about here]
4.1 Hypothesis 1: Inventory trends
The ANOVA results confirm the trends shown in Figure 2 and suggest that
inventory performance indeed differs significantly over the four decades in all three
sectors (Table 1). The post-hoc analysis, which compares the treatment group means
21
in a pairwise manner, indicates specifically which decades’ inventory performance
exhibited significant differences (Table 2).
[Tables 1 and 2 about here]
The average inventory levels in the manufacturing sector during the 90s are
significantly lower than the inventory levels in the 60s (mean difference: µd = .292, p
< .00), 70s (µd = .307, p < .00) and 80s (µd = .248, p < .00); other pairwise
comparisons were not significant. While some significant differences were found in
both wholesale and retail sectors, the differences were in the opposite direction,
meaning that average inventories in the later decades were higher than the earlier
decades. In the wholesale sector, significant differences were found between the 60s
and 80s (µd = -.066, p < .05) and the 60s and 90s (µd = -.081, p < .01); no other
paired means were found significantly different. In the retail sector, inventory levels
differed significantly between the 60s and 80s (µd = -.080, p < .00), 60s and 90s (µd =
-.065, p < .01), and 70s and 80s (µd = .048, p < .05); all other paired mean
differences were insignificant.
Based on ANOVA and post hoc analysis, we can conclude that inventory
levels have changed over the last four decades although not all decreased during the
time period. In fact, only the manufacturing sector experienced a significant
decrease while inventory levels increased for the other two sectors. Therefore,
Hypothesis 1 (H1a) is supported only for the manufacturing sector. Because of the
contrasting trends in the inventory levels among the three sectors, an exploratory
correlation analysis was conducted to examine pairwise bivariate correlations among
the three sectors’ inventory levels. None of the bivariate correlations were
22

significant at .05 level of significance.
4.2. Hypothesis 2: Impact of IT Investment on inventory performance
Table 3 summarizes the hierarchical regression results for the test of
Hypothesis 2. Inv_Perf was the dependent variable, and time index and IT_Invest
were entered in a sequential manner described earlier. Overall, the final regression
model (Model A2) explains significant amount of the variance in inventory
performance for each of the three sectors. Specifically, the model explains 61.1% (F
= 29.067, p < .00) of variance in Inv_Perf for the manufacturing sector, 24.6% (F =
6.043, p < .01) for the wholesale sector and 44.1% (F = 14.571, p < .01) for the retail
sector. Time effect accounts for a large and significant amount of variance in each
of the three models. This result is in agreement with Stock et al (2001), who also
found that time effect accounts for a relatively large portion of variance in the
dependent variables while analyzing time dependent data. The inclusion of
IT_Invest results in a significant change in R2 for the manufacturing and retail sectors
but not for the wholesale sector.
[Table 3 about here]
In the manufacturing sector, time is negatively associated with Inv_Perf (β2 =
-.537, p < .00), implying that the inventory levels decreased significantly during the
last four decades; see Model A2 in Table 3. IT_Invest is also negatively associated
with Inv_Perf (β3 = -.323, p < .05), and adding IT_Invest into the model results in a
significant incremental increase in the R2 of .063 (p < .05). Therefore, we can
conclude that 6.3 % of the variance in Inv_Perf can be attributed to the influence of
23

IT_Invest. The results confirm that increasing rate of investment in information
technology leads to a significant reduction in the inventory levels of the
manufacturing sector. Thus, Hypothesis 2 (H2a) was supported for the
manufacturing sector.
In the wholesale sector, time has a positive and significant association with
Inv_Perf (β2 = .566, p < .01) suggesting that inventory levels have increased in this
sector over the four decades (Model A2). The relationship between IT_Invest and
Inv_Perf is not statistically significant (β3 = -.109, p > .05), although it is in the
expected direction. Accordingly, adding IT_Invest into the model does not result in a
significant increase in R2, and Hypothesis 2 (H2a) was not supported for the
wholesale sector.
The regression results for the retail sector are most interesting. The time
index is positively associated with Inv_Perf (β2 = .806, p <.00) with an R2 of .311,
suggesting that the inventory level increased significantly during the last four
decades. IT_Invest is also found to be negatively associated with Inv_Perf (β3 = -
.438, p < .01), supporting Hypothesis 2 (H2a) for the retail sector. Incorporating
IT_Invest into the model results in a significant increase in the R2 (incremental R2
= .130, p < .01). This result clearly indicates that the increased investment in IT has
a positive influence on inventory performance when the effect of time is controlled
in the model.
4.3. Hypothesis 3: IT Investment, inventory performance and financial
performance
24

Table 4 summarizes the hierarchical regression results for the test of
Hypothesis 3. In each regression, the sector’s profit-to-sales ratio (Fin_Perf) was the
dependent variable, and the independent variables were introduced in the following
hierarchical order: time index (Model B1), IT_Invest and Inv_Perf (Model B2), and
the interaction term, IT_Invest x Inv_Perf (Model B3).
Initially, three regression models (Models B1, B2, and B3) were run to test
Hypothesis 3. However, adding the interaction term, IT_Invest x Inv_Perf, into the
regression model (Model B3) did not improve the R2 significantly in any of the three
sectors (see Table 4). The results fail to provide support for the moderation effect of
IT investment on other variables. In other words, the impact of inventory
performance on financial performance was not altered (moderated) by the level of IT
investment. Consequently, determining which of the two models (Models B2 and
B3) is relevant and should be chosen as the final model for interpretation becomes a
critical issue.
A prevailing approach suggests that we should prefer Model B3 to Model B2
because the inclusion of interaction term reduces the error term (1 – R2). That is, it
reduces the amount of variance in dependent variable that is not explained by the
model. However, this rule cannot be applied universally, especially when the
inclusion of an independent variable deteriorates the reliability of the regression
model, leading to a decrease in F statistic (Cohen and Cohen, 1983; Neter et al.,
1996). As shown in Table 4, F statistics of Model B2 are 46.589 for the
manufacturing sector and 21.315 for the retail sector. In Model B3, these F values
are significantly lower; they are 36.683 and 15.567 for the manufacturing and the
25
retail sector respectively. Therefore, Model B2 was chosen as the final model for
interpretation and discussion purposes.
The final regression model (Model B2) explains significant amount of
variance in Fin_Perf for the manufacturing (R2 = .795, F = 46.589, p < .00) and the
retail (R2 = .640, F = 21.315, p < .00) sectors but not for the wholesale sector (R2
= .140, F = 1.958, p > .05).
[Table 4 about here]
In the manufacturing sector, time accounts for a significant amount of
variance of Fin_Perf with an R2 of .552 (p < .00). Adding IT_Invest and Inv_Perf
into the model led to a significant increase in R2 by .243 (p < .00). Adding the
interaction term has increased R2 by .012, but the increase was not statistically
significant (p > .05). In Model B2 for the manufacturing sector, time has a
significant and negative association with Fin_Perf (β5 = -1.314, p < .00), indicating
that in general the manufacturing sector’s profitability has reduced for the last four
decades. IT_Invest is positively associated (β6 = .118) with Fin_Perf, but the
association is not significant. Inv_Perf shows a significant negative association with
Fin_Perf (β7 = -.672, p < .00). These results indicate that manufacturing sector’s
reduced inventory levels especially in the 80s and 90s has a positive influence on the
financial performance when the effect of time (trend) is controlled. In other words,
the reduced inventory level in the manufacturing sector over the last four decades has
contributed to improving financial performance of the sector. Therefore, for the
manufacturing sector, only Hypothesis 3-2 (H3-2a) was supported.
None of the repressors was found to be significant for the wholesale sector.
26

In the wholesale sector, many unknown factors seem to intervene in the relationships
among the variables under investigation. Hypothesis 3 was not supported for the
wholesale sector, and detailed discussions will not be presented.
In the retail sector, time also accounts for a significant amount of variance of
Fin_Perf with an R2 of .142 (p < .05). Adding IT_Invest and Inv_Perf into the model
also leads to a significant incremental increase in R2 (incremental R2 = .498, p < .00)
as shown in Table 4. Adding the interaction term does not improve the model
(incremental R2 = .00, p > .05) at all.
In Model B2 for the retail sector, whereas both time index and Inv_Perf are
statistically significant (p < .00), IT_Invest (p > .05) is not significant. Therefore,
only Hypothesis 3-2 (H3-2a) is supported for the retail sector. Time is positively
associated with Fin_Perf (β5 = .808, p < .00), indicating that overall the financial
performance in the retail sector has increased with time. The coefficient for Inv_Perf
is significant and negative (β7 = -.826, P < .00), meaning that the lower the inventory
level, the higher the financial performance.
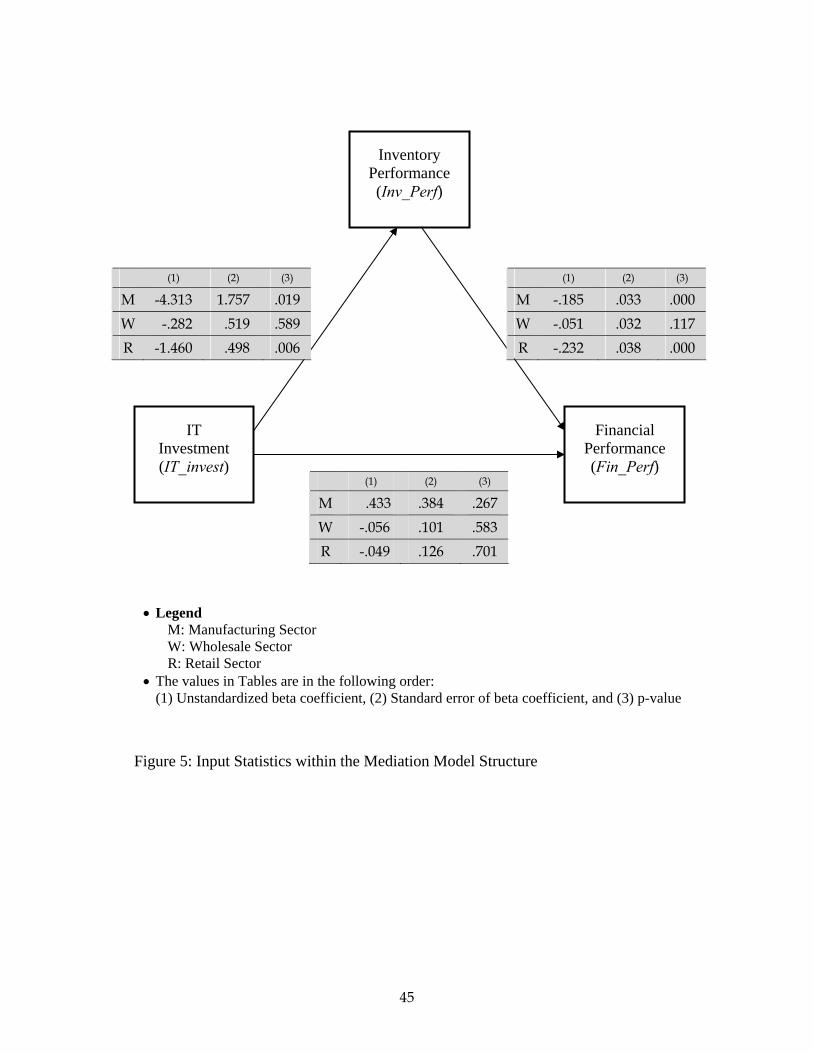
4.4. Mediation effect of Inv_Perf on the association between IT_invest and Fin_Perf
Figure 5 illustrates the detailed structure of the mediation model and also
presents statistics (unstandardized beta coefficients, standard errors of beta
coefficients, and corresponding p-values) obtained from the individual regression
analyses, using Models A2 and B2. The unstandardized beta coefficients and the
corresponding standard errors are used as input for Sobel test and Goodman (I) test
as shown in Figure 5.
27
[Figure 5 about here]
The test results are summarized in Table 5. The mediation effect of Inv_Perf
on the association between IT_Invest and Fin_Perf was found significant for
manufacturing (p < .05) and retail (p < .01) sectors for both Sobel and Goodman (I)
tests. In addition, the mediation effect was stronger in the retail sector. However,
the mediation effect of Inv_Perf was found insignificant in the wholesale sector (p >
0.05). These results suggest that the mediation model in Figure 1(b) is more
appropriate than the moderation model in Figure 1(a) to explain the empirical
linkage among IT investment, inventory performance, and financial performance.
[Table 5 about here]
5. Findings and Discussion
This research suggests three major findings. In this section, we discuss each
of the findings and their implications.
5.1. Inventory trends in manufacturing, wholesale and retail sectors
With regard to inventory trend in the US economy from 1960 to 1999, the
results are encouraging, but provide a mixed picture. While the relative inventory
level (inventory-to-sales ratio) in the manufacturing sector has decreased
significantly during that time period, the wholesale and retail sectors have seen an
increasing trend. For the manufacturing sector as a whole, increased managerial
emphasis on operational efficiency and implementation of performance improvement
programs seem to have paid off. However, in both wholesale and retail sectors, other
factors (hidden or excluded in this study) have saddled the wholesale and retail
28
sectors with higher inventory levels.
A possible explanation for the increased inventory levels in the wholesale and
retail sectors is the increasing proliferation of products that is required to meet
divergent consumer needs. According to “Annual Report by Federal Reserve Bank
of Dallas (1998),” the number of available products has increased considerably in
every product category in recent years. For example, the number of automobile
models has increased from 140 in the early 70s to 260 in the late 90s, breakfast
cereals from 160 to 340, and running shoe styles from 17 to 140.
Increasing number of products can lead to inventory performance differences
among the economic sectors in two ways. First, given that retailers and wholesales
do not hold raw materials and work-in-process inventories, implementation of
process improvement programs could be less beneficial to both wholesale and retail
sectors. Rajagopalan and Malhotra (2001) indirectly support this viewpoint,
showing that while raw materials and work-in-process inventories decreased in a
majority of manufacturing industries at SIC two-digit level, finished goods
inventories decreased only in some of the industries.
Second, as manufacturers have reduced their inventories, the burden of
meeting consumer demand has been pushed downstream to wholesalers and retailers.
Due to the progress of information technology, consumers at every level have been
gaining the capability to compare and purchase products to satisfy their specific
needs at the click of a mouse. Probability of losing a customer in the event of
insufficient or unavailable inventory is becoming really high, making both
wholesalers and retailers more acutely aware of the importance of service levels and
29

of holding excess inventories. This may have prevented the retailers and the
wholesalers from reducing their overall inventory levels as extensively as
manufacturers.
5.2. Role of IT on Inventory Performance
Impact of IT on firm performance is associated with a significant amount of
hedging both at conceptual and at empirical level. At a conceptual level, Carr (2003)
has recently argued that as the rate of investment in IT increases, and as IT becomes
more ubiquitous, its impact on performance becomes increasingly smaller and
ultimately disappears. At the empirical level, there are studies that show a positive,
negative and even zero impact of IT on firm performance. The empirical ambiguity
is often considered a consequence of the level of data aggregation, which is adopted
to measure IT investment. Kohli and Devaraj (2003) suggest that as the aggregation
level increases from firm level to a macro industry level, the impact of IT investment
on performance becomes less evident.
Our findings do not conform to either of these contentions. The results
suggest that, even after controlling for the effect of time, a higher rate of increase in
IT investment is significantly associated with a lower level of inventories in both
manufacturing and retail sectors, although not in the wholesale sector. One of the
strengths of this industry group level research stems from its extensive data coverage
from 1960 to 1999. Although important information technology applications, such
as MRP and EDI, have been available since the 70s, most studies do not capture the
benefits of these early investments in IT. In this context, the current findings of this
30

research make important contribution to the existing IT payoff literature.
While the negative association between IT investment and inventory level is
not surprising for the manufacturing sector, it is somewhat unforeseen in the retail
sector because in the retail sector both IT investment and inventory level
demonstrated an increasing trend during the four decades. The significant and
negative association is driven by the fact that inventory level in the retail sector
increased at a decreasing rate in part due to the effect of investment in IT. Therefore,
it is reasonable to conclude that without significant investment in IT, inventory level
in the retail sector could have been higher. In other words, the rate of inventory level
increase in the retail sector has been slowed down due to the investment in
information technology.
We did not find the same significant impact of IT investment on inventory
performance for the wholesale sector. Although the wholesale sector’s IT
investment has been increasing at a faster rate than that of the manufacturing and
retail sectors, the wholesale sector’s IT investment did not seem to translate into
similar gains in inventory reduction. It is possible that IT investment in the
wholesale sector is concentrated on enhancing coordination activities with trading
partners in the manufacturing and retail sectors, making them the bigger
beneficiaries of the increased investment. This result needs further examination in
the future studies.
5.3. Inventory, IT Investment, and Financial performance
We find significant direct effects of inventory performance on financial
31

performance in the manufacturing and retail sectors but not in the wholesale sector.
While the results from hierarchical regression clearly support the direct relationship,
it can also be detected from Figures 1 and 2. As the retail sector’s average
inventory-to-sales ratio increased from the 60s to the 80s, the sector’s profit-to-sales
ratio decreases steadily. As the average inventory-to-sales ratio decreases slightly in
the 90, the average profit-to-sales ratio improves. The results imply that the retail
sector’s poor inventory performance between the 60s and 80s is one of the main
causes for the sector’s worsening profitability during the period. The manufacturing
sector’s inventory and financial performance also shows similar patterns. When the
inventory level increased between the 60s and 70s, the manufacturing financial
performance deteriorated. The manufacturing sector’s financial performance was
improved between the 80s and 90s, leveraged by the sector’s inventory performance
improvement during the period. This strong association between inventory
performance and financial performance in the manufacturing and retail sectors
provides sound empirical evidence that reduction of inventories has a directive
influence on the companies’ financial performance.
Our research does not support a direct or a moderating role of IT investment
and financial performance in any of the sectors. Rather, it appears that the impact of
IT investment is mediated by the direct effect of inventory performance on financial
performance. Some of the IT payoff studies provide possible explanations why the
financial benefit of IT investment could not be easily detected; 1) lagged benefits of
IT investment (Brynjolfsson and Hitt, 1998), 2) limited set of control variables that
can reduce error terms by eliminating the noise of extraneous factors (Devaraj and
32

Kohli, 2003), 3) conflicting effect of IT investment which increases asset base but
directly lowers profit each year, and so forth.
Although these explanations have been widely accepted, the findings from
the present study strongly suggest that the benefits of IT investment are rather
indirect through the improvement in operational performance. More specifically, our
findings suggest that the manufacturing and the retail sectors’ increased IT
investment has contributed to the sectors’ improved inventory performance, which in
turn has shown a positive influence on financial performance. Therefore, the effect
of IT investment on financial performance appears mediated by the stronger effect of
inventory performance on financial performance. This result is consistent with the
industrial organization paradigm proposed by Scherer and Ross (1990) that
operational excellence (conduct) is a requisite for a successful implementation of
strategy and structural decisions in order to improve firm’s performance.
5.4. Managerial Implications
Our research findings have important managerial implications. First, results
suggest that reducing inventories has a significant and direct relationship to financial
performance. This provides strong justification for current managers to continue to
emphasize efficient inventory management and supply chain inventory coordination.
The results have added salience for the managers in the wholesale sector, given that
the inventory levels in the wholesale sector have been increasing over the years.
Perhaps, the managers in the wholesale sector need to seek out appropriate
improvement programs applicable to their specific operations. Second, the
33

importance of operational excellence cannot be ignored. Our findings suggest that
the financial benefits of IT investment will be realized indirectly through
improvement in inventory performance. The large effect size of inventory
performance on financial performance and the significant mediation test results
collectively demonstrate that operational excellence is a necessary condition for
reaping long term benefits from implementation of structural decisions (IT
investment).
6. Conclusion
In this research, we evaluated important relationships among IT investment,
inventory performance, and financial performance at the aggregated manufacturing,
retail and wholesale sector level. The research objective was to find empirical
evidence for the theory that companies’ focus on operational excellence in inventory
management and the relevant IT investment would enhance the firms’ profitability in
the long run.
The findings of this research make important contributions and raise
meaningful research questions as well. First, the ANOVA results show that not all
industries witnessed significant inventory reductions during the last four decades.
Opposed to the conventional wisdom that inventory performance of the US firms has
improved over time, the retail and the wholesale sectors have encountered a
significant increase in their inventory levels. Inventory levels have declined only in
the manufacturing sector.
Second, the findings suggest that increased IT investment has an immediate,
34

positive, and significant impact on inventory reduction in the manufacturing and
retail sectors, but not in the wholesale sector. Contrary to the argument forwarded
by Carr (2003) in “IT doesn’t matter,”, our result provides a strong support for the
managerial belief that investing in IT improves a firm’s operational efficiency.
Finally, this research confirms that a reduction in inventory level leads to a
higher level of financial performance for the manufacturing and the retail sectors.
More interestingly, we do not find any support for a direct or a moderating effect of
increased IT investment on financial performance, but the financial benefit of IT
investment appears to exist through a mediation effect of improved inventory
performance. In other words, increased IT investment improves inventory
performance, which in turn improves financial performance
Limitations of this research are related primarily to the scope and the
characteristics of the data used in the study. The empirical linkage and related
hypotheses were tested based upon the economic data aggregated at the sector level.
Although the results support a positive influence of IT investment on inventory
performance and a positive impact of inventory reduction on financial performance,
one must be careful when using the results to generalize at a lower level of
aggregation such as business units, firms, or corporations. Thus, future research
replicating this study at a lower level of aggregation can help explain the relevant
relationships more in depth. In addition, underlying factors that caused opposing
inventory patterns in different sectors are worth studying in the future. Identification
of such factors can help firms promote the positive influences while minimizing the
impact of factors that affect inventory trends negatively.
35

36

APPENDIX In this appendix, we summarize the terminology of this research, which is also available on the Bureau of Economic Analysis site (http://www.bea.doc.gov/bea/glossary/glossary_i.htm) or US Census Bureau site (http://www.census.gov/mtis/www/mtis.html). Thus, additional citations are omitted. I. Industry-group classification Manufacturing industry group (sector) comprises companies engaged in the
mechanical or chemical transformation of materials or substances into new products.
Wholesale Treading industry-group comprises companies with one or more
establishments engaged in wholesaling merchandise, generally without transformation, and rendering services incidental to the sale of merchandise. The wholesaling process is an intermediate step in the distribution of merchandise.
Retail Trading industry group comprises companies with one or more
establishments that sell merchandise and related services to final consumers. II. Variable definitions Inventory of each sector represents the total value of the end-of-month stocks. While
inventories in the manufacturing sector includes purchased materials and supplies, goods in process, or finished goods regardless of stage of fabrication, inventories in the wholesale and the retail sectors are mainly merchandise inventories held for sales purposes. Inventories associated with the non-business activities are excluded.
Sales of each sector are monthly shipment data with seasonality adjusted. Sales are
net values after deductions such as refunds and allowances for merchandise returned by customers. The industry group wide sales estimates are aggregated from three surveys conducted by the US Census Bureau: the Monthly Retail Trade Survey, the Monthly Wholesale Trade Survey, and the Manufacturers’ Shipments, Inventories, and Orders Survey.
Profit represents aggregated Corporate Profits (quarterly data) of a sector with Inventory
Valuation Adjustment. Corporate profits are the income earned by corporations as a result of current production
and established business. It excludes capital gains and losses, and it is calculated by valuing depreciation of fixed assets and inventory withdrawals at current cost, rather than at historical cost.
Inventory valuation adjustment is an adjustment made to corporate profits in order to
remove inventory profits, which are more like a capital-gain than like profits from current production.
IT investment (quarterly data) represents the sum of three components (Computers and
peripheral equipment, Software, and Other) as asset, which is categorized as Information
37
Processing Equipment Investment and Software in the non-residential area. Total private investment (quarterly data) is a sum of the investments as asset including the
investments in Buildings, Utilities, Mining Exploration, Shafts, Wells, Industrial Equipment, Transportation Equipment, Information Processing Equipment and Software and others.
References Annual Report, 1998. The Right Stuff: America's Move to Mass Customization: Annual Report by Federal Reserve Bank of Dallas, Federal Reserve Bank of Dallas, Texas. Baron, R. M., Kenny, D. A., 1986. The moderator-mediator variable distinction in social psychological research: Conceptual, strategic, and statistical considerations. Journal of Personality and Social Psychology 51, 1173-1182. Balakrishnan, R., Linsmeier, T.J., Venkatachalam, M., 1996. Financial benefits from JIT adoption: effects of customer concentration and cost structure. The Accounting Review 71 (2), 183–205. Barua, A., Kribel, C., Mukhopadhyay, T., 1995. Information technology and business value: An analytic and empirical evaluation. Information Systems Research 7 (4), 409-428. Benton W.C., Shin, H., 1998. Manufacturing planning and control: The evolution of MRP and JIT integration. European Journal of Operational Research 110 (3), 411-440. Billesbach, T.J., Hayen, R., 1994. Long-term impact of just-in-time on inventory performance measures. Production and Inventory Management Journal 35 (1), 62-66. Boyer, K.K., Leong, G.K., Ward, P., Krajewski, L., 1997. Unlocking the Potential of Advanced Manufacturing Technologies. Journal of Operations Management 15 (1), 331-347. Brynjolfsson, E., 1993. The productivity paradox of information technology. Comm. ACM 36 (12), 66-77. Brynjolfsson, E., Hitt, L., 1996. Paradox lost? Firm-level evidence on the returns to information systems spending. Management Science 42 (4), 541-558. Brynjolfsson, E., Hitt, L., 1998. Beyond the productivity paradox, Communications of the ACM 41 (8), 49-55. Brynjolfsson, E., Hitt, L., 2000. Beyond computation: Information technology, organizational transformation and business performance. Journal of Economic
38

Perspective 14 (4), 23-48. Callen, J.L., Fader, C., Krinsky I., 2000. Just-in-time: a cross-sectional plant analysis. International Journal of Production Economics 63, 277–301. Carr, N.G., 2003. IT doesn’t matter. Harvard Business Review 81 (5), 41-49. Cohen, J., Cohen, P., 1983. Applied Multiple Regression/Correlation Analysis for the Behavioral Sciences, the 2nd Edition, Lawrence Erlbaum Associate Publications, New Jersey. Chang, D., Lee, S.M., 1995. Impact of JIT on organizational performance of U.S. firms, International Journal of Production Research 33 (11), 3053-3068. D’Aveni, R.A., 1994. Hypercompetition: Managing the Dynamics of Strategic Maneuvering, The Free Press, New York. Devaraj, S., Kohli, R., 2003. Performance impacts of information technology: Is actual usage the missing link? Management Science 49 (3), 273-289. Dewan, S., Min, C.K., 1997. The substitution of information technology for other factors of production: A firm level analysis. Management science 43 (12), 1660-1675. DiMaggio, P.J., Powell, W.W., 1983. The Iron Cage Revisited: Institutional Isomorphism and Collective Rationality in Organizational Fields. American Sociological Review 48, 147-160. Eisenhardt, K., 1989. Making fast strategic decisions in high velocity environment. Academy of Management Journal 32 (3), 543-576. Fine, C.H., 1998. Clockspeed: winning industry control in the age of temporary advantage, Reading, Mass, Perseus Books. Fullerton, R.R., McWatters, C.S., Fawson, C., 2003. An examination of the relationships between JIT and financial performance. Journal of Operations Management 21 (4), 383-404. Goodman, L. A., 1960. On the exact variance of products. Journal of the American Statistical Association 55, 708-713. Haunschild, P.R., Miner, A.S., 1997. Modes of inter-organizational imitation: The effects of outcome salience and uncertainty. Administrative Science Quarterly 42 (3), 472-500. Huber, G.P., 1984. The nature and design of post-industrial organizations. Management Science 30 (8), 928-951.
39

Huson, M., Nanda, D., 1995. The impact of just-in-time manufacturing on firm performance in the US. Journal of Operations Management 12 (3/4), 297-310. Im, J.H., Lee, S.M., 1989. implementation of just-in-time systems in US manufacturing firms. International Journal of Operations and Production Management 9 (1), 5-14. Inman, R.A., Mehra, S., 1993. Financial justification of JIT implementation. International Journal of Operations and Production Management 13 (4), 32-40. Jorgenson, D.W., Stiroh, K.J., 2000. Raising the speed limit: U.S. economic growth in the information age. Brookings Papers on Economic Activity (1), 125-211. Kohli, R., Devaraj, S., 2003. Measuring information technology payoff: A meta-analysis of structural variables in firm-level empirical research. Information Systems Research 14 (2), 127-145. Kraemer, K.L., Dedrick, J., 2001. The productivity paradox: Is it resolved? Is there a new one? What does it all mean for managers? CRITO Publication Series, University of California at Irvine, Irvine CA. Leverne, H., 1960. In Olkin, I., Ghurye, S.G., Hoeffding, W., Madow, W.G., Mann, H.B., eds. Contributions to Probability and Statistics: Essays in Honor of Harold Hotelling, Stanford University Press, Stanford, 278–292. Lilliefors, H.W., 1967. On the Kolmogorov-Smirnov test for normality with mean and variance unknown. Journal of the American Statistical Association 62, 399-402. Mendelson, H., Pillai, R.R., 1999. Industry clockspeed: measurement and operational implications. Manufacturing and Service Operations Management 1 (1), 1-20. Miller, D., Dröge, C., 1986. Psychological and traditional determinants of structure. Administrative science Quarterly 31 (4), 539-560. Neter, J., Kutner, M. H., Nachtsheim, C.J., Wasserman, W., 1996. Applied Linear Regression Models, 4th Edition, Irwin, Chicago. Rajagopalan, S., Malhotra, A., 2001. Have U.S. manufacturing inventories really decreased? An empirical study. Manufacturing and Service Operations Management 3 (1), 14-24. Roach, S., 1987, America’s technology dilemma: A profile of the information economy, Special economic study, Morgan Stanley, New York. Scherer, F. M., Ross, D., Industrial Market Structure and Economic Performance, 3rd
40

Edition, Houghton Mifflin, Boston, 1990. Shah, R., Ward, P.T., 2003. Lean manufacturing: context, practice bundles, and performance. Journal of Operations Management 21(2), 129-149. Shapiro, S. S., Wilk, M. B., 1965. An analysis of variance test for normality (complete samples). Biometrika 52 (3/4), 591-611. Sobel, M. E., 1982. Asymptotic intervals for indirect effects in structural equations models. In S. Leinhart (Ed.), Sociological methodology, Jossey-Bass, San Francisco, 290-312. Stock, G.N., Greis, N.P., Fischer, W.A., 2001. Absorptive capacity and new product development. Journal of High Technology 12, 77-91. Strassmann, P.A., 1985. Information Payoff: The Transformation of Work in the Electronic Age, The Free Press, Collier MaCmillan, New York, London, U.K. Tatikonda, M.V., Montoya-Weiss, M.M., 2001. Integrating operations and marketing perspectives of product innovation: The influence of organizational process factors and capabilities on development performance. Management Science 47 (1), 151-172. Venkatraman, N., 1989. The concept of fit in strategy research: toward verbal and statistical correspondence. Academy of Management Review 14 (1), 423-444. Vergin, R.C., 1988. An examination of inventory turnover in the Fortune 500 industrial companies. Production and Inventory Management Journal 39 (1), 51-56. White, R.E., Pearson, J.N., Wilson, J.R., 1999. JIT manufacturing: a survey of implementations in small and large US manufacturers. Management Science 45 (1), 1-15.
41

(a) The Moderation Model
Interaction between IT and Inventory
IT Investment
Inventory Performance
Financial Performance
(b) The Mediation Model
Financial Performance
Inventory Performance
IT Investment
Figure 1: A Schematic Comparison between Moderation Model and Mediation Model
42

1.751 1.766
1.707
1.228
1.294 1.294 1.309
1.4421.474
1.5221.459
1.507
1.000
1.200
1.400
1.600
1.800
2.000
'60s '70s '80s '90s
Inve
ntor
y-to
-Sal
es R
atio
Manufacturing Wholesale Retail
Figure 2: Trend of Inventory Performance: Average Inventory to Sales Ratios
0.277
0.210
0.145
0.074 0.079
0.0650.056 0.054
0.164
0.065
0.065
0.081
0.000
0.100
0.200
0.300
0.400
'60s '70s '80s '90s
Prof
it-to
-Sal
es R
atio
Manufacturing Wholesale Retail
Figure 3: Trend of Financial Performance: Average Profit to Sales Ratios
43

0.0050.007
0.042
0.022
0.0020.002 0.006
0.017
0.008
0.005
0.0010.000
0.020
0.040
0.060
'60s '70s '80s '90s
Cha
nge
in IT
Inve
stm
ent
Manufacturing Wholesale Retail
Figure 4: Trend of IT Investment Change: Average IT Investment Increase Ratio
44
IT Investment (IT_invest)
Financial Performance (Fin_Perf)
(1) (2) (3)
M -4.313 1.757 .019 W -.282 .519 .589 R -1.460 .498 .006
(1) (2) (3)
M -.185 .033 .000 W -.051 .032 .117 R -.232 .038 .000
(1) (2) (3)
M .433 .384 .267 W -.056 .101 .583 R -.049 .126 .701
Inventory Performance (Inv_Perf)
• Legend M: Manufacturing Sector W: Wholesale Sector R: Retail Sector • The values in Tables are in the following order:
(1) Unstandardized beta coefficient, (2) Standard error of beta coefficient, and (3) p-value
Figure 5: Input Statistics within the Mediation Model Structure
45
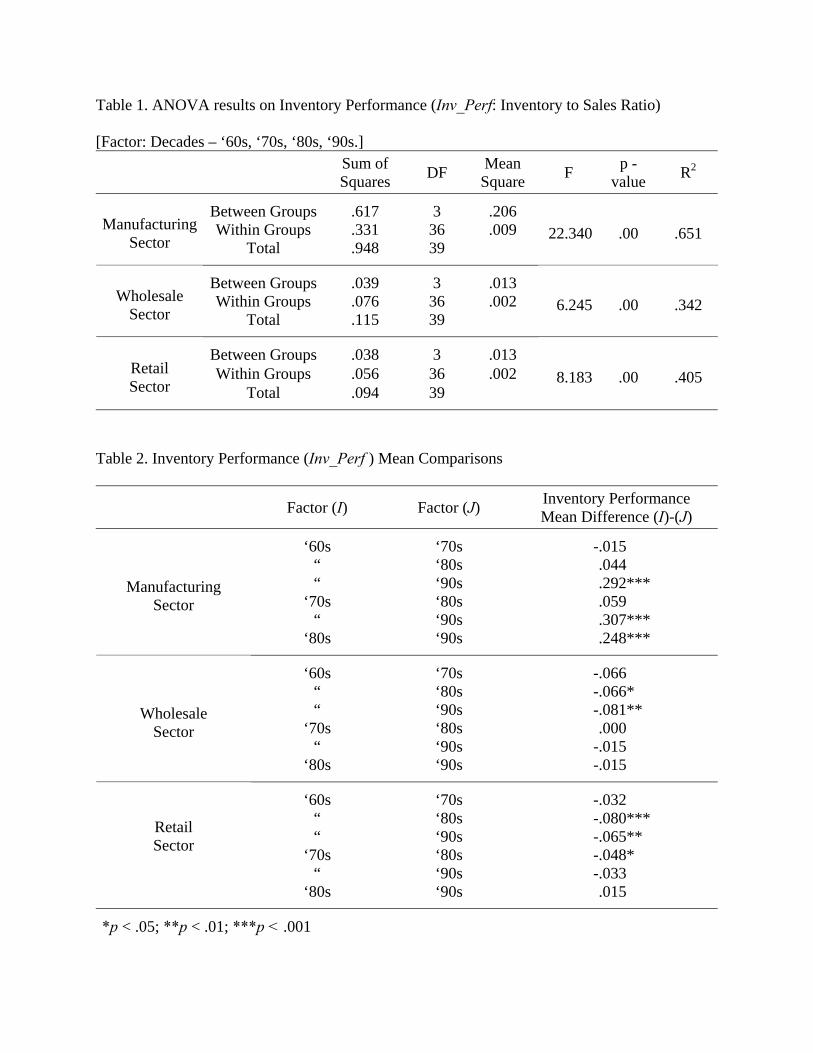
Table 1. ANOVA results on Inventory Performance (Inv_Perf: Inventory to Sales Ratio) [Factor: Decades – ‘60s, ‘70s, ‘80s, ‘90s.]
Sum of Squares DF Mean
Square F p -value R2
Between Groups .617 3 .206 Within Groups .331 36 .009 Manufacturing
Sector Total .948 39 22.340 .00 .651
Between Groups .039 3 .013 Within Groups .076 36 .002 Wholesale
Sector Total .115 39 6.245 .00 .342
Between Groups .038 3 .013 Within Groups .056 36 .002 Retail
Sector Total .094 39 8.183 .00 .405
Table 2. Inventory Performance (Inv_Perf ) Mean Comparisons
Factor (I) Factor (J) Inventory Performance Mean Difference (I)-(J)
‘60s ‘70s -.015 “ ‘80s .044 “ ‘90s .292***
‘70s ‘80s .059 “ ‘90s .307***
Manufacturing Sector
‘80s ‘90s .248***
‘60s ‘70s -.066 “ ‘80s -.066* “ ‘90s -.081**
‘70s ‘80s .000 “ ‘90s -.015
Wholesale Sector
‘80s ‘90s -.015
‘60s ‘70s -.032 “ ‘80s -.080*** “ ‘90s -.065**
‘70s ‘80s -.048* “ ‘90s -.033
Retail Sector
‘80s ‘90s .015
*p < .05; **p < .01; ***p < .001

Table 3. Hierarchical Regression on Inventory Performance (Inv_Perf: Inventory to Sales Ratio)
Standardized Beta Coefficients
Model A1 Model A2
Time index (t) -.740*** -.537*** IT_Invest -.323* R2 .548 .611 Change in R2 .548*** .063* Model F statistic 46.023 29.067
Manufacturing Sector
Model p-value .000 .000
Time index (t) .490** .566** IT_Invest -.109 R2 .240 .246 Change in R2 .240** .006 Model F statistic 12.012 6.043
Wholesale Sector
Model p-value .001 .005
Time index (t) .557*** .806*** IT_Invest -.438** R2 .311 .441 Change in R2 .311*** .130** Model F statistic 17.125 14.571
Retail Sector
Model p-value .000 .000
*p < .05; **p < .01; ***p < .001 • Model A1 is for Eq. (2), and Model A2 for Eq. (3)
1

Table 4. Hierarchical Regression on Financial Performance (Fin_Perf: Profit to Sales Ratio)
Standardized Beta Coefficients
Model B1 Model B2 Model B3
Time index (t) -.743*** -1.314*** -1.288*** IT_Invest .118 -.249 Inv_Perf -.672*** -.532** IT_Invest x Inv_Perf .466 R2 .552 .795 .807 Change in R2 .552*** .243*** .012 Model F statistic 46.776 46.589 36.683
Manufacturing Sector
Model p-value .000 .000 .000
Time index (t) -.273 -.049 -.049 IT_Invest -.120 -.116 Inv_Perf -.286 -.289 IT_Invest x Inv_Perf -.004 R2 .075 .140 .140 Change in R2 .075 .066 .000 Model F statistic 3.060 1.958 1.428
Wholesale Sector
Model p-value .088 .138 .245
Time index (t) .377* .808*** .815*** IT_Invest .052 .122 Inv_Perf -.826*** -.845*** IT_Invest x Inv_Perf -.078 R2 .142 .640 .640 Change in R2 .142* .498*** .000 Model F statistic 6.283 21.315 15.567
Retail Sector
Model p-value .017 .000 .000
*p < .05; **p < .01; ***p < .001 • Model B1 is for Eq. (4), Model B2 for Eq. (5), and Model B3 for Eq. (6).
2

Table 5. Test of Mediation Effects Test statistic (z) p-value
Sobel Test 2.249 0.025 Manufacturing Sector Goodman (I) Test 2.219 0.026
Sobel Test 0.514 0.607 Wholesale Sector Goodman (I) Test 0.442 0.658
Sobel Test 2.706 0.007 Retail Sector Goodman (I) Test 2.683 0.007
3