inventing smarter ways - annual report
TRANSCRIPT

INVENTING SMARTER WAYS
2018 Annual Report

On the cover: BHGE employee Michela Vanni, Production Supervision Specialist in Florence, Italy.
Contents
01 Chairman’s Letter to Shareholders
05 Financial Performance
06 Strategy in Action
08 Portfolio
09 Businesses
13 Technology & Innovation
14 People, Planet and Principles
16 Executive Leadership
Form 10-K
Inventing Smarter Ways to Bring Energy to the WorldFor our shareholders, for our customers, for our employees and the community.
We are BHGEOnly Baker Hughes, a GE company (BHGE) has fullstream capabilities: the portfolio, the people and the reach to deliver across the entire oil and gas value chain.
120+Countries in which we operate
$23B2018 Revenue
~66,000Employees
$700M2018 Research & Development spend

“Built on a fullstream portfolio, we are uniquely positioned to deliver a step-change in productivity for ourselves and for our customers.”– Lorenzo Simonelli
Chairman, President and Chief Executive Officer
We Are Taking Energy Forward
Dear Fellow Shareholders,Our industry and society are changing faster than ever. Populations continue to grow and require access to more efficient and cleaner energy. Technology and innovation are disrupting existing markets and increasing competitiveness of global energy sources.
These trends, coupled with a complex geopolitical and macro environment, are accelerating change across the energy landscape.
Oil and gas will continue to be essential components of the energy mix for many years to come, but we need to make structural changes to adapt and prepare for the future. Regardless of the commodity price, our industry must deliver higher productivity solutions, better returns on capital and a smaller carbon footprint.
We believe this journey starts with innovation, integration and collaboration across the energy value chain. Less than two years ago, we created BHGE with the purpose of “inventing smarter ways to bring energy to the world.” Built on a fullstream portfolio, we are uniquely positioned to deliver a step-change in productivity for ourselves and for our customers.
In 2018, we introduced a comprehensive growth strategy to increase our competitiveness by reducing the cost of doing business, drive efficiencies with integrated solutions, and deliver industrial yield through partnerships and innovative commercial models.
This strategy is a critical enabler for our financial priorities of growing market share, expanding operating margins and generating strong free cash flow conversion for our shareholders.
1BHGE 2018 Annual Report
CHAIRMAN’S LETTER TO SHAREHOLDERS
2018: Building a Better BHGE2018 was a year of change, transition and progress for us.
We moved beyond the initial integration phase into the next chapter for BHGE. We continued our efforts to strengthen our execution and improve operations. We are running BHGE better and striving to be the most customer-centric Company we can be.
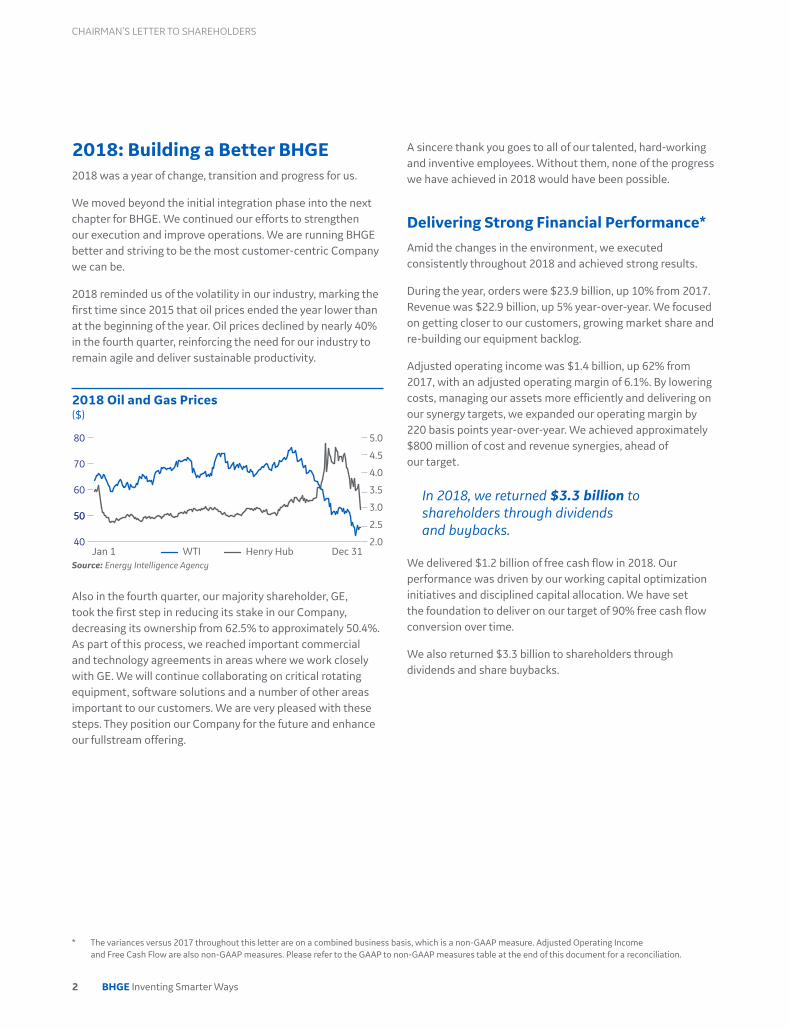
2018 reminded us of the volatility in our industry, marking the first time since 2015 that oil prices ended the year lower than at the beginning of the year. Oil prices declined by nearly 40% in the fourth quarter, reinforcing the need for our industry to remain agile and deliver sustainable productivity.
2.0
3.0
4.0
5.0
2.5
3.5
4.5
2018 Oil and Gas Prices($)
WTI Henry Hub
50
60
70
80
50
40Jan 1 Dec 31
Source: Energy Intelligence Agency
Also in the fourth quarter, our majority shareholder, GE, took the first step in reducing its stake in our Company, decreasing its ownership from 62.5% to approximately 50.4%. As part of this process, we reached important commercial and technology agreements in areas where we work closely with GE. We will continue collaborating on critical rotating equipment, software solutions and a number of other areas important to our customers. We are very pleased with these steps. They position our Company for the future and enhance our fullstream offering.
A sincere thank you goes to all of our talented, hard-working and inventive employees. Without them, none of the progress we have achieved in 2018 would have been possible.
Delivering Strong Financial Performance*
Amid the changes in the environment, we executed consistently throughout 2018 and achieved strong results.
During the year, orders were $23.9 billion, up 10% from 2017. Revenue was $22.9 billion, up 5% year-over-year. We focused on getting closer to our customers, growing market share and re-building our equipment backlog.
Adjusted operating income was $1.4 billion, up 62% from 2017, with an adjusted operating margin of 6.1%. By lowering costs, managing our assets more efficiently and delivering on our synergy targets, we expanded our operating margin by 220 basis points year-over-year. We achieved approximately $800 million of cost and revenue synergies, ahead of our target.
In 2018, we returned $3.3 billion to shareholders through dividends and buybacks.
We delivered $1.2 billion of free cash flow in 2018. Our performance was driven by our working capital optimization initiatives and disciplined capital allocation. We have set the foundation to deliver on our target of 90% free cash flow conversion over time.
We also returned $3.3 billion to shareholders through dividends and share buybacks.
* The variances versus 2017 throughout this letter are on a combined business basis, which is a non-GAAP measure. Adjusted Operating Income and Free Cash Flow are also non-GAAP measures. Please refer to the GAAP to non-GAAP measures table at the end of this document for a reconciliation.
2 BHGE Inventing Smarter Ways
CHAIRMAN’S LETTER TO SHAREHOLDERS

Winning in the Market
In 2018, we secured key wins across our businesses. We continued to enhance our fullstream offering and gained traction with our integrated solutions.
In Oilfield Services (OFS), we increased our presence globally. Our teams won a number of major awards and launched unique partnerships with customers. OFS outpaced the rig count in North America, growing revenue by 17% in 2018 versus rig count growth of 13%. Internationally, we saw revenue growth of 9% versus rig count growth of 4% for the year.
In Oilfield Equipment (OFE), we re-built the equipment backlog and strengthened our competitive offering. We introduced Subsea Connect, a new approach to subsea developments. Subsea Connect improves offshore economics and has the potential to lower economic development costs by an average of 30%. We grew orders by 23% compared to 2017 and won 77 subsea trees in 2018, the highest total in three years.
In Turbomachinery & Process Solutions (TPS), orders increased by 12%. We are at the forefront of technology for critical applications in the upstream, midstream and liquefied natural gas (LNG) sectors. In 2018, we saw the re-emergence of the LNG market with the first major project sanctioned in several years. Our outlook for LNG projects to receive positive final investment decisions (FID) in 2019 remains strong. We are well positioned for future growth.
In Digital Solutions (DS), we grew revenues by 3%. We gained traction with our hardware and software offerings. We launched partnerships to advance artificial intelligence and computing in the oil and gas industry, and expanded our predictive corrosion management offering.
Investing in Innovation
Leading technology is one of our key differentiators, with unmatched technical capabilities across our broad portfolio. We have adopted a disciplined approach to product development to continue our technology leadership and drive returns on our investments.
~2,700 global patents issued 100+ new product launches
In 2018, we increased our research and development (R&D) investment by 10% to $700 million, introduced more than 100 new products and received approximately 2,700 patents globally. We also launched our Energy Innovation Center in Oklahoma, U.S., a fully functional R&D center focused on commercializing new technology through a network of start-ups and incubators. Our teams have adopted an agile approach to develop, test and commercialize new technologies with speed.
Enhancing Our Culture and Our Values
We are one BHGE team and have built our own, unique culture that guides everything we do. We have focused on integrating our teams, fostering an inclusive environment and strengthening our learning and development programs. In 2018, we established clear criteria within our executive incentive compensation plan for how we measure and assess our leaders on performance, culture, and diversity and inclusion. We also launched recruiting campaigns to attract a more diverse workforce.
We achieved 153 Perfect HSE Days.
Our culture is built on safety, compliance and integrity, and quality. We believe in doing the right thing every time. And we strive to make every day one without injuries, accidents, illness or harm to the environment. We call it the “Perfect Health, Safety and Environment (HSE) Day.” In 2018, we achieved 153 Perfect HSE Days, a 20% improvement compared to 2017.
BHGE employee measuring petrophysical properties in a core holder to better understand the reservoir and optimize well placement for maximum returns.
3BHGE 2018 Annual Report
CHAIRMAN’S LETTER TO SHAREHOLDERS
Taking Energy ForwardOur 2018 results provide a strong foundation for our Company, as we prepare for a future that will be shaped by three themes:
Demand for More Efficient Energy Systems. Growing populations and an expanding middle class globally are creating the need for more energy. New social and geopolitical dynamics are requiring more from energy. These changes are creating new challenges and opportunities, but it is clear that energy must become cheaper, cleaner and more efficient.
The International Energy Agency predicts energy demand will grow by more than 25% by 2040, which will require more than $2 trillion a year of investment in new supply.
Technology Disruption. The convergence of new technologies, digitalization and new business models is transforming how we operate and invest. Technology is also becoming more accessible and affordable, reducing the barriers of entry and creating a more competitive space.
The World Economic Forum states that $1 trillion of opportunity is still at stake for the digitalization of the oil and gas industry, and less than 3% of all data generated is analyzed.
Cleaner Energy Solutions. Carbon reduction targets are not only being driven by governments, but also by consumers and our industry. This focus is leading to changes in demand patterns and low carbon initiatives. While total energy demand will continue to increase, we see the share of energy consumption shifting to more gas over the coming decades. As an industry, we must find ways to be part of the carbon solution.
According to multiple international industry sources, 50 gigatons of CO2 equivalent emissions are generated each year. Our industry contributes 10% of the total emissions.
Delivering Today and Positioning the Company for TomorrowWe will meet these challenges and take advantage of the opportunities they present. BHGE plays an important role in making energy more productive. We are taking energy forward with our portfolio, our long-term strategy and our focus on cleaner energy solutions.
We have developed a comprehensive long-term strategy… 50-50-50
Our strategy includes bold targets to deliver a step-change in productivity across the industry. It is based on three core pillars:
50 Building Market Leading Product Companies50% improvement in core competitiveness
We are reducing our product and service costs by driving best-in-class efficiency in our internal processes and eliminating unnecessary complexity and design variations. We are also building efficiencies through innovative new technologies, new materials and processes, such as additive manufacturing, and new supply chain solutions to reduce cycle time.
50 Developing Integrated Service Modules50% improvement in productivity and efficiency
We are creating more value by reducing the number of interfaces as we deliver projects and services. This cuts complexity, drives speed and increases execution efficiency.
50 Unlocking the Power of Fullstream50% increase in industrial yield
We are bringing the promise of fullstream to life with innovative commercial models and through stronger partnerships with our customers, our suppliers and within our own teams.
We are holding ourselves to a higher standard… a net-zero emissions future
Today, our industry is focused on reducing the impacts of climate change and preparing for the future. We believe we have an important role to play in society as an industry leader and partner to our customers.
Since 2012, we have reduced our own emissions by 26%. At the beginning of 2019, we made a commitment to further reduce our CO2 equivalent emissions by 50% by 2030, and to net-zero CO2 equivalent emissions by 2050.
We are also committed to helping our customers reduce their carbon footprint. We are expanding our low-carbon solutions, including our differentiated gas offering. With more than 500 compressors and 440 gas turbines in LNG applications, we are the leader in global LNG liquefaction. We are well positioned as the overall demand for gas increases.
In Conclusion2018 was a year of significant change in which we made great progress toward our strategic and financial goals. In 2019, we have a renewed sense of purpose and determination to support our customers and take energy forward.
I want to thank the BHGE team and our customers for a successful 2018. I also want to express my deep gratitude to our shareholders, who have invested in us and in our future.
Sincerely,
Lorenzo Simonelli Chairman, President and Chief Executive Officer
4 BHGE Inventing Smarter Ways
CHAIRMAN’S LETTER TO SHAREHOLDERS

* The variances versus 2017 on this page are on a combined business basis, which is a non-GAAP measure. Adjusted Operating Income and Free Cash Flow are also non-GAAP measures. Please refer to the GAAP to non-GAAP measures table at the end of this document for a reconciliation.
2018 Financial Highlights*($ billions)
Delivering Strong Financial PerformanceWe made progress on our financial priorities of growing faster than the market, expanding operating margins and driving free cash flow conversion.
Growing Faster Than the Market Expanding Operating Margins
2017 2018
$21.8$23.9
Orders
up 10%
2017 2018
$21.8 $22.9
Revenue
up 5%
2017 2018
$0.9
$1.4
Adjusted OperatingIncome
up 62%
2017 2018
3.9%
6.1%
Adjusted OperatingMargin
up 220 basis points
Synergies
Achieved
$0.8Bin cost and revenue synergies, ahead of target
Driving Free Cash Flow Conversion
Cash Flow from Operations
Free Cash Flow Working Capital Metrics
Days Sales Outstanding
Days Payable Outstanding
Inventory Turns
$1.8B $1.2BImproved
15 days year-over-year to 80 days
Improved
8 days year-over-year to 57 days
Up
0.5 turns year-over-year to 4.9 turns
Creating Long-Term Value for Our ShareholdersWe made progress on our capital allocation priorities of returning capital to shareholders and investing in the long-term success of the business, while maintaining capital discipline and a strong balance sheet.
Returning Capital to Shareholders
Positioning for Long-Term Growth
Maintaining a Strong Balance Sheet
Returned
$3.3Bin cash to shareholders through dividends and share buybacks
R&D Spend
$0.7B up 10% year-over-year
Reaffirmed
Moody’s A3and
S&P’s A-ratings for our long-term debt
Net Capex Investment
$0.5B
FInAnCIAl PerFOrMAnCe
5BHGE 2018 Annual Report
W&T O�shore
Drilling Milestones
Kinder Morgan
NVIDIA
Bruce Power
Coastal GasLink
BP POA
FPSOWin
LNG Canada
Enbridge
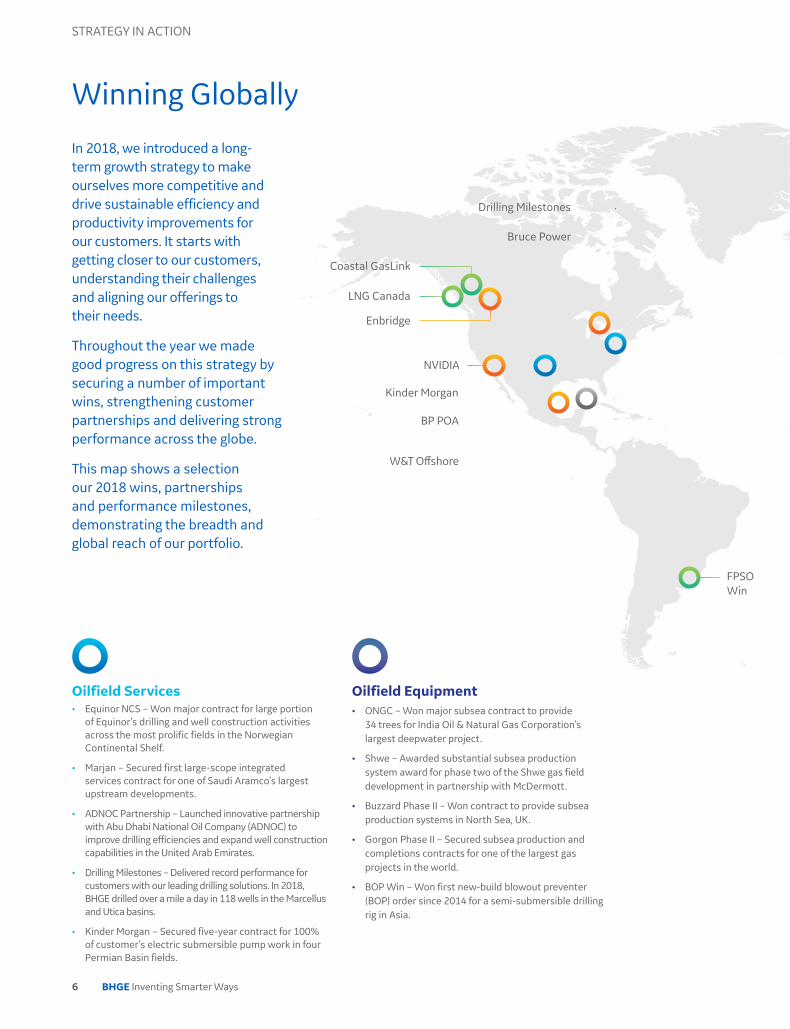
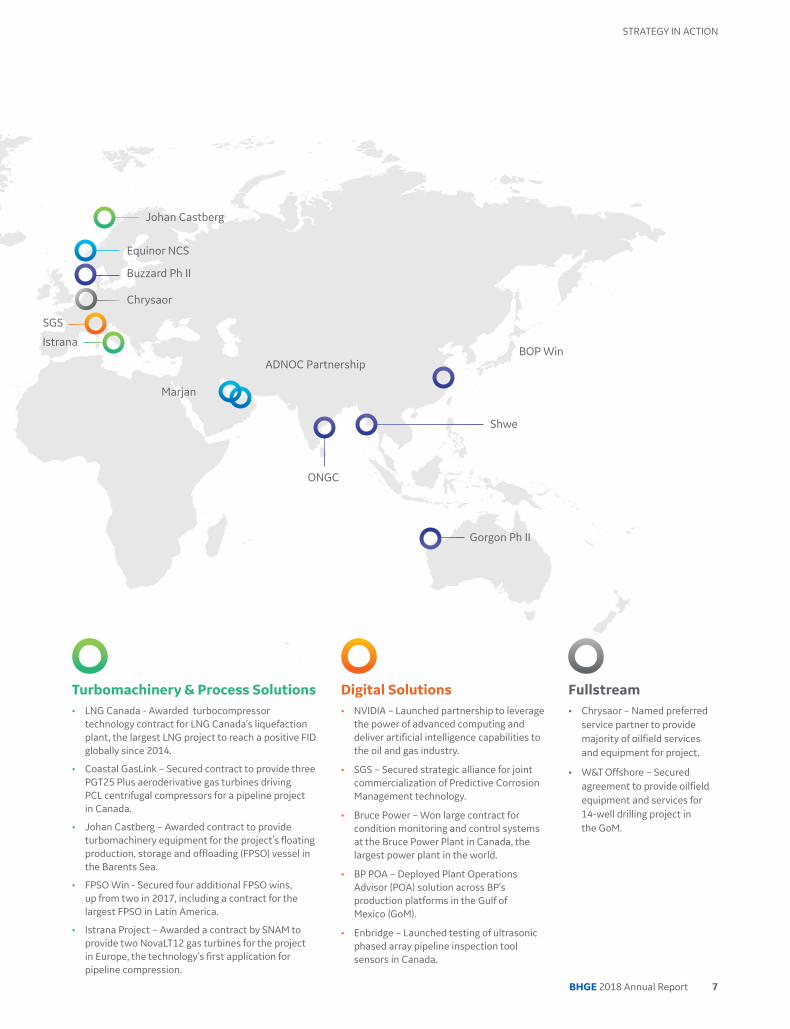
Oilfield Services Oilfield Equipment• Equinor NCS – Won major contract for large portion
of Equinor’s drilling and well construction activities across the most prolific fields in the Norwegian Continental Shelf.
• Marjan – Secured first large-scope integrated services contract for one of Saudi Aramco’s largest upstream developments.
• ADNOC Partnership – Launched innovative partnership with Abu Dhabi National Oil Company (ADNOC) to improve drilling efficiencies and expand well construction capabilities in the United Arab Emirates.
• Drilling Milestones – Delivered record performance for customers with our leading drilling solutions. In 2018, BHGE drilled over a mile a day in 118 wells in the Marcellus and Utica basins.
• Kinder Morgan – Secured five-year contract for 100% of customer’s electric submersible pump work in four Permian Basin fields.
• ONGC – Won major subsea contract to provide 34 trees for India Oil & Natural Gas Corporation’s largest deepwater project.
• Shwe – Awarded substantial subsea production system award for phase two of the Shwe gas field development in partnership with McDermott.
• Buzzard Phase II – Won contract to provide subsea production systems in North Sea, UK.
• Gorgon Phase II – Secured subsea production and completions contracts for one of the largest gas projects in the world.
• BOP Win – Won first new-build blowout preventer (BOP) order since 2014 for a semi-submersible drilling rig in Asia.
Winning Globally
STrATEGy IN ACTION
BHGE Inventing Smarter Ways6
In 2018, we introduced a long- term growth strategy to make ourselves more competitive and drive sustainable efficiency and productivity improvements for our customers. It starts with getting closer to our customers, understanding their challenges and aligning our offerings to their needs.
Throughout the year we made good progress on this strategy by securing a number of important wins, strengthening customer partnerships and delivering strong performance across the globe.
This map shows a selection our 2018 wins, partnerships and performance milestones, demonstrating the breadth and global reach of our portfolio.
Istrana
Johan Castberg
Equinor NCS
Buzzard Ph II
Chrysaor
SGS
ADNOC Partnership
Marjan
Shwe
BOP Win
ONGC
Gorgon Ph II
Turbomachinery & Process Solutions Digital Solutions Fullstream• LNG Canada - Awarded turbocompressor
technology contract for LNG Canada’s liquefaction plant, the largest LNG project to reach a positive FID globally since 2014.
• Coastal GasLink – Secured contract to provide three PGT25 Plus aeroderivative gas turbines driving PCL centrifugal compressors for a pipeline project in Canada.
• Johan Castberg – Awarded contract to provide turbomachinery equipment for the project’s floating production, storage and offloading (FPSO) vessel in the Barents Sea.
• FPSO Win - Secured four additional FPSO wins, up from two in 2017, including a contract for the largest FPSO in Latin America.
• Istrana Project – Awarded a contract by SNAM to provide two NovaLT12 gas turbines for the project in Europe, the technology’s first application for pipeline compression.
• NVIDIA – Launched partnership to leverage the power of advanced computing and deliver artificial intelligence capabilities to the oil and gas industry.
• SGS – Secured strategic alliance for joint commercialization of Predictive Corrosion Management technology.
• Bruce Power – Won large contract for condition monitoring and control systems at the Bruce Power Plant in Canada, the largest power plant in the world.
• BP POA – Deployed Plant Operations Advisor (POA) solution across BP’s production platforms in the Gulf of Mexico (GoM).
• Enbridge – Launched testing of ultrasonic phased array pipeline inspection tool sensors in Canada.
• Chrysaor – Named preferred service partner to provide majority of oilfield services and equipment for project.
• W&T Offshore – Secured agreement to provide oilfield equipment and services for 14-well drilling project in the GoM.
7BHGE 2018 Annual Report
STrATEGy IN ACTION

We are Fullstream
We leverage leading technology, global scale and an integrated offering to deliver products and services across the entire oil and gas value chain.
Upstream
Drilling
Evaluation
Completions and Production
Subsea
Midstream
Liquefied Natural Gas (LNG)
Pipeline
Storage
Downstream
Refining
Petrochemical and Fertilizer Processing
Industrial
Power and Renewables
Controls and Sensing
Digital
Sensors, software, advanced analytics and artificial intelligence, robotics and innovative edge device technology
We go to market through our four businesses, which benefit from multiple growth drivers and enable us to deliver through the cycle.
Oilfield Services
Leader in well construction and production with a strong global presence
Oilfield Equipment
Broad portfolio of subsea technology offerings and solutions
Turbomachinery & Process SolutionsTechnology leader in LNG and upstream production with significant installed base
Digital Solutions
Best-in-class sensing and measurement technology with differentiated software offering
Our teams of scientists and engineers develop, test and deploy innovative new technologies to support our customers across the fullstream from our Energy Innovation Center in Oklahoma City, Oklahoma, U.S.
BHGE Inventing Smarter Ways8
PoRTFoLio
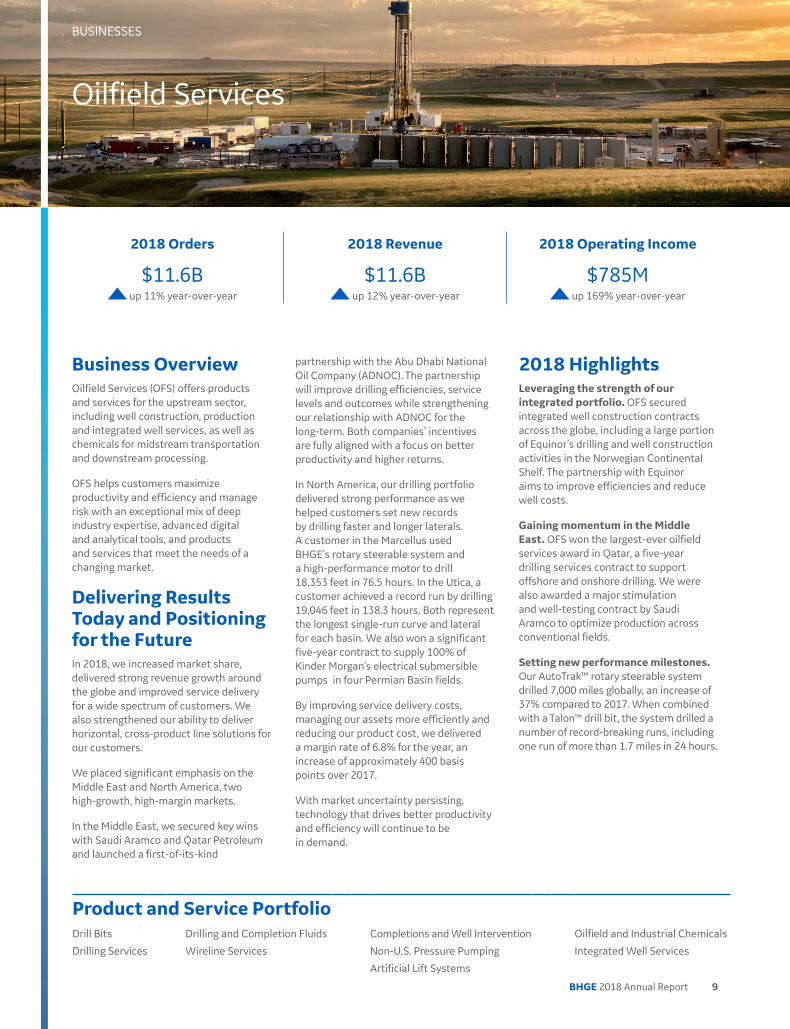
Oilfield Services
2018 Orders
$11.6B up 11% year-over-year
2018 Revenue
$11.6B up 12% year-over-year
2018 Operating Income
$785M up 169% year-over-year
Business OverviewOilfield Services (OFS) offers products and services for the upstream sector, including well construction, production and integrated well services, as well as chemicals for midstream transportation and downstream processing.
OFS helps customers maximize productivity and efficiency and manage risk with an exceptional mix of deep industry expertise, advanced digital and analytical tools, and products and services that meet the needs of a changing market.
Delivering Results Today and Positioning for the Future In 2018, we increased market share, delivered strong revenue growth around the globe and improved service delivery for a wide spectrum of customers. We also strengthened our ability to deliver horizontal, cross-product line solutions for our customers.
We placed significant emphasis on the Middle East and North America, two high-growth, high-margin markets.
In the Middle East, we secured key wins with Saudi Aramco and Qatar Petroleum and launched a first-of-its-kind
partnership with the Abu Dhabi National Oil Company (ADNOC). The partnership will improve drilling efficiencies, service levels and outcomes while strengthening our relationship with ADNOC for the long-term. Both companies’ incentives are fully aligned with a focus on better productivity and higher returns.
In North America, our drilling portfolio delivered strong performance as we helped customers set new records by drilling faster and longer laterals. A customer in the Marcellus used BHGE’s rotary steerable system and a high-performance motor to drill 18,353 feet in 76.5 hours. In the Utica, a customer achieved a record run by drilling 19,046 feet in 138.3 hours. Both represent the longest single-run curve and lateral for each basin. We also won a significant five-year contract to supply 100% of Kinder Morgan’s electrical submersible pumps in four Permian Basin fields.
By improving service delivery costs, managing our assets more efficiently and reducing our product cost, we delivered a margin rate of 6.8% for the year, an increase of approximately 400 basis points over 2017.
With market uncertainty persisting, technology that drives better productivity and efficiency will continue to be in demand.
BUSINESSES
Product and Service PortfolioDrill Bits
Drilling Services
Drilling and Completion Fluids
Wireline Services
Completions and Well Intervention
Non-U.S. Pressure Pumping
Artificial Lift Systems
Oilfield and Industrial Chemicals
Integrated Well Services
2018 HighlightsLeveraging the strength of our integrated portfolio. OFS secured integrated well construction contracts across the globe, including a large portion of Equinor’s drilling and well construction activities in the Norwegian Continental Shelf. The partnership with Equinor aims to improve efficiencies and reduce well costs.
Gaining momentum in the Middle East. OFS won the largest-ever oilfield services award in Qatar, a five-year drilling services contract to support offshore and onshore drilling. We were also awarded a major stimulation and well-testing contract by Saudi Aramco to optimize production across conventional fields.
Setting new performance milestones. Our AutoTrak™ rotary steerable system drilled 7,000 miles globally, an increase of 37% compared to 2017. When combined with a Talon™ drill bit, the system drilled a number of record-breaking runs, including one run of more than 1.7 miles in 24 hours.
9BHGE 2018 Annual Report
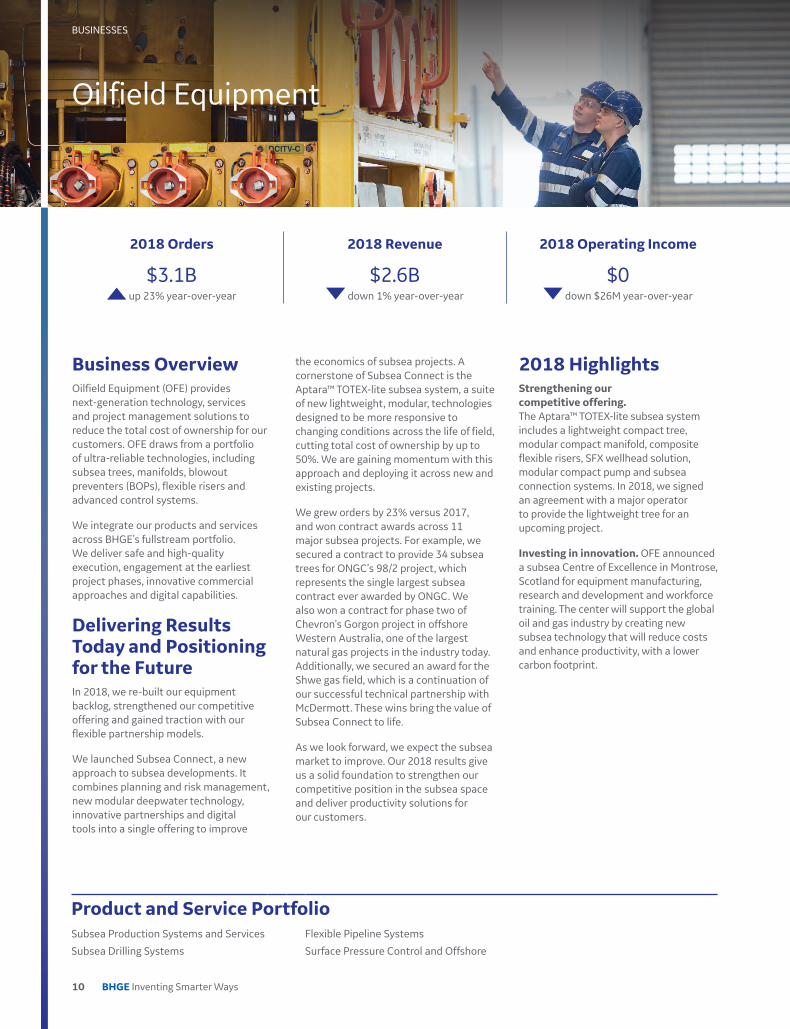
Business OverviewOilfield Equipment (OFE) provides next-generation technology, services and project management solutions to reduce the total cost of ownership for our customers. OFE draws from a portfolio of ultra-reliable technologies, including subsea trees, manifolds, blowout preventers (BOPs), flexible risers and advanced control systems.
We integrate our products and services across BHGE’s fullstream portfolio. We deliver safe and high-quality execution, engagement at the earliest project phases, innovative commercial approaches and digital capabilities.
Delivering Results Today and Positioning for the FutureIn 2018, we re-built our equipment backlog, strengthened our competitive offering and gained traction with our flexible partnership models.
We launched Subsea Connect, a new approach to subsea developments. It combines planning and risk management, new modular deepwater technology, innovative partnerships and digital tools into a single offering to improve
the economics of subsea projects. A cornerstone of Subsea Connect is the Aptara™ TOTEX-lite subsea system, a suite of new lightweight, modular, technologies designed to be more responsive to changing conditions across the life of field, cutting total cost of ownership by up to 50%. We are gaining momentum with this approach and deploying it across new and existing projects.
We grew orders by 23% versus 2017, and won contract awards across 11 major subsea projects. For example, we secured a contract to provide 34 subsea trees for ONGC’s 98/2 project, which represents the single largest subsea contract ever awarded by ONGC. We also won a contract for phase two of Chevron’s Gorgon project in offshore Western Australia, one of the largest natural gas projects in the industry today. Additionally, we secured an award for the Shwe gas field, which is a continuation of our successful technical partnership with McDermott. These wins bring the value of Subsea Connect to life.
As we look forward, we expect the subsea market to improve. Our 2018 results give us a solid foundation to strengthen our competitive position in the subsea space and deliver productivity solutions for our customers.
2018 Orders
$3.1B up 23% year-over-year
2018 Revenue
$2.6B down 1% year-over-year
2018 Operating Income
$0 down $26M year-over-year
Product and Service PortfolioSubsea Production Systems and Services
Subsea Drilling Systems
Flexible Pipeline Systems
Surface Pressure Control and Offshore
Oilfield Equipment
2018 HighlightsStrengthening our competitive offering. The Aptara™ TOTEX-lite subsea system includes a lightweight compact tree, modular compact manifold, composite flexible risers, SFX wellhead solution, modular compact pump and subsea connection systems. In 2018, we signed an agreement with a major operator to provide the lightweight tree for an upcoming project.
Investing in innovation. OFE announced a subsea Centre of Excellence in Montrose, Scotland for equipment manufacturing, research and development and workforce training. The center will support the global oil and gas industry by creating new subsea technology that will reduce costs and enhance productivity, with a lower carbon footprint.
BHGE Inventing Smarter Ways10
BUSINESSES

Business OverviewTurbomachinery & Process Solutions (TPS) provides rotating equipment and process flow and transmission technologies that maximize productivity, minimize risk and reduce project costs. TPS operates across onshore-and-offshore production, gas processing, pipeline, liquefied natural gas (LNG), refining, petrochemical and industrial sectors. TPS collaborates closely with customers to innovate and deliver long-term service agreements, digital analytics and monitoring and maintenance solutions.
TPS’s solutions offer equipment and support through the entire project lifecycle, including project management, engineering, construction, software applications and data analytics.
Delivering Results Today and Positioning for the FutureIn 2018, we strengthened our leading position in LNG and gained traction with our lower-megawatt product offering. We increased orders by 12% versus 2017, and won a number of important awards across our operating segments.
Throughout the year, we saw the re-emergence of the LNG market as the first new projects in several years were approved. We secured a major technology award for LNG Canada’s liquefaction plant in Kitimat, British Columbia. This is the largest LNG project to achieve a positive final investment decision globally since 2014, and the first large-scale LNG project to use modular liquefaction trains. We also signed an agreement to provide our LM9000 gas turbine technology for a large operator in the Eastern Hemisphere.
Our lower megawatt NovaLTTM 12 gas turbine was selected by SNAM for the Istrana project in Europe, the first application for pipeline compression. The technology was also selected for a floating production, storage and offloading vessel (FPSO) in Malaysia, demonstrating the versatility of our NovaLT family of gas turbines.
The expected LNG project acceleration presents strong growth opportunities. Our teams are working closely with our customers to meet their scheduling requirements. We are well positioned for 2019 and beyond.
2018 Orders
$6.6B up 12% year-over-year
2018 Revenue
$6B down 4% year-over-year
2018 Operating Income
$621M down 7% year-over-year
Product and Service PortfolioAeroderivative and Heavy-duty Gas Turbines
Small- to Medium-sized Steam Turbines
Centrifugal and Axial Compressors
Reciprocating Compressors
Process, Control and Safety Valves
Service Solutions
Turbomachinery & Process Solutions
2018 HighlightsStrengthening LNG leadership position: TPS delivered ahead of schedule critical turbomachinery equipment for the Yamal LNG project and partnered with Novatek on the successful start up of the third train, helping enable the plant operations to reach full capacity of 16.5 million tonnes per annum in less than a year after launch.
Gaining traction with our lower megawatt offerings: We announced a collaboration with H2U, Australia’s leading hydrogen infrastructure developer, to configure BHGE’s innovative NovaLT gas turbine to operate 100% on hydrogen for a “green” power plant facility in South Australia.
Investing in innovation: With our TPS iCenters in Florence, Houston and Kuala Lampur, we digitally connect our experts to more than 1,270 installed machines around the world to maximize asset performance and value for a facility’s full lifecycle, 24 hours a day. TPS’s Virtual Reality and 3D site scanning allows engineers to simulate on-site repairs and maintenance.
11BHGE 2018 Annual Report
BUSINESSES
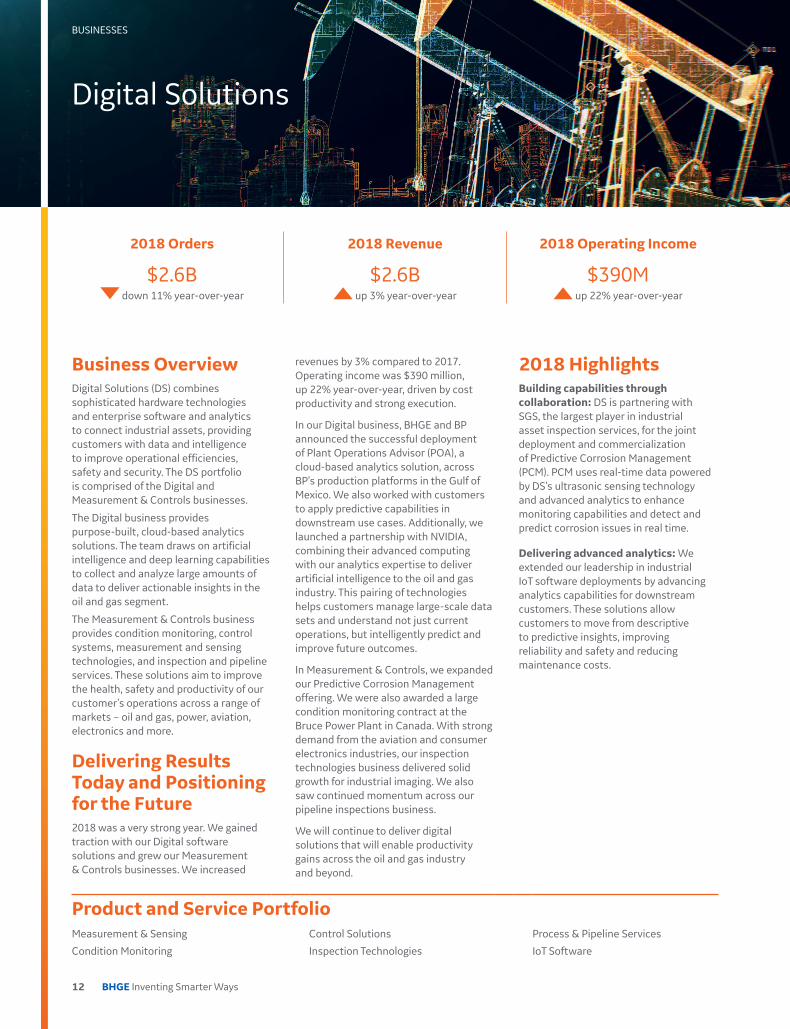
Digital Solutions
Business Overview Digital Solutions (DS) combines sophisticated hardware technologies and enterprise software and analytics to connect industrial assets, providing customers with data and intelligence to improve operational efficiencies, safety and security. The DS portfolio is comprised of the Digital and Measurement & Controls businesses.
The Digital business provides purpose-built, cloud-based analytics solutions. The team draws on artificial intelligence and deep learning capabilities to collect and analyze large amounts of data to deliver actionable insights in the oil and gas segment.
The Measurement & Controls business provides condition monitoring, control systems, measurement and sensing technologies, and inspection and pipeline services. These solutions aim to improve the health, safety and productivity of our customer’s operations across a range of markets – oil and gas, power, aviation, electronics and more.
Delivering Results Today and Positioning for the Future2018 was a very strong year. We gained traction with our Digital software solutions and grew our Measurement & Controls businesses. We increased
revenues by 3% compared to 2017. Operating income was $390 million, up 22% year-over-year, driven by cost productivity and strong execution.
In our Digital business, BHGE and BP announced the successful deployment of Plant Operations Advisor (POA), a cloud-based analytics solution, across BP’s production platforms in the Gulf of Mexico. We also worked with customers to apply predictive capabilities in downstream use cases. Additionally, we launched a partnership with NVIDIA, combining their advanced computing with our analytics expertise to deliver artificial intelligence to the oil and gas industry. This pairing of technologies helps customers manage large-scale data sets and understand not just current operations, but intelligently predict and improve future outcomes.
In Measurement & Controls, we expanded our Predictive Corrosion Management offering. We were also awarded a large condition monitoring contract at the Bruce Power Plant in Canada. With strong demand from the aviation and consumer electronics industries, our inspection technologies business delivered solid growth for industrial imaging. We also saw continued momentum across our pipeline inspections business.
We will continue to deliver digital solutions that will enable productivity gains across the oil and gas industry and beyond.
2018 Orders
$2.6B down 11% year-over-year
2018 Revenue
$2.6B up 3% year-over-year
2018 Operating Income
$390M up 22% year-over-year
Product and Service PortfolioMeasurement & Sensing
Condition Monitoring
Control Solutions
Inspection Technologies
Process & Pipeline Services
IoT Software
2018 HighlightsBuilding capabilities through collaboration: DS is partnering with SGS, the largest player in industrial asset inspection services, for the joint deployment and commercialization of Predictive Corrosion Management (PCM). PCM uses real-time data powered by DS’s ultrasonic sensing technology and advanced analytics to enhance monitoring capabilities and detect and predict corrosion issues in real time.
Delivering advanced analytics: We extended our leadership in industrial IoT software deployments by advancing analytics capabilities for downstream customers. These solutions allow customers to move from descriptive to predictive insights, improving reliability and safety and reducing maintenance costs.
BHGE Inventing Smarter Ways12
BUSINESSES

The future of the industry will be determined by better productivity, higher returns on capital and a smaller carbon footprint. Technology plays a central role.
Investing in InnovationMaintaining our innovation leadership requires investment, speed and research capabilities. In 2018, we increased our Research & Development (R&D) investment by 10% to $700 million. We are creating customer solutions faster, while maintaining capital discipline. Our focus areas include:
• Edge Intelligence. BHGE is disrupting the industry’s approach to on-site analytics and controls. Our customers make critical decisions in the field every day. BHGE is investing in innovative edge devices to help our customers capture and analyze the right data closer to the source. This enables quick and accurate decisions to improve operations.
• Additive Manufacturing. BHGE is changing how our industry creates parts and processes with additive manufacturing. We have established a global additive manufacturing technology network with a mission to bring commercial-scale production closer to customers. This reduces product development time, transportation impact and associated emissions, while improving product performance.
• Low-carbon Technology. BHGE is committed to investing in smarter technologies and solutions that reduce our own environmental impact and help lower carbon emissions for our customers.
Accelerating the Pace of InnovationWe are transforming the way we innovate to bring new products to market faster.
• In 2018, we launched our Energy Innovation Center (EIC), a fully-functional R&D center focused on accelerating commercialization through unique commercial models and partnerships. The teams work as start-ups and incubators and collaborate closely with customers, technology partners, entrepreneurs and university partners. This enables us to tailor solutions to a specific problem or need, and develop, test and launch new technology into the market quickly.
• We also founded an early-stage technology development venture associated with the EIC that will identify, invest and grow emerging technologies for the energy sector.
BHGE employee at our Turbomachinery & Process Solutions Additive Laboratory.
Commercializing Innovation
UpstreamDigital Core Analysis. Digital Core Analysis (DCA) brings next-level formation evaluation data and reservoir insights. This service leverages CT technology to create 3D digital maps of core rock properties 10 times faster and at 1,000 times higher resolution than conventional core analysis. This helps our customers accelerate completions decisions and improve reserves estimates.
MidstreamLM9000 Gas Turbine. Introduced in 2017, the LM9000 aeroderivative gas turbine was designed to allow the liquefied natural gas (LNG) train to start in a fully pressurized condition without venting process gas. Its flexible fuel technology reduces emissions while eliminating water use in emissions abatement. The LM9000 delivers a 50% longer maintenance interval, 20% more power and 40% lower NOx emissions, resulting in 20% lower cost of ownership for LNG customers.
Downstream The flare.IQ solution. flare.IQ is a hardware and software solution to help control flare gas in refineries and petrochemical plants. It is designed to help customers meet federal regulations related to the Clean Air Act. The solution will also help reduce operational costs by decreasing the amount of fuel and steam traditionally used to minimize emissions.
2018 Highlights
~2,700Patents Issued Globally in 2018
9,000+Engineers and Scientists
10Global Technology Centers
100+New Product Launches
Inventing Smarter Ways to Innovate and Deliver New Technology
TECHNOLOGY & INNOVATION
13BHGE 2018 Annual Report
The Framework for Our Sustainable FutureOur environmental, social and governance (ESG) activities and investments are prioritized around people, planet and principles.
PeopleWe are building a culture that drives collaboration and innovation, supports talent development and makes an impact in communities where we live and work.
Since becoming one BHGE team in July 2017, we have been fostering our own culture that guides everything we do and how we do it. In 2018, we continued on our culture journey, reaffirming our commitment to diversity and inclusion (D&I), enhancing our talent development strategy and driving economic growth in our communities.
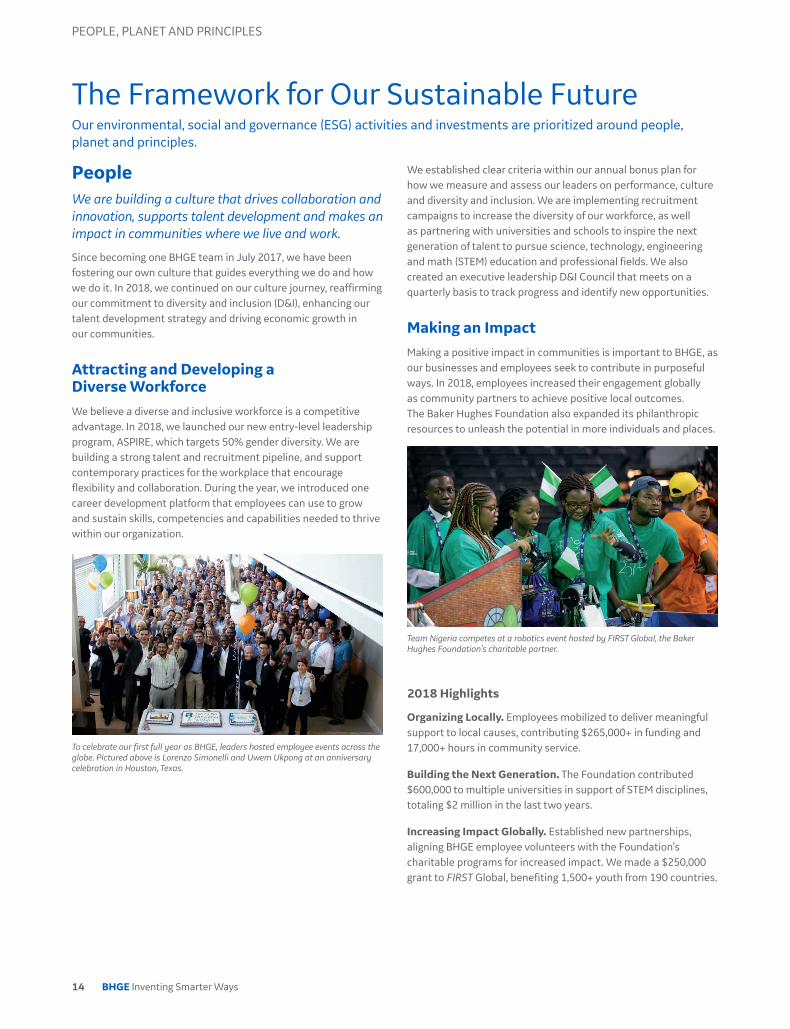
Attracting and Developing a Diverse Workforce We believe a diverse and inclusive workforce is a competitive advantage. In 2018, we launched our new entry-level leadership program, ASPIRE, which targets 50% gender diversity. We are building a strong talent and recruitment pipeline, and support contemporary practices for the workplace that encourage flexibility and collaboration. During the year, we introduced one career development platform that employees can use to grow and sustain skills, competencies and capabilities needed to thrive within our organization.
To celebrate our first full year as BHGE, leaders hosted employee events across the globe. Pictured above is Lorenzo Simonelli and Uwem Ukpong at an anniversary celebration in Houston, Texas.
We established clear criteria within our annual bonus plan for how we measure and assess our leaders on performance, culture and diversity and inclusion. We are implementing recruitment campaigns to increase the diversity of our workforce, as well as partnering with universities and schools to inspire the next generation of talent to pursue science, technology, engineering and math (STEM) education and professional fields. We also created an executive leadership D&I Council that meets on a quarterly basis to track progress and identify new opportunities.
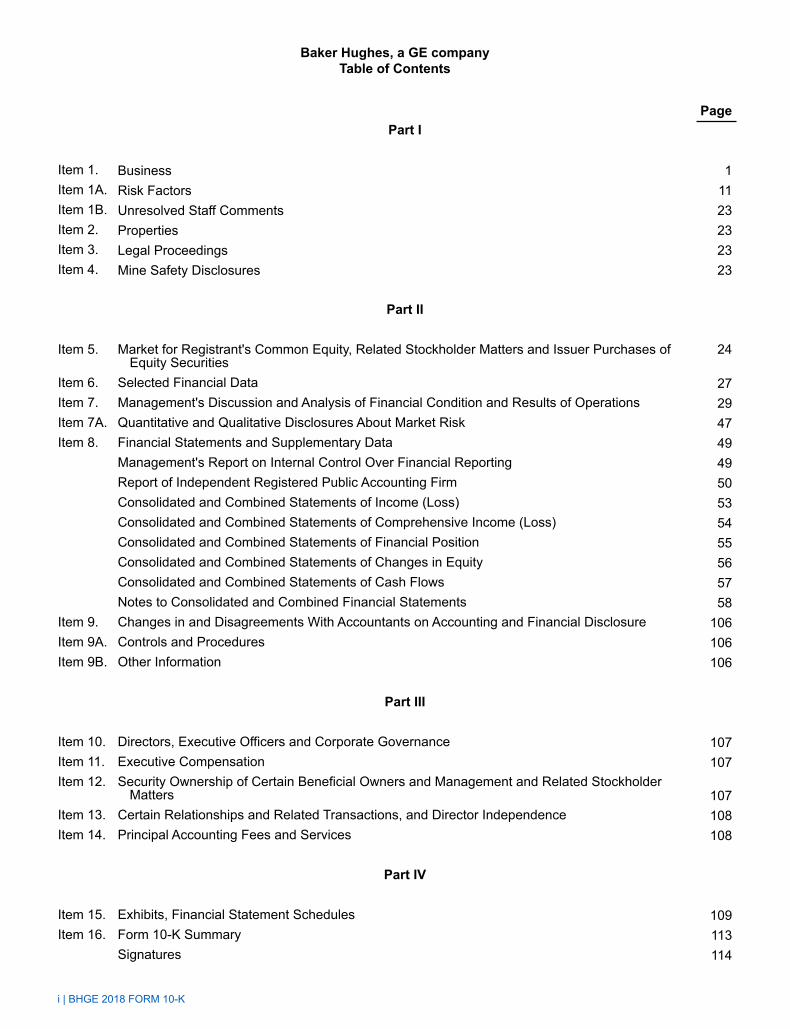
Making an Impact Making a positive impact in communities is important to BHGE, as our businesses and employees seek to contribute in purposeful ways. In 2018, employees increased their engagement globally as community partners to achieve positive local outcomes. The Baker Hughes Foundation also expanded its philanthropic resources to unleash the potential in more individuals and places.
Team Nigeria competes at a robotics event hosted by FIRST Global, the Baker Hughes Foundation’s charitable partner.
2018 Highlights
Organizing Locally. Employees mobilized to deliver meaningful support to local causes, contributing $265,000+ in funding and 17,000+ hours in community service.
Building the Next Generation. The Foundation contributed $600,000 to multiple universities in support of STEM disciplines, totaling $2 million in the last two years.
Increasing Impact Globally. Established new partnerships, aligning BHGE employee volunteers with the Foundation’s charitable programs for increased impact. We made a $250,000 grant to FIRST Global, benefiting 1,500+ youth from 190 countries.
PEOPLE, PLANET AND PRINCIPLES
14 BHGE Inventing Smarter Ways

PlanetWe are stewards of the environment, inventing technologies to reduce negative impact, while using our own resources wisely.
Concerns over climate change are driving regulatory and policy changes, shifting demand patterns and increasing attention on cleaner fossil fuel solutions. The need for action is stronger and more focused than ever, and attention is on us as an industry. At BHGE, we believe we have an important role to play in society as an industry leader and partner to our customers.
Committing to a Net-Zero Emissions Future We have a long history of pushing the boundaries of technology and operating efficiency to lessen our environmental impact. At the beginning of 2019, we made a commitment to further reduce our own footprint of CO2 equivalent emissions by 50% by 2030 and achieve net zero by 2050*. We are making good progress. Since 2012, we have reduced our carbon emissions 26% through improvements in sustainable building practices, manufacturing, logistics and supply chain. We will continue reducing our own emissions through energy efficiency and operational improvements. We remain committed to transparent external reporting of our emission reduction to organizations such as the CDP, formerly known as the Carbon Disclosure Project.
Expanding Our Portfolio of Clean Energy Solutions We are also committed to helping our customers reduce their carbon footprint. We are expanding our portfolio of low-carbon solutions by bringing innovative new products and services to market. For example, we are developing a full-suite of methane monitoring and inspection solutions capable of streaming live data from sensors to a cloud-based software for real-time results.
BHGE’s LUMEN technology, a ground-and drone-based advanced methane detection and reduction system, helps our customers reduce their impact on the environment and supports our low-carbon goals.
PrinciplesWe are guided by a series of “non-negotiables” in the areas of health, safety and environment (HSE); compliance and integrity; and quality.
Protecting People and the Environment HSE is ingrained in our DNA. We strive to make every day one without injuries, accidents, illness or harm to the environment. We call it the “Perfect HSE Day.” We empower our employees to own our HSE performance, and we hold each other accountable. In 2018, we achieved 153 Perfect HSE Days, which is a 20% improvement versus 2017.
Ensuring Integrity & Compliance, and QualityWe adhere to the high ethical standards that our stakeholders expect of us, and—more importantly—that we expect of ourselves.
We foster a culture of complete compliance through sound governance, effective policies and guidelines, and open channels of reporting. Our employees are expected to follow BHGE’s Code of Conduct, Company policies and procedures, and all laws and regulations. Our global ethics and compliance program is designed to prevent, detect and manage any potential violations to these rules and regulations. In 2018, we rolled out the Completely Compliant framework and provided resources to all employees across the organization.
We are committed to delivering the best quality products, services and processes in the industry. In 2018, we implemented one enterprise quality management system to standardize, track and manage the “cost of quality” to reduce waste and improve profitability. We also hosted “World Quality Day,” a series of events across the globe dedicated to highlighting quality as a core non-negotiable and showing how all employees play a role in building and sustaining our reputation.
Employees were challenged to reflect, discuss and demonstrate their commitment to Quality during World Quality Day.
* BHGE’s 2030 emissions reduction targets and performance are based on scope 1 & 2 emissions for 2017 and baseline year 2012, as reported to the Carbon Disclosure Project. Learn more in BHGE’s 2017 Health, Safety, Environment and Social Responsibility Report https://www.bhge.com/system/files/2018-07/2017_bhge_hsesr_report_.pdf
15BHGE 2018 Annual Report
PEOPLE, PLANET AND PRINCIPLES

LEFT TO RIGHT: (back row) Kevin Wetherington, Will Marsh, Rod Christie, Harry Elsinga, Neil Saunders, (middle row) Rami Qasem, Lorenzo Simonelli, Derek Mathieson, Jennifer Hartsock, (front row) Brian Worrell, Jody Markopoulos, Maria Claudia Borras, Uwem Ukpong.
Lorenzo Simonelli Chairman, President and Chief Executive OfficerLorenzo Simonelli is Chairman, President and Chief Executive Officer (CEO). Previously, he served as GE Senior Vice President and President and CEO of GE Oil & Gas. He has more than 20 years of executive leadership experience.
Jody Markopoulos Chief Transition OfficerJody Markopoulos previously served as Chief Supply Chain Officer for BHGE and has 25 years of industrial operating experience.
Neil Saunders President and CEO, Oilfield EquipmentNeil Saunders is President and CEO, Oilfield Equipment. Prior to his role, he served as President and CEO of Subsea Systems and Drilling for GE Oil & Gas. He has more than 25 years of experience in the upstream oil and gas industry.
Maria Claudia Borras President and CEO, Oilfield ServicesMaria Claudia Borras is President and CEO of Oilfield Services. Previously, she served as Chief Commercial Officer for GE Oil & Gas. Maria has more than 25 years of oil and gas industry experience.
Will Marsh Chief Legal Officer
Will Marsh is Chief Legal Officer. Previously, he served as Vice President and General Counsel for Baker Hughes Incorporated. He has more than 30 years of legal experience.
Uwem Ukpong Chief Global Operations OfficerUwem Ukpong is Chief Global Operations Officer. Previously, he served as Chief Integration Officer for BHGE and has more than 25 years of experience across the oil and gas industry.
Rod Christie President and CEO, Turbomachinery & Process SolutionsRod Christie is President and CEO of Turbomachinery & Process Solutions. Previously, he served as President and CEO, Turbomachinery & Process Solutions for GE Oil & Gas and has more than 30 years of industry experience.
Derek Mathieson Chief Marketing and Technology OfficerDerek Mathieson is Chief Marketing and Technology Officer. Previously, he served as Chief Integration Officer for Baker Hughes Incorporated and has more than 20 years of industry experience.
Kevin Wetherington Chief HSE, Security & Quality Officer
Kevin Wetherington is Chief HSE, Security & Quality Officer. Previously, he served as President, North America for BHGE and brings 27 years of experience in the oilfield service industry.
Harry Elsinga Chief Human Resources OfficerHarry Elsinga is Chief Human Resources Officer. Prior to this role, he served as Vice President, Human Resources (HR) for GE Oil & Gas. He has more than 20 years of specialized HR expertise.
Rami Qasem President and CEO, Measurement & ControlsRami Qasem is President and CEO, Measurement & Controls. He most recently served as President, Middle East, North Africa, Turkey and India for BHGE and has nearly 25 years of industry experience.
Brian Worrell Chief Financial OfficerBrian Worrell is BHGE’s Chief Financial Officer (CFO). Prior to this role, he served as CFO of GE Oil & Gas and has 27 years of experience.
Jennifer Hartsock Chief Information OfficerJennifer Hartsock is Chief Information Officer. Most recently she served as Global Chief Information Officer for GE Oil & Gas. She has more than 20 years of IT experience.
ExECUTIVE LEADERSHIP
BHGE Inventing Smarter Ways16

UNITED STATES
SECURITIES AND EXCHANGE COMMISSIONWashington, D.C. 20549
Form 10-K[X] ANNUAL REPORT PURSUANT TO SECTION 13 OR 15(d) OF THE SECURITIES EXCHANGE ACT OF 1934
FOR THE FISCAL YEAR ENDED DECEMBER 31, 2018
OR
[ ] TRANSITION REPORT PURSUANT TO SECTION 13 OR 15(d)OF THE SECURITIES EXCHANGE ACT OF 1934
Commission file number 1-38143
Baker Hughes, a GE company(Exact name of registrant as specified in its charter)
Delaware 81-4403168(State or other jurisdiction of incorporation or organization) (I.R.S. Employer Identification No.)
17021 Aldine Westfield Road, Houston, Texas 77073-5101(Address of principal executive offices) (Zip Code)
Registrant's telephone number, including area code: (713) 439-8600Securities registered pursuant to Section 12(b) of the Act:
Title of each class Name of each exchange on which registeredClass A Common Stock, $0.0001 Par Value per Share New York Stock ExchangeClass B Common Stock, $0.0001 Par Value per Share -
Securities registered pursuant to Section 12(g) of the Act: None
Indicate by check mark if the registrant is a well-known seasoned issuer, as defined in Rule 405 of the Securities Act. YES [X] NO [ ]
Indicate by check mark if the registrant is not required to file reports pursuant to Section 13 or 15(d) of the Act. YES [ ] NO [X]
Indicate by check mark whether the registrant (1) has filed all reports required to be filed by Section 13 or 15(d) of the Securities Exchange Act of 1934 during the preceding 12 months (or for such shorter period that the registrant was required to file such reports), and (2) has been subject to such filing requirements for the past 90 days. YES [X] NO [ ]
Indicate by check mark whether the registrant has submitted electronically every Interactive Data File required to be submitted pursuant to Rule 405 of Regulation S-T (§232.405 of this chapter) during the preceding 12 months (or for such shorter period that the registrant was required to submit such files). YES [X] NO [ ]
Indicate by check mark if disclosure of delinquent filers pursuant to Item 405 of Regulation S-K (§229.405 of this chapter) is not contained herein, and will not be contained, to the best of registrant's knowledge, in definitive proxy or information statements incorporated by reference in Part III of this Form 10-K or any amendment to this Form 10-K. [ ]
Indicate by check mark whether the registrant is a large accelerated filer, an accelerated filer, a non-accelerated filer, a smaller reporting company or an emerging growth company. See the definitions of "large accelerated filer," "accelerated filer" "smaller reporting company" and "emerging growth company" in Rule 12b-2 of the Exchange Act. (Check one):
Large accelerated filer Accelerated filer Non-accelerated filer Smaller reporting company Emerging growth company
If an emerging growth company, indicate by check mark if the registrant has elected not to use the extended transition period for complying with any new or revised financial accounting standards provided pursuant to Section 13(a) of the Exchange Act. [ ]
Indicate by check mark whether the registrant is a shell company (as defined in Rule 12b-2 of the Act). YES [ ] NO [X]
The aggregate market value of the voting and non-voting common stock held by non-affiliates of the registrant as of the last business day of the registrant’s most recently completed second fiscal quarter (based on the closing price on June 30, 2018 reported by the New York Stock Exchange) was approximately $12,108,399,000.
As of February 8, 2019, the registrant had outstanding 514,871,270 shares of Class A Common Stock, $0.0001 par value per share and 521,543,095 shares of Class B Common Stock, $0.0001 par value per share.
DOCUMENTS INCORPORATED BY REFERENCE
Portions of Registrant's Definitive Proxy Statement for the 2019 Annual Meeting of Stockholders are incorporated by reference into Part III of this Form 10-K.
i | BHGE 2018 FORM 10-K
Baker Hughes, a GE companyTable of Contents
PagePart I
Item 1. BusinessItem 1A. Risk FactorsItem 1B. Unresolved Staff CommentsItem 2. PropertiesItem 3. Legal ProceedingsItem 4. Mine Safety Disclosures
Part II
Item 5. Market for Registrant's Common Equity, Related Stockholder Matters and Issuer Purchases of Equity Securities
Item 6. Selected Financial DataItem 7. Management's Discussion and Analysis of Financial Condition and Results of OperationsItem 7A. Quantitative and Qualitative Disclosures About Market RiskItem 8. Financial Statements and Supplementary Data
Management's Report on Internal Control Over Financial ReportingReport of Independent Registered Public Accounting FirmConsolidated and Combined Statements of Income (Loss)Consolidated and Combined Statements of Comprehensive Income (Loss)Consolidated and Combined Statements of Financial PositionConsolidated and Combined Statements of Changes in EquityConsolidated and Combined Statements of Cash FlowsNotes to Consolidated and Combined Financial Statements
Item 9. Changes in and Disagreements With Accountants on Accounting and Financial DisclosureItem 9A. Controls and ProceduresItem 9B. Other Information
Part III
Item 10. Directors, Executive Officers and Corporate GovernanceItem 11. Executive CompensationItem 12. Security Ownership of Certain Beneficial Owners and Management and Related Stockholder
MattersItem 13. Certain Relationships and Related Transactions, and Director IndependenceItem 14. Principal Accounting Fees and Services
Part IV
Item 15. Exhibits, Financial Statement SchedulesItem 16. Form 10-K Summary
Signatures
11123232323
24
272947494950535455565758
106106106
107107
107108108
109113114
BHGE 2018 FORM 10-K | 1
PART I
ITEM 1. BUSINESS
Baker Hughes, a GE company (the Company, BHGE, we, us, or our), a Delaware corporation, was formed on October 28, 2016, for the purpose of facilitating the combination of Baker Hughes Incorporated, a Delaware corporation (Baker Hughes or BHI), and the oil and gas business (GE O&G) of General Electric Company (GE).
On July 3, 2017, we closed our business combination (the Transactions) to combine GE O&G and Baker Hughes creating a fullstream oilfield technology provider that has a unique mix of integrated equipment and service capabilities. As a result of the Transactions, substantially all of the business of GE O&G and of Baker Hughes was transferred to a subsidiary of the Company, Baker Hughes, a GE company, LLC (BHGE LLC) with GE having an economic interest of approximately 62.5% and the Company having an economic interest of approximately 37.5% of BHGE LLC. The Transactions were treated as a “reverse acquisition” for accounting purposes and, as such, the historical financial statements of the accounting acquirer, GE O&G, are the historical financial statements of the Company. The historical financial results in the combined financial statements presented may not be indicative of the results that would have been achieved had GE O&G operated as a separate, stand-alone entity during those periods.
As of December 31, 2018, GE held approximately 50.4% of the economic interest and the Company held approximately 49.6% of the economic interest in BHGE LLC. Although we hold a minority economic interest in BHGE LLC, we conduct and exercise full control over all its activities, without the approval of any other member. Accordingly, we consolidate the financial results of BHGE LLC and report a noncontrolling interest in our consolidated and combined financial statements for the economic interest in BHGE LLC not held by us. We are a holding company and have no material assets other than our ownership interest in BHGE LLC and certain intercompany and tax related balances. BHGE LLC is a Securities and Exchange Commission (SEC) Registrant with separate filing requirements with the SEC and its separate financial information can be obtained from www.sec.gov.
In June 2018, GE announced their intention to pursue an orderly separation from BHGE over time. On November 13, 2018, we entered into a Master Agreement and a series of related ancillary agreements and binding term sheets with GE (collectively, the Master Agreement Framework) designed to further solidify the commercial and technological collaborations between us and GE and to facilitate our ability to transition from operating as a controlled company. In particular, the Master Agreement Framework contemplates long-term agreements between us and GE on technology, fulfillment and other key areas to provide greater clarity to customers, employees and shareholders. For a discussion of certain risks associated with the separation, including risks related to our business, financial condition and results of operations, see “Item 1A. Risk Factors-Risks Factors Related to the Transactions and Separation from GE.” For further details on the Master Agreement Framework, see "Note 18. Related Party Disclosures" of the Notes to Consolidated and Combined Financial Statements in Item 8 herein.
Secondary Offering and LLC Units Repurchase
In November 2018, we also completed an underwritten secondary public offering in which GE and its affiliates (together, the selling stockholders) sold 101.2 million shares of our Class A common stock. We did not receive any proceeds from the shares sold by the selling stockholders in this offering. The offering included the exchange by the selling stockholders of common units of BHGE LLC (Units) (together with the corresponding shares of our Class B common stock) for our Class A common stock, which resulted in increases in capital in excess of par value, with offsetting reductions in noncontrolling interests and other comprehensive income.
Also, in November 2018, we repurchased 65 million BHGE LLC Units (together with the corresponding shares of our Class B common stock) from GE and its affiliates for $1.5 billion, or $22.48 per unit, which is the same per share price, net of discounts and commissions, paid by the underwriters to the selling stockholders in the offering (the repurchase). In connection with the repurchase, the corresponding shares of Class B common stock held by GE and its affiliates were canceled. As a result of the secondary offering and the repurchase, GE's economic interest in BHGE LLC was reduced from approximately 62.5% to approximately 50.4%. If GE's economic interest in BHGE LLC falls below 50%, they would not have a controlling interest. Any future declines in their ownership would be accounted for by us as equity transactions reducing their noncontrolling interests.

2 | BHGE 2018 FORM 10-K
OUR VISION
We are the industry’s only fullstream oilfield services company with an offering that spans the entire oil and gas value chain. In 2018, we generated revenue of $22.9 billion and conducted business in more than 120 countries. With the breadth of our portfolio, innovative technology solutions and unique business and partnership models, we are positioned to deliver outcome-based solutions across the industry. By integrating Health, Safety & Environment (HSE) into everything we do, we protect our people, our customers, and the environment. We believe in doing the right thing every time, and delivering the best quality and safest products, services, processes, solutions, and technologies in the industry.
The oil and gas macroeconomic environment continues to be dynamic, and we believe the industry is going through a transformation that requires a change in how we work. Irrespective of commodity prices, our customers are focused on reducing both capital and operating expenditures. Our customers expect new models and solutions to deliver sustainable productivity improvements and leverage economies of scale, with a lower carbon footprint. We have developed a comprehensive growth strategy to deliver the productivity improvements the industry needs for the next decade and beyond. Our strategy is based on three growth pillars:
• We have market-leading product companies focused on reducing product and service costs, while improving equipment efficiency and reliability to reduce total project spend.
• We strive to create value through integrated offerings by reducing the number of interfaces as we deliver projects and services. This reduces complexity, drives speed, and increases execution efficiency, and
• We plan to continue to develop fullstream opportunities that drive value creation through improvements in total cost reduction and productivity increases for the industry.
Additionally, managing carbon emissions is an important strategic focus for our business. We believe we have an important role to play in society as an industry leader and partner. BHGE has a long legacy of pushing the boundaries of technology and operating efficiency. In January 2019, we made a commitment to reduce CO2 equivalent (eq.) emissions 50 percent by 2030, achieving net-zero CO2 eq. emissions by 2050. We will also invest in our portfolio of advanced technologies to assist customers with reducing their carbon footprint.
We have already achieved a 26% reduction in its emissions since 2012 through a commitment to new technology and operational efficiencies. We will continue to employ a broad range of emissions reduction initiatives across manufacturing, supply chain, logistics, energy sourcing and generation. We have established a global additive manufacturing technology network with a mission to bring commercial-scale production closer to customers, reducing transportation impact and associated emissions.
We expect to benefit from the following:
• Complete fullstream portfolio. Leading portfolio of products, services and expertise capable of serving upstream, midstream/liquefied natural gas (LNG) and downstream sectors of the oil and gas industry, matching oilfield service and equipment leaders in many areas. We deliver across the value chain through our four product companies: Oilfield Services; Oilfield Equipment; Turbomachinery & Process Solutions; and Digital Solutions as discussed below under "Products and Services, and each are among the top four providers in their respective segments.
• Technology. We have a culture built on a heritage of innovation and invention in research and development, with complementary capabilities. Technology remains a differentiator for us, and a key enabler to drive the efficiency and productivity gains our customers need. We also have a range of technologies that support our customers efforts to reduce their carbon footprint. We remain committed to investing in our products and services to maintain our leadership position across our offerings, including $700 million research & development spend in 2018.
• Digital capabilities. We expect to be able to continue to develop software offerings on any operating platform, for new and extended applications in the oil and gas and other industrial ecosystems, such as machine and equipment health, reliability management and maintenance optimization.
BHGE 2018 FORM 10-K | 3
We believe our strategy coupled with our capabilities will help us compete and win in the current environment, while positioning us for the future.
ORDERS AND REMAINING PERFORMANCE OBLIGATIONS
We are a global business and generate revenue and orders from a combination of equipment sales and services. In 2018, 40% of revenue was generated from equipment sales and 60% from services, while 42% of orders were for equipment and 58% for services. In 2017 and 2016, 42% and 47% of revenue was generated from equipment sales, and 58% and 53% of revenue was from services, respectively. We recognized orders of $23,904 million, $17,159 million, and $11,066 million in 2018, 2017 and 2016, respectively. As of December 31, 2018, 2017 and 2016, the aggregate amount of transaction price allocated to unsatisfied (or partially unsatisfied) performance obligations totaled $21.0 billion, $21.0 billion, and $21.8 billion, respectively.
Our statement of income (loss) displays sales and costs of sales in accordance with SEC regulations under which “goods” is required to include all sales of tangible products and “services” must include all other sales, including other services activities. For the amounts shown above, as well as in the orders included in Management’s Discussion and Analysis of Financial Condition and Results of Operations included in Item 7 in this Form 10-K, we distinguish between “equipment” and “product services,” where product services refers to sales under product services agreements, including sales of both goods (such as spare parts and equipment upgrades) and related services (such as monitoring, maintenance and repairs), which is an important part of its operations. We refer to “product services” simply as “services” within this Business section and the Management’s Discussion and Analysis of Financial Condition and Results of Operations included in Item 7 in this Form 10-K.
Remaining performance obligations (RPO), a defined term under generally accepted accounting principles (GAAP), are unfilled customer orders for products and product services excluding any purchase order that provides the customer with the ability to cancel or terminate without incurring a substantive penalty, even if the likelihood of cancellation is remote based on historical experience. For product services, an amount is included for the expected life of the contract.
PRODUCTS AND SERVICES
We are a fullstream provider of oilfield products, services and digital solutions. Our reportable segments, which are the same as our operating segments, are organized based on the nature of our markets and customers. We report our operating results through our four operating segments that consist of similar products and services within each segment as described below.
Oilfield Services
The Oilfield Services (OFS) segment provides products and services for on and offshore operations across the lifecycle of a well, ranging from drilling, evaluation, completion, production, and intervention. The segment includes product lines that design and manufacture products and services to help operators find, evaluate, drill, and produce hydrocarbons.
Products and services include diamond and tri-cone drill bits, drilling services, including directional drilling technology, measurement while drilling and logging while drilling, wireline services, drilling and completions fluids, completions tools and systems, wellbore intervention tools and services, artificial lift systems, and oilfield and industrial chemicals.
OFS’ core evaluation and drilling technologies provide greater understanding of the subsurface to enable smoother, faster drilling and precise wellbore placement, leading to improved recovery and project economics. With the industry’s broadest completions portfolio, OFS can provide tailored well integrity solutions for all well types. Drawing from a wide range of artificial lift technology, coupled with enterprise optimization software, OFS can help lower the cost per barrel for the life of an asset.
Our customers include the large integrated major and super-major oil and natural gas companies, U.S. and international independent oil and natural gas companies and the national or state-owned oil companies as well as oilfield service companies.
4 | BHGE 2018 FORM 10-K
Oilfield Equipment
The Oilfield Equipment (OFE) segment provides a broad portfolio of products and services required to facilitate the safe and reliable flow of hydrocarbons from the subsea wellhead to the surface production facilities. The OFE operation designs and manufactures onshore and offshore drilling and production systems and equipment for floating production platforms and provides a full range of services related to onshore and offshore drilling activities.
The OFE segment includes deepwater drilling equipment, subsea production systems (SPS), flexible pipe systems, onshore wellheads, and related service solutions. The OFE drilling and production systems product line offers blowout preventers, control systems, marine drilling risers, wellhead connectors, diverters, and related services. OFE offers SPS, including trees, control systems, manifolds, connections, wellheads, specialty connectors & pipes, installation and decommissioning solutions, and related services. OFE also provides advanced flexible pipe products including risers, flowlines, fluid transfer lines and jumpers, for both subsea and FPSO (floating production storage & offloading) based production across a range of operating environments. Investment in composite technology is enabling BHGE to extend the capabilities of BHGE’s flexibles even further. In addition, OFE offers a full range of onshore wellhead products, flow equipment, valves, actuators, as well as related services. OFE also offers a range of comprehensive, worldwide services for installation, technical support, well access through subsea intervention systems, operating resources and tools, offshore products and brownfield asset integrity solutions.
OFE customers are oil and gas field developers, drilling and oil companies seeking to undertake new subsea projects, mid-life upgrades and maintenance, well interventions and workover campaigns. OFE differentiates itself in SPS and deepwater drilling systems. The key competitive areas in OFE are large-bore gas fields, deepwater oilfields and fields with long tieback distances. In addition to a robust presence in other subsea areas, including high-pressure high-temperature (HPHT) fields, OFE’s product lines’ production systems are among the industry’s most reliable, with uptime of the critical control system exceeding 99.8%.
Turbomachinery & Process Solutions
The Turbomachinery & Process Solutions (TPS) segment provides equipment and related services for mechanical-drive, compression and power-generation applications across the oil and gas industry as well as products and services to serve the downstream segments of the industry including refining, petrochemical, distributed gas, flow and process control, and other industrial applications. The TPS segment is a leader in designing, manufacturing, maintaining and upgrading rotating equipment across the oil and gas, petrochemical, and industrial sectors.
The TPS segment includes drivers, driven equipment, flow control, and turnkey solutions. Drivers are comprised of aero-derivative gas turbines, heavy-duty gas turbines, small- to medium-sized steam turbines, slow speed and integrated gas engines, hot gas and turbo expanders, and synchronous, and induction electric motors. TPS’ driven equipment consists of electric generators, reciprocating, centrifugal, axial, direct-drive high speed, integrated and subsea compressors, and turbo-expanders. TPS’ flow control includes pumps, valves, regulators, control systems, and other flow and process control technologies. As part of its turnkey solutions, TPS offers power generation modules, waste heat/energy recovery, energy storage, modularized small and large liquefaction plants, carbon capture, and storage/use facilities. TPS also offers a variety of system upgrades and conversion solutions, from a single machine to full plant debottlenecking and modernization.
TPS’ products enable customers to increase upstream oil and gas production, liquefy natural gas, compress gas for transport via pipelines, generate electricity, store gas and energy, refine oil and gas and produce petrochemicals, while minimizing both operational and environmental risks in the most extreme service conditions. TPS’ customers are upstream, midstream and downstream, onshore and offshore, and small to large scale. Midstream and downstream customers include LNG plants, pipelines, storage facilities, refineries, and a wide range of industrial and engineering, procurement and construction (EPC) companies.
TPS’ value proposition is founded on its turbomachinery and flow control technology, a unique competence to integrate gas turbines and compressors in the most critical natural gas applications, best-in-class manufacturing and testing capabilities, reliable maintenance and service operations, and innovative real-time diagnostics and control systems, enabling condition-based maintenance and increasing overall productivity, availability, efficiency, and reliability for oil and gas assets. TPS differentiates itself from competitors with its expertise in technology and

BHGE 2018 FORM 10-K | 5
project management, local presence and partnerships, as well as the deep industry know-how of its teams to provide fully integrated equipment and services solutions with state-of-art technology from design and manufacture through to operations.
Digital Solutions
The Digital Solutions (DS) segment provides operating technologies helping to improve the health, productivity, and safety of asset intensive industries and enable the Industrial Internet of Things. DS includes the measurement & controls business for industry-leading hardware technologies as well as our software businesses that leverage best-of-class cloud services, including GE's Predix application development platform.
The DS segment includes condition monitoring, inspection technologies, measurement, sensing, and pipeline solutions. Condition monitoring technologies include the Bently Nevada® and System 1® brands, providing rack-based vibration monitoring equipment, sensors, software cybersecurity solutions, and industrial controls primarily for power generation and oil and gas operations. The DS inspection technologies product line includes non-destructive testing technology, software, and services, including industrial radiography, ultrasonic sensors, testing machines and gauges, NDT film, and remote visual inspection.
The DS process and pipeline services product line (PPS) provides pre-commissioning and maintenance services to improve throughput and asset integrity for process facilities and pipelines while achieving the highest returns possible. In addition, the PPS product line provides inline inspection solutions to support pipeline integrity and includes nitrogen, bolting, torqueing and leak detection services, as well as the world’s largest fleet of air compressors to dry pipelines after hydrotesting. The DS measurement and sensing product line provides instrumentation to better detect and analyze pressure, flow, gas, and moisture conditions.
The DS segment helps companies monitor and optimize industrial assets while mitigating risk and boosting safety, by providing performance management, and condition and asset health monitoring. It also provides customers the technical capabilities to drive enterprise wide digital transformation of business processes and to focus on better production outcomes along the entire oil & gas value chain, using sensors, services and inspections to connect industrial assets to the Industrial Internet. The DS software business is built to handle data at an industrial scale, giving customers the power to innovate, and make faster, more confident decisions to maximize performance.
MARKETS AND COMPETITION
We sell to our customers through direct and indirect channels. Our primary sales channel is through our direct sales force, which has a strong regional focus with local teams close to the customer, who are able to draw support from centers of excellence in each of our major product lines. No single customer accounted for 10% or more of our revenue in the current year.
Our products and services are sold in highly competitive markets and the competitive environment varies by product line, as discussed below:
Oilfield Services
Our OFS segment believes that the principal competitive factors in the industries and markets it serves are product and service quality, reliability and availability, health, safety and environmental standards, technical proficiency, and price. Our products and services are sold in highly competitive markets and revenue and earnings are affected by changes in commodity prices, fluctuations in the level of drilling, workover and completion activity in major markets, general economic conditions, foreign currency exchange fluctuations and governmental regulations. While we may have contracts with customers that include multiple well projects and that may extend over a period of time ranging from two to four years, our services and products are generally provided on a well-by-well basis. Most contracts cover our pricing of the products and services, but do not necessarily establish an obligation to use our products and services. OFS segment competitors include Schlumberger, Halliburton, and Weatherford International.

6 | BHGE 2018 FORM 10-K
Oilfield Equipment
Our OFE segment believes that the principal competitive factors in the industries and markets it serves are product and service quality, reliability and on time delivery, health, safety and environmental standards, technical proficiency, availability of spare parts, and price. Its strong track record of innovation enables OFE to enter into long-term, performance-based service agreements with our customers. In the SPS product line, the primary competitors of OFE include Schlumberger, TechnipFMC, Aker Solutions ASA, Proserv, and Dril-Quip Inc. In the flexible pipe product line, competitors include TechnipFMC, National Oilwell Varco (NOV), Airborne, and Magma. In the drilling product line, competitors include NOV, Schlumberger, and Horn Equipment. In the surface pressure control product line the primary competitors include Cactus Wellhead, TechnipFMC, and Schlumberger.
Turbomachinery & Process Solutions
Our TPS segment believes that the principal competitive factors in the industries and markets it serves are product range (or power range measured in megawatts) coverage, efficiency, product reliability and availability, service capabilities, packages, references, emissions, and price. In upstream and midstream applications, our primary equipment competitors include Siemens (Power and Gas business unit), Solar (a Caterpillar company), MAN Turbo, and Mitsubishi Heavy Industries. In downstream applications, TPS primarily competes with original equipment manufacturers and independent service providers, including Flowserve, Siemens, Elliott Ebara, and Mitsubishi Heavy Industries. Our aftermarket equipment product line competes with smaller, independent local providers such as Masaood John Brown, Sulzer, MTU, and Chromalloy.
Digital Solutions
Our DS segment believes that the principal competitive factors in the industries and markets it serves are superior product technology, service, quality, and reliability. Our DS segment competes across a wide range of industries, including oil & gas, power generation, aerospace, and light and heavy industrials. The products and services are sold in a diversified, fragmented arena with a broad range of competitors. Although no single company competes directly with DS across all its product lines, various companies compete in one or more products. Competitors include Emerson, Honeywell Process Solutions, Olympus, Schneider Electric, and Siemens.
CONTRACTS
We conduct our business under various types of contracts in the upstream, midstream, and downstream segments, including fixed-fee or turnkey contracts, transactional agreements for products and services, and long-term aftermarket service agreements.
We enjoy stable relationships with many of our customers based on long-term project contracts and master service agreements. Several of those contracts require us to commit to a fixed price based on the customer’s technical specifications with little or no legal relief available due to changes in circumstances, such as changes in local laws or industry or geopolitical events. In some cases, failure to deliver products or perform services within contractual commitments may lead to liquidated damages claims. We seek to mitigate these exposures through close collaboration with our customers.
We strive to negotiate the terms of our customer contracts consistent with what we consider to be industry best practices. Our customers typically indemnify us for certain claims arising from: the injury or death of their employees and often their other contractors; the loss of or damage to their equipment and often that of their other contractors; pollution originating from their equipment or facility; and all liabilities related to the well and subsurface operations, including loss or damage to the well or reservoir, loss of well control, fire, explosion, or any uncontrolled flow of oil or gas. Conversely, we typically indemnify our customers for certain claims arising from: the injury or death of our employees and sometimes that of our subcontractors; the loss of or damage to our equipment (other than equipment lost in the hole); and pollution originating from our equipment above the surface of the earth while in our care, custody, and control. Where the above indemnities do not apply or are not consistent with industry best practices, we typically provide a capped indemnity for damages caused to the customer by our negligence or the negligence of our contractors, and include an overall limitation of liability clause. It is also our general practice to include a limitation of liability for consequential loss, including loss of profits and loss of revenue, in all customer contracts.
BHGE 2018 FORM 10-K | 7
Our indemnity structure may not protect us in every case. Certain U.S. states such as Texas, Louisiana, Wyoming, and New Mexico have enacted oil and natural gas specific anti-indemnity statutes. These statutes can void the allocation of liability agreed to in a contract, however, both the Texas and Louisiana anti-indemnity statutes include important exclusions. The Louisiana statute does not apply to property damage, and the Texas statute allows mutual indemnity agreements that are supported by insurance and has exclusions, which include, among other things, loss or liability for property damage that results from pollution and the cost of well control events. State law, laws or public policy in countries outside the U.S., or the negotiated terms of a customer contract may also limit indemnity obligations in the event of the gross negligence or willful misconduct. We sometimes contract with customers that are not the end user of our products. It is our practice to seek to obtain an indemnity from our customer for any end-user claims, but this is not always possible. Similarly, government agencies and other third parties, including in some cases other contractors of our customers, may make claims in respect of which we are not indemnified and for which responsibility is assessed proportionate to fault. In all cases, deviations from our standard contracting practices are examined through an established risk deviation process.
The Company maintains a commercial general liability insurance policy program that covers against certain operating hazards, including product liability claims and personal injury claims, as well as certain limited environmental pollution claims for damage to a third party or its property arising out of contact with pollution for which the Company is liable, however, clean up and well control costs are not covered by such program. All of the insurance policies purchased by the Company are subject to deductible and/or self-insured retention amounts for which we are responsible for payment, specific terms, conditions, limitations, and exclusions. There can be no assurance that the nature and amount of Company insurance will be sufficient to fully indemnify us against liabilities related to our business.
RESEARCH AND DEVELOPMENT
We engage in research and development activities directed primarily toward the development of new products, services, technology, and other solutions, as well as the improvement of existing products and services and the design of specialized products to meet specific customer needs. We continue to invest across all operating segments in products to develop capability, improve performance, and reduce costs. In OFS, we invested in a range of formation evaluation capabilities as well as drilling, completions, and production hardware. This included the introduction of Electrical Submersible Pumps (ESP’s) with permanent magnet motors for higher efficiency through reduced power consumption. In OFE, the recent focus has been to expand capability into deeper water, longer offsets and at higher pressures as well as modular designs that allow for simpler and more integrated subsea systems. Additionally, subsea power and processing is also an area in which we are investing, covering both pumping and compression. In TPS, we continue to invest in continuous product improvement of reciprocating and centrifugal compressors, using advanced fluid dynamic simulation and advanced aeromechanics to improve capability, operability and efficiency of its centrifugal compressors family. Further, we continue to invest in our latest generation of gas turbines for energy efficiency and reduced carbon footprint. DS continues to invest in advanced digital solutions designed to improve the efficiency, reliability and safety of oil and gas production operations. These systems integrate operational data and provide analytics from producing oil and gas facilities helping to prevent unplanned downtime and improve facility reliability. In addition, DS invests in a broad range of measurement and control solutions spanning multiple industries, including methane detection systems for oil and gas operations and inspection technology for consumer electronics.
INTELLECTUAL PROPERTY
Our technology, brands and other intellectual property (IP) rights are important elements of our business. We rely on patent, trademark, copyright, and trade secret laws, as well as non-disclosure and employee invention assignment agreements to protect our intellectual property rights. Many patents and patent applications comprise the BHGE portfolio and are owned by us. Other patents and patent applications applicable to our products and services are licensed to us by GE and, in some cases, third parties. We do not consider any individual patent to be material to our business operations.
In connection with the Master Agreement Framework, GE has now entered into an amended and restated IP cross-license agreement (the IP Cross-License Agreement) with BHGE LLC. GE has agreed to perpetually license to BHGE LLC the right to use certain intellectual property owned or controlled by GE pursuant to the terms of the IP Cross-License Agreement. BHGE LLC has in return also agreed to perpetually license to GE the right to use certain intellectual property rights pursuant to the terms of the IP Cross-License Agreement. This
8 | BHGE 2018 FORM 10-K
license allows BHGE LLC to have continued and permanent rights to commercially utilize some GE intellectual property pursuant to the terms of the IP Cross-License Agreement.
We follow a policy of seeking patent and trademark protection in numerous countries and regions throughout the world for products and methods that appear to have commercial significance. We believe that protection of our patents, trademarks, and related intellectual property rights is central to the conduct of our business, and aggressively pursue protection of our intellectual property rights against infringement worldwide as we deem appropriate to protect our business. Additionally, we consider the quality and timely delivery of our products, the service we provide to our customers, and the technical knowledge and skills of our personnel to be other important components of the portfolio of capabilities and assets supporting our ability to compete.
SEASONALITY
Our operations can be affected by seasonal weather, which can temporarily affect the delivery and performance of our products and services, and our customers' budgetary cycles. Examples of seasonal events that can impact our business are set forth below:
• The severity and duration of both the summer and the winter in North America can have a significant impact on activity levels. In Canada, the timing and duration of the spring thaw directly affects activity levels, which reach seasonal lows during the second quarter and build through the third and fourth quarters to a seasonal high in the first quarter.
• Adverse weather conditions, such as hurricanes in the Gulf of Mexico, may interrupt or curtail our coastal and offshore drilling, or our customers’ operations, cause supply disruptions and result in a loss of revenue and damage to our equipment and facilities, which may or may not be insured.
• Severe weather during the winter months normally results in reduced activity levels in the North Sea and Russia generally in the first quarter and may interrupt or curtail our operations, or our customers’ operations, in those areas and result in a loss of revenue.
• Scheduled repair and maintenance of offshore facilities in the North Sea can reduce activity in the second and third quarters.
• Many of our international oilfield customers increase orders for certain products and services in the fourth quarter.
• Our process & pipeline business in the DS segment typically experiences lower sales during the first and fourth quarters of the year due to the Northern Hemisphere winter.
• Our broader DS business typically experiences higher customer activity as a result of spending patterns in the second half of the year.
RAW MATERIALS
We purchase various raw materials and component parts for use in manufacturing our products and delivering our services. The principal raw materials we use include steel alloys, chromium, nickel, titanium, barite, beryllium, copper, lead, tungsten carbide, synthetic and natural diamonds, gels, sand and other proppants, printed circuit boards and other electronic components, and hydrocarbon-based chemical feed stocks. Raw materials that are essential to our business are normally readily available from multiple sources, but may be subject to price volatility. Market conditions can trigger constraints in the supply of certain raw materials, and we are always seeking ways to ensure the availability and manage the cost of raw materials. Our procurement department uses its size and buying power to enhance its access to key materials at competitive prices.
In addition to raw materials and component parts, we also use the products and services of metal fabricators, machine shops, foundries, forge shops, assembly operations, contract manufacturers, logistics providers, packagers, indirect material providers, and others in order to produce and deliver products to customers. These materials and services are generally available from multiple sources.
BHGE 2018 FORM 10-K | 9
EMPLOYEES
As of December 31, 2018, we had approximately 66,000 employees, of which the majority are outside the U.S. Approximately 11% of these employees are represented under collective bargaining agreements or similar-type labor arrangements.
ENVIRONMENTAL MATTERS
We are committed to the health and safety of people, protection of the environment and compliance with environmental laws, regulations and our policies. Our past and present operations include activities that are subject to extensive domestic (including U.S. federal, state and local) and international regulations with regard to air, land and water quality and other environmental matters. Regulations continue to evolve, and changes in standards of enforcement of existing regulations, as well as the enactment of new legislation, may require us and our customers to modify, supplement or replace equipment or facilities or to change or discontinue present methods of operation. Our environmental compliance expenditures and our capital costs for environmental control equipment may change accordingly.
We are, and may in the future be, involved in voluntary remediation projects at current and former properties. On rare occasions, our remediation activities are conducted as specified by a government agency-issued consent decree or agreed order. Remediation costs at these properties are accrued using currently available facts, existing environmental permits, technology and presently enacted laws and regulations. For sites where we are primarily responsible for the remediation, our cost estimates are developed based on internal evaluations and are not discounted. We record accruals when it is probable that we will be obligated to pay amounts for environmental site evaluation, remediation or related activities, and such amounts can be reasonably estimated. Accruals are recorded even if significant uncertainties exist over the ultimate cost of the remediation. Ongoing environmental compliance costs, such as obtaining environmental permits, installation and maintenance of pollution control equipment and waste disposal, are expensed as incurred.
The Comprehensive Environmental Response, Compensation and Liability Act (known as "Superfund") imposes liability for the release of a "hazardous substance" into the environment. Superfund liability is imposed without regard to fault, even if the waste disposal was in compliance with laws and regulations. We have been identified as a potentially responsible party (PRP) at various Superfund sites, and we accrue our share of the estimated remediation costs for the site. PRPs in Superfund actions have joint and several liability and may be required to pay more than their proportional share of such costs.
In some cases, it is not possible to quantify our ultimate exposure because the projects are either in the investigative or early remediation stage, or superfund allocation information is not yet available. Based upon current information, we believe that our overall compliance with environmental regulations, including remediation obligations, environmental compliance costs and capital expenditures for environmental control equipment, will not have a material adverse effect on our capital expenditures, earnings or competitive position because we have either established adequate reserves or our compliance cost, based on available information, is not expected to be material to our consolidated and combined financial statements. Our total accrual for environmental remediation was $84 million and $82 million at December 31, 2018 and 2017, respectively. We continue to focus on reducing future environmental liabilities by maintaining appropriate Company standards and by improving our assurance programs.
AVAILABILITY OF INFORMATION FOR STOCKHOLDERS
Our annual reports on Form 10-K, quarterly reports on Form 10-Q, current reports on Form 8-K and amendments to those reports filed or furnished pursuant to Section 13(a) or 15(d) of the Securities Exchange Act of 1934, as amended (Exchange Act), are made available free of charge on our Internet website at www.bhge.com as soon as reasonably practicable after these reports have been electronically filed with, or furnished to, the SEC. Information contained on or connected to our website is not incorporated by reference into this annual report on Form 10-K and should not be considered part of this annual report or any other filing we make with the SEC.
We have a Code of Conduct (The Spirit and The Letter) to provide guidance to our directors, officers and employees on matters of business conduct and ethics, including compliance standards and procedures. We have also required our principal executive officer, principal financial officer and principal accounting officer to sign a Code of Ethical Conduct Certification.
10 | BHGE 2018 FORM 10-K
The Spirit and The Letter and Code of Ethical Conduct Certifications are available on the Investor section of our website at www.bhge.com. We will disclose on a current report on Form 8-K or on our website information about any amendment or waiver of these codes for our executive officers and directors. Waiver information disclosed on our website will remain on the website for at least 12 months after the initial disclosure of a waiver. Our Governance Principles and the charters of our Audit Committee, Compensation Committee, Conflicts Committee and Governance and Nominating Committee are also available on the Investor section of our website at www.bhge.com. In addition, a copy of The Spirit and The Letter, Code of Ethical Conduct Certifications, Governance Principles, and the charters of the committees referenced above are available in print at no cost to any stockholder who requests them.
EXECUTIVE OFFICERS OF BAKER HUGHES, A GE COMPANY
The following table shows, as of February 19, 2019, the name of each of our executive officers, together with his or her age and office presently or previously held. There are no family relationships among our executive officers.
Name Age Position and BackgroundLorenzo Simonelli 45 Chairman, President and Chief Executive Officer
Lorenzo Simonelli has been the Chairman of the Board of Directors of the Company since October 2017, and a Director, President and Chief Executive Officer of the Company since July 2017. Before joining the Company in July 2017, Mr. Simonelli was Senior Vice President, GE and President and Chief Executive Officer, GE Oil & Gas from October 2013 to July 2017. Before joining GE Oil & Gas, he was the President and Chief Executive Officer of GE Transportation from July 2008 to October 2013. Mr. Simonelli joined GE in 1994 and held various finance and leadership roles from 1994 to 2008.
Brian Worrell 49 Chief Financial OfficerBrian Worrell is the Chief Financial Officer of the Company. Prior to joining the Company in July 2017, he served as Vice President and Chief Financial Officer of GE Oil & Gas from January 2014 to July 2017. He previously held the position of Vice President, Financial Planning & Analysis for GE from 2010 to January 2014 and Vice President Corporate Audit Staff for GE from 2006 to 2010.
Maria Claudia Borras
50 President, Oilfield ServicesMaria Claudia Borras is the President and Chief Executive Officer, Oilfield Services of the Company. Before joining the Company in July 2017, she served as the Chief Commercial Officer of GE Oil & Gas from December 2014 to July 2017. Prior to joining GE Oil & Gas, she held various leadership positions at Baker Hughes Incorporated including President, Latin America from October 2013 to January 2015, President Europe Region from August 2011 to October 2013, Vice President, Global Marketing from May 2009 to July 2011 and other leadership roles at Baker Hughes Incorporated from 1994 to April 2009.
Kurt Camilleri 44 Vice President, Controller and Chief Accounting OfficerKurt Camilleri is the Vice President, Controller and Chief Accounting Officer of the Company. Prior to joining the Company in July 2017, he served as the Global Controller for GE Oil & Gas from July 2013 to July 2017. Mr. Camilleri served as the Global Controller for GE Transportation from January 2013 to June 2013 and the Controller for Europe and Eastern and African Growth Markets for GE Healthcare from 2010 to January 2013. He began his career in 1996 with Pricewaterhouse in London, which subsequently became PricewaterhouseCoopers.
Roderick Christie 56 President, Turbomachinery and Process SolutionsRod Christie is the President and Chief Executive Officer of Turbomachinery & Process Solutions of the Company. Prior to joining the Company in July 2017, he served as the Chief Executive Officer of Turbomachinery & Process Solutions at GE Oil & Gas from January 2016 to July 2017. He served as the Chief Executive Officer of GE Oil & Gas’ Subsea Systems & Drilling Business from August 2011 to 2016 and held various other leadership positions within GE between 1999 to 2011.
BHGE 2018 FORM 10-K | 11
Name Age Position and BackgroundMatthias Heilmann 50 President, Digital Solutions
Matthias Heilmann is the President and Chief Executive Officer of Digital Solutions of the Company. Prior to joining the Company in July 2017, he served as the Chief Digital Officer, President & Chief Executive Officer of Digital Solutions within GE Oil & Gas from 2016 through July 2017. Prior to joining GE Oil & Gas, he led ABB’s Global Product Group Enterprise Software business from June 2014 to January 2016. He served as the Chief Operating Officer of Ryerson Holding Corporation from March 2010 until January 2012 and served as Executive Vice President and Chief Operating Officer of Ryerson Inc. from January 2009 to January 2012.
William D. Marsh 56 Chief Legal OfficerWilliam D. Marsh is the Chief Legal Officer of the Company. Prior to joining the Company in July 2017, he served as the Vice President and General Counsel of Baker Hughes Incorporated from February 2013 to July 2017. He previously served as the Vice President-Legal for Western Hemisphere at Baker Hughes Incorporated from May 2009 to February 2013 and held various executive, legal and corporate roles within Baker Hughes Incorporated from 1998 to 2009.
Derek Mathieson 48 Chief Marketing and Technology OfficerDerek Mathieson is the Chief Marketing and Technology Officer of the Company. Prior to joining the Company in July 2017, he served in various leadership roles at Baker Hughes Incorporated including Chief Integration Officer from October 2016 to July 2017; Chief Commercial Officer from May 2016 to October 2016; Chief Technology and Marketing Officer from September 2015 to May 2016; Chief Strategy Officer from October 2013 to September 2015; President Western Hemisphere Operations from 2012 to 2013; President, Products and Technology from May 2009 to January 2012; and Chief Technology and Marketing Officer from December 2008 to May 2009.
Neil Saunders 49 President, Oilfield EquipmentNeil Saunders is the President and Chief Executive Officer of Oilfield Equipment of the Company. Prior to joining the Company in July 2017, he served as the President and Chief Executive Officer of the Subsea Systems & Drilling business at GE Oil & Gas from July 2016 to July 2017 and the Senior Vice President for Subsea Production Systems from August 2011 to July 2016. He served in various leadership roles within GE Oil & Gas from 2007 to August 2011.
Uwem Ukpong 47 Chief Global Operations OfficerUwem Ukpong is the Chief Global Operations Officer of the Company. Prior to this role, he served as the Chief Integration Officer of the Company from July 2017 to January 2018. He served as Vice President, Baker Hughes Integration for GE Oil & Gas from October 2016 to July 2017 and President and CEO of the GE Oil & Gas Surface Business from January 2016 to October 2016. He held various technical and leadership roles at Schlumberger from 1993 to 2015.
ITEM 1A. RISK FACTORS
An investment in our common stock involves various risks. When considering an investment in the Company, one should carefully consider all of the risk factors described below, as well as other information included and incorporated by reference in this annual report. There may be additional risks, uncertainties and matters not listed below, that we are unaware of, or that we currently consider immaterial. Any of these may adversely affect our business, financial condition, results of operations and cash flows and, thus, the value of an investment in the Company.
Risk Factors Related to Our Business
We operate in a highly competitive environment, which may adversely affect our ability to succeed.
We operate in a highly competitive environment for marketing oilfield products and services and securing equipment and trained personnel. Our ability to continually provide competitive products and services can impact our ability to defend, maintain or increase prices for our products and services, maintain market share, and negotiate acceptable contract terms with our customers. In order to be competitive, we must provide new

12 | BHGE 2018 FORM 10-K
technologies, reliable products and services that perform as expected and that create value for our customers, and successfully recruit, train and retain competent personnel.
In addition, our investments in new technologies and properties, plants and equipment may not provide competitive returns. Our ability to defend, maintain or increase prices for our products and services is in part dependent on the industry’s capacity relative to customer demand, and on our ability to differentiate the value delivered by our products and services from our competitors’ products and services. Managing development of competitive technology and new product introductions on a forecasted schedule and at a forecasted cost can impact our financial results. If we are unable to continue to develop and produce competitive technology or deliver it to our clients in a timely and cost-competitive manner in various markets in which we operate, or if competing technology accelerates the obsolescence of any of our products or services, any competitive advantage that we may hold, and in turn, our business, financial condition and results of operations could be materially and adversely affected.
The high cost or unavailability of infrastructure, materials, equipment, supplies and personnel, particularly in periods of rapid growth, could adversely affect our ability to execute our operations on a timely basis.
Our manufacturing operations are dependent on having sufficient raw materials, component parts and manufacturing capacity available to meet our manufacturing plans at a reasonable cost while minimizing inventories. Our ability to effectively manage our manufacturing operations and meet these goals can have an impact on our business, including our ability to meet our manufacturing plans and revenue goals, control costs, and avoid shortages or over-supply of raw materials and component parts. Raw materials and components of particular concern include steel alloys (including chromium and nickel), titanium, barite, beryllium, copper, lead, tungsten carbide, synthetic and natural diamonds, gels, sand and other proppants, printed circuit boards and other electronic components and hydrocarbon-based chemical feed stocks. Our ability to repair or replace equipment damaged or lost in the well can also impact our ability to service our customers. A lack of manufacturing capacity could result in increased backlog, which may limit our ability to respond to orders with short lead times.
People are a key resource to developing, manufacturing and delivering our products and services to our customers around the world. Our ability to manage the recruiting, training, retention and efficient usage of the highly skilled workforce required by our plans and to manage the associated costs could impact our business. A well-trained, motivated workforce has a positive impact on our ability to attract and retain business. Periods of rapid growth present a challenge to us and our industry to recruit, train and retain our employees, while also managing the impact of wage inflation and the limited available qualified labor in the markets where we operate.
Likewise, if the economy or markets decline or other changes occur, we may have to reduce utilization of our assets or adjust our workforce to control costs, which may cause us to lose some of our skilled employees. Labor-related actions, including strikes, slowdowns and facility occupations can also have a negative impact on our business.
Our business could be impacted by geopolitical and terrorism threats in countries where we or our customers do business and our business operations may be impacted by civil unrest, government expropriations and/or epidemic outbreaks.
Geopolitical and terrorism risks continue to grow in a number of key countries where we currently or may in the future do business. Geopolitical and terrorism risks could lead to, among other things, a loss of our investment in the country, impairment of the safety of our employees and impairment of our or our customers’ ability to conduct operations.
In addition to other geopolitical and terrorism risks, civil unrest continues to grow in a number of key countries where we do business. Our ability to conduct business operations may be impacted by that civil unrest and our assets in these countries may also be subject to expropriation by governments or other parties involved in civil unrest. Epidemic outbreaks may also impact our business operations by, among other things, restricting travel to protect the health and welfare of our employees and decisions by our customers to curtail or stop operations in impacted areas.
BHGE 2018 FORM 10-K | 13
Compliance with and changes in laws could be costly and could affect operating results. In addition, government disruptions could negatively impact our ability to conduct our business.
We have operations in the United States and in more than 120 countries that can be impacted by expected and unexpected changes in the legal and business environments in which we operate. Compliance-related issues could also limit our ability to do business in certain countries and impact our earnings. Changes that could impact the legal environment include new legislation, new regulations, new policies, investigations and legal proceedings and new interpretations of existing legal rules and regulations, in particular, changes in export control laws or exchange control laws, additional restrictions on doing business in countries subject to sanctions, and changes in laws in countries where we operate. In addition, changes and uncertainty in the political environments in which our businesses operate can have a material effect on the laws, rules, and regulations that affect our operations. Government disruptions may also delay or halt the granting and renewal of permits, licenses and other items required by us and our customers to conduct our business. The continued success of our global business and operations depends, in part, on our ability to continue to anticipate and effectively manage these and other political, legal and regulatory risks.
Increased cybersecurity requirements, vulnerabilities, threats and more sophisticated and targeted computer crime could pose risks to our systems, networks, products, solutions, services and data.
Increased global cybersecurity vulnerabilities, threats and more sophisticated and targeted cyber-related attacks pose risks to our systems, networks, products, solutions, services and data. Cybersecurity attacks also pose risks to our customers’, partners’, suppliers’ and third-party service providers’ products, systems and networks and the confidentiality, availability and integrity of our and our customers’ data. While we attempt to mitigate these risks, we remain vulnerable to additional known or unknown threats. Given our global footprint, the large number of customers with which we do business, and the increasing sophistication of cyber attacks, a cyber attack could occur and persist for an extended period of time without detection. We expect that any investigation of a cyber attack would be inherently unpredictable and that it would take time before the completion of any investigation and before there is availability of full and reliable information. During such time we would not necessarily know the extent of the harm or how best to remediate it, and certain errors or actions could be repeated or compounded before they are discovered and remediated, all or any of which would further increase the costs and consequences of a cyber attack.
We also may have access to sensitive, confidential or personal data or information in certain of our businesses that is subject to privacy and security laws, regulations and customer-imposed controls. Despite our efforts to protect sensitive, confidential or personal data or information, we may be vulnerable to material security breaches, theft, misplaced or lost data, programming errors, employee errors and/or malfeasance that could potentially lead to the compromising of sensitive, confidential or personal data or information, improper use of our systems, software solutions or networks, unauthorized access, use, disclosure, modification or destruction of information, defective products, production downtimes and operational disruptions. In addition, a cyber-related attack could adversely impact our operating results and result in other negative consequences, including damage to our reputation or competitiveness, remediation or increased protection costs, litigation or regulatory action, fines and penalties.
Our failure to comply with the Foreign Corrupt Practices Act (FCPA) and other similar laws could have a negative impact on our ongoing operations.
Our ability to comply with the FCPA, the U.K. Bribery Act and various other anti-bribery and anti-corruption laws depends on the success of our ongoing compliance program, including our ability to successfully manage our agents, distributors and other business partners, and supervise, train and retain competent employees. Our compliance program depends on the efforts of our employees, agents, distributors and other business partners to comply with applicable law and our internal policies. We could be subject to sanctions and civil and criminal prosecution, as well as fines and penalties, in the event of a finding of a violation of any of these laws by us or any of our employees.
Anti-money laundering and anti-terrorism financing laws could have significant adverse consequences for us.
We maintain an enterprise-wide program designed to enable us to comply with all applicable anti-money laundering and anti-terrorism financing laws and regulations, including the Bank Secrecy Act and the Patriot Act. This program includes policies, procedures, processes and other internal controls designed to identify, monitor, manage and mitigate the risk of money laundering or terrorist financing posed by our products, services, customers
14 | BHGE 2018 FORM 10-K
and geographic locale. These controls establish procedures and processes to detect and report suspicious transactions, perform customer due diligence, respond to requests from law enforcement, and meet all recordkeeping and reporting requirements related to particular transactions involving currency or monetary instruments. We cannot be sure our programs and controls are or will remain effective to ensure our compliance with all applicable anti-money laundering and anti-terrorism financing laws and regulations, and our failure to comply could subject us to significant sanctions, fines, penalties and reputational harm, all of which could have a material adverse effect on our business, results of operations and financial condition.
Changes in tax laws, tax rates, tariffs, adverse positions taken by taxing authorities, and tax audits could impact operating results.
Changes in tax laws, tax rates, tariffs, changes in interpretation of tax laws, the resolution of tax assessments or audits by various tax authorities, and the ability to fully utilize tax loss carryforwards and tax credits could impact our operating results, including additional valuation allowances for deferred tax assets. In addition, we may periodically restructure our legal entity organization. If taxing authorities were to disagree with our tax positions in connection with any such restructurings, our effective tax rate could be materially impacted.
Our operations involve a variety of operating hazards and risks that could cause losses.
The products that we manufacture and the services that we provide are complex, and the failure of our equipment to operate properly or to meet specifications may greatly increase our customers’ costs. In addition, many of these products are used in inherently hazardous industries, such as the offshore oilfield business. These hazards include blowouts, explosions, nuclear-related events, fires, collisions, capsizings and severe weather conditions. We may incur substantial liabilities or losses as a result of these hazards. While we maintain insurance protection against some of these risks, and seek to obtain indemnity agreements from our customers requiring the customers to hold us harmless from some of these risks, our insurance and contractual indemnity protection may not be sufficient or effective to protect us under all circumstances or against all risks. The occurrence of a significant event, against which we were not fully insured or indemnified or the failure of a customer to meet its indemnification obligations to us, could materially and adversely affect our results of operations and financial condition.
Compliance with, and rulings and litigation in connection with, environmental and climate change regulations and the environmental and climate change impacts of our or our customers’ operations may adversely affect our business and operating results.
We and our business are impacted by material changes in environmental laws, regulations, rulings and litigation. Our expectations regarding our compliance with environmental laws and regulations and our expenditures to comply with environmental laws and regulations, including (without limitation) our capital expenditures for environmental control equipment, are only our forecasts regarding these matters. These forecasts may be substantially different from actual results, which may be affected by factors such as: changes in law that impose restrictions on air emissions, wastewater management, waste disposal, hydraulic fracturing, or wetland and land use practices; more stringent enforcement of existing environmental laws and regulations; a change in our share of any remediation costs or other unexpected, adverse outcomes with respect to sites where we have been named as a potentially responsible party, including (without limitation) Superfund sites; the discovery of other sites where additional expenditures may be required to comply with environmental legal obligations; and the accidental discharge of hazardous materials.
International, national, and state governments and agencies continue to evaluate and promulgate legislation and regulations that are focused on restricting emissions commonly referred to as greenhouse gas (GHG) emissions. In the United States, the U.S. Environmental Protection Agency (EPA) has taken steps to regulate GHG emissions as air pollutants under the U.S. Clean Air Act of 1970, as amended. The EPA’s Greenhouse Gas Reporting Rule requires monitoring and reporting of GHG emissions from, among others, certain mobile and stationary GHG emission sources in the oil and natural gas industry, which in turn may include data from certain of our wellsite equipment and operations. In addition, the U.S. government has proposed rules in the past setting GHG emission standards for, or otherwise aimed at reducing GHG emissions from, the oil and natural gas industry. Caps or fees on carbon emissions, including in the United States, have been and may continue to be established and the cost of such caps or fees could disproportionately affect the fossil-fuel energy sector. We are unable to predict whether and when the proposed changes in laws or regulations ultimately will occur or what they ultimately
BHGE 2018 FORM 10-K | 15
will require, and accordingly, we are unable to assess the potential financial or operational impact they may have on our business.
Other developments focused on restricting GHG emissions include the United Nations Framework Convention on Climate Change, which includes the Paris Agreement and the Kyoto Protocol; the European Union Emission Trading System; Article 8 of the European Union Energy Efficiency Directive and the United Kingdom’s Carbon Reduction Commitment Energy Efficiency and Energy Savings Opportunity (ESOS) schemes; and, in the United States, the Regional Greenhouse Gas Initiative, the Western Climate Action Initiative, and various state programs implementing the California Global Warming Solutions Act of 2006 (known as Assembly Bill 32).
The potential for climate related changes may pose future risks to our operations and those of our customers. These changes can include extreme variability in weather patterns such as increased frequency of severe weather, rising mean temperature and sea levels, and long-term changes in precipitation patterns. Such changes have the potential to affect business continuity and operating results, particularly at facilities in coastal areas.
Uninsured claims and litigation against us could adversely impact our operating results.
We could be impacted by the outcome of pending litigation, as well as unexpected litigation or proceedings. While we have insurance coverage against operating hazards, including product liability claims and personal injury claims related to our products, to the extent deemed prudent by our management and to the extent insurance is available; no assurance can be given that the nature and amount of that insurance will be sufficient to fully indemnify us against liabilities arising out of pending and future claims and litigation. This insurance has deductibles or self-insured retentions and contains certain coverage exclusions. The insurance does not cover damages from breach of contract by us or based on alleged fraud or deceptive trade practices. In addition, the following risks apply with respect to our insurance coverage:
• we may not be able to continue to obtain insurance on commercially reasonable terms;
• we may be faced with types of liabilities that will not be covered by our insurance;
• our insurance carriers may not be able to meet their obligations under the policies; or
• the dollar amount of any liabilities may exceed our policy limits.
Control of oil and natural gas reserves by state-owned oil companies may impact the demand for our services and products and create additional risks in our operations.
Much of the world’s oil and natural gas reserves are controlled by state-owned oil companies. State-owned oil companies may require their contractors to meet local content requirements or other local standards, such as conducting our operations through joint ventures with local partners that could be difficult or undesirable for us to meet. The failure to meet the local content requirements and other local standards may adversely impact our operations in those countries. In addition, our ability to work with state-owned oil companies is subject to our ability to negotiate and agree upon acceptable contract terms.
Providing services on an integrated or turnkey basis could require us to assume additional risks.
We may enter into integrated contracts or turnkey contracts with our customers and we may choose to provide services outside our core business. Providing services on an integrated or turnkey basis may subject us to additional risks, such as costs associated with unexpected delays or difficulties in drilling or completion operations and risks associated with subcontracting arrangements.
Some of our customers require bids in the form of fixed pricing contracts.
Some of our customers require bids for contracts in the form of fixed pricing contracts that may require us to provide integrated project management services outside our normal discrete business and to act as project managers, as well as service providers, and may require us to assume additional risks associated with cost over-runs. These customers may provide us with inaccurate information in relation to their reserves. The estimation of reserves is a process that involves subjective judgment about likely location and volume, and estimates that prove
16 | BHGE 2018 FORM 10-K
inaccurate may result in cost over-runs, delays, and project losses for us or our customers, which may adversely impact our business and our relationship with our customers.
The credit risks of having a concentrated customer base in the energy industry could result in losses.
Having a concentration of customers in the energy industry may impact our overall exposure to credit risk as our customers may be similarly affected by prolonged changes in economic and industry conditions. Some of our customers may experience extreme financial distress as a result of falling commodity prices and may be forced to seek protection under applicable bankruptcy laws, which may affect our ability to recover any amounts due from such customers. Furthermore, countries that rely heavily upon income from hydrocarbon exports have been and may in the future be negatively and significantly affected by a drop in oil prices, which could affect our ability to collect from our customers in these countries, particularly national oil companies. Laws in some jurisdictions in which we will operate could make collection difficult or time consuming. We will perform ongoing credit evaluations of our customers and do not expect to require collateral in support of our trade receivables. While we maintain reserves for potential credit losses, we cannot assure such reserves will be sufficient to meet write-offs of uncollectible receivables or that our losses from such receivables will be consistent with our expectations. Additionally, in the event of a bankruptcy of any of our customers, we may be treated as an unsecured creditor and may collect substantially less, or none, of the amounts owed to us by such customer.
Our Remaining Performance Obligations (RPO) are subject to modification, termination or reduction of orders, which could negatively impact our sales.
Our RPO is comprised of unfilled customer orders for products and product services (expected life of contract sales for product services). Our RPO can be significantly affected by the timing of orders for large projects. Although modifications and terminations of orders may be partially offset by cancellation fees, customers can, and sometimes do, terminate or modify orders. Our failure to replace canceled orders could negatively impact our sales and results of operations. The total dollar amount of the Company’s RPO as of December 31, 2018 was $21.0 billion.
We may not be able to satisfy technical requirements, testing requirements or other specifications required under our service contracts and equipment purchase agreements.
Our products are used in deepwater and other harsh environments and severe service applications. Our contracts with customers and customer requests for bids typically set forth detailed specifications or technical requirements for our products and services, which may also include extensive testing requirements. We anticipate that such testing requirements will become more common in our contracts. In addition, recent scrutiny of the offshore drilling industry has resulted in more stringent technical specifications for our products and more comprehensive testing requirements for our products to ensure compliance with such specifications. We cannot provide assurance that our products will be able to satisfy the specifications or that we will be able to perform the full-scale testing necessary to prove that the product specifications are satisfied in future contract bids or under existing contracts, or that the costs of modifications to our products to satisfy the specifications and testing will not adversely affect our results of operations. If our products are unable to satisfy such requirements, or we are unable to perform any required full-scale testing, our customers may cancel their contracts and/or seek new suppliers, and our business, results of operations, cash flows or financial position may be adversely affected.
Currency fluctuations or devaluations may impact our operating results.
Fluctuations or devaluations in foreign currencies relative to the U.S. dollar can impact our revenue and our costs of doing business, as well as the costs of doing business of our customers. Most of our products and services are sold through contracts denominated in U.S. dollars or local currency indexed to U.S. dollars, however, some of our revenue, local expenses and manufacturing costs are incurred in local currencies and therefore changes in the exchange rates between the U.S. dollar and foreign currencies can increase or decrease our revenue and expenses reported in U.S. dollars or revenue and expenses of our customers and, consequently, may impact the ability of our customers to satisfy their payment obligations and our results of operations.
BHGE 2018 FORM 10-K | 17
Changes in economic and/or market conditions may impact our ability to borrow and/or cost of borrowing.
The condition of the capital markets and equity markets in general can affect the price of our common stock and our ability to obtain financing, if necessary. If our credit rating is ever downgraded, it could increase borrowing costs under credit facilities and commercial paper programs, as well as increase the cost of renewing or obtaining, or make it more difficult to renew, obtain or issue new debt financing.
An inability to protect our intellectual property rights could adversely affect our business.
There can be no assurance that the steps we take to obtain, maintain and protect our intellectual property rights will be completely adequate. Our intellectual property rights may fail to provide us with significant competitive advantages, particularly in foreign jurisdictions where we have not invested in an intellectual property portfolio or that do not have, or do not enforce, strong intellectual property rights. The weakening of protection of our trademarks, patents and other intellectual property rights could also adversely affect our business.
We are a party to a number of licenses that give us rights to intellectual property that is necessary or useful to our business, including from GE following the Transactions. Our success depends in part on the ability of our licensors to obtain, maintain and sufficiently enforce the licensed intellectual property rights we have commercialized. Without protection for the intellectual property rights we license, other companies might be able to offer substantially identical products for sale, which could adversely affect our competitive business position and harm our business products. Also, there can be no assurances that we will be able to obtain or renew from third parties the licenses to use intellectual property rights we need in the future, and there is no assurance that such licenses can be obtained on reasonable terms. Specifically we are a party to several agreements with GE which provide for intellectual property rights to use and access. Access and use of intellectual property created solely or collaboratively with GE is an important part of our operations. We would be adversely affected in the event these agreements were terminated without the right to continue such access as we might continue to improve current products and services or develop new ones.
We may be subject to litigation if another party claims that we have infringed upon its intellectual property rights.
The tools, techniques, methodologies, programs and components we use to provide our products and services may infringe upon the intellectual property rights of others or be challenged on that basis. Regardless of the merits, infringement claims may result in significant legal and other costs and may distract management from running our core business. Resolving such claims could increase our costs, including through royalty payments to acquire licenses, if available, from third parties and through the development of non-infringing technologies. If a license to resolve a claim were not available, we might not be able to continue providing a particular service or product, which could adversely affect our financial condition, results of operations and cash flows.
The effects of Brexit may have a negative impact on our financial results and operations of the business.
In June 2016, United Kingdom (UK) voters approved the UK’s exit (Brexit) from the European Union (EU). The political and economic uncertainty surrounding Brexit, if it occurs or in whatever form it occurs, could harm our business and financial results due to fluctuations in the value of the British pound versus the U.S. dollar, euro and other currencies. In addition, Brexit could result in delayed deliveries, which may impact our internal supply chain and our customer projects.
Risk Factors Related to the Worldwide Oil and Natural Gas Industry
Volatility of oil and natural gas prices can adversely affect demand for our products and services.
Prices of oil and gas products are set on a commodity basis. As a result, the volatility in oil and natural gas prices can impact our customers’ activity levels and spending for our products and services. Current energy prices are important contributors to cash flow for our customers and their ability to fund exploration and development activities. Expectations about future prices and price volatility are important for determining future spending levels.
Lower oil and natural gas prices generally lead to decreased spending by our customers. While higher oil and natural gas prices generally lead to increased spending by our customers, sustained high energy prices can be an impediment to economic growth, and can therefore negatively impact spending by our customers. Our customers also take into account the volatility of energy prices and other risk factors by requiring higher returns for individual
18 | BHGE 2018 FORM 10-K
projects if there is higher perceived risk. Any of these factors could affect the demand for oil and natural gas and could have a material effect on our results of operations.
Demand for oil and natural gas is subject to factors beyond our control, which may adversely affect our operating results. Changes in the global economy could impact our customers’ spending levels and our revenue and operating results.
Demand for oil and natural gas, as well as the demand for our services and products, is highly correlated with global economic growth, and in particular by the economic growth of countries such as the U.S., India, China, and developing countries in Asia and the Middle East, which are either significant users of oil and natural gas or whose economies are experiencing the most rapid economic growth compared to the global average. Weakness or deterioration of the global economy or credit markets could reduce our customers’ spending levels and reduce our revenue and operating results. Incremental weakness in global economic activity, particularly in China, India, Europe, the Middle East and developing countries in Asia, could reduce demand for oil and natural gas and result in lower oil and natural gas prices. Incremental strength in global economic activity in such areas will create more demand for oil and natural gas and support higher oil and natural gas prices. A prolonged reduction in oil and natural gas prices may require us to record additional asset impairments. Such a potential impairment charge could have a material adverse impact on our operating results.
Requirements and voluntary initiatives to reduce greenhouse gas emissions, as well as increased climate change awareness, are likely to result in increased costs for the oil and gas industry to curb greenhouse gas emissions and could have an adverse impact on demand for oil and natural gas.
International, national, and state governments, agencies and bodies continue to evaluate and promulgate regulations and voluntary initiatives that are focused on restricting GHG emissions. These requirements and initiatives are likely to become more stringent over time and to result in increased costs for the oil and gas industry to curb GHG emissions. In addition, these developments, and public perception relating to climate change, may curtail production and demand for hydrocarbons such as oil and natural gas by shifting demand towards and investment in relatively lower carbon energy sources such as wind, solar and other renewables. The renewable energy industry is developing enhanced technologies and becoming more competitive with fossil-fuel energy. If renewable energy becomes more competitive than fossil-fuel energy, particularly during periods of higher oil and natural gas prices, it could have a material effect on our results of operations.
Supply of oil and natural gas is subject to factors beyond our control, which may adversely affect our operating results.
Productive capacity for oil and natural gas is dependent on our customers’ decisions to develop and produce oil and natural gas reserves and on the regulatory environment in which our customers and we operate. The ability to produce oil and natural gas can be affected by the number and productivity of new wells drilled and completed, as well as the rate of production and resulting depletion of existing wells. Advanced technologies, such as horizontal drilling and hydraulic fracturing, improve total recovery but also result in a more rapid production decline and may become subject to more stringent regulation, particularly on the state or local level, in the future.
Productive capacity in excess of demand (spare productive capacity) is also an important factor influencing energy prices and spending by oil and natural gas exploration companies. Spare productive capacity and oil and natural gas storage inventory levels are an indicator of the relative balance between supply and demand. High or increasing storage, inventories, or spare productive capacity generally indicate that supply is exceeding demand and that energy prices are likely to soften. Low or decreasing storage, inventories, or spare productive capacity are generally an indicator that demand is growing faster than supply and that energy prices are likely to rise.
Access to prospects is also important to our customers, but such access may be limited because host governments do not allow access to the reserves. Government regulations and the costs incurred by oil and natural gas exploration companies to conform to and comply with government regulations may also limit the quantity of oil and natural gas that may be economically produced.
Supply can also be impacted by the degree to which individual OPEC nations and other large oil and natural gas producing countries are willing and able to control production and exports of oil, to decrease or increase supply and to support their targeted oil price while meeting their market share objectives. Any of these factors could affect the supply of oil and natural gas and could have a material effect on our results of operations.
BHGE 2018 FORM 10-K | 19
Our customers’ activity levels and spending for our products and services and ability to pay amounts owed us could be impacted by the reduction of their cash flow and the ability of our customers to access equity or credit markets.
Our customers’ access to capital is dependent on their ability to access the funds necessary to develop economically attractive projects based upon their expectations of future energy prices, required investments and resulting returns. Limited access to external sources of funding has caused and may continue to cause customers to reduce their capital spending plans to levels supported by internally generated cash flow. In addition, a reduction of cash flow resulting from declines in commodity prices, a reduction in borrowing bases under reserve-based credit facilities or the lack of available debt or equity financing may impact the ability of our customers to pay amounts owed to us and could cause us to increase our reserve for doubtful accounts.
Seasonal and weather conditions could adversely affect demand for our services and operations.
Variation from normal weather patterns, such as cooler or warmer summers and winters, can have a significant impact on demand for our services and operations. Adverse weather conditions, such as hurricanes in the Gulf of Mexico, may interrupt or curtail our operations, or our customers’ operations, cause supply disruptions and result in a loss of revenue and damage to our equipment and facilities, which may or may not be insured. For example, extreme winter conditions in Canada, Russia or the North Sea may interrupt or curtail our operations, or our customers’ operations, in those areas and result in a loss of revenue.
Risk Factors Related to the Transactions and Separation from GE
We may experience challenges relating to the ongoing integration of Baker Hughes and GE O&G or the separation from GE that may result in a decline in the anticipated benefits of the Transactions and the Master Agreement Framework.
The Transactions involved the combination of two businesses that previously operated as independent businesses. The Company has been and will continue to be required to devote management attention and resources to integrating its business practices and operations, as well as to the separation from GE.
If we experience difficulties with the ongoing integration process or with the separation from GE, the anticipated benefits of the Transactions and the Master Agreement Framework may not be realized fully or at all, may take longer to realize than expected, or may be offset by the decrease in business from certain customers or other negative impacts. These integration matters and the impact of the separation from GE could have an adverse effect on our business, results of operations, financial condition or other prospects on an ongoing basis.
We have incurred and will continue to incur costs in connection with the Transactions and the integration of the two businesses. We also have incurred and expect to continue to incur additional costs in connection with the Master Agreement Framework and the separation from GE.
The Transactions involved the combination of two businesses that previously operated as independent businesses. As a result of the Transactions, there are many systems that must be successfully integrated between the two businesses, including information management, purchasing, accounting and finance, sales, billing, payroll and benefits, fixed asset and lease administration systems and regulatory compliance.
Separately, on November 13, 2018, the Company, BHGE LLC and GE entered into the Master Agreement Framework designed to further solidify the commercial and technological relationships between the two companies and to facilitate BHGE’s ability to transition from operating as a controlled company. In particular, the Master Agreement Framework contemplates long-term agreements between the Company, BHGE LLC and GE on technology, fulfillment and other key areas to provide greater clarity to customers, employees and shareholders. Certain of the transactions contemplated by the Master Agreement Framework may be subject to regulatory approvals. The Company has been and will continue to be required to devote management attention and resources to integrating its business practices and operations, as well as to the separation from GE.
Our entry into the Master Agreement Framework with GE, the ongoing integration of Baker Hughes and GE O&G, the separation from GE and any necessary changes to complete integration efforts based on the new business arrangements contemplated by the Master Agreement Framework may result in additional costs and difficulties. Actual costs related to the separation and the implementation of the changes contemplated by the
20 | BHGE 2018 FORM 10-K
Master Agreement Framework may be higher than anticipated, and we may experience additional difficulties in effecting such changes.
We are a “controlled company” within the meaning of the NYSE rules and, as a result, qualify for, and are relying on, exemptions from certain corporate governance requirements. As a result, our stockholders do not have the same protections afforded to stockholders of companies that are subject to such requirements. The interests of GE as a majority stockholder may differ from the interests of other stockholders of the Company. If we do not retain “controlled company” status in the event that GE sells additional equity in the future, we may during the phase-in period continue to rely on exemptions from certain corporate governance requirements that provide protection to stockholders of other companies.
Through its ownership of a majority of our voting power and the provisions set forth in our charter, our bylaws and the Stockholders Agreement, GE has the ability to designate and elect a majority of our directors until the later of July 3, 2019 and the first date on which it ceases to hold more than 50% of the voting power of our outstanding common stock (the Trigger Date). As a result of GE’s ownership of a majority of the voting power of our common stock, we are a “controlled company” as defined in NYSE listing rules and, therefore, are not subject to NYSE requirements that would otherwise require us to have (i) a majority of independent directors, (ii) a nominating committee composed solely of independent directors, (iii) the compensation of our executive officers determined by a majority of the independent directors or a compensation committee composed solely of independent directors, and (iv) director nominees selected, or recommended for the board’s selection, either by a majority of the independent directors or a nominating committee composed solely of independent directors. In connection with the Master Agreement Framework, the Stockholders Agreement was amended and restated to provide that, following the Trigger Date and until GE and its affiliates own less than 20% of the voting power of our outstanding common stock, GE shall be entitled to designate one person for nomination to our board of directors. See “Note 18. Related Party Transactions" of the Notes to Consolidated and Combined Financial Statements in Item 8 herein.
In the event that GE sells additional equity in the future, GE may cease to control a majority of our voting power. Accordingly, we may no longer be a “controlled company” as defined in NYSE listing rules. Under the listing rules, a company that ceases to be a controlled company must comply with the independent board committee requirements as they relate to the nominating and corporate governance and compensation committees on the following phase-in schedule: (1) one independent committee member at the time it ceases to be a controlled company, (2) a majority of independent committee members within 90 days of the date it ceases to be a controlled company and (3) all independent committee members within one year of the date it ceases to be a controlled company. Additionally, NYSE listing rules provide a 12-month phase-in period from the date a company ceases to be a controlled company to comply with the majority independent board requirement. Although we believe we would be able to modify the composition of our board in a timely manner, during these phase-in periods our stockholders may not have the same protections afforded to stockholders of companies of which the majority of directors are independent. Furthermore, a change in our board of directors and committee membership may result in a change in corporate strategy and operation philosophies, and may result in deviations from our current strategy.
The Company is a party to the tax matters agreement with GE (the Tax Matters Agreement) entered into at closing of the Transactions and amended under the Master Agreement Framework. Under the Tax Matters Agreement, the Company could, under certain circumstances, be entitled to receive tax benefits in connection with the sale by GE of its equity interests in the Company. However, there is no assurance that the Company will realize any such benefits.
GE also has control over certain matters submitted to stockholders for approval, including changes in capital structure, transactions requiring stockholder approval under Delaware law and corporate governance, subject to the terms of the Stockholders Agreement relating to GE’s agreement to vote in favor of director nominees not designated by GE and to proposals by GE to acquire all of the shares of Class A common stock held by non-GE stockholders. Even if GE sells additional equity in the future and is no longer a majority stockholder, GE may still exercise control or significant influence over matters submitted to our stockholders for approval. GE may also have influence over matters that do not require stockholder approval. GE may have different interests than other holders of Class A common stock on these and other matters which may affect our operational and financial decisions.
Among other things, GE’s control could delay, defer, or prevent a sale of the Company that other stockholders support, or, conversely, this control could result in the consummation of such a transaction that other stockholders do not support. This concentrated control could discourage a potential investor from seeking to acquire Class A common stock and, as a result, might harm the market price of that Class A common stock.
BHGE 2018 FORM 10-K | 21
Given GE’s ownership of the majority of our outstanding voting securities and the interactions that have taken place and will take place between us and GE, our success depends in part on the reputation and success of GE. In the event that we are no longer controlled by GE, our success will remain partially dependent on GE through, among other things, their participation in our business operations and strategy as described above, our reliance on the long-term agreements and transition services agreements between the Company and GE pursuant to the Master Agreement Framework and the public perception of our affiliation with GE.
If we were to cease being a majority-owned subsidiary of GE in the future, such a separation could adversely affect our business and profitability. Uncertainty about the likelihood of any such separation could also adversely affect our business, financial condition and results of operations.
Following the Transactions, we market many of our products and services using the “GE” brand name and logo. Although we believe that the association with GE provides many benefits, including: a strong brand, broad research and development capabilities, elevated status with suppliers and customers, and established relationships with regulators, we may in the future determine to rebrand our business or pursue alternative marketing strategies, which could adversely affect our ability to attract new customers or maintain existing business relationships with customers, suppliers and other business partners, all of which could have a material adverse effect on our business, financial condition and results of operations.
Although GE has licensed to us the right to use certain “GE” marks in its corporate name and in the products and services of our business in connection with certain oil and gas activities and other discrete oil and gas segments, that right to use these marks would be lost if the license were to expire or otherwise terminate, which may occur, among other reasons, in the event we cease being a majority-owned subsidiary of GE (subject to certain phase-out provisions). As a consequence of such expiration or termination, we would need to remove the “GE” marks from our corporate name, products and services.
In addition, if we were to cease being a majority-owned subsidiary of GE, or there were otherwise a meaningful change in the relationships between GE and the Company beyond what is contemplated by the Master Agreement Framework, such an event or events could adversely affect, among other things, our ability to attract and retain customers. We may be required to provide more favorable pricing and other terms to our customers and take other action to maintain our relationship with existing, and attract new, customers, all of which could have a material adverse effect on our business, financial condition and results of operations. For example, although GE would be subject to certain non-compete restrictions for a period of time following the Company no longer being a majority-owned subsidiary of GE, in the absence of an agreement regulating the go-to-market strategy and the reciprocal commercial and technical support between GE and the Company, GE may attempt to compete with us with respect to certain technologies and customer projects where we have adjacent or overlapping presence (e.g., steam turbines and gas turbines). Furthermore, we may lose cost synergies, joint investment and R&D opportunities, and access to customers, in fields where we and GE currently collaborate as per the terms of the Channel Agreement (e.g. additive manufacturing; digital).
The potential separation from GE has created, and may continue to create, uncertainty among our customers, suppliers, and other business partners. In addition, the Master Agreement Framework and related binding term sheets contemplate entering into a number of definitive agreements based on terms included therein. If we are unable to enter into definitive agreements with GE for any reason by certain specified deadlines, the business arrangements contemplated by the Master Agreement Framework may by their terms take effect in the absence of definitive agreements, which may lead to additional uncertainty and could have a material adverse effect on our business, financial condition and results of operations. The potential uncertainty due to these or other factors may undermine our business and have a material adverse effect on our financial condition and results of operations, and may cause increased volatility and wide price fluctuations in our stock price.
The market price of our Class A common stock could be materially impacted due to the substantial number of shares of our capital stock eligible for sale in future secondary offerings by GE.
The large number of shares of our Class A common stock eligible for sale by GE in the future could cause the market price of our Class A common stock to substantially decrease. GE owned approximately 50.4% percent of our outstanding Class A common stock as of December 31, 2018 (assuming full exchange of our shares of Class B common stock pursuant to the Exchange Agreement). Future sales of a substantial number of shares of our Class
22 | BHGE 2018 FORM 10-K
A common stock in the public market, or the perception that these sales could occur, could substantially decrease the market price of our Class A common stock.
The market price and trading volume of our Class A common stock may be volatile, which could result in rapid and substantial losses for our stockholders.
The market price of our Class A common stock may be highly volatile and could be subject to wide fluctuations. In addition, the trading volume in our Class A common stock may fluctuate and cause significant price variations to occur. If the market price of our Class A common stock declines significantly, you may be unable to sell your shares of our Class A common stock at or above your purchase price, if at all. We cannot assure you that the market price of our Class A common stock will not fluctuate or decline significantly in the future. Some of the factors that could negatively affect the price of our Class A common stock or result in fluctuations in the price or trading volume of our Class A common stock include: variations in our quarterly operating results; failure to meet our earnings estimates; publication of research reports about us or our industry or the failure of securities analysts to cover our Class A common stock after the offering; additions or departures of our executive officers and other key management personnel; adverse market reaction to any indebtedness we may incur or securities we may issue in the future; actions by stockholders; offerings of our Class A common stock by GE or the perceived possibility of such offerings; changes in market valuations of similar companies; speculation in the press or investment community; changes or proposed changes in laws or regulations or differing interpretations thereof affecting our business or enforcement of these laws and regulations, or announcements relating to these matters; adverse publicity about our industry generally or individual scandals, specifically; and general market and economic conditions.
Anti-takeover provisions in our organizational documents and Delaware law might discourage or delay acquisition attempts for us that you might consider favorable.
Our amended and restated certificate of incorporation and amended and restated bylaws may delay or prevent a merger or acquisition that a stockholder may consider favorable by permitting our board of directors to issue one or more series of preferred stock, requiring advance notice for stockholder proposals and nominations, and placing limitations on convening stockholder meetings. These provisions may also discourage acquisition proposals or delay or prevent a change in control, which could harm our stock price.
BHGE 2018 FORM 10-K | 23
ITEM 1B. UNRESOLVED STAFF COMMENTS
None.
ITEM 2. PROPERTIES
We own or lease numerous properties throughout the world. We consider our manufacturing plants, equipment assembly, maintenance and overhaul facilities, grinding plants, drilling fluids and chemical processing centers, and primary research and technology centers to be our principal properties. The following sets forth the location of our principal owned or leased facilities for our business segments as of December 31, 2018:
Oilfield Services: Houston, Pasadena, and The Woodlands, Texas; Broken Arrow and Claremore,Oklahoma - all located in the United States; Leduc, Canada; Celle, Germany;Tananger, Norway; Aberdeen, Scotland; Liverpool, England; Macae, Brazil;Singapore, Singapore; Kakinada, India; Nimr, Oman; Abu Dhabi and Dubai,United Arab Emirates; Dhahran, Saudi Arabia; Luanda, Angola; Port Harcourt,Nigeria
Oilfield Equipment: Houston and Humble, Texas - located in the United States; Montrose, Scotland;Nailsea, England; Niteroi, Brazil; Suzhou, China; Dammam, Saudi Arabia
Turbomachinery & ProcessSolutions:
Deer Park, Texas and Jacksonville, Florida - located in the United States;Florence and Massa, Italy; Le Creusot, France; Coimbatore, India
Digital Solutions: Billerica, Massachusetts and Minden, Nevada - located in the United States;Groby, England; Shannon, Ireland; Hurth, Germany
We own or lease numerous other facilities such as service centers, blend plants, workshops and sales and administrative offices throughout the geographic regions in which we operate. We also have a significant investment in service vehicles, tools and manufacturing and other equipment. All of our owned properties are unencumbered. We believe that our facilities are well maintained and suitable for their intended purposes.
ITEM 3. LEGAL PROCEEDINGS
The information with respect to Item 3. Legal Proceedings is contained in "Note 19. Commitment and Contingencies" of the Notes to Consolidated Financial Statements in Item 8 herein.
ITEM 4. MINE SAFETY DISCLOSURES
Our barite mining operations, in support of our drilling fluids products and services business, are subject to regulation by the federal Mine Safety and Health Administration under the Federal Mine Safety and Health Act of 1977. Information concerning mine safety violations or other regulatory matters required by Section 1503(a) of the Dodd-Frank Wall Street Reform and Consumer Protection Act and Item 104 of Regulation S-K is included in Exhibit 95 to this annual report.
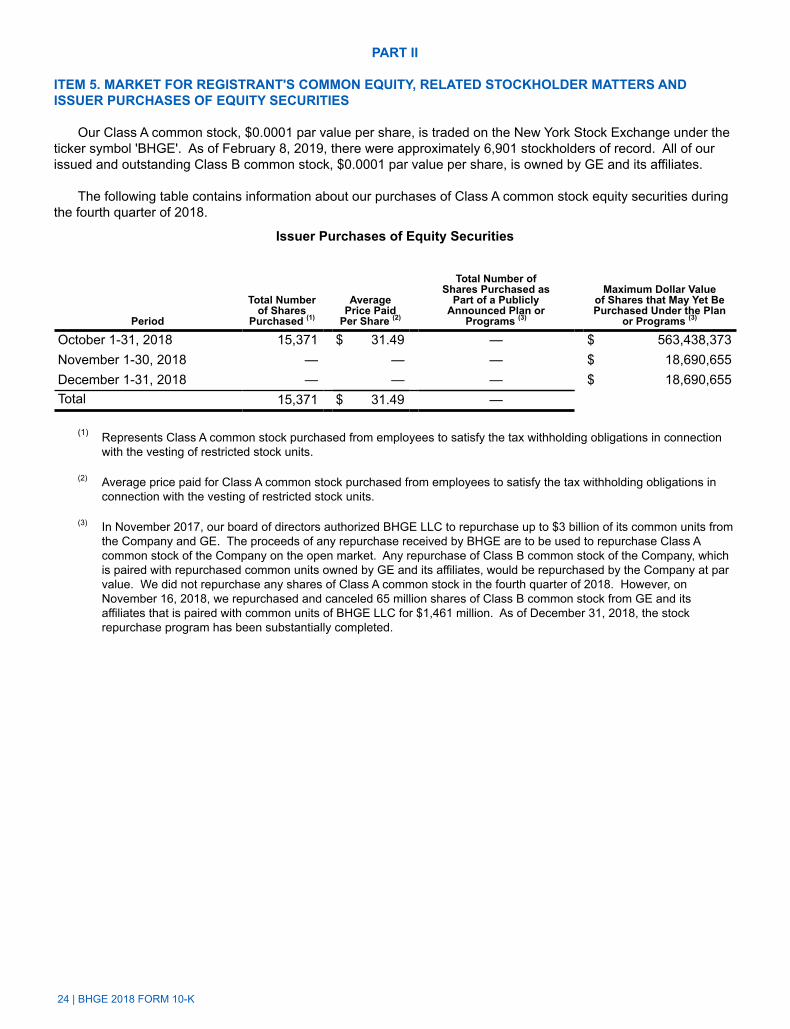
24 | BHGE 2018 FORM 10-K
PART II
ITEM 5. MARKET FOR REGISTRANT'S COMMON EQUITY, RELATED STOCKHOLDER MATTERS AND ISSUER PURCHASES OF EQUITY SECURITIES
Our Class A common stock, $0.0001 par value per share, is traded on the New York Stock Exchange under the ticker symbol 'BHGE'. As of February 8, 2019, there were approximately 6,901 stockholders of record. All of our issued and outstanding Class B common stock, $0.0001 par value per share, is owned by GE and its affiliates.
The following table contains information about our purchases of Class A common stock equity securities during the fourth quarter of 2018.
Issuer Purchases of Equity Securities
Period
Total Numberof Shares
Purchased (1)
AveragePrice Paid
Per Share (2)
Total Number ofShares Purchased as
Part of a PubliclyAnnounced Plan or
Programs (3)
Maximum Dollar Valueof Shares that May Yet BePurchased Under the Plan
or Programs (3)
October 1-31, 2018 15,371 $ 31.49 — $ 563,438,373November 1-30, 2018 — — — $ 18,690,655December 1-31, 2018 — — — $ 18,690,655Total 15,371 $ 31.49 —
(1) Represents Class A common stock purchased from employees to satisfy the tax withholding obligations in connectionwith the vesting of restricted stock units.
(2) Average price paid for Class A common stock purchased from employees to satisfy the tax withholding obligations inconnection with the vesting of restricted stock units.
(3) In November 2017, our board of directors authorized BHGE LLC to repurchase up to $3 billion of its common units fromthe Company and GE. The proceeds of any repurchase received by BHGE are to be used to repurchase Class Acommon stock of the Company on the open market. Any repurchase of Class B common stock of the Company, whichis paired with repurchased common units owned by GE and its affiliates, would be repurchased by the Company at parvalue. We did not repurchase any shares of Class A common stock in the fourth quarter of 2018. However, onNovember 16, 2018, we repurchased and canceled 65 million shares of Class B common stock from GE and itsaffiliates that is paired with common units of BHGE LLC for $1,461 million. As of December 31, 2018, the stockrepurchase program has been substantially completed.
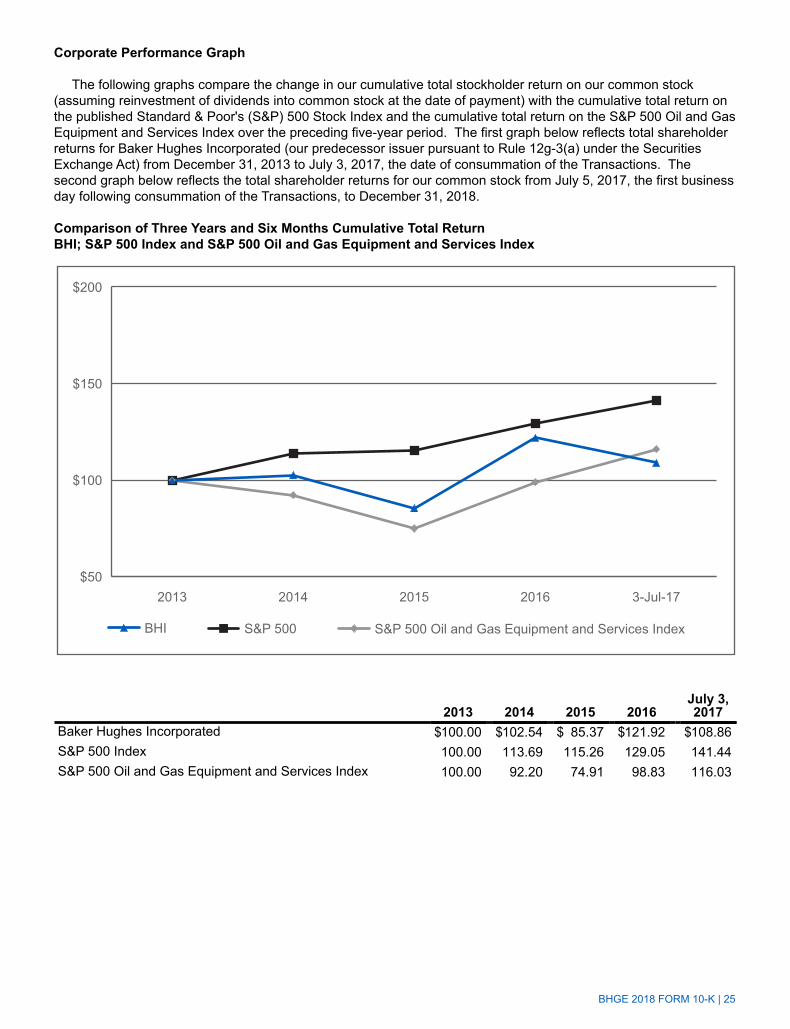
BHGE 2018 FORM 10-K | 25
Corporate Performance Graph
The following graphs compare the change in our cumulative total stockholder return on our common stock (assuming reinvestment of dividends into common stock at the date of payment) with the cumulative total return on the published Standard & Poor's (S&P) 500 Stock Index and the cumulative total return on the S&P 500 Oil and Gas Equipment and Services Index over the preceding five-year period. The first graph below reflects total shareholder returns for Baker Hughes Incorporated (our predecessor issuer pursuant to Rule 12g-3(a) under the Securities Exchange Act) from December 31, 2013 to July 3, 2017, the date of consummation of the Transactions. The second graph below reflects the total shareholder returns for our common stock from July 5, 2017, the first business day following consummation of the Transactions, to December 31, 2018.
Comparison of Three Years and Six Months Cumulative Total ReturnBHI; S&P 500 Index and S&P 500 Oil and Gas Equipment and Services Index
2013 2014 2015 2016July 3,2017
Baker Hughes Incorporated $100.00 $102.54 $ 85.37 $121.92 $108.86S&P 500 Index 100.00 113.69 115.26 129.05 141.44S&P 500 Oil and Gas Equipment and Services Index 100.00 92.20 74.91 98.83 116.03
$200
$150
$100
$502013 2014 2015 2016 3-Jul-17
BHI S&P 500 S&P 500 Oil and Gas Equipment and Services Index
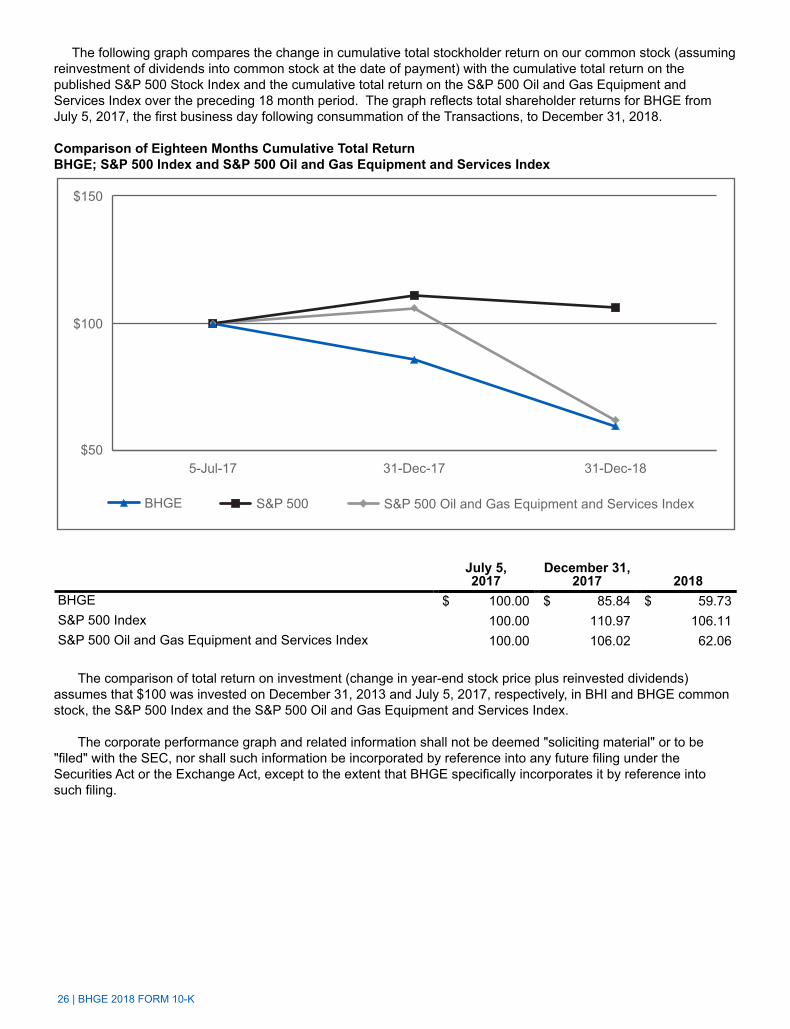
26 | BHGE 2018 FORM 10-K
The following graph compares the change in cumulative total stockholder return on our common stock (assuming reinvestment of dividends into common stock at the date of payment) with the cumulative total return on the published S&P 500 Stock Index and the cumulative total return on the S&P 500 Oil and Gas Equipment and Services Index over the preceding 18 month period. The graph reflects total shareholder returns for BHGE from July 5, 2017, the first business day following consummation of the Transactions, to December 31, 2018.
Comparison of Eighteen Months Cumulative Total ReturnBHGE; S&P 500 Index and S&P 500 Oil and Gas Equipment and Services Index
July 5,2017
December 31,2017 2018
BHGE $ 100.00 $ 85.84 $ 59.73S&P 500 Index 100.00 110.97 106.11S&P 500 Oil and Gas Equipment and Services Index 100.00 106.02 62.06
The comparison of total return on investment (change in year-end stock price plus reinvested dividends) assumes that $100 was invested on December 31, 2013 and July 5, 2017, respectively, in BHI and BHGE common stock, the S&P 500 Index and the S&P 500 Oil and Gas Equipment and Services Index.
The corporate performance graph and related information shall not be deemed "soliciting material" or to be "filed" with the SEC, nor shall such information be incorporated by reference into any future filing under the Securities Act or the Exchange Act, except to the extent that BHGE specifically incorporates it by reference into such filing.
$150
$100
$505-Jul-17 31-Dec-17 31-Dec-18
BHGE S&P 500 S&P 500 Oil and Gas Equipment and Services Index
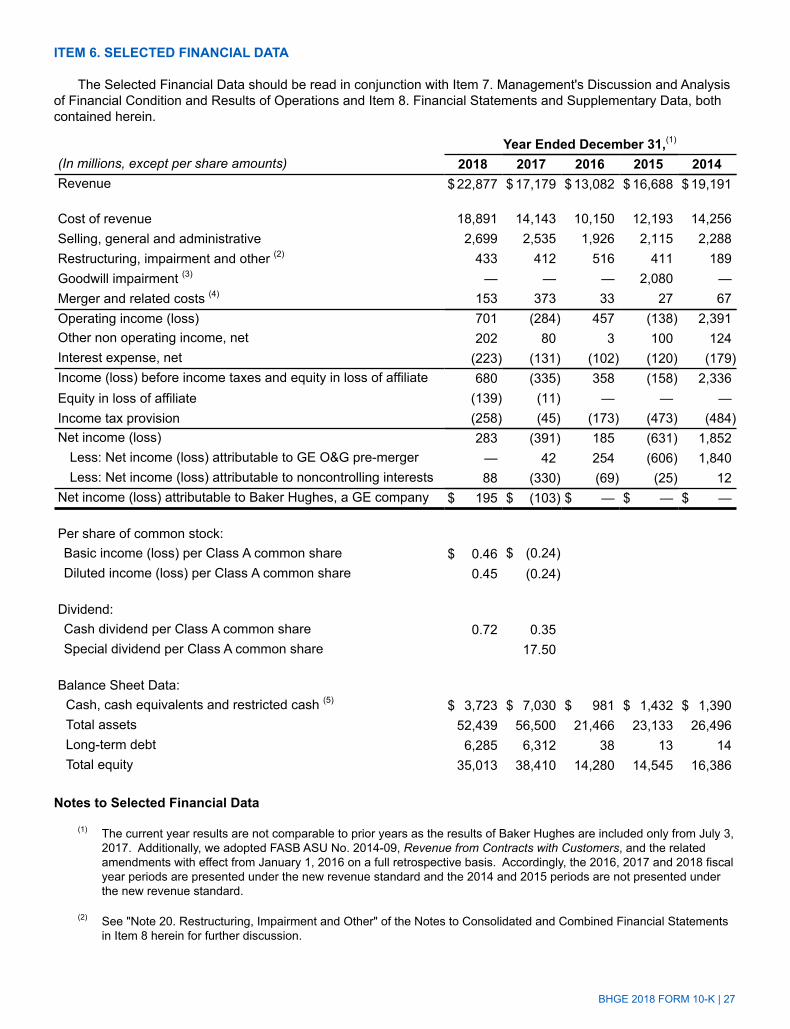
BHGE 2018 FORM 10-K | 27
ITEM 6. SELECTED FINANCIAL DATA
The Selected Financial Data should be read in conjunction with Item 7. Management's Discussion and Analysis of Financial Condition and Results of Operations and Item 8. Financial Statements and Supplementary Data, both contained herein.
Year Ended December 31,(1)
(In millions, except per share amounts) 2018 2017 2016 2015 2014Revenue $ 22,877 $ 17,179 $ 13,082 $ 16,688 $ 19,191
Cost of revenue 18,891 14,143 10,150 12,193 14,256Selling, general and administrative 2,699 2,535 1,926 2,115 2,288Restructuring, impairment and other (2) 433 412 516 411 189Goodwill impairment (3) — — — 2,080 —Merger and related costs (4) 153 373 33 27 67Operating income (loss) 701 (284) 457 (138) 2,391Other non operating income, net 202 80 3 100 124Interest expense, net (223) (131) (102) (120) (179)Income (loss) before income taxes and equity in loss of affiliate 680 (335) 358 (158) 2,336Equity in loss of affiliate (139) (11) — — —Income tax provision (258) (45) (173) (473) (484)Net income (loss) 283 (391) 185 (631) 1,852
Less: Net income (loss) attributable to GE O&G pre-merger — 42 254 (606) 1,840Less: Net income (loss) attributable to noncontrolling interests 88 (330) (69) (25) 12
Net income (loss) attributable to Baker Hughes, a GE company $ 195 $ (103) $ — $ — $ —
Per share of common stock:Basic income (loss) per Class A common share $ 0.46 $ (0.24)Diluted income (loss) per Class A common share 0.45 (0.24)
Dividend:Cash dividend per Class A common share 0.72 0.35Special dividend per Class A common share 17.50
Balance Sheet Data:Cash, cash equivalents and restricted cash (5) $ 3,723 $ 7,030 $ 981 $ 1,432 $ 1,390Total assets 52,439 56,500 21,466 23,133 26,496Long-term debt 6,285 6,312 38 13 14Total equity 35,013 38,410 14,280 14,545 16,386
Notes to Selected Financial Data
(1) The current year results are not comparable to prior years as the results of Baker Hughes are included only from July 3, 2017. Additionally, we adopted FASB ASU No. 2014-09, Revenue from Contracts with Customers, and the related amendments with effect from January 1, 2016 on a full retrospective basis. Accordingly, the 2016, 2017 and 2018 fiscal year periods are presented under the new revenue standard and the 2014 and 2015 periods are not presented under the new revenue standard.
(2) See "Note 20. Restructuring, Impairment and Other" of the Notes to Consolidated and Combined Financial Statements in Item 8 herein for further discussion.

28 | BHGE 2018 FORM 10-K
(3) In performing the annual impairment test for goodwill in the third quarter of 2015 using data as of July 1 of that year, we determined that a step two test was required for a reporting unit within our OFS operating segment. As a consequence of the continued pressure on oil prices, the revised expected cash flows for this reporting unit resulted in a goodwill impairment charge of $2,080 million
(4) See "Note 3. Business Acquisition and Disposition" of the Notes to Consolidated and Combined Financial Statements in Item 8 herein for further discussion of merger and related costs.
(5) Cash, cash equivalents and restricted cash includes $747 million and $997 million of cash held on behalf of GE at December 31, 2018 and 2017, respectively.
BHGE 2018 FORM 10-K | 29
ITEM 7. MANAGEMENT'S DISCUSSION AND ANALYSIS OF FINANCIAL CONDITION AND RESULTS OF OPERATIONS
Management's Discussion and Analysis of Financial Condition and Results of Operations (MD&A) should be read in conjunction with the consolidated and combined financial statements included in Item 8. Financial Statements and Supplementary Data contained herein.
EXECUTIVE SUMMARY
On July 3, 2017, we closed the Transactions to combine GE O&G and Baker Hughes, creating a fullstream oilfield technology provider that has a unique mix of integrated oilfield products, services and digital solutions. The Transactions were executed using a partnership structure, pursuant to which GE O&G and Baker Hughes each contributed their operating assets to a newly formed partnership, BHGE LLC. As of December 31, 2018, GE holds an approximate 50.4% controlling interest in this partnership and the Company holds an approximate 49.6% economic interest. The results of operations for the Company include the results of Baker Hughes from July 3, 2017, the date of acquisition, through December 31, 2018. The majority of the Baker Hughes business operations are included in the Oilfield Services segment. The Transactions were treated as a “reverse acquisition” for accounting purposes and, as such, the historical financial statements of the accounting acquirer, GE O&G, are the historical financial statements of the Company. The current year results may not be comparable to prior years as the prior years include the results of Baker Hughes only from July 3, 2017. We operate through our four business segments: Oilfield Services (OFS), Oilfield Equipment (OFE), Turbomachinery & Processing Solutions (TPS), and Digital Solutions (DS). As of December 31, 2018, BHGE employs approximately 66,000 employees and operates in more than 120 countries.
In June 2018, GE announced their intention to pursue an orderly separation from BHGE over time. To that end, during the fourth quarter of 2018, certain equity transactions were completed and GE’s ownership of BHGE was reduced from approximately 62.5% to approximately 50.4%. At the same time, we completed the Master Agreement Framework designed to further solidify the commercial and technological collaboration between us and GE and to position us for the future. The Master Agreement Framework focuses on areas where we work most closely with GE on developing leading technology and executing for customers. First, we defined the parameters for long-term collaboration and partnership with GE on critical rotating equipment technology. Second, for our Digital software and technology business we will maintain the status quo as the exclusive supplier of GE Digital oil-and-gas applications. Finally, we reached agreements on a number of other areas including our Controls business, pension, taxes, and intercompany services. For further details on the Master Agreement Framework see "Note 18. Related Party Disclosures" of the Notes to Consolidated and Combined Financial Statements in Item 8 herein.
In aggregate, we anticipate that the net financial impact of the agreements contemplated by the Master Agreement Framework will have a slightly negative impact on our operating margin rates of approximately 20 to 40 basis points. In addition, we expect to incur one-time charges related to separation from GE of approximately $0.2 billion to $0.3 billion over the next three years. We expect these charges to be primarily related to the build-out of information technology infrastructure as well as customary transaction fees. For a discussion of certain risks associated with separation, including risks related to our business, financial condition and results of operations, see “Item 1A. Risk Factors-Risks Factors Related to the Transactions and Separation from GE.”
In 2018, we generated revenue of $22,877 million, compared to $17,179 million in 2017. The increase in revenue was driven primarily by OFS as 2018 included the full year results of Baker Hughes compared to only six months in 2017, and to a lesser extent, by DS partially offset by declines in TPS and OFE. Income before income taxes and equity in loss of affiliate was $680 million in 2018, and included restructuring and impairment charges of $433 million and merger and related costs of $153 million. These restructuring and impairment charges were recorded as a result of our continued actions to adjust our operations and cost structure to reflect reduced activity levels. In 2017, loss before income taxes and equity in loss of affiliate was $335 million, which also included restructuring and impairment charges of $412 million, and merger and related costs of $373 million.
30 | BHGE 2018 FORM 10-K
OUTLOOK
Our business is exposed to a number of different macro factors, which influence our expectations and outlook. All of our outlook expectations are purely based on the market as we see it today, and are subject to change given volatile conditions in the industry.
• North America onshore activity: in 2018, we experienced an acceleration in rig count growth, as compared to 2017, driven by the increase in commodity prices for the first 10 months of the year. In the fourth quarter, WTI prices declined 38% driven by both increased supply and geo-political events. We expect the decline in commodity prices may have a negative impact on activity in North America in 2019.
• International onshore activity: we have seen a moderate increase in rig count activity in 2018 and expect growth to continue into 2019, at a slightly increased rate. We have seen signs of improvement with the increase in commodity prices, but due to continued volatility, we remain cautious as to growth expectations.
• Offshore projects: although commodity prices have been volatile, we have begun to see increasing customer activity on offshore projects and more final investment decisions being made. Subsea tree awards increased in 2018, and we expect tree awards to be roughly flat in 2019, though still at levels significantly below prior 2012 and 2013 peaks. We expect customers to continue to evaluate the timing of final investment decisions, and in light of increased commodity price volatility, there may be some project delays.
• Liquefied Natural Gas (LNG) projects: we remain optimistic on the LNG market. While currently oversupplied, we believe a significant number of final investment decisions are needed to fill the projected supply-demand imbalance in the early to middle part of the next decade. In 2018, we saw positive final investment decisions for new LNG capacity. We continue to view the long-term economics of the LNG industry as positive given our outlook for supply and demand.
• Refinery, petrochemical and industrial projects: in refining, we believe large, complex refineries should gain advantage in a more competitive, oversupplied landscape in 2019 as the industry globalizes and refiners position to meet local demand and secure export potential. In petrochemicals, we continue to see healthy demand and cost-advantaged supply driving projects forward in 2019. The industrial market continues to grow as outdated infrastructure is replaced, policy changes come into effect and power is decentralized. We continue to see growing demand across these markets in 2019.
We have other segments in our portfolio that are more correlated with different industrial metrics such as our Digital Solutions business. Overall, we believe our portfolio is uniquely positioned to compete across the value chain, and deliver comprehensive solutions for our customers. We remain optimistic about the long-term economics of the industry, but are continuing to operate with flexibility given our expectations for volatility and changing assumptions in the near term.
Solar and wind net additions continued to exceed coal and gas throughout 2018. Governments may change or may not continue incentives for renewable energy additions. In the long term, renewables' cost decline may accelerate to compete with new-built fossil capacity. However, we do not anticipate any significant impacts to our business in the foreseeable future.
Despite the near-term volatility, the long-term outlook for our industry remains positive. We believe the world’s demand for energy will continue to rise, and the supply of energy will continue to increase in complexity, requiring greater service intensity and more advanced technology from oilfield service companies. As such, we remain focused on delivering innovative, cost-efficient solutions that deliver step changes in operating and economic performance for our customers.
BHGE 2018 FORM 10-K | 31
BUSINESS ENVIRONMENT
The following discussion and analysis summarizes the significant factors affecting our results of operations, financial condition and liquidity position as of and for the year ended December 31, 2018, 2017 and 2016, and should be read in conjunction with the consolidated and combined financial statements and related notes of the Company.
We operate in more than 120 countries helping customers find, evaluate, drill, produce, transport and process hydrocarbon resources. Our revenue is predominately generated from the sale of products and services to major, national, and independent oil and natural gas companies worldwide, and is dependent on spending by our customers for oil and natural gas exploration, field development and production. This spending is driven by a number of factors, including our customers' forecasts of future energy demand and supply, their access to resources to develop and produce oil and natural gas, their ability to fund their capital programs, the impact of new government regulations and most importantly, their expectations for oil and natural gas prices as a key driver of their cash flows.
Oil and Natural Gas Prices
Oil and natural gas prices are summarized in the table below as averages of the daily closing prices during each of the periods indicated.
2018 2017 2016Brent oil prices ($/Bbl) (1) $ 71.34 $ 54.12 $ 43.64WTI oil prices ($/Bbl) (2) 65.23 50.80 43.29Natural gas prices ($/mmBtu) (3) 3.15 2.99 2.52
(1) Energy Information Administration (EIA) Europe Brent Spot Price per Barrel
(2) EIA Cushing, OK WTI (West Texas Intermediate) spot price
(3) EIA Henry Hub Natural Gas Spot Price per million British Thermal Unit
2018 demonstrated the volatility of the oil and gas market. Through the first three quarters of 2018, we experienced stability in the North American and international markets. However, in the fourth quarter of 2018 commodity prices dropped nearly 40% resulting in increased customer uncertainty. From an offshore standpoint, through most of 2018, we saw multiple large offshore projects reach positive final investment decisions, and the LNG market and outlook improved throughout 2018, driven by increased demand globally. In 2018, the first large North American LNG positive final investment decision was reached.
Outside of North America, customer spending is highly driven by Brent oil prices, which increased on average throughout the year. Average Brent oil prices increased to $71.34/Bbl in 2018 from $54.12/Bbl in 2017, and ranged from a low of $50.57/Bbl in December 2018, to a high of $86.07/Bbl in October 2018. For the first three quarters of 2018, Brent oil prices increased sequentially. However, in the fourth quarter, Brent oil prices declined 39% versus the end of the third quarter, as a result of increased supply from the U.S., worries of a global economic slowdown, and lower than expected production cuts.
In North America, customer spending is highly driven by WTI oil prices, which similar to Brent oil prices, on average increased throughout the year. Average WTI oil prices increased to $65.23/Bbl in 2018 from $50.80/Bbl in 2017, and ranged from a low of $44.48/Bbl in December 2018, to a high of $77.41/Bbl in June 2018.
In North America, natural gas prices, as measured by the Henry Hub Natural Gas Spot Price, averaged $3.15/mmBtu in 2018, representing a 6% increase over the prior year. Throughout the year, Henry Hub Natural Gas Spot Prices ranged from a high of $6.24/mmBtu in January 2018 to a low of $2.49/mmBtu in February 2018. According to the U.S. Department of Energy (DOE), working natural gas in storage at the end of 2018 was 2,705 billion cubic feet (Bcf), which was 15.6%, or 421 Bcf, below the corresponding week in 2017.
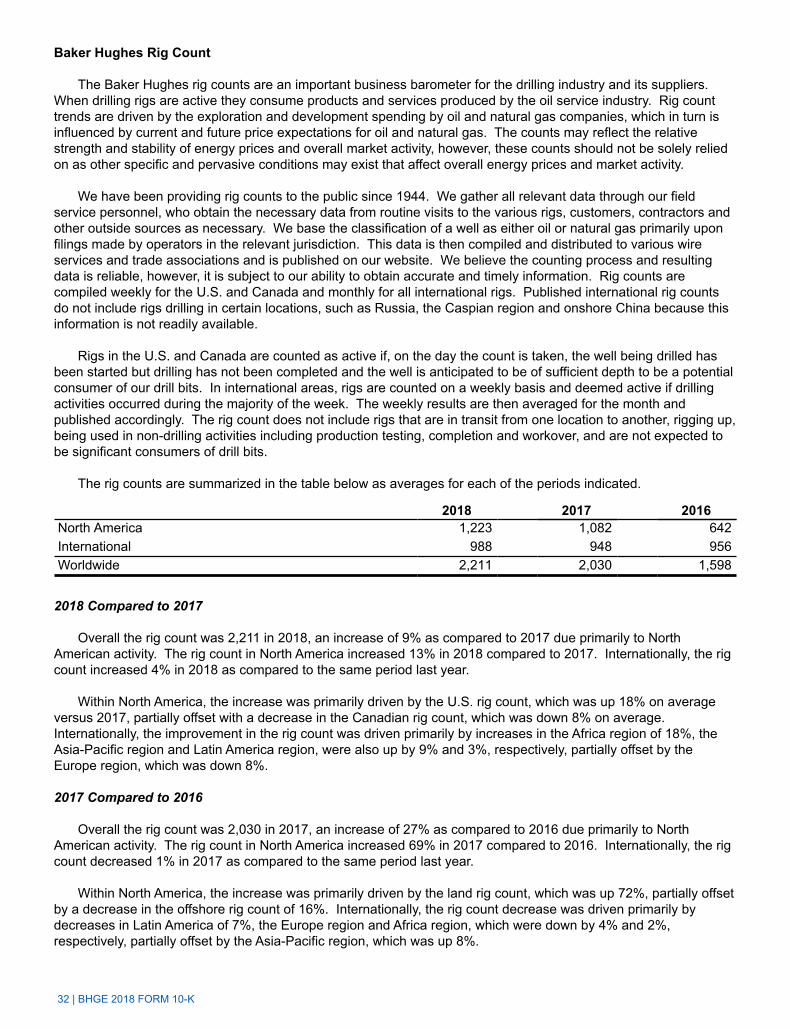
32 | BHGE 2018 FORM 10-K
Baker Hughes Rig Count
The Baker Hughes rig counts are an important business barometer for the drilling industry and its suppliers. When drilling rigs are active they consume products and services produced by the oil service industry. Rig count trends are driven by the exploration and development spending by oil and natural gas companies, which in turn is influenced by current and future price expectations for oil and natural gas. The counts may reflect the relative strength and stability of energy prices and overall market activity, however, these counts should not be solely relied on as other specific and pervasive conditions may exist that affect overall energy prices and market activity.
We have been providing rig counts to the public since 1944. We gather all relevant data through our field service personnel, who obtain the necessary data from routine visits to the various rigs, customers, contractors and other outside sources as necessary. We base the classification of a well as either oil or natural gas primarily upon filings made by operators in the relevant jurisdiction. This data is then compiled and distributed to various wire services and trade associations and is published on our website. We believe the counting process and resulting data is reliable, however, it is subject to our ability to obtain accurate and timely information. Rig counts are compiled weekly for the U.S. and Canada and monthly for all international rigs. Published international rig counts do not include rigs drilling in certain locations, such as Russia, the Caspian region and onshore China because this information is not readily available.
Rigs in the U.S. and Canada are counted as active if, on the day the count is taken, the well being drilled has been started but drilling has not been completed and the well is anticipated to be of sufficient depth to be a potential consumer of our drill bits. In international areas, rigs are counted on a weekly basis and deemed active if drilling activities occurred during the majority of the week. The weekly results are then averaged for the month and published accordingly. The rig count does not include rigs that are in transit from one location to another, rigging up, being used in non-drilling activities including production testing, completion and workover, and are not expected to be significant consumers of drill bits.
The rig counts are summarized in the table below as averages for each of the periods indicated.
2018 2017 2016North America 1,223 1,082 642International 988 948 956Worldwide 2,211 2,030 1,598
2018 Compared to 2017
Overall the rig count was 2,211 in 2018, an increase of 9% as compared to 2017 due primarily to North American activity. The rig count in North America increased 13% in 2018 compared to 2017. Internationally, the rig count increased 4% in 2018 as compared to the same period last year.
Within North America, the increase was primarily driven by the U.S. rig count, which was up 18% on average versus 2017, partially offset with a decrease in the Canadian rig count, which was down 8% on average. Internationally, the improvement in the rig count was driven primarily by increases in the Africa region of 18%, the Asia-Pacific region and Latin America region, were also up by 9% and 3%, respectively, partially offset by the Europe region, which was down 8%.
2017 Compared to 2016
Overall the rig count was 2,030 in 2017, an increase of 27% as compared to 2016 due primarily to North American activity. The rig count in North America increased 69% in 2017 compared to 2016. Internationally, the rig count decreased 1% in 2017 as compared to the same period last year.
Within North America, the increase was primarily driven by the land rig count, which was up 72%, partially offset by a decrease in the offshore rig count of 16%. Internationally, the rig count decrease was driven primarily by decreases in Latin America of 7%, the Europe region and Africa region, which were down by 4% and 2%, respectively, partially offset by the Asia-Pacific region, which was up 8%.
BHGE 2018 FORM 10-K | 33
RESULTS OF OPERATIONS
The discussions below relating to significant line items from our consolidated and combined statements of income (loss) are based on available information and represent our analysis of significant changes or events that impact the comparability of reported amounts. Where appropriate, we have identified specific events and changes that affect comparability or trends and, where reasonably practicable, have quantified the impact of such items. In addition, the discussions below for revenue and cost of revenue are on a total basis as the business drivers for product sales and services are similar. All dollar amounts in tabulations in this section are in millions of dollars, unless otherwise stated. Certain columns and rows may not add due to the use of rounded numbers.
The results of operations for the Company include the results of Baker Hughes from July 3, 2017, the date of acquisition, through the year ended December 31, 2018. Our results of operations are evaluated by the Chief Executive Officer on a consolidated basis as well as at the segment level.
The performance of our operating segments is evaluated based on segment operating income (loss), which is defined as income (loss) before income taxes and equity in loss of affiliate and before the following: net interest expense, net other non operating income, corporate expenses, restructuring, impairment and other charges, inventory impairment, merger and related costs, and certain gains and losses not allocated to the operating segments.
In evaluating the segment performance, the Company uses the following:
Volume: Volume is the increase or decrease in products and/or services sold period-over-period excluding the impact of foreign exchange and price. The volume impact on profit is calculated by multiplying the prior period profit rate by the change in revenue volume between the current and prior period. It also includes price, defined as the change in sales price for a comparable product or service period-over-period and is calculated as the period-over-period change in sales prices of comparable products and services.
Foreign Exchange (FX): FX measures the translational foreign exchange impact, or the translation impact of the period-over-period change on sales and costs directly attributable to change in the foreign exchange rate compared to the US dollar. FX impact is calculated by multiplying the functional currency amounts (revenue or profit) with the period-over-period FX rate variance, using the average exchange rate for the respective period.
(Inflation)/Deflation: (Inflation)/deflation is defined as the increase or decrease in direct and indirect costs of the same type for an equal amount of volume. It is calculated as the year-over-year change in cost (i.e. price paid) of direct material, compensation & benefits and overhead costs.
Productivity: Productivity is measured by the remaining variance in profit, after adjusting for the period-over-period impact of volume & price, foreign exchange and (inflation)/deflation as defined above. Improved or lower period-over-period cost productivity is the result of cost efficiencies or inefficiencies, such as cost decreasing or increasing more than volume, or cost increasing or decreasing less than volume, or changes in sales mix among segments. This also includes the period-over-period variance of transactional foreign exchange, aside from those foreign currency devaluations that are reported separately for business evaluation purposes.
Orders and Remaining Performance Obligations
Orders: We recognized orders of $23,904 million, $17,159 million, and $11,066 million in 2018, 2017 and 2016, respectively. In 2018, service orders were up 36% and equipment orders were up 45%, compared to 2017. In 2017, service orders were up 39% and equipment orders were up 88%, compared to 2016. The increase in orders in 2018 and 2017 was driven primarily by the acquisition of Baker Hughes.
Remaining Performance Obligations (RPO): As of December 31, 2018 and 2017, the aggregate amount of the transaction price allocated to the unsatisfied (or partially unsatisfied) performance obligations was $21.0 billion in each year, respectively.
34 | BHGE 2018 FORM 10-K
Revenue and Segment Operating Income (Loss) Before Tax
Revenue and segment operating income (loss) for each of our four operating segments is provided below.
Year Ended December 31, $ Change
2018 2017 2016From 2017
to 2018From 2016
to 2017Revenue:
Oilfield Services $ 11,617 $ 5,881 $ 788 $ 5,736 $ 5,093Oilfield Equipment 2,641 2,661 3,540 (20) (879)Turbomachinery & Process Solutions 6,015 6,295 6,668 (280) (373)Digital Solutions 2,604 2,342 2,086 262 256
Total $ 22,877 $ 17,179 $ 13,082 $ 5,698 $ 4,097
Year Ended December 31, $ Change
2018 2017 2016From 2017
to 2018From 2016
to 2017Segment operating income (loss):
Oilfield Services $ 785 $ 67 $ (207) $ 718 $ 274Oilfield Equipment — 26 305 (26) (279)Turbomachinery & Process Solutions 621 665 1,058 (44) (393)Digital Solutions 390 357 363 33 (6)
Total segment operating income 1,796 1,115 1,519 681 (404)Corporate (405) (370) (375) (35) 5Inventory impairment and related charges (1) (105) (244) (138) 139 (106)Restructuring, impairment and other (433) (412) (516) (21) 104Merger and related costs (153) (373) (33) 220 (340)Operating income (loss) 701 (284) 457 985 (741)Other non operating income, net 202 80 3 122 77Interest expense, net (223) (131) (102) (92) (29)Income (loss) before income taxes and equity in loss of affiliate 680 (335) 358 1,015 (693)Equity in loss of affiliate (139) (11) — (128) (11)Provision for income taxes (258) (45) (173) (213) 128Net income (loss) $ 283 $ (391) $ 185 $ 674 $ (576)
(1) Inventory impairments and related charges are reported in the "Cost of goods sold" caption of the consolidated and combined statements of income (loss). 2017 includes $87 million of adjustments to write-up the acquired inventory to its estimated fair value on acquisition of Baker Hughes as this inventory was used or sold in the six months ended December 31, 2017.
Fiscal Year 2018 to Fiscal Year 2017
Revenue in 2018 was $22,877 million, an increase of $5,698 million, or 33%, from 2017. This increase in revenue was largely a result of the incremental Baker Hughes revenue in 2018. OFS increased $5,736 million, DS increased $262 million, OFE decreased $20 million, and TPS decreased $280 million.
Total segment operating income in 2018 was $1,796 million, an increase of $681 million, or 61%, from 2017. The increase was primarily driven by OFS, which increased $718 million, and DS, which increased $33 million, partially offset by TPS, which decreased $44 million, and OFE, which decreased $26 million.
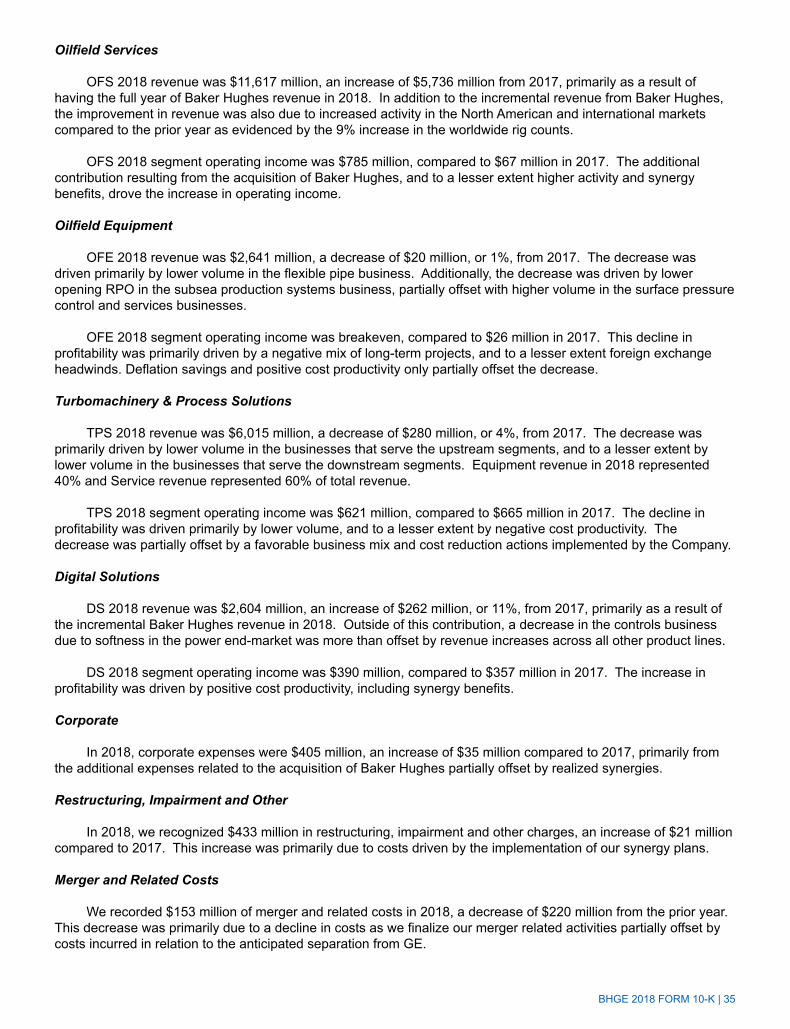
BHGE 2018 FORM 10-K | 35
Oilfield Services
OFS 2018 revenue was $11,617 million, an increase of $5,736 million from 2017, primarily as a result of having the full year of Baker Hughes revenue in 2018. In addition to the incremental revenue from Baker Hughes, the improvement in revenue was also due to increased activity in the North American and international markets compared to the prior year as evidenced by the 9% increase in the worldwide rig counts.
OFS 2018 segment operating income was $785 million, compared to $67 million in 2017. The additional contribution resulting from the acquisition of Baker Hughes, and to a lesser extent higher activity and synergy benefits, drove the increase in operating income.
Oilfield Equipment
OFE 2018 revenue was $2,641 million, a decrease of $20 million, or 1%, from 2017. The decrease was driven primarily by lower volume in the flexible pipe business. Additionally, the decrease was driven by lower opening RPO in the subsea production systems business, partially offset with higher volume in the surface pressure control and services businesses.
OFE 2018 segment operating income was breakeven, compared to $26 million in 2017. This decline in profitability was primarily driven by a negative mix of long-term projects, and to a lesser extent foreign exchange headwinds. Deflation savings and positive cost productivity only partially offset the decrease.
Turbomachinery & Process Solutions
TPS 2018 revenue was $6,015 million, a decrease of $280 million, or 4%, from 2017. The decrease was primarily driven by lower volume in the businesses that serve the upstream segments, and to a lesser extent by lower volume in the businesses that serve the downstream segments. Equipment revenue in 2018 represented 40% and Service revenue represented 60% of total revenue.
TPS 2018 segment operating income was $621 million, compared to $665 million in 2017. The decline in profitability was driven primarily by lower volume, and to a lesser extent by negative cost productivity. The decrease was partially offset by a favorable business mix and cost reduction actions implemented by the Company.
Digital Solutions
DS 2018 revenue was $2,604 million, an increase of $262 million, or 11%, from 2017, primarily as a result of the incremental Baker Hughes revenue in 2018. Outside of this contribution, a decrease in the controls business due to softness in the power end-market was more than offset by revenue increases across all other product lines.
DS 2018 segment operating income was $390 million, compared to $357 million in 2017. The increase in profitability was driven by positive cost productivity, including synergy benefits.
Corporate
In 2018, corporate expenses were $405 million, an increase of $35 million compared to 2017, primarily from the additional expenses related to the acquisition of Baker Hughes partially offset by realized synergies.
Restructuring, Impairment and Other
In 2018, we recognized $433 million in restructuring, impairment and other charges, an increase of $21 million compared to 2017. This increase was primarily due to costs driven by the implementation of our synergy plans.
Merger and Related Costs
We recorded $153 million of merger and related costs in 2018, a decrease of $220 million from the prior year. This decrease was primarily due to a decline in costs as we finalize our merger related activities partially offset by costs incurred in relation to the anticipated separation from GE.
36 | BHGE 2018 FORM 10-K
Interest Expense, Net
In 2018, we incurred net interest expense of $223 million, an increase of $92 million from the prior year, primarily driven by $3.95 billion of debt issued in the fourth quarter of 2017 and debt obtained in the Baker Hughes acquisition, partially offset by reduced interest expense associated with the retirement of debt of $615 million in January of 2018. In addition, interest expense declined as we ceased participation in the GE receivables monetization program.
Equity in Loss of Affiliate
In 2018, we recorded a loss of $139 million related to our equity method investment in BJ Services. As a result, we discontinued applying the equity method. We will resume application of the equity method only after our share of unrecognized net income equals our share of net loss not recognized during the period the equity method was suspended. There is no cash impact to BHGE.
Income Tax
In 2018, our income tax expense increased by $213 million, from $45 million in 2017 to $258 million in 2018. The increase was primarily due to higher foreign taxes related to increased foreign earnings and geographical mix of earnings.
Fiscal Year 2017 to Fiscal Year 2016
Revenue in 2017 was $17,179 million, an increase of $4,097 million, or 31%, from 2016. This increase was primarily driven by the acquisition of Baker Hughes. OFS increased $5,093 million, DS increased $256 million, OFE decreased $879 million, and TPS decreased $373 million.
Total segment operating income in 2017 was $1,115 million, a decrease of $404 million, or 27%, from 2016. The acquisition of Baker Hughes added $321 million of segment operating income, but was more than offset by the organic impact of lower productivity and pricing pressure. OFS increased $274 million, TPS decreased $393 million, OFE decreased $279 million and DS decreased $6 million.
Oilfield Services
OFS 2017 revenue was $5,881 million, an increase of $5,093 million from 2016, primarily as a result of the acquisition of Baker Hughes on July 3, 2017.
OFS 2017 segment operating income was $67 million, compared to a loss of $207 million in 2016. The acquisition of Baker Hughes added $327 million of segment operating income, which includes increased depreciation & amortization expense driven by purchase accounting, partially offset by pricing pressure.
Oilfield Equipment
OFE 2017 revenue was $2,661 million, a decrease of $879 million, or 25%, from 2016. The revenue decline was primarily due to continued volume pressures and to a lesser extent to negative pricing, driven by the delays in final investment decisions by our customers in prior years.
OFE 2017 segment operating income was $26 million, compared to $305 million in 2016. This decline in profitability was the result of negative productivity and volume, while strong deflation savings more than offset pricing pressures.
Turbomachinery & Process Solutions
TPS 2017 revenue was $6,295 million, a decrease of $373 million, or 6%, from 2016. The decline was primarily attributable to negative pricing and to a lesser extent to volume decreases, driven by lower equipment contracts being awarded in prior years and continued softness in the services market.
BHGE 2018 FORM 10-K | 37
TPS 2017 segment operating income was $665 million, compared to $1,058 million in 2016. This decline in profitability was primarily due to unfavorable cost productivity. Other factors were lower margin equipment backlog throughput and the impact of negative pricing.
Digital Solutions
DS 2017 revenue was $2,342 million, an increase of $256 million, or 12%, from 2016, driven by the acquisition of Baker Hughes which added $211 million of revenue versus the prior year.
DS 2017 segment operating income was $357 million, compared to $363 million in 2016. This decline in profitability was primarily driven by the Baker Hughes acquisition contributing a $5 million segment operating loss.
Corporate
In 2017, corporate expenses were $370 million, a decrease of $5 million compared to 2016. This was primarily due to selective decreases in R&D program investments and cost productivity.
Restructuring, Impairment and Other
In 2017, we recognized $412 million in restructuring, impairment and other charges, a decrease of $104 million compared to 2016. This decrease was driven by the absence of any significant currency devaluations in Angola and Nigeria that were experienced in 2016.
Merger and Related Costs
We recorded $373 million of merger and related costs in 2017, an increase of $340 million from the prior year, primarily related to the acquisition of Baker Hughes.
Interest Expense, Net
In 2017, we incurred net interest expense of $131 million, an increase of $29 million from the prior year, primarily driven by the debt acquired on the acquisition of Baker Hughes.
Income Tax
In 2017, our income tax expense decreased by $128 million, from $173 million in 2016 to $45 million in 2017. This decrease was primarily due to a benefit of $132 million related to recent U.S. tax reform and a decline in profit.
COMPLIANCE
We, in the conduct of all of our activities, are committed to maintaining the core values of our Company, as well as high safety, ethical and quality standards (Standards) as also reported in our Quality Management System (QMS). We believe such a commitment is integral to running a sound, successful, and sustainable business. To ensure that we live up to our high Standards, we devote significant resources to maintain a comprehensive global ethics and compliance program (Compliance Program) which is designed to prevent, detect, and appropriately respond in a timely fashion to any potential violations of law, our Code of Conduct (The Spirit & The Letter), and other Company policies and procedures.
Highlights of our Compliance Program include the following:
• Comprehensive internal policies over such areas as anti-bribery; travel, entertainment, gifts and charitable donations connected to government officials; payments to commercial sales representatives; and, the use of non-U.S. police or military organizations for security purposes. In addition, there are country-specific guidance for customs standards, visa processing, export and re-export controls, economic sanctions and antiboycott laws.
• Global structure of Legal Compliance Counsel and Professionals providing compliance advice, customized training, investigations, and governance, across all regions and countries where we do business.
38 | BHGE 2018 FORM 10-K
• Comprehensive employee compliance training program that combines instructor-led and web-based training modules tailored to the key risks that employees face on an ongoing basis.
• Due diligence procedures for commercial sales agents, administrative service providers, and professional consultants, and an enhanced risk-based process for classifying channel partners and suppliers.
• Due diligence procedures for merger and acquisition activities.
• Specifically tailored compliance risk assessments focused on country and third party risk.
• Compliance Review Board comprised of senior officers of the Company that meets quarterly to monitor effectiveness of the Compliance Program, as well as Product Company and regional compliance committees that meet quarterly.
• Technology to monitor and report on compliance matters, including an internal investigations management system, a web-based antiboycott reporting tool and global trade management systems.
• A compliance program designed to create an “Open Reporting Environment” where employees are encouraged to report any ethics or compliance matter without fear of retaliation, including a global network of trained employee ombudspersons, and a worldwide, 24-hour business helpline operated by a third party and available in 150 languages.
• Centralized finance organization with company-wide policies.
• Anti-corruption audits of high-risk countries conducted by Legal Compliance and Internal Audit, as well as risk based compliance audits of third parties conducted by Legal Compliance.
• A centralized human resources function, including locally compliant processes and procedures for management of HR related issues, including implementation of locally compliant standards for pre-hire screening of employees; a process to screen existing employees prior to promotion to select roles where they may be exposed to finance and/or corruption-related risks; and implementation of a global new hire compliance training module for all employees.
LIQUIDITY AND CAPITAL RESOURCES
Our objective in financing our business is to maintain sufficient liquidity, adequate financial resources and financial flexibility in order to fund the requirements of our business. At December 31, 2018, we had cash, cash equivalents and restricted cash of $3,723 million compared to $7,030 million at December 31, 2017. Cash, cash equivalents and restricted cash includes $747 million and $997 million of cash held on behalf of GE at December 31, 2018 and 2017, respectively.
Excluding cash held on behalf of GE, our US subsidiaries held approximately $0.7 billion and $3.6 billion while our foreign subsidiaries held approximately $2.3 billion and $2.4 billion of our cash, cash equivalents and restricted cash as at December 31, 2018 and 2017, respectively. A substantial portion of the cash held by foreign subsidiaries at December 31, 2018 has been reinvested in active non-U.S. business operations. If we decide at a later date to repatriate those funds to the U.S., we may be required to provide taxes on certain of those funds, however, due to the enactment of U.S. tax reform, repatriations of foreign earnings will generally be free of U.S. federal tax but may incur other taxes such as withholding or state taxes.
We have a five-year $3 billion committed unsecured revolving credit facility (the 2017 Credit Agreement) with commercial banks maturing in July 2022. The 2017 Credit Agreement contains certain customary representations and warranties, certain affirmative covenants and no negative covenants. Upon the occurrence of certain events of default, our obligations under the 2017 Credit Agreement may be accelerated. Such events of default include payment defaults to lenders under the 2017 Credit Agreement, and other customary defaults. We were in compliance with all of the credit facility's covenants, and in 2018 there were no borrowings under the credit facility.
We have a commercial paper program under which we may issue from time to time up to $3 billion in commercial paper with maturities of no more than 397 days. At December 31, 2018, we had no borrowings
BHGE 2018 FORM 10-K | 39
outstanding under the commercial paper program. The maximum combined borrowing at any time under both the 2017 Credit Agreement and the commercial paper program is $3 billion.
If market conditions were to change and our revenue was reduced significantly or operating costs were to increase, our cash flows and liquidity could be reduced. Additionally, it could cause the rating agencies to lower our credit rating. There are no ratings triggers that would accelerate the maturity of any borrowings under our committed credit facility. However, a downgrade in our credit ratings could increase the cost of borrowings under the credit facility and could also limit or preclude our ability to issue commercial paper. Should this occur, we could seek alternative sources of funding, including borrowing under the credit facility.
During the year ended December 31, 2018, we used cash to fund a variety of activities including certain working capital needs and restructuring costs, capital expenditures, the repayment of debt, payment of dividends, distributions to GE and share repurchases. We believe that cash on hand, cash flows generated from operations and the available credit facility will provide sufficient liquidity to manage our global cash needs.
Cash Flows
Cash flows provided by (used in) each type of activity were as follows for the years ended December 31:
(In millions) 2018 2017 2016Operating activities $ 1,762 $ (799) $ 262Investing activities (578) (4,123) (472)Financing activities (4,363) 10,919 (102)
Operating Activities
Our largest source of operating cash is payments from customers, of which the largest component is collecting cash related to product or services sales including advance payments or progress collections for work to be performed. The primary use of operating cash is to pay our suppliers, employees, tax authorities and others for a wide range of material and services.
Cash flows from operating activities generated cash of $1,762 million and used cash of $799 million for the years ended December 31, 2018 and 2017, respectively. Cash flows from operating activities increased $2,561 million in 2018 primarily driven by better operating performance. These cash inflows were supported by strong working capital cash flows, especially in the fourth quarter of 2018, including approximately $300 million for a progress collection payment from a customer. Included in our cash flows from operating activities for 2018 and 2017 are payments of $473 million and $612 million, respectively, made primarily for employee severance as a result of our restructuring activities and merger and related costs.
Cash flows from operating activities used $799 million and generated $262 million for the years ended December 31, 2017 and 2016, respectively. Cash flows from operating activities decreased $1,061 million in 2017 primarily driven by a $1,201 million negative impact from ending our receivables monetization program in the fourth quarter, and restructuring related payments throughout the year. These cash outflows were partially offset by strong working capital cash flows, especially in the fourth quarter of 2017. Included in our cash flows from operating activities for 2017 and 2016 are payments of $612 million and $177 million, respectively, made for employee severance as a result of our restructuring activities and merger and related costs.
Investing Activities
Cash flows from investing activities used cash of $578 million, $4,123 million and $472 million for the years ended December 31, 2018, 2017 and 2016, respectively.
Our principal recurring investing activity is the funding of capital expenditures to ensure that we have the appropriate levels and types of machinery and equipment in place to generate revenue from operations. Expenditures for capital assets totaled $995 million, $665 million and $424 million for 2018, 2017 and 2016, respectively, partially offset by cash flows from the sale of property, plant and equipment of $458 million, $172 million and $20 million in 2018, 2017 and 2016, respectively. Proceeds from the disposal of assets related primarily
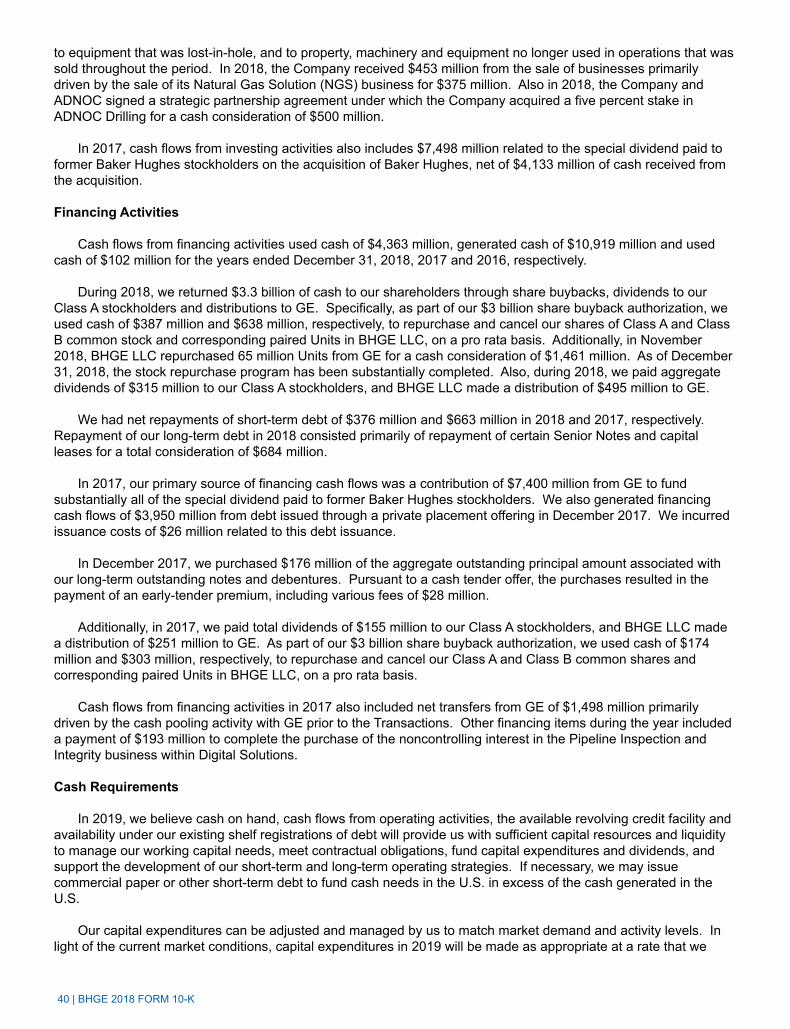
40 | BHGE 2018 FORM 10-K
to equipment that was lost-in-hole, and to property, machinery and equipment no longer used in operations that was sold throughout the period. In 2018, the Company received $453 million from the sale of businesses primarily driven by the sale of its Natural Gas Solution (NGS) business for $375 million. Also in 2018, the Company and ADNOC signed a strategic partnership agreement under which the Company acquired a five percent stake in ADNOC Drilling for a cash consideration of $500 million.
In 2017, cash flows from investing activities also includes $7,498 million related to the special dividend paid to former Baker Hughes stockholders on the acquisition of Baker Hughes, net of $4,133 million of cash received from the acquisition.
Financing Activities
Cash flows from financing activities used cash of $4,363 million, generated cash of $10,919 million and used cash of $102 million for the years ended December 31, 2018, 2017 and 2016, respectively.
During 2018, we returned $3.3 billion of cash to our shareholders through share buybacks, dividends to our Class A stockholders and distributions to GE. Specifically, as part of our $3 billion share buyback authorization, we used cash of $387 million and $638 million, respectively, to repurchase and cancel our shares of Class A and Class B common stock and corresponding paired Units in BHGE LLC, on a pro rata basis. Additionally, in November 2018, BHGE LLC repurchased 65 million Units from GE for a cash consideration of $1,461 million. As of December 31, 2018, the stock repurchase program has been substantially completed. Also, during 2018, we paid aggregate dividends of $315 million to our Class A stockholders, and BHGE LLC made a distribution of $495 million to GE.
We had net repayments of short-term debt of $376 million and $663 million in 2018 and 2017, respectively. Repayment of our long-term debt in 2018 consisted primarily of repayment of certain Senior Notes and capital leases for a total consideration of $684 million.
In 2017, our primary source of financing cash flows was a contribution of $7,400 million from GE to fund substantially all of the special dividend paid to former Baker Hughes stockholders. We also generated financing cash flows of $3,950 million from debt issued through a private placement offering in December 2017. We incurred issuance costs of $26 million related to this debt issuance.
In December 2017, we purchased $176 million of the aggregate outstanding principal amount associated with our long-term outstanding notes and debentures. Pursuant to a cash tender offer, the purchases resulted in the payment of an early-tender premium, including various fees of $28 million.
Additionally, in 2017, we paid total dividends of $155 million to our Class A stockholders, and BHGE LLC made a distribution of $251 million to GE. As part of our $3 billion share buyback authorization, we used cash of $174 million and $303 million, respectively, to repurchase and cancel our Class A and Class B common shares and corresponding paired Units in BHGE LLC, on a pro rata basis.
Cash flows from financing activities in 2017 also included net transfers from GE of $1,498 million primarily driven by the cash pooling activity with GE prior to the Transactions. Other financing items during the year included a payment of $193 million to complete the purchase of the noncontrolling interest in the Pipeline Inspection and Integrity business within Digital Solutions.
Cash Requirements
In 2019, we believe cash on hand, cash flows from operating activities, the available revolving credit facility and availability under our existing shelf registrations of debt will provide us with sufficient capital resources and liquidity to manage our working capital needs, meet contractual obligations, fund capital expenditures and dividends, and support the development of our short-term and long-term operating strategies. If necessary, we may issue commercial paper or other short-term debt to fund cash needs in the U.S. in excess of the cash generated in the U.S.
Our capital expenditures can be adjusted and managed by us to match market demand and activity levels. In light of the current market conditions, capital expenditures in 2019 will be made as appropriate at a rate that we
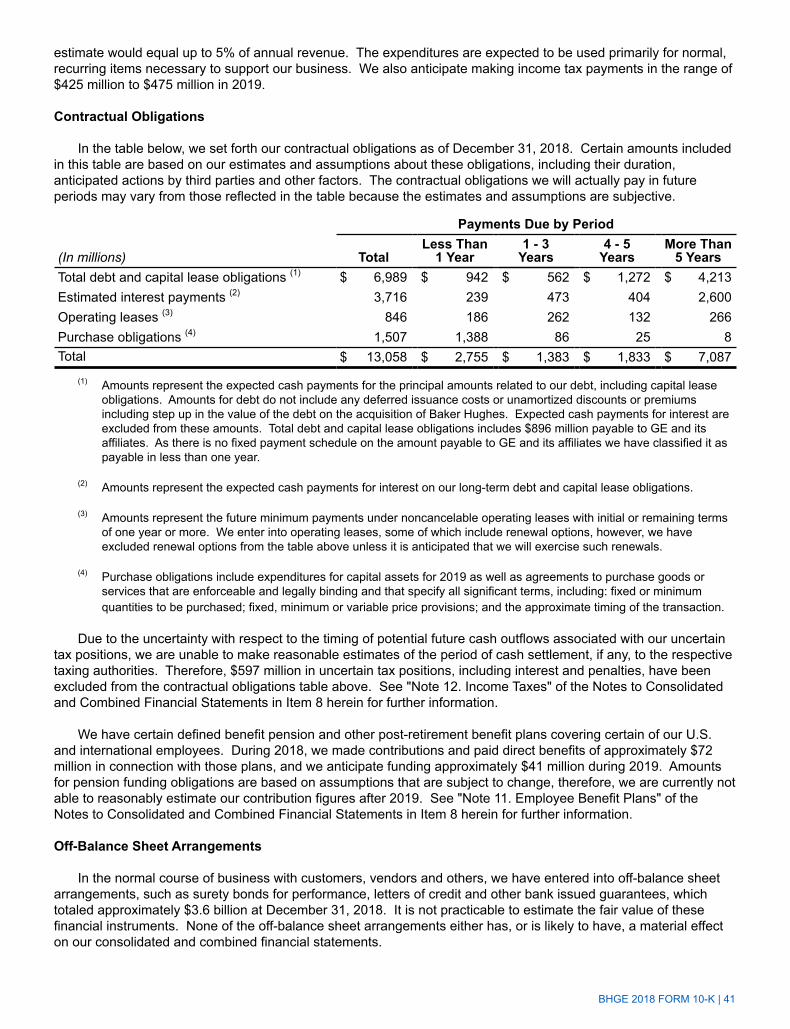
BHGE 2018 FORM 10-K | 41
estimate would equal up to 5% of annual revenue. The expenditures are expected to be used primarily for normal, recurring items necessary to support our business. We also anticipate making income tax payments in the range of $425 million to $475 million in 2019.
Contractual Obligations
In the table below, we set forth our contractual obligations as of December 31, 2018. Certain amounts included in this table are based on our estimates and assumptions about these obligations, including their duration, anticipated actions by third parties and other factors. The contractual obligations we will actually pay in future periods may vary from those reflected in the table because the estimates and assumptions are subjective.
Payments Due by Period
(In millions) TotalLess Than
1 Year1 - 3
Years4 - 5
YearsMore Than
5 YearsTotal debt and capital lease obligations (1) $ 6,989 $ 942 $ 562 $ 1,272 $ 4,213Estimated interest payments (2) 3,716 239 473 404 2,600Operating leases (3) 846 186 262 132 266Purchase obligations (4) 1,507 1,388 86 25 8Total $ 13,058 $ 2,755 $ 1,383 $ 1,833 $ 7,087
(1) Amounts represent the expected cash payments for the principal amounts related to our debt, including capital lease obligations. Amounts for debt do not include any deferred issuance costs or unamortized discounts or premiums including step up in the value of the debt on the acquisition of Baker Hughes. Expected cash payments for interest are excluded from these amounts. Total debt and capital lease obligations includes $896 million payable to GE and its affiliates. As there is no fixed payment schedule on the amount payable to GE and its affiliates we have classified it as payable in less than one year.
(2) Amounts represent the expected cash payments for interest on our long-term debt and capital lease obligations.
(3) Amounts represent the future minimum payments under noncancelable operating leases with initial or remaining terms of one year or more. We enter into operating leases, some of which include renewal options, however, we have excluded renewal options from the table above unless it is anticipated that we will exercise such renewals.
(4) Purchase obligations include expenditures for capital assets for 2019 as well as agreements to purchase goods or services that are enforceable and legally binding and that specify all significant terms, including: fixed or minimum quantities to be purchased; fixed, minimum or variable price provisions; and the approximate timing of the transaction.
Due to the uncertainty with respect to the timing of potential future cash outflows associated with our uncertain tax positions, we are unable to make reasonable estimates of the period of cash settlement, if any, to the respective taxing authorities. Therefore, $597 million in uncertain tax positions, including interest and penalties, have been excluded from the contractual obligations table above. See "Note 12. Income Taxes" of the Notes to Consolidated and Combined Financial Statements in Item 8 herein for further information.
We have certain defined benefit pension and other post-retirement benefit plans covering certain of our U.S. and international employees. During 2018, we made contributions and paid direct benefits of approximately $72 million in connection with those plans, and we anticipate funding approximately $41 million during 2019. Amounts for pension funding obligations are based on assumptions that are subject to change, therefore, we are currently not able to reasonably estimate our contribution figures after 2019. See "Note 11. Employee Benefit Plans" of the Notes to Consolidated and Combined Financial Statements in Item 8 herein for further information.
Off-Balance Sheet Arrangements
In the normal course of business with customers, vendors and others, we have entered into off-balance sheet arrangements, such as surety bonds for performance, letters of credit and other bank issued guarantees, which totaled approximately $3.6 billion at December 31, 2018. It is not practicable to estimate the fair value of these financial instruments. None of the off-balance sheet arrangements either has, or is likely to have, a material effect on our consolidated and combined financial statements.
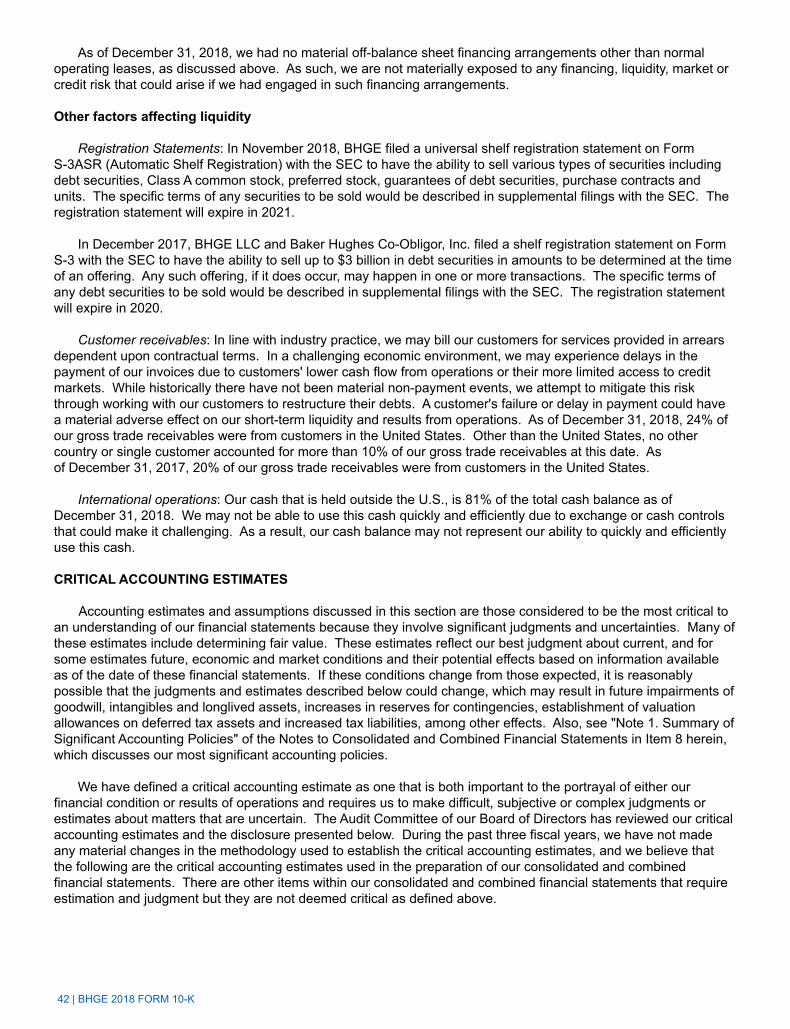
42 | BHGE 2018 FORM 10-K
As of December 31, 2018, we had no material off-balance sheet financing arrangements other than normal operating leases, as discussed above. As such, we are not materially exposed to any financing, liquidity, market or credit risk that could arise if we had engaged in such financing arrangements.
Other factors affecting liquidity
Registration Statements: In November 2018, BHGE filed a universal shelf registration statement on Form S-3ASR (Automatic Shelf Registration) with the SEC to have the ability to sell various types of securities including debt securities, Class A common stock, preferred stock, guarantees of debt securities, purchase contracts and units. The specific terms of any securities to be sold would be described in supplemental filings with the SEC. The registration statement will expire in 2021.
In December 2017, BHGE LLC and Baker Hughes Co-Obligor, Inc. filed a shelf registration statement on Form S-3 with the SEC to have the ability to sell up to $3 billion in debt securities in amounts to be determined at the time of an offering. Any such offering, if it does occur, may happen in one or more transactions. The specific terms of any debt securities to be sold would be described in supplemental filings with the SEC. The registration statement will expire in 2020.
Customer receivables: In line with industry practice, we may bill our customers for services provided in arrears dependent upon contractual terms. In a challenging economic environment, we may experience delays in the payment of our invoices due to customers' lower cash flow from operations or their more limited access to credit markets. While historically there have not been material non-payment events, we attempt to mitigate this risk through working with our customers to restructure their debts. A customer's failure or delay in payment could have a material adverse effect on our short-term liquidity and results from operations. As of December 31, 2018, 24% of our gross trade receivables were from customers in the United States. Other than the United States, no other country or single customer accounted for more than 10% of our gross trade receivables at this date. As of December 31, 2017, 20% of our gross trade receivables were from customers in the United States.
International operations: Our cash that is held outside the U.S., is 81% of the total cash balance as of December 31, 2018. We may not be able to use this cash quickly and efficiently due to exchange or cash controls that could make it challenging. As a result, our cash balance may not represent our ability to quickly and efficiently use this cash.
CRITICAL ACCOUNTING ESTIMATES
Accounting estimates and assumptions discussed in this section are those considered to be the most critical to an understanding of our financial statements because they involve significant judgments and uncertainties. Many of these estimates include determining fair value. These estimates reflect our best judgment about current, and for some estimates future, economic and market conditions and their potential effects based on information available as of the date of these financial statements. If these conditions change from those expected, it is reasonably possible that the judgments and estimates described below could change, which may result in future impairments of goodwill, intangibles and longlived assets, increases in reserves for contingencies, establishment of valuation allowances on deferred tax assets and increased tax liabilities, among other effects. Also, see "Note 1. Summary of Significant Accounting Policies" of the Notes to Consolidated and Combined Financial Statements in Item 8 herein, which discusses our most significant accounting policies.
We have defined a critical accounting estimate as one that is both important to the portrayal of either our financial condition or results of operations and requires us to make difficult, subjective or complex judgments or estimates about matters that are uncertain. The Audit Committee of our Board of Directors has reviewed our critical accounting estimates and the disclosure presented below. During the past three fiscal years, we have not made any material changes in the methodology used to establish the critical accounting estimates, and we believe that the following are the critical accounting estimates used in the preparation of our consolidated and combined financial statements. There are other items within our consolidated and combined financial statements that require estimation and judgment but they are not deemed critical as defined above.
BHGE 2018 FORM 10-K | 43
Revenue Recognition on Long-Term Product Services Agreements
We have long-term service agreements with our customers predominately within our TPS segment. These agreements typically require us to maintain assets sold to the customer over a defined contract term. These agreements have average contract terms of 15 years. From time to time, these contract terms may be extended through contract modifications or amendments, which may result in revisions to future billing and cost estimates.
Revenue recognition on long-term product services agreements requires estimates of both customer payments and the costs to perform required maintenance services over the contract term. We recognize revenue on an overtime basis using input method to measure our progress toward completion at the estimated margin rate of the contract.
To develop our billings estimates, we consider the number of billable events that will occur based on estimated utilization of the asset under contract, over the life of the contract term. This estimated utilization will consider both historical and market conditions, asset retirements and new product introductions, if applicable.
To develop our cost estimates, we consider the timing and extent of maintenance and overhaul events, including the amount and cost of labor, spare parts and other resources required to perform the services. In developing our cost estimates, we utilize a combination of our historical cost experience and expected cost improvements. Cost improvements are only included in future cost estimates after savings have been observed in actual results or proven effective through an extensive regulatory or engineering approval process.
We routinely review the estimates used in our product services agreements and regularly revise them to adjust for changes. These revisions are based on objectively verifiable information that is available at the time of the review.
The difference between the timing of our revenue recognition and cash received from our customers results in either a contract asset (revenue in excess of billings) or a contract liability (billings in excess of revenue). See "Note 8. Contract and other deferred assets" and "Note 9. Progress collections and deferred income" of the Notes to Consolidated and Combined Financial Statements in Item 8 herein for further information.
We regularly assess customer credit risk inherent in the carrying amounts of receivables and contract assets and estimated earnings, including the risk that contractual penalties may not be sufficient to offset our accumulated investment in the event of customer termination. We gain insight into expected future utilization and cost trends, as well as credit risk, through our knowledge of the equipment installed and the close interaction with our customers through supplying critical services and parts over extended periods. Revisions to cost or billing estimates may affect a product services agreement’s total estimated profitability resulting in an adjustment of earnings; such adjustments generated earnings of $26 million, $44 million and $113 million for the three years ended December 31, 2018, 2017 and 2016, respectively. We provide for probable losses when they become evident.
On December 31, 2018, our long-term product service agreements, net of related billings in excess of revenues, of $0.4 billion, represent approximately 4.3% of our total estimated life of contract billings of $10.3 billion. Cash billings collected on these contracts were approximately $0.6 billion and $0.5 billion during the years ended December 31, 2018 and 2017, respectively. Our contracts (on average) are approximately 16% complete based on costs incurred to date and our estimate of future costs. Revisions to our estimates of future revenue or costs that increase or decrease total estimated contract profitability by 1% would increase or decrease the long-term product service agreements balance by $0.04 billion.
Goodwill and Other Identified Intangible Assets
We test goodwill for impairment annually using data as of July 1 of that year. The impairment test consists of two different steps: in step one, the carrying value of the reporting unit is compared with its fair value, in step two, which is applied only when the carrying value is more than its fair value, the amount of goodwill impairment, if any, is derived by deducting the fair value of the reporting unit’s assets and liabilities from the fair value of its equity and comparing that amount with the carrying amount of goodwill. We determine fair values of each of the reporting units using the market approach, when available and appropriate, or the income approach, or a combination of both. We
44 | BHGE 2018 FORM 10-K
assess the valuation methodology based upon the relevance and availability of the data at the time the valuation is performed.
Pension Assumptions
Pension benefits are calculated using significant inputs to the actuarial models that measure pension benefit obligations and related effects on operations. Two assumptions, discount rate and expected return on assets, are important elements of plan expense and asset/liability measurement. We evaluate these critical assumptions at least annually on a plan and country specific basis. We periodically evaluate other assumptions involving demographic factors such as retirement age, mortality and turnover, and update them to reflect its experience and expectations for the future. Actual results in any given year will often differ from actuarial assumptions because of economic and other factors.
Projected benefit obligations are measured as the present value of expected payments discounted using the weighted average of market observed yields for high quality fixed income securities with maturities that correspond to the payment of benefits, lower discount rates increase present values and subsequent year pension expense and higher discount rates decrease present values and subsequent year pension expense. The discount rates used to determine the benefit obligations for our principal pension plans at December 31, 2018, 2017 and 2016 were 3.43%, 2.99% and 3.41%, respectively, reflecting market interest rates. Our expected return on assets at December 31, 2018, 2017 and 2016 was 5.94%, 6.26% and 6.86%, respectively.
Income Taxes
We operate in more than 120 countries and our effective tax rate is based on our income, statutory tax rates and differences between tax laws and the GAAP in these various jurisdictions. Tax laws are complex and subject to different interpretations by the taxpayer and respective governmental taxing authorities. Our income tax rate is significantly affected by the tax rate on our global operations. In addition to local country tax laws and regulations, this rate depends on the extent earnings are indefinitely reinvested outside the U.S. Historically, U.S. taxes were due upon repatriation of foreign earnings. Due to the enactment of U.S. tax reform, repatriations of foreign earnings will generally be free of U.S. federal tax but may incur other taxes such as withholding or state taxes. Indefinite reinvestment is determined by management’s judgment about and intentions concerning the future operations of the Company. Most of these earnings have been reinvested in active non-U.S. business operations. However, as a result of U.S. tax reform, substantially all of our prior unrepatriated foreign earnings were subject to U.S. tax and accordingly we expect to have the ability to repatriate those earnings without incremental U.S. federal tax. As a result of U.S. tax reform, we changed our intent regarding certain cash repatriations and have accrued an additional $9 million of foreign withholding taxes. As of December 31, 2018, the cumulative amount of indefinitely reinvested foreign earnings is approximately $6.3 billion. Computation of the potential deferred tax liability associated with these undistributed earnings and any other basis differences is not practicable.
Deferred income tax assets represent amounts available to reduce income taxes payable in future years. We evaluate the recoverability of these future tax deductions and credits by assessing the adequacy of future taxable income from all sources, including reversal of taxable temporary differences, forecasted operating earnings and available tax planning strategies. These sources of income rely heavily on estimates. We use our historical experience and short and long range business forecasts to provide insight. We record a valuation allowance when it is more likely than not that some portion or all of the deferred tax assets will not be realized.
On December 22, 2017, the U.S. enacted the Tax Cuts and Jobs Act (U.S. tax reform) that lowers the statutory tax rate on U.S. earnings, taxes historic foreign earnings previously deferred from U.S. taxation at a reduced rate of tax (transition tax), establishes a territorial tax system and enacts new taxes associated with global operations.
The impact of U.S. tax reform was initially recorded on a provisional basis as the legislation provided for additional guidance to be issued by the U.S. Department of the Treasury on several provisions, including the computation of the transition tax. Based on guidance received to date, finalization of purchase accounting for the Baker Hughes acquisition and finalization of our 2017 U.S. income tax returns, we have recorded a $107 million tax benefit in 2018 for the impact of tax reform primarily related to the revaluation of deferred taxes.
BHGE 2018 FORM 10-K | 45
Additionally, as part of U.S. tax reform, the U.S. has enacted a tax on "base eroding" payments from the U.S. and a minimum tax on foreign earnings (global intangible low-taxed income). We have made an accounting policy election to account for these taxes as period costs.
Our tax filings routinely are subject to audit by the tax authorities in the jurisdictions where we conduct business. These audits may result in assessments of additional taxes that are resolved with the tax authorities or through the courts. We have provided for the amounts we believe will ultimately result from these proceedings, but settlements of issues raised in these audits may affect our tax rate. We have $472 million of gross unrecognized tax benefits, excluding interest and penalties, at December 31, 2018. We are not able to reasonably estimate in which future periods these amounts ultimately will be settled.
Other Loss Contingencies
Other loss contingencies are uncertain and unresolved matters that arise in the ordinary course of business and result from events or actions by others that have the potential to result in a future loss. Such contingencies include, but are not limited to, environmental obligations, litigation, regulatory proceedings, product quality and losses resulting from other events and developments.
The preparation of our consolidated and combined financial statements requires us to make estimates and judgments that affect the reported amounts of assets, liabilities, revenue and expenses and related disclosures as well as disclosures about any contingent assets and liabilities. We base these estimates and judgments on historical experience and other assumptions and information that are believed to be reasonable under the circumstances. Estimates and assumptions about future events and their effects are subject to uncertainty and, accordingly, these estimates may change as new events occur, as more experience is acquired, as additional information is obtained and as the business environment in which we operate changes.
Allowance for Doubtful Accounts
The determination of the collectability of amounts due from our customers requires us to make judgments and estimates regarding our customers' ability to pay amounts due us in order to determine the amount of valuation allowances required for doubtful accounts. We monitor our customers' payment history and current credit worthiness to determine that collectability is reasonably assured. We also consider the overall business climate in which our customers operate. Provisions for doubtful accounts are recorded based on the aging status of the customer accounts or when it becomes evident that the customer will not make the required payments at either contractual due dates or in the future. At December 31, 2018 and 2017, the allowance for doubtful accounts totaled $327 million and $330 million of total gross accounts receivable, respectively. We believe that our allowance for doubtful accounts is adequate to cover potential bad debt losses under current conditions, however, uncertainties regarding changes in the financial condition of our customers, either adverse or positive, could impact the amount and timing of any additional provisions for doubtful accounts that may be required.
Inventory Reserves
Inventory is a significant component of current assets and is stated at the lower of cost or net realizable value. This requires us to record provisions and maintain reserves for excess, slow moving and obsolete inventory. To determine these reserve amounts, we regularly review inventory quantities on hand and compare them to estimates of future product demand, market conditions, production requirements and technological developments. These estimates and forecasts inherently include uncertainties and require us to make judgments regarding potential future outcomes. At December 31, 2018 and 2017, inventory reserves totaled $430 million and $360 million of gross inventory, respectively. We believe that our reserves are adequate to properly value potential excess, slow moving and obsolete inventory under current conditions. Significant or unanticipated changes to our estimates and forecasts could impact the amount and timing of any additional provisions for excess, slow moving or obsolete inventory that may be required.
46 | BHGE 2018 FORM 10-K
Acquisitions-Purchase Price Allocation
We allocate the purchase price of an acquired business to its identifiable assets and liabilities based on estimated fair values. The excess of the purchase price over the amount allocated to the assets and liabilities, if any, is recorded as goodwill. We use all available information to estimate fair values, including quoted market prices, the carrying value of acquired assets and widely accepted valuation techniques such as discounted cash flows. We engage third-party appraisal firms to assist in fair value determination of inventories, identifiable intangible assets and any other significant assets or liabilities when appropriate. The judgments made in determining the estimated fair value assigned to each class of assets acquired and liabilities assumed, as well as asset lives, can materially impact our results of operations.
NEW ACCOUNTING STANDARDS TO BE ADOPTED
See "Note 1. Summary of Significant Accounting Policies" of the Notes to Consolidated and Combined Financial Statements in Item 8 herein for further discussion of accounting standards to be adopted.
RELATED PARTY TRANSACTIONS
See "Note 18. Related Party Transactions" of the Notes to Consolidated and Combined Financial Statements in Item 8 herein for further discussion of related party transactions.
OTHER ITEMS
Brexit
In June 2016, UK voters approved the UK’s exit (Brexit) from the EU. The UK is currently negotiating the terms of its exit from the EU scheduled for March 29, 2019. There remains significant uncertainty as to whether the withdrawal agreement between the UK government and the EU will be approved, when, if and on what terms Brexit will happen. There is a range of outcomes possible, from no Brexit to an abrupt cut-off of the UK’s future trading relationship with the EU. The above withdrawal agreement contemplates a transition period from March 2019 through December 2020 to allow time for a future trade deal to be agreed.
Although our customer base is global with predominant exposure to the U.S. dollar, we have a manufacturing and service base in the UK with some euro procurement, thus we are exposed to fluctuations in value of the British pound versus the U.S. dollar, euro and other currencies. We have a hedging program which looks to accommodate this potential volatility.
Iran Threat Reduction And Syria Human Rights Act Of 2012
The Company is making the following disclosure pursuant to Section 13(r) of the Securities Exchange Act of 1934. Under Section 13(r) of the Securities Exchange Act of 1934, enacted in 2012, we are required to disclose in our periodic reports if we or any of our affiliates knowingly engaged in business activities relating to Iran, even if those activities are conducted in accordance with authorizations subsequently issued by the U.S. Government. Reportable activities include investments that significantly enhance Iran’s ability to develop petroleum resources valued at $20 million or more in the aggregate during a twelve-month period. Reporting is also required for transactions related to Iran’s domestic production of refined petroleum products or Iran’s ability to import refined petroleum products valued at $5 million or more in the aggregate during a twelve-month period.
In January 2016, the U.S. Department of Treasury’s Office of Foreign Assets Control (OFAC) issued General License H authorizing U.S.-owned or controlled foreign entities to engage in transactions with Iran if these entities meet the requirements of the general license. On May 8, 2018, President Trump announced that the United States will cease participation in the Joint Comprehensive Plan of Action (JCPOA) and begin re-imposing the U.S. nuclear-related sanctions. On June 27, 2018, OFAC revoked General License H and added Section 560.537 to the Iranian Transactions and Sanctions Regulations (ITSR), which authorized all transactions and activities that are ordinarily incident and necessary to the winding down of activities previously approved under General License H through November 4, 2018. Prior to May 8, 2018, certain non-U.S. BHGE affiliates conducted limited activities, as described below, in accordance with General License H. As of November 5, 2018, non-U.S. BHGE affiliates have concluded
BHGE 2018 FORM 10-K | 47
all activity previously conducted under General License H in Iran. These activities were conducted in accordance with all applicable laws and regulations.
During the year ending December 31, 2018, but prior to the expiration of the wind down period for General License H, non-U.S. BHGE affiliates conducted the following reportable activities:
• A non-U.S. affiliate of BHGE received five purchase orders and attributed €31.4 million ($36.0 million) in gross revenues and €8.6 million ($9.9 million) in net profits related to the sale of valves and parts for industrial machinery and equipment used in gas plants, petrochemical plants and gas production projects in Iran.
• A second non-U.S. affiliate of BHGE received 12 purchase orders and attributed €0.1 million ($0.1 million) in gross revenues and less than €0.1 million ($0.1 million) in net profits to the sale of valves and other spare parts for use in the petrochemical industry in Iran.
• A third non-U.S. affiliate of BHGE attributed €0.3 million ($0.3 million) in gross revenues and €0.1 million ($0.1 million) in net profits to transactions involving the sale of films used in the inspection of pipelines in Iran.
These non-U.S. affiliates do not intend to continue the activities described above. The Company has ended all of these activities in full compliance with U.S. sanctions and at this time does not intend to seek specific U.S. Government authorization to collect revenues associated with previously reported projects.
For additional information on business activities related to Iran, please refer to the Other Items section within MD&A in our quarterly report on Form 10-Q for the quarter ended September 30, 2018.
FORWARD-LOOKING STATEMENTS
This Form 10-K, including MD&A and certain statements in the Notes to Consolidated and Combined Financial Statements, contains forward-looking statements within the meaning of Section 27A of the Securities Act of 1933, as amended, and Section 21E of the Exchange Act of 1934, as amended, (each a "forward-looking statement"). Forward-looking statements concern future circumstances and results and other statements that are not historical facts and are sometimes identified by the words "may," "will," "should," "potential," "intend," "expect," "endeavor," "seek," "anticipate," "estimate," "overestimate," "underestimate," "believe," "could," "project," "predict," "continue," "target" or other similar words or expressions. Forward-looking statements are based upon current plans, estimates and expectations that are subject to risks, uncertainties and assumptions. Should one or more of these risks or uncertainties materialize, or should underlying assumptions prove incorrect, actual results may vary materially from those indicated or anticipated by such forward-looking statements. The inclusion of such statements should not be regarded as a representation that such plans, estimates or expectations will be achieved. Important factors that could cause actual results to differ materially from such plans, estimates or expectations include, among others, the risk factors in the "Risk Factors" section of Part 1 of Item 1A of this Form 10-K and those set forth from time-to-time in other filings by the Company with the SEC. These documents are available through our website or through the SEC's Electronic Data Gathering and Analysis Retrieval (EDGAR) system at http://www.sec.gov.
In light of such risks and uncertainties, we caution you not to place undue reliance on these forward-looking statements. These forward-looking statements speak only as of the date of this annual report, or if earlier, as of the date they were made. We do not intend to, and disclaim any obligation to, update or revise any forward-looking statements unless required by securities law.
ITEM 7A. QUANTITATIVE AND QUALITATIVE DISCLOSURES ABOUT MARKET RISK
We are exposed to certain market risks that are inherent in our financial instruments and arise from changes in interest rates and foreign currency exchange rates. We may enter into derivative financial instrument transactions to manage or reduce market risk but do not enter into derivative financial instrument transactions for speculative purposes. A discussion of our primary market risk exposure in financial instruments is presented below.
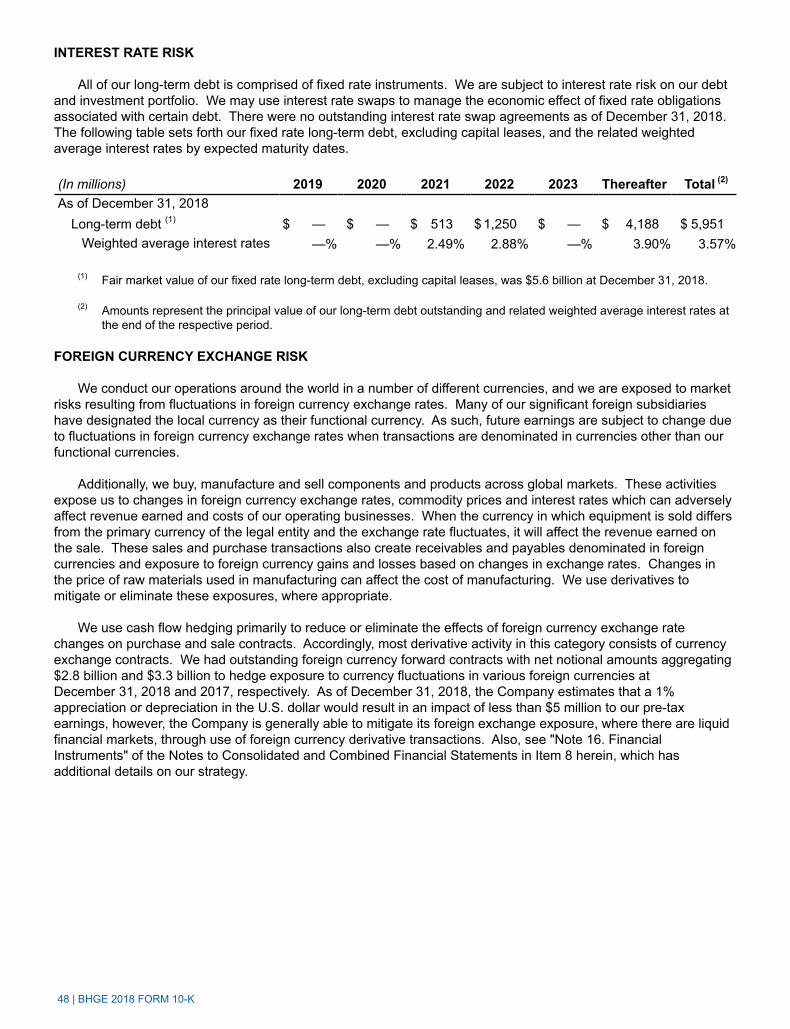
48 | BHGE 2018 FORM 10-K
INTEREST RATE RISK
All of our long-term debt is comprised of fixed rate instruments. We are subject to interest rate risk on our debt and investment portfolio. We may use interest rate swaps to manage the economic effect of fixed rate obligations associated with certain debt. There were no outstanding interest rate swap agreements as of December 31, 2018. The following table sets forth our fixed rate long-term debt, excluding capital leases, and the related weighted average interest rates by expected maturity dates.
(In millions) 2019 2020 2021 2022 2023 Thereafter Total (2)
As of December 31, 2018Long-term debt (1) $ — $ — $ 513 $ 1,250 $ — $ 4,188 $ 5,951
Weighted average interest rates —% —% 2.49% 2.88% —% 3.90% 3.57%
(1) Fair market value of our fixed rate long-term debt, excluding capital leases, was $5.6 billion at December 31, 2018.
(2) Amounts represent the principal value of our long-term debt outstanding and related weighted average interest rates at the end of the respective period.
FOREIGN CURRENCY EXCHANGE RISK
We conduct our operations around the world in a number of different currencies, and we are exposed to market risks resulting from fluctuations in foreign currency exchange rates. Many of our significant foreign subsidiaries have designated the local currency as their functional currency. As such, future earnings are subject to change due to fluctuations in foreign currency exchange rates when transactions are denominated in currencies other than our functional currencies.
Additionally, we buy, manufacture and sell components and products across global markets. These activities expose us to changes in foreign currency exchange rates, commodity prices and interest rates which can adversely affect revenue earned and costs of our operating businesses. When the currency in which equipment is sold differs from the primary currency of the legal entity and the exchange rate fluctuates, it will affect the revenue earned on the sale. These sales and purchase transactions also create receivables and payables denominated in foreign currencies and exposure to foreign currency gains and losses based on changes in exchange rates. Changes in the price of raw materials used in manufacturing can affect the cost of manufacturing. We use derivatives to mitigate or eliminate these exposures, where appropriate.
We use cash flow hedging primarily to reduce or eliminate the effects of foreign currency exchange rate changes on purchase and sale contracts. Accordingly, most derivative activity in this category consists of currency exchange contracts. We had outstanding foreign currency forward contracts with net notional amounts aggregating $2.8 billion and $3.3 billion to hedge exposure to currency fluctuations in various foreign currencies at December 31, 2018 and 2017, respectively. As of December 31, 2018, the Company estimates that a 1% appreciation or depreciation in the U.S. dollar would result in an impact of less than $5 million to our pre-tax earnings, however, the Company is generally able to mitigate its foreign exchange exposure, where there are liquid financial markets, through use of foreign currency derivative transactions. Also, see "Note 16. Financial Instruments" of the Notes to Consolidated and Combined Financial Statements in Item 8 herein, which has additional details on our strategy.
BHGE 2018 FORM 10-K | 49
ITEM 8. FINANCIAL STATEMENTS AND SUPPLEMENTARY DATA
Management's Report on Internal Control Over Financial Reporting
Our management is responsible for establishing and maintaining adequate internal control over our financial reporting, as such term is defined in Exchange Act Rules 13a-15(f). Our internal control over financial reporting is a process designed to provide reasonable assurance regarding the reliability of financial reporting and the preparation of financial statements for external purposes in accordance with generally accepted accounting principles.
Under the supervision and with the participation of our management, including our principal executive officer and principal financial officer, we assessed the effectiveness of our internal control over financial reporting based on the 2013 framework in Internal Control - Integrated Framework issued by the Committee of Sponsoring Organizations of the Treadway Commission. Based on our assessment, our principal executive officer and principal financial officer concluded that our internal control over financial reporting was effective as of December 31, 2018. This conclusion is based on the recognition that there are inherent limitations in all systems of internal control. Because of the inherent limitations of internal control over financial reporting, including the possibility of collusion or improper management override of controls, material misstatements due to error or fraud may not be prevented or detected on a timely basis. Also, projections of any evaluation of effectiveness to future periods are subject to the risk that controls may become inadequate because of changes in conditions, or that the degree of compliance with the policies or procedures may deteriorate.
KPMG LLP, the Company's independent registered public accounting firm, has issued an attestation report on the effectiveness of the Company's internal control over financial reporting.
/s/ LORENZO SIMONELLILorenzo SimonelliChairman, President andChief Executive Officer
/s/ BRIAN WORRELLBrian WorrellChief Financial Officer
/s/ KURT CAMILLERIKurt CamilleriVice President, Controller and Chief Accounting Officer
Houston, TexasFebruary 19, 2019
50 | BHGE 2018 FORM 10-K
REPORT OF INDEPENDENT REGISTERED PUBLIC ACCOUNTING FIRM
To the Stockholders and Board of DirectorsBaker Hughes, a GE company:
Opinion on the Consolidated and Combined Financial Statements
We have audited the accompanying consolidated and combined statement of financial position of Baker Hughes, a GE company and subsidiaries (the "Company") as of December 31, 2018 and 2017, the related consolidated and combined statements of income (loss), comprehensive income (loss), changes in equity, and cash flows for each of the years in the two-year period ended December 31, 2018, and the related notes (collectively, the "consolidated and combined financial statements"). In our opinion, the consolidated and combined financial statements present fairly, in all material respects, the financial position of the Company as of December 31, 2018 and 2017, and the results of its operations and its cash flows for each of the years in the two-year period ended December 31, 2018, in conformity with U.S. generally accepted accounting principles.
We also have audited, in accordance with the standards of the Public Company Accounting Oversight Board (United States) ("PCAOB"), the Company’s internal control over financial reporting as of December 31, 2018, based on criteria established in Internal Control - Integrated Framework (2013) issued by the Committee of Sponsoring Organizations of the Treadway Commission, and our report dated February 19, 2019 expressed an unqualified opinion on the effectiveness of the Company’s internal control over financial reporting.
Change in Accounting Principle
As discussed in Note 1 to the consolidated and combined financial statements, the Company has changed its method of accounting for revenue recognition in 2018 due to the adoption of Accounting Standards Codification 606, Revenue from Contracts with Customers.
Basis for Opinion
These consolidated and combined financial statements are the responsibility of the Company’s management. Our responsibility is to express an opinion on these consolidated and combined financial statements based on our audits. We are a public accounting firm registered with the PCAOB and are required to be independent with respect to the Company in accordance with the U.S. federal securities laws and the applicable rules and regulations of the Securities and Exchange Commission and the PCAOB.
We conducted our audits in accordance with the standards of the PCAOB. Those standards require that we plan and perform the audit to obtain reasonable assurance about whether the consolidated and combined financial statements are free of material misstatement, whether due to error or fraud. Our audits included performing procedures to assess the risks of material misstatement of the consolidated and combined financial statements, whether due to error or fraud, and performing procedures that respond to those risks. Such procedures included examining, on a test basis, evidence regarding the amounts and disclosures in the consolidated and combined financial statements. Our audits also included evaluating the accounting principles used and significant estimates made by management, as well as evaluating the overall presentation of the consolidated and combined financial statements. We believe that our audits provide a reasonable basis for our opinion.
/s/ KPMG LLP
We have served as the Company’s auditor since 2017.
Houston, TexasFebruary 19, 2019
BHGE 2018 FORM 10-K | 51
REPORT OF INDEPENDENT REGISTERED PUBLIC ACCOUNTING FIRM
To the Stockholders and Board of Directors Baker Hughes, a GE Company:
We have audited the accompanying combined statements of income (loss), comprehensive income (loss), changes in equity, and cash flows of GE Oil & Gas (the "Company", a business within General Electric Company) for the year ended December 31, 2016. These combined financial statements are the responsibility of the Company’s management. Our responsibility is to express an opinion on these combined financial statements based on our audits.
We conducted our audit in accordance with the standards of the Public Company Accounting Oversight Board (United States) and in accordance with auditing standards generally accepted in the United States of America. Those standards require that we plan and perform the audit to obtain reasonable assurance about whether the financial statements are free of material misstatement. An audit includes examining, on a test basis, evidence supporting the amounts and disclosures in the financial statements. An audit also includes assessing the accounting principles used and significant estimates made by management, as well as evaluating the overall financial statement presentation. We believe that our audit provides a reasonable basis for our opinion.
In our opinion, the combined financial statements referred to above present fairly, in all material respects, the combined results of operations and cash flows for the Company for the year ended December 31, 2016, in conformity with U.S. generally accepted accounting principles.
Change in Accounting Principle
As discussed in Note 1 to the combined financial statements, the Company has changed its method of accounting for revenue recognition in 2018 due to the adoption of Accounting Standards Codification 606, Revenue from Contracts with Customers.
/s/ KPMG S.p.A. Florence, Italy March 16, 2017, except as to Note 17 which is as of December 4, 2017, and Note 1 which is as of November 13, 2018.

52 | BHGE 2018 FORM 10-K
REPORT OF THE INDEPENDENT REGISTERED PUBLIC ACCOUNTING FIRM
To the Stockholders and Board of DirectorsBaker Hughes, a GE company:
Opinion on Internal Control Over Financial Reporting
We have audited Baker Hughes, a GE company and subsidiaries’ (the "Company") internal control over financial reporting as of December 31, 2018, based on criteria established in Internal Control - Integrated Framework (2013) issued by the Committee of Sponsoring Organizations of the Treadway Commission. In our opinion, the Company maintained, in all material respects, effective internal control over financial reporting as of December 31, 2018, based on criteria established in Internal Control - Integrated Framework (2013) issued by the Committee of Sponsoring Organizations of the Treadway Commission.
We also have audited, in accordance with the standards of the Public Company Accounting Oversight Board (United States) ("PCAOB"), the consolidated and combined statement of financial position of the Company as of December 31, 2018 and 2017, the related consolidated and combined statements of income (loss), comprehensive income (loss), changes in equity, and cash flows for each of the years in the two-year period ended December 31, 2018, and the related notes (collectively, the "consolidated and combined financial statements"), and our report dated February 19, 2019, expressed an unqualified opinion on those consolidated and combined financial statements.
Basis for Opinion
The Company’s management is responsible for maintaining effective internal control over financial reporting and for its assessment of the effectiveness of internal control over financial reporting, included in the accompanying Management’s Report on Internal Control Over Financial Reporting. Our responsibility is to express an opinion on the Company’s internal control over financial reporting based on our audit. We are a public accounting firm registered with the PCAOB and are required to be independent with respect to the Company in accordance with the U.S. federal securities laws and the applicable rules and regulations of the Securities and Exchange Commission and the PCAOB.
We conducted our audit in accordance with the standards of the PCAOB. Those standards require that we plan and perform the audit to obtain reasonable assurance about whether effective internal control over financial reporting was maintained in all material respects. Our audit of internal control over financial reporting included obtaining an understanding of internal control over financial reporting, assessing the risk that a material weakness exists, and testing and evaluating the design and operating effectiveness of internal control based on the assessed risk. Our audit also included performing such other procedures as we considered necessary in the circumstances. We believe that our audit provides a reasonable basis for our opinion.
Definition and Limitations of Internal Control Over Financial Reporting
A company’s internal control over financial reporting is a process designed to provide reasonable assurance regarding the reliability of financial reporting and the preparation of financial statements for external purposes in accordance with generally accepted accounting principles. A company’s internal control over financial reporting includes those policies and procedures that (1) pertain to the maintenance of records that, in reasonable detail, accurately and fairly reflect the transactions and dispositions of the assets of the company; (2) provide reasonable assurance that transactions are recorded as necessary to permit preparation of financial statements in accordance with generally accepted accounting principles, and that receipts and expenditures of the company are being made only in accordance with authorizations of management and directors of the company; and (3) provide reasonable assurance regarding prevention or timely detection of unauthorized acquisition, use, or disposition of the company’s assets that could have a material effect on the financial statements.
Because of its inherent limitations, internal control over financial reporting may not prevent or detect misstatements. Also, projections of any evaluation of effectiveness to future periods are subject to the risk that controls may become inadequate because of changes in conditions, or that the degree of compliance with the policies or procedures may deteriorate.
/s/ KPMG LLPHouston, TexasFebruary 19, 2019
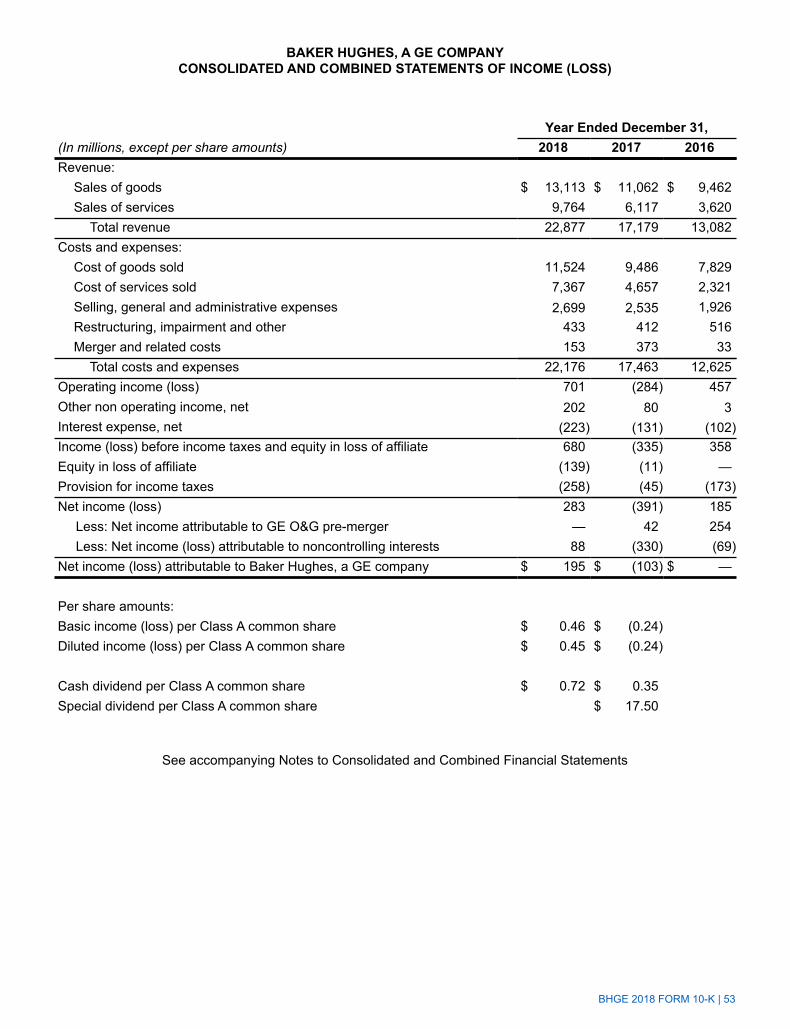
BHGE 2018 FORM 10-K | 53
BAKER HUGHES, A GE COMPANYCONSOLIDATED AND COMBINED STATEMENTS OF INCOME (LOSS)
Year Ended December 31,(In millions, except per share amounts) 2018 2017 2016Revenue:
Sales of goods $ 13,113 $ 11,062 $ 9,462Sales of services 9,764 6,117 3,620
Total revenue 22,877 17,179 13,082Costs and expenses:
Cost of goods sold 11,524 9,486 7,829Cost of services sold 7,367 4,657 2,321Selling, general and administrative expenses 2,699 2,535 1,926Restructuring, impairment and other 433 412 516Merger and related costs 153 373 33
Total costs and expenses 22,176 17,463 12,625Operating income (loss) 701 (284) 457Other non operating income, net 202 80 3Interest expense, net (223) (131) (102)Income (loss) before income taxes and equity in loss of affiliate 680 (335) 358Equity in loss of affiliate (139) (11) —Provision for income taxes (258) (45) (173)Net income (loss) 283 (391) 185
Less: Net income attributable to GE O&G pre-merger — 42 254Less: Net income (loss) attributable to noncontrolling interests 88 (330) (69)
Net income (loss) attributable to Baker Hughes, a GE company $ 195 $ (103) $ —
Per share amounts:Basic income (loss) per Class A common share $ 0.46 $ (0.24)Diluted income (loss) per Class A common share $ 0.45 $ (0.24)
Cash dividend per Class A common share $ 0.72 $ 0.35Special dividend per Class A common share $ 17.50
See accompanying Notes to Consolidated and Combined Financial Statements
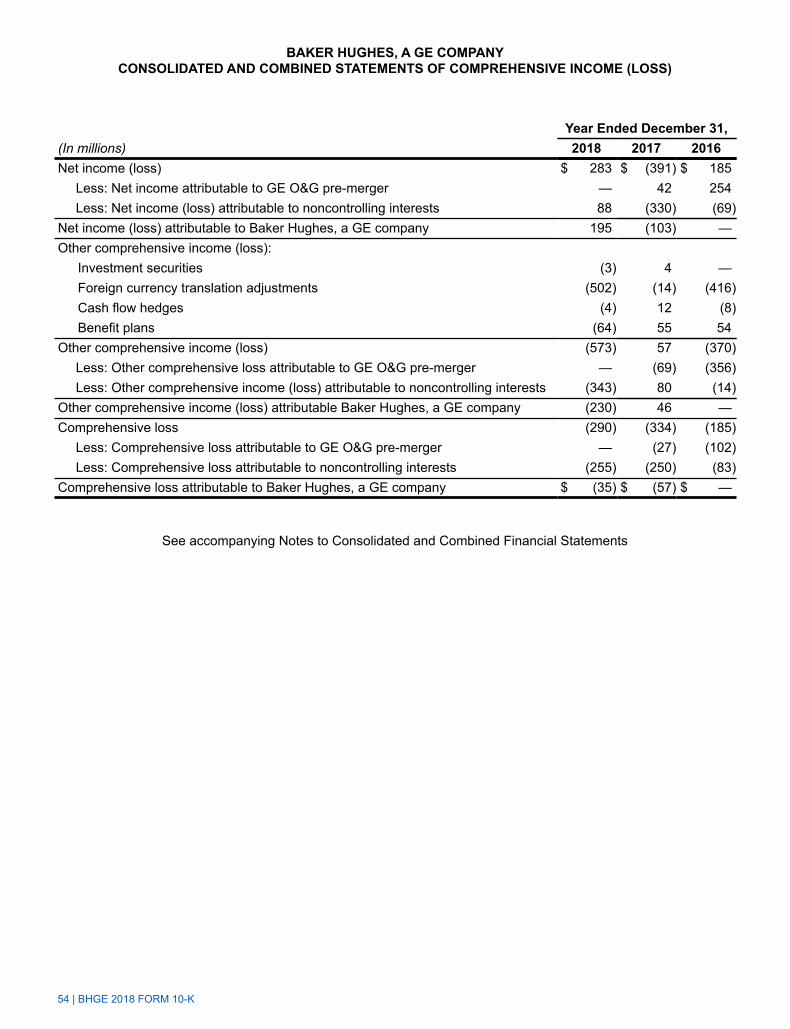
54 | BHGE 2018 FORM 10-K
BAKER HUGHES, A GE COMPANYCONSOLIDATED AND COMBINED STATEMENTS OF COMPREHENSIVE INCOME (LOSS)
Year Ended December 31,(In millions) 2018 2017 2016Net income (loss) $ 283 $ (391) $ 185
Less: Net income attributable to GE O&G pre-merger — 42 254Less: Net income (loss) attributable to noncontrolling interests 88 (330) (69)
Net income (loss) attributable to Baker Hughes, a GE company 195 (103) —Other comprehensive income (loss):
Investment securities (3) 4 —Foreign currency translation adjustments (502) (14) (416)Cash flow hedges (4) 12 (8)Benefit plans (64) 55 54
Other comprehensive income (loss) (573) 57 (370)Less: Other comprehensive loss attributable to GE O&G pre-merger — (69) (356)Less: Other comprehensive income (loss) attributable to noncontrolling interests (343) 80 (14)
Other comprehensive income (loss) attributable Baker Hughes, a GE company (230) 46 —Comprehensive loss (290) (334) (185)
Less: Comprehensive loss attributable to GE O&G pre-merger — (27) (102)Less: Comprehensive loss attributable to noncontrolling interests (255) (250) (83)
Comprehensive loss attributable to Baker Hughes, a GE company $ (35) $ (57) $ —
See accompanying Notes to Consolidated and Combined Financial Statements
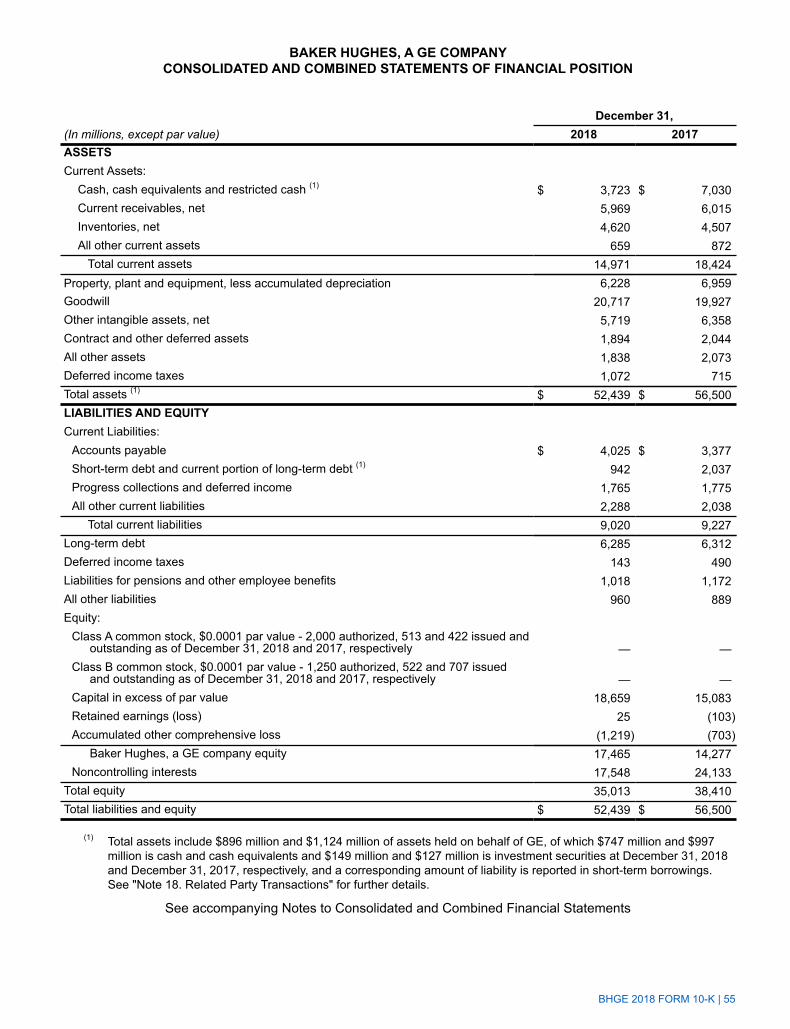
BHGE 2018 FORM 10-K | 55
BAKER HUGHES, A GE COMPANYCONSOLIDATED AND COMBINED STATEMENTS OF FINANCIAL POSITION
December 31,(In millions, except par value) 2018 2017ASSETSCurrent Assets:
Cash, cash equivalents and restricted cash (1) $ 3,723 $ 7,030Current receivables, net 5,969 6,015Inventories, net 4,620 4,507All other current assets 659 872
Total current assets 14,971 18,424Property, plant and equipment, less accumulated depreciation 6,228 6,959Goodwill 20,717 19,927Other intangible assets, net 5,719 6,358Contract and other deferred assets 1,894 2,044All other assets 1,838 2,073Deferred income taxes 1,072 715Total assets (1) $ 52,439 $ 56,500LIABILITIES AND EQUITYCurrent Liabilities:
Accounts payable $ 4,025 $ 3,377Short-term debt and current portion of long-term debt (1) 942 2,037Progress collections and deferred income 1,765 1,775All other current liabilities 2,288 2,038
Total current liabilities 9,020 9,227Long-term debt 6,285 6,312Deferred income taxes 143 490Liabilities for pensions and other employee benefits 1,018 1,172All other liabilities 960 889Equity:
Class A common stock, $0.0001 par value - 2,000 authorized, 513 and 422 issued andoutstanding as of December 31, 2018 and 2017, respectively — —
Class B common stock, $0.0001 par value - 1,250 authorized, 522 and 707 issuedand outstanding as of December 31, 2018 and 2017, respectively — —
Capital in excess of par value 18,659 15,083Retained earnings (loss) 25 (103)Accumulated other comprehensive loss (1,219) (703)
Baker Hughes, a GE company equity 17,465 14,277Noncontrolling interests 17,548 24,133
Total equity 35,013 38,410Total liabilities and equity $ 52,439 $ 56,500
(1) Total assets include $896 million and $1,124 million of assets held on behalf of GE, of which $747 million and $997 million is cash and cash equivalents and $149 million and $127 million is investment securities at December 31, 2018 and December 31, 2017, respectively, and a corresponding amount of liability is reported in short-term borrowings. See "Note 18. Related Party Transactions" for further details.
See accompanying Notes to Consolidated and Combined Financial Statements
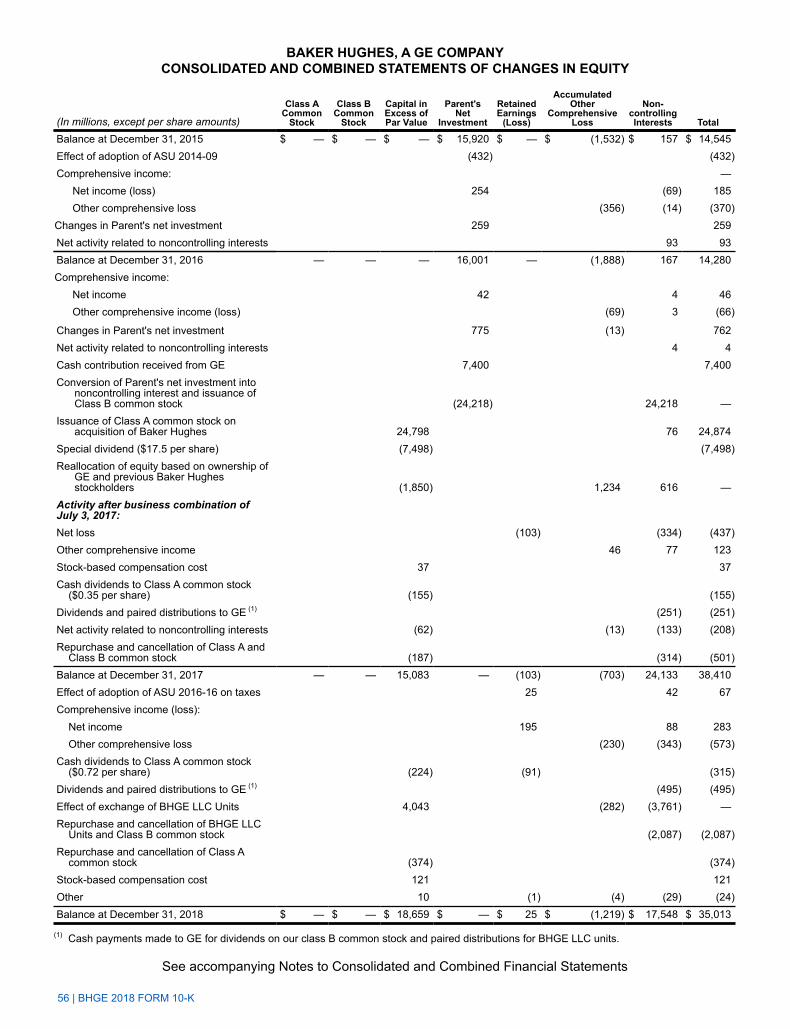
56 | BHGE 2018 FORM 10-K
BAKER HUGHES, A GE COMPANYCONSOLIDATED AND COMBINED STATEMENTS OF CHANGES IN EQUITY
(In millions, except per share amounts)
Class ACommon
Stock
Class BCommon
Stock
Capital inExcess ofPar Value
Parent'sNet
Investment
RetainedEarnings
(Loss)
AccumulatedOther
ComprehensiveLoss
Non-controllingInterests Total
Balance at December 31, 2015 $ — $ — $ — $ 15,920 $ — $ (1,532) $ 157 $ 14,545Effect of adoption of ASU 2014-09 (432) (432)Comprehensive income: —
Net income (loss) 254 (69) 185Other comprehensive loss (356) (14) (370)
Changes in Parent's net investment 259 259Net activity related to noncontrolling interests 93 93Balance at December 31, 2016 — — — 16,001 — (1,888) 167 14,280Comprehensive income:
Net income 42 4 46Other comprehensive income (loss) (69) 3 (66)
Changes in Parent's net investment 775 (13) 762Net activity related to noncontrolling interests 4 4Cash contribution received from GE 7,400 7,400Conversion of Parent's net investment into
noncontrolling interest and issuance ofClass B common stock (24,218) 24,218 —
Issuance of Class A common stock onacquisition of Baker Hughes 24,798 76 24,874
Special dividend ($17.5 per share) (7,498) (7,498)Reallocation of equity based on ownership of
GE and previous Baker Hughesstockholders (1,850) 1,234 616 —
Activity after business combination ofJuly 3, 2017:Net loss (103) (334) (437)Other comprehensive income 46 77 123Stock-based compensation cost 37 37Cash dividends to Class A common stock
($0.35 per share) (155) (155)Dividends and paired distributions to GE (1) (251) (251)Net activity related to noncontrolling interests (62) (13) (133) (208)Repurchase and cancellation of Class A and
Class B common stock (187) (314) (501)Balance at December 31, 2017 — — 15,083 — (103) (703) 24,133 38,410Effect of adoption of ASU 2016-16 on taxes 25 42 67Comprehensive income (loss):
Net income 195 88 283Other comprehensive loss (230) (343) (573)
Cash dividends to Class A common stock($0.72 per share) (224) (91) (315)
Dividends and paired distributions to GE (1) (495) (495)Effect of exchange of BHGE LLC Units 4,043 (282) (3,761) —Repurchase and cancellation of BHGE LLC
Units and Class B common stock (2,087) (2,087)Repurchase and cancellation of Class A
common stock (374) (374)Stock-based compensation cost 121 121Other 10 (1) (4) (29) (24)Balance at December 31, 2018 $ — $ — $ 18,659 $ — $ 25 $ (1,219) $ 17,548 $ 35,013
(1) Cash payments made to GE for dividends on our class B common stock and paired distributions for BHGE LLC units.
See accompanying Notes to Consolidated and Combined Financial Statements
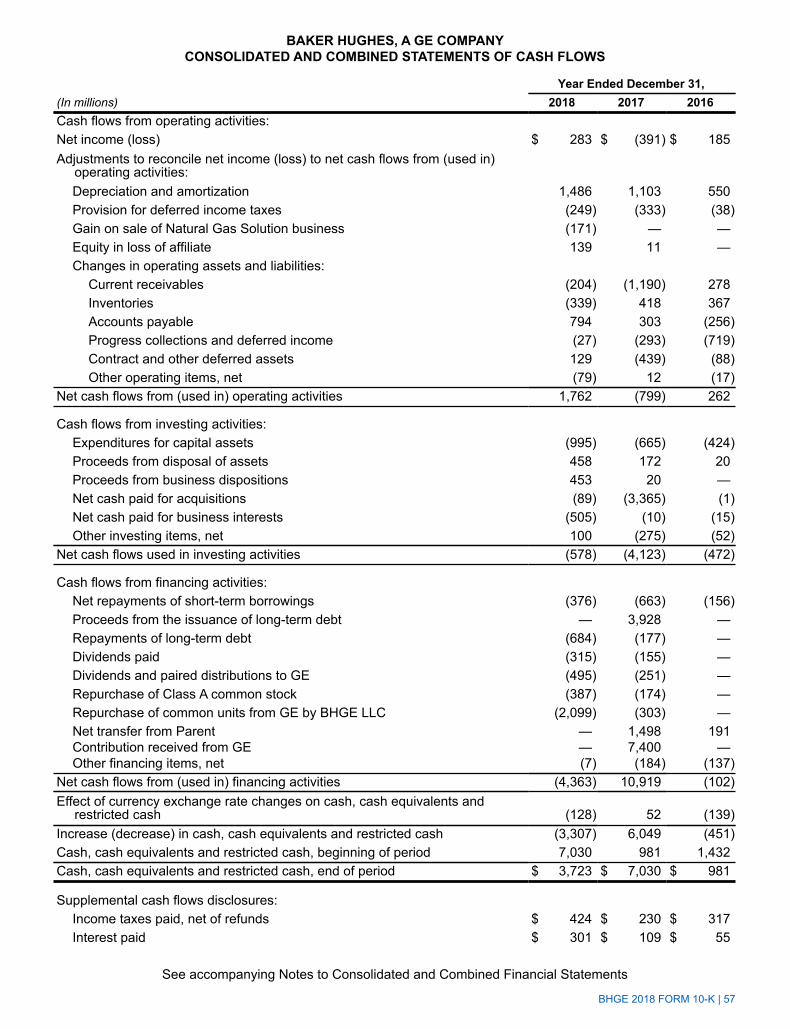
BHGE 2018 FORM 10-K | 57
BAKER HUGHES, A GE COMPANYCONSOLIDATED AND COMBINED STATEMENTS OF CASH FLOWS
Year Ended December 31,(In millions) 2018 2017 2016Cash flows from operating activities:Net income (loss) $ 283 $ (391) $ 185Adjustments to reconcile net income (loss) to net cash flows from (used in)
operating activities:Depreciation and amortization 1,486 1,103 550Provision for deferred income taxes (249) (333) (38)Gain on sale of Natural Gas Solution business (171) — —Equity in loss of affiliate 139 11 —Changes in operating assets and liabilities:
Current receivables (204) (1,190) 278Inventories (339) 418 367Accounts payable 794 303 (256)Progress collections and deferred income (27) (293) (719)Contract and other deferred assets 129 (439) (88)Other operating items, net (79) 12 (17)
Net cash flows from (used in) operating activities 1,762 (799) 262
Cash flows from investing activities:Expenditures for capital assets (995) (665) (424)Proceeds from disposal of assets 458 172 20Proceeds from business dispositions 453 20 —Net cash paid for acquisitions (89) (3,365) (1)Net cash paid for business interests (505) (10) (15)Other investing items, net 100 (275) (52)
Net cash flows used in investing activities (578) (4,123) (472)
Cash flows from financing activities:Net repayments of short-term borrowings (376) (663) (156)Proceeds from the issuance of long-term debt — 3,928 —Repayments of long-term debt (684) (177) —Dividends paid (315) (155) —Dividends and paired distributions to GE (495) (251) —Repurchase of Class A common stock (387) (174) —Repurchase of common units from GE by BHGE LLC (2,099) (303) —Net transfer from Parent — 1,498 191Contribution received from GE — 7,400 —Other financing items, net (7) (184) (137)
Net cash flows from (used in) financing activities (4,363) 10,919 (102)Effect of currency exchange rate changes on cash, cash equivalents and
restricted cash (128) 52 (139)Increase (decrease) in cash, cash equivalents and restricted cash (3,307) 6,049 (451)Cash, cash equivalents and restricted cash, beginning of period 7,030 981 1,432Cash, cash equivalents and restricted cash, end of period $ 3,723 $ 7,030 $ 981
Supplemental cash flows disclosures:Income taxes paid, net of refunds $ 424 $ 230 $ 317Interest paid $ 301 $ 109 $ 55
See accompanying Notes to Consolidated and Combined Financial Statements
Baker Hughes, a GE companyNotes to Consolidated and Combined Financial Statements
58 | BHGE 2018 FORM 10-K
NOTE 1. BASIS OF PRESENTATION AND SUMMARY OF SIGNIFICANT ACCOUNTING POLICIES
DESCRIPTION OF THE BUSINESS
Baker Hughes, a GE company (the Company, BHGE, we, us, or our), was formed on October 28, 2016, for the purpose of facilitating the combination of Baker Hughes and GE O&G. BHGE is a world-leading, fullstream oilfield technology provider that has a unique mix of equipment and service capabilities. We conduct business in more than 120 countries and employ approximately 66,000 employees.
BASIS OF PRESENTATION
On July 3, 2017, we closed the business combination (the Transactions) of GE O&G and Baker Hughes (refer to "Note 3. Business Acquisition and Disposition" for further details on the Transactions). As a result, substantially all of the business of GE O&G and of Baker Hughes were transferred to a subsidiary of the Company, Baker Hughes, a GE company, LLC (BHGE LLC). As of December 31, 2018, GE has approximately 50.4% of economic interest in BHGE LLC and the Company has approximately 49.6% of the economic interest in BHGE LLC. Although we hold a minority economic interest in BHGE LLC, we conduct and exercise full control over all its activities, therefore, we consolidate the financial results of BHGE LLC and report a noncontrolling interest in our consolidated and combined financial statements for the economic interest in BHGE LLC not held by us. We consider BHGE LLC to be a consolidated variable interest entity (VIE). We are a holding company and have no material assets other than our ownership interest in BHGE LLC and certain intercompany and tax related balances. BHGE LLC is a Securities and Exchange Commission (SEC) Registrant with separate filing requirements with the SEC and its separate financial information can be obtained from www.sec.gov. The current year results, and balances, may not be comparable to prior years as the prior years include the results of Baker Hughes from July 3, 2017 forward.
The accompanying consolidated and combined financial statements of the Company have been prepared in accordance with accounting principles generally accepted in the United States of America (U.S. and such principles, U.S. GAAP) and pursuant to the rules and regulations of the SEC for annual financial information. All intercompany accounts and transactions have been eliminated.
The Company's financial statements have been prepared on a consolidated basis, effective July 3, 2017. Under this basis of presentation, our financial statements consolidate all of our subsidiaries (entities in which we have a controlling financial interest, most often because we hold a majority voting interest). All subsequent periods will also be presented on a consolidated basis. For all periods prior to July 3, 2017, the Company's financial statements were prepared on a combined basis. The combined financial statements combine certain accounts of GE and its subsidiaries that were historically managed as part of its oil & gas business and contributed to BHGE LLC as part of the Transactions. Additionally, it also includes certain assets, liabilities and results of operations of other businesses of GE that were also contributed to BHGE LLC as part of the Transactions on a fully retrospective basis (in accordance with the guidance applicable to transactions between entities under common control) based on their carrying values, as reflected in the accounting records of GE. The consolidated and combined statements of income reflect intercompany expense allocations made to us by GE for certain corporate functions and for shared services provided by GE. Where possible, these allocations were made on a specific identification basis, and in other cases, these expenses were allocated by GE based on relative percentages of net operating costs or some other basis depending on the nature of the allocated cost. See "Note 18. Related Party Transactions" for further information on expenses allocated by GE. The historical financial results in the consolidated and combined financial statements presented may not be indicative of the results that would have been achieved had GE O&G operated as a separate, stand-alone entity during those periods.
Merger and related costs includes all costs associated with the Transactions described in Note 3. Refer to "Note 3. Business Acquisition and Disposition" for further details. In 2018, merger and related costs also include costs incurred in connection with the finalization of the Master Agreement Framework and costs related to the anticipated separation from GE. See "Note 18. Related Party Transactions" for further information on the Master Agreement Framework.
In the Company's financial statements and notes, certain amounts have been reclassified to conform with the current year presentation. In the notes to the consolidated and combined financial statements, all dollar and share
Baker Hughes, a GE companyNotes to Consolidated and Combined Financial Statements
BHGE 2018 FORM 10-K | 59
amounts in tabulations are in millions of dollars and shares, respectively, unless otherwise indicated. Certain columns and rows in our financial statements and notes thereto may not add due to the use of rounded numbers.
SUMMARY OF SIGNIFICANT ACCOUNTING POLICIES
Use of Estimates
The preparation of financial statements in conformity with U.S. GAAP requires management to make estimates and judgments that affect the reported amounts of assets and liabilities, disclosure of any contingent assets or liabilities at the date of the financial statements and the reported amounts of revenue and expenses during the reporting period. We base our estimates and judgments on historical experience and on various other assumptions and information that we believe to be reasonable under the circumstances. Estimates and assumptions about future events and their effects cannot be perceived with certainty, and accordingly, these estimates may change as new events occur, as more experience is acquired, as additional information is obtained and as our operating environment changes. While we believe that the estimates and assumptions used in the preparation of the consolidated and combined financial statements are appropriate, actual results could differ from those estimates. Estimates are used for, but are not limited to, determining the following: allowance for doubtful accounts and inventory valuation reserves; recoverability of long-lived assets, including revenue recognition on long-term contracts, valuation of goodwill; useful lives used in depreciation and amortization; income taxes and related valuation allowances; accruals for contingencies; actuarial assumptions to determine costs and liabilities related to employee benefit plans; stock-based compensation expense; valuation of derivatives and the fair value of assets acquired and liabilities assumed in acquisitions; and expense allocations for certain corporate functions and shared services provided by GE.
Foreign Currency
Assets and liabilities of non-U.S. operations with a functional currency other than the U.S. dollar have been translated into U.S. dollars at the quarterly exchange rates, and revenue, expenses, and cash flows have been translated at average rates for the respective periods. Any resulting translation gains and losses are included in other comprehensive income (loss).
Gains and losses from foreign currency transactions, such as those resulting from the settlement of receivables or payables in the non-functional currency and those resulting from remeasurements of monetary items, are included in the consolidated and combined statement of income (loss).
Investments in Equity Securities
Investments in equity securities (of entities in which we do not have a controlling financial interest, most often because we hold a voting interest of 0% to 20%) with readily determinable fair values are measured at fair value with changes in fair value recognized in earnings and reported in the "other non operating income, net" caption in the consolidated and combined statements of income (loss). Equity securities that do not have readily determinable fair values are recorded at cost minus impairment, if any, plus or minus changes resulting from observable price changes in orderly transactions for identical or similar equity securities of the same issuer. We perform a qualitative impairment assessment for equity securities without readily determinable fair values. When a qualitative assessment indicates that impairment exists, that equity security is impaired to fair value.
Associated companies are entities in which we do not have a controlling financial interest, but over which we have significant influence, most often because we hold a voting interest of 20% to 50%. Associated companies are accounted for as equity method investments. Results of associated companies are presented on a one-line basis in the caption "Equity in loss of affiliate" in our consolidated and combined statements of income (loss). Investments in, and advances to, associated companies are presented on a one-line basis in the caption "All other assets" in our consolidated and combined statement of financial position.
60 | BHGE 2018 FORM 10-K
Revenue from Sale of Equipment
Performance Obligations Satisfied Over Time
We recognize revenue on agreements for sales of goods manufactured to unique customer specifications, including long-term construction projects, on an over-time basis utilizing cost inputs as the measurement criteria in assessing the progress toward completion. Our estimate of costs to be incurred to fulfill our promise to a customer is based on our history of manufacturing or constructing similar assets for customers and is updated routinely to reflect changes in quantity or pricing of the inputs. We begin to recognize revenue on these contracts when the contract specific inventory becomes customized for a customer, which is reflective of our initial transfer of control of the incurred costs. We provide for potential losses on any of these agreements when it is probable that we will incur the loss.
Our billing terms for these over-time contracts vary, but are generally based on achieving specified milestones. The differences between the timing of our revenue recognized (based on costs incurred) and customer billings (based on contractual terms) results in changes to our contract asset or contract liability positions.
Performance Obligations Satisfied at a Point In Time
We recognize revenue for non-customized equipment at the point in time that the customer obtains control of the good, which is no earlier than when the customer has physical possession of the product. Equipment for which we recognize revenue at a point in time include goods we manufacture on a standardized basis for sale to the market. We use proof of delivery for certain large equipment with more complex logistics associated with the shipment, whereas the delivery of other equipment is determined based on historical data of transit times between regions.
On occasion we sell products with a right of return. We use our accumulated experience to estimate and provide for such returns when we record the sale. In situations where arrangements include customer acceptance provisions based on seller or customer-specified objective criteria, we recognize revenue when we have concluded that the customer has control of the goods and that acceptance is likely to occur.
Our billing terms for these point in time equipment contracts vary, but are generally based on shipment of the goods to the customer.
Revenue from Sale of Services
Performance Obligations Satisfied Over Time
Revenue on Oilfield Services is recognized on an overtime basis as performed. We also sell product services under long-term product maintenance or extended warranty agreements in our Turbomachinery & Process Solutions and Oilfield Equipment segments. These agreements require us to maintain the customers' assets over the service agreement contract terms, which generally range from 10 to 20 years. In general, these are contractual arrangements to provide services, repairs, and maintenance of a covered unit (gas turbines for mechanical drive or power generation, primarily on LNG applications, drilling rigs). These services are performed at various times during the life of the contract, thus the costs of performing services are incurred on other than a straight-line basis. We recognize related sales based on the extent of our progress toward completion measured by actual costs incurred in relation to total expected costs. We provide for any loss that we expect to incur on any of these agreements when that loss is probable. BHGE utilizes historical customer data, prior product performance data, statistical analysis, third-party data, and internal management estimates to calculate contract-specific margins. In certain contracts, the total transaction price is variable based on customer utilization, which is excluded from the contract margin until the period that the customer has utilized to appropriately reflect the revenue activity in the period earned.
Our billing terms for these contracts are generally based on asset utilization (i.e. usage per hour) or the occurrence of a major maintenance event within the contract. The differences between the timing of our revenue
Baker Hughes, a GE companyNotes to Consolidated and Combined Financial Statements
BHGE 2018 FORM 10-K | 61
recognized (based on costs incurred) and customer billings (based on contractual terms) results in changes to our contract asset or contract liability positions.
Performance Obligations Satisfied at a Point In Time
We sell certain tangible products, largely spare equipment, through our services business. We recognize revenues for this equipment at the point in time that the customer obtains control of the good, which is at the point in time we deliver the spare part to the customer. Our billing terms for these point in time service contracts vary, but are generally based on shipment of the goods to the customer.
Research and Development
Research and development costs are expensed as incurred and relate to the research and development of new products and services. These costs amounted to $700 million, $501 million and $352 million for the years ended December 31, 2018, 2017 and 2016, respectively. Research and development expenses were reported in cost of goods sold and cost of services sold.
Cash, Cash Equivalents and Restricted Cash
Short-term investments with original maturities of three months or less are included in cash equivalents unless designated as available-for-sale and classified as investment securities.
As of December 31, 2018 and December 31, 2017, we had $1,208 million and $1,190 million, respectively, of cash held in bank accounts that cannot be released, transferred or otherwise converted into a currency that is regularly transacted internationally, due to lack of market liquidity, capital controls or similar monetary or exchange limitations limiting the flow of capital out of the jurisdiction. These funds are available to fund operations and growth in these jurisdictions and we do not currently anticipate a need to transfer these funds to the U.S. Included in these amounts are $461 million and $764 million, as of December 31, 2018 and December 31, 2017, respectively, held on behalf of GE.
Cash, cash equivalents and restricted cash includes a total of $747 million and $997 million of cash at December 31, 2018 and December 31, 2017, respectively, held on behalf of GE, and a corresponding liability is reported in short-term borrowings. See "Note 18. Related Party Transactions" for further details.
As a result of adopting FASB ASU No. 2016-18, Statement of Cash Flows: Restricted Cash, we reclassified our restricted cash of $7 million from all other assets to cash, cash equivalents and restricted cash as of December 31, 2017.
Allowance for Doubtful Accounts
We establish an allowance for doubtful accounts based on various factors including the payment history and financial condition of our debtors and the economic environment. Provisions for doubtful accounts are recorded based on the aging status of the debtor accounts or when it becomes evident that the debtor will not make the required payments at either contractual due dates or in the future.
Concentration of Credit Risk
We grant credit to our customers who primarily operate in the oil and natural gas industry. Although this concentration affects our overall exposure to credit risk, our current receivables are spread over a diverse group of customers across many countries, which mitigates this risk. We perform periodic credit evaluations of our customers' financial conditions, including monitoring our customers' payment history and current credit worthiness to manage this risk. We do not generally require collateral in support of our current receivables, but we may require payment in advance or security in the form of a letter of credit or a bank guarantee.
Baker Hughes, a GE companyNotes to Consolidated and Combined Financial Statements
62 | BHGE 2018 FORM 10-K
Inventories
All inventories are stated at the lower of cost or net realizable values and they are measured on a first-in, first-out (FIFO) basis or average cost basis. As necessary, we record provisions and maintain reserves for excess, slow moving and obsolete inventory. To determine these reserve amounts, we regularly review inventory quantities on hand and compare them to estimates of future product demand, market conditions, production requirements and technological developments.
Property, Plant and Equipment (PP&E)
Property, plant and equipment is initially stated at cost and is depreciated over its estimated economic life. Subsequently, property, plant and equipment is measured at cost less accumulated depreciation and impairment losses. We manufacture a substantial portion of our tools and equipment and the cost of these items, which includes direct and indirect manufacturing costs, is capitalized and carried in inventory until it is completed.
Other Intangible Assets
We amortize the cost of other intangible assets over their estimated useful lives unless such lives are deemed indefinite. The cost of intangible assets is generally amortized on a straight-line basis over the asset's estimated economic life. Amortizable intangible assets are reviewed for impairment whenever events or changes in circumstances indicate that the related carrying amounts may not be recoverable. In these circumstances, they are tested for impairment based on undiscounted cash flows and, if impaired, written down to fair value based on either discounted cash flows or appraised values. Intangible assets with indefinite lives are tested annually for impairment and written down to fair value as required. Refer to the Impairment of Goodwill and Other Long-Lived Assets accounting policy.
Impairment of Goodwill and Other Long-lived Assets
We perform an annual impairment test of goodwill on a qualitative or quantitative basis for each of our reporting units as of July 1, or more frequently when circumstances indicate an impairment may exist at the reporting unit level. When performing the annual impairment test we have the option of first performing a qualitative assessment to determine the existence of events and circumstances that would lead to a determination that it is more likely than not that the fair value of a reporting unit is less than its carrying amount. If such a conclusion is reached, we would then be required to perform a quantitative impairment assessment of goodwill. However, if the assessment leads to a determination that it is more likely than not that the fair value of a reporting unit is greater than its carrying amount, then no further assessments are required. A quantitative assessment for the determination of impairment is made by comparing the carrying amount of each reporting unit with its fair value, which is generally calculated using a combination of market, comparable transaction and discounted cash flow approaches. See "Note 7. Goodwill and Other Intangible Assets" for further information on valuation methodology and impairment of goodwill.
We review PP&E, intangible assets and certain other long-lived assets for impairment whenever events or changes in circumstances indicate that the carrying amount may not be recoverable and at least annually for indefinite-lived intangible assets. When testing for impairment, we group our long-lived assets with other assets and liabilities at the lowest level for which identifiable cash flows are largely independent of the cash flows of other assets and liabilities (or asset group). The determination of recoverability is made based upon the estimated undiscounted future net cash flows. The amount of impairment loss, if any, is determined by comparing the fair value, as determined by a discounted cash flow analysis, with the carrying value of the related assets.
Financial Instruments
Our financial instruments include cash and equivalents, current receivables, investments, accounts payables, short and long-term debt, and derivative financial instruments.
We monitor our exposure to various business risks including commodity prices and foreign currency exchange rates and we regularly use derivative financial instruments to manage these risks. At the inception of a new derivative, we designate the derivative as a hedge or we determine the derivative to be undesignated as a hedging
Baker Hughes, a GE companyNotes to Consolidated and Combined Financial Statements
BHGE 2018 FORM 10-K | 63
instrument. We document the relationships between the hedging instruments and the hedged items, as well as our risk management objectives and strategy for undertaking various hedge transactions. We assess whether the derivatives that are used in hedging transactions are highly effective in offsetting changes in cash flows of the hedged item at both the inception of the hedge and on an ongoing basis.
We have a program that utilizes foreign currency forward contracts to reduce the risks associated with the effects of certain foreign currency exposures. Under this program, our strategy is to have gains or losses on the foreign currency forward contracts mitigate the foreign currency transaction and translation gains or losses to the extent practical. These foreign currency exposures typically arise from changes in the value of assets (for example, current receivables) and liabilities (for example, current payables) which are denominated in currencies other than the functional currency of the respective entity. We record all derivatives as of the end of our reporting period in our consolidated and combined statement of financial position at fair value. For the forward contracts held as undesignated hedging instruments, we record the changes in fair value of the forward contracts in our consolidated and combined statements of income (loss) along with the change in the fair value, related to foreign exchange movements, of the hedged item. Changes in the fair value of forward contracts designated as cash flow hedging instruments are recognized in other comprehensive income until the hedged item is recognized in earnings. If derivatives designated as a cash flow hedge are determined to be ineffective, the ineffective portion of that derivative's change in fair value is recognized in earnings.
Fair Value Measurements
For financial assets and liabilities measured at fair value on a recurring basis, fair value is the price we would receive to sell an asset or pay to transfer a liability in an orderly transaction with a market participant at the measurement date. In the absence of active markets for the identical assets or liabilities, such measurements involve developing assumptions based on market observable data and, in the absence of such data, internal information that is consistent with what market participants would use in a hypothetical transaction that occurs at the measurement date.
Observable inputs reflect market data obtained from independent sources, while unobservable inputs reflect our market assumptions. Preference is given to observable inputs. These two types of inputs create the following fair value hierarchy:
• Level 1 - Quoted prices for identical instruments in active markets.
• Level 2 - Quoted prices for similar instruments in active markets; quoted prices for identical or similar instruments in markets that are not active; and model-derived valuations whose inputs are observable or whose significant value drivers are observable.
• Level 3 - Significant inputs to the valuation model are unobservable.
We maintain policies and procedures to value instruments using the best and most relevant data available. In addition, we perform reviews to assess the reasonableness of the valuations. With regard to Level 3 valuations (including instruments valued by third parties), we perform a variety of procedures to assess the reasonableness of the valuations. Such reviews include an evaluation of instruments whose fair value change exceeds predefined thresholds (and/or does not change) and consider the current interest rate, currency and credit environment, as well as other published data, such as rating agency market reports and current appraisals.
Recurring Fair Value Measurements
Derivatives
When we have Level 1 derivatives, which are traded either on exchanges or liquid over-the-counter markets, we use closing prices for valuation. The majority of our derivatives are valued using internal models and are included in Level 2. These internal models maximize the use of market observable inputs including interest rate curves and both forward and spot prices for currencies and commodities. Derivative assets and liabilities included in Level 2 primarily represent foreign currency and commodity forward contracts for the Company.
Baker Hughes, a GE companyNotes to Consolidated and Combined Financial Statements
64 | BHGE 2018 FORM 10-K
Investments in Debt and Equity Securities
When available, we use quoted market prices to determine the fair value of investment securities, and they are included in Level 1. Level 1 securities primarily include publicly traded equity securities.
For investment securities for which market prices are observable for identical or similar investment securities but not readily accessible for each of those investments individually (that is, it is difficult to obtain pricing information for each individual investment security at the measurement date), we use pricing models that are consistent with what other market participants would use. The inputs and assumptions to the models are derived from market observable sources including: benchmark yields, reported trades, broker/dealer quotes, issuer spreads, benchmark securities, bids, offers, and other market-related data. Thus, certain securities may not be priced using quoted prices, but rather determined from market observable information. These investments are included in Level 2. When we use valuations that are based on significant unobservable inputs we classify the investment securities in Level 3.
Non-Recurring Fair Value Measurements
Certain assets are measured at fair value on a non-recurring basis. These assets are not measured at fair value on an ongoing basis, but are subject to fair value adjustments only in certain circumstances. These assets can include long-lived assets that have been reduced to fair value when they are held for sale, equity securities without readily determinable fair value and equity method investments and long-lived assets that are written down to fair value when they are impaired and the remeasurement of retained investments in formerly consolidated subsidiaries upon a change in control that results in a deconsolidation of a subsidiary, if we sell a controlling interest and retain a noncontrolling stake in the entity. Assets that are written down to fair value when impaired and retained investments are not subsequently adjusted to fair value unless further impairment occurs.
Investments in Equity Securities
Investments in equity securities are valued using market observable data such as quoted prices when available. When market observable data is unavailable, investments are valued using a discounted cash flow model, comparative market multiples or a combination of both approaches as appropriate and other third-party pricing sources.
Long-lived Assets
Fair values of long-lived assets, including real estate, are primarily derived internally and are based on observed sales transactions for similar assets. In other instances, for example, collateral types for which we do not have comparable observed sales transaction data, collateral values are developed internally and corroborated by external appraisal information. Adjustments to third-party valuations may be performed in circumstances where market comparables are not specific to the attributes of the specific collateral or appraisal information may not be reflective of current market conditions due to the passage of time and the occurrence of market events since receipt of the information.
Income Taxes
We file U.S. federal and state income tax returns which after the closing of the Transactions primarily includes our distributive share of items of income, gain, loss and deduction of BHGE LLC which is treated as a partnership for U.S. tax purposes. As such, BHGE LLC will not itself be subject to U.S. federal income tax under current U.S. tax laws. Non-U.S. current and deferred income taxes owed by the subsidiaries of BHGE LLC are reflected in the financial statements.
Prior to the closing of the Transactions, GE O&G was included in the consolidated U.S. federal, foreign and state income tax returns of GE, where allowable by law. Our prior year current and deferred taxes were determined based upon the separate return method (i.e., as if we were a taxpayer separate from GE).
Baker Hughes, a GE companyNotes to Consolidated and Combined Financial Statements
BHGE 2018 FORM 10-K | 65
We account for taxes under the asset and liability method. Under this method, deferred income taxes are recognized for temporary differences between the financial statement and tax return bases of assets and liabilities as well as from net operating losses and tax credit carryforwards, based on enacted tax rates expected to be in effect when taxes actually are paid or recovered and other provisions of the tax law. The effect of a change in tax laws or rates on deferred tax assets and liabilities is recognized in income in the period in which such change is enacted. Future tax benefits are recognized to the extent that realization of such benefits is more likely than not, and a valuation allowance is established for any portion of a deferred tax asset that management believes may not be realized.
We provide U.S. deferred taxes on our outside basis difference in our investment in BHGE LLC. In determining the basis difference, we exclude non-deductible goodwill and the basis difference related to certain foreign corporations owned by BHGE LLC where the undistributed earnings of the foreign corporation have been, or will be, reinvested indefinitely.
Due to the enactment of U.S. tax reform, repatriations of foreign earnings will generally be free of U.S. federal tax but may incur other taxes, such as withholding or state taxes. Indefinite reinvestment is determined by management’s judgment about and intentions concerning the future operations of the Company. Most of these earnings have been reinvested in active non-U.S. business operations. It is not practicable to determine the income tax liability that would be payable if such earnings were not reinvested indefinitely.
Significant judgment is required in determining our tax expense and in evaluating our tax positions, including evaluating uncertainties. We operate in more than 120 countries and our tax filings are subject to audit by the tax authorities in the jurisdictions where we conduct business. These audits may result in assessments of additional taxes that are resolved with the tax authorities or through the courts. We have provided for the amounts that we believe will ultimately result from these proceedings. We recognize uncertain tax positions that are “more likely than not” to be sustained if the relevant tax authority were to audit the position with full knowledge of all the relevant facts and other information. For those tax positions that meet this threshold, we measure the amount of tax benefit based on the largest amount of tax benefit that has a greater than 50% chance of being realized in a final settlement with the relevant authority. We classify interest and penalties associated with uncertain tax positions as income tax expense. The effects of tax adjustments and settlements from taxing authorities are presented in the combined financial statements in the period they are recorded.
Additionally, as part of U.S. tax reform, the U.S. has enacted a tax on "base eroding" payments from the U.S. and a minimum tax on foreign earnings (global intangible low-taxed income). In 2018, we made an accounting policy election to account for these taxes as period costs.
Environmental Liabilities
We are involved in numerous remediation actions to clean up hazardous waste as required by federal and state laws. Liabilities for remediation costs exclude possible insurance recoveries and, when dates and amounts of such costs are not known, are not discounted. When there appears to be a range of possible costs with equal likelihood, liabilities are based on the low end of such range. It is reasonably possible that our environmental remediation exposure will exceed amounts accrued. However, due to uncertainties about the status of laws, regulations, technology and information related to individual sites, such amounts are not reasonably estimable. The determination of the required accruals for remediation costs is subject to uncertainty, including the evolving nature of environmental regulations and the difficulty in estimating the extent and type of remediation activity that is necessary.
NEW ACCOUNTING STANDARDS ADOPTED
On January 1, 2018, we adopted the FASB ASU No. 2014-09, Revenue from Contracts with Customers, and the related amendments (ASC 606). We elected to adopt the new standard using the full retrospective method, where the standard was applied to each prior reporting period presented and the cumulative effect of applying the standard was recognized at January 1, 2016. In addition, we elected the practical expedient for contract modifications, which essentially means that the terms of the contract that existed at the beginning of the earliest period presented can be assumed to have been in place since the inception of the contract (i.e., not practical to
Baker Hughes, a GE companyNotes to Consolidated and Combined Financial Statements
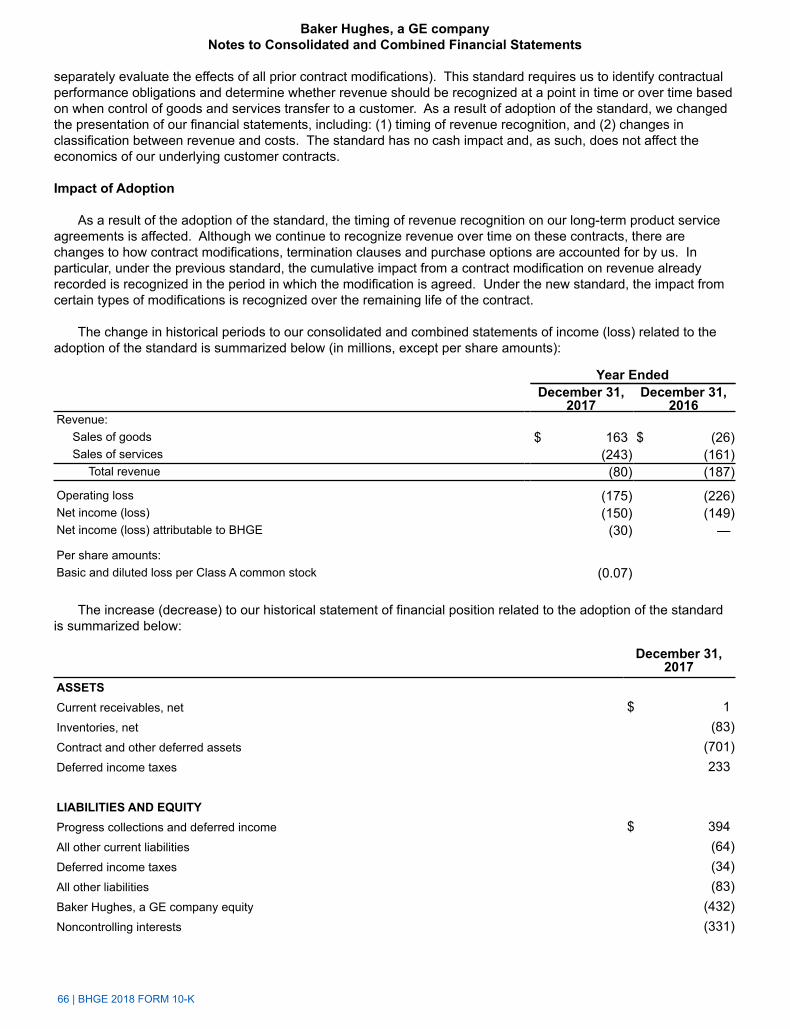
66 | BHGE 2018 FORM 10-K
separately evaluate the effects of all prior contract modifications). This standard requires us to identify contractual performance obligations and determine whether revenue should be recognized at a point in time or over time based on when control of goods and services transfer to a customer. As a result of adoption of the standard, we changed the presentation of our financial statements, including: (1) timing of revenue recognition, and (2) changes in classification between revenue and costs. The standard has no cash impact and, as such, does not affect the economics of our underlying customer contracts.
Impact of Adoption
As a result of the adoption of the standard, the timing of revenue recognition on our long-term product service agreements is affected. Although we continue to recognize revenue over time on these contracts, there are changes to how contract modifications, termination clauses and purchase options are accounted for by us. In particular, under the previous standard, the cumulative impact from a contract modification on revenue already recorded is recognized in the period in which the modification is agreed. Under the new standard, the impact from certain types of modifications is recognized over the remaining life of the contract.
The change in historical periods to our consolidated and combined statements of income (loss) related to the adoption of the standard is summarized below (in millions, except per share amounts):
Year EndedDecember 31,
2017December 31,
2016Revenue:
Sales of goods $ 163 $ (26)Sales of services (243) (161)
Total revenue (80) (187)
Operating loss (175) (226)Net income (loss) (150) (149)Net income (loss) attributable to BHGE (30) —
Per share amounts:Basic and diluted loss per Class A common stock (0.07)
The increase (decrease) to our historical statement of financial position related to the adoption of the standard is summarized below:
December 31,2017
ASSETSCurrent receivables, net $ 1Inventories, net (83)Contract and other deferred assets (701)Deferred income taxes 233
LIABILITIES AND EQUITYProgress collections and deferred income $ 394All other current liabilities (64)Deferred income taxes (34)All other liabilities (83)Baker Hughes, a GE company equity (432)Noncontrolling interests (331)
Baker Hughes, a GE companyNotes to Consolidated and Combined Financial Statements
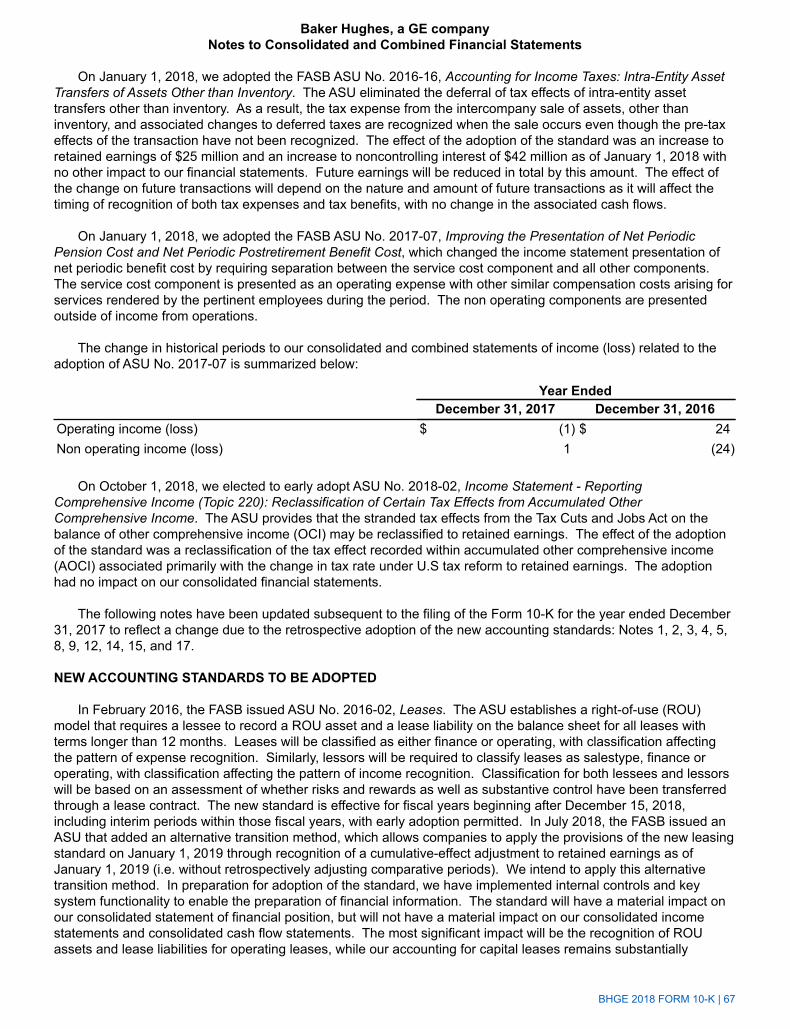
BHGE 2018 FORM 10-K | 67
On January 1, 2018, we adopted the FASB ASU No. 2016-16, Accounting for Income Taxes: Intra-Entity Asset Transfers of Assets Other than Inventory. The ASU eliminated the deferral of tax effects of intra-entity asset transfers other than inventory. As a result, the tax expense from the intercompany sale of assets, other than inventory, and associated changes to deferred taxes are recognized when the sale occurs even though the pre-tax effects of the transaction have not been recognized. The effect of the adoption of the standard was an increase to retained earnings of $25 million and an increase to noncontrolling interest of $42 million as of January 1, 2018 with no other impact to our financial statements. Future earnings will be reduced in total by this amount. The effect of the change on future transactions will depend on the nature and amount of future transactions as it will affect the timing of recognition of both tax expenses and tax benefits, with no change in the associated cash flows.
On January 1, 2018, we adopted the FASB ASU No. 2017-07, Improving the Presentation of Net Periodic Pension Cost and Net Periodic Postretirement Benefit Cost, which changed the income statement presentation of net periodic benefit cost by requiring separation between the service cost component and all other components. The service cost component is presented as an operating expense with other similar compensation costs arising for services rendered by the pertinent employees during the period. The non operating components are presented outside of income from operations.
The change in historical periods to our consolidated and combined statements of income (loss) related to the adoption of ASU No. 2017-07 is summarized below:
Year EndedDecember 31, 2017 December 31, 2016
Operating income (loss) $ (1) $ 24Non operating income (loss) 1 (24)
On October 1, 2018, we elected to early adopt ASU No. 2018-02, Income Statement - Reporting Comprehensive Income (Topic 220): Reclassification of Certain Tax Effects from Accumulated Other Comprehensive Income. The ASU provides that the stranded tax effects from the Tax Cuts and Jobs Act on the balance of other comprehensive income (OCI) may be reclassified to retained earnings. The effect of the adoption of the standard was a reclassification of the tax effect recorded within accumulated other comprehensive income (AOCI) associated primarily with the change in tax rate under U.S tax reform to retained earnings. The adoption had no impact on our consolidated financial statements.
The following notes have been updated subsequent to the filing of the Form 10-K for the year ended December 31, 2017 to reflect a change due to the retrospective adoption of the new accounting standards: Notes 1, 2, 3, 4, 5, 8, 9, 12, 14, 15, and 17.
NEW ACCOUNTING STANDARDS TO BE ADOPTED
In February 2016, the FASB issued ASU No. 2016-02, Leases. The ASU establishes a right-of-use (ROU) model that requires a lessee to record a ROU asset and a lease liability on the balance sheet for all leases with terms longer than 12 months. Leases will be classified as either finance or operating, with classification affecting the pattern of expense recognition. Similarly, lessors will be required to classify leases as salestype, finance or operating, with classification affecting the pattern of income recognition. Classification for both lessees and lessors will be based on an assessment of whether risks and rewards as well as substantive control have been transferred through a lease contract. The new standard is effective for fiscal years beginning after December 15, 2018, including interim periods within those fiscal years, with early adoption permitted. In July 2018, the FASB issued an ASU that added an alternative transition method, which allows companies to apply the provisions of the new leasing standard on January 1, 2019 through recognition of a cumulative-effect adjustment to retained earnings as of January 1, 2019 (i.e. without retrospectively adjusting comparative periods). We intend to apply this alternative transition method. In preparation for adoption of the standard, we have implemented internal controls and key system functionality to enable the preparation of financial information. The standard will have a material impact on our consolidated statement of financial position, but will not have a material impact on our consolidated income statements and consolidated cash flow statements. The most significant impact will be the recognition of ROU assets and lease liabilities for operating leases, while our accounting for capital leases remains substantially
Baker Hughes, a GE companyNotes to Consolidated and Combined Financial Statements
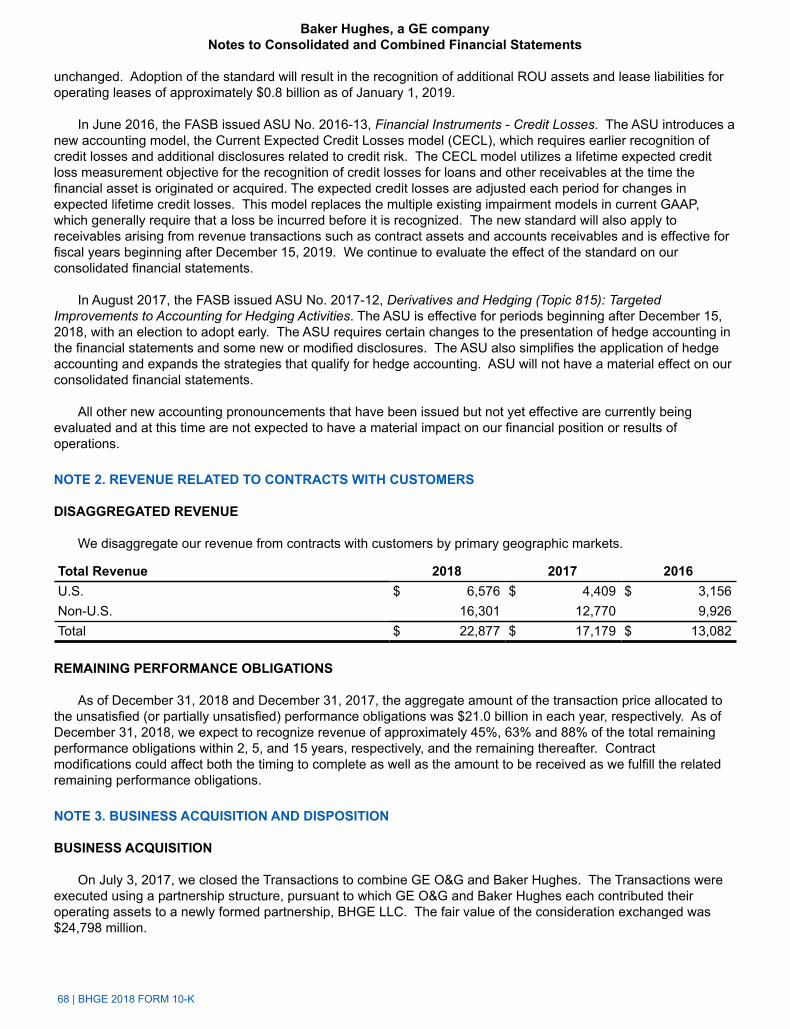
68 | BHGE 2018 FORM 10-K
unchanged. Adoption of the standard will result in the recognition of additional ROU assets and lease liabilities for operating leases of approximately $0.8 billion as of January 1, 2019.
In June 2016, the FASB issued ASU No. 2016-13, Financial Instruments - Credit Losses. The ASU introduces a new accounting model, the Current Expected Credit Losses model (CECL), which requires earlier recognition of credit losses and additional disclosures related to credit risk. The CECL model utilizes a lifetime expected credit loss measurement objective for the recognition of credit losses for loans and other receivables at the time the financial asset is originated or acquired. The expected credit losses are adjusted each period for changes in expected lifetime credit losses. This model replaces the multiple existing impairment models in current GAAP, which generally require that a loss be incurred before it is recognized. The new standard will also apply to receivables arising from revenue transactions such as contract assets and accounts receivables and is effective for fiscal years beginning after December 15, 2019. We continue to evaluate the effect of the standard on our consolidated financial statements.
In August 2017, the FASB issued ASU No. 2017-12, Derivatives and Hedging (Topic 815): Targeted Improvements to Accounting for Hedging Activities. The ASU is effective for periods beginning after December 15, 2018, with an election to adopt early. The ASU requires certain changes to the presentation of hedge accounting in the financial statements and some new or modified disclosures. The ASU also simplifies the application of hedge accounting and expands the strategies that qualify for hedge accounting. ASU will not have a material effect on our consolidated financial statements.
All other new accounting pronouncements that have been issued but not yet effective are currently being evaluated and at this time are not expected to have a material impact on our financial position or results of operations.
NOTE 2. REVENUE RELATED TO CONTRACTS WITH CUSTOMERS
DISAGGREGATED REVENUE
We disaggregate our revenue from contracts with customers by primary geographic markets.
Total Revenue 2018 2017 2016U.S. $ 6,576 $ 4,409 $ 3,156Non-U.S. 16,301 12,770 9,926Total $ 22,877 $ 17,179 $ 13,082
REMAINING PERFORMANCE OBLIGATIONS
As of December 31, 2018 and December 31, 2017, the aggregate amount of the transaction price allocated to the unsatisfied (or partially unsatisfied) performance obligations was $21.0 billion in each year, respectively. As of December 31, 2018, we expect to recognize revenue of approximately 45%, 63% and 88% of the total remaining performance obligations within 2, 5, and 15 years, respectively, and the remaining thereafter. Contract modifications could affect both the timing to complete as well as the amount to be received as we fulfill the related remaining performance obligations.
NOTE 3. BUSINESS ACQUISITION AND DISPOSITION
BUSINESS ACQUISITION
On July 3, 2017, we closed the Transactions to combine GE O&G and Baker Hughes. The Transactions were executed using a partnership structure, pursuant to which GE O&G and Baker Hughes each contributed their operating assets to a newly formed partnership, BHGE LLC. The fair value of the consideration exchanged was $24,798 million.
Baker Hughes, a GE companyNotes to Consolidated and Combined Financial Statements
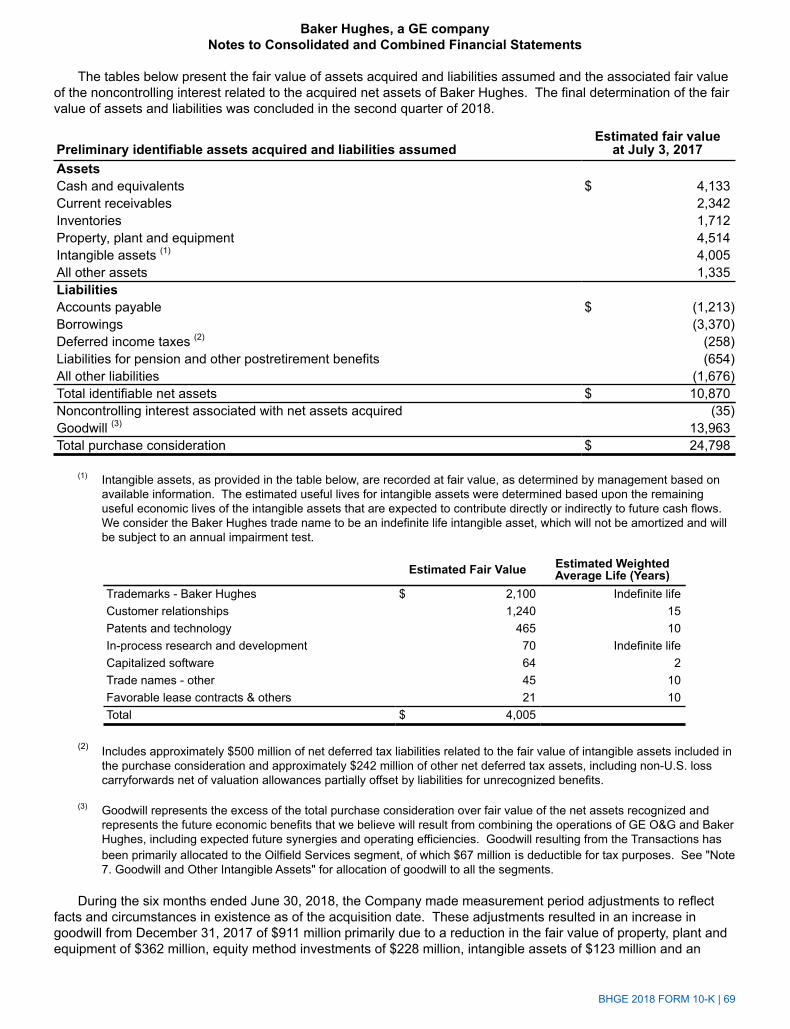
BHGE 2018 FORM 10-K | 69
The tables below present the fair value of assets acquired and liabilities assumed and the associated fair value of the noncontrolling interest related to the acquired net assets of Baker Hughes. The final determination of the fair value of assets and liabilities was concluded in the second quarter of 2018.
Preliminary identifiable assets acquired and liabilities assumedEstimated fair value
at July 3, 2017Assets Cash and equivalents $ 4,133Current receivables 2,342Inventories 1,712Property, plant and equipment 4,514Intangible assets (1) 4,005All other assets 1,335Liabilities Accounts payable $ (1,213)Borrowings (3,370)Deferred income taxes (2) (258)Liabilities for pension and other postretirement benefits (654)All other liabilities (1,676)Total identifiable net assets $ 10,870Noncontrolling interest associated with net assets acquired (35)Goodwill (3) 13,963Total purchase consideration $ 24,798
(1) Intangible assets, as provided in the table below, are recorded at fair value, as determined by management based on available information. The estimated useful lives for intangible assets were determined based upon the remaining useful economic lives of the intangible assets that are expected to contribute directly or indirectly to future cash flows. We consider the Baker Hughes trade name to be an indefinite life intangible asset, which will not be amortized and will be subject to an annual impairment test.
Estimated Fair Value Estimated WeightedAverage Life (Years)
Trademarks - Baker Hughes $ 2,100 Indefinite lifeCustomer relationships 1,240 15Patents and technology 465 10In-process research and development 70 Indefinite lifeCapitalized software 64 2Trade names - other 45 10Favorable lease contracts & others 21 10Total $ 4,005
(2) Includes approximately $500 million of net deferred tax liabilities related to the fair value of intangible assets included in the purchase consideration and approximately $242 million of other net deferred tax assets, including non-U.S. loss carryforwards net of valuation allowances partially offset by liabilities for unrecognized benefits.
(3) Goodwill represents the excess of the total purchase consideration over fair value of the net assets recognized and represents the future economic benefits that we believe will result from combining the operations of GE O&G and Baker Hughes, including expected future synergies and operating efficiencies. Goodwill resulting from the Transactions has been primarily allocated to the Oilfield Services segment, of which $67 million is deductible for tax purposes. See "Note 7. Goodwill and Other Intangible Assets" for allocation of goodwill to all the segments.
During the six months ended June 30, 2018, the Company made measurement period adjustments to reflect facts and circumstances in existence as of the acquisition date. These adjustments resulted in an increase in goodwill from December 31, 2017 of $911 million primarily due to a reduction in the fair value of property, plant and equipment of $362 million, equity method investments of $228 million, intangible assets of $123 million and an
Baker Hughes, a GE companyNotes to Consolidated and Combined Financial Statements
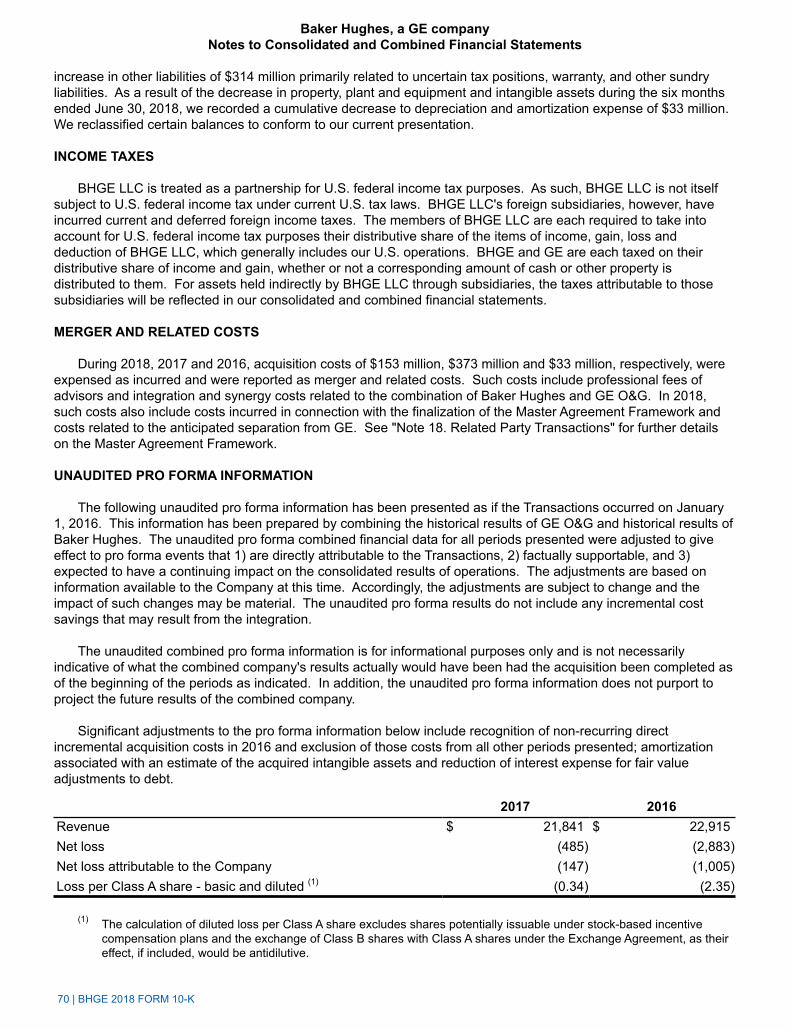
70 | BHGE 2018 FORM 10-K
increase in other liabilities of $314 million primarily related to uncertain tax positions, warranty, and other sundry liabilities. As a result of the decrease in property, plant and equipment and intangible assets during the six months ended June 30, 2018, we recorded a cumulative decrease to depreciation and amortization expense of $33 million. We reclassified certain balances to conform to our current presentation.
INCOME TAXES
BHGE LLC is treated as a partnership for U.S. federal income tax purposes. As such, BHGE LLC is not itself subject to U.S. federal income tax under current U.S. tax laws. BHGE LLC's foreign subsidiaries, however, have incurred current and deferred foreign income taxes. The members of BHGE LLC are each required to take into account for U.S. federal income tax purposes their distributive share of the items of income, gain, loss and deduction of BHGE LLC, which generally includes our U.S. operations. BHGE and GE are each taxed on their distributive share of income and gain, whether or not a corresponding amount of cash or other property is distributed to them. For assets held indirectly by BHGE LLC through subsidiaries, the taxes attributable to those subsidiaries will be reflected in our consolidated and combined financial statements.
MERGER AND RELATED COSTS
During 2018, 2017 and 2016, acquisition costs of $153 million, $373 million and $33 million, respectively, were expensed as incurred and were reported as merger and related costs. Such costs include professional fees of advisors and integration and synergy costs related to the combination of Baker Hughes and GE O&G. In 2018, such costs also include costs incurred in connection with the finalization of the Master Agreement Framework and costs related to the anticipated separation from GE. See "Note 18. Related Party Transactions" for further details on the Master Agreement Framework.
UNAUDITED PRO FORMA INFORMATION
The following unaudited pro forma information has been presented as if the Transactions occurred on January 1, 2016. This information has been prepared by combining the historical results of GE O&G and historical results of Baker Hughes. The unaudited pro forma combined financial data for all periods presented were adjusted to give effect to pro forma events that 1) are directly attributable to the Transactions, 2) factually supportable, and 3) expected to have a continuing impact on the consolidated results of operations. The adjustments are based on information available to the Company at this time. Accordingly, the adjustments are subject to change and the impact of such changes may be material. The unaudited pro forma results do not include any incremental cost savings that may result from the integration.
The unaudited combined pro forma information is for informational purposes only and is not necessarily indicative of what the combined company's results actually would have been had the acquisition been completed as of the beginning of the periods as indicated. In addition, the unaudited pro forma information does not purport to project the future results of the combined company.
Significant adjustments to the pro forma information below include recognition of non-recurring direct incremental acquisition costs in 2016 and exclusion of those costs from all other periods presented; amortization associated with an estimate of the acquired intangible assets and reduction of interest expense for fair value adjustments to debt.
2017 2016Revenue $ 21,841 $ 22,915Net loss (485) (2,883)Net loss attributable to the Company (147) (1,005)Loss per Class A share - basic and diluted (1) (0.34) (2.35)
(1) The calculation of diluted loss per Class A share excludes shares potentially issuable under stock-based incentive compensation plans and the exchange of Class B shares with Class A shares under the Exchange Agreement, as their effect, if included, would be antidilutive.
Baker Hughes, a GE companyNotes to Consolidated and Combined Financial Statements
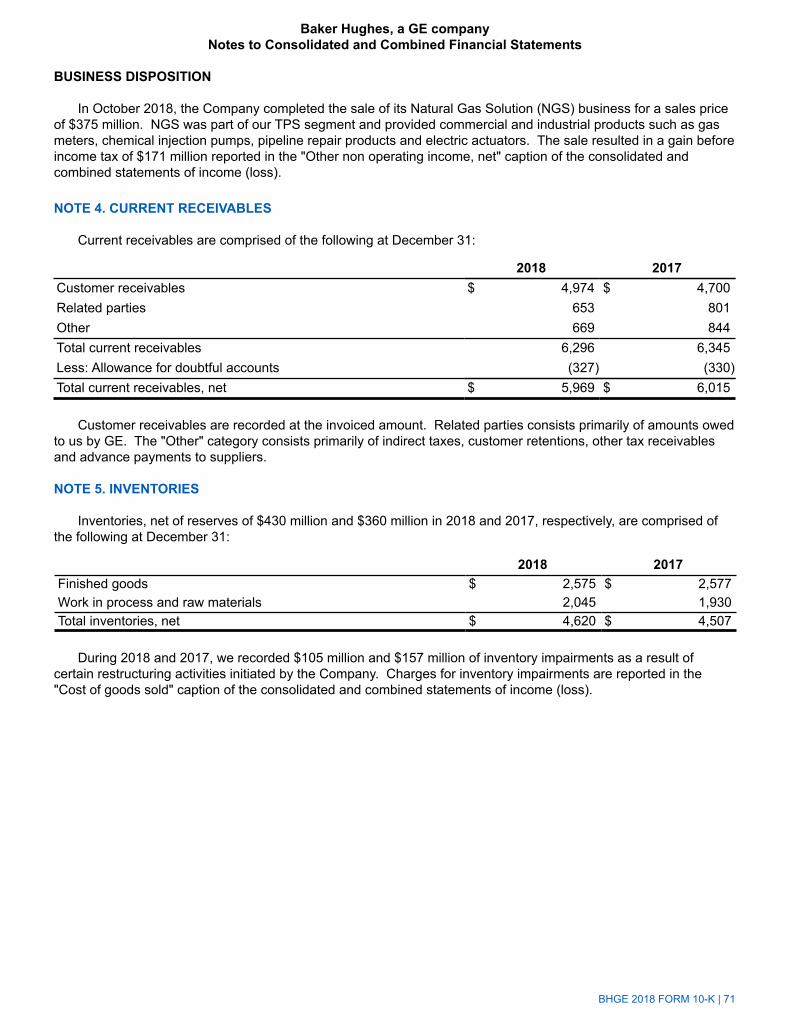
BHGE 2018 FORM 10-K | 71
BUSINESS DISPOSITION
In October 2018, the Company completed the sale of its Natural Gas Solution (NGS) business for a sales price of $375 million. NGS was part of our TPS segment and provided commercial and industrial products such as gas meters, chemical injection pumps, pipeline repair products and electric actuators. The sale resulted in a gain before income tax of $171 million reported in the "Other non operating income, net" caption of the consolidated and combined statements of income (loss).
NOTE 4. CURRENT RECEIVABLES
Current receivables are comprised of the following at December 31:
2018 2017Customer receivables $ 4,974 $ 4,700Related parties 653 801Other 669 844Total current receivables 6,296 6,345Less: Allowance for doubtful accounts (327) (330)Total current receivables, net $ 5,969 $ 6,015
Customer receivables are recorded at the invoiced amount. Related parties consists primarily of amounts owed to us by GE. The "Other" category consists primarily of indirect taxes, customer retentions, other tax receivables and advance payments to suppliers.
NOTE 5. INVENTORIES
Inventories, net of reserves of $430 million and $360 million in 2018 and 2017, respectively, are comprised of the following at December 31:
2018 2017Finished goods $ 2,575 $ 2,577Work in process and raw materials 2,045 1,930Total inventories, net $ 4,620 $ 4,507
During 2018 and 2017, we recorded $105 million and $157 million of inventory impairments as a result of certain restructuring activities initiated by the Company. Charges for inventory impairments are reported in the "Cost of goods sold" caption of the consolidated and combined statements of income (loss).
Baker Hughes, a GE companyNotes to Consolidated and Combined Financial Statements
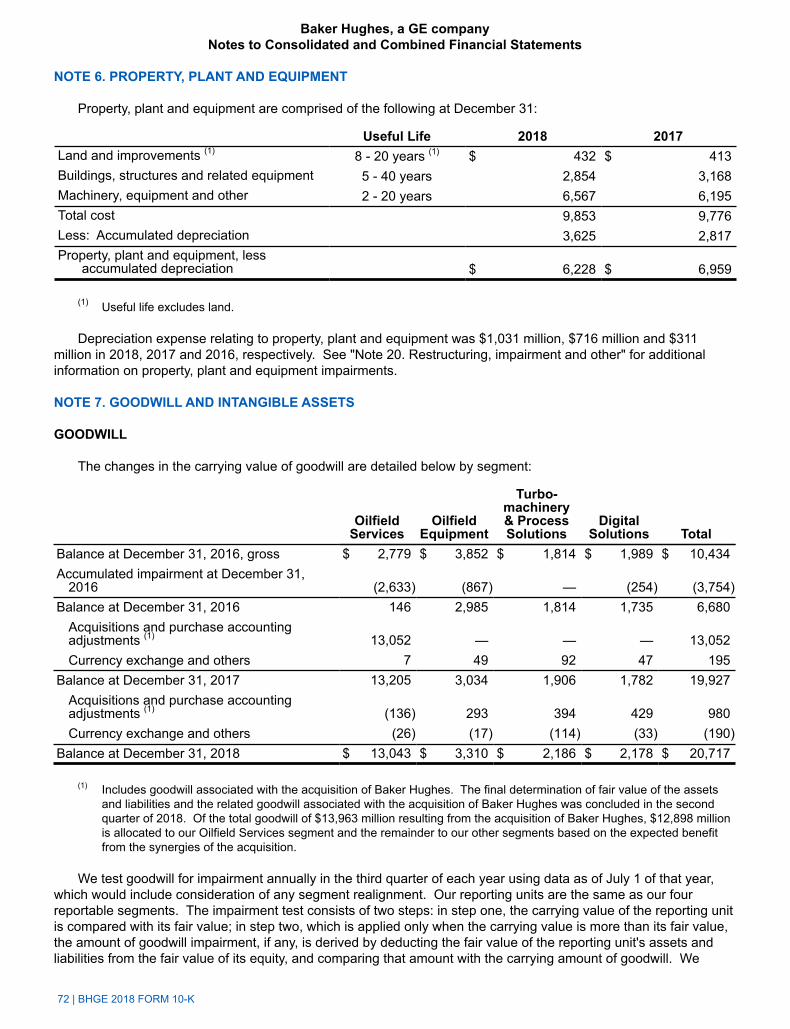
72 | BHGE 2018 FORM 10-K
NOTE 6. PROPERTY, PLANT AND EQUIPMENT
Property, plant and equipment are comprised of the following at December 31:
Useful Life 2018 2017Land and improvements (1) 8 - 20 years (1) $ 432 $ 413Buildings, structures and related equipment 5 - 40 years 2,854 3,168Machinery, equipment and other 2 - 20 years 6,567 6,195Total cost 9,853 9,776Less: Accumulated depreciation 3,625 2,817Property, plant and equipment, less
accumulated depreciation $ 6,228 $ 6,959
(1) Useful life excludes land.
Depreciation expense relating to property, plant and equipment was $1,031 million, $716 million and $311 million in 2018, 2017 and 2016, respectively. See "Note 20. Restructuring, impairment and other" for additional information on property, plant and equipment impairments.
NOTE 7. GOODWILL AND INTANGIBLE ASSETS
GOODWILL
The changes in the carrying value of goodwill are detailed below by segment:
OilfieldServices
OilfieldEquipment
Turbo-machinery& ProcessSolutions
DigitalSolutions Total
Balance at December 31, 2016, gross $ 2,779 $ 3,852 $ 1,814 $ 1,989 $ 10,434Accumulated impairment at December 31,
2016 (2,633) (867) — (254) (3,754)Balance at December 31, 2016 146 2,985 1,814 1,735 6,680
Acquisitions and purchase accounting adjustments (1) 13,052 — — — 13,052Currency exchange and others 7 49 92 47 195
Balance at December 31, 2017 13,205 3,034 1,906 1,782 19,927Acquisitions and purchase accounting adjustments (1) (136) 293 394 429 980Currency exchange and others (26) (17) (114) (33) (190)
Balance at December 31, 2018 $ 13,043 $ 3,310 $ 2,186 $ 2,178 $ 20,717
(1) Includes goodwill associated with the acquisition of Baker Hughes. The final determination of fair value of the assets and liabilities and the related goodwill associated with the acquisition of Baker Hughes was concluded in the second quarter of 2018. Of the total goodwill of $13,963 million resulting from the acquisition of Baker Hughes, $12,898 million is allocated to our Oilfield Services segment and the remainder to our other segments based on the expected benefit from the synergies of the acquisition.
We test goodwill for impairment annually in the third quarter of each year using data as of July 1 of that year, which would include consideration of any segment realignment. Our reporting units are the same as our four reportable segments. The impairment test consists of two steps: in step one, the carrying value of the reporting unit is compared with its fair value; in step two, which is applied only when the carrying value is more than its fair value, the amount of goodwill impairment, if any, is derived by deducting the fair value of the reporting unit's assets and liabilities from the fair value of its equity, and comparing that amount with the carrying amount of goodwill. We
Baker Hughes, a GE companyNotes to Consolidated and Combined Financial Statements
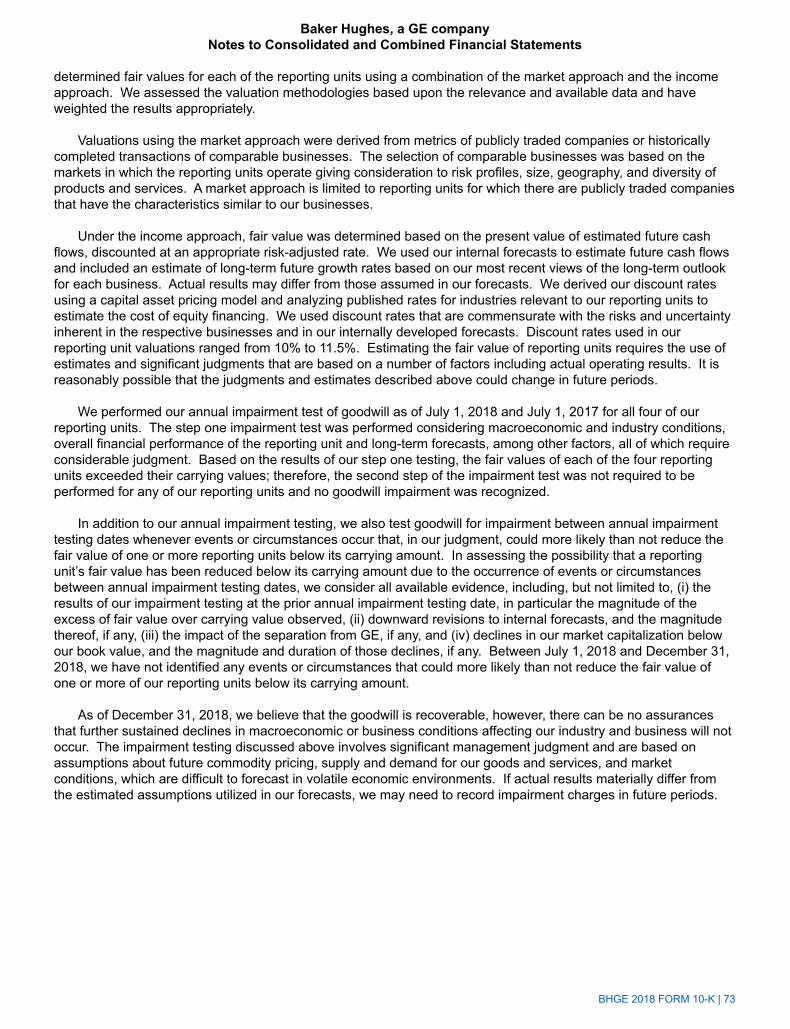
BHGE 2018 FORM 10-K | 73
determined fair values for each of the reporting units using a combination of the market approach and the income approach. We assessed the valuation methodologies based upon the relevance and available data and have weighted the results appropriately.
Valuations using the market approach were derived from metrics of publicly traded companies or historically completed transactions of comparable businesses. The selection of comparable businesses was based on the markets in which the reporting units operate giving consideration to risk profiles, size, geography, and diversity of products and services. A market approach is limited to reporting units for which there are publicly traded companies that have the characteristics similar to our businesses.
Under the income approach, fair value was determined based on the present value of estimated future cash flows, discounted at an appropriate risk-adjusted rate. We used our internal forecasts to estimate future cash flows and included an estimate of long-term future growth rates based on our most recent views of the long-term outlook for each business. Actual results may differ from those assumed in our forecasts. We derived our discount rates using a capital asset pricing model and analyzing published rates for industries relevant to our reporting units to estimate the cost of equity financing. We used discount rates that are commensurate with the risks and uncertainty inherent in the respective businesses and in our internally developed forecasts. Discount rates used in our reporting unit valuations ranged from 10% to 11.5%. Estimating the fair value of reporting units requires the use of estimates and significant judgments that are based on a number of factors including actual operating results. It is reasonably possible that the judgments and estimates described above could change in future periods.
We performed our annual impairment test of goodwill as of July 1, 2018 and July 1, 2017 for all four of our reporting units. The step one impairment test was performed considering macroeconomic and industry conditions, overall financial performance of the reporting unit and long-term forecasts, among other factors, all of which require considerable judgment. Based on the results of our step one testing, the fair values of each of the four reporting units exceeded their carrying values; therefore, the second step of the impairment test was not required to be performed for any of our reporting units and no goodwill impairment was recognized.
In addition to our annual impairment testing, we also test goodwill for impairment between annual impairment testing dates whenever events or circumstances occur that, in our judgment, could more likely than not reduce the fair value of one or more reporting units below its carrying amount. In assessing the possibility that a reporting unit’s fair value has been reduced below its carrying amount due to the occurrence of events or circumstances between annual impairment testing dates, we consider all available evidence, including, but not limited to, (i) the results of our impairment testing at the prior annual impairment testing date, in particular the magnitude of the excess of fair value over carrying value observed, (ii) downward revisions to internal forecasts, and the magnitude thereof, if any, (iii) the impact of the separation from GE, if any, and (iv) declines in our market capitalization below our book value, and the magnitude and duration of those declines, if any. Between July 1, 2018 and December 31, 2018, we have not identified any events or circumstances that could more likely than not reduce the fair value of one or more of our reporting units below its carrying amount.
As of December 31, 2018, we believe that the goodwill is recoverable, however, there can be no assurances that further sustained declines in macroeconomic or business conditions affecting our industry and business will not occur. The impairment testing discussed above involves significant management judgment and are based on assumptions about future commodity pricing, supply and demand for our goods and services, and market conditions, which are difficult to forecast in volatile economic environments. If actual results materially differ from the estimated assumptions utilized in our forecasts, we may need to record impairment charges in future periods.
Baker Hughes, a GE companyNotes to Consolidated and Combined Financial Statements
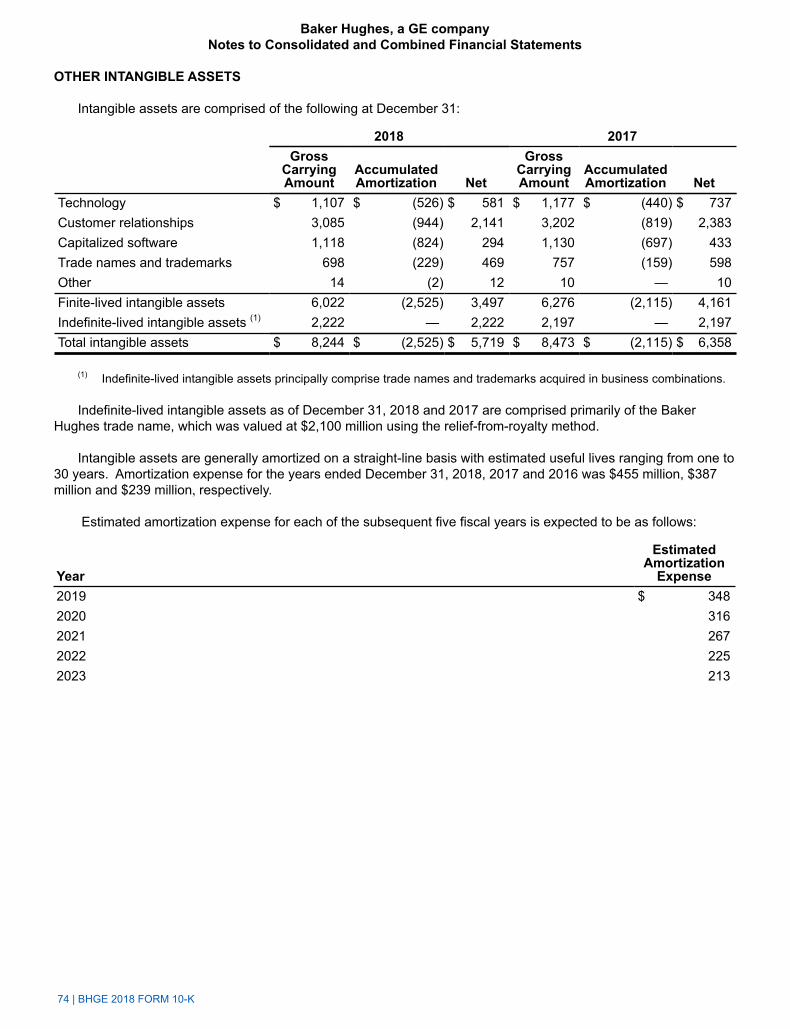
74 | BHGE 2018 FORM 10-K
OTHER INTANGIBLE ASSETS
Intangible assets are comprised of the following at December 31:
2018 2017Gross
CarryingAmount
AccumulatedAmortization Net
GrossCarryingAmount
AccumulatedAmortization Net
Technology $ 1,107 $ (526) $ 581 $ 1,177 $ (440) $ 737Customer relationships 3,085 (944) 2,141 3,202 (819) 2,383Capitalized software 1,118 (824) 294 1,130 (697) 433Trade names and trademarks 698 (229) 469 757 (159) 598Other 14 (2) 12 10 — 10Finite-lived intangible assets 6,022 (2,525) 3,497 6,276 (2,115) 4,161Indefinite-lived intangible assets (1) 2,222 — 2,222 2,197 — 2,197Total intangible assets $ 8,244 $ (2,525) $ 5,719 $ 8,473 $ (2,115) $ 6,358
(1) Indefinite-lived intangible assets principally comprise trade names and trademarks acquired in business combinations.
Indefinite-lived intangible assets as of December 31, 2018 and 2017 are comprised primarily of the Baker Hughes trade name, which was valued at $2,100 million using the relief-from-royalty method.
Intangible assets are generally amortized on a straight-line basis with estimated useful lives ranging from one to 30 years. Amortization expense for the years ended December 31, 2018, 2017 and 2016 was $455 million, $387 million and $239 million, respectively.
Estimated amortization expense for each of the subsequent five fiscal years is expected to be as follows:
Year
EstimatedAmortization
Expense2019 $ 3482020 3162021 2672022 2252023 213
Baker Hughes, a GE companyNotes to Consolidated and Combined Financial Statements
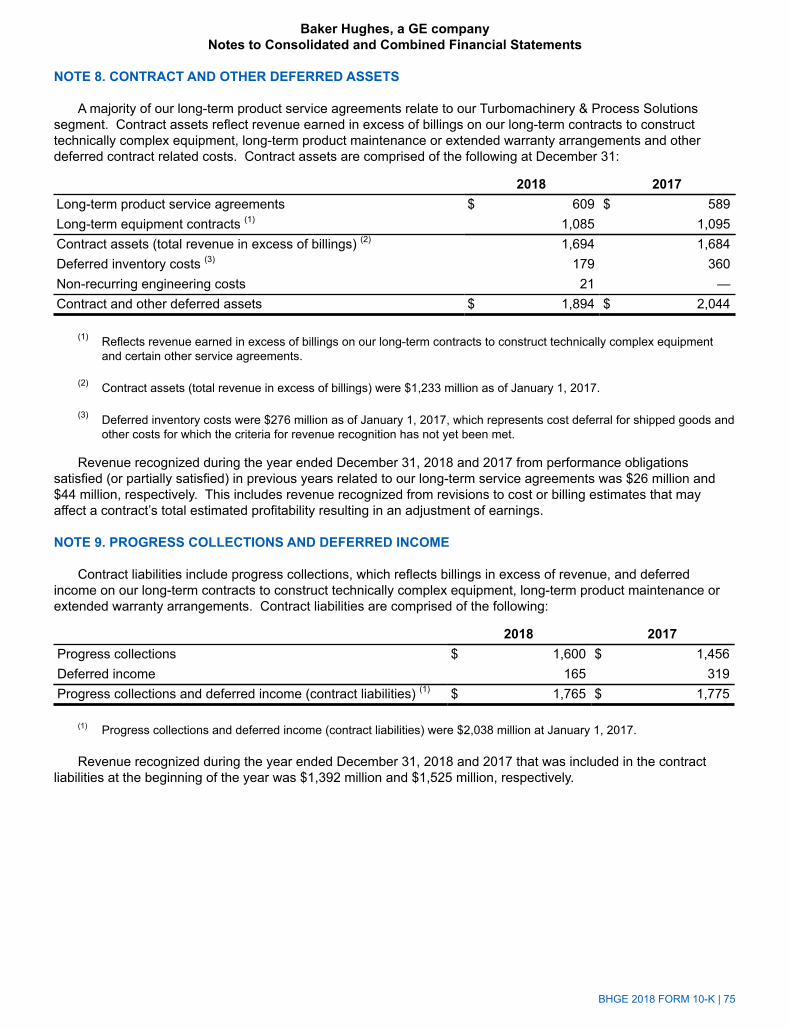
BHGE 2018 FORM 10-K | 75
NOTE 8. CONTRACT AND OTHER DEFERRED ASSETS
A majority of our long-term product service agreements relate to our Turbomachinery & Process Solutions segment. Contract assets reflect revenue earned in excess of billings on our long-term contracts to construct technically complex equipment, long-term product maintenance or extended warranty arrangements and other deferred contract related costs. Contract assets are comprised of the following at December 31:
2018 2017Long-term product service agreements $ 609 $ 589Long-term equipment contracts (1) 1,085 1,095Contract assets (total revenue in excess of billings) (2) 1,694 1,684Deferred inventory costs (3) 179 360Non-recurring engineering costs 21 —Contract and other deferred assets $ 1,894 $ 2,044
(1) Reflects revenue earned in excess of billings on our long-term contracts to construct technically complex equipment and certain other service agreements.
(2) Contract assets (total revenue in excess of billings) were $1,233 million as of January 1, 2017.
(3) Deferred inventory costs were $276 million as of January 1, 2017, which represents cost deferral for shipped goods and other costs for which the criteria for revenue recognition has not yet been met.
Revenue recognized during the year ended December 31, 2018 and 2017 from performance obligations satisfied (or partially satisfied) in previous years related to our long-term service agreements was $26 million and $44 million, respectively. This includes revenue recognized from revisions to cost or billing estimates that may affect a contract’s total estimated profitability resulting in an adjustment of earnings.
NOTE 9. PROGRESS COLLECTIONS AND DEFERRED INCOME
Contract liabilities include progress collections, which reflects billings in excess of revenue, and deferred income on our long-term contracts to construct technically complex equipment, long-term product maintenance or extended warranty arrangements. Contract liabilities are comprised of the following:
2018 2017Progress collections $ 1,600 $ 1,456Deferred income 165 319Progress collections and deferred income (contract liabilities) (1) $ 1,765 $ 1,775
(1) Progress collections and deferred income (contract liabilities) were $2,038 million at January 1, 2017.
Revenue recognized during the year ended December 31, 2018 and 2017 that was included in the contract liabilities at the beginning of the year was $1,392 million and $1,525 million, respectively.
Baker Hughes, a GE companyNotes to Consolidated and Combined Financial Statements
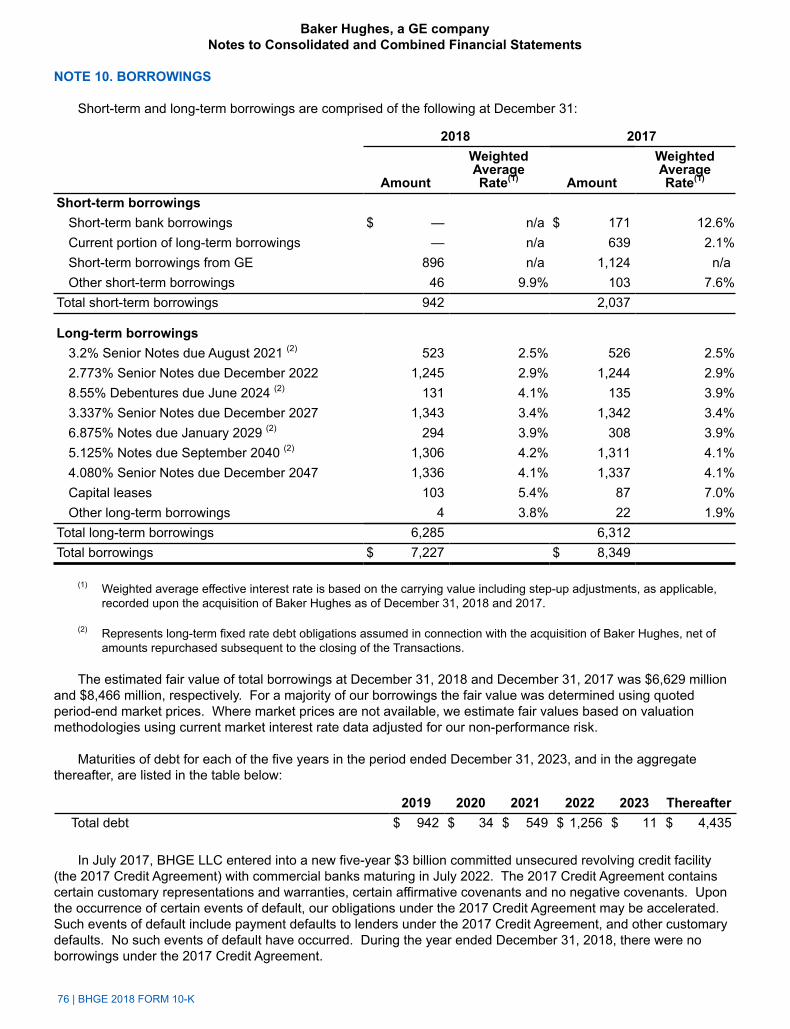
76 | BHGE 2018 FORM 10-K
NOTE 10. BORROWINGS
Short-term and long-term borrowings are comprised of the following at December 31:
2018 2017
Amount
Weighted Average Rate(1) Amount
Weighted Average Rate(1)
Short-term borrowingsShort-term bank borrowings $ — n/a $ 171 12.6%Current portion of long-term borrowings — n/a 639 2.1%Short-term borrowings from GE 896 n/a 1,124 n/aOther short-term borrowings 46 9.9% 103 7.6%
Total short-term borrowings 942 2,037
Long-term borrowings 3.2% Senior Notes due August 2021 (2) 523 2.5% 526 2.5%2.773% Senior Notes due December 2022 1,245 2.9% 1,244 2.9%8.55% Debentures due June 2024 (2) 131 4.1% 135 3.9%3.337% Senior Notes due December 2027 1,343 3.4% 1,342 3.4%6.875% Notes due January 2029 (2) 294 3.9% 308 3.9%5.125% Notes due September 2040 (2) 1,306 4.2% 1,311 4.1%4.080% Senior Notes due December 2047 1,336 4.1% 1,337 4.1%Capital leases 103 5.4% 87 7.0%Other long-term borrowings 4 3.8% 22 1.9%
Total long-term borrowings 6,285 6,312Total borrowings $ 7,227 $ 8,349
(1) Weighted average effective interest rate is based on the carrying value including step-up adjustments, as applicable, recorded upon the acquisition of Baker Hughes as of December 31, 2018 and 2017.
(2) Represents long-term fixed rate debt obligations assumed in connection with the acquisition of Baker Hughes, net of amounts repurchased subsequent to the closing of the Transactions.
The estimated fair value of total borrowings at December 31, 2018 and December 31, 2017 was $6,629 million and $8,466 million, respectively. For a majority of our borrowings the fair value was determined using quoted period-end market prices. Where market prices are not available, we estimate fair values based on valuation methodologies using current market interest rate data adjusted for our non-performance risk.
Maturities of debt for each of the five years in the period ended December 31, 2023, and in the aggregate thereafter, are listed in the table below:
2019 2020 2021 2022 2023 ThereafterTotal debt $ 942 $ 34 $ 549 $ 1,256 $ 11 $ 4,435
In July 2017, BHGE LLC entered into a new five-year $3 billion committed unsecured revolving credit facility (the 2017 Credit Agreement) with commercial banks maturing in July 2022. The 2017 Credit Agreement contains certain customary representations and warranties, certain affirmative covenants and no negative covenants. Upon the occurrence of certain events of default, our obligations under the 2017 Credit Agreement may be accelerated. Such events of default include payment defaults to lenders under the 2017 Credit Agreement, and other customary defaults. No such events of default have occurred. During the year ended December 31, 2018, there were no borrowings under the 2017 Credit Agreement.
Baker Hughes, a GE companyNotes to Consolidated and Combined Financial Statements
BHGE 2018 FORM 10-K | 77
In November 2017, BHGE LLC entered into a commercial paper program under which it may issue from time to time up to $3 billion in commercial paper with maturities of no more than 397 days. At December 31, 2018, we had no borrowings outstanding under the commercial paper program. The maximum combined borrowing at any time under both the 2017 Credit Agreement and the commercial paper program is $3 billion.
Concurrent with the Transactions associated with the acquisition of Baker Hughes on July 3, 2017, Baker Hughes Co-Obligor, Inc. became a co-obligor, jointly and severally with BHGE LLC, on our registered debt securities. This co-obligor is a 100%-owned finance subsidiary of BHGE LLC that was incorporated for the sole purpose of serving as a co-obligor of debt securities and has no assets or operations other than those related to its sole purpose. Baker Hughes Co-Obligor, Inc. is also a co-obligor of the $3,950 million senior notes issued on December 11, 2017 by BHGE LLC in a private placement.
Certain Senior Notes contain covenants that restrict BHGE LLC's ability to take certain actions, including, but not limited to, the creation of certain liens securing debt, the entry into certain sale-leaseback transactions and engaging in certain merger, consolidation and asset sale transactions in excess of specified limits.
In January 2018, BHGE LLC redeemed all remaining aggregate principal amount of the 2018 Senior Notes of $615 million. Also in January 2018, BHGE LLC commenced an offering to exchange $3,950 million of all the outstanding, unregistered senior notes that were issued in a private offering on December 11, 2017, for identical, registered 2.773% Senior Notes due 2022, 3.337% Senior Notes due 2027 and 4.080% Senior Notes due 2047. The exchange offer was completed on January 31, 2018.
See "Note 18. Related Party Transactions" for additional information on the short-term borrowings from GE, and see "Note 16. Financial Instruments" for additional information about borrowings and associated swaps.
NOTE 11. EMPLOYEE BENEFIT PLANS
GE MULTI-EMPLOYER PLANS
Certain of our U.S. employees are covered under various U.S. GE employee benefit plans, including GE's retirement plans (pension, retiree health and life insurance, and savings benefit plans). In addition, certain United Kingdom (UK) employees participate in the GE UK Pension Plan. We are allocated relevant participation costs for these GE employee benefit plans as part of multi-employer plans. As such, we have not recorded any liabilities associated with our participation in these plans. Expenses associated with our participation in these plans was $158 million, $132 million and $140 million in the years ended December 31, 2018, 2017 and 2016, respectively. In November 2018, the Company entered into an agreement with GE whereby GE will transfer the assets and liabilities of the GE UK Pension Plan related to the oil & gas businesses to BHGE on what is intended to be a fully funded basis. Subsequent to this transfer, BHGE shall cease to participate in the GE UK Pension Plan. This transfer is expected to close in 2019. Additionally, beginning in 2019, legacy GE O&G U.S. employees will cease to participate in the GE U.S. plans above.
DEFINED BENEFIT PLANS
In addition to these GE plans, certain of our employees are also covered by company sponsored pension plans. Our primary pension plans in 2018 included four U.S. plans and six non-U.S. pension plans, primarily in the UK, Germany, and Canada, all with pension assets or obligations greater than $20 million. We use a December 31 measurement date for these plans. These defined benefit plans generally provide benefits to employees based on formulas recognizing length of service and earnings; however, over half of these plans are either frozen or closed to new entrants. We also provide certain postretirement health care benefits (Other Postretirement Benefits), through an unfunded plan, to a closed group of U.S. employees who retire and meet certain age and service requirements.
Funded Status
The funded status position represents the difference between the benefit obligation and the plan assets. The projected benefit obligation (PBO) for pension benefits represents the actuarial present value of benefits attributed to employee services and compensation and includes an assumption about future compensation levels. The
Baker Hughes, a GE companyNotes to Consolidated and Combined Financial Statements
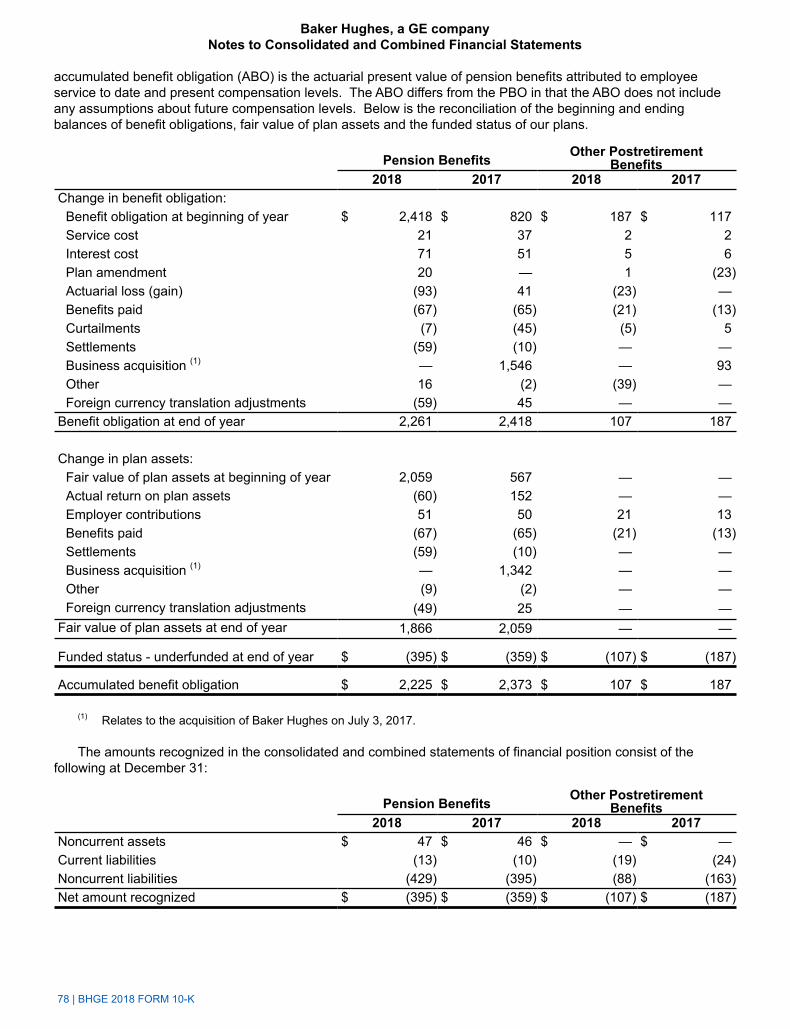
78 | BHGE 2018 FORM 10-K
accumulated benefit obligation (ABO) is the actuarial present value of pension benefits attributed to employee service to date and present compensation levels. The ABO differs from the PBO in that the ABO does not include any assumptions about future compensation levels. Below is the reconciliation of the beginning and ending balances of benefit obligations, fair value of plan assets and the funded status of our plans.
Pension Benefits Other PostretirementBenefits
2018 2017 2018 2017Change in benefit obligation:
Benefit obligation at beginning of year $ 2,418 $ 820 $ 187 $ 117Service cost 21 37 2 2Interest cost 71 51 5 6Plan amendment 20 — 1 (23)Actuarial loss (gain) (93) 41 (23) —Benefits paid (67) (65) (21) (13)Curtailments (7) (45) (5) 5Settlements (59) (10) — —Business acquisition (1) — 1,546 — 93Other 16 (2) (39) —Foreign currency translation adjustments (59) 45 — —
Benefit obligation at end of year 2,261 2,418 107 187
Change in plan assets:Fair value of plan assets at beginning of year 2,059 567 — —Actual return on plan assets (60) 152 — —Employer contributions 51 50 21 13Benefits paid (67) (65) (21) (13)Settlements (59) (10) — —Business acquisition (1) — 1,342 — —Other (9) (2) — —Foreign currency translation adjustments (49) 25 — —
Fair value of plan assets at end of year 1,866 2,059 — —
Funded status - underfunded at end of year $ (395) $ (359) $ (107) $ (187)
Accumulated benefit obligation $ 2,225 $ 2,373 $ 107 $ 187
(1) Relates to the acquisition of Baker Hughes on July 3, 2017.
The amounts recognized in the consolidated and combined statements of financial position consist of the following at December 31:
Pension Benefits Other PostretirementBenefits
2018 2017 2018 2017Noncurrent assets $ 47 $ 46 $ — $ —Current liabilities (13) (10) (19) (24)Noncurrent liabilities (429) (395) (88) (163)Net amount recognized $ (395) $ (359) $ (107) $ (187)
Baker Hughes, a GE companyNotes to Consolidated and Combined Financial Statements
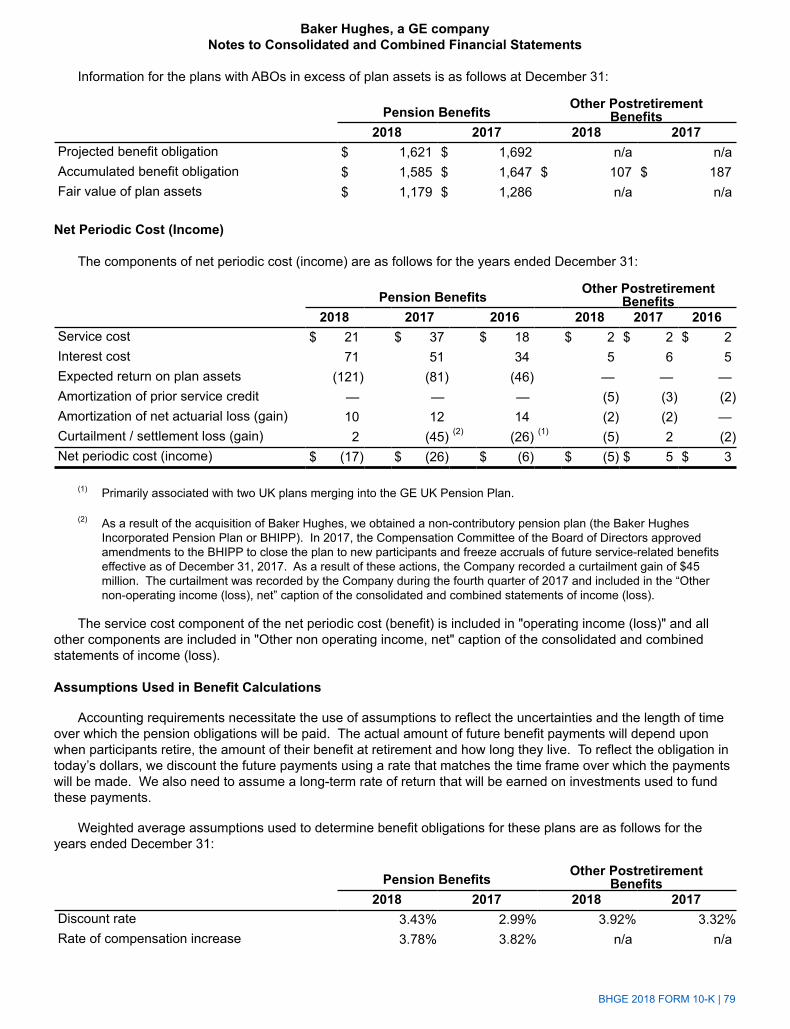
BHGE 2018 FORM 10-K | 79
Information for the plans with ABOs in excess of plan assets is as follows at December 31:
Pension Benefits Other PostretirementBenefits
2018 2017 2018 2017Projected benefit obligation $ 1,621 $ 1,692 n/a n/aAccumulated benefit obligation $ 1,585 $ 1,647 $ 107 $ 187Fair value of plan assets $ 1,179 $ 1,286 n/a n/a
Net Periodic Cost (Income)
The components of net periodic cost (income) are as follows for the years ended December 31:
Pension Benefits Other PostretirementBenefits
2018 2017 2016 2018 2017 2016Service cost $ 21 $ 37 $ 18 $ 2 $ 2 $ 2Interest cost 71 51 34 5 6 5Expected return on plan assets (121) (81) (46) — — —Amortization of prior service credit — — — (5) (3) (2)Amortization of net actuarial loss (gain) 10 12 14 (2) (2) —Curtailment / settlement loss (gain) 2 (45) (2) (26) (1) (5) 2 (2)Net periodic cost (income) $ (17) $ (26) $ (6) $ (5) $ 5 $ 3
(1) Primarily associated with two UK plans merging into the GE UK Pension Plan.
(2) As a result of the acquisition of Baker Hughes, we obtained a non-contributory pension plan (the Baker Hughes Incorporated Pension Plan or BHIPP). In 2017, the Compensation Committee of the Board of Directors approved amendments to the BHIPP to close the plan to new participants and freeze accruals of future service-related benefits effective as of December 31, 2017. As a result of these actions, the Company recorded a curtailment gain of $45 million. The curtailment was recorded by the Company during the fourth quarter of 2017 and included in the “Other non-operating income (loss), net” caption of the consolidated and combined statements of income (loss).
The service cost component of the net periodic cost (benefit) is included in "operating income (loss)" and all other components are included in "Other non operating income, net" caption of the consolidated and combined statements of income (loss).
Assumptions Used in Benefit Calculations
Accounting requirements necessitate the use of assumptions to reflect the uncertainties and the length of time over which the pension obligations will be paid. The actual amount of future benefit payments will depend upon when participants retire, the amount of their benefit at retirement and how long they live. To reflect the obligation in today’s dollars, we discount the future payments using a rate that matches the time frame over which the payments will be made. We also need to assume a long-term rate of return that will be earned on investments used to fund these payments.
Weighted average assumptions used to determine benefit obligations for these plans are as follows for the years ended December 31:
Pension Benefits Other PostretirementBenefits
2018 2017 2018 2017Discount rate 3.43% 2.99% 3.92% 3.32%Rate of compensation increase 3.78% 3.82% n/a n/a
Baker Hughes, a GE companyNotes to Consolidated and Combined Financial Statements

80 | BHGE 2018 FORM 10-K
Weighted average assumptions used to determine net periodic cost for these plans are as follows for the years ended December 31:
Pension Benefits Other Postretirement Benefits
2018 2017 2016 2018 2017 2016Discount rate 2.99% 3.24% 3.83% 3.32% 3.72% 4.25%Expected long-term return on plan assets 5.94% 6.26% 6.86% n/a n/a n/a
We determine the discount rate using a bond matching model, whereby the weighted average yields on high-quality fixed-income securities have maturities consistent with the timing of benefit payments. Lower discount rates increase the size of the benefit obligations and pension expense in the following year; higher discount rates reduce the size of the benefit obligation and subsequent-year pension expense. The compensation assumption is used in our active plans to estimate the annual rate at which pay of plan participants will grow. If the rate of growth assumed increases, the size of the pension obligations will increase.
The expected return on plan assets is the estimated long-term rate of return that will be earned on the investments used to fund the pension obligations. To determine this rate, we consider the current and target composition of plan investments, our historical returns earned, and our expectations about the future.
Assumed health care cost trend rates can have a significant effect on the amounts reported for Other Postretirement Benefits. As of December 31, 2018, the health care cost trend rate was 6.50%, declining gradually each successive year until it reaches 4.68%. A one percentage point change in assumed health care cost trend rates would have been immaterial in 2018.
Accumulated Other Comprehensive Loss
The amount recorded before-tax in accumulated other comprehensive loss related to employee benefit plans consists of the following at December 31:
Pension Benefits Other PostretirementBenefits
2018 2017 2018 2017Net actuarial loss (gain) $ 177 $ 117 $ (29) $ (16)Net prior service cost (credit) 20 — (18) (25)Total $ 197 $ 117 $ (47) $ (41)
The estimated net actuarial loss and prior service cost for the defined benefit pension plans that will be amortized from accumulated other comprehensive loss and included in net periodic benefit cost in 2019 is $15 million and $1 million, respectively. The estimated net actuarial gain and prior service credit for the other postretirement benefits that will be amortized from accumulated other comprehensive loss and included in net periodic benefit cost in 2019 is $7 million and $3 million, respectively.
Plan Assets
We have investment committees that meet regularly to review the portfolio returns and to determine asset-mix targets based on asset/liability studies. Third-party investment consultants assist such committees in developing asset allocation strategies to determine our expected rates of return and expected risk for various investment portfolios. The investment committees considered these strategies in the formal establishment of the current asset-mix targets based on the projected risk and return levels for all major asset classes.
Baker Hughes, a GE companyNotes to Consolidated and Combined Financial Statements
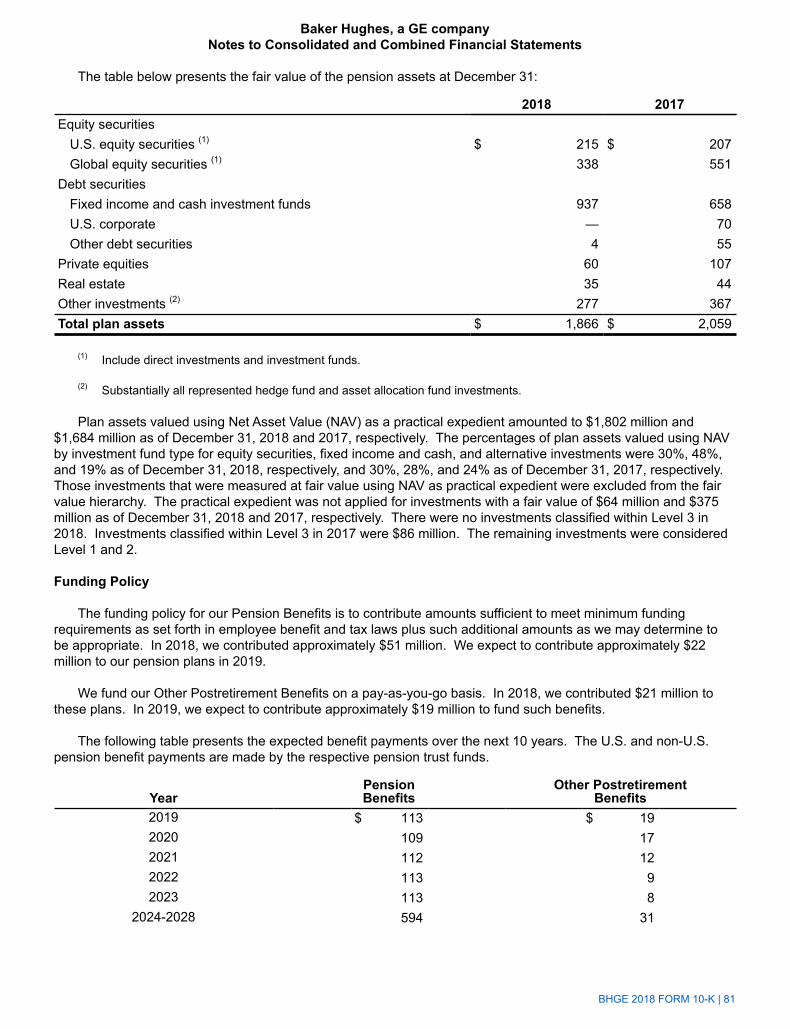
BHGE 2018 FORM 10-K | 81
The table below presents the fair value of the pension assets at December 31:
2018 2017Equity securities
U.S. equity securities (1) $ 215 $ 207Global equity securities (1) 338 551
Debt securitiesFixed income and cash investment funds 937 658U.S. corporate — 70Other debt securities 4 55
Private equities 60 107Real estate 35 44Other investments (2) 277 367Total plan assets $ 1,866 $ 2,059
(1) Include direct investments and investment funds.
(2) Substantially all represented hedge fund and asset allocation fund investments.
Plan assets valued using Net Asset Value (NAV) as a practical expedient amounted to $1,802 million and $1,684 million as of December 31, 2018 and 2017, respectively. The percentages of plan assets valued using NAV by investment fund type for equity securities, fixed income and cash, and alternative investments were 30%, 48%, and 19% as of December 31, 2018, respectively, and 30%, 28%, and 24% as of December 31, 2017, respectively. Those investments that were measured at fair value using NAV as practical expedient were excluded from the fair value hierarchy. The practical expedient was not applied for investments with a fair value of $64 million and $375 million as of December 31, 2018 and 2017, respectively. There were no investments classified within Level 3 in 2018. Investments classified within Level 3 in 2017 were $86 million. The remaining investments were considered Level 1 and 2.
Funding Policy
The funding policy for our Pension Benefits is to contribute amounts sufficient to meet minimum funding requirements as set forth in employee benefit and tax laws plus such additional amounts as we may determine to be appropriate. In 2018, we contributed approximately $51 million. We expect to contribute approximately $22 million to our pension plans in 2019.
We fund our Other Postretirement Benefits on a pay-as-you-go basis. In 2018, we contributed $21 million to these plans. In 2019, we expect to contribute approximately $19 million to fund such benefits.
The following table presents the expected benefit payments over the next 10 years. The U.S. and non-U.S. pension benefit payments are made by the respective pension trust funds.
YearPensionBenefits
Other PostretirementBenefits
2019 $ 113 $ 192020 109 172021 112 122022 113 92023 113 8
2024-2028 594 31
Baker Hughes, a GE companyNotes to Consolidated and Combined Financial Statements
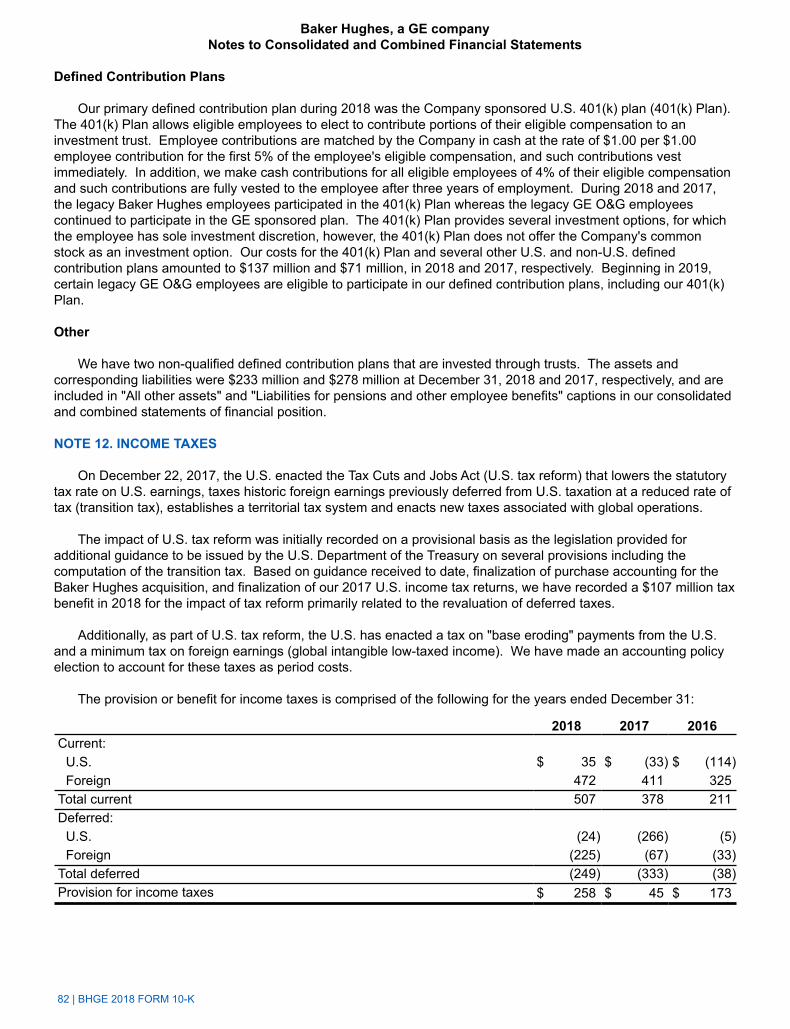
82 | BHGE 2018 FORM 10-K
Defined Contribution Plans
Our primary defined contribution plan during 2018 was the Company sponsored U.S. 401(k) plan (401(k) Plan). The 401(k) Plan allows eligible employees to elect to contribute portions of their eligible compensation to an investment trust. Employee contributions are matched by the Company in cash at the rate of $1.00 per $1.00 employee contribution for the first 5% of the employee's eligible compensation, and such contributions vest immediately. In addition, we make cash contributions for all eligible employees of 4% of their eligible compensation and such contributions are fully vested to the employee after three years of employment. During 2018 and 2017, the legacy Baker Hughes employees participated in the 401(k) Plan whereas the legacy GE O&G employees continued to participate in the GE sponsored plan. The 401(k) Plan provides several investment options, for which the employee has sole investment discretion, however, the 401(k) Plan does not offer the Company's common stock as an investment option. Our costs for the 401(k) Plan and several other U.S. and non-U.S. defined contribution plans amounted to $137 million and $71 million, in 2018 and 2017, respectively. Beginning in 2019, certain legacy GE O&G employees are eligible to participate in our defined contribution plans, including our 401(k) Plan.
Other
We have two non-qualified defined contribution plans that are invested through trusts. The assets and corresponding liabilities were $233 million and $278 million at December 31, 2018 and 2017, respectively, and are included in "All other assets" and "Liabilities for pensions and other employee benefits" captions in our consolidated and combined statements of financial position.
NOTE 12. INCOME TAXES
On December 22, 2017, the U.S. enacted the Tax Cuts and Jobs Act (U.S. tax reform) that lowers the statutory tax rate on U.S. earnings, taxes historic foreign earnings previously deferred from U.S. taxation at a reduced rate of tax (transition tax), establishes a territorial tax system and enacts new taxes associated with global operations.
The impact of U.S. tax reform was initially recorded on a provisional basis as the legislation provided for additional guidance to be issued by the U.S. Department of the Treasury on several provisions including the computation of the transition tax. Based on guidance received to date, finalization of purchase accounting for the Baker Hughes acquisition, and finalization of our 2017 U.S. income tax returns, we have recorded a $107 million tax benefit in 2018 for the impact of tax reform primarily related to the revaluation of deferred taxes.
Additionally, as part of U.S. tax reform, the U.S. has enacted a tax on "base eroding" payments from the U.S. and a minimum tax on foreign earnings (global intangible low-taxed income). We have made an accounting policy election to account for these taxes as period costs.
The provision or benefit for income taxes is comprised of the following for the years ended December 31:
2018 2017 2016Current:
U.S. $ 35 $ (33) $ (114)Foreign 472 411 325
Total current 507 378 211Deferred:
U.S. (24) (266) (5)Foreign (225) (67) (33)
Total deferred (249) (333) (38)Provision for income taxes $ 258 $ 45 $ 173
Baker Hughes, a GE companyNotes to Consolidated and Combined Financial Statements

BHGE 2018 FORM 10-K | 83
The geographic sources of income (loss) before income taxes, inclusive of equity in loss of affiliate are as follows for the years ended December 31:
2018 2017 2016U.S. $ (672) $ (1,189) $ (487)Foreign 1,213 843 845Income (loss) before income taxes, inclusive of equity in loss of affiliate $ 541 $ (346) $ 358
The benefit or provision for income taxes differs from the amount computed by applying the U.S. statutory income tax rate to the loss or income before income taxes for the reasons set forth below for the years ended December 31:
2018 2017 2016Income (loss) before income taxes, inclusive of equity in loss of affiliate $ 541 $ (346) $ 358Taxes at the U.S. federal statutory income tax rate 114 (121) 125Effect of foreign operations 103 (19) (2)Tax impact of partnership structure 80 171 —Change in valuation allowances 87 169 28Tax Cuts and Jobs Act enactment (107) (132) —Other - net (19) (23) 22
Provision for income taxes $ 258 $ 45 $ 173Actual income tax rate 47.7% (13.0)% 48.3%
Deferred income taxes reflect the net tax effects of temporary differences between the carrying amounts of assets and liabilities for financial reporting purposes and the amounts used for income tax purposes, as well as operating loss and tax credit carryforwards.
The tax effects of our temporary differences and carryforwards are as follows at December 31:
2018 2017Deferred tax assets:
Receivables $ 117 $ 98Inventory 79 63Property 191 144Goodwill and other intangibles 132 —Employee benefits 97 64Investment in partnership 228 74Other accrued expenses 74 91Operating loss carryforwards 1,525 1,376Tax credit carryforwards 653 554
Other 232 498Total deferred income tax asset 3,328 2,962 Valuation allowances (2,372) (2,484)Total deferred income tax asset after valuation allowance 956 478Deferred tax liabilities:
Goodwill and other intangibles — (202)Undistributed earnings of foreign subsidiaries (9) —
Other (18) (51)Total deferred income tax liability (27) (253)Net deferred tax asset $ 929 $ 225
Baker Hughes, a GE companyNotes to Consolidated and Combined Financial Statements
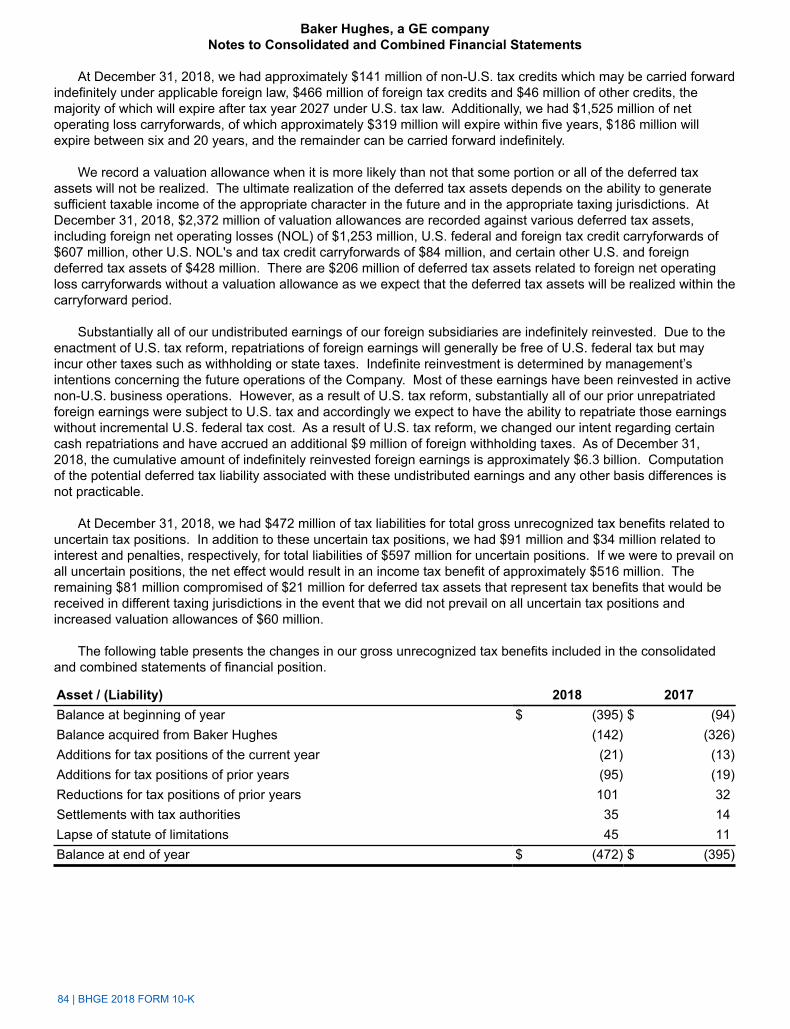
84 | BHGE 2018 FORM 10-K
At December 31, 2018, we had approximately $141 million of non-U.S. tax credits which may be carried forward indefinitely under applicable foreign law, $466 million of foreign tax credits and $46 million of other credits, the majority of which will expire after tax year 2027 under U.S. tax law. Additionally, we had $1,525 million of net operating loss carryforwards, of which approximately $319 million will expire within five years, $186 million will expire between six and 20 years, and the remainder can be carried forward indefinitely.
We record a valuation allowance when it is more likely than not that some portion or all of the deferred tax assets will not be realized. The ultimate realization of the deferred tax assets depends on the ability to generate sufficient taxable income of the appropriate character in the future and in the appropriate taxing jurisdictions. At December 31, 2018, $2,372 million of valuation allowances are recorded against various deferred tax assets, including foreign net operating losses (NOL) of $1,253 million, U.S. federal and foreign tax credit carryforwards of $607 million, other U.S. NOL's and tax credit carryforwards of $84 million, and certain other U.S. and foreign deferred tax assets of $428 million. There are $206 million of deferred tax assets related to foreign net operating loss carryforwards without a valuation allowance as we expect that the deferred tax assets will be realized within the carryforward period.
Substantially all of our undistributed earnings of our foreign subsidiaries are indefinitely reinvested. Due to the enactment of U.S. tax reform, repatriations of foreign earnings will generally be free of U.S. federal tax but may incur other taxes such as withholding or state taxes. Indefinite reinvestment is determined by management’s intentions concerning the future operations of the Company. Most of these earnings have been reinvested in active non-U.S. business operations. However, as a result of U.S. tax reform, substantially all of our prior unrepatriated foreign earnings were subject to U.S. tax and accordingly we expect to have the ability to repatriate those earnings without incremental U.S. federal tax cost. As a result of U.S. tax reform, we changed our intent regarding certain cash repatriations and have accrued an additional $9 million of foreign withholding taxes. As of December 31, 2018, the cumulative amount of indefinitely reinvested foreign earnings is approximately $6.3 billion. Computation of the potential deferred tax liability associated with these undistributed earnings and any other basis differences is not practicable.
At December 31, 2018, we had $472 million of tax liabilities for total gross unrecognized tax benefits related to uncertain tax positions. In addition to these uncertain tax positions, we had $91 million and $34 million related to interest and penalties, respectively, for total liabilities of $597 million for uncertain positions. If we were to prevail on all uncertain positions, the net effect would result in an income tax benefit of approximately $516 million. The remaining $81 million compromised of $21 million for deferred tax assets that represent tax benefits that would be received in different taxing jurisdictions in the event that we did not prevail on all uncertain tax positions and increased valuation allowances of $60 million.
The following table presents the changes in our gross unrecognized tax benefits included in the consolidated and combined statements of financial position.
Asset / (Liability) 2018 2017Balance at beginning of year $ (395) $ (94)Balance acquired from Baker Hughes (142) (326)Additions for tax positions of the current year (21) (13)Additions for tax positions of prior years (95) (19)Reductions for tax positions of prior years 101 32Settlements with tax authorities 35 14Lapse of statute of limitations 45 11Balance at end of year $ (472) $ (395)
Baker Hughes, a GE companyNotes to Consolidated and Combined Financial Statements

BHGE 2018 FORM 10-K | 85
It is expected that the amount of unrecognized tax benefits will change in the next twelve months due to expiring statutes, audit activity, tax payments, and competent authority proceedings related to transfer pricing or final decisions in matters that are the subject of litigation in various taxing jurisdictions in which we operate. At December 31, 2018, we had approximately $96 million of tax liabilities, net of $1 million of tax assets, related to uncertain tax positions, each of which are individually insignificant, and each of which are reasonably possible of being settled within the next twelve months.
We conduct business in more than 120 countries and are subject to income taxes in most taxing jurisdictions in which we operate. All Internal Revenue Service examinations have been completed and closed through year end 2015 for the most significant U.S. returns. We believe there are no other jurisdictions in which the outcome of unresolved issues or claims is likely to be material to our results of operations, financial position or cash flows. We further believe that we have made adequate provision for all income tax uncertainties.
NOTE 13. STOCK-BASED COMPENSATION
In July 2017, we adopted the BHGE 2017 Long-Term Incentive Plan (LTI Plan) under which we may grant stock options and other equity-based awards to employees and non-employee directors providing services to the Company and our subsidiaries. A total of up to 57.4 million shares of Class A common stock are authorized for issuance pursuant to awards granted under the LTI Plan over its term which expires on the date of the annual meeting of the Company in 2027. A total of 46.2 million shares of Class A common stock are available for issuance as of December 31, 2018.
Stock-based compensation cost was $121 million and $37 million in 2018 and 2017, respectively. Stock-based compensation cost is measured at the date of grant based on the calculated fair value of the award and is generally recognized on a straight-line basis over the vesting period of the equity grant. The compensation cost is determined based on awards ultimately expected to vest; therefore, we have reduced the cost for estimated forfeitures based on historical forfeiture rates. Forfeitures are estimated at the time of grant and revised, if necessary, in subsequent periods to reflect actual forfeitures. There were no stock-based compensation costs capitalized as the amounts were not material.
Stock Options
We may grant stock options to our officers, directors and key employees. Stock options generally vest in equal amounts over a three-year vesting period provided that the employee has remained continuously employed by the Company through such vesting date. The fair value of each stock option granted is estimated using the Black-Scholes option pricing model. The following table presents the weighted average assumptions used in the option pricing model for options granted under the LTI Plan. The expected life of the options represents the period of time the options are expected to be outstanding. The expected life is based on a simple average of the vesting term and original contractual term of the awards. The expected volatility is based on the historical volatility of our five main competitors over a six year period. The risk-free interest rate is based on the observed U.S. Treasury yield curve in effect at the time the options were granted. The dividend yield is based on a five year history of dividend payouts in Baker Hughes.
2018 2017Expected life (years) 6 6Risk-free interest rate 2.5% 2.1%Volatility 33.7% 36.4%Dividend yield 2% 1.2%Weighted average fair value per share at grant date $ 10.34 $ 12.32
Baker Hughes, a GE companyNotes to Consolidated and Combined Financial Statements
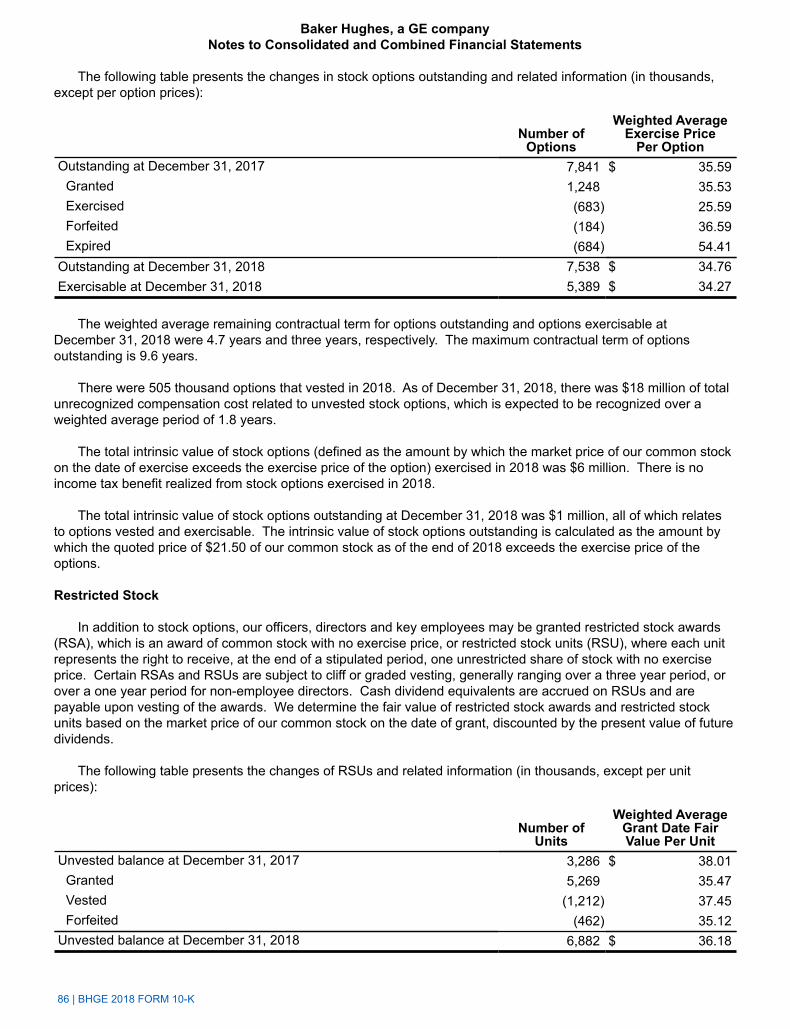
86 | BHGE 2018 FORM 10-K
The following table presents the changes in stock options outstanding and related information (in thousands, except per option prices):
Number ofOptions
Weighted AverageExercise Price
Per OptionOutstanding at December 31, 2017 7,841 $ 35.59
Granted 1,248 35.53Exercised (683) 25.59Forfeited (184) 36.59Expired (684) 54.41
Outstanding at December 31, 2018 7,538 $ 34.76Exercisable at December 31, 2018 5,389 $ 34.27
The weighted average remaining contractual term for options outstanding and options exercisable at December 31, 2018 were 4.7 years and three years, respectively. The maximum contractual term of options outstanding is 9.6 years.
There were 505 thousand options that vested in 2018. As of December 31, 2018, there was $18 million of total unrecognized compensation cost related to unvested stock options, which is expected to be recognized over a weighted average period of 1.8 years.
The total intrinsic value of stock options (defined as the amount by which the market price of our common stock on the date of exercise exceeds the exercise price of the option) exercised in 2018 was $6 million. There is no income tax benefit realized from stock options exercised in 2018.
The total intrinsic value of stock options outstanding at December 31, 2018 was $1 million, all of which relates to options vested and exercisable. The intrinsic value of stock options outstanding is calculated as the amount by which the quoted price of $21.50 of our common stock as of the end of 2018 exceeds the exercise price of the options.
Restricted Stock
In addition to stock options, our officers, directors and key employees may be granted restricted stock awards (RSA), which is an award of common stock with no exercise price, or restricted stock units (RSU), where each unit represents the right to receive, at the end of a stipulated period, one unrestricted share of stock with no exercise price. Certain RSAs and RSUs are subject to cliff or graded vesting, generally ranging over a three year period, or over a one year period for non-employee directors. Cash dividend equivalents are accrued on RSUs and are payable upon vesting of the awards. We determine the fair value of restricted stock awards and restricted stock units based on the market price of our common stock on the date of grant, discounted by the present value of future dividends.
The following table presents the changes of RSUs and related information (in thousands, except per unit prices):
Number ofUnits
Weighted AverageGrant Date FairValue Per Unit
Unvested balance at December 31, 2017 3,286 $ 38.01Granted 5,269 35.47Vested (1,212) 37.45Forfeited (462) 35.12
Unvested balance at December 31, 2018 6,882 $ 36.18
Baker Hughes, a GE companyNotes to Consolidated and Combined Financial Statements
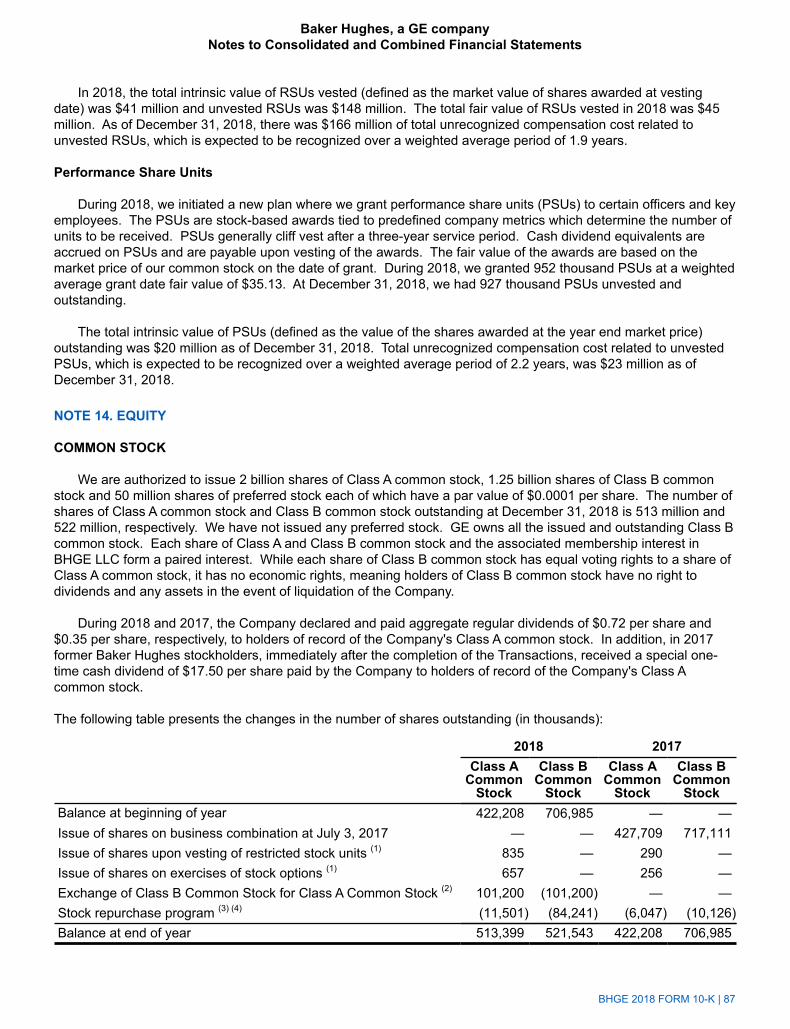
BHGE 2018 FORM 10-K | 87
In 2018, the total intrinsic value of RSUs vested (defined as the market value of shares awarded at vesting date) was $41 million and unvested RSUs was $148 million. The total fair value of RSUs vested in 2018 was $45 million. As of December 31, 2018, there was $166 million of total unrecognized compensation cost related to unvested RSUs, which is expected to be recognized over a weighted average period of 1.9 years.
Performance Share Units
During 2018, we initiated a new plan where we grant performance share units (PSUs) to certain officers and key employees. The PSUs are stock-based awards tied to predefined company metrics which determine the number of units to be received. PSUs generally cliff vest after a three-year service period. Cash dividend equivalents are accrued on PSUs and are payable upon vesting of the awards. The fair value of the awards are based on the market price of our common stock on the date of grant. During 2018, we granted 952 thousand PSUs at a weighted average grant date fair value of $35.13. At December 31, 2018, we had 927 thousand PSUs unvested and outstanding.
The total intrinsic value of PSUs (defined as the value of the shares awarded at the year end market price) outstanding was $20 million as of December 31, 2018. Total unrecognized compensation cost related to unvested PSUs, which is expected to be recognized over a weighted average period of 2.2 years, was $23 million as of December 31, 2018.
NOTE 14. EQUITY
COMMON STOCK
We are authorized to issue 2 billion shares of Class A common stock, 1.25 billion shares of Class B common stock and 50 million shares of preferred stock each of which have a par value of $0.0001 per share. The number of shares of Class A common stock and Class B common stock outstanding at December 31, 2018 is 513 million and 522 million, respectively. We have not issued any preferred stock. GE owns all the issued and outstanding Class B common stock. Each share of Class A and Class B common stock and the associated membership interest in BHGE LLC form a paired interest. While each share of Class B common stock has equal voting rights to a share of Class A common stock, it has no economic rights, meaning holders of Class B common stock have no right to dividends and any assets in the event of liquidation of the Company.
During 2018 and 2017, the Company declared and paid aggregate regular dividends of $0.72 per share and $0.35 per share, respectively, to holders of record of the Company's Class A common stock. In addition, in 2017 former Baker Hughes stockholders, immediately after the completion of the Transactions, received a special one-time cash dividend of $17.50 per share paid by the Company to holders of record of the Company's Class A common stock.
The following table presents the changes in the number of shares outstanding (in thousands):
2018 2017Class A
CommonStock
Class BCommon
Stock
Class ACommon
Stock
Class BCommon
StockBalance at beginning of year 422,208 706,985 — —Issue of shares on business combination at July 3, 2017 — — 427,709 717,111Issue of shares upon vesting of restricted stock units (1) 835 — 290 —Issue of shares on exercises of stock options (1) 657 — 256 —Exchange of Class B Common Stock for Class A Common Stock (2) 101,200 (101,200) — —Stock repurchase program (3) (4) (11,501) (84,241) (6,047) (10,126)Balance at end of year 513,399 521,543 422,208 706,985
Baker Hughes, a GE companyNotes to Consolidated and Combined Financial Statements
88 | BHGE 2018 FORM 10-K
(1) Share amounts reflected above are net of shares withheld to satisfy the employee's tax withholding obligation.
(2) In November 2018, we completed an underwritten secondary public offering in which GE and its affiliates sold 101.2 million shares of our Class A common stock. We did not receive any proceeds from the shares sold by GE and its affiliates in this offering. The offering included the exchange of BHGE LLC Units (together with the corresponding shares of Class B common stock) for Class A common stock by GE and its affiliates per the Exchange Agreement.
(3) In November 2017, our board of directors authorized BHGE LLC to repurchase up to $3 billion of its common units from the Company and GE. The $3 billion repurchase authorization is the aggregate authorization for repurchases of Class A common stock and Class B common stock together with its paired common unit. As of December 31, 2018, the stock repurchase program has been substantially completed.
(4) During 2018, we repurchased and canceled 11,500,992 shares of Class A common stock for a total of $374 million and 19,241,160 shares of Class B common stock from GE together with the paired common units of BHGE LLC for $626 million. Additionally, in November 2018, we also repurchased 65 million of BHGE LLC Units from GE and its affiliates for an aggregate of $1,461 million, or $22.48 per share, which is the same per share price, net of discounts and commissions paid by the underwriters to GE and its affiliates in the underwritten public offering. In connection with this repurchase, the corresponding shares of Class B common stock held by GE and its affiliates were canceled.
As a result of the exchange of shares in the secondary offering and the BHGE LLC Units repurchased in November 2018, GE's economic interest in BHGE LLC reduced during the fourth quarter of 2018 from approximately 62.5% to approximately 50.4%. The effect of this change in ownership resulted in a decrease in noncontrolling interests of $3,761 million and accumulated other comprehensive income of $282 million with a corresponding increase in capital in excess of par value totaling $4,043 million.
Baker Hughes, a GE companyNotes to Consolidated and Combined Financial Statements

BHGE 2018 FORM 10-K | 89
ACCUMULATED OTHER COMPREHENSIVE LOSS (AOCL)
The following table presents the changes in accumulated other comprehensive loss, net of tax:
InvestmentSecurities
ForeignCurrency
TranslationAdjustments
Cash FlowHedges
BenefitPlans
AccumulatedOther
ComprehensiveLoss
Balance at December 31, 2016 $ — $ (1,795) $ (10) $ (83) $ (1,888)Other comprehensive income (loss) before
reclassifications 41 (4) 8 45 90Amounts reclassified from accumulated
other comprehensive loss (39) — 7 1 (31)Deferred taxes 2 (10) (3) 9 (2)
Other comprehensive income (loss) 4 (14) 12 55 57Less: Other comprehensive income
attributable to noncontrolling interests 3 38 2 37 80Less: Other adjustments — — — 13 13Less: Reallocation of AOCL based on
ownership of GE and previous BakerHughes stockholders — (1,170) (1) (63) (1,234)
Less: Activity related to noncontrolling interest — 5 — 8 13Balance at December 31, 2017 1 (682) 1 (23) (703)
Other comprehensive loss beforereclassifications (1) (502) (6) (70) (579)
Amounts reclassified from accumulatedother comprehensive loss — — 1 5 6Deferred taxes (2) — 1 1 —
Other comprehensive loss (3) (502) (4) (64) (573)Less: Other comprehensive loss attributable to
noncontrolling interests (2) (303) (2) (36) (343)Less: Reallocation of AOCL based on change
in ownership of BHGE LLC Units — 271 — 11 282Less: Activity related to noncontrolling interest — — — 4 4Balance at December 31, 2018 $ — $ (1,152) $ (1) $ (66) $ (1,219)
The amounts reclassified from accumulated other comprehensive loss during the years ended December 31, 2018 and 2017 represent (i) realized gains (losses) on investment securities recorded in other non operating income, net (ii) gains (losses) reclassified on cash flow hedges when the hedged transaction occurs and (iii) the amortization of net actuarial loss and prior service credit, and curtailments which are included in the computation of net periodic pension cost (see "Note 11. Employee Benefit Plans" for additional details). Net periodic pension cost is recorded across the various cost and expense line items within the consolidated and combined statements of income (loss).
Baker Hughes, a GE companyNotes to Consolidated and Combined Financial Statements
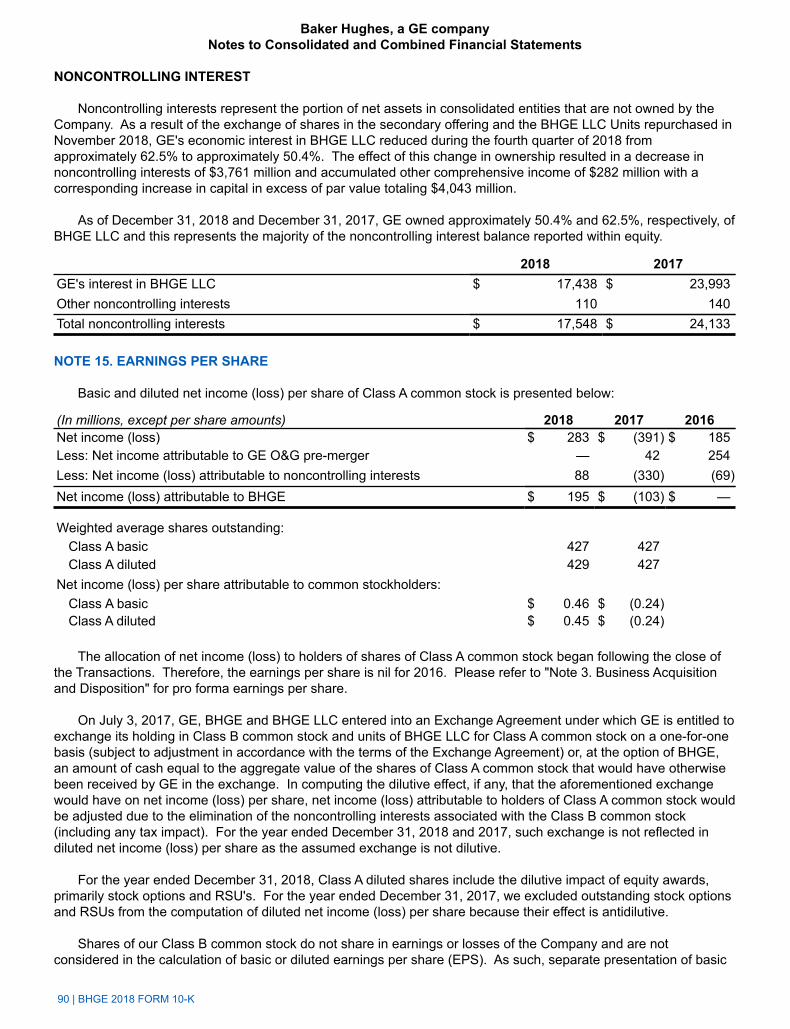
90 | BHGE 2018 FORM 10-K
NONCONTROLLING INTEREST
Noncontrolling interests represent the portion of net assets in consolidated entities that are not owned by the Company. As a result of the exchange of shares in the secondary offering and the BHGE LLC Units repurchased in November 2018, GE's economic interest in BHGE LLC reduced during the fourth quarter of 2018 from approximately 62.5% to approximately 50.4%. The effect of this change in ownership resulted in a decrease in noncontrolling interests of $3,761 million and accumulated other comprehensive income of $282 million with a corresponding increase in capital in excess of par value totaling $4,043 million.
As of December 31, 2018 and December 31, 2017, GE owned approximately 50.4% and 62.5%, respectively, of BHGE LLC and this represents the majority of the noncontrolling interest balance reported within equity.
2018 2017GE's interest in BHGE LLC $ 17,438 $ 23,993Other noncontrolling interests 110 140Total noncontrolling interests $ 17,548 $ 24,133
NOTE 15. EARNINGS PER SHARE
Basic and diluted net income (loss) per share of Class A common stock is presented below:
(In millions, except per share amounts) 2018 2017 2016Net income (loss) $ 283 $ (391) $ 185Less: Net income attributable to GE O&G pre-merger — 42 254Less: Net income (loss) attributable to noncontrolling interests 88 (330) (69)Net income (loss) attributable to BHGE $ 195 $ (103) $ —
Weighted average shares outstanding:Class A basic 427 427Class A diluted 429 427
Net income (loss) per share attributable to common stockholders:Class A basic $ 0.46 $ (0.24)Class A diluted $ 0.45 $ (0.24)
The allocation of net income (loss) to holders of shares of Class A common stock began following the close of the Transactions. Therefore, the earnings per share is nil for 2016. Please refer to "Note 3. Business Acquisition and Disposition" for pro forma earnings per share.
On July 3, 2017, GE, BHGE and BHGE LLC entered into an Exchange Agreement under which GE is entitled to exchange its holding in Class B common stock and units of BHGE LLC for Class A common stock on a one-for-one basis (subject to adjustment in accordance with the terms of the Exchange Agreement) or, at the option of BHGE, an amount of cash equal to the aggregate value of the shares of Class A common stock that would have otherwise been received by GE in the exchange. In computing the dilutive effect, if any, that the aforementioned exchange would have on net income (loss) per share, net income (loss) attributable to holders of Class A common stock would be adjusted due to the elimination of the noncontrolling interests associated with the Class B common stock (including any tax impact). For the year ended December 31, 2018 and 2017, such exchange is not reflected in diluted net income (loss) per share as the assumed exchange is not dilutive.
For the year ended December 31, 2018, Class A diluted shares include the dilutive impact of equity awards, primarily stock options and RSU's. For the year ended December 31, 2017, we excluded outstanding stock options and RSUs from the computation of diluted net income (loss) per share because their effect is antidilutive.
Shares of our Class B common stock do not share in earnings or losses of the Company and are not considered in the calculation of basic or diluted earnings per share (EPS). As such, separate presentation of basic
Baker Hughes, a GE companyNotes to Consolidated and Combined Financial Statements
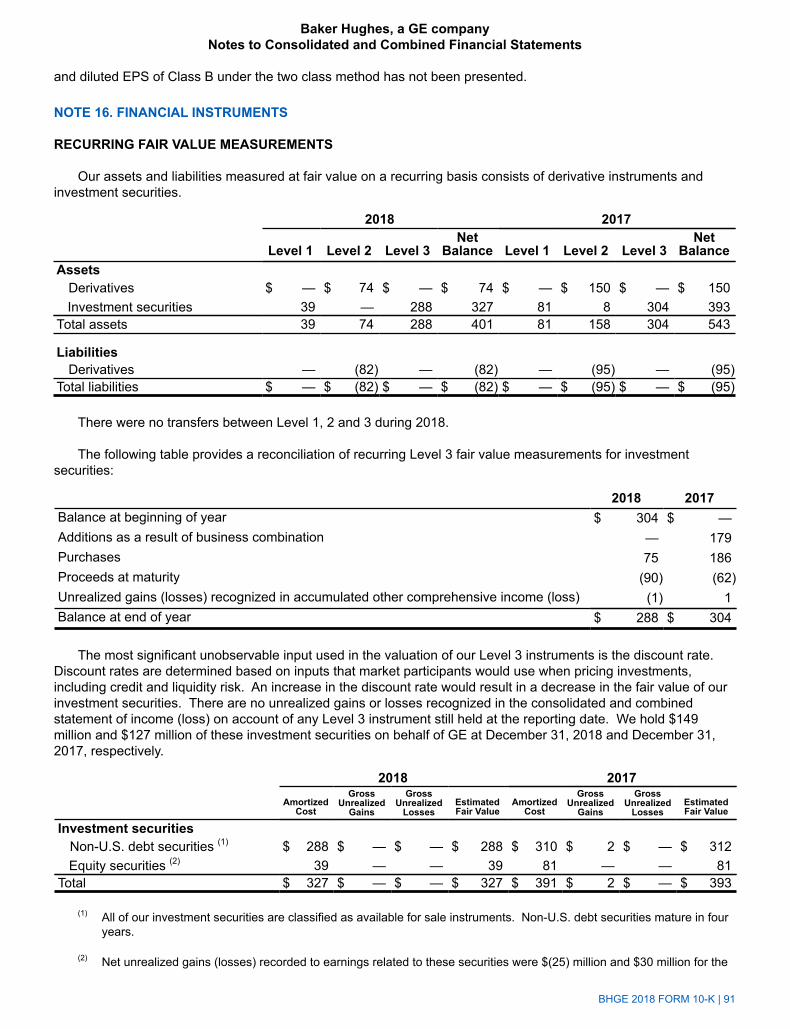
BHGE 2018 FORM 10-K | 91
and diluted EPS of Class B under the two class method has not been presented.
NOTE 16. FINANCIAL INSTRUMENTS
RECURRING FAIR VALUE MEASUREMENTS
Our assets and liabilities measured at fair value on a recurring basis consists of derivative instruments and investment securities.
2018 2017
Level 1 Level 2 Level 3Net
Balance Level 1 Level 2 Level 3Net
BalanceAssets
Derivatives $ — $ 74 $ — $ 74 $ — $ 150 $ — $ 150 Investment securities 39 — 288 327 81 8 304 393Total assets 39 74 288 401 81 158 304 543
Liabilities Derivatives — (82) — (82) — (95) — (95)
Total liabilities $ — $ (82) $ — $ (82) $ — $ (95) $ — $ (95)
There were no transfers between Level 1, 2 and 3 during 2018.
The following table provides a reconciliation of recurring Level 3 fair value measurements for investment securities:
2018 2017Balance at beginning of year $ 304 $ —Additions as a result of business combination — 179Purchases 75 186Proceeds at maturity (90) (62)Unrealized gains (losses) recognized in accumulated other comprehensive income (loss) (1) 1Balance at end of year $ 288 $ 304
The most significant unobservable input used in the valuation of our Level 3 instruments is the discount rate. Discount rates are determined based on inputs that market participants would use when pricing investments, including credit and liquidity risk. An increase in the discount rate would result in a decrease in the fair value of our investment securities. There are no unrealized gains or losses recognized in the consolidated and combined statement of income (loss) on account of any Level 3 instrument still held at the reporting date. We hold $149 million and $127 million of these investment securities on behalf of GE at December 31, 2018 and December 31, 2017, respectively.
2018 2017Amortized
Cost
GrossUnrealized
Gains
GrossUnrealized
LossesEstimatedFair Value
AmortizedCost
GrossUnrealized
Gains
GrossUnrealized
LossesEstimatedFair Value
Investment securities Non-U.S. debt securities (1) $ 288 $ — $ — $ 288 $ 310 $ 2 $ — $ 312
Equity securities (2) 39 — — 39 81 — — 81Total $ 327 $ — $ — $ 327 $ 391 $ 2 $ — $ 393
(1) All of our investment securities are classified as available for sale instruments. Non-U.S. debt securities mature in four years.
(2) Net unrealized gains (losses) recorded to earnings related to these securities were $(25) million and $30 million for the
Baker Hughes, a GE companyNotes to Consolidated and Combined Financial Statements
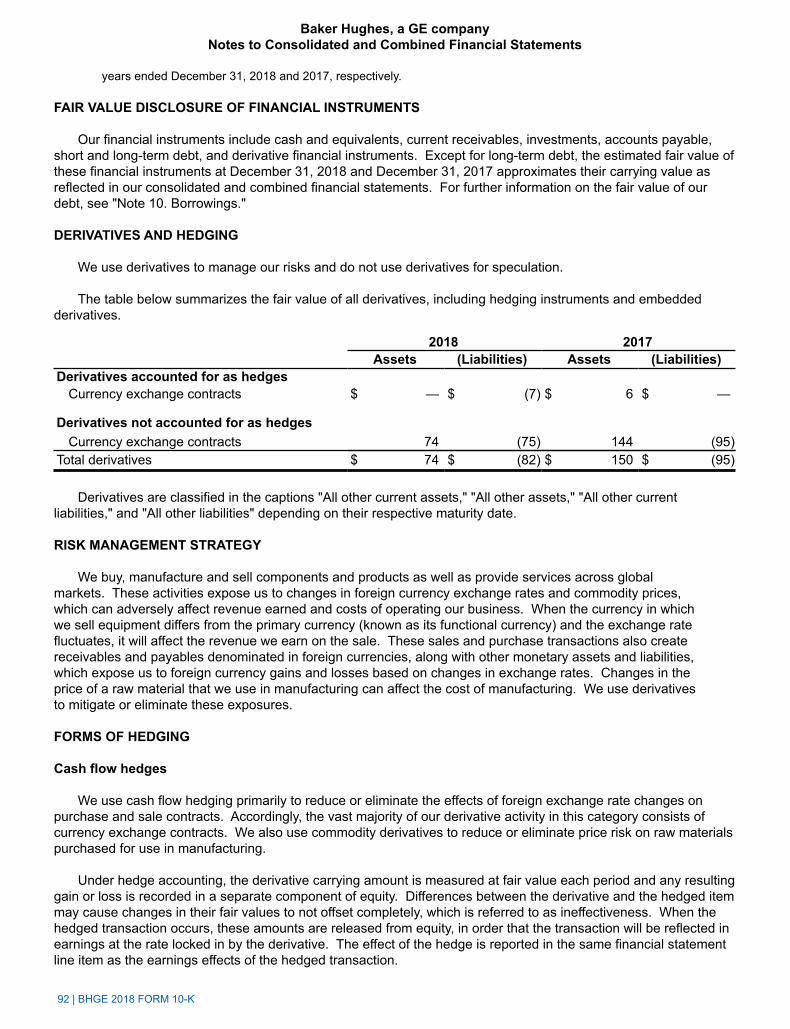
92 | BHGE 2018 FORM 10-K
years ended December 31, 2018 and 2017, respectively.
FAIR VALUE DISCLOSURE OF FINANCIAL INSTRUMENTS
Our financial instruments include cash and equivalents, current receivables, investments, accounts payable, short and long-term debt, and derivative financial instruments. Except for long-term debt, the estimated fair value of these financial instruments at December 31, 2018 and December 31, 2017 approximates their carrying value as reflected in our consolidated and combined financial statements. For further information on the fair value of our debt, see "Note 10. Borrowings."
DERIVATIVES AND HEDGING
We use derivatives to manage our risks and do not use derivatives for speculation.
The table below summarizes the fair value of all derivatives, including hedging instruments and embedded derivatives.
2018 2017Assets (Liabilities) Assets (Liabilities)
Derivatives accounted for as hedgesCurrency exchange contracts $ — $ (7) $ 6 $ —
Derivatives not accounted for as hedgesCurrency exchange contracts 74 (75) 144 (95)
Total derivatives $ 74 $ (82) $ 150 $ (95)
Derivatives are classified in the captions "All other current assets," "All other assets," "All other current liabilities," and "All other liabilities" depending on their respective maturity date.
RISK MANAGEMENT STRATEGY
We buy, manufacture and sell components and products as well as provide services across global markets. These activities expose us to changes in foreign currency exchange rates and commodity prices, which can adversely affect revenue earned and costs of operating our business. When the currency in which we sell equipment differs from the primary currency (known as its functional currency) and the exchange rate fluctuates, it will affect the revenue we earn on the sale. These sales and purchase transactions also create receivables and payables denominated in foreign currencies, along with other monetary assets and liabilities, which expose us to foreign currency gains and losses based on changes in exchange rates. Changes in the price of a raw material that we use in manufacturing can affect the cost of manufacturing. We use derivatives to mitigate or eliminate these exposures.
FORMS OF HEDGING
Cash flow hedges
We use cash flow hedging primarily to reduce or eliminate the effects of foreign exchange rate changes on purchase and sale contracts. Accordingly, the vast majority of our derivative activity in this category consists of currency exchange contracts. We also use commodity derivatives to reduce or eliminate price risk on raw materials purchased for use in manufacturing.
Under hedge accounting, the derivative carrying amount is measured at fair value each period and any resulting gain or loss is recorded in a separate component of equity. Differences between the derivative and the hedged item may cause changes in their fair values to not offset completely, which is referred to as ineffectiveness. When the hedged transaction occurs, these amounts are released from equity, in order that the transaction will be reflected in earnings at the rate locked in by the derivative. The effect of the hedge is reported in the same financial statement line item as the earnings effects of the hedged transaction.
Baker Hughes, a GE companyNotes to Consolidated and Combined Financial Statements

BHGE 2018 FORM 10-K | 93
The following table explains the effect of changes in market rates on the fair value of derivatives we use most commonly in cash flow hedging arrangements.
Currency forwards/swaps U.S. dollar strengthens U.S. dollar weakens Pay U.S. dollars/receive foreign currency Fair value decreases Fair value increases
Economic Hedges
These derivatives are not designated as hedges from an accounting standpoint (and therefore we do not apply hedge accounting to the relationship) but otherwise serve the same economic purpose as other hedging arrangements. Some economic hedges are used when changes in the carrying amount of the hedged item are already recorded in earnings in the same period as the derivative, making hedge accounting unnecessary. For some other types of economic hedges, changes in the fair value of the derivative are recorded in earnings currently but changes in the value of the forecasted foreign currency cash flows are only recognized in earnings when they occur. As a result, even though the derivative is an effective economic hedge, there is a net effect on earnings in each period due to differences in the timing of earnings recognition between the derivative and the hedged item.
These derivatives are marked to fair value through earnings each period. The effects are reported in "Selling, general and administrative expenses" in the consolidated and combined statement of income (loss). In general, the income (loss) effects of the hedged item are recorded in the same consolidated and combined financial statement line as the derivative. The income (loss) effect of economic hedges, after considering offsets related to income (loss) effects of hedged assets and liabilities, is substantially offset by changes in the fair value of forecasted transactions that have not yet affected income (loss).
The table below explains the effects of market rate changes on the fair value of derivatives we use most commonly as economic hedges.
Currency forwards/swaps U.S. dollar strengthens U.S. dollar weakens Pay U.S. dollars/receive foreign currency Fair value decreases Fair value increases Receive U.S. dollars/pay foreign currency Fair value increases Fair value decreases
Commodity derivatives Price increases Price decreases Receive commodity/ pay fixed price Fair value increases Fair value decreases
NOTIONAL AMOUNT OF DERIVATIVES
The notional amount of a derivative is the number of units of the underlying (for example, the notional principal amount of the debt in an interest rate swap). A substantial majority of the outstanding notional amount of $6.4 billion and $10.2 billion at December 31, 2018 and December 31, 2017, respectively, is related to hedges of anticipated sales and purchases in foreign currency, commodity purchases, and contractual terms in contracts that are considered embedded derivatives and for intercompany borrowings in foreign currencies. We generally disclose derivative notional amounts on a gross basis to indicate the total counterparty risk. Where we have gross purchase and sale derivative contracts for a particular currency, we look to execute these contracts with the same counterparty to reduce our exposure. The corresponding net notional amounts were $2.8 billion at December 31, 2018 and $3.3 billion at December 31, 2017.
The table below provides additional information about how derivatives are reflected in our consolidated and combined financial statements.
Carrying amount related to derivatives 2018 2017Derivative assets $ 74 $ 150Derivative liabilities (82) (95)Net derivatives $ (8) $ 55
Baker Hughes, a GE companyNotes to Consolidated and Combined Financial Statements
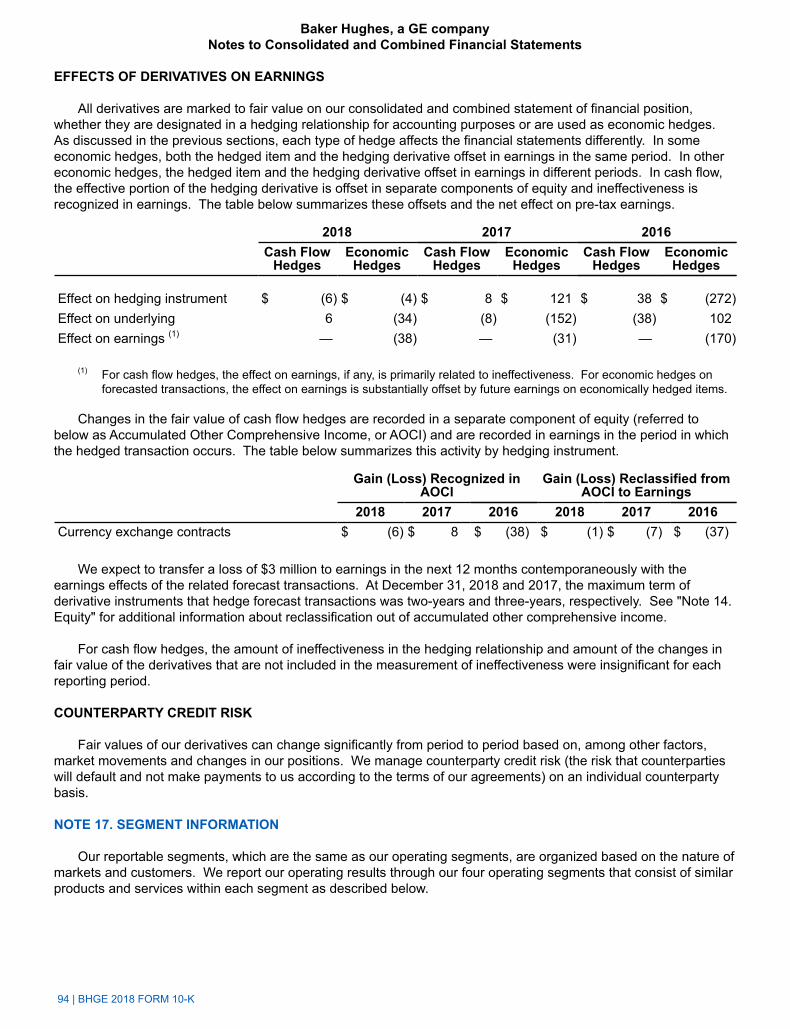
94 | BHGE 2018 FORM 10-K
EFFECTS OF DERIVATIVES ON EARNINGS
All derivatives are marked to fair value on our consolidated and combined statement of financial position, whether they are designated in a hedging relationship for accounting purposes or are used as economic hedges. As discussed in the previous sections, each type of hedge affects the financial statements differently. In some economic hedges, both the hedged item and the hedging derivative offset in earnings in the same period. In other economic hedges, the hedged item and the hedging derivative offset in earnings in different periods. In cash flow, the effective portion of the hedging derivative is offset in separate components of equity and ineffectiveness is recognized in earnings. The table below summarizes these offsets and the net effect on pre-tax earnings.
2018 2017 2016Cash Flow
HedgesEconomic
HedgesCash Flow
HedgesEconomic
HedgesCash Flow
HedgesEconomic
Hedges
Effect on hedging instrument $ (6) $ (4) $ 8 $ 121 $ 38 $ (272)Effect on underlying 6 (34) (8) (152) (38) 102Effect on earnings (1) — (38) — (31) — (170)
(1) For cash flow hedges, the effect on earnings, if any, is primarily related to ineffectiveness. For economic hedges on forecasted transactions, the effect on earnings is substantially offset by future earnings on economically hedged items.
Changes in the fair value of cash flow hedges are recorded in a separate component of equity (referred to below as Accumulated Other Comprehensive Income, or AOCI) and are recorded in earnings in the period in which the hedged transaction occurs. The table below summarizes this activity by hedging instrument.
Gain (Loss) Recognized inAOCI
Gain (Loss) Reclassified fromAOCI to Earnings
2018 2017 2016 2018 2017 2016Currency exchange contracts $ (6) $ 8 $ (38) $ (1) $ (7) $ (37)
We expect to transfer a loss of $3 million to earnings in the next 12 months contemporaneously with the earnings effects of the related forecast transactions. At December 31, 2018 and 2017, the maximum term of derivative instruments that hedge forecast transactions was two-years and three-years, respectively. See "Note 14. Equity" for additional information about reclassification out of accumulated other comprehensive income.
For cash flow hedges, the amount of ineffectiveness in the hedging relationship and amount of the changes in fair value of the derivatives that are not included in the measurement of ineffectiveness were insignificant for each reporting period.
COUNTERPARTY CREDIT RISK
Fair values of our derivatives can change significantly from period to period based on, among other factors, market movements and changes in our positions. We manage counterparty credit risk (the risk that counterparties will default and not make payments to us according to the terms of our agreements) on an individual counterparty basis.
NOTE 17. SEGMENT INFORMATION
Our reportable segments, which are the same as our operating segments, are organized based on the nature of markets and customers. We report our operating results through our four operating segments that consist of similar products and services within each segment as described below.
Baker Hughes, a GE companyNotes to Consolidated and Combined Financial Statements

BHGE 2018 FORM 10-K | 95
OILFIELD SERVICES
Oilfield Services provides products and services for onshore and offshore operations across the lifecycle of a well, ranging from drilling, evaluation, completion, production and intervention. Products and services include diamond and tri-cone drill bits, drilling services, including directional drilling technology, measurement while drilling & logging while drilling, downhole completion tools and systems, wellbore intervention tools and services, wireline services, drilling and completions fluids, oilfield and industrial chemicals, pressure pumping, and artificial lift technologies, including electrical submersible pumps.
OILFIELD EQUIPMENT
Oilfield Equipment provides a broad portfolio of products and services required to facilitate the safe and reliable flow of hydrocarbons from the subsea wellhead to the surface. Products and services include pressure control equipment and services, subsea production systems and services, drilling equipment, and flexible pipeline systems. Oilfield Equipment designs and manufactures onshore and offshore drilling and production systems and equipment for floating production platforms and provides a full range of services related to onshore and offshore drilling activities.
TURBOMACHINERY & PROCESS SOLUTIONS
Turbomachinery & Process Solutions provides equipment and related services for mechanical-drive, compression and power-generation applications across the oil and gas industry as well as products and services to serve the downstream segments of the industry including refining, petrochemical, distributed gas, flow and process control and other industrial applications. The Turbomachinery & Process Solutions portfolio includes drivers (aero-derivative gas turbines, heavy-duty gas turbines and synchronous and induction electric motors), compressors (centrifugal and axial, direct drive high speed, integrated, subsea compressors, turbo expanders and reciprocating), turn-key solutions (industrial modules and waste heat recovery), pumps, valves, and compressed natural gas (CNG) and small-scale liquefied natural gas (LNG) solutions used primarily for shale oil and gas field development.
DIGITAL SOLUTIONS
Digital Solutions provides equipment and services for a wide range of industries, including oil & gas, power generation, aerospace, metals, and transportation. The offerings include sensor-based measurement, non-destructive testing and inspection, turbine, generator and plant controls and condition monitoring, as well as pipeline integrity solutions.
SEGMENT RESULTS
Summarized financial information is shown in the following tables. Consistent accounting policies have been applied by all segments within the Company, for all reporting periods. The current year results, and balances, may not be comparable to prior years as the current year includes the results of Baker Hughes from July 3, 2017.
Segment revenue 2018 2017 2016Oilfield Services $ 11,617 $ 5,881 $ 788Oilfield Equipment 2,641 2,661 3,540Turbomachinery & Process Solutions 6,015 6,295 6,668Digital Solutions 2,604 2,342 2,086Total $ 22,877 $ 17,179 $ 13,082
Baker Hughes, a GE companyNotes to Consolidated and Combined Financial Statements
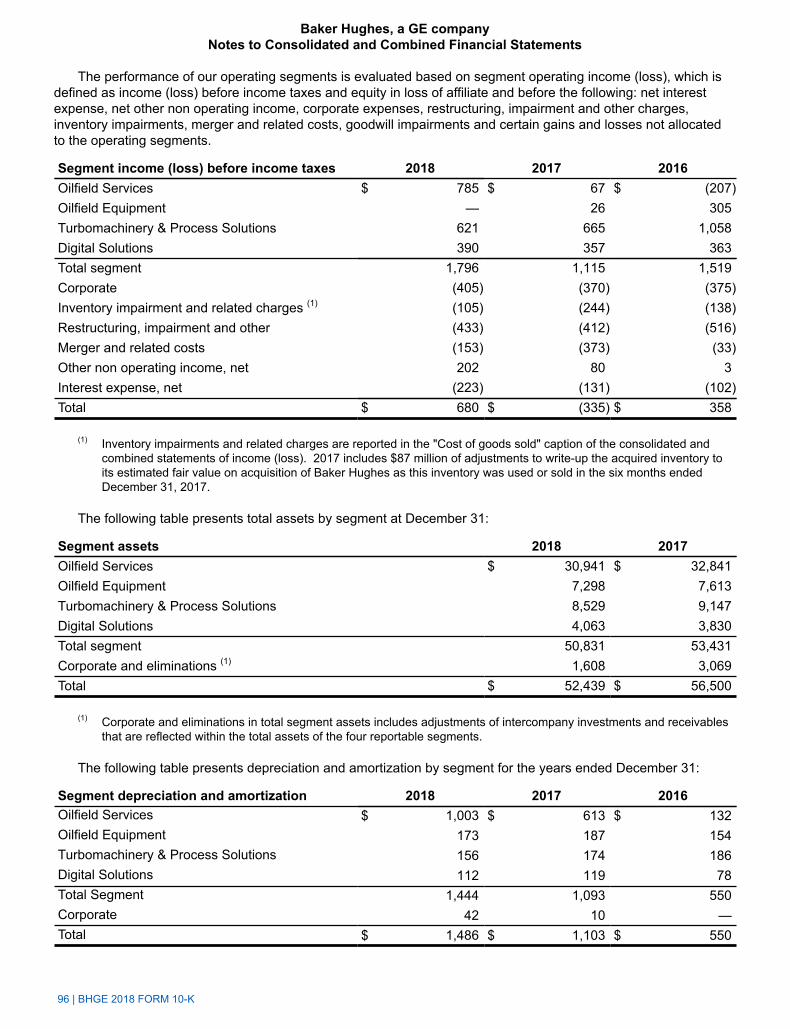
96 | BHGE 2018 FORM 10-K
The performance of our operating segments is evaluated based on segment operating income (loss), which is defined as income (loss) before income taxes and equity in loss of affiliate and before the following: net interest expense, net other non operating income, corporate expenses, restructuring, impairment and other charges, inventory impairments, merger and related costs, goodwill impairments and certain gains and losses not allocated to the operating segments.
Segment income (loss) before income taxes 2018 2017 2016Oilfield Services $ 785 $ 67 $ (207)Oilfield Equipment — 26 305Turbomachinery & Process Solutions 621 665 1,058Digital Solutions 390 357 363Total segment 1,796 1,115 1,519Corporate (405) (370) (375)Inventory impairment and related charges (1) (105) (244) (138)Restructuring, impairment and other (433) (412) (516)Merger and related costs (153) (373) (33)Other non operating income, net 202 80 3Interest expense, net (223) (131) (102)Total $ 680 $ (335) $ 358
(1) Inventory impairments and related charges are reported in the "Cost of goods sold" caption of the consolidated and combined statements of income (loss). 2017 includes $87 million of adjustments to write-up the acquired inventory to its estimated fair value on acquisition of Baker Hughes as this inventory was used or sold in the six months ended December 31, 2017.
The following table presents total assets by segment at December 31:
Segment assets 2018 2017Oilfield Services $ 30,941 $ 32,841Oilfield Equipment 7,298 7,613Turbomachinery & Process Solutions 8,529 9,147Digital Solutions 4,063 3,830Total segment 50,831 53,431Corporate and eliminations (1) 1,608 3,069Total $ 52,439 $ 56,500
(1) Corporate and eliminations in total segment assets includes adjustments of intercompany investments and receivables that are reflected within the total assets of the four reportable segments.
The following table presents depreciation and amortization by segment for the years ended December 31:
Segment depreciation and amortization 2018 2017 2016Oilfield Services $ 1,003 $ 613 $ 132Oilfield Equipment 173 187 154Turbomachinery & Process Solutions 156 174 186Digital Solutions 112 119 78Total Segment 1,444 1,093 550Corporate 42 10 —Total $ 1,486 $ 1,103 $ 550
Baker Hughes, a GE companyNotes to Consolidated and Combined Financial Statements
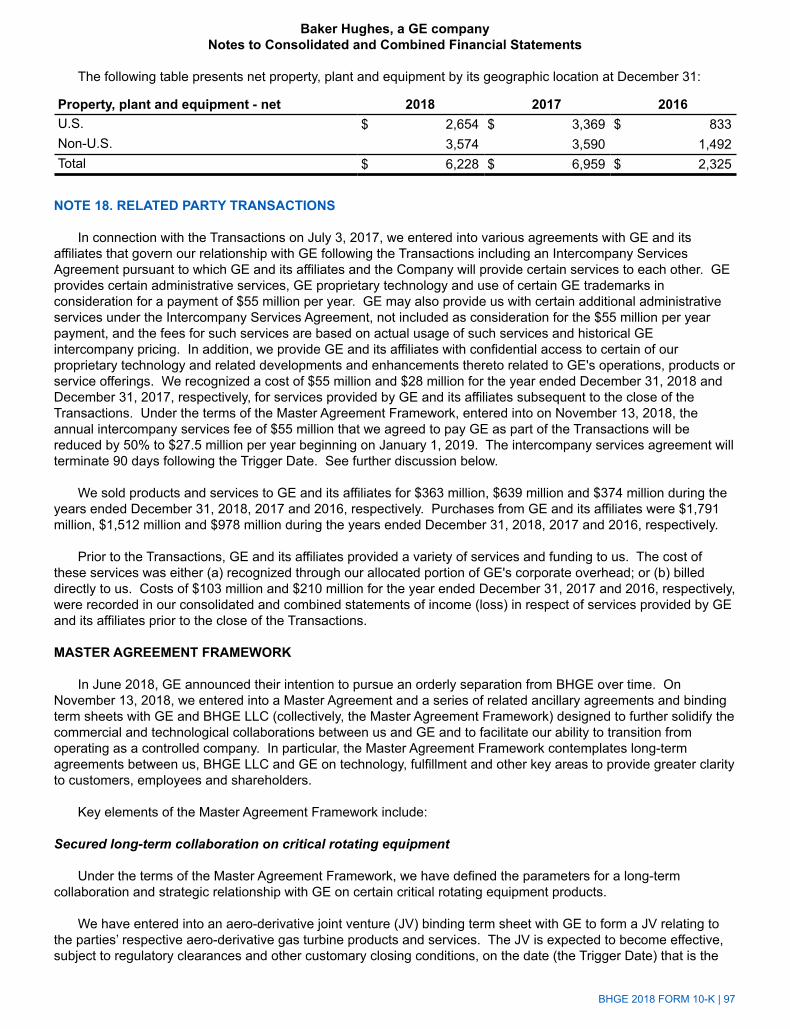
BHGE 2018 FORM 10-K | 97
The following table presents net property, plant and equipment by its geographic location at December 31:
Property, plant and equipment - net 2018 2017 2016U.S. $ 2,654 $ 3,369 $ 833Non-U.S. 3,574 3,590 1,492Total $ 6,228 $ 6,959 $ 2,325
NOTE 18. RELATED PARTY TRANSACTIONS
In connection with the Transactions on July 3, 2017, we entered into various agreements with GE and its affiliates that govern our relationship with GE following the Transactions including an Intercompany Services Agreement pursuant to which GE and its affiliates and the Company will provide certain services to each other. GE provides certain administrative services, GE proprietary technology and use of certain GE trademarks in consideration for a payment of $55 million per year. GE may also provide us with certain additional administrative services under the Intercompany Services Agreement, not included as consideration for the $55 million per year payment, and the fees for such services are based on actual usage of such services and historical GE intercompany pricing. In addition, we provide GE and its affiliates with confidential access to certain of our proprietary technology and related developments and enhancements thereto related to GE's operations, products or service offerings. We recognized a cost of $55 million and $28 million for the year ended December 31, 2018 and December 31, 2017, respectively, for services provided by GE and its affiliates subsequent to the close of the Transactions. Under the terms of the Master Agreement Framework, entered into on November 13, 2018, the annual intercompany services fee of $55 million that we agreed to pay GE as part of the Transactions will be reduced by 50% to $27.5 million per year beginning on January 1, 2019. The intercompany services agreement will terminate 90 days following the Trigger Date. See further discussion below.
We sold products and services to GE and its affiliates for $363 million, $639 million and $374 million during the years ended December 31, 2018, 2017 and 2016, respectively. Purchases from GE and its affiliates were $1,791 million, $1,512 million and $978 million during the years ended December 31, 2018, 2017 and 2016, respectively.
Prior to the Transactions, GE and its affiliates provided a variety of services and funding to us. The cost of these services was either (a) recognized through our allocated portion of GE's corporate overhead; or (b) billed directly to us. Costs of $103 million and $210 million for the year ended December 31, 2017 and 2016, respectively, were recorded in our consolidated and combined statements of income (loss) in respect of services provided by GE and its affiliates prior to the close of the Transactions.
MASTER AGREEMENT FRAMEWORK
In June 2018, GE announced their intention to pursue an orderly separation from BHGE over time. On November 13, 2018, we entered into a Master Agreement and a series of related ancillary agreements and binding term sheets with GE and BHGE LLC (collectively, the Master Agreement Framework) designed to further solidify the commercial and technological collaborations between us and GE and to facilitate our ability to transition from operating as a controlled company. In particular, the Master Agreement Framework contemplates long-term agreements between us, BHGE LLC and GE on technology, fulfillment and other key areas to provide greater clarity to customers, employees and shareholders.
Key elements of the Master Agreement Framework include:
Secured long-term collaboration on critical rotating equipment
Under the terms of the Master Agreement Framework, we have defined the parameters for a long-term collaboration and strategic relationship with GE on certain critical rotating equipment products.
We have entered into an aero-derivative joint venture (JV) binding term sheet with GE to form a JV relating to the parties’ respective aero-derivative gas turbine products and services. The JV is expected to become effective, subject to regulatory clearances and other customary closing conditions, on the date (the Trigger Date) that is the
Baker Hughes, a GE companyNotes to Consolidated and Combined Financial Statements
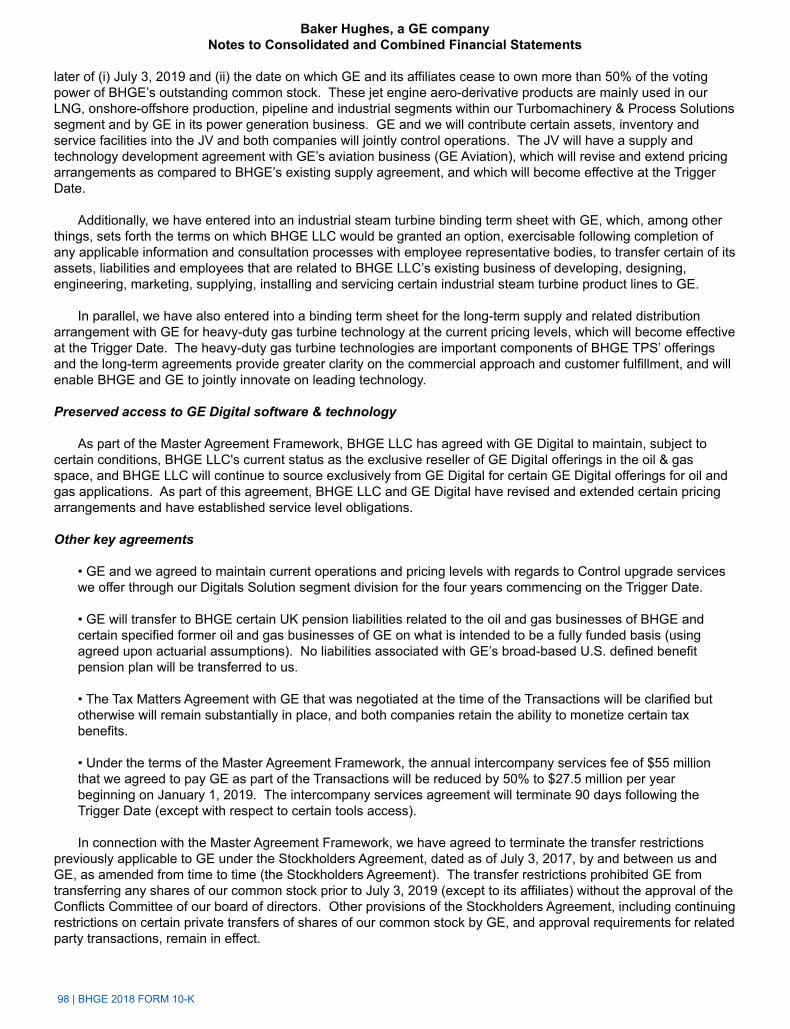
98 | BHGE 2018 FORM 10-K
later of (i) July 3, 2019 and (ii) the date on which GE and its affiliates cease to own more than 50% of the voting power of BHGE’s outstanding common stock. These jet engine aero-derivative products are mainly used in our LNG, onshore-offshore production, pipeline and industrial segments within our Turbomachinery & Process Solutions segment and by GE in its power generation business. GE and we will contribute certain assets, inventory and service facilities into the JV and both companies will jointly control operations. The JV will have a supply and technology development agreement with GE’s aviation business (GE Aviation), which will revise and extend pricing arrangements as compared to BHGE’s existing supply agreement, and which will become effective at the Trigger Date.
Additionally, we have entered into an industrial steam turbine binding term sheet with GE, which, among other things, sets forth the terms on which BHGE LLC would be granted an option, exercisable following completion of any applicable information and consultation processes with employee representative bodies, to transfer certain of its assets, liabilities and employees that are related to BHGE LLC’s existing business of developing, designing, engineering, marketing, supplying, installing and servicing certain industrial steam turbine product lines to GE.
In parallel, we have also entered into a binding term sheet for the long-term supply and related distribution arrangement with GE for heavy-duty gas turbine technology at the current pricing levels, which will become effective at the Trigger Date. The heavy-duty gas turbine technologies are important components of BHGE TPS’ offerings and the long-term agreements provide greater clarity on the commercial approach and customer fulfillment, and will enable BHGE and GE to jointly innovate on leading technology.
Preserved access to GE Digital software & technology
As part of the Master Agreement Framework, BHGE LLC has agreed with GE Digital to maintain, subject to certain conditions, BHGE LLC's current status as the exclusive reseller of GE Digital offerings in the oil & gas space, and BHGE LLC will continue to source exclusively from GE Digital for certain GE Digital offerings for oil and gas applications. As part of this agreement, BHGE LLC and GE Digital have revised and extended certain pricing arrangements and have established service level obligations.
Other key agreements
• GE and we agreed to maintain current operations and pricing levels with regards to Control upgrade services we offer through our Digitals Solution segment division for the four years commencing on the Trigger Date.
• GE will transfer to BHGE certain UK pension liabilities related to the oil and gas businesses of BHGE and certain specified former oil and gas businesses of GE on what is intended to be a fully funded basis (using agreed upon actuarial assumptions). No liabilities associated with GE’s broad-based U.S. defined benefit pension plan will be transferred to us.
• The Tax Matters Agreement with GE that was negotiated at the time of the Transactions will be clarified but otherwise will remain substantially in place, and both companies retain the ability to monetize certain tax benefits.
• Under the terms of the Master Agreement Framework, the annual intercompany services fee of $55 million that we agreed to pay GE as part of the Transactions will be reduced by 50% to $27.5 million per year beginning on January 1, 2019. The intercompany services agreement will terminate 90 days following the Trigger Date (except with respect to certain tools access).
In connection with the Master Agreement Framework, we have agreed to terminate the transfer restrictions previously applicable to GE under the Stockholders Agreement, dated as of July 3, 2017, by and between us and GE, as amended from time to time (the Stockholders Agreement). The transfer restrictions prohibited GE from transferring any shares of our common stock prior to July 3, 2019 (except to its affiliates) without the approval of the Conflicts Committee of our board of directors. Other provisions of the Stockholders Agreement, including continuing restrictions on certain private transfers of shares of our common stock by GE, and approval requirements for related party transactions, remain in effect.
Baker Hughes, a GE companyNotes to Consolidated and Combined Financial Statements
BHGE 2018 FORM 10-K | 99
In addition, the Stockholders Agreement was amended and restated to provide that, following the Trigger Date and until GE and its affiliates own less than 20% of the voting power of our outstanding common stock, GE shall be entitled to designate one person for nomination to our board of directors.
OTHER RELATED PARTY
In connection with the Transactions, on July 3, 2017, we executed a promissory note with GE that represents certain cash that we are holding on GE's behalf due to the restricted nature of the cash. The restriction arises as the majority of the cash cannot be released, transferred or otherwise converted into a non-restricted market currency due to the lack of market liquidity, capital controls or similar monetary or exchange limitations by a Government entity of the jurisdiction in which such cash is situated. There is no maturity date on the promissory note, but we remain obligated to repay GE, therefore, this obligation is reflected as short-term borrowings. As of December 31, 2018, of the $896 million due to GE, $747 million was held in the form of cash and $149 million was held in the form of investment securities. As of December 31, 2017, of the $1,124 million due to GE, $997 million was held in the form of cash and $127 million was held in the form of investment securities. A corresponding liability is reported in short-term borrowings in the consolidated and combined statements of financial position.
The Company has $538 million and $575 million of accounts payable at December 31, 2018 and 2017, respectively, for goods and services provided by GE in the ordinary course of business. The Company has $653 million and $801 million of current receivables at December 31, 2018 and 2017, respectively, for goods and services provided to GE in the ordinary course of business.
Prior to the Transactions, GE provided guarantees, letters of credit, and other support arrangements on our behalf. We provide guarantees to GE Capital on behalf of some customers who have entered into financing arrangements with GE Capital.
TRADE PAYABLES ACCELERATED PAYMENT PROGRAM
Our North American operations participate in accounts payable programs with GE Capital. Invoices are settled with vendors per our payment terms to obtain cash discounts. GE Capital provides funding for invoices eligible for a cash discount. Our liability associated with the funded participation in the accounts payable programs, which is presented as accounts payable within the consolidated and combined statements of financial position, was $471 million and $293 million as of December 31, 2018 and December 31, 2017, respectively. On January 16, 2019, GE announced the sale of GE Capital’s accounts payable program platform to a third-party and their intent to start transitioning their existing program to an accounts payable program with that party. As a GE affiliate, we are covered under the agreement.
INCOME TAXES
At closing of the Transactions, BHGE, GE and BHGE LLC entered into a Tax Matters Agreement. The Tax Matters Agreement governs the administration and allocation between the parties of tax liabilities and benefits arising prior to, as a result of, and subsequent to the Transactions, including certain restructuring transactions in connection therewith, and the respective rights, responsibilities and obligations of GE and BHGE, with respect to various other tax matters. GE will be responsible for certain taxes related to the formation of the transaction undertaken by GE and Baker Hughes and their respective subsidiaries. GE has assumed approximately $31 million of tax obligations of Baker Hughes related to the formation of the transaction.
Following the closing of the Transactions, BHGE or BHGE LLC (or their respective subsidiaries) may be included in group tax returns with GE. To the extent included in such group tax returns, (i) GE will be required to pay BHGE or BHGE LLC to the extent such separate tax returns include net operating losses that are used to reduce taxes payable by GE with respect to the applicable group tax return, and (ii) BHGE or BHGE LLC will be required to make tax sharing payments to GE in an amount intended to approximate the amount that such entity would have paid if it had not been included in such group tax returns and had filed separate tax returns.
The Tax Matters Agreement also provides for the sharing of certain tax benefits (i) arising from the Transactions, including restructuring transactions, and (ii) resulting from allocations of tax items by BHGE LLC. GE is entitled to 100% of these tax benefits to the extent that GE has borne certain taxes related to the formation of the transaction
Baker Hughes, a GE companyNotes to Consolidated and Combined Financial Statements
100 | BHGE 2018 FORM 10-K
which are currently estimated to be $31 million. Thereafter, these tax benefits will be shared by GE and BHGE in accordance with their economic ownership of BHGE LLC. The sharing of tax benefits generally is expected to result in cash payments by BHGE LLC to its members. Any such cash payments may be subject to adjustment based on certain subsequent events, including tax audits or other determinations as to the availability of the tax benefits with respect to which such cash payments were previously made.
NOTE 19. COMMITMENTS AND CONTINGENCIES
LEASES
At December 31, 2018, we had long-term non-cancelable operating leases covering certain facilities and equipment. The minimum annual rental commitments, net of amounts due under subleases, for each of the five years in the period ending December 31, 2023 are $186 million, $154 million, $108 million, $77 million and $55 million, respectively, and $266 million in the aggregate thereafter. Rent expense was $579 million, $360 million and $200 million for the years ended December 31, 2018, 2017 and 2016, respectively. We did not enter into any significant capital leases during the three years ended December 31, 2018.
LITIGATION
We are subject to a number of lawsuits and claims arising out of the conduct of our business. The ability to predict the ultimate outcome of such matters involves judgments, estimates and inherent uncertainties. We record a liability for those contingencies where the incurrence of a loss is probable and the amount can be reasonably estimated, including accruals for self-insured losses which are calculated based on historical claim data, specific loss development factors and other information.
A range of total possible losses for all litigation matters cannot be reasonably estimated. Based on a consideration of all relevant facts and circumstances, we do not expect the ultimate outcome of currently pending lawsuits or claims against us, other than those discussed below, will have a material adverse effect on our financial position, results of operations or cash flows, however, there can be no assurance as to the ultimate outcome of these matters.
With respect to the litigation matters below, if there was an adverse outcome individually or collectively, there could be a material impact on our business, financial condition and results of operations expected for the year. These litigation matters are subject to inherent uncertainties and management's view of these matters may change in the future. Therefore, there can be no assurance as to the ultimate outcome of these matters.
During 2014, we received notification from a customer related to a possible equipment failure in a natural gas storage system in Northern Germany, which includes certain of our products. The customer initiated arbitral proceedings against us on June 19, 2015, under the rules of the German Institute of Arbitration e.V. (DIS). On August 3, 2016, the customer amended its claims and alleged damages of €202 million plus interest at an annual rate of prime + 5%. Hearings before the arbitration panel were held January 16, 2017 through January 23, 2017, and March 20, 2017 through March 21, 2017. In addition, on September 21, 2015, TRIUVA Kapitalverwaltungsgesellschaft mbH filed a lawsuit in the United States District Court for the Southern District of Texas, Houston Division against the Company and Baker Hughes Oilfield Operations, Inc. alleging that the plaintiff is the owner of gas storage caverns in Etzel, Germany in which the Company provided certain equipment in connection with the development of the gas storage caverns. The plaintiff further alleges that the Company supplied equipment that was either defectively designed or failed to warn of risks that the equipment posed, and that these alleged defects caused damage to the plaintiff's property. The plaintiff seeks recovery of alleged compensatory and punitive damages of an unspecified amount, in addition to reasonable attorneys' fees, court costs and pre-judgment and post-judgment interest. The allegations in this lawsuit are related to the claims made in the June 19, 2015 German arbitration referenced above. On June 7, 2018, the DIS arbitration panel issued a confidential Arbitration Ruling which addressed all claims asserted by the customer. The estimated financial impact of the Arbitration Ruling has been reflected in the Company's financial statements and did not have a material impact. The Company is vigorously contesting the claims made by TRIUVA in the Houston Federal Court. At this time, we are not able to predict the outcome of the claims asserted in the Houston Federal Court.
Baker Hughes, a GE companyNotes to Consolidated and Combined Financial Statements
BHGE 2018 FORM 10-K | 101
On July 31, 2015, Rapid Completions LLC filed a lawsuit in federal court in the Eastern District of Texas against Baker Hughes Incorporated, Baker Hughes Oilfield Operations, Inc., and others claiming infringement of U.S. Patent Nos. 6,907,936; 7,134,505; 7,543,634; 7,861,774; and 8,657,009. On August 6, 2015, Rapid Completions amended its complaint to allege infringement of U.S. Patent No. 9,074,451. On September 17, 2015, Rapid Completions and Packers Plus Energy Services Inc. sued Baker Hughes Canada Company in the Canada Federal Court on the related Canadian patent 2,412,072. On April 1, 2016, Rapid Completions removed U.S. Patent No. 6,907,936 from its claims in the lawsuit. On April 5, 2016, Rapid Completions filed a second lawsuit in federal court in the Eastern District of Texas against Baker Hughes Incorporated, Baker Hughes Oilfield Operations, Inc. and others claiming infringement of U.S. Patent No. 9,303,501. These patents relate primarily to certain specific downhole completions equipment. The plaintiff has requested a permanent injunction against further alleged infringement, damages in an unspecified amount, supplemental and enhanced damages, and additional relief such as attorney's fees and costs. During August and September 2016, the United States Patent and Trademark Office (USPTO) agreed to institute an inter-partes review of U.S. Patent Nos 7,861,774; 7,134,505; 7,543,634; 6,907,936; 8,657,009; and 9,074,451. On August 29, 2017, the USPTO issued its final written decisions in the inter-partes reviews of U.S. Patent Nos. 8,657,009 and 9,074,451 finding that all claims of those patents were unpatentable. On August 31, 2017, the USPTO issued its final written decision in the inter-partes review of U.S. Patent 6,907,936 - the patent dropped from the lawsuit by the plaintiffs - finding that all claims of this patent were patentable. On October 27, 2017, Rapid Completions filed its notices of appeal of the USPTO’s final written decision in the inter-partes review of U.S. Patent Nos. 8,657,009 and 9,074,451. On September 26, 2018, the USPTO issued its final written decision in the inter-partes review of U.S. Patent No. 7,134,505 finding all of the challenged claims unpatentable. On September 27, 2018, the USPTO issued its final written decision in the inter-partes review of U.S. Patent No. 7,543,634 finding all of the challenged claims unpatentable. Trial on the validity of asserted claims from Canada patent 2,412,072, was completed March 9, 2017. On December 7, 2017, the Canadian Court issued its judgment finding the patent claims asserted from Canada patent 2,412,072 against Baker Hughes Canada Company were invalid. On January 5, 2018, Rapid Completions filed its Notice of Appeal of the Canadian Court’s judgment of invalidity. At this time, we are not able to predict the outcome of these claims.
Following consummation of the Transactions, two purported holders of shares of Baker Hughes common stock, representing a total of 1,875,000 shares of common stock of Baker Hughes, filed petitions in the Court of Chancery of the State of Delaware seeking appraisal for their shares pursuant to Section 262 of the Delaware General Corporation Law. The action is captioned as follows: GKC Strategic Value Master Fund, LP F/K/A GKC Appraisal Rights Master Fund, LP and Walleye Trading LLC v. Baker Hughes Incorporated, Case No. 2017-0769. On July 12, 2018, the parties entered a Confidential Settlement Agreement and Release of all claims asserted by the two shareholders. The Settlement Agreement does not have a material impact on the Company's financial statements.
On February 17, 2017, GE Infrastructure Sensing, Inc. (now known as GE Infrastructure Sensing, LLC) (GEIS), a subsidiary of the Company, was served with a lawsuit filed in the Eastern District of New York by a company named Saniteq LLC claiming compensatory damages totaling $500 million plus punitive damages of an unspecified amount. The complaint is captioned Saniteq LLC v. GE Infrastructure Sensing, Inc., No. 17-cv-771 (E.D.N.Y 2017). The complaint generally alleges that GEIS breached a contract being negotiated between the parties and misappropriated unspecified trade secrets. On September 13, 2018, the District Court entered an Order granting GEIS’ Motion for Summary Judgment dismissing Saniteq LLC’s claims in their entirety as a matter of law. Saniteq LLC filed a notice of appeal from the District Court’s Judgment. On February 6, 2019, the parties entered a Confidential Settlement Agreement and Release of all claims. The Settlement Agreement does not have a material impact on the Company's financial statements.
In January 2013, INEOS and Naphtachimie initiated expertise proceedings in Aix-en-Provence, France arising out of a fire at a chemical plant owned by INEOS in Lavera, France, which resulted in a 15-day plant shutdown and destruction of a steam turbine, which was part of a compressor train owned by Naphtachimie. The most recent quantification of the alleged damages is €250 million. Two of the Company's subsidiaries (and 17 other companies) were notified to participate in the proceedings. The proceedings are ongoing, and at this time, there is no indication that the Company's subsidiaries were involved in the incident. Although the outcome of the claims remains uncertain, BHGE's insurer has accepted coverage and is defending the Company in the expertise proceeding.
In late November 2017, staff of the Boston office of the SEC notified GE that they are conducting an investigation of GE’s revenue recognition practices and internal controls over financial reporting related to long-term
Baker Hughes, a GE companyNotes to Consolidated and Combined Financial Statements
102 | BHGE 2018 FORM 10-K
service agreements. The scope of the SEC’s request may include some BHGE contracts, expected to be mainly in our TPS business. We have provided documents to GE and are cooperating with them in their response to the SEC. At this time, we are not able to predict the outcome of this review.
On July 31, 2018, International Engineering & Construction S.A. (IEC) initiated arbitration proceedings in New York administered by the International Center for Dispute Resolution (ICDR) against the Company and its subsidiaries arising out of a series of sales and service contracts entered between IEC and the Company’s subsidiaries for the sale and installation of LNG plants and related power generation equipment in Nigeria (Contracts). Prior to the filing of the IEC Arbitration, the Company’s subsidiaries made demands for payment due under the Contracts. On August 15, 2018, the Company’s subsidiaries initiated a separate demand for ICDR arbitration against IEC for claims of additional costs and amounts due under the Contracts. On October 10, 2018, IEC filed a Petition to Compel Arbitration in the United States District Court for the Southern District of New York against the Company seeking to compel non-signatory BHGE entities to participate in the arbitration filed by IEC. The complaint is captioned International Engineering & Construction S.A. et al. v. Baker Hughes, a GE Company LLC, et al. No. 18-cv-09241 (S.D.N.Y 2018). IEC alleges breach of contract and other claims against the Company and its subsidiaries and seeks recovery of alleged compensatory damages, in addition to reasonable attorneys' fees, expenses and arbitration costs. IEC alleges that its total damages may exceed $500 million. The Company intends to vigorously contest the claims made by IEC in the arbitration and litigation proceedings. At this time, we are not able to predict the outcome of these claims.
We insure against risks arising from our business to the extent deemed prudent by our management and to the extent insurance is available, but no assurance can be given that the nature and amount of that insurance will be sufficient to fully indemnify us against liabilities arising out of pending or future legal proceedings or other claims. Most of our insurance policies contain deductibles or self-insured retentions in amounts we deem prudent and for which we are responsible for payment. In determining the amount of self-insurance, it is our policy to self-insure those losses that are predictable, measurable and recurring in nature, such as claims for automobile liability, general liability and workers compensation.
ENVIRONMENTAL MATTERS
Estimated remediation costs are accrued using currently available facts, existing environmental permits, technology and enacted laws and regulations. Our cost estimates are developed based on internal evaluations and are not discounted. Accruals are recorded when it is probable that we will be obligated to pay for environmental site evaluation, remediation or related activities, and such costs can be reasonably estimated. As additional information becomes available, accruals are adjusted to reflect current cost estimates. Ongoing environmental compliance costs, such as obtaining environmental permits, installation of pollution control equipment and waste disposal are expensed as incurred. Where we have been identified as a potentially responsible party in a U.S. federal or state Comprehensive Environmental Response, Compensation and Liability Act (Superfund) site, we accrue our share of the estimated remediation costs of the site. This share is based on the ratio of the estimated volume of waste we contributed to the site to the total volume of waste disposed at the site.
OTHER
In the normal course of business with customers, vendors and others, we have entered into off-balance sheet arrangements, such as surety bonds for performance, letters of credit and other bank issued guarantees, which totaled approximately $3.6 billion at December 31, 2018. It is not practicable to estimate the fair value of these financial instruments. None of the off-balance sheet arrangements either has, or is likely to have, a material effect on our financial position, results of operations or cash flows. We also had commitments outstanding for purchase obligations for each of the five years in the period ending December 31, 2023 of $1,388 million, $51 million, $35 million, $20 million and $5 million, respectively, and $8 million in the aggregate thereafter.
NOTE 20. RESTRUCTURING, IMPAIRMENT AND OTHER
We recorded restructuring, impairment and other charges of $433 million, $412 million, and $516 million during the years ended December 31, 2018, 2017 and 2016, respectively. Details of these charges are discussed below.
Baker Hughes, a GE companyNotes to Consolidated and Combined Financial Statements

BHGE 2018 FORM 10-K | 103
RESTRUCTURING AND IMPAIRMENT CHARGES
In the current and prior periods, we approved various restructuring plans globally, mainly to consolidate manufacturing and service facilities, rationalize product lines and rooftops, and reduce headcount across various functions. As a result, we recognized a charge of $304 million, $385 million and $293 million for the years ended December 31, 2018, 2017 and 2016, respectively. These restructuring initiatives are expected to generate charges of approximately $82 million as these restructuring plans come to completion.
These charges are included in the "Restructuring, impairment and other" caption in the consolidated and combined statements of income (loss).
The amount of costs not included in the reported segment results is as follows:
2018 2017 2016Oilfield Services $ 160 $ 187 $ 122Oilfield Equipment 25 114 52Turbomachinery & Process Solutions 71 21 58Digital Solutions 17 34 34Corporate 31 29 27Total $ 304 $ 385 $ 293
These costs were primarily related to product line terminations, facility closures and related expenses such as property, plant and equipment impairments, contract terminations and costs of assets' and employees' relocation, employee-related termination benefits, and other incremental costs that were a direct result of the restructuring plans.
2018 2017 2016Property, plant & equipment, net $ 80 $ 131 $ 93Employee-related termination expenses 123 186 111Asset relocation costs 28 10 17EHS remediation costs 6 9 20Contract termination fees 44 26 37Other incremental costs 23 23 15Total $ 304 $ 385 $ 293
OTHER CHARGES
Other charges included in "Restructuring, impairment and other" caption of the consolidated and combined statements of income (loss) was $129 million, $27 million and $223 million for the years ended December 31, 2018, 2017 and 2016, respectively. In 2018, other charges consist primarily of accelerated amortization of $80 million related to trade names and technology in our OFS segment, litigation charges of $25 million in Corporate and costs of $13 million to exit certain operations that impacted our TPS and OFS segments. In 2017 and 2016, other charges primarily include currency devaluation charges of $12 million and $138 million, respectively, largely driven by significant currency devaluations in Angola and Nigeria.
Baker Hughes, a GE companyNotes to Consolidated and Combined Financial Statements
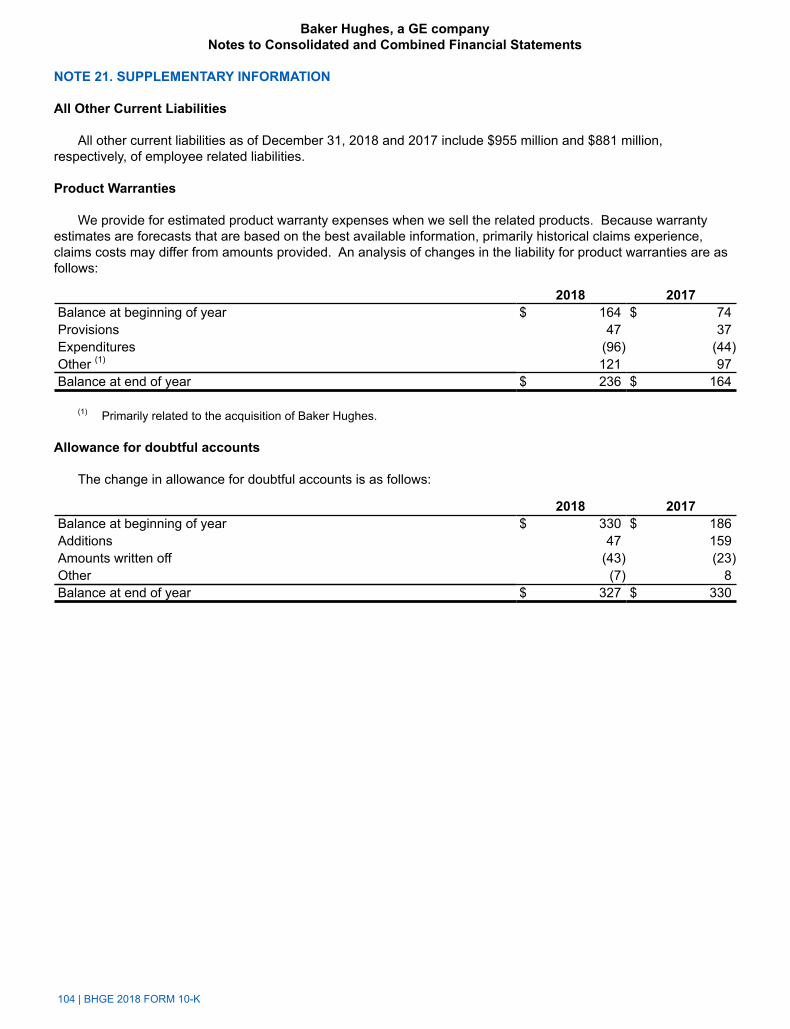
104 | BHGE 2018 FORM 10-K
NOTE 21. SUPPLEMENTARY INFORMATION
All Other Current Liabilities
All other current liabilities as of December 31, 2018 and 2017 include $955 million and $881 million, respectively, of employee related liabilities.
Product Warranties
We provide for estimated product warranty expenses when we sell the related products. Because warranty estimates are forecasts that are based on the best available information, primarily historical claims experience, claims costs may differ from amounts provided. An analysis of changes in the liability for product warranties are as follows:
2018 2017Balance at beginning of year $ 164 $ 74Provisions 47 37Expenditures (96) (44)Other (1) 121 97Balance at end of year $ 236 $ 164
(1) Primarily related to the acquisition of Baker Hughes.
Allowance for doubtful accounts
The change in allowance for doubtful accounts is as follows:
2018 2017Balance at beginning of year $ 330 $ 186Additions 47 159Amounts written off (43) (23)Other (7) 8Balance at end of year $ 327 $ 330
Baker Hughes, a GE companyNotes to Consolidated and Combined Financial Statements
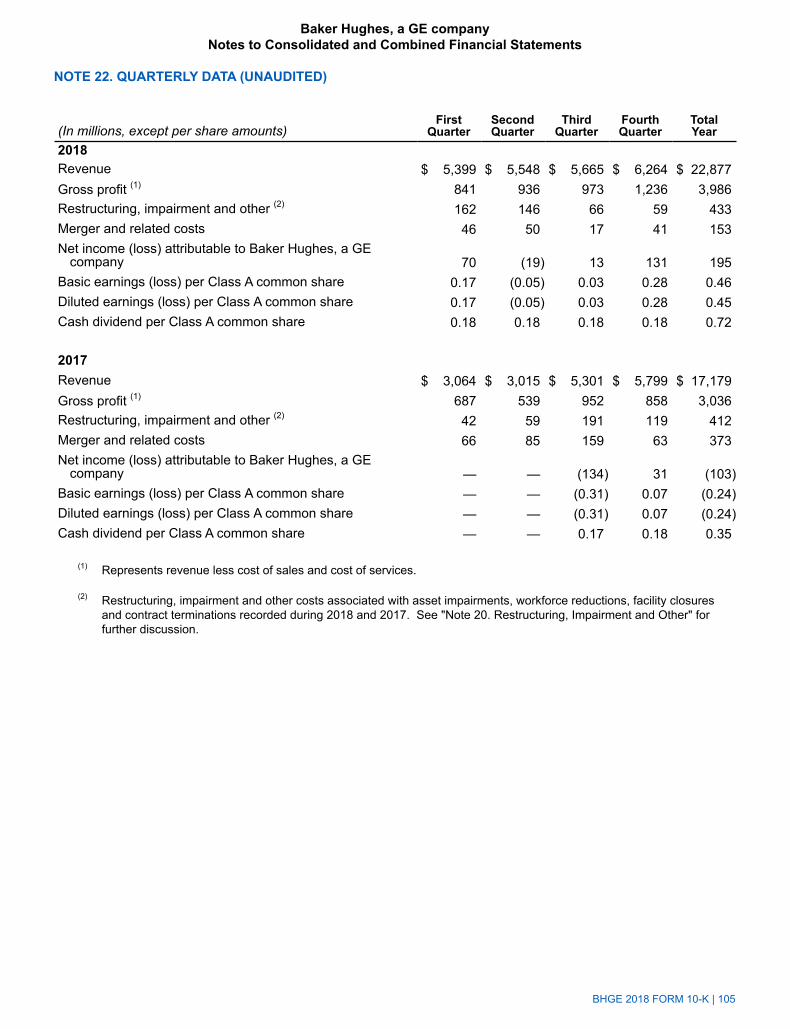
BHGE 2018 FORM 10-K | 105
NOTE 22. QUARTERLY DATA (UNAUDITED)
(In millions, except per share amounts)First
QuarterSecondQuarter
ThirdQuarter
FourthQuarter
TotalYear
2018Revenue $ 5,399 $ 5,548 $ 5,665 $ 6,264 $ 22,877Gross profit (1) 841 936 973 1,236 3,986Restructuring, impairment and other (2) 162 146 66 59 433Merger and related costs 46 50 17 41 153Net income (loss) attributable to Baker Hughes, a GE
company 70 (19) 13 131 195Basic earnings (loss) per Class A common share 0.17 (0.05) 0.03 0.28 0.46Diluted earnings (loss) per Class A common share 0.17 (0.05) 0.03 0.28 0.45Cash dividend per Class A common share 0.18 0.18 0.18 0.18 0.72
2017Revenue $ 3,064 $ 3,015 $ 5,301 $ 5,799 $ 17,179Gross profit (1) 687 539 952 858 3,036Restructuring, impairment and other (2) 42 59 191 119 412Merger and related costs 66 85 159 63 373Net income (loss) attributable to Baker Hughes, a GE
company — — (134) 31 (103)Basic earnings (loss) per Class A common share — — (0.31) 0.07 (0.24)Diluted earnings (loss) per Class A common share — — (0.31) 0.07 (0.24)Cash dividend per Class A common share — — 0.17 0.18 0.35
(1) Represents revenue less cost of sales and cost of services.
(2) Restructuring, impairment and other costs associated with asset impairments, workforce reductions, facility closures and contract terminations recorded during 2018 and 2017. See "Note 20. Restructuring, Impairment and Other" for further discussion.
Baker Hughes, a GE companyNotes to Consolidated and Combined Financial Statements

106 | BHGE 2018 FORM 10-K
ITEM 9. CHANGES IN AND DISAGREEMENTS WITH ACCOUNTANTS ON ACCOUNTING AND FINANCIAL DISCLOSURE
None.
ITEM 9A. CONTROLS AND PROCEDURES
Evaluation of disclosure controls and procedures
Our management, with the participation of our Chief Executive Officer and Chief Financial Officer, has evaluated the effectiveness of the design and operation of our disclosure controls and procedures (as defined in Rule 15d-15(e) under the Exchange Act) as of the end of the period covered by this report. Based upon that evaluation, the Chief Executive Officer and Chief Financial Officer have concluded that, as of December 31, 2018, our disclosure controls and procedures (as defined in Rule 15d-15(e) of the Exchange Act) were effective at a reasonable assurance level.
Effective January 1, 2018, we adopted the new revenue guidance under ASC Topic 606, Revenue from Contracts with Customers, using the full retrospective method of adoption. The adoption of this guidance required the implementation of new accounting policies and processes, including changes to our information systems, which changed the Company’s internal controls over financial reporting for revenue recognition and related disclosures for both our restated historical financial statements and current period reporting.
ITEM 9B. OTHER INFORMATION
None.
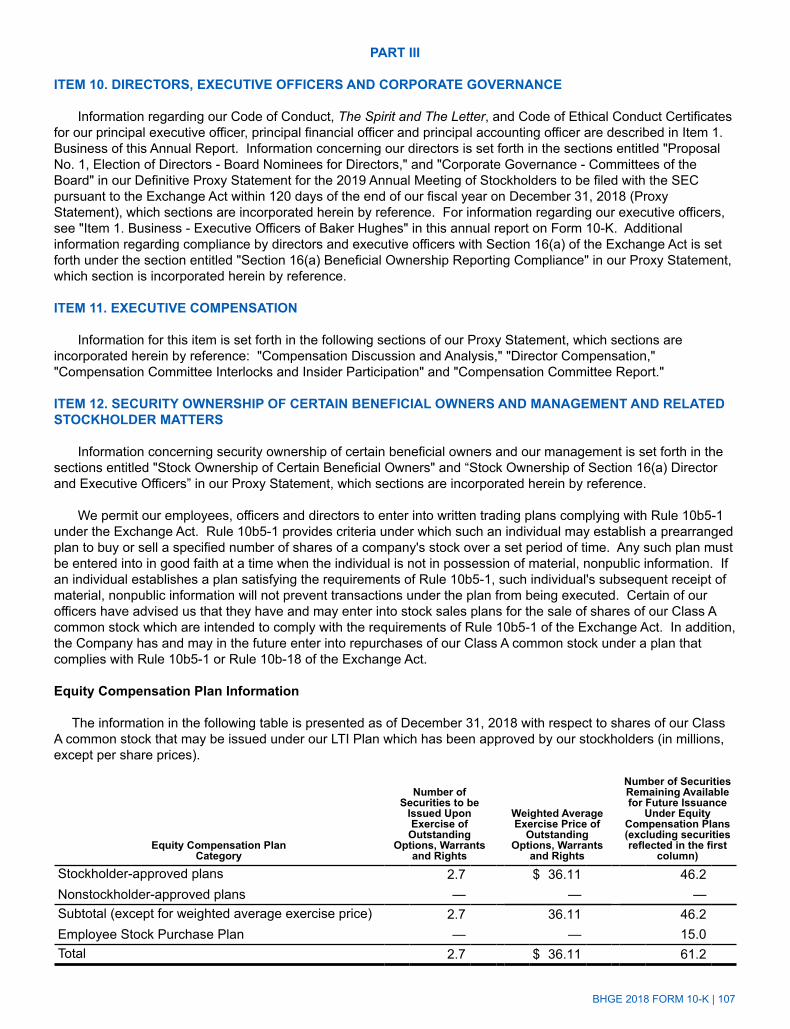
BHGE 2018 FORM 10-K | 107
PART III
ITEM 10. DIRECTORS, EXECUTIVE OFFICERS AND CORPORATE GOVERNANCE
Information regarding our Code of Conduct, The Spirit and The Letter, and Code of Ethical Conduct Certificates for our principal executive officer, principal financial officer and principal accounting officer are described in Item 1. Business of this Annual Report. Information concerning our directors is set forth in the sections entitled "Proposal No. 1, Election of Directors - Board Nominees for Directors," and "Corporate Governance - Committees of the Board" in our Definitive Proxy Statement for the 2019 Annual Meeting of Stockholders to be filed with the SEC pursuant to the Exchange Act within 120 days of the end of our fiscal year on December 31, 2018 (Proxy Statement), which sections are incorporated herein by reference. For information regarding our executive officers, see "Item 1. Business - Executive Officers of Baker Hughes" in this annual report on Form 10-K. Additional information regarding compliance by directors and executive officers with Section 16(a) of the Exchange Act is set forth under the section entitled "Section 16(a) Beneficial Ownership Reporting Compliance" in our Proxy Statement, which section is incorporated herein by reference.
ITEM 11. EXECUTIVE COMPENSATION
Information for this item is set forth in the following sections of our Proxy Statement, which sections are incorporated herein by reference: "Compensation Discussion and Analysis," "Director Compensation," "Compensation Committee Interlocks and Insider Participation" and "Compensation Committee Report."
ITEM 12. SECURITY OWNERSHIP OF CERTAIN BENEFICIAL OWNERS AND MANAGEMENT AND RELATED STOCKHOLDER MATTERS
Information concerning security ownership of certain beneficial owners and our management is set forth in the sections entitled "Stock Ownership of Certain Beneficial Owners" and “Stock Ownership of Section 16(a) Director and Executive Officers” in our Proxy Statement, which sections are incorporated herein by reference.
We permit our employees, officers and directors to enter into written trading plans complying with Rule 10b5-1 under the Exchange Act. Rule 10b5-1 provides criteria under which such an individual may establish a prearranged plan to buy or sell a specified number of shares of a company's stock over a set period of time. Any such plan must be entered into in good faith at a time when the individual is not in possession of material, nonpublic information. If an individual establishes a plan satisfying the requirements of Rule 10b5-1, such individual's subsequent receipt of material, nonpublic information will not prevent transactions under the plan from being executed. Certain of our officers have advised us that they have and may enter into stock sales plans for the sale of shares of our Class A common stock which are intended to comply with the requirements of Rule 10b5-1 of the Exchange Act. In addition, the Company has and may in the future enter into repurchases of our Class A common stock under a plan that complies with Rule 10b5-1 or Rule 10b-18 of the Exchange Act.
Equity Compensation Plan Information
The information in the following table is presented as of December 31, 2018 with respect to shares of our Class A common stock that may be issued under our LTI Plan which has been approved by our stockholders (in millions, except per share prices).
Equity Compensation PlanCategory
Number ofSecurities to be
Issued UponExercise of
OutstandingOptions, Warrants
and Rights
Weighted AverageExercise Price of
OutstandingOptions, Warrants
and Rights
Number of SecuritiesRemaining Availablefor Future Issuance
Under EquityCompensation Plans(excluding securitiesreflected in the first
column)
Stockholder-approved plans 2.7 $ 36.11 46.2Nonstockholder-approved plans — — —Subtotal (except for weighted average exercise price) 2.7 36.11 46.2Employee Stock Purchase Plan — — 15.0Total 2.7 $ 36.11 61.2

108 | BHGE 2018 FORM 10-K
ITEM 13. CERTAIN RELATIONSHIPS AND RELATED TRANSACTIONS, AND DIRECTOR INDEPENDENCE
Information for this item is set forth in the sections entitled "Corporate Governance-Director Independence" and "Certain Relationships and Related Party Transactions" in our Proxy Statement, which sections are incorporated herein by reference.
ITEM 14. PRINCIPAL ACCOUNTING FEES AND SERVICES
Information concerning principal accountant fees and services is set forth in the section entitled "Fees Paid to Deloitte & Touche LLP, KPMG LLP and KPMG S.p.A." in our Proxy Statement, which section is incorporated herein by reference.
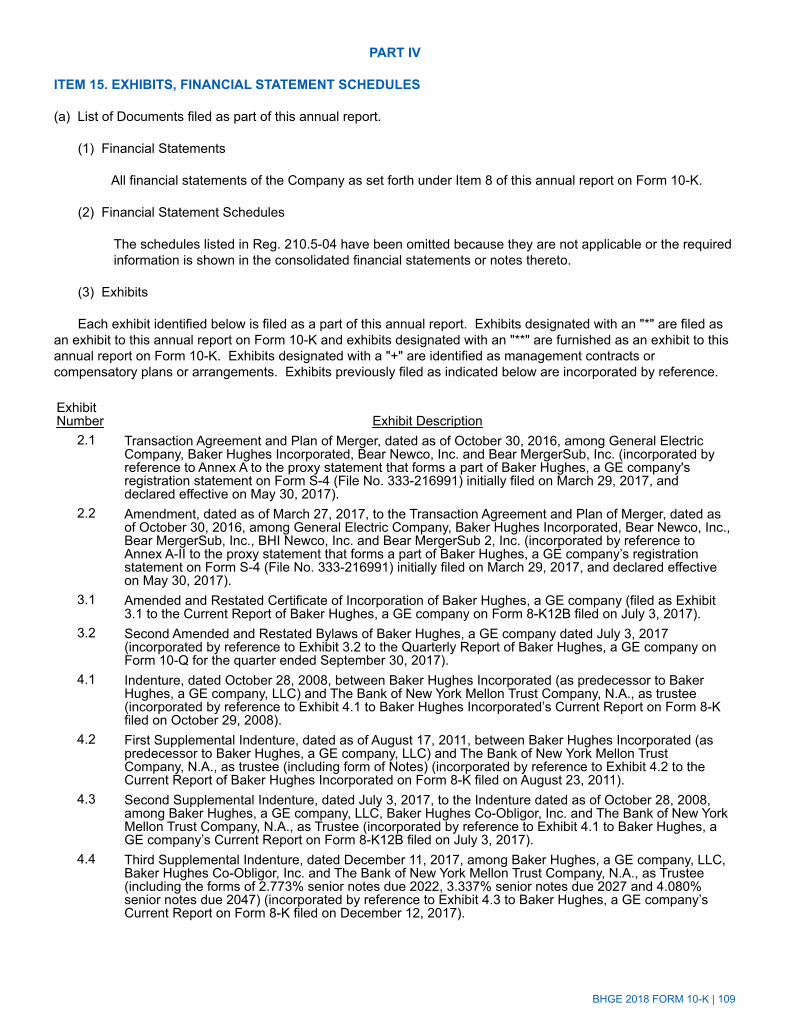
BHGE 2018 FORM 10-K | 109
PART IV
ITEM 15. EXHIBITS, FINANCIAL STATEMENT SCHEDULES
(a) List of Documents filed as part of this annual report.
(1) Financial Statements
All financial statements of the Company as set forth under Item 8 of this annual report on Form 10-K.
(2) Financial Statement Schedules
The schedules listed in Reg. 210.5-04 have been omitted because they are not applicable or the required information is shown in the consolidated financial statements or notes thereto.
(3) Exhibits
Each exhibit identified below is filed as a part of this annual report. Exhibits designated with an "*" are filed as an exhibit to this annual report on Form 10-K and exhibits designated with an "**" are furnished as an exhibit to this annual report on Form 10-K. Exhibits designated with a "+" are identified as management contracts or compensatory plans or arrangements. Exhibits previously filed as indicated below are incorporated by reference.
Exhibit Number Exhibit Description
2.1 Transaction Agreement and Plan of Merger, dated as of October 30, 2016, among General Electric Company, Baker Hughes Incorporated, Bear Newco, Inc. and Bear MergerSub, Inc. (incorporated by reference to Annex A to the proxy statement that forms a part of Baker Hughes, a GE company's registration statement on Form S-4 (File No. 333-216991) initially filed on March 29, 2017, and declared effective on May 30, 2017).
2.2 Amendment, dated as of March 27, 2017, to the Transaction Agreement and Plan of Merger, dated as of October 30, 2016, among General Electric Company, Baker Hughes Incorporated, Bear Newco, Inc., Bear MergerSub, Inc., BHI Newco, Inc. and Bear MergerSub 2, Inc. (incorporated by reference to Annex A-II to the proxy statement that forms a part of Baker Hughes, a GE company’s registration statement on Form S-4 (File No. 333-216991) initially filed on March 29, 2017, and declared effective on May 30, 2017).
3.1 Amended and Restated Certificate of Incorporation of Baker Hughes, a GE company (filed as Exhibit 3.1 to the Current Report of Baker Hughes, a GE company on Form 8-K12B filed on July 3, 2017).
3.2 Second Amended and Restated Bylaws of Baker Hughes, a GE company dated July 3, 2017 (incorporated by reference to Exhibit 3.2 to the Quarterly Report of Baker Hughes, a GE company on Form 10-Q for the quarter ended September 30, 2017).
4.1 Indenture, dated October 28, 2008, between Baker Hughes Incorporated (as predecessor to Baker Hughes, a GE company, LLC) and The Bank of New York Mellon Trust Company, N.A., as trustee (incorporated by reference to Exhibit 4.1 to Baker Hughes Incorporated’s Current Report on Form 8-K filed on October 29, 2008).
4.2 First Supplemental Indenture, dated as of August 17, 2011, between Baker Hughes Incorporated (as predecessor to Baker Hughes, a GE company, LLC) and The Bank of New York Mellon Trust Company, N.A., as trustee (including form of Notes) (incorporated by reference to Exhibit 4.2 to the Current Report of Baker Hughes Incorporated on Form 8-K filed on August 23, 2011).
4.3 Second Supplemental Indenture, dated July 3, 2017, to the Indenture dated as of October 28, 2008, among Baker Hughes, a GE company, LLC, Baker Hughes Co-Obligor, Inc. and The Bank of New York Mellon Trust Company, N.A., as Trustee (incorporated by reference to Exhibit 4.1 to Baker Hughes, a GE company’s Current Report on Form 8-K12B filed on July 3, 2017).
4.4 Third Supplemental Indenture, dated December 11, 2017, among Baker Hughes, a GE company, LLC, Baker Hughes Co-Obligor, Inc. and The Bank of New York Mellon Trust Company, N.A., as Trustee (including the forms of 2.773% senior notes due 2022, 3.337% senior notes due 2027 and 4.080% senior notes due 2047) (incorporated by reference to Exhibit 4.3 to Baker Hughes, a GE company’s Current Report on Form 8-K filed on December 12, 2017).
110 | BHGE 2018 FORM 10-K
4.5 Indenture, dated May 15, 1994, between Western Atlas Inc. and The Bank of New York, Trustee, providing for the issuance of securities in series (incorporated by reference to Exhibit 4.4 to the Annual Report of Baker Hughes Incorporated on Form 10-K for the year ended December 31, 2004).
4.6 First Supplemental Indenture to the Indenture dated as of May 15, 1994, among Baker Hughes, a GE company, LLC, Baker Hughes Co-Obligor, Inc. and The Bank of New York Mellon Trust Company, N.A., as trustee (incorporated by reference to Exhibit 4.4 to Baker Hughes, a GE company’s Current Report on Form 8-K12B filed on July 3, 2017).
4.7 Sixth Supplemental Indenture to the Indenture dated as of June 8, 2006, among Baker Hughes, a GE company, LLC, Baker Hughes Co-Obligor, Inc., Baker Hughes Oilfield Operations, LLC, Baker Hughes International Branches, LLC and Wells Fargo Bank, National Association, as trustee (incorporated by reference to Exhibit 4.3 to Baker Hughes, a GE company’s Current Report on Form 8-K12B filed on July 3, 2017).
10.1 Master Agreement, dated as of November 13, 2018, between Baker Hughes, a GE company, Baker Hughes, a GE company, LLC and General Electric Company (incorporated by reference to Exhibit 10.1 to the Current Report of Baker Hughes, a GE company on Form 8-K dated November 13, 2018, Accession No. 0000950103-18-013305).
10.2 Aero-Derivatives Supply and Technology Development Agreement, dated as of November 13, 2018, between Baker Hughes, a GE company, LLC and General Electric Company (incorporated by reference to Exhibit 10.2 to the Current Report of Baker Hughes, a GE company on Form 8-K dated November 13, 2018, Accession No. 0000950103-18-013305).
10.3 HDGT Supply Agreement, dated as of November 13, 2018, between Baker Hughes, a GE company, LLC and General Electric Company (incorporated by reference to Exhibit 10.3 to the Current Report of Baker Hughes, a GE company on Form 8-K dated November 13, 2018, Accession No. 0000950103-18-013305).
10.4 Amended and Restated Stockholders Agreement, dated as of November 13, 2018, between Baker Hughes, a GE company and General Electric Company (incorporated by reference to Exhibit 10.4 to the Current Report of Baker Hughes, a GE company on Form 8-K dated November 13, 2018, Accession No. 0000950103-18-013305).
10.5 Registration Rights Agreement, dated as of July 3, 2017, between Baker Hughes, a GE company and General Electric Company (incorporated by reference to Exhibit 10.2 to the Current Report of Baker Hughes, a GE company on Form 8-K12B dated July 3, 2017).
10.6 Exchange Agreement, dated as of July 3, 2017, among General Electric Company, GE Oil & Gas US Holdings I, Inc., GE Oil & Gas US Holdings IV, Inc., GE Holdings (US), Inc., Baker Hughes, a GE company and Baker Hughes, a GE company, LLC (incorporated by reference to Exhibit 10.3 to the Current Report of Baker Hughes, a GE company on Form 8-K12B dated July 3, 2017).
10.7 Amended and Restated Limited Liability Company Agreement of Baker Hughes, a GE company, LLC, dated as of July 3, 2017 (incorporated by reference to Exhibit 10.4 to the Current Report of Baker Hughes, a GE company on Form 8-K12B dated July 3, 2017).
10.8 Tax Matters Agreement, dated as of July 3, 2017, among General Electric Company, Baker Hughes, a GE company, EHHC Newco, LLC and Baker Hughes, a GE company, LLC (incorporated by reference to Exhibit 10.5 to the Current Report of Baker Hughes, a GE company on Form 8-K12B dated July 3, 2017).
10.9 Amended and Restated Non-Competition Agreement, dated as of November 13, 2018, between General Electric Company and Baker Hughes, a GE company (incorporated by reference to Exhibit 10.7 to the Current Report of Baker Hughes, a GE company on Form 8-K dated November 13, 2018, Accession No. 0000950103-18-013305).
10.10 Amended and Restated Channel Agreement, dated as of November 13, 2018, between General Electric Company and Baker Hughes, a GE company (incorporated by reference to Exhibit 10.8 to the Current Report of Baker Hughes, a GE company on Form 8-K dated November 13, 2018, Accession No. 0000950103-18-013305).
10.11 Amended and Restated IP Cross License Agreement, dated as of November 13, 2018, between General Electric Company and Baker Hughes, a GE company, LLC (incorporated by reference to Exhibit 10.11 to the Current Report of Baker Hughes, a GE company on Form 8-K dated November 13, 2018, Accession No. 0000950103-18-013305).
10.12 Side Letter to the Amended and Restated IP Cross License Agreement dated as of November 13, 2018, between General Electric Company and Baker Hughes, a GE company, LLC (incorporated by reference to Exhibit 10.12 to the Current Report of Baker Hughes, a GE company on Form 8-K dated November 13, 2018, Accession No. 0000950103-18-013305).
BHGE 2018 FORM 10-K | 111
10.13 Amended and Restated Trademark License Agreement, dated as of November 13, 2018, between General Electric Company and Baker Hughes, a GE company, LLC (incorporated by reference to Exhibit 10.13 to the Current Report of Baker Hughes, a GE company on Form 8-K dated November 13, 2018, Accession No. 0000950103-18-013305).
10.14 Amended and Restated GE Digital Master Products and Services Agreement, dated as of November 13, 2018, between GE Digital LLC and Baker Hughes, a GE company, LLC (incorporated by reference to Exhibit 10.10 to the Current Report of Baker Hughes, a GE company on Form 8-K dated November 13, 2018, Accession No. 0000950103-18-013305).
10.15 Amended and Restated Intercompany Services Agreement, dated as of November 13, 2018, between General Electric Company and Baker Hughes, a GE company, LLC (incorporated by reference to Exhibit 10.9 to the Current Report of Baker Hughes, a GE company on Form 8-K dated November 13, 2018, Accession No. 0000950103-18-013305).
10.16 Amended and Restated Supply Agreement, dated as of November 13, 2018, between General Electric Company, as Seller, and Baker Hughes, a GE company, LLC, as Buyer (incorporated by reference to Exhibit 10.5 to the Current Report of Baker Hughes, a GE company on Form 8-K dated November 13, 2018, Accession No. 0000950103-18-013305).
10.17 Amended and Restated Supply Agreement, dated as of November 13, 2018, between Baker Hughes, a GE company, LLC, as Seller, and General Electric Company, as Buyer (incorporated by reference to Exhibit 10.6 to the Current Report of Baker Hughes, a GE company on Form 8-K dated November 13, 2018, Accession No. 0000950103-18-013305).
10.18 Umbrella Aero-Derivatives IP Agreement, dated as of November 13, 2018, between General Electric Company and Baker Hughes, a GE company, LLC (incorporated by reference to Exhibit 10.14 to the Current Report of Baker Hughes, a GE company on Form 8-K dated November 13, 2018, Accession No. 0000950103-18-013305).
10.19 Equity Repurchase Agreement, dated as of November 6, 2017, by and among General Electric Company, Baker Hughes, a GE company, and Baker Hughes, a GE company, LLC (incorporated by reference to Exhibit 10.1 to the Current Report of Baker Hughes, a GE company on Form 8-K filed on November 7, 2017).
10.20 Equity Repurchase Agreement dated as of November 13, 2018, by and among General Electric Company, Baker Hughes, a GE company, and Baker Hughes, a GE company, LLC (incorporated by reference to Exhibit 10.1 to the Current Report of Baker Hughes, a GE company on Form 8-K dated November 13, 2018, Accession No. 0000950103-18-013306).
10.21 Credit Agreement, dated as of July 3, 2017, among Baker Hughes, a GE company, LLC, JPMorgan Chase Bank, as Administrative Agent, and the Lenders party thereto (incorporated by reference to Exhibit 10.14 to the Current Report of Baker Hughes, a GE company on Form 8-K12B dated July 3, 2017).
10.22+ Form of Indemnification Agreement (incorporated by reference to Exhibit 10.15 to the Current Report of Baker Hughes, a GE company on Form 8-K12B dated July 3, 2017).
10.23+ Baker Hughes, a GE company 2017 Long-Term Incentive Plan (incorporated by reference to Exhibit 10.16 to the Current Report of Baker Hughes, a GE company on Form 8-K12B dated July 3, 2017).
10.24+* Baker Hughes, a GE company Executive Officer Short Term Incentive Compensation Plan.10.25+* Baker Hughes, a GE company Executive Severance Benefits Program.10.26+ Form of Stock Option Award Agreement (incorporated by reference to Exhibit 10.17 to the Current
Report of Baker Hughes, a GE company on Form 8-K12B dated July 3, 2017). 10.27+ Form of Stock Option Award Agreement dated January 2018 (incorporated by reference to Exhibit
10.21 to the Annual Report of Baker Hughes, a GE Company on Form 10-K for the year ended December 31, 2017).
10.28+Form of Senior Executive Stock Option Award Agreement (incorporated by reference to Exhibit 10.18 to the Current Report of Baker Hughes, a GE company on Form 8-K12B dated July 3, 2017).
10.29+ Form of Restricted Stock Unit Award Agreement (incorporated by reference to Exhibit 10.19 to the Current Report of Baker Hughes, a GE company on Form 8-K12B dated July 3, 2017).
10.30+ Form of Restricted Stock Unit Award Agreement (three year cliff vest) dated January 2018 (incorporated by reference to Exhibit 10.24 to the Annual Report of Baker Hughes, a GE Company on Form 10-K for the year ended December 31, 2017).
10.31+ Form of Restricted Stock Unit Award Agreement (three year ratable vest) dated January 2018 (incorporated by reference to Exhibit 10.25 to the Annual Report of Baker Hughes, a GE Company on Form 10-K for the year ended December 31, 2017).
10.32+ Form of Senior Executive Restricted Stock Unit Award Agreement (incorporated by reference to Exhibit 10.20 to the Current Report of Baker Hughes, a GE company on Form 8-K12B dated July 3, 2017).
112 | BHGE 2018 FORM 10-K
10.33+ Form of Senior Executive Performance Share Award Agreement (Performance Metric of Return on Invested Capital) dated January 2018 (incorporated by reference to Exhibit 10.27 to the Annual Report of Baker Hughes, a GE Company on Form 10-K for the year ended December 31, 2017).
10.34+ Form of Senior Executive Performance Share Award Agreement (Performance Metric of Total Shareholder Return) dated January 2018 (incorporated by reference to Exhibit 10.28 to the Annual Report of Baker Hughes, a GE Company on Form 10-K for the year ended December 31, 2017).
10.35+ Form of Director Restricted Stock Unit Award Agreement (incorporated by reference to Exhibit 10.21 to the Current Report of Baker Hughes, a GE company on Form 8-K12B dated July 3, 2017).
10.36+ Form of Director Restricted Stock Unit Award Agreement dated January 2018 (incorporated by reference to Exhibit 10.30 to the Annual Report of Baker Hughes, a GE Company on Form 10-K for the year ended December 31, 2017).
10.37+ Baker Hughes, a GE company Non-Employee Director Deferral Plan (filed as Exhibit 10.1 to the Current Report of Baker Hughes, a GE company on Form 8-K filed on August 4, 2017).
10.38+ Offer Letter between Baker Hughes, a GE company and Lorenzo Simonelli, dated as of August 1, 2017 (filed as Exhibit 10.2 to the Current Report of Baker Hughes, a GE company on Form 8-K filed on August 4, 2017).
10.39+ Outperformance Share Unit Award Agreement between the Company and Lorenzo Simonelli dated as of June 1, 2018 (incorporated by reference to Exhibit 10.1 to the Current Report of Baker Hughes, a GE company on Form 8-K filed on June 1, 2018).
10.40+ Restricted Stock Unit Award Agreement between the Company and Lorenzo Simonelli dated as of June 1, 2018 (incorporated by reference to Exhibit 10.2 to the Current Report of Baker Hughes, a GE company on Form 8-K filed on June 1, 2018).
10.41+ Baker Hughes Incorporated Director Retirement Policy for Certain Former Members of the Board of Directors of Baker Hughes Incorporated (incorporated by reference to Exhibit 10.10 to the Annual Report of Baker Hughes Incorporated on Form 10-K for the year ended December 31, 2003).
10.42+* Baker Hughes, a GE company Supplemental Retirement Plan, as amended and restated effective as of January 1, 2019 (formerly known as Baker Hughes Incorporated Supplemental Retirement Plan).
10.43+ Amended and Restated Baker Hughes Incorporated 2002 Employee Long-Term Incentive Plan effective April 24, 2014 (incorporated by reference to Exhibit 10.2 to the Current Report of Baker Hughes Incorporated on Form 8-K filed on April 29, 2014).
10.44+ Amended and Restated Baker Hughes Incorporated 2002 Director & Officer Long-Term Incentive Plan effective April 24, 2014 (incorporated by reference to Exhibit 10.1 to the Current Report of Baker Hughes Incorporated on Form 8-K filed on April 29, 2014).
10.45+ Form of Baker Hughes Incorporated Nonqualified Stock Option Agreement with Terms and Conditions for officers (incorporated by reference to Exhibit 10.30 to the Annual Report of Baker Hughes Incorporated on Form 10-K for the year ended December 31, 2009).
10.46+ Form of Baker Hughes Incorporated Nonqualified Stock Option Award Agreement and Terms and Conditions for officers (incorporated by reference to Exhibit 10.70 to the Annual Report of Baker Hughes Incorporated on Form 10-K for the year ended December 31, 2011).
10.47+ Form of Baker Hughes Incorporated Nonqualified Stock Option Award Agreement and Terms and Conditions for officers (incorporated by reference to Exhibit 10.6 to the Current Report of Baker Hughes Incorporated on Form 8-K filed on January 28, 2014).
10.48+ Form of Baker Hughes Incorporated Nonqualified Stock Option Award Agreement and Terms and Conditions for officers (incorporated by reference to Exhibit 10.6 to the Quarterly Report of Baker Hughes Incorporated on Form 10-Q for the quarter ended June 30, 2014).
10.49+ Form of Baker Hughes Incorporated Restricted Stock Unit Award Agreement and Terms and Conditions for officers with a three-year graded vesting (incorporated by reference to Exhibit 10.2 to the Current Report of Baker Hughes Incorporated on Form 8-K filed on January 31, 2017).
10.50+ Form of Baker Hughes Incorporated Restricted Stock Unit Award Agreement and Terms and Conditions for officers with a three-year cliff vesting (incorporated by reference to Exhibit 10.1 to the Current Report of Baker Hughes Incorporated on Form 8-K filed on January 31, 2017).
10.51+ Baker Hughes, a GE company Bonus Deferral Plan effective October 26, 2017 (merged into Baker Hughes, a GE company Supplemental Retirement Plan as amended and restated effective January 1, 2019) (incorporated by reference to Exhibit 10.57 to the Annual Report of Baker Hughes, a GE Company on Form 10-K for the year ended December 31, 2017).
10.52+ Baker Hughes, a GE company Employee Stock Purchase Plan (incorporated by reference to Exhibit 99.1 on Form S-8 filed on August 31, 2018).
BHGE 2018 FORM 10-K | 113
10.53+* Employee Benefits Matters Agreement dated as of November 13, 2018 by and among General Electric Company, Baker Hughes, a GE company and Baker Hughes, a GE company, LLC.
10.54+* Form of Stock Option Award Agreement dated January 2019.10.55+* Baker Hughes, a GE company Supplementary Pension Plan Effective as of December 31, 2018.10.56 Plea Agreement between Baker Hughes Services International, Inc. and the United States Department
of Justice filed on April 26, 2007, with the United States District Court of Texas, Houston Division (incorporated by reference to Exhibit 10.5 to the Quarterly Report of Baker Hughes Incorporated on Form 10-Q for the quarter ended March 31, 2007).
21.1* Subsidiaries of the Company.23.1* Consent of KPMG LLP.23.2* Consent of KPMG S.p.A.31.1** Certification of Lorenzo Simonelli, President and Chief Executive Officer, furnished pursuant to Rule
13a-14(a) of the Securities Exchange Act of 1934, as amended.31.2** Certification of Brian Worrell, Chief Financial Officer, furnished pursuant to Rule 13a-14(a) of the
Securities Exchange Act of 1934, as amended.32** Certification of Lorenzo Simonelli, President and Chief Executive Officer, and Brian Worrell, Chief
Financial Officer, furnished pursuant to Rule 13a-14(b) of the Securities Exchange Act of 1934, as amended.
95* Mine Safety Disclosures.101.INS* XBRL Instance Document101.SCH* XBRL Schema Document101.CAL* XBRL Calculation Linkbase Document101.LAB* XBRL Label Linkbase Document101.PRE* XBRL Presentation Linkbase Document101.DEF* XBRL Definition Linkbase Document
ITEM 16. FORM 10-K SUMMARY
None.
114 | BHGE 2018 FORM 10-K
SIGNATURES
Pursuant to the requirements of Section 13 or 15(d) of the Securities Exchange Act of 1934, as amended, the registrant has duly caused this report to be signed on its behalf by the undersigned, thereunto duly authorized.
BAKER HUGHES, A GE COMPANY
Date: February 19, 2019 /s/ LORENZO SIMONELLI
Lorenzo SimonelliChairman, President and Chief Executive Officer
KNOWN ALL PERSONS BY THESE PRESENTS, that each person whose signature appears below constitutes and appoints Lorenzo Simonelli, Brian Worrell and William D. Marsh, each of whom may act without joinder of the other, as their true and lawful attorneys-in-fact and agents, each with full power of substitution and resubstitution, for such person and in his or her name, place and stead, in any and all capacities, to sign any and all amendments to this Annual Report on Form 10-K, and to file the same, with all exhibits thereto and other documents in connection therewith, with the Securities and Exchange Commission, granting unto said attorneys-in-fact and agents full power and authority to do and perform each and every act and thing requisite and necessary to be done in and about the premises, as fully to all intents and purposes as he might or could do in person, hereby ratifying and confirming all that said attorneys-in-fact and agents, or their substitutes, may lawfully do or cause to be done by virtue hereof.
Pursuant to the requirements of the Securities Exchange Act of 1934, as amended, this report has been signed below by the following persons on behalf of the registrant and in the capacities indicated on this 19th day of February 2019.
Signature Title
/s/ LORENZO SIMONELLI Chairman, President and Chief Executive Officer (Lorenzo Simonelli) (principal executive officer)
/S/ BRIAN WORRELL Chief Financial Officer (Brian Worrell) (principal financial officer)
/S/ KURT CAMILLERI Vice President, Controller and Chief Accounting Officer(Kurt Camilleri) (principal accounting officer)

BHGE 2018 FORM 10-K | 115
Signature Title
/s/ W. GEOFFREY BEATTIE Director(W. Geoffrey Beattie)
/s/ GREGORY D. BRENNEMAN Director(Gregory D. Brenneman)
/s/ CLARENCE P. CAZALOT, JR. Director(Clarence P. Cazalot, Jr.)
/s/ MARTIN S. CRAIGHEAD Vice Chairman of the Board(Martin S. Craighead)
/s/ LYNN L. ELSENHANS Director(Lynn L. Elsenhans)
/s/ JAMIE S. MILLER Director(Jamie S. Miller)
/s/ JAMES J. MULVA Director(James J. Mulva)
/s/ JOHN G. RICE Director(John G. Rice)
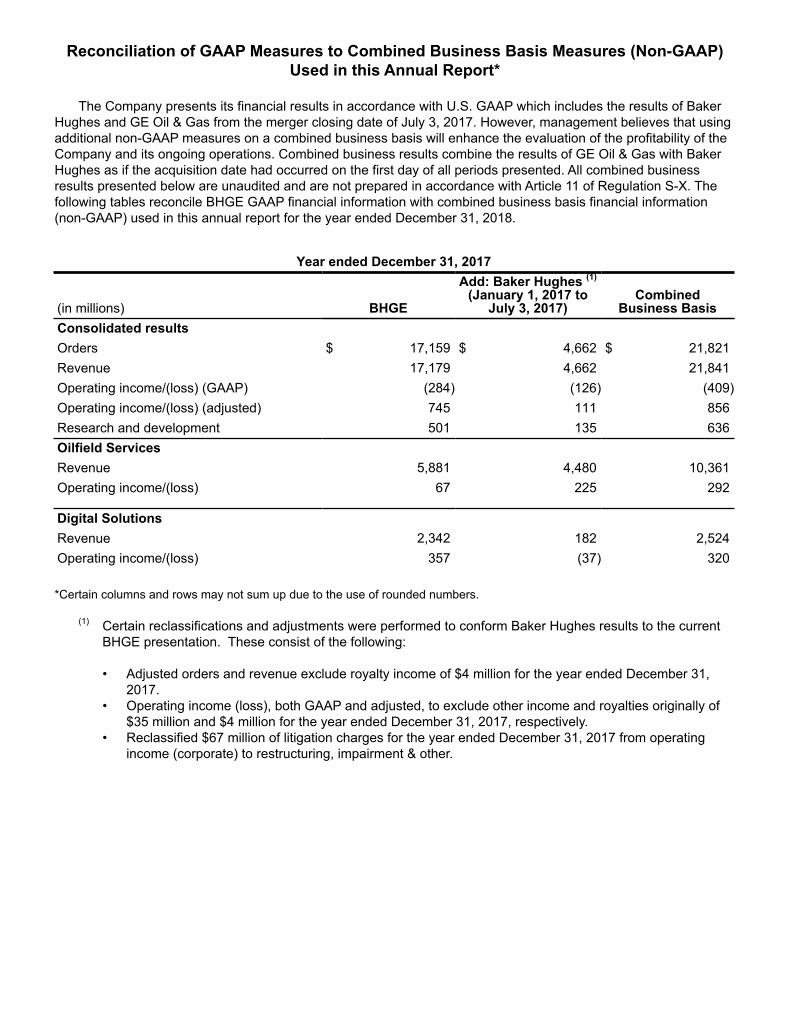
Reconciliation of GAAP Measures to Combined Business Basis Measures (Non-GAAP) Used in this Annual Report*
The Company presents its financial results in accordance with U.S. GAAP which includes the results of Baker Hughes and GE Oil & Gas from the merger closing date of July 3, 2017. However, management believes that using additional non-GAAP measures on a combined business basis will enhance the evaluation of the profitability of the Company and its ongoing operations. Combined business results combine the results of GE Oil & Gas with Baker Hughes as if the acquisition date had occurred on the first day of all periods presented. All combined business results presented below are unaudited and are not prepared in accordance with Article 11 of Regulation S-X. The following tables reconcile BHGE GAAP financial information with combined business basis financial information (non-GAAP) used in this annual report for the year ended December 31, 2018.
Year ended December 31, 2017
(in millions) BHGE
Add: Baker Hughes (1)
(January 1, 2017 to July 3, 2017)
CombinedBusiness Basis
Consolidated resultsOrders $ 17,159 $ 4,662 $ 21,821Revenue 17,179 4,662 21,841Operating income/(loss) (GAAP) (284) (126) (409)Operating income/(loss) (adjusted) 745 111 856Research and development 501 135 636Oilfield ServicesRevenue 5,881 4,480 10,361Operating income/(loss) 67 225 292
Digital SolutionsRevenue 2,342 182 2,524Operating income/(loss) 357 (37) 320
*Certain columns and rows may not sum up due to the use of rounded numbers.
(1) Certain reclassifications and adjustments were performed to conform Baker Hughes results to the current BHGE presentation. These consist of the following:
• Adjusted orders and revenue exclude royalty income of $4 million for the year ended December 31, 2017.
• Operating income (loss), both GAAP and adjusted, to exclude other income and royalties originally of $35 million and $4 million for the year ended December 31, 2017, respectively.
• Reclassified $67 million of litigation charges for the year ended December 31, 2017 from operating income (corporate) to restructuring, impairment & other.
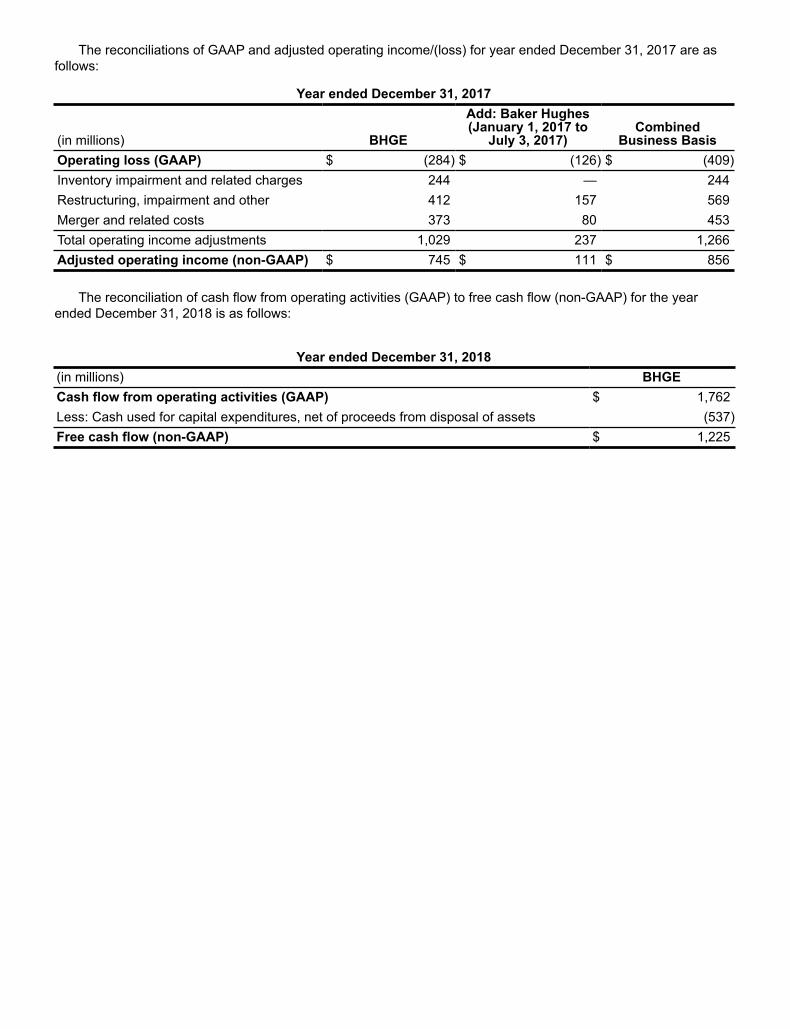
The reconciliations of GAAP and adjusted operating income/(loss) for year ended December 31, 2017 are as follows:
Year ended December 31, 2017
(in millions) BHGE
Add: Baker Hughes
(January 1, 2017 to July 3, 2017)
CombinedBusiness Basis
Operating loss (GAAP) $ (284) $ (126) $ (409)Inventory impairment and related charges 244 — 244Restructuring, impairment and other 412 157 569Merger and related costs 373 80 453Total operating income adjustments 1,029 237 1,266Adjusted operating income (non-GAAP) $ 745 $ 111 $ 856
The reconciliation of cash flow from operating activities (GAAP) to free cash flow (non-GAAP) for the year ended December 31, 2018 is as follows:
Year ended December 31, 2018(in millions) BHGECash flow from operating activities (GAAP) $ 1,762Less: Cash used for capital expenditures, net of proceeds from disposal of assets (537)Free cash flow (non-GAAP) $ 1,225

Corporate InformationBOARD OF DIRECTORS
Lorenzo SimonelliChairman, President and Chief Executive Officer, Baker Hughes, a GE Company
Martin S. Craighead*Vice Chairman, Baker Hughes, a GE Company Former Chairman, President and Chief Executive Officer, Baker Hughes Incorporated
W. Geoffrey BeattieLead Director, Baker Hughes, a GE Company Chief Executive Officer, Generation Capital
Gregory D. BrennemanExecutive Chairman, CCMP Capital Advisors, LLC
Clarence P. Cazalot, Jr. Former Executive Chairman, President and Chief Executive Officer, Marathon Oil Corporation
Lynn L. Elsenhans Former Executive Chairman, President and Chief Executive Officer, Sunoco, Inc.
Jamie S. MillerSenior Vice President and Chief Financial Officer, General Electric
James J. MulvaFormer Chairman and Chief Executive Officer, ConocoPhillips
John G. RiceChairman of General Electric Gas Power
2019 DIRECTOR NOMINEE
Gregory L. EbelFormer Chairman, President and Chief Executive Officer Spectra Energy Corp.
EXECUTIVE LEADERSHIP
Lorenzo SimonelliChairman, President and Chief Executive Officer
Maria Claudia BorrasPresident and CEO, Oilfield Services
Rod ChristiePresident and CEO, Turbomachinery & Process Solutions
Harry ElsingaChief Human Resources Officer
Jennifer HartsockChief Information Officer
Jody MarkopoulosChief Transition Officer
Will MarshChief Legal Officer
Derek MathiesonChief Marketing and Technology Officer
Rami QasemPresident and CEO, Measurement & Controls
Neil Saunders President and CEO, Oilfield Equipment
Uwem UkpongChief Global Operations Officer
Kevin WetheringtonChief HSE, Security & Quality Officer
Brian WorrellChief Financial Officer
Stockholder Information
Transfer Agent and Registrar:Computershare Investor Services
Regular postal mail:ComputershareP.O. Box 505000Louisville, Kentucky40233-5000
Overnight Courier:Computershare462 South 4th Street, Suite 1600Louisville, Kentucky 40202 +1.888.216.8056.
As a BHGE stockholder, you are invited to take advantage of our convenient stockholder services or request more information about BHGE. Computershare Investor Services, our transfer agent, maintains the records for our registered stockholders and can help you with a variety of stockholder-related services, including:
• Change of name or address enrollment
• Duplicate mailings• Lost stock certificates• Additional administrative
services• Consolidation of accounts• Transfer of stock to
another person• Dividend reinvestment
Access your investor statements online 24 hours a day, seven days a week. For more information, go to https://www.computershare.com/ investor
Stock Exchange Listing
Ticker Symbol “BHGE” New York Stock Exchange, Inc.
New York Stock Exchange
Our Annual CEO Certification, without qualifications, was timely submitted to the NYSE. Also, we file our certifications required under SOX as exhibits to our Form 10-K.
Investor Relations Office
Phil MuellerVice President, Investor Relations
Corporate Communications Office
Russell WilkersonChief Communications Officer
Form 10-K
Additional copies of the Company’s Annual Report (Form 10-K) are available by writing:
Investor Relations 17021 Aldine Westfield Rd, Houston, Texas 77073
Also available at our website:http://investors.bhge.com/
Annual Meeting
The Company’s Annual Meeting of Stockholders will be held: 9:00 a.m. Central Daylight Time (CDT) May 10, 2019 2001 Rankin Road Baker Street Conference Room Houston, Texas 77073
Corporate Office Location and Mailing Address
17021 Aldine Westfield Road Houston, Texas 77073
Telephone: +1.713.439.8600
The Ark, 201 Talgarth Road,London, W6 8BJ,United Kingdom
Telephone: +44 (0) 207.302.6982
Website
www.bhge.com
* Mr. Craighead will not stand for re-election in the 2019 annual meeting.