influencing visual judgment through affective priming...
TRANSCRIPT

Influencing Visual Judgment through Affective PrimingLane HarrisonUNC-Charlotte
Charlotte, North [email protected]
Drew SkauUNC-Charlotte
Charlotte, North [email protected]
Steven FranconeriNorthwestern University
Evanston, [email protected]
Aidong LuUNC-Charlotte
Charlotte, North [email protected]
Remco ChangTufts University
Medford, [email protected]
ABSTRACTRecent research suggests that individual personality differ-ences can influence performance with visualizations. In addi-tion to stable personality traits, research in psychology hasfound that temporary changes in affect (emotion) can alsosignificantly impact performance during cognitive tasks. Inthis paper, we show that affective priming also influencesuser performance on visual judgment tasks through an ex-periment that combines affective priming with longstandinggraphical perception experiments. Our results suggest that af-fective priming can influence accuracy in common graphicalperception tasks. We discuss possible explanations for thesefindings, and describe how these findings can be applied todesign visualizations that are less (or more) susceptible to er-ror in common visualization contexts.
Author KeywordsVisualization; Affect; Emotion; Charts
ACM Classification KeywordsH.5.m. Information Interfaces and Presentation (e.g. HCI):Miscellaneous
General TermsHuman Factors; Design; Measurement.
INTRODUCTIONVisual reasoning involves many cognitive processes includingmemory, attention, learning, judgment, creativity, decision-making, and problem-solving [8, 11, 13, 22]. Yet researchin psychology has found that short-term changes in emotionsignificantly influence several of these same cognitive pro-cesses [18, 29]. While researchers have begun to identify keyfactors that influence cognition (e.g. emotion and personality
Permission to make digital or hard copies of all or part of this work forpersonal or classroom use is granted without fee provided that copies arenot made or distributed for profit or commercial advantage and that copiesbear this notice and the full citation on the first page. To copy otherwise, orrepublish, to post on servers or to redistribute to lists, requires prior specificpermission and/or a fee.CHI 2013, April 27–May 2, 2013, Paris, France.Copyright 2013 ACM 978-1-4503-1899-0/13/04...$15.00.
traits), the impact that such factors have on a user’s ability toperceive information remains largely unexplored.
Emotion, often referred to as affect in psychology, is typi-cally defined by values along two dimensions: valence (pos-itive or negative feelings) and arousal (the intensity of thosefeelings). To study the impact of affect on various cognitivetasks, many studies in psychology involve manipulating va-lence and/or arousal via emotional stimuli. This techniqueof inducing emotion in human participants is referred to asaffective priming.
Affect has been shown to influence both low-level cognitiveabilities (attention, memory) [1, 50] as well as high-levelabilities (creativity, decision-making, problem-solving) [2, 6,35]. Since recent research in visualization has identified aclose relationship between a user’s cognitive abilities withtheir ability to perceive and understand information in visual-izations [8, 11], we hypothesize that there exists a relationshipbetween affect and visual judgment.
In this paper, we describe an experiment which uses affec-tive priming to influence visual judgment. Cleveland andMcGill’s seminal results [10] serve as a basis for this graph-ical perception study, as they have been replicated and ex-tended by Heer and Bostock [24] as well as adapted to studythe effect of social information on visual judgments by Hull-man et al. [28]. Specifically, we follow Cleveland andMcGill’s experiments which compare user accuracy with var-ious position-length chart types (see Figure 1). We also ex-tend their work by building on both recent crowdsourcedgraphical perception studies [16, 20] and affective primingstudies [14, 27] to examine how emotion influences visualjudgment [23].
We conduct an experiment which combines affective primingtechniques with visual judgment tasks using Amazon’s Me-chanical Turk (AMT hereafter). We initially performed twopilot studies to verify our study design, emotional stimuli,and emotion-measurement metrics. For our main experiment,we recruited 963 participants to be either negatively or posi-tively primed and to complete several visual judgment taskssimilar to those found in Cleveland and McGill [10], Heerand Bostock [24], and Hullman et al. [28]. Our results indi-cate that affective priming significantly influenced the visual

judgments of participants, and that positive priming improvedaccuracy.
ContributionsThis paper makes a number of contributions to our under-standing of how emotion, a fundamental component of hu-man cognition, relates to graphical perception, a fundamentalcomponent of visualization:
• First, we present experimental evidence demonstrating thataffective priming can significantly influence visual judg-ment accuracy.
• Second, we corroborate these findings with related re-search in cognitive psychology and discuss how changesin affect arise in visualization contexts.
• Finally, we describe several cases in which these resultscan be used to help choose effective visualizations for dif-ferent audiences and contexts.
To avoid confusion, we note a caveat about the use of theword perception in graphical perception studies. In thesestudies, participants must not only identify (perceive) thegraphical elements (bars, pie slices), but also make judgmentson the proportion of one element to another. Since these judg-ments involve attention, working memory, and mental trans-lation/manipulation, they are cognitive in nature. One recentstudy uses the term “visual judgment”, which we adopt here[28]. Throughout this paper, we refer to graphical perceptionstudies which involve visual judgments.
RELATED WORK
Graphical PerceptionGraphical perception is a fundamental component of visual-ization, and is the subject of several recent works [24, 28].The results from these studies have been used extensively inboth the development of automatic presentation systems [38]and as a basis for visualization design principles [5].
Recently, Heer and Bostock replicated and extended a por-tion of Cleveland and McGill’s experiments [24] on variouschart types using AMT (see Figure 1). The rankings obtainedin their crowdsourced studies were similar to Cleveland andMcGill’s rankings. These results validate AMT as a viable,scalable platform for visualization research.
Hullman et al. also leverage AMT and revise Heer and Bo-stock’s graphical perception experiment [28] to explore theimpact of social information on visual judgment. Their re-sults suggest that visual judgment can be significantly influ-enced by adding social information, which has implicationsin collaborative and social visualization environments. Sim-ilarly, we explore the effect of affective priming on graphi-cal perception (instead of the effect of social information ongraphical perception). Our experiment also includes addi-tional chart types in order to explore possible cognitive mech-anisms (e.g. attention, memory, embodied cognition) throughwhich affect influences visual judgment.
Cleveland & McGill's Results
1.0 1.5 2.0 2.5 3.0
T1
T2
T3
T4
T5
Log Error
Crowdsourced Results
1.0 1.5 2.0 2.5 3.0
T1
T2
T3
T4
T5
T6
T7
T8
T9
Log Error
Figure 1. Cleveland and McGill’s results and Heer and Bostock crowd-sourced replication (from [24]).
Affect and CognitionThere is a large body of research on affect and its influence onvarious cognitive processes. These processes include atten-tion, memory, creativity, problem-solving, decision-making,and others [2, 18, 29, 50, 51]. Early literature in this areafocused on behavioral studies, but has recently been supple-mented by studies which have identified the neurological fac-tors related to emotion and cognition [51]. Here, we discussresearch as it relates to the cognitive processes used in visual-ization. Specifically, we focus on attention and memory sincethey are low level components and, thus, are relevant to thelow-level nature of graphical perception.
Several studies have explored the relationship between emo-tion and attention [40, 51], and specifically how attention re-lates to visual processes [50]. These studies show that whenaffective priming precedes cognitive tasks, the effect of theprime is carried over and influences attention regulation [40,43]. Positive priming is usually linked to better performance[44], but there is also evidence that negative priming can alsoproduce desirable behavior [19] such as increased caution indecisions involving risk. For a discussion on possible neu-rological factors and other attention regulation processes, seeVuilleumier and Huang [51].
In addition to impacting attention, emotion has been shownto play a role in memory [31]. Studies show that emotion canhave a significant impact on long-term recall [2], as well as in-fluence working memory [1, 32]. Recent research also showsthat negative affect can support memory of details, while pos-itive affect increases working memory performance and sup-ports memory of the “big picture” of situations [1, 32]. An-other experiment found that anxiety (which falls under neg-
ative affect) can significantly disrupt visuospatial workingmemory, leaving verbal working memory intact [45]. Ourstudy is partially based on these prior findings, and apply thesame text-based affective priming techniques as presented byGoeritz and Verheyen [21, 48].
Judgment (or decision-making) is defined as the process bywhich one assesses future outcomes and examines various al-ternatives, typically through cost-benefit analysis [3]. Emo-tion plays a significant component in decision-making, aseach possible outcome is associated with emotional conse-quences [3, 37]. In fact, emotion is so strongly linked todecision-making that persons who are perceptually and cog-nitively normal, except for an inability to experience emo-tions, are incapable of making even basic decisions [12].Other studies have shown that affect also plays a role in plan-ning and risk perception [6, 37].
Positive emotions have been shown to support creativity andopen-ended reasoning [18]. A recent crowdsourced experi-ment showed that positive priming (using images) increasedthe quality of ideas generated on a range of tasks requir-ing creativity [35]. These results were used to make designsuggestions for creativity-support software. Positive emotionis also linked to better performance in creative and generalproblem-solving [18, 29, 30].
In general, positive emotions tend to lead to better cognitiveperformance, and negative emotions (with some exceptions)lead to decreased performance. Yet we currently do not knowto what extent affect can impact visualization use and perfor-mance. Hence the motivation for our study: to prime partic-ipants with positive or negative affect and to measure theirperformance on visual judgment tasks.
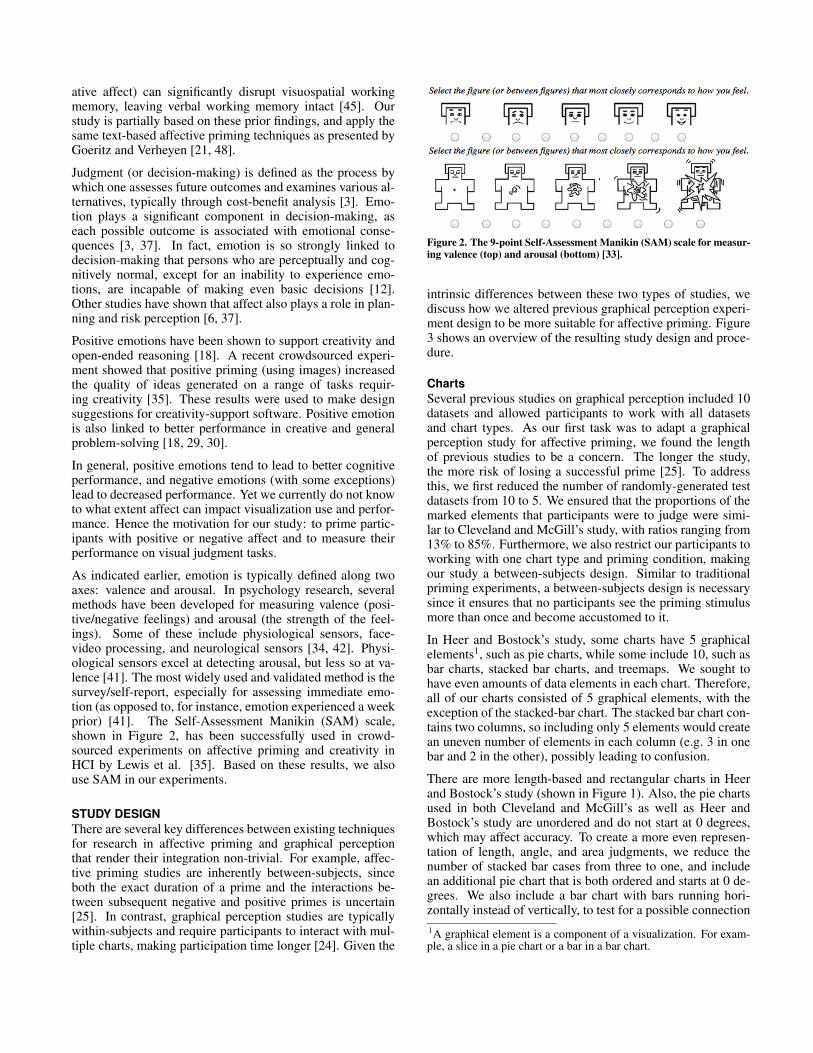
As indicated earlier, emotion is typically defined along twoaxes: valence and arousal. In psychology research, severalmethods have been developed for measuring valence (posi-tive/negative feelings) and arousal (the strength of the feel-ings). Some of these include physiological sensors, face-video processing, and neurological sensors [34, 42]. Physi-ological sensors excel at detecting arousal, but less so at va-lence [41]. The most widely used and validated method is thesurvey/self-report, especially for assessing immediate emo-tion (as opposed to, for instance, emotion experienced a weekprior) [41]. The Self-Assessment Manikin (SAM) scale,shown in Figure 2, has been successfully used in crowd-sourced experiments on affective priming and creativity inHCI by Lewis et al. [35]. Based on these results, we alsouse SAM in our experiments.
STUDY DESIGNThere are several key differences between existing techniquesfor research in affective priming and graphical perceptionthat render their integration non-trivial. For example, affec-tive priming studies are inherently between-subjects, sinceboth the exact duration of a prime and the interactions be-tween subsequent negative and positive primes is uncertain[25]. In contrast, graphical perception studies are typicallywithin-subjects and require participants to interact with mul-tiple charts, making participation time longer [24]. Given the
Figure 2. The 9-point Self-Assessment Manikin (SAM) scale for measur-ing valence (top) and arousal (bottom) [33].
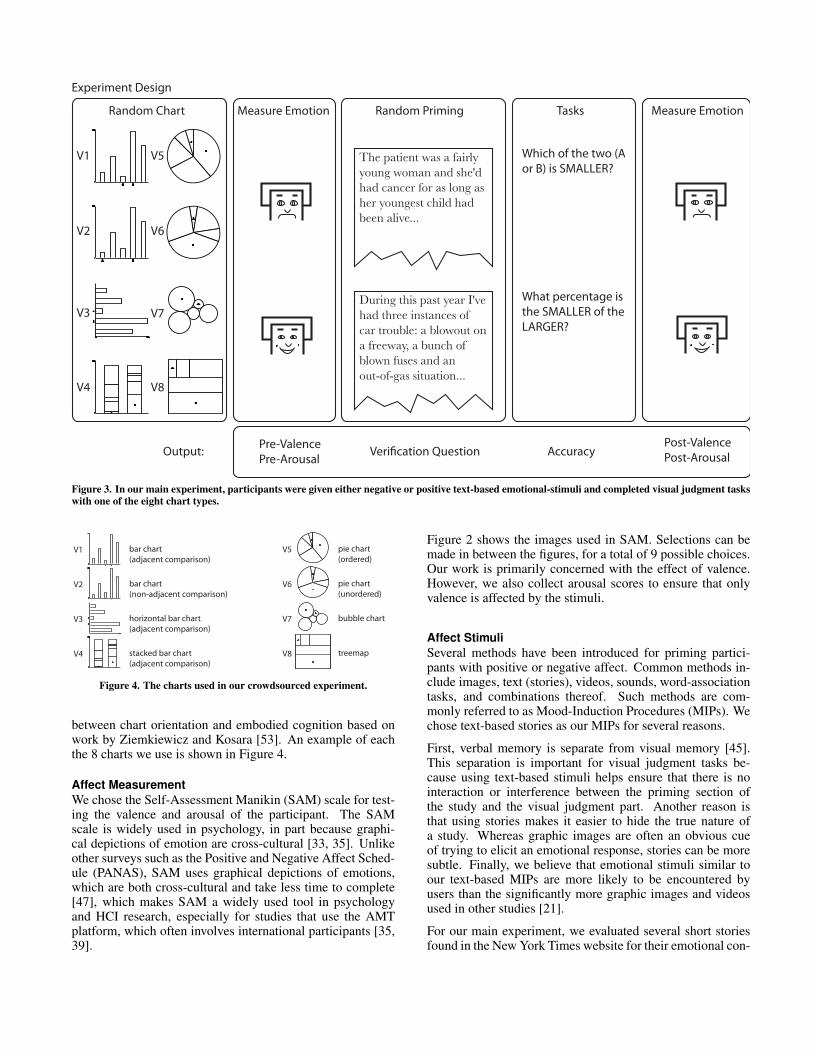
intrinsic differences between these two types of studies, wediscuss how we altered previous graphical perception experi-ment design to be more suitable for affective priming. Figure3 shows an overview of the resulting study design and proce-dure.
ChartsSeveral previous studies on graphical perception included 10datasets and allowed participants to work with all datasetsand chart types. As our first task was to adapt a graphicalperception study for affective priming, we found the lengthof previous studies to be a concern. The longer the study,the more risk of losing a successful prime [25]. To addressthis, we first reduced the number of randomly-generated testdatasets from 10 to 5. We ensured that the proportions of themarked elements that participants were to judge were simi-lar to Cleveland and McGill’s study, with ratios ranging from13% to 85%. Furthermore, we also restrict our participants toworking with one chart type and priming condition, makingour study a between-subjects design. Similar to traditionalpriming experiments, a between-subjects design is necessarysince it ensures that no participants see the priming stimulusmore than once and become accustomed to it.
In Heer and Bostock’s study, some charts have 5 graphicalelements1, such as pie charts, while some include 10, such asbar charts, stacked bar charts, and treemaps. We sought tohave even amounts of data elements in each chart. Therefore,all of our charts consisted of 5 graphical elements, with theexception of the stacked-bar chart. The stacked bar chart con-tains two columns, so including only 5 elements would createan uneven number of elements in each column (e.g. 3 in onebar and 2 in the other), possibly leading to confusion.
There are more length-based and rectangular charts in Heerand Bostock’s study (shown in Figure 1). Also, the pie chartsused in both Cleveland and McGill’s as well as Heer andBostock’s study are unordered and do not start at 0 degrees,which may affect accuracy. To create a more even represen-tation of length, angle, and area judgments, we reduce thenumber of stacked bar cases from three to one, and includean additional pie chart that is both ordered and starts at 0 de-grees. We also include a bar chart with bars running hori-zontally instead of vertically, to test for a possible connection1A graphical element is a component of a visualization. For exam-ple, a slice in a pie chart or a bar in a bar chart.
Output:
Experiment Design
Pre-ValencePre-Arousal
Post-ValencePost-ArousalAccuracyVeri�cation Question
A B
100
0
A
B
100
0
A B
100
0
A
B
A
B
tree
A
B
A
B
1000
A
B
Random Chart Measure Emotion Random Priming
The patient was a fairly young woman and she'd had cancer for as long as her youngest child had been alive...
During this past year I've had three instances of car trouble: a blowout on a freeway, a bunch of blown fuses and an out-of-gas situation...
Tasks
Which of the two (A or B) is SMALLER?
What percentage is the SMALLER of the LARGER?
Measure Emotion
V1
V2
V3
V4
V5
V6
V7
V8
Figure 3. In our main experiment, participants were given either negative or positive text-based emotional-stimuli and completed visual judgment taskswith one of the eight chart types.
A B
100
0
A
B
100
0
A B
100
0
A
B
A
B
tree
A
B
A
B
1000
A
B
V1
V2
V3
V4
V5
V6
V7
V8
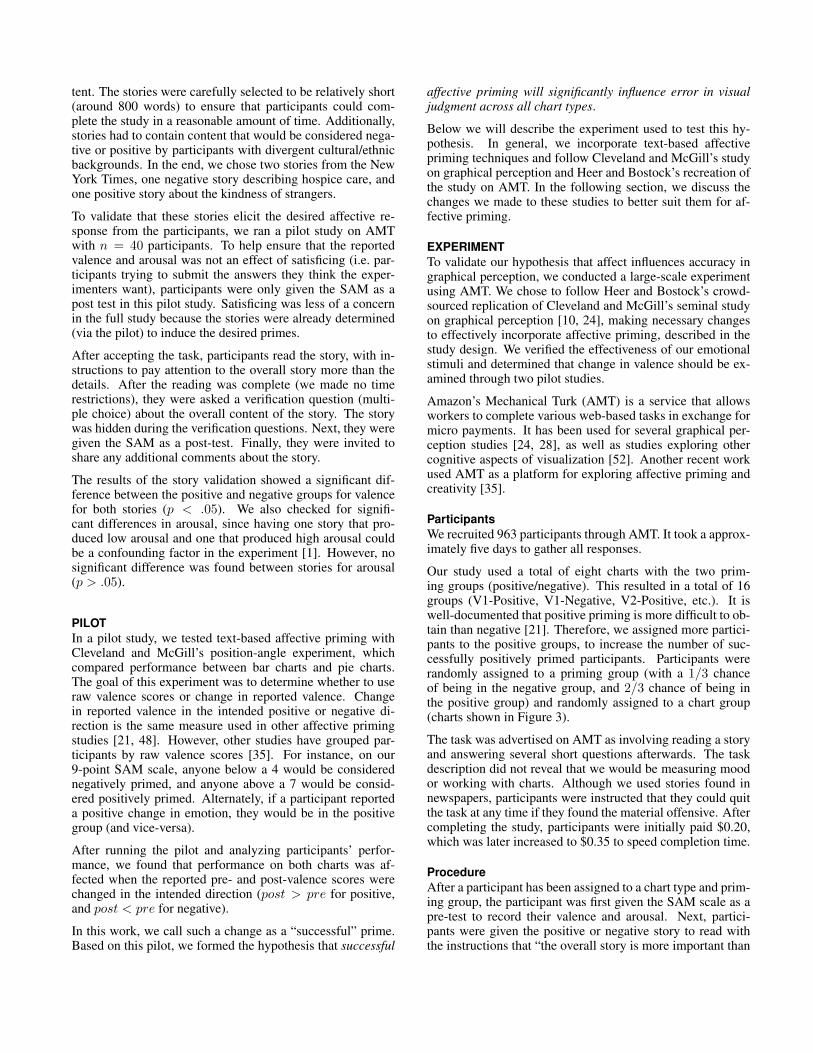
bar chart(adjacent comparison)
bar chart(non-adjacent comparison)
horizontal bar chart(adjacent comparison)
stacked bar chart(adjacent comparison)
pie chart(ordered)
pie chart(unordered)
bubble chart
treemap
Figure 4. The charts used in our crowdsourced experiment.
between chart orientation and embodied cognition based onwork by Ziemkiewicz and Kosara [53]. An example of eachthe 8 charts we use is shown in Figure 4.
Affect MeasurementWe chose the Self-Assessment Manikin (SAM) scale for test-ing the valence and arousal of the participant. The SAMscale is widely used in psychology, in part because graphi-cal depictions of emotion are cross-cultural [33, 35]. Unlikeother surveys such as the Positive and Negative Affect Sched-ule (PANAS), SAM uses graphical depictions of emotions,which are both cross-cultural and take less time to complete[47], which makes SAM a widely used tool in psychologyand HCI research, especially for studies that use the AMTplatform, which often involves international participants [35,39].
Figure 2 shows the images used in SAM. Selections can bemade in between the figures, for a total of 9 possible choices.Our work is primarily concerned with the effect of valence.However, we also collect arousal scores to ensure that onlyvalence is affected by the stimuli.
Affect StimuliSeveral methods have been introduced for priming partici-pants with positive or negative affect. Common methods in-clude images, text (stories), videos, sounds, word-associationtasks, and combinations thereof. Such methods are com-monly referred to as Mood-Induction Procedures (MIPs). Wechose text-based stories as our MIPs for several reasons.
First, verbal memory is separate from visual memory [45].This separation is important for visual judgment tasks be-cause using text-based stimuli helps ensure that there is nointeraction or interference between the priming section ofthe study and the visual judgment part. Another reason isthat using stories makes it easier to hide the true nature ofa study. Whereas graphic images are often an obvious cueof trying to elicit an emotional response, stories can be moresubtle. Finally, we believe that emotional stimuli similar toour text-based MIPs are more likely to be encountered byusers than the significantly more graphic images and videosused in other studies [21].
For our main experiment, we evaluated several short storiesfound in the New York Times website for their emotional con-
tent. The stories were carefully selected to be relatively short(around 800 words) to ensure that participants could com-plete the study in a reasonable amount of time. Additionally,stories had to contain content that would be considered nega-tive or positive by participants with divergent cultural/ethnicbackgrounds. In the end, we chose two stories from the NewYork Times, one negative story describing hospice care, andone positive story about the kindness of strangers.
To validate that these stories elicit the desired affective re-sponse from the participants, we ran a pilot study on AMTwith n = 40 participants. To help ensure that the reportedvalence and arousal was not an effect of satisficing (i.e. par-ticipants trying to submit the answers they think the exper-imenters want), participants were only given the SAM as apost test in this pilot study. Satisficing was less of a concernin the full study because the stories were already determined(via the pilot) to induce the desired primes.
After accepting the task, participants read the story, with in-structions to pay attention to the overall story more than thedetails. After the reading was complete (we made no timerestrictions), they were asked a verification question (multi-ple choice) about the overall content of the story. The storywas hidden during the verification questions. Next, they weregiven the SAM as a post-test. Finally, they were invited toshare any additional comments about the story.
The results of the story validation showed a significant dif-ference between the positive and negative groups for valencefor both stories (p < .05). We also checked for signifi-cant differences in arousal, since having one story that pro-duced low arousal and one that produced high arousal couldbe a confounding factor in the experiment [1]. However, nosignificant difference was found between stories for arousal(p > .05).
PILOTIn a pilot study, we tested text-based affective priming withCleveland and McGill’s position-angle experiment, whichcompared performance between bar charts and pie charts.The goal of this experiment was to determine whether to useraw valence scores or change in reported valence. Changein reported valence in the intended positive or negative di-rection is the same measure used in other affective primingstudies [21, 48]. However, other studies have grouped par-ticipants by raw valence scores [35]. For instance, on our9-point SAM scale, anyone below a 4 would be considerednegatively primed, and anyone above a 7 would be consid-ered positively primed. Alternately, if a participant reporteda positive change in emotion, they would be in the positivegroup (and vice-versa).
After running the pilot and analyzing participants’ perfor-mance, we found that performance on both charts was af-fected when the reported pre- and post-valence scores werechanged in the intended direction (post > pre for positive,and post < pre for negative).
In this work, we call such a change as a “successful” prime.Based on this pilot, we formed the hypothesis that successful
affective priming will significantly influence error in visualjudgment across all chart types.
Below we will describe the experiment used to test this hy-pothesis. In general, we incorporate text-based affectivepriming techniques and follow Cleveland and McGill’s studyon graphical perception and Heer and Bostock’s recreation ofthe study on AMT. In the following section, we discuss thechanges we made to these studies to better suit them for af-fective priming.
EXPERIMENTTo validate our hypothesis that affect influences accuracy ingraphical perception, we conducted a large-scale experimentusing AMT. We chose to follow Heer and Bostock’s crowd-sourced replication of Cleveland and McGill’s seminal studyon graphical perception [10, 24], making necessary changesto effectively incorporate affective priming, described in thestudy design. We verified the effectiveness of our emotionalstimuli and determined that change in valence should be ex-amined through two pilot studies.
Amazon’s Mechanical Turk (AMT) is a service that allowsworkers to complete various web-based tasks in exchange formicro payments. It has been used for several graphical per-ception studies [24, 28], as well as studies exploring othercognitive aspects of visualization [52]. Another recent workused AMT as a platform for exploring affective priming andcreativity [35].
ParticipantsWe recruited 963 participants through AMT. It took a approx-imately five days to gather all responses.
Our study used a total of eight charts with the two prim-ing groups (positive/negative). This resulted in a total of 16groups (V1-Positive, V1-Negative, V2-Positive, etc.). It iswell-documented that positive priming is more difficult to ob-tain than negative [21]. Therefore, we assigned more partici-pants to the positive groups, to increase the number of suc-cessfully positively primed participants. Participants wererandomly assigned to a priming group (with a 1/3 chanceof being in the negative group, and 2/3 chance of being inthe positive group) and randomly assigned to a chart group(charts shown in Figure 3).
The task was advertised on AMT as involving reading a storyand answering several short questions afterwards. The taskdescription did not reveal that we would be measuring moodor working with charts. Although we used stories found innewspapers, participants were instructed that they could quitthe task at any time if they found the material offensive. Aftercompleting the study, participants were initially paid $0.20,which was later increased to $0.35 to speed completion time.
ProcedureAfter a participant has been assigned to a chart type and prim-ing group, the participant was first given the SAM scale as apre-test to record their valence and arousal. Next, partici-pants were given the positive or negative story to read withthe instructions that “the overall story is more important than
A B
100
0
A
B
100
0
A B
100
0
A
B
A
B
tree
A
B
A
B
1000
A
B
V1
V2
V3
V4
V5
V6
V7
V8
0 1 2 3 4
Positively Primed
Negatively Primed
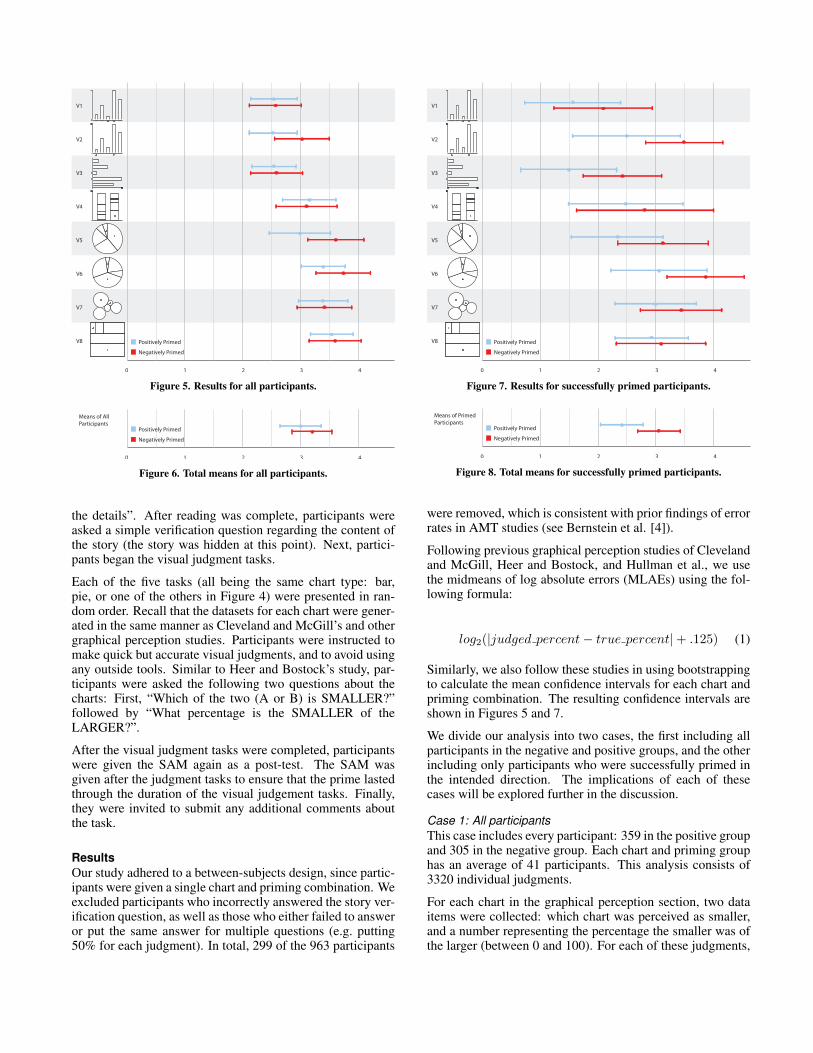
Figure 5. Results for all participants.
0 1 2 3 4
Positively Primed
Negatively Primed
Means of AllParticipants
Figure 6. Total means for all participants.
the details”. After reading was complete, participants wereasked a simple verification question regarding the content ofthe story (the story was hidden at this point). Next, partici-pants began the visual judgment tasks.
Each of the five tasks (all being the same chart type: bar,pie, or one of the others in Figure 4) were presented in ran-dom order. Recall that the datasets for each chart were gener-ated in the same manner as Cleveland and McGill’s and othergraphical perception studies. Participants were instructed tomake quick but accurate visual judgments, and to avoid usingany outside tools. Similar to Heer and Bostock’s study, par-ticipants were asked the following two questions about thecharts: First, “Which of the two (A or B) is SMALLER?”followed by “What percentage is the SMALLER of theLARGER?”.
After the visual judgment tasks were completed, participantswere given the SAM again as a post-test. The SAM wasgiven after the judgment tasks to ensure that the prime lastedthrough the duration of the visual judgement tasks. Finally,they were invited to submit any additional comments aboutthe task.
ResultsOur study adhered to a between-subjects design, since partic-ipants were given a single chart and priming combination. Weexcluded participants who incorrectly answered the story ver-ification question, as well as those who either failed to answeror put the same answer for multiple questions (e.g. putting50% for each judgment). In total, 299 of the 963 participants
A B
100
0
A
B
100
0
A B
100
0
A
B
A
B
tree
A
B
A
B
1000
A
B
V1
V2
V3
V4
V5
V6
V7
V8
0 1 2 3 4
Positively Primed
Negatively Primed
Figure 7. Results for successfully primed participants.
0 1 2 3 4
Positively Primed
Negatively Primed
Means of PrimedParticipants
Figure 8. Total means for successfully primed participants.
were removed, which is consistent with prior findings of errorrates in AMT studies (see Bernstein et al. [4]).
Following previous graphical perception studies of Clevelandand McGill, Heer and Bostock, and Hullman et al., we usethe midmeans of log absolute errors (MLAEs) using the fol-lowing formula:
log2(|judged percent− true percent|+ .125) (1)
Similarly, we also follow these studies in using bootstrappingto calculate the mean confidence intervals for each chart andpriming combination. The resulting confidence intervals areshown in Figures 5 and 7.
We divide our analysis into two cases, the first including allparticipants in the negative and positive groups, and the otherincluding only participants who were successfully primed inthe intended direction. The implications of each of thesecases will be explored further in the discussion.
Case 1: All participantsThis case includes every participant: 359 in the positive groupand 305 in the negative group. Each chart and priming grouphas an average of 41 participants. This analysis consists of3320 individual judgments.
For each chart in the graphical perception section, two dataitems were collected: which chart was perceived as smaller,and a number representing the percentage the smaller was ofthe larger (between 0 and 100). For each of these judgments,

we compute the MLAEs using the formula mentioned previ-ously. We then compute the mean error and 95% confidenceintervals for each chart and priming type.
The results of these calculations are shown in Figure 5.Following Hullman et al., we also take the results for allcharts in each priming group together, including all chart er-ror scores for each participant in the negative- and positive-primed groups. A t-test on these groups was not significantt(662) = 1.8318, p = .067, This is not surprising becausethe difference between positive (M = 3.00, SD = 1.39) andnegative (M = 3.20, SD = 1.475) is only 0.2, which is a smalldifference in error.
Recall that in our pilot study, we explored two common met-rics for defining negative and positive groups. One approachdivides groups based on raw valence scores, and the other onwhether the change in pre- to post- valence scores occur inthe intended direction [21, 48]. The results of the pilot studyfound a possible influence for change in valence on visualjudgment. Based on these results, we include the change invalence metric in our second case.
Case 2: Successfully primed participantsIn this case we include those who were succesfully primed inthe intended negative or positive direction. Specifically, weinclude those whose post-valence is higher than pre-valencefor the positive group, and vice-versa for the negative group.This resulted in 87 participants in the positive condition and120 in the negative condition for a total of n = 197. Therewas an average of 13 participants for a single chart and prim-ing condition (out of 16 total possible combinations). Eachparticipant made judgments on 5 charts. Therefore, this anal-ysis consists of approximately 985 individual judgments.
As before, we compute the MLAEs for each judgment andcombine these to produce a mean errors and confidence in-tervals for each chart and priming condition. The results ofthese calculations are shown in Figure 7.
We then compare positive error with negative error using at-test. This yields a significant effect for error t(205) =3.1560, p = .0018, with error in the negative group beinghigher than that of the positive group. The lowest error ap-peared in the positive group (M = 2.42, SD = 1.47), meaningparticipants in the positive group performed better on visualjudgment tasks than those in the negative group (M = 3.05,SD = 1.49). These results are consistent with our hypothesisthat affective priming can significantly impact visual judg-ment performance in participants who report a change in va-lence scores.
An interesting finding is that it appears that positive prim-ing tends to improve performance, rather than negative prim-ing decreasing performance. We see this by comparing thedata in Figures 6 and 8. It appears that, on average acrossall charts, negative priming stays about the same. To testthis, we compare the successfully primed positive group (M= 2.42, SD = 1.47) against all positively primed participants(M = 3.00, SD = 1.39). Doing so, we see a significant effectfor error t(444) = 3.5634, p < .001, with the successfully-primed participants having significantly lower error than the
total positive group. This supports the notion that positivepriming can improve visual judgment accuracy.
Other interesting findings can be seen by looking at the indi-vidual difference in charts in the Figure 5. Following Cleve-land and McGill as well as Heer and Bostock, rather than testeach chart pair for significant differences, we will simply dis-cuss the relative rankings between charts and the effects ofaffective priming in the following section.
DISCUSSIONConsistent with past research on the impact of affect andlow level cognitive processes [40, 44], we found that affec-tive priming also influences performance on visual judgmenttasks involving several chart types commonly used in visual-ization [10, 24, 28]. Furthermore, as much research on affecthas focused on the relationship between positive affect andincreased cognitive performance [29, 30, 44], we also foundthat successful positive priming yielded significantly bettervisual judgment performance.
There are many ways in which the affect might impact per-formance. Given the low-level nature of the visual judg-ment tasks described in our experiment (the perception oflarger/smaller elements and the estimation of the differencein their sizes) we find it useful to focus on low-level cognitiveprocesses such as attention and working memory, which canbe enhanced by priming positive affect [50, 1, 32].
While positive affect might improve these processes partlythrough higher overall engagement and alertness [44], it isalso likely that different moods place observers in states thatare better or worse for given tasks. For instance, positivemoods can expand the scope of the conceptual ‘spotlight’, increativity tasks where observers must generate new uses fortools [35], identify words that form compounds with an arbi-trary set of other words [44], or solutions to anagrams [46].
But positive moods can also expand the scope of the percep-tual spotlight of attention [15]. They encourage an observerto process a larger spatial area of the world in a single glance[44, 20], relative to negative or anxious moods that constrictthis spatial area [16]. These effects are often demonstrated byasking observers to make a decision about a small spatial area(e.g. discriminate a letter at the center of a screen), and show-ing that incompatible information within the broader spatialarea (e.g., another letter that tempts the ‘wrong’ answer) in-terferes more after positive mood priming than after negativeor anxious mood priming.
Work from the perceptual psychology literature also suggeststhat some visual operations are more efficient under a broadspatial scope. These include determining the distance be-tween two objects [7], deciding whether two objects are vi-sually similar [17], or extracting statistical summary infor-mation (about e.g., size or orientation) from a collection ofobjects [9]. In contrast, a more narrow spatial scope may benecessary for processing spatial relations between objects [7,17] or accessing fine details [40].
These differences in the perceptual scope of attention mightserve as a mediating factor that causes mood to impact per-
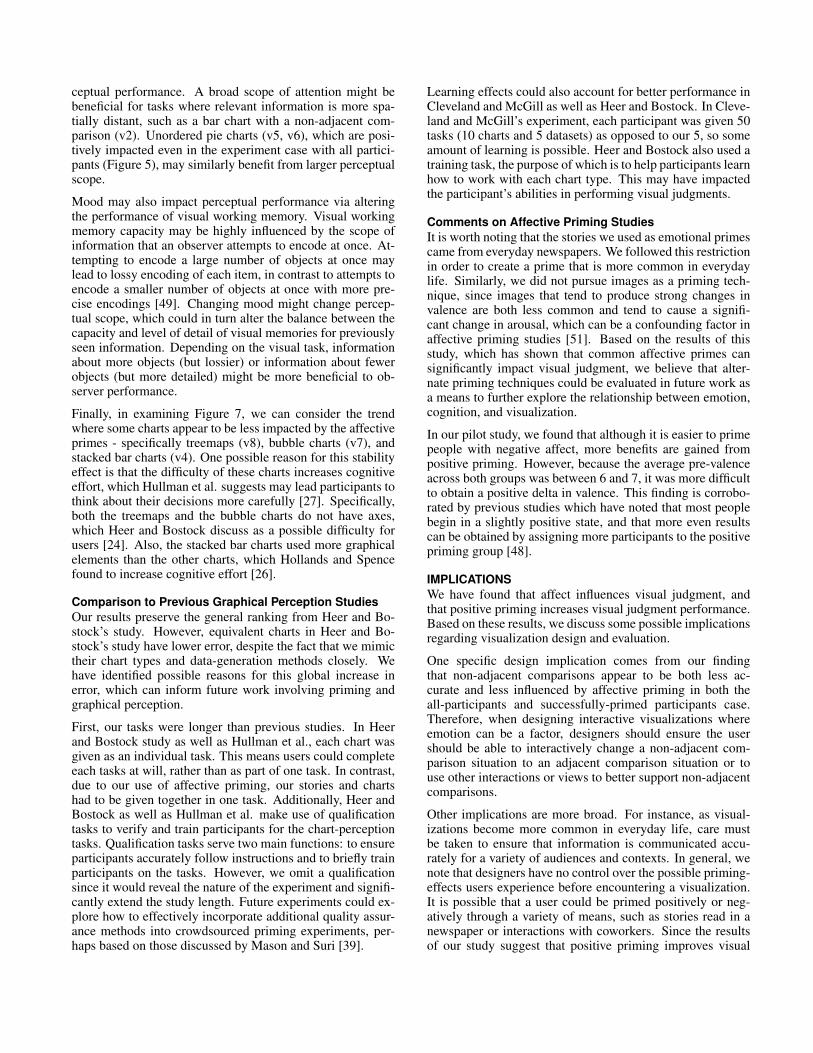
ceptual performance. A broad scope of attention might bebeneficial for tasks where relevant information is more spa-tially distant, such as a bar chart with a non-adjacent com-parison (v2). Unordered pie charts (v5, v6), which are posi-tively impacted even in the experiment case with all partici-pants (Figure 5), may similarly benefit from larger perceptualscope.
Mood may also impact perceptual performance via alteringthe performance of visual working memory. Visual workingmemory capacity may be highly influenced by the scope ofinformation that an observer attempts to encode at once. At-tempting to encode a large number of objects at once maylead to lossy encoding of each item, in contrast to attempts toencode a smaller number of objects at once with more pre-cise encodings [49]. Changing mood might change percep-tual scope, which could in turn alter the balance between thecapacity and level of detail of visual memories for previouslyseen information. Depending on the visual task, informationabout more objects (but lossier) or information about fewerobjects (but more detailed) might be more beneficial to ob-server performance.
Finally, in examining Figure 7, we can consider the trendwhere some charts appear to be less impacted by the affectiveprimes - specifically treemaps (v8), bubble charts (v7), andstacked bar charts (v4). One possible reason for this stabilityeffect is that the difficulty of these charts increases cognitiveeffort, which Hullman et al. suggests may lead participants tothink about their decisions more carefully [27]. Specifically,both the treemaps and the bubble charts do not have axes,which Heer and Bostock discuss as a possible difficulty forusers [24]. Also, the stacked bar charts used more graphicalelements than the other charts, which Hollands and Spencefound to increase cognitive effort [26].
Comparison to Previous Graphical Perception StudiesOur results preserve the general ranking from Heer and Bo-stock’s study. However, equivalent charts in Heer and Bo-stock’s study have lower error, despite the fact that we mimictheir chart types and data-generation methods closely. Wehave identified possible reasons for this global increase inerror, which can inform future work involving priming andgraphical perception.
First, our tasks were longer than previous studies. In Heerand Bostock study as well as Hullman et al., each chart wasgiven as an individual task. This means users could completeeach tasks at will, rather than as part of one task. In contrast,due to our use of affective priming, our stories and chartshad to be given together in one task. Additionally, Heer andBostock as well as Hullman et al. make use of qualificationtasks to verify and train participants for the chart-perceptiontasks. Qualification tasks serve two main functions: to ensureparticipants accurately follow instructions and to briefly trainparticipants on the tasks. However, we omit a qualificationsince it would reveal the nature of the experiment and signifi-cantly extend the study length. Future experiments could ex-plore how to effectively incorporate additional quality assur-ance methods into crowdsourced priming experiments, per-haps based on those discussed by Mason and Suri [39].
Learning effects could also account for better performance inCleveland and McGill as well as Heer and Bostock. In Cleve-land and McGill’s experiment, each participant was given 50tasks (10 charts and 5 datasets) as opposed to our 5, so someamount of learning is possible. Heer and Bostock also used atraining task, the purpose of which is to help participants learnhow to work with each chart type. This may have impactedthe participant’s abilities in performing visual judgments.
Comments on Affective Priming StudiesIt is worth noting that the stories we used as emotional primescame from everyday newspapers. We followed this restrictionin order to create a prime that is more common in everydaylife. Similarly, we did not pursue images as a priming tech-nique, since images that tend to produce strong changes invalence are both less common and tend to cause a signifi-cant change in arousal, which can be a confounding factor inaffective priming studies [51]. Based on the results of thisstudy, which has shown that common affective primes cansignificantly impact visual judgment, we believe that alter-nate priming techniques could be evaluated in future work asa means to further explore the relationship between emotion,cognition, and visualization.
In our pilot study, we found that although it is easier to primepeople with negative affect, more benefits are gained frompositive priming. However, because the average pre-valenceacross both groups was between 6 and 7, it was more difficultto obtain a positive delta in valence. This finding is corrobo-rated by previous studies which have noted that most peoplebegin in a slightly positive state, and that more even resultscan be obtained by assigning more participants to the positivepriming group [48].
IMPLICATIONSWe have found that affect influences visual judgment, andthat positive priming increases visual judgment performance.Based on these results, we discuss some possible implicationsregarding visualization design and evaluation.
One specific design implication comes from our findingthat non-adjacent comparisons appear to be both less ac-curate and less influenced by affective priming in both theall-participants and successfully-primed participants case.Therefore, when designing interactive visualizations whereemotion can be a factor, designers should ensure the usershould be able to interactively change a non-adjacent com-parison situation to an adjacent comparison situation or touse other interactions or views to better support non-adjacentcomparisons.
Other implications are more broad. For instance, as visual-izations become more common in everyday life, care mustbe taken to ensure that information is communicated accu-rately for a variety of audiences and contexts. In general, wenote that designers have no control over the possible priming-effects users experience before encountering a visualization.It is possible that a user could be primed positively or neg-atively through a variety of means, such as stories read in anewspaper or interactions with coworkers. Since the resultsof our study suggest that positive priming improves visual
judgment accuracy, future research could explore how to in-tegrate positive priming into design.
On the other hand, visualization tool design often includesknowledge about the environments in which users interactwith the system. For instance, a user in a disaster-responsesetting may be more subject to negative priming, whereas auser in gaming may be more subject to positive priming. Suchinformation can be used to assess the probability of negativeor positive emotions and their subsequent impact on cogni-tive processes. One approach designers could follow is thatof Lewis et al. [35], who suggest that embedded images andother interface design elements could help manage affect insoftware systems.
Another possible situation is where strongly-emotional con-tent is unavoidable, such as visualizations dealing with datathat has strong potential for unintentional affective priming.For example, a study by Elting et al. [14] compared visual-ization formats for communicating clinical trial risk. In clin-ical trials, a significant difference in error can often mean anumber of lives lost (or saved). Other common high-stressareas where visualization has been used include criminal in-vestigation, finance (high risk), and disease control. Giventhe complex nature of the decisions made in these situations,we believe that it is necessary to investigate the relationshipbetween visualization, emotion, higher-level cognitive pro-cesses.
LIMITATIONSWhile positive priming is generally associated with bettercognitive performance, negative priming can also impacthigher-level cognitive processes. An example a recent studyby Livingston et al. which found that negative content hadmore impact than positive content on a user’s subsequent re-view of a game [36]. While positive priming can be used topositively influence perceptual accuracy, it is possible that theresidual effects of positive emotions may negatively influencea higher-level task.
CONCLUSIONIn this paper, we describe a crowdsourced experiment inwhich affective priming is used to influence low-level vi-sual judgment performance. Our results suggest that affec-tive priming significantly influences visual judgments, andthat positive priming increases performance. We hope thesefindings serve as a step forward in better understanding thecognitive aspects related to visualization.
ACKNOWLEDGEMENTSWe thank the National Science Foundation (grant no. IIS-1218170) for support of this research. Any opinions, findings,conclusions, or recommendations expressed in this paper arethose of the authors and do not necessarily reflect the viewsof the National Science Foundation.
REFERENCES1. Ashby, F. G., Valentin, V., and Turken, U. The effects of positive affect
and arousal on working memory and executive attention. 2002,245–282.
2. Bechara, A. The role of emotion in decision-making: Evidence fromneurological patients with orbitofrontal damage. Brain and Cognition55, 1 (2004), 30–40.
3. Bechara, A., Damasio, H., and Damasio, A. R. Emotion, decisionmaking and the orbitofrontal cortex. Cerebral Cortex 10, 3 (2000),295–307.
4. Bernstein, M. S., Little, G., Miller, R. C., Hartmann, B., Ackerman,M. S., Karger, D. R., Crowell, D., and Panovich, K. Soylent: A WordProcessor with a Crowd Inside. ACM CHI (2010), 313–322.
5. Bertin, J. Semiologie Graphique. Gauthier-Villars, 1967.
6. Bohm, G., and Pfister, H.-R. Anticipated and experienced emotions inenvironmental risk perception. Judgement and Decision Making 3(2008), 73–86.
7. Chabris, C. F., and Kosslyn, S. M. How do the cerebral hemispherescontribute to encoding spatial relations? Current Directions inPsychological Science 7, 1 (1998), 8–14.
8. Chen, C., and Czerwinski, M. Spatial ability and visual navigation: Anempirical study. New Review of Hypermedia and Multimedia 3, 1(1997), 67–89.
9. Chong, S., and Treisman, A. Attentional spread in the statisticalprocessing of visual displays. Attention, Perception, & Psychophysics67, 1 (2005), 1–13.
10. Cleveland, W. S., and McGill, R. Graphical perception: Theory,experimentation, and application to the development of graphicalmethods. Journal of the American Statistical Association 79, 387(1984), 531–554.
11. Conati, C., and Maclaren, H. Exploring the role of individualdifferences in information visualization. Advanced Visual Interfaces(AVI) (2008), 199–206.
12. Damasio, A. Descartes Error. New York: Grosset/Putnam, 1994.
13. Dou, W., Ziemkiewicz, C., Harrison, L., Jeong, D., Ryan, R., Ribarsky,W., Wang, X., and Chang, R. Comparing different levels of interactionconstraints for deriving visual problem isomorphs. IEEE VAST (2010),194–202.
14. Elting, L., Martin, C., Cantor, S., and Rubenstein, E. Influence of datadisplay formats on physician investigators’ decisions to stop clinicaltrials: prospective trial with repeated measures. British Medical Journal318, 7197 (1999), 1527–1531.
15. Eriksen, C., and St. James, J. Visual attention within and around thefield of focal attention: A zoom lens model. Attention, Perception, &Psychophysics 40, 4 (1986), 225–240.
16. Eysenck, M., and Calvo, M. Anxiety and performance: The processingefficiency theory. Cognition & Emotion 6, 6 (1992), 409–434.
17. Franconeri, S., Scimeca, J., Roth, J., Helseth, S., and Kahn, L. Flexiblevisual processing of spatial relationships. Cognition 122 (2012),210–227.
18. Fredrickson, B. What good are positive emotions? Review of GeneralPsychology 2, 3 (1998), 300–319.
19. Fredrickson, B., and Branigan, C. Positive emotions broaden the scopeof attention and thought-action repertoires. Cognition and Emotion 19,3 (2005), 313–332.
20. Gasper, K., and Clore, G. Attending to the big picture: Mood andglobal versus local processing of visual information. PsychologicalScience 13, 1 (2002), 34–40.
21. Goeritz, A. S. The induction of mood via the www. Motivation andEmotion 31, 1 (2007), 35–47.
22. Green, T., and Fisher, B. Towards the personal equation of interaction:The impact of personality factors on visual analytics interfaceinteraction. IEEE VAST (2010), 203–210.
23. Harrison, L., Chang, R., and Lu, A. Exploring the impact of emotion onvisual judgement. IEEE VAST (2012).
24. Heer, J., and Bostock, M. Crowdsourcing graphical perception: Usingmechanical turk to assess visualization design. ACM CHI (2010),203–212.

25. Hermans, D., Houwer, J. D., and Eelen, P. A time course analysis of theaffective priming effect. Cognition and Emotion 15, 2 (2001), 143–165.
26. Hollands, J., and Spence, I. Judging proportion with graphs: Thesummation model. Applied Cognitive Psychology 12, 2 (1998),173–190.
27. Hullman, J., Adar, E., and Shah, P. Benefitting infovis with visualdifficulties. IEEE TVCG 17, 12 (2011), 2213–2222.
28. Hullman, J., Adar, E., and Shah, P. The impact of social information onvisual judgments. ACM CHI (2011), 1461–1470.
29. Isen, A. Positive affect facilitates creative problem solving. Journal ofPersonality and Social Psychology 52, 6 (1987), 1122–1131.
30. Isen, A. The influence of positive affect on clinical problem solving.Medical Decision Making 11, 3 (1991), 221–227.
31. Johnson-Laird, P., and Oatley, K. Cognitive and social construction inemotion. Handbook of Emotions, 2nd ed. (2000), 458.
32. Klein, K., and Boals, A. Expressive writing can increase workingmemory capacity. Journal of Experimental Psychology 130, 3 (2001),520–533.
33. Lang, P., Bradley, M., and Cuthbert, B. International affective picturesystem: Affective ratings of pictures and instruction manual. NIMHCenter for the Study of Emotion & Attention (2008).
34. Larsen, R., and Fredrickson, B. Measurement issues in emotionresearch. 2003, 40–60.
35. Lewis, S., Dontcheva, M., and Gerber, E. Affective computationalpriming and creativity. ACM CHI (2011), 735–744.
36. Livingston, I., Nacke, L., and Mandryk, R. Influencing experience: theeffects of reading game reviews on player experience. EntertainmentComputing–ICEC 2011 (2011), 89–100.
37. Loewenstein, G., and Lerner, J. S. The role of affect in decison making.Oxford University Press, 2003, 619–642.
38. Mackinlay, J., Hanrahan, P., and Stolte, C. Show me: Automaticpresentation for visual analysis. IEEE TVCG 13, 6 (2007), 1137–1144.
39. Mason, W., and Suri, S. Conducting behavioral research on amazonsmechanical turk. Behavior Research Methods 44, 1 (2012), 1–23.
40. Phelps, E., and Carrasco, M. Emotion facilitates perception andpotentiates the perceptual benefits of attention. Psychological Science17, 4 (2006), 292–299.
41. Picard, R., and Daily, S. Evaluating affective interactions: Alternativesto asking what users feel. CHI Workshop on Evaluating AffectiveInterfaces: Innovative Approaches (2005).
42. Picard, R., and Scheirer, J. The galvactivator: A glove that senses andcommunicates skin conductivity. ACM CHI (2001), 1538–1542.
43. Pourtois, G., Thut, G., de Peralta, R. G., Michel, C., and Vuilleumier, P.Two electrophysiological stages of spatial orienting towards fearfulfaces: Early temporo-parietal activation preceding gain control inextrastriate visual cortex. Neuroimage 26, 1 (2005), 149–163.
44. Rowe, G., Hirsh, J., and Anderson, A. Positive affect increases thebreadth of attentional selection. Proceedings of the National Academyof Sciences (PNAS) 104, 1 (2007), 383–388.
45. Shackman, A., Sarinopoulos, I., Maxwell, J., Pizzagalli, D., Lavric, A.,and Davidson, R. Anxiety selectively disrupts visuospatial workingmemory. Emotion 6, 1 (2006), 40–61.
46. Swinyard, W. The effects of mood, involvement, and quality of storeexperience on shopping intentions. Journal of Consumer Research(1993), 271–280.
47. Thompson, E. R. Development and validation of an internationallyreliable short-form of the positive and negative affect schedule (panas).Journal of Cross-Cultural Psychology 38, 2 (2007), 227–242.
48. Verheyen, C., and Goeritz, A. Plain texts as an online mood-inductionprocedure. Social Psychology 40, 1 (2009), 6–15.
49. Vogel, E., McCollough, A., and Machizawa, M. Neural measures revealindividual differences in controlling access to working memory. Nature438, 7067 (2005), 500–503.
50. Vuilleumier, P., and Driver, J. Modulation of visual processing byattention and emotion: Windows on causal interactions between humanbrain regions. Philosophical Transactions: Biological Sciences 362,1481 (2007), 837–855.
51. Vuilleumier, P., and Huang, Y.-M. Emotional attention: Uncovering themechanisms of affective biases in perception. Current Directions inPsychological Science 18, 3 (2009), 148–152.
52. Ziemkiewicz, C., Crouser, R. J., Su, S., Yauilla, A. R., Ribarsky, W.,and Chang, R. How locus of control influences compatibility withvisualization style. IEEE VAST (2011), 81–90.
53. Ziemkiewicz, C., and Kosara, R. Preconceptions and IndividualDifferences in Understanding Visual Metaphors. Computer GraphicsForum 28, 3 (2009), 911–918.