influence of matrix polarity on the properties of ethylene
TRANSCRIPT
NANO EXPRESS
Influence of Matrix Polarity on the Properties of Ethylene VinylAcetate–Carbon Nanofiller Nanocomposites
Jinu Jacob George Æ Anil K. Bhowmick
Received: 8 December 2008 / Accepted: 5 March 2009 / Published online: 21 March 2009
� to the authors 2009
Abstract A series of ethylene vinyl acetate (EVA)
nanocomposites using four kinds of EVA with 40, 50, 60,
and 70 wt% vinyl acetate (VA) contents and three different
carbon-based nanofillers—expanded graphite (EG), multi-
walled carbon nanotube (MWCNT), and carbon nanofiber
(CNF) have been prepared via solution blending. The
influence of the matrix polarity and the nature of nanofillers
on the morphology and properties of EVA nanocomposites
have been investigated. It is observed that the sample with
lowest vinyl acetate content exhibits highest mechanical
properties. However, the enhancement in mechanical
properties with the incorporation of various nanofillers is
the highest for EVA with high VA content. This trend has
been followed in both dynamic mechanical properties and
thermal conductivity of the nanocomposites. EVA
copolymer undergoes a transition from partial to complete
amorphousness between 40 and 50 wt% VA content, and
this changes the dispersion of the nanofillers. The high VA-
containing polymers show more affinity toward fillers due
to the large free volume available and allow easy disper-
sion of nanofillers in the amorphous rubbery phase, as
confirmed from the morphological studies. The thermal
stability of the nanocomposites is also influenced by the
type of nanofiller.
Keywords Nanocomposites � Carbon fillers �Ethylene vinyl acetate � Elastomers � Mechanical properties
Introduction
Ethylene vinyl acetate (EVA) is one of the important
organic polymers, extensively used for electrical insula-
tion, cable jacketing and repair, component encapsulation
and water proofing, corrosion protection, and packaging of
components. However, bulk EVA does not often fulfill the
requirements in terms of its thermal stability and
mechanical properties in some specific areas. Studies have
been reported on the effect of electron beam irradiation on
the mechanical properties and thermal stability of the EVA
elastomer [1, 2]. Also, in order to improve various prop-
erties, nanoparticles are added as fillers. Various research
investigations have been reported on the properties of
nanoclay-filled EVA nanocomposites [3–5]. Costache et al.
[6] have worked on the thermal degradation behavior of
EVA–clay nanocomposites. Studies have been reported on
the linear viscoelastic behavior of EVA-layered silicate
nanocomposites [7, 8]. Effect of vinyl acetate (VA) content
on the mechanical and thermal properties of EVA/MgAl-
layered double hydroxide nanocomposites has been studied
by various groups [9, 10]. Several studies have focussed on
the influence of VA content on the dispersion of clay
platelets, addition of external compatibilizers [11, 12], or
the nature of the clay organo-modifier [9]. Preparation and
characterization of natural rubber (NR)/EVA blend–clay
nanocomposites have also been reported in the literature
[13]. Silica nanoparticles prepared through the sol–gel
mechanism by hydrolysis of tetraethoxysilane (TEOS) are
found to improve the gas barrier properties of EVA–silica
nanocomposites membranes [14].
EVA is a random copolymer consisting of ethylene and
vinyl acetate as repeating units. VA content has two fun-
damental effects that influence the properties of EVA
copolymers. The first effect is to disrupt the crystalline
J. J. George � A. K. Bhowmick (&)
Rubber Technology Centre, Indian Institute of Technology,
Kharagpur 721302, India
e-mail: [email protected]
123
Nanoscale Res Lett (2009) 4:655–664
DOI 10.1007/s11671-009-9296-8

regions formed by the polyethylene segments of the
copolymer. The second overriding effect of VA content
results from the polar nature of the acetoxy side chain. The
EVA shows various properties by varying the VA content.
The properties of EVA depend on the crystallinity of the
EVA [15–18], which can be controlled by the VA content.
Elastomers are proved to be very compatible matrices
for carbon-based fillers. Several applications of rubbers
might benefit from the incorporation of carbon nanofillers
to form rubber-based nanocomposites. Studies have been
carried out on the effect of carbon-based nanofillers on
various properties of EVA thermoplastic elastomers having
low VA content (25–32%), by melt mixing techniques [19–
22]. From our laboratory, we have reported preliminary
studies on the effect of various carbon-based nanofillers on
the properties of elastomeric grade EVA [23–25]. How-
ever, there is no study carried out so far on the effect of VA
content on the properties of these nanocomposites. Lee and
Kim [21] describe the process of manufacturing nano-
composite material, which involves adding CNTs to
improve EVA’s physical characteristics such as radiation
resistance and thermal properties. Effect of MWCNT on
the fire retardant and electromagnetic interference shield-
ing properties of EVA has been investigated by various
groups [22, 26]. Effect of VA content on the properties of
MWCNT-filled thermoplastic elastomeric EVA nanocom-
posites has also been reported in the literature [27].
This study aims at evaluating the effect of the VA
content in elastomeric grade EVA copolymers, on the
dispersion states of three different carbon nanofillers:
expanded graphite (EG), multiwalled carbon nanotubes
(MWCNTs), and carbon nanofibers (CNFs) and also on the
morphological, mechanical, dynamic mechanical, and
thermal properties of the resulting nanocomposites. The
effect of polarity of the EVA matrix on the extent of dis-
persion and distribution of the carbon-based nanofillers has
been investigated by solution blending of 4 wt% of these
three fillers with four EVA matrices containing 40, 50, 60,
and 70% VA units. These studies have not been reported in
the literature.
Experimental
Materials
Four commercial ethylene vinyl acetate copolymer grades
were supplied by Bayer (now Lanxess), Germany. The
expanded graphite was procured from Asbury Graphite
Mills Inc, NJ, USA. MWCNT was provided by Helix
Material Solutions, TX, USA. CNF (as grown grade PR-24
AG, Pyrograf-IIITM) was obtained from Applied Sciences
Inc., OH, USA. The dicumyl peroxide (DCP, 99% pure),
cross-linker for the rubber, was obtained from Hercules
India. Triallyl cyanurate (TAC), the co-crosslinker was
procured from Fluka A G, Germany. Tetrahydrofuran
(THF) of LR grade, used as the solvent for EVA was
obtained from MERCK (India) Ltd., Mumbai, India.
Preparation of Nanocomposites
The nanocomposites were synthesized by using a solution-
mixing technique. EVA (5 g per batch) was dissolved in
50 mL of THF to make 10% solution of the rubber using a
mechanical stirrer. DCP (0.05 g) as the curing agent and
0.05 g of TAC as the co-agent were added to the rubber
solution. The solution was thoroughly stirred using a
mechanical stirrer. The nanofiller dispersed in THF was
first sonicated for 15 min and subsequently added to the
rubber solution while stirring at room temperature (27 �C).
The final solution was cast over teflon trays and kept for air
drying followed by vacuum drying at 50 �C, till there was
practically no weight variation. The dried films were
molded in a hot press at a pressure of 5 MPa at 150 �C for
an optimum cure time of 25 min, determined from a
Monsanto oscillating disc rheometer (ODR, 100S).
The various sample designations are given in Table 1.
Morphological Study
The microscopy was performed using a JEOL JEM-2010
(Japan), Transmission Electron Microscope (TEM) oper-
ating at an accelerating voltage of 200 kV. The composite
samples were cut by ultra-cryomicrotomy using a Leica
Ultracut UCT. Freshly sharpened glass knives with cutting
edge of 45� were used to get the cryosections of 50–70 nm
thickness. Since these samples were elastomeric in nature,
the temperature during ultra-cryomicrotomy was kept at
-50 �C (which was well below the glass transition tem-
perature of EVA). The cryosections were collected
individually on sucrose solution and directly supported on
a copper grid of 300-mesh size.
Table 1 Sample designations for various nanocomposites
Sample designation Description
EVA40 Virgin EVA elastomer with 40% VA content
EVA50 Virgin EVA elastomer with 50% VA content
EVA60 Virgin EVA elastomer with 60% VA content
EVA70 Virgin EVA elastomer with 70% VA content
EVA-4EG EVA filled with 4 wt% of EG
EVA-4T EVA filled with 4 wt% of MWCNT
EVA-4F EVA filled with 4 wt% of CNF
656 Nanoscale Res Lett (2009) 4:655–664
123
Mechanical Property Analysis
The mechanical properties of the nanocomposites were
evaluated by a universal testing machine (UTM, Zwick
1445) on dumbbell specimens, punched out from the cast
films using an ASTM Die C. All the tests were carried out
as per ASTM D 412-99 method at 25 ± 2 �C at a cross-
head speed of 500 mm/min. The average values of three
tests for tensile strength, tensile modulus, and elongation at
break are reported for each sample.
Swelling Study
The swelling studies of the rubber specimens were carried
out in toluene at ambient conditions (25 ± 2 �C) for 72 h.
Volume fraction of rubber, Vr was calculated using the
following equation [28]
Vr ¼D � FTð Þq�1
r
D � FTð Þq�1r þ A0q�1
s
ð1Þ
where, Vr is volume fraction of rubber in the swollen gel, D
the de-swollen weight of the composites, F the fraction
insoluble, T the initial weight of the sample, and A0 the
amount of solvent imbibed. qr is the density of the rubber,
while qs is density of the swelling solvent.
Differential Scanning Calorimetry (DSC)
DSC of various samples was carried out by using a Q-100
DSC, of TA instruments, USA. The test was carried out in
the temperature range -100 to ?100 �C, with samples of
5 mg weight and the rate of heating/cooling was fixed at
10 �C/min in nitrogen.
Dynamic Mechanical Thermal Analysis (DMTA)
Dynamic mechanical thermal characteristics of the
composite films (0.4–0.6 mm thick) were evaluated by
using a DMTA IV (Rheometric Scientific) under tension
mode. All the data were analyzed using RSI Orchestrator
application software on an ACER computer attached to
the machine. The temperature sweep measurements were
made from -35 to 20 �C. The experiments were carried
out at a frequency of 1 Hz at a heating rate of 2 �C/min.
The storage modulus (E0) and the loss tangent (tan d)
data were recorded for all the samples under identical
conditions.
Thermal Conductivity
The thermal conductivity of the various nanocomposites
was measured as per ASTM C177-97. The thermal con-
ductivity was calculated using the equation
K ¼ Wt
AdTð2Þ
where W is the power in watts (here 4 W), K is the thermal
conductivity, t the thickness of sample, A the area of the
sample, and dT the temperature difference between the two
plates.
Thermal Degradation Studies
Thermal stability of the composites was investigated by
thermogravimetric analysis (TGA) by using a Perkin Elmer
TGA instrument [Model: Pyris Diamond TG/DTA] from
ambient to 800 �C at a programed heating rate of 20 �C/
min in nitrogen. A sample weight of approximately 10 mg
was taken for all the measurements. The weight loss
against temperature was recorded. Differential thermo-
gravimetric analysis (DTG) of the composites was
represented in terms of the first derivative plots of the TGA
curves. The data points denote the weight loss/time against
temperature at the specified heating rate.
Results and Discussion
Morphological Analysis
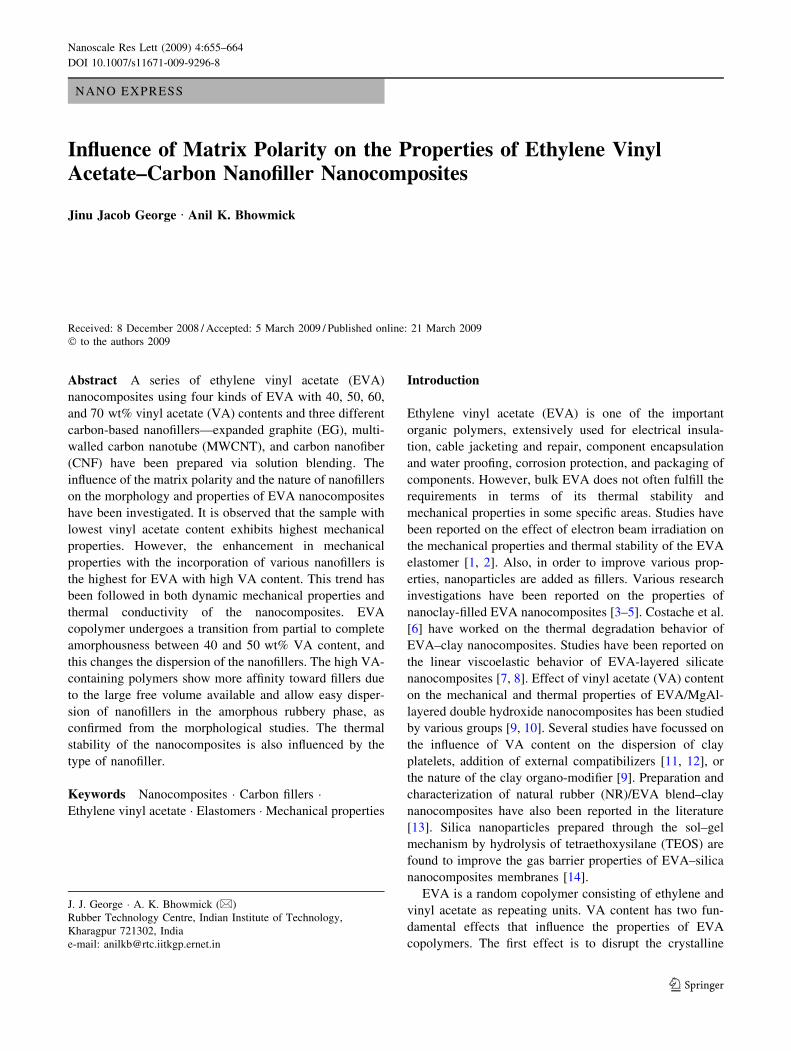
Figure 1a–d displays the TEM images of the nanocom-
posites which show the distribution of EG in all the four
EVA grades. The graphite flakes are distributed well in the
elastomeric EVA matrices, with the presence of few filler
aggregations in all the samples.
Fig. 1 TEM photographs of a EVA40-4EG, b EVA50-4EG, cEVA60-4EG, and d EVA70-4EG
Nanoscale Res Lett (2009) 4:655–664 657
123

A similar trend is observed in the case of EVA grades
reinforced with MWCNT (Fig. 2a–d) and CNF as well
(Fig. 3a–d). MWCNT is distributed relatively well in all
the four matrices with the presence of small agglomera-
tions. The CNFs are well dispersed in EVA and have an
average diameter of 120 nm. The nanofillers show more
affinity toward the rubber phase and are better dispersed
there due to the large free volume available in the amor-
phous rubber phase. Hence, the high VA-containing grades
show more uniform morphology. In EVA40, all the
nanofillers tend to form agglomerations (shown by circles
in the figures).
Mechanical Properties
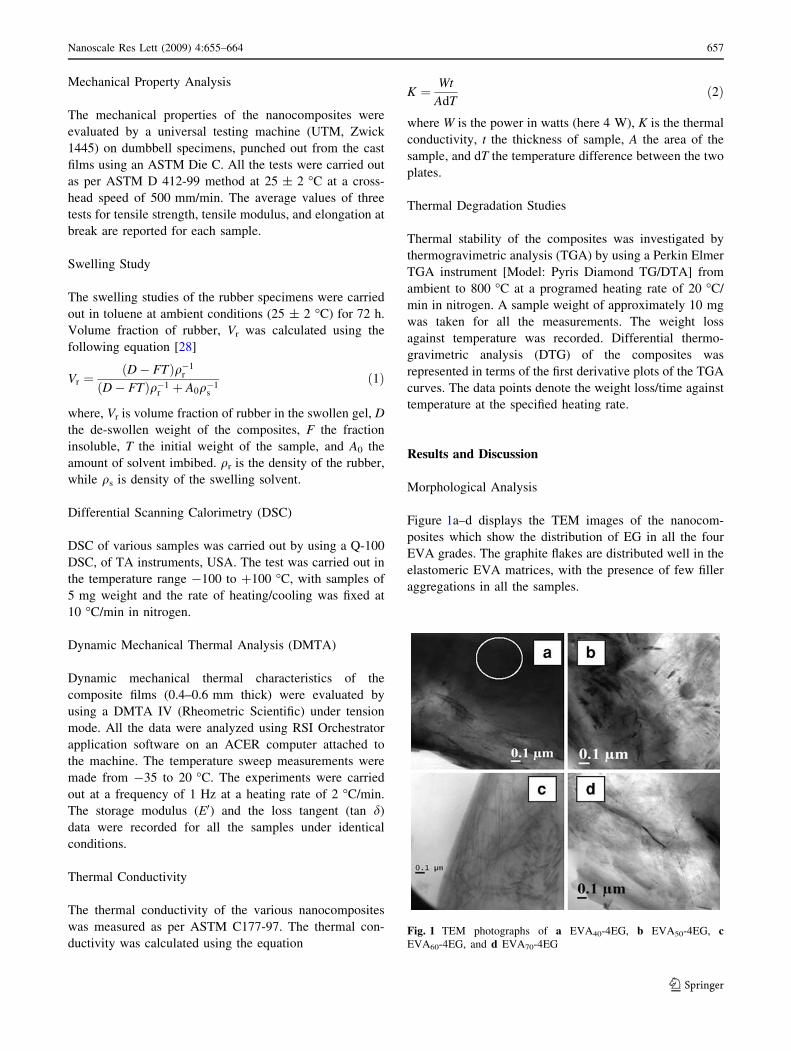
The tensile properties of various EVA samples and their
4 wt% filler loaded nanocomposites are plotted against the
VA content. These are displayed in Fig. 4a–c. The pres-
ence of the fillers does not modify the overall stress versus
strain behavior of the matrices. However, all the EVA
grades show an increase in tensile strength and modulus
with the incorporation of nanofillers (Table 2). The tensile
strength has a significant decrement when the VA content
is increased from 40 to 50 wt%, whereas further increase in
VA content does not show any significant change in tensile
strength. This change may be due to the reduction in
crystallinity with VA content and at a point between 40 and
50%, the material becomes completely amorphous [29].
The addition of expanded graphite and MWCNTs has
significant reinforcing effect, the maximum improvement
in tensile strength and modulus being shown by the high
vinyl acetate grades of EVA50 to EVA70 and exhibits least
increment for EVA40. This may be because of the easy
dispersion of nanofillers in the rubbery phase and hence the
high vinyl acetate grades disperse the fillers well. Addition
of 4 wt% of EG enhances the tensile strength of EVA40 by
11.5%, whereas MWCNT and CNF increase it by 7 and
32.8%, respectively. On the other hand, the increments are
58, 14, and 150%, respectively, in EVA70. The EVA40
consists of more plastic (crystalline) phase and hence the
nanofillers find it more difficult to disperse and hence form
relatively more agglomerations, whereas in high vinyl
acetate grades, the amount of free volume is more and
hence the fillers can disperse relatively easily.
The tensile strength of various nanocomposites can be
related to the volume fraction of nanofiller, using the
reinforcing factor, R follows:
rc
rm
¼ 1 þ R /fð Þ ð3Þ
where rc and rm are the tensile strength of the composite
and the virgin matrix, respectively. /f is the volume frac-
tion of the respective filler. The relative tensile strength, rc
rm
is plotted against volume fraction of filler /f for all the
three fillers with the same EVA50 matrix. The plots are
linear fitted to obtain the reinforcing factor of each filler in
the EVA50 matrix (Fig. 5).
These values are very close to the respective reinforcing
factors calculated from Eq. 3. For example, the value of
Fig. 2 TEM photographs of a EVA40-4T, b EVA50-4T, c EVA60-4T,
and d EVA70-4T
Fig. 3 TEM photographs of a EVA40-4F, b EVA50-4F, c EVA60-4F,
and d EVA70-4F
658 Nanoscale Res Lett (2009) 4:655–664
123
reinforcing factor, R, obtained by linear fitting is 0.27 for
EVA50-4F, which is very close to the value calculated from
Eq. 3. The reinforcing factors of various EVA nanocom-
posites are plotted against the VA contents of EVAs in
Fig. 6.
From the plots, it is clear that the reinforcing factor of
EG and CNF increases in direct proportion with the VA
content. The reinforcing effect of MWCNTs is lower. This
might have resulted from relatively poor dispersion of
MWCNT as compared to the other two fillers. It is to be
Fig. 4 Dependence of tensile
properties on VA content
Table 2 Tensile properties of
EVA grades and their
nanocomposites at 4 wt% filler
loading
Sample Tensile strength
(MPa)
Elongation at
break (%)
Modulus at 100%
elongation (MPa)
EVA40 8.36 ± 0.19 495 ± 15 1.31 ± 0.12
EVA50 5.35 ± 0.12 440 ± 10 0.74 ± 0.11
EVA60 5.24 ± 0.20 430 ± 10 0.57 ± 0.05
EVA70 5.04 ± 0.17 410 ± 14 0.48 ± 0.07
EVA40-4EG 9.32 ± 0.18 525 ± 12 2.39 ± 0.15
EVA50-4EG 7.21 ± 0.14 435 ± 16 1.94 ± 0.08
EVA60-4EG 7.51 ± 0.10 420 ± 10 2.05 ± 0.06
EVA70-4EG 7.98 ± 0.15 410 ± 15 2.29 ± 0.12
EVA40-4T 8.95 ± 0.18 470 ± 15 2.56 ± 0.13
EVA50-4T 6.60 ± 0.12 370 ± 15 2.40 ± 0.09
EVA60-4T 6.68 ± 0.18 370 ± 16 2.42 ± 0.10
EVA70-4T 6.75 ± 0.20 375 ± 15 2.46 ± 0.10
EVA40-4F 11.10 ± 0.21 565 ± 20 3.13 ± 0.14
EVA50-4F 11.34 ± 0.12 400 ± 15 3.38 ± 0.11
EVA60-4F 11.45 ± 0.15 375 ± 13 3.65 ± 0.10
EVA70-4F 12.30 ± 0.16 380 ± 15 4.13 ± 0.15
Nanoscale Res Lett (2009) 4:655–664 659
123

noted that increment is more prominent in the partially
amorphous to fully amorphous transition region which
occurs beyond 50% VA content.
Solvent Swelling Analysis
The solvent swelling analysis supports the results of
mechanical properties. The composite samples having var-
ious nanofillers exhibit higher rubber volume fraction (Vr)
values (Table 3) due to the interaction between the polymer
chains and the filler. The highest value is achieved with
CNFs and also when the vinyl acetate content is highest.
Differential Scanning Calorimetry
DSC studies of all the EVA copolymers and their nano-
composites have been carried out. On loading the
nanofillers, there is marginal change in the enthalpy of
melting (DHm) values with no change in the melting peak
temperature. The percentage crystallinity of all the samples
lies in the range 0.3–0.4%, thus confirming that all the
nanocomposites are basically amorphous materials. It has
been reported earlier that loading of carbon nanotubes
reduces the crystallinity of EVA having 27% VA content
(much lower than those used in the present investigation)
due to the reduction in the orientation of polymer chains as
a result of polymer–filler interaction [30]. However, there
is no such indication from the DSC traces for these
amorphous polymers, as the DHm values are very low.
Dynamic Mechanical Thermal Analysis
Dynamic mechanical thermal analysis is an excellent tool
to characterize the viscoelastic properties of polymer
composites. A better understanding of the dynamic
mechanical properties of the composite will help to define
structure/property relationships and subsequently to relate
these properties to product’s final performance. Figure 7a
displays the variation of tan d and storage modulus,
E0(inset) with temperature and Fig. 7b–e represents the
variation in Tg, storage modulus, and tan dMax with vinyl
acetate content of EVA. It can be observed that while
EVA40 exhibits a Tg of -31.6 �C the high VA-containing
sample EVA70 exhibits Tg of -18.5 �C (Table 4). This
significant shift in Tg is due to the variation of ethylene
content in the copolymers (http://www.levapren.com). As
the ethylene content increases, the Tg shifts to the lower
Fig. 5 rc
rmvs. /f plots for EVA50-EG, EVA50-MWCNT, and EVA50-
CNF
Fig. 6 Plots of reinforcing factor(R) versus VA content of EVA for
EVA-4EG, EVA-4T, and EVA-4F
Table 3 Rubber volume fraction of EVA grades and their nano-
composites at 4 wt% filler
Sample Volume fraction
of rubber (Vr)
EVA40 0.106
EVA50 0.114
EVA60 0.115
EVA70 0.118
EVA40-4EG 0.118
EVA50-4EG 0.125
EVA60-4EG 0.129
EVA70-4EG 0.131
EVA40-4T 0.158
EVA50-4T 0.187
EVA60-4T 0.191
EVA70-4T 0.194
EVA40-4F 0.210
EVA50-4F 0.280
EVA60-4F 0.285
EVA70-4F 0.288
660 Nanoscale Res Lett (2009) 4:655–664
123
temperatures. Also, it is to be noted that the tan d peak
height reduces as the VA content reduces. This is due to
increase in chain flexibility due to increasing rubbery
nature. Or in other words, the amount of amorphous phase
is increased with the increase of the VA content in the
EVA.
As expected, various nanocomposites exhibit much
higher storage modulus than pure EVA grades, especially
at low temperatures, given the reinforcing effect of
nanofillers on the matrix. In addition, the presence of the
fillers also enables the matrix to sustain high-modulus
value at high temperatures. Also, various nanocomposites
show a reduction in tan d peak height as compared to those
of respective neat elastomers. This is due to the restriction
in polymer chain movements employed by the filler–
polymer interactions.
Fig. 7 a Variation of tan d and storage modulus (inset) with temperature, b–e variation of Tg, E0, and tan dMax with VA content
Table 4 DMTA data of EVA grades and their nanocomposites at
4 wt% filler loading
Sample Tg (�C) Storage modulus Log E’ (Pa) at tan d at
Tg 20 �C Tg 20 �C
EVA40 -31.6 7.93 6.18 0.76 0.13
EVA50 -30.8 7.68 6.10 1.09 0.18
EVA60 -26.5 6.50 5.64 1.45 0.16
EVA70 -18.5 6.03 5.27 1.51 0.21
EVA40-4EG -29.4 7.96 6.21 0.75 0.13
EVA50-4EG -28.9 7.93 6.37 0.92 0.16
EVA60-4EG -23.5 7.40 6.24 1.24 0.22
EVA70-4EG -17.2 7.25 6.08 1.31 0.22
EVA40-4T -26.1 7.52 6.36 0.75 0.12
EVA50-4T -25.5 8.21 6.68 0.91 0.17
EVA60-4T -20.6 7.16 7.76 1.05 0.13
EVA70-4T -15.6 7.41 7.88 1.27 0.20
EVA40-4F -28.7 8.08 6.65 0.67 0.12
EVA50-4F -24.2 7.56 6.20 0.89 0.16
EVA60-4F -23.1 8.12 6.47 1.09 0.19
EVA70-4F -16.5 7.78 6.62 1.33 0.21
Table 5 Thermal conductivity data of various EVA nanocomposites
at 4 wt% filler loading
Sample Thermal conductivity
(W/mK)
EVA40 0.22
EVA50 0.24
EVA60 0.23
EVA70 0.24
EVA40-4EG 0.71
EVA50-4EG 0.83
EVA60-4EG 0.87
EVA70-4EG 0.89
EVA40-4T 0.90
EVA50-4T 1.13
EVA60-4T 1.16
EVA70-4T 1.18
EVA40-4F 0.60
EVA50-4F 0.69
EVA60-4F 0.75
EVA70-4F 0.78
Nanoscale Res Lett (2009) 4:655–664 661
123

Thermal Conductivity
1. The thermal conductivity of various nanocomposite
samples has been analyzed in this section (Table 5 and
Fig. 8). There is no significant difference among the
thermal conductivity values of different EVA grades.
Addition of 4 wt% of expanded graphite increases the
thermal conductivity several folds over the neat elas-
tomers. Increments are more prominent in the high
VA-containing grades. Due to their inherent superior
thermal conductivity, MWCNTs provide highest
enhancement in thermal conductivity in various
matrices. The thermal conductivity enhancement of
polymer nanocomposites depends to a large extent on
the thermal conductivity of nanoscale fillers and their
structural properties [31]. Even though CNF has higher
aspect ratio, its intrinsic thermal conductivity is about
2000 W/mK which is much lower than that of
MWCNT which is 3000 W/mK [32]. In spite of the
higher polymer–filler interaction revealed by Vr values,
CNF-based composites register lower thermal con-
ductivity values because of the above reason.
Interfacial bonding between filler and polymer plays a
vital role on the thermal conductivity of the resulting
nanocomposites following earlier references [33]. In
the present case, however, the MWCNT shows a rel-
atively poorer dispersion and also the swelling
resistance is lower than that of CNF-based composites.
It seems that there are many factors, including the
thermal conductivity of the filler, important in deter-
mining the thermal conductivity of the composites.
Thermogravimetric Analysis
Thermogravimetric analysis has been carried out to study
the degradation behavior of various nanocomposites pre-
pared (Fig. 9a–c and Table 6). The representative DTG and
TGA (inset) plots of virgin EVA grades are provided in
Fig. 8 Variation of thermal conductivity with VA content
Fig. 9 a DTG and TGA (inset)
curves of EVA grades, b and cdependence of TMax and rate of
degradation on VA content
662 Nanoscale Res Lett (2009) 4:655–664
123

Fig. 9a. Temperature corresponding to maximum rate of
degradation (TMax) and maximum rate of degradation for
various nanocomposites are reported in Table 6. The results
show that the EVA with higher VA content exhibits higher
thermal stability. The weight loss in pure EVA starts around
300 �C due to the liberation of acetic acid. In presence of
nanofillers, the onset of weight loss in the composites occurs
at higher temperatures. The sudden weight loss observed
between 400 and 500 �C due to the thermal degradation of
the polymer is also shifted to higher temperatures in EVA
nanocomposites. That means the heat stability of the poly-
mer is improved in general, by the incorporation of various
carbon nanofillers. Unlike the mechanical properties, the
thermal stability of various nanocomposites exhibits more
dependence on filler than nature of the matrix. Among the
various nanofillers used, EG imparts maximum thermal
degradation stability to various EVA matrices. This may be
due to the flake like structure of graphite particles, which
prevent easy degradation of polymer chains much effec-
tively. The individual TMax values of EG, MWCNT, and
CNF are 736, 623, and 592 �C, respectively, which support
the results. The higher thermal stability of EG might have
played a significant role in providing EG-reinforced nano-
composites highest thermal stability.
Conclusions
Reinforcing effect of expanded graphite, multiwalled car-
bon nanotube, and carbon nanofiber on various elastomeric
grades of EVA have been investigated and the effect of
vinyl acetate content on various composite properties has
been analyzed. The enhancements in mechanical, dynamic
mechanical, and thermal properties indicate that the more
elastomeric (VA content) the matrix is, the more easily the
nanofillers get dispersed due to higher free volume. This
effect is more prominent where the polymer achieves
complete amorphousness which occurs between 40 and
50% VA content. Further increments in VA content did not
bring about significant improvements in filler dispersion as
evident from the TEM photographs. This effect is reflected
in the enhancement in properties with the addition of
nanofillers, though EVA40 exhibits highest mechanical
properties as compared to the higher VA-containing
grades. This trend has been followed in both dynamic
mechanical properties and thermal conductivity of the
nanocomposites. The thermal degradation of the nano-
composites shows more dependence on the type of
nanofiller rather than the VA content of EVA. Among the
three nanofillers, expanded graphite provides maximum
thermal stability.
Acknowledgment The authors acknowledge the financial assistance
provided by DRDO, New Delhi, India.
References
1. S.K. Datta, A.K. Bhowmick, T.K. Chaki, A.B. Majali, R.S.
Despande, Polymer (Guildf) 37, 45 (1996). doi:10.1016/0032-
3861(96)81598-9
2. S.K. Datta, A.K. Bhowmick, P.G. Mukunda, T.K. Chaki, Polym.
Degrad. Stab. 50, 75 (1995). doi:10.1016/0141-3910(95)00125-6
3. M. Pramanik, S.K. Srivastava, B.K. Samantaray, A.K. Bhow-
mick, J. Appl. Polym. Sci. 87, 2216 (2003). doi:10.1002/app.
11475
4. M. Pramanik, S.K. Srivastava, B.K. Samantaray, A.K. Bhow-
mick, J. Polym. Sci. B Polym. Phys. 40, 2065 (2002). doi:
10.1002/polb.10266
5. S.K. Srivastava, M. Pramanik, H. Acharya, J. Polym. Sci. B
Polym. Phys. 44, 471 (2006). doi:10.1002/polb.20702
6. M.C. Costache, D.D. Jiang, C.A. Wilkie, Polymer (Guildf) 46,
6947 (2005). doi:10.1016/j.polymer.2005.05.084
7. R. Prasad, R.K. Gupta, F. Cser, S.N. Bhattacharya, J. Appl.
Polym. Sci. 101, 2127 (2006). doi:10.1002/app.22331
8. F.P. La Mantia, N.T. Dintcheva, Polym. Test. 25, 701 (2006). doi:
10.1016/j.polymertesting.2006.03.003
9. W. Zhang, D. Chen, Q. Zhao, Y. Fang, Polymer (Guildf) 44, 7953
(2003). doi:10.1016/j.polymer.2003.10.046
10. T. Kuila, H. Acharya, S.K. Srivastava, A.K. Bhowmick, J. Appl.
Polym. Sci. 108, 1329 (2008). doi:10.1002/app.27834
11. I.S. Suh, S.H. Ryu, J.H. Bae, Y.W. Chang, J. Appl. Polym. Sci.
94, 1057 (2004). doi:10.1002/app.20962
12. C.H. Jeon, S.H. Ryu, Y.W. Chang, Polym. Int. 52, 153 (2003).
doi:10.1002/pi.1066
13. J. Sharif, W.M.Z.W. Yunus, K.H. Dahlan, M.H. Ahmad, J. Appl.
Polym. Sci. 100, 353 (2006). doi:10.1002/app.23121
14. M. Sadeghi, G. Khanbabaei, A.H.S. Dehaghani, M. Sadeghi,
M.A. Aravand, M. Akbarzade, S. Khatti, J. Membr. Sci. 322, 423
(2008). doi:10.1016/j.memsci.2008.05.077
Table 6 Thermal degradation data of various EVA nanocomposites
at 4 wt% filler loading
Sample TMax (�C) Maximum rate of
degradation (%/�C)
EVA40 453 2.24
EVA50 462 1.78
EVA60 483 1.47
EVA70 486 1.23
EVA40-4EG 469 1.72
EVA50-4EG 476 1.53
EVA60-4EG 498 1.47
EVA70-4EG 498 1.12
EVA40-4T 460 1.37
EVA50-4T 466 1.48
EVA60-4T 488 1.44
EVA70-4T 487 1.06
EVA40-4F 456 2.39
EVA50-4F 470 1.55
EVA60-4F 491 1.38
EVA70-4F 493 1.08
Nanoscale Res Lett (2009) 4:655–664 663
123

15. M. Brogly, M. Nardin, J. Schultz, J. Appl. Polym. Sci. 64, 1903
(1997). doi:10.1002/(SICI)1097-4628(19970606)64:10\1903::
AID-APP4[3.0.CO;2-M
16. A. Arsac, C. Carrot, J. Guillet, J. Appl. Polym. Sci. 74, 2625
(1999). doi:10.1002/(SICI)1097-4628(19991209)74:11\2625::
AID-APP9[3.0.CO;2-G
17. S. Bistac, P. Kunemann, J. Schultz, Polymer (Guildf) 39, 4875
(1998). doi:10.1016/S0032-3861(97)10328-7
18. N. Gospodinova, T. Zlatkov, L. Terlemezyan, Polymer (Guildf)
39, 2583 (1998). doi:10.1016/S0032-3861(97)00558-2
19. S. Peeterbroeck, B. Lepoittevin, E. Pollet, S. Benali, C. Broeka-
ert, M.D. Alexandre, P.B. Viville, R. Lazzaroni, P. Dubois,
Polym. Eng. Sci. 46, 1022 (2006). doi:10.1002/pen.20560
20. S. Peeterbroeck, M. Alexandre, J.B. Nagy, C. Pirlot, A. Fonseca,
N. Moreau, G. Philippin, J. Delhalle, Z. Mekhalif, R. Sporken,
G. Beyer, P. Dubois, Compos. Sci. Technol. 64, 2317 (2004). doi:
10.1016/j.compscitech.2004.01.020
21. K.-Y. Lee, K.-Y. Kim, Polym. Degrad. Stab. 93, 1290 (2008).
doi:10.1016/j.polymdegradstab.2008.04.007
22. S. Peeterbroeck, F. Laoutid, B. Swoboda, J.-M. Lopez-Cuesta,
N. Moreau, J.B. Nagy, M. Alexandre, P. Dubois, Macromol.
Rapid Commun. 28, 260 (2007). doi:10.1002/marc.200600614
23. J.J. George, R. Sengupta, A.K. Bhowmick, J. Nanosci. Nano-
technol. 8, 1913 (2008). doi:10.1166/jnn.2008.230
24. J.J. George, A.K. Bhowmick, J. Mater. Sci. 43, 702 (2008). doi:
10.1007/s10853-007-2193-6
25. J.J. George, A.K. Bhowmick, Nanoscale Res. Lett. 3, 508 (2008).
doi:10.1007/s11671-008-9188-3
26. N.C. Das, S. Maiti, J. Mater. Sci. 43, 1920 (2008). doi:
10.1007/s10853-008-2458-8
27. S. Peeterbroeck, L. Breugelmans, M. Alexandre, J.B. Nagy, P.
Viville, R. Lazzaroni, P. Dubois, Compos. Sci. Technol. 67, 1659
(2007). doi:10.1016/j.compscitech.2006.07.001
28. S. Sadhu, A.K. Bhowmick, J. Polym. Sci. B Polym. Phys. 42,
1573 (2004)
29. A.M. Henderson, IEEE Electr. Insul. Mag. 9, 30 (1993). doi:
10.1109/57.249923
30. H.E. Miltner, S. Peeterbroeck, P. Viville, P. Dubois, B. Vanmele,
J. Polym. Sci. B Polym. Phys. 45, 1291 (2007). doi:10.1002/
polb.21193
31. Y. Yang, M.C. Gupta, J.N. Zalameda, W.P. Winfree, Micro &
Nano Lett 3(2), 35 (2008). doi:10.1049/mnl:20070073
32. M.H. Al-Saleh, U. Sundararaj, Carbon 47, 2 (2009). doi:
10.1016/j.carbon.2008.09.039
33. S.T. Huxtable, D.G. Cahill, S. Shenogin, L. Xue, R. OZisik,
P. Barone, M. Usrey, M.S. Strano, G. Siddons, M. Shim,
P. Keblinski, Nat. Mater. 2, 731 (2003). doi:10.1038/nmat996
664 Nanoscale Res Lett (2009) 4:655–664
123