intsika yethu local municipality · this idp as a principal strategic planning instrument which...
TRANSCRIPT

INTSIKA YETHU LOCAL
MUNICIPALITY INTEGRATED DEVELOPMENT
PLAN- FINAL
2015-2016

Intsika Yethu IDP 2014-2015
Page 1
Foreword by the Mayor
The Integrated Development Plan (IDP) marks another step in the on-going quest of continuous
improvement. Opposed from just mechanistic made-for-the shelf product; we want to continue to use
this IDP as a principal strategic planning instrument which guides and informs all planning and
development, and all decisions with regard to planning, management and development in the Intsika
Yethu Municipality. It is in that context that Intsika Yethu Municipality will continue to give life to
our IDP.
This Intsika Yethu IDP review process is built on previous work, our experience in governing Intsika
Yethu, and the inputs from our respective citizens through the public participation programmes and
continuous interaction. Noticing the annual review of the IDP’s legislation, it is also critical for the
municipality council’s planning to consistently update these plans and continue communicating with
our stakeholders.
The review further allows the Intsika Yethu Municipal Council to address emerging challenges and
political priorities. The Council will not discard the information contained in the five-year IDP, but
through its annual review it will seek to give implications and annual meaning of the five-year IDP. In
essence, the annual review is used as a tool to help realise the medium to long-term objectives of the
Council.
The Intsika Yethu Municipal Council will continue to use IDP as a roadmap to help meet
community’s needs, while ensuring continued growth, equality and empowerment of the poor.
I trust that this IDP will serve to stimulate and strengthen our partnership with our colleagues in
government, the people of Intsika Yethu and all those who live, work, do business and play in our
town-not by prescribing and regulating but by outlining a common vision.
Sincerely,
…………………..
K VIMBAYO
HON MAYOR

Intsika Yethu IDP 2014-2015
Page 2
Table of Contents
Executive Summary ............................................................................................................................... 10
The Process Plan .................................................................................................................................... 14
Situational Analysis ............................................................................................................................... 14
Institutional Review ......................................................................................................................... 14
The Development Context and Socio-Economic Profile.......................................................... 14
Spatial Analysis and Rational ........................................................................................................ 15
The Service Delivery Profile ........................................................................................................... 15
Development strategies, projects and programmes .............................................................................. 15
Performance Management System ........................................................................................................ 16
Financial Plan and Budget ..................................................................................................................... 16
(Part A) Introduction ............................................................................................................................. 18
(Part B) The Planning Process ............................................................................................................... 19
1. The IDP Process Plan ......................................................................................................................... 19
1.1.1 Ward committees and CDWs ................................................................................................ 29
1.1.2 Issues identified by Wards within IYLM ............................................................................ 29
Chapter 2: Situational Analysis ............................................................................................................. 31
(Part A) An Institutional Review ........................................................................................................... 31
Introduction ........................................................................................................................................... 31
2. Institutional Profile ............................................................................................................................ 31
2.1 Municipal Powers and Functions ..................................................................................................... 31
2.2 Municipal Council and institutional governance............................................................................. 34
2.3 Committees of Council ..................................................................................................................... 35
2.4 Community Development Workers (CDWs) ................................................................................... 36
2.5 Ward Committees ............................................................................................................................ 36
2.6 Finances and Financial Management .............................................................................................. 36
2.9 Skills development ........................................................................................................................... 51
(Part B) The Development Context and Socio-Economic Profile .......................................................... 53
3. Socio-Economic Profile ...................................................................................................................... 53
3.1 Demographic Profile ........................................................................................................................ 53
3.2 Poverty Rate in IYLM ....................................................................................................................... 55
3.3 Income and Employment data......................................................................................................... 56
3.4 Human Development Index ............................................................................................................ 61
3.6 Economic Data ................................................................................................................................. 63
Intsika Yethu IDP 2014-2015
Page 3
4. Spatial Analysis and Rationale .......................................................................................................... 66
4.1 Spatial Overview ............................................................................................................................... 66
4.2 Prioritized Secondary Nodes .......................................................................................................... 68
4.3 Development Corridors ................................................................................................................... 71
(Part D) Service Delivery Profile ............................................................................................................ 77
5. Service Delivery Profile and the Clusters .......................................................................................... 77
5.1 Cluster Model integration and coordination .................................................................................... 77
5.2 Technical Service Cluster ................................................................................................................. 78
5.2.1 Free Basic Services and Social Infrastructure ............................................................................... 78
5.2.2 Human settlements ...................................................................................................................... 88
5.3 Social Needs Cluster ........................................................................................................................ 90
5.3.1 Education levels ............................................................................................................................ 90
5.3.2 Health Care Issues ........................................................................................................................ 93
5.3.3 Community Facilities .................................................................................................................... 94
5.3.4 Safety and Security ........................................................................................................................ 94
5.3.5 Cremation and Cemeteries ............................................................................................................ 94
5.3.6 Waste Management ...................................................................................................................... 94
5.3.7 Disaster Management ................................................................................................................... 96
5.4 Economic Development and Planning Cluster ................................................................................ 99
5.4.1 Local Economic Development ....................................................................................................... 99
5.4.2 Chris Hani Growth and Development Summit .......................................................................... 100
5.4.3 Economic opportunities within IYLM ........................................................................................ 101
5.4.4 Tourism ....................................................................................................................................... 101
5.4.5 Agriculture .................................................................................................................................. 107
5.4.6 Forestry ....................................................................................................................................... 110
5.4.7 Environment Management .......................................................................................................... 112
Chapter 3: Development Priorities, Strategic Objectives, Strategies and Projects .............................. 113
6. Vision, Mission, and Key Performance Areas ................................................................................... 113
6.1 Vision and Mission ..........................................................................................................................114
6.2 Principles and Values of IYLM .......................................................................................................114
6.3 Key Performance Areas, Clusters, and Goals.................................................................................. 115
6.4 Goals and Strategic Objectives .......................................................................................................116
6.4.1 Institutional development ............................................................................................................116
6.4.2 Municipal planning, maintenance & infrastructure provision .................................................... 117
6.4.3 Provide social infrastructure and quality social services ............................................................. 117
6.4.4 Job creation, enterprise formation, business retention and expansion ...................................... 117
6.4.5 Building financial viability .......................................................................................................... 118
Intsika Yethu IDP 2014-2015
Page 4
6.4.6 Good governance and oversight ................................................................................................. 118
6.5 The Three Year Implementation Plan ............................................................................................ 121
6.6.1 KPA 1: Municipal Transformation and Organisational Development:.. Error! Bookmark not
defined.
Corporate services ............................................................................ Error! Bookmark not defined.
Municipal Managers Office.............................................................. Error! Bookmark not defined.
6.6.2 KPA 2: Basic Services and Infrastructure .............................. Error! Bookmark not defined.
6.6.3 KPA 3: Local Economic Development .................................... Error! Bookmark not defined.
Local Economic Development and planning ......................... Error! Bookmark not defined.
Eastern Cape Department of Rural Development and Agrarian Reform ................... Error!
Bookmark not defined.
6.6.4 KPA 4: Financial Management and Viability ........................ Error! Bookmark not defined.
6.7 Unfunded Projects and Programmes ............................................................................................. 195
6.7.1 KPA 1: Municipal Transformation & Organisational Development............................................ 195
6.7.2 KPA 2: Basic Services and Infrastructure ................................................................................... 196
6.7.3 KPA 3: Local Economic Development ....................................................................................... 202
Eastern Cape Department of Rural Development and Agrarian Reform ........................ 203
7. Introduction .................................................................................................................................... 209
7.1 Legislative background .................................................................................................................. 209
7.2 IYLM’s Performance Management System .................................................................................... 211
7.2.1 Role of the Council ....................................................................................................................... 211
7.2.2 Role of the community ................................................................................................................. 211
7.2.3 Performance Indicators .............................................................................................................. 212
7.2.4 Performance Targets ................................................................................................................... 214
7.2.5 Publishing of Performance Reports and the Annual Reports ..................................................... 215
7.2.6 The PMS in relation to the IDP ................................................................................................... 216
7.3 Institutional Performance Management........................................................................................ 218
7.4 Individual Performance Management ........................................................................................... 218
7.4.1 The Performance Assessment process ........................................................................................ 219
7.4.2 Rewarding and correcting good and poor performance ............................................................ 220
7.5 Performance Audit ........................................................................................................................ 220
First Draft High Level Service Delivery Budget Implementation Plan (SDBIP) ................................. 221
Chapter 5: Financial Plan and Budget ................................................................................................. 232
8. Financial Viability ......................................................................... Error! Bookmark not defined.
8.1 Financial risks ............................................................................. Error! Bookmark not defined.
8.2 Key Challenges ............................................................................ Error! Bookmark not defined.
8.3 Financial Strategies .................................................................... Error! Bookmark not defined.
8.3.1 Revenue Enhancement and Maximisation Strategy ................ Error! Bookmark not defined.

Intsika Yethu IDP 2014-2015
Page 5
8.3.2 Subsidies and Grants ............................................................... Error! Bookmark not defined.
8.3.3 Credit Control and Debt Collection Policy............................... Error! Bookmark not defined.
8.3.4 Tariff Policy .............................................................................. Error! Bookmark not defined.
8.4 Asset Management ..................................................................... Error! Bookmark not defined.
8.4.1 Asset Management Strategies .................................................. Error! Bookmark not defined.
8.4.2 Asset Management Policy ........................................................ Error! Bookmark not defined.
8.4.3 Asset Movement System .......................................................... Error! Bookmark not defined.
8.5 Financial Management Strategies .............................................. Error! Bookmark not defined.
8.5.2 Operational Financing Strategies ............................................ Error! Bookmark not defined.
8.5.3 Strategies to Enhance Cost Effectiveness ................................ Error! Bookmark not defined.
8.5.4 Benchmarking and Performance Indicators ........................... Error! Bookmark not defined.
8.5.6 Training and Development of Staff ......................................... Error! Bookmark not defined.
8.5.7 Cost Effectiveness .................................................................... Error! Bookmark not defined.
8.6 Free Basic Services ...................................................................... Error! Bookmark not defined.
8.6.1 The indigent support policy ..................................................... Error! Bookmark not defined.
8.7 Actual expenditure and revenue for 2012/2013 ......................... Error! Bookmark not defined.
8.8 Financial Plan and Budget Statement ........................................ Error! Bookmark not defined.
8.9 Financial Recovery Plan ................................................................................................................ 249
8.10 Summarized Financial Statements .............................................................................................. 249
8.11 Recurring AGs reporting issues .................................................................................................... 254
8.12 Internal Controls .......................................................................................................................... 255
9.1 Amendments to Budget Related Policies ....................................................................................... 256
9.2 New Policies proposed ................................................................................................................... 256
9.3 History of Audit Reports ................................................................................................................ 256

Intsika Yethu IDP 2014-2015
Page 6
Acronym List
ABET Adult Basic Education and Training
AIDS Acquired Immune Deficiency Syndrome
ASGISA Accelerated and Shared Growth Initiatives for South Africa
BOP Best Operating Practices
CBP Community Based Plan
CDW Community Development Worker
CFO Chief Financial Officer
CFO Chief financial Officer
CHDM Chris Hani District Municipality
CIP Comprehensive Infrastructure Plan
COGTA
Department of Corporative Governance and Traditional
Affairs
CPF Community Policing Forum
DBSA Development Bank of Southern Africa
DGDS District Growth and Development Strategy
DLA Department of Land Affairs
DLGTA Department of Local Government and Traditional Affairs
DWAF Department of Water and Forestry
EAP Employee Assistance Programme
EC Eastern Cape
EC-DoE Eastern Cape Provincial Department of Education
ECSECC Eastern Cape Social and Economic Consultative Council
EHP Environmental Health Practitioners
FBS Free Basic Services
FET Further Education and Training
FMG Financial Management Grant
FS Free State
GP Gauteng Province
GRAP Generally Recognised Accounting Practice
GVA Gross Value Added
HDI Human Development Index
HIV Human Immune Deficiency Virus
HOD Head of Department
HV High Voltage
IDP Integrated Development Plan
IeC Integrated Energy Centre
IGR Intergovernmental Relations
ISD Integrated Service Delivery
IYLM Intsika Yelthu Local Municipality
KPA Key Performance Area
KPI Key Performance Information
KZN Kwa-Zulu Natal
LAC Local Aids Council
LED Local Economic Development
LRAD Land Redistribution for Agriculture Development
LTO Local Tourism Organisation
MDG Millennium Development Goals
MEC Member of the Executive Committee

Intsika Yethu IDP 2014-2015
Page 7
MFMA Municipal Finance Management Act
MHS Municipal Health Service
MIG Municipal Infrastructure Grant
MM Municipal Managers
MoU Memorandum of Understanding
MP Mpumalanga
MPAC Municipal Public Accounts Committee
MPRA Municipal Property Rates Act
MSA Municipal Systems Act
MSIG Municipal Systems Improvement Grant
MTEF Medium Term Expenditure Framework
MTREF Medium Term Revenue and Expenditure Framework
NC Northern Cape
NP Northern Province
NSDP National Spatial Development Plan
NW North West
OHS Organisational Health and Safety
PDP Personal Development Plan
PMS Performance Management System
PSDV Provincial Spatial Development Plan
RBIG Regional Bulk Infrastructure Grant
RED Regional Electricity Distribution
RSA Republic of South Africa
SALGA South African Local Government Associations
SANAC South African National Aids Council
SARS South African Revenue Services
SCCIP School Community Co-operative Ilima Programmes
SCM Supply Chain Management
SDBIP Service Delivery Budget Implementation Plan
SDF Spatial Development Framework
SDL Skills Development Levies
SETA Sector Education and Training Facilities
SLA Service Level Agreement
SMME Small Medium and Micro Enterprise
SPU Special Programmes Unit
SWOT Strengths, Weaknesses, Opportunities and Threats
TADA Treatment Against Drugs and Alcohol
UIF Unemployment Insurance Fund
VAT Value Added Tax
VIP Ventilated Improvement Pit (dry sanitation facility)
WC Western Cape
WSA Water Service Authority
WSP Water Service Provider

Intsika Yethu IDP 2014-2015
Page 8
List of Tables
Table 1: Distribution of Roles and Responsibilities in the IDP process ................................................. 19
Table 2: IYLM IDP Action Plan ............................................................................................................. 22
Table 3: Participation mechanisms for different Phases ....................................................................... 28
Table 4: Division of Powers and functions between CHDM and IYLM ................................................ 33
Table 5: Voting results of the Local Government Elections of May 2011 for IYLM .............................. 34
Table 6: Municipal Councillors for IYLM .............................................................................................. 35
Table 7: IYLM Budget Allocations 2010-2013 ....................................................................................... 37
Table 8: Audit outcomes for IYLM from 2006-2011 ............................................................................. 37
Table 9: Financial Policies of IYLM ....................................................................................................... 38
Table 10: Approved posts per Department circa 2010 .......................................................................... 39
Table 11: Existing Manuals of IYLM ...................................................................................................... 47
Table 12: Existing Institutional Policies of IYLM .................................................................................. 48
Table 13: Employment equity* within IYLM as at 13 January 2012 ..................................................... 50
Table 14: Poverty rates from 1995-2010 ................................................................................................ 56
Table 15: Social Grants recipients as a percentage of total population ................................................. 58
Table 16: HDI for the Eastern Cape, District and IYLM ......................................................................... 61
Table 17: Prioritised Secondary Nodes .................................................................................................. 69
Table 18: Development Zones ................................................................................................................ 73
Table 19: Cluster approach ..................................................................................................................... 77
Table 20: Progress against backlogs within IYLM ................................................................................ 80
Table 21: Funding sources for addressing service delivery backlog ...................................................... 81
Table 22: Household access to water within IYLM ............................................................................... 85
Table 23: Household access to energy within IYLM ............................................................................. 86
Table 24: Household access to refuse removal within IYLM ................................................................ 87
Table 25: Household access to sanitation in IYLM ............................................................................... 87
Table 26: Educational qualification levels within IYLM ....................................................................... 92
Table 27: IYLM Waste Generation Rates in relation to population growth trends............................... 95
Table 28: Tourism Facilities in IYLM .................................................................................................. 102
Table 29: Tabulation of strength, weaknesses, opportunities and threats .......................................... 103
Table 30: Heritage Tourism initiatives ................................................................................................ 104
Table 31: Sports and Recreation .......................................................................................................... 105
Table 32: Agriculture SWOT Analysis .................................................................................................. 107
Table 33: Forestry SWOT analysis ........................................................................................................ 110
Table 34: Comprehensive table displaying the different roles in the PMS process ............................. 212
Table 35: Integration of the strategic planning with the PMS ............................................................. 216
Table 36: Institution Performance Achievement Rating ..................................................................... 218
Table 37: Appraisal schedule of the IYLM PMS ................................................................................... 219
Table 38: Performance Rating Scale of the IYLM PMS ........................................................................ 219
Table 39 ................................................................................................................................................ 222
Table 40: IYLM budgeted expenditure versus actual expenditure 2010/2011 . Error! Bookmark not
defined.
Table 41: IYLM budgeted revenue versus actual revenue 2010/2011 ............... Error! Bookmark not
defined.
Table 42: Indicative 3 Year MTEF Budget for IYLM ........................................................................... 240
Intsika Yethu IDP 2014-2015
Page 9
List of Charts
Chart 1: Employment opportunities across economic sectors ..................................................................................................... 58 Chart 2: Employment opportunities within the informal sector .................................................................................................. 59 Chart 3: Inequality within CHDM with special focus on IYLM ................................................................................................... 62 Chart 4: Gross Value Added contribution (2010) as a percentage per Local Municipality within Chris Hani District ............ 63 Chart 5: GVA contribution of IYLM across economic sectors ..................................................................................................... 63 Chart 6: Access to Communication (2010 forecasts) ................................................................................................................... 88 Chart 7: Distribution of housing across IYLM .............................................................................................................................. 89 Chart 8: Educational levels of over-21 year olds .......................................................................................................................... 92
List of Figures
Figure 1: Municipal Manager’s Office organisational structure ............................................................ 40
Figure 2: Corporate Services’ organisational structure .......................................................................... 41
Figure 3: Finances organisational structure .......................................................................................... 42
Figure 4: Local Economic Development organisational structure ........................................................ 43
Figure 5: Community Services organisational structure ....................................................................... 44
Figure 6: Technical Services organisational structure .......................................................................... 45
Figure 7: Water and Sanitation Provisioning organisational structure ................................................ 46
Figure 8: Availability of activities within Provinces ............................................................................ 104
Figure 9: A visual representation of the hierarchy of strategic intent of IYLM.................................... 114
Figure 10: The convergence of KPAs, Clusters, and Goals for the IDP 2012-2017 .............................. 115
List of Maps
Map 1: Spatial Priorities ........................................................................................................................ 67
Map 2: Key nodes and corridors of IYLM .............................................................................................. 68
Map 3: Special Development Areas ...................................................................................................... 72
Map 4: Development Zones .................................................................................................................. 75
Map 5: Land Reform Zone .................................................................................................................... 76
Map 6: Water Resources ....................................................................................................................... 84
Map 7: Overviews of empty land and flood lines within IYLM ............................................................. 97
Map 8: Tourism .................................................................................................................................. 106
Map 9: Proposals Local Economic Development (Agriculture – Crops and Forestry) ...................... 108
Map 10: Forestry ...................................................................................................................................111

Intsika Yethu IDP 2014-2015
Page 10
Executive Summary
Intsika Yethu Local Municipality (IYLM), which has approximatel 145 372 in population, is located
within the Chris Hani District Municipality of the Eastern Cape. It has 21 wards, and is bounded by
municipalities such as Sakhisizwe, Engcobo, Emalahleni, Lukhanji, Amahlati, Mnquma, and Mbashe.
Cofimvaba and Tsomo are the main towns and the rural residential component comprises 213 villages
scattered throughout the municipal area.
Intsika Yethu prides itself of best agricultural resources in the land, with no less than three irrigation
schemes viz Ncora, Qamata and Bilatye Irrigation Schenes, which are considered to be the biggest
not only in the province but in South Africa as the whole. With its rich biophysical endownments in
the form of rivers and plains, its pristine natural veld,valleys and unique landscapes(for tourism), its
rich heritage resources and its relatively good potential soils; Intsika Yethu should be what “gold” is to
Gauteng, “platinum” to North West, and “coal” in Mpumalanga in so far as economic development is
concerned. It is incongruous that the area with such abundance of natural resources (water and land)
remains trapped in abject poverty and high levels of unemployment.
In lieu of the picture painted above and in fullfilment of the municipality’s legal obligation in terms of
Section 32 of MsyA of 2000, the Intsika Yethu Local Municiapality’s Council has taken a consultative
planning process in review of its Intergrated Development Plan( IDP) . The IDP sets out the objectives
and priorities the municipality intends to achieve in order to fulfil its vision and turn the situation
around. This will be through a set of strategies, programmes and projects that it will implement in the
financial year 2015/16.
As a service delivery sphere of government, Intsika Yethu Municipality is showing signs of becoming a
stronger institution. This is evidenced by its good track record in delivery of its mandate as well as
excellent working relationship between Council and Management. To that end; the municipality can
point to several achievements in the roll out of its programmes and projects. As much as there is a
story to tell in terms of service delivery, there remain many challenges that still beset the
municipality. It therefore goes without saying that there are tasks that need to be attended to in the
months ahead. The intended programmes and initiatives that will be a pedestal at the centerpiece of
Intsika Yethu’s development trajectory will be briefly alluded to below:
Within Basic Services and Infrastructure including social infrastructure, focus will be on investment
in the following key programs:
- Community Residential Units
The municipality has earmarked Erf 2342 within the Township of Thabo Village f or the purposes
for Community Residential Units, with collaboration with the Department of Human Settlement.
The development is in line with the Breaking New Ground policy (2004) for comprehensive
human settlements. The development is to accommodate individuals or households who are
unable to be accommodated in the private rental and social housing market. The Development is
structured in phases and the first phase involves the construction of 100 units comprising of
bachelor, one bedroom and two bedroom apartments. The first phase is envisaged to for the
2014/2015 financial year.
- Shopping Mall/Complex
The municipality has undertaken a project to develop of a shopping mall/complex within the
remainder of Erf 1 Cofimvaba. The shopping mall/complex is to be strategically located along the
R61. Within the remainder of Erf 1, Cofimvaba the municipality has identified three (3) portions

Intsika Yethu IDP 2014-2015
Page 11
of land parcels for the purposes of the shopping mall/complex; the municipality is to decide on
the appropriate location of the mall/complex after the process of evaluating developmental
proposals thereafter the selection of the developer whom is to develop the selected site(s).
- Office Space
The municipality has earmarked Erf 2310, Cofimvaba for the development of an office block, this
need is due to the growth of the municipality and the need for the governmental departments to
bring their services close to the people. The municipality has appointed Eris Properties as a
developer for the development of an office park on Erf 2310, Cofimvaba, the municipality is
currently collaborating with the Department of Public Works and Eris Properties, the
development of the offices is envisaged to take place during the 2014/2015 financial year.
- Rental Residential Units
Due to the envisaged economic and population growth of the municipality, the municipality has
seen a need to cater for rental residential units within the municipality. This need is also
supported by development of the mall/complex and office park. The municipality has made a
portion of the remainder of Erf 1, Cofimvaba which is at an extent of 9 Hectares available for the
purposes of mixed residential type options and the rental residential units is one of the options.
The development is to cater accommodation for individuals who get an income over an amount of
R3 500.00.
- Potable Water, Electricity, Road and Storm Water, and Sanitation service delivery
Provision
Generally poor levels of road access across IYM and sporadic transportation services are affecting
socio economic upliftment and local economic development initiatives; Climate change is leading
to increased incidents of storms, flooding and damage to buildings and infrastructure, which
threatens sustainable livelihoods; and inadequate bulk infrastructure capacity is stifling economic
investment and the development of towns.
- Planning, construction, connecting, upgrading and ensuring that all citezens of Intsika Yethu have
reasonable access to these basic services is but one of the strategic intent the municipality will
continue to address in 2014/15 and beyond. This is moreso given the backlogs the municipality
continues to grapple with, with MIG and Equitable share funding insufficient to address these
service delivery backlogs.
- Solid Waste Management: The municipality has established a functional landfill site in PPP
arrangement with Buyisa e-bag. This has resulted in the formation of a business structure in form
of a Co-operative that is currently in operating mainly made of women. It then can be said that
this initiative has not only been a good omen to environmental issues alone but has contributed to
LED in the form of job opportunities created through this venture.
In terms of Local Economic Development; there is widespread poverty, unemployment and
inadequate social support systems which make it difficult for local enterprise, contractors and
SMME’s to gain access to opportunities for trade and employment; Whilst there are significant
opportunities for agriculture and forestry in the area, connecting these opportunities to
meaningful community participation is complex and time consuming; and economic
sustainability of IYM is dependent upon retention of existing investors and attraction of new
investors. Key programmes to be pursued include, Integrated Energy Centre (IeC), which is going
to be a one stop shop for fuel (petrol, gasoline, and paraffin), Agricultural development through
livestock and crop improvement programmes, SMME support and Tourism development. In as far

Intsika Yethu IDP 2014-2015
Page 12
as agricultural development is concerned more efforts will be on the resuscitation of our irrigation
schemes which are a shadow of their former glory. The motive behind revitalisation of irrigation
schemes is as discussed below:
- Revitalisation of Irrigation Schemes: Intsika Yethu Municipality, recognising that its
irrigation used to be the hub of economic activities, employing a significant nummber of its
residents and providing a much needed food security in the early seventies to late eighties
embarked on the process of resuscitating these irrigation schemes. Working with Chris Hani
District Municipality, Provincial Department of Rural Development and Agrarian Reform, the
National Department of Rural Development and Land Reform and ECRDA, our collaborative
efforts will be focussed towards attracting investors to run the schemes under Public Private
Parteneships. The main objective being to exploit the undisputed agricultural potential of the area
and make agriculture the mainstay of the economy of Intsika Yethu like in the good old days.
- Tourism Development: One of strategic objectives of Intsika Yethu Municipality owing to its
rich heritage and tourism potential is developing tourism programmes with an intent to position
Intsika Yethu as a recognised tourist destination. IYM has a operating Local Tourism Organisation
also to market our products (LTO).
With regard to issues relating to: Good Governance and Public Participation (Deepening
Democracy) Strategic Framework: the municipal area is affected by marginalized and
dependent communities, therefore more effective and active community participation in
planning and development initiatives are needed. Towards this end, public participation systems
and structures continue to form a strong pillar of our governance. Despite many challenges, ward
committees and Traditional leaders remain functional while efforts to strengthen participation of the
business sector continue to preoccupy us. Intsika Yethu municipality is working tirelessly to improve
its relations with some traditional leaders and is strengthening the capacity of its Business Chamber so
that these Actors play a meaningful role in the affairs of the municipality. Internally a functional
Internal Audit unit, MPAC and internal audit continue to work tirelessly in ensuring that there is a
clean administration and that there a movement towards clean audit, a situation which has eluded us
in the past three years.
The main strategic focus of good governance and public participation includes implementing
Gender Mainstreaming, implementation of the Youth Development Plan and focus on addressing
HIV and Aids.
- Health/HIV-AIDS: HIV and AIDS affects every municipality and Intsika Yethu Municipality is
not imune in this phenomenon. HIV and AIDS results in greater demand for municipality and
support, such as health care, burial spaces, poverty alleviation and indigent concessions amongst
other things. In responding to HIV/AIDS epidemic ,Intsika Yethu municipality, developed a
strategy that focusses on amoungst other things, revival and strengthening of Local Aids Council
and mainstreaming HIV/AIDS in the IDP processes and core business of the municipality. Todate
we have a functional WARD LOCAL COUNCILS in all Intsika Yethu wards. We also have an
HIV/AIDS strategy that focusses not only on HIV in workplace but HIV at local level. Towards
this end Intsika Yethu won the best credible HIV/AIDS strategy at CMRA in September 2010. The
thrust of the strategy rests on public awareness campaigns, health education, counselling and
provision of health services and wide range of clinic facilities.
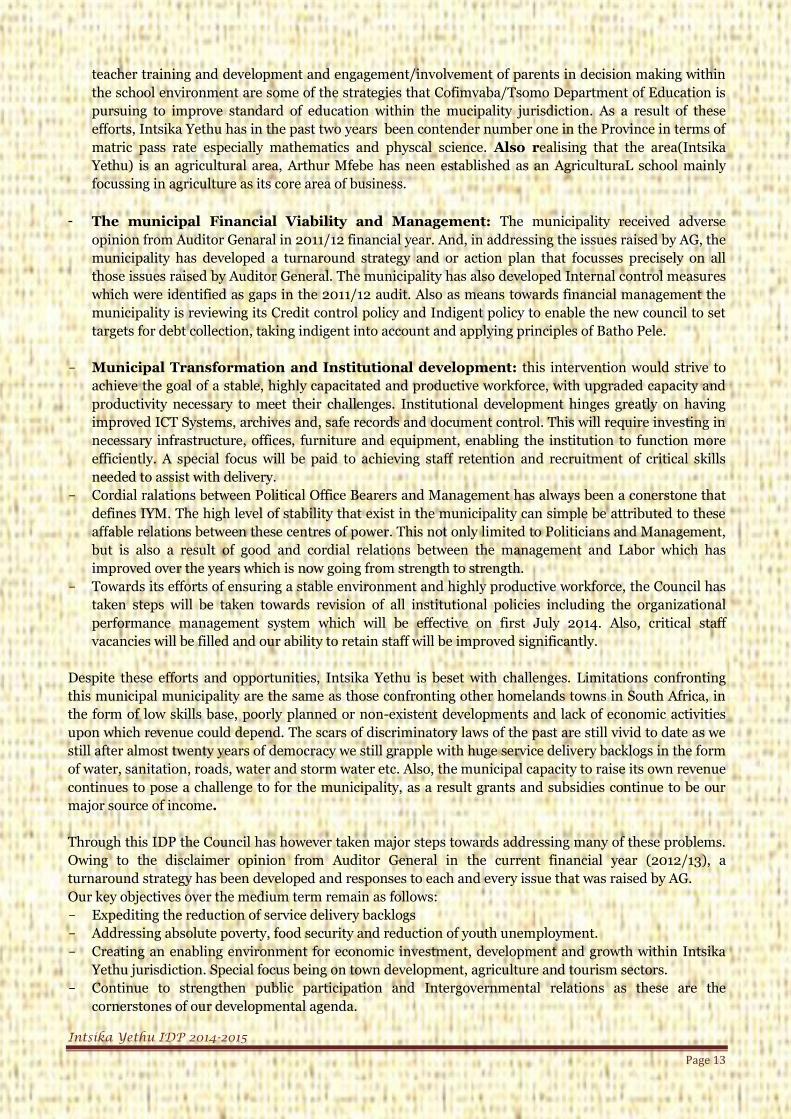
- Youth Development Plan: Education and literacy development programmes, Improving
learner perfomance and achievements, providing school infrastructure which include school buidings
i.e classrooms, provision of safety and security at schools, provision of scholar transport and nutrition,
Intsika Yethu IDP 2014-2015
Page 13
teacher training and development and engagement/involvement of parents in decision making within
the school environment are some of the strategies that Cofimvaba/Tsomo Department of Education is
pursuing to improve standard of education within the mucipality jurisdiction. As a result of these
efforts, Intsika Yethu has in the past two years been contender number one in the Province in terms of
matric pass rate especially mathematics and physcal science. Also realising that the area(Intsika
Yethu) is an agricultural area, Arthur Mfebe has neen established as an AgriculturaL school mainly
focussing in agriculture as its core area of business.
- The municipal Financial Viability and Management: The municipality received adverse
opinion from Auditor Genaral in 2011/12 financial year. And, in addressing the issues raised by AG, the
municipality has developed a turnaround strategy and or action plan that focusses precisely on all
those issues raised by Auditor General. The municipality has also developed Internal control measures
which were identified as gaps in the 2011/12 audit. Also as means towards financial management the
municipality is reviewing its Credit control policy and Indigent policy to enable the new council to set
targets for debt collection, taking indigent into account and applying principles of Batho Pele.
- Municipal Transformation and Institutional development: this intervention would strive to
achieve the goal of a stable, highly capacitated and productive workforce, with upgraded capacity and
productivity necessary to meet their challenges. Institutional development hinges greatly on having
improved ICT Systems, archives and, safe records and document control. This will require investing in
necessary infrastructure, offices, furniture and equipment, enabling the institution to function more
efficiently. A special focus will be paid to achieving staff retention and recruitment of critical skills
needed to assist with delivery.
- Cordial ralations between Political Office Bearers and Management has always been a conerstone that
defines IYM. The high level of stability that exist in the municipality can simple be attributed to these
affable relations between these centres of power. This not only limited to Politicians and Management,
but is also a result of good and cordial relations between the management and Labor which has
improved over the years which is now going from strength to strength.
- Towards its efforts of ensuring a stable environment and highly productive workforce, the Council has
taken steps will be taken towards revision of all institutional policies including the organizational
performance management system which will be effective on first July 2014. Also, critical staff
vacancies will be filled and our ability to retain staff will be improved significantly.
Despite these efforts and opportunities, Intsika Yethu is beset with challenges. Limitations confronting
this municipal municipality are the same as those confronting other homelands towns in South Africa, in
the form of low skills base, poorly planned or non-existent developments and lack of economic activities
upon which revenue could depend. The scars of discriminatory laws of the past are still vivid to date as we
still after almost twenty years of democracy we still grapple with huge service delivery backlogs in the form
of water, sanitation, roads, water and storm water etc. Also, the municipal capacity to raise its own revenue
continues to pose a challenge to for the municipality, as a result grants and subsidies continue to be our
major source of income.
Through this IDP the Council has however taken major steps towards addressing many of these problems.
Owing to the disclaimer opinion from Auditor General in the current financial year (2012/13), a
turnaround strategy has been developed and responses to each and every issue that was raised by AG.
Our key objectives over the medium term remain as follows:
- Expediting the reduction of service delivery backlogs
- Addressing absolute poverty, food security and reduction of youth unemployment.
- Creating an enabling environment for economic investment, development and growth within Intsika
Yethu jurisdiction. Special focus being on town development, agriculture and tourism sectors.
- Continue to strengthen public participation and Intergovernmental relations as these are the
cornerstones of our developmental agenda.

Intsika Yethu IDP 2014-2015
Page 14
- As the way of monitoring and evaluation a municipal-wide scorecard with targets for the next three
years has been developed which, in turn will lay the basis for the annual operational plans (SDBIP) and
the performance agreements for the Section 57 managers.
The Process Plan
In line with Section 28 and Section 29 of the Municipal Systems Act (MSA) of 2000, IYLM adopted a
process plan on the August of 2015 which outlined the programme, processes, and institutional
arrangements for the IDP review 2015-2016. In line with statutory requirements, provision was made for
public participation and community commentary and was considered integral to the development of the
document. Community identified priority issues are the point of departure for this document and as such,
a presentation of those issues and their comparative weighting is presented at the end of the section on
process.
Situational Analysis
The IDP 2015-2016 includes an in depth assessment of IYLM’s current situation with regards to both the
institutional arrangements of the municipality and the socio-economic profile of its inhabitants. The
objective of a comprehensive situational analysis in an IDP is to give a clear picture of the prevalent
circumstances in the municipality which in turn assists with the identification of priorities, opportunities
or short-comings in the municipality on both an institutional and societal level.
Institutional Review
The situational analysis elaborates on the institutional profile of the local municipality through presenting
a breakdown of the municipal powers and functions of the municipality as informed by The Constitution of
the Republic of South Africa (Act 108 of 1996), Section 156, Section 229 and the Municipal Structures Act
(Act 117 of 1998, Section 84). The situational analysis further presents a breakdown of the powers and
functions of the Local Municipality in relation to the District Municipality.
The situational analysis also gives information regarding the organisational structure of IYLM, including
the Municipal Managers office, the Corporate Services Directorate, the Finances Directorate, Local
Economic Development Directorate, Community Services Directorate, as well as the Technical Services
Directorate and Water and Sanitation Provisioning Services are presented. Brief consideration of the
municipality’s financial position and performance, as well as key considerations relating to vacancy and
funding are included. In addition, a list of institutional policies and manuals in IYLM is presented in the
chapter. Issues pertaining to human resources such as Employment Equity and Skills Development are
also briefly touched on in this section. The institutional review is considered representative of the
institution’s Finance, Governance and Administration cluster.
The Development Context and Socio-Economic Profile
The socio-economic profile of IYLM forms an integral part of the situational analysis; the profile provides a
detailed analysis of the population of IYLM and further provides some key insights into demographics,
socio-economic conditions, infrastructural service levels in the Municipal area and environmental issues.
The analysis lends weight to prioritisation of identified issues in IYLM and conveys some urgency with
regards to what needs to be done first.
The socio-economic profile elucidates many of the social issues which characterise IYLM. The data
demonstrates that IYLM has a relatively young and rural population which is characterised by high levels
of poverty and relatively low levels of literacy. The people of IYLM are also generally low income earners
with many of them having no regular income at all. The data further shows population decreases in recent
years which point to the possible outward migration of many people in search of better employment and

Intsika Yethu IDP 2014-2015
Page 15
education opportunities in more urbanised areas outside of the region. IYLM performs poorly in terms of
the Human Development Index (HDI) measures of life expectancy, literacy and education. Thus the
demographic profile of the municipality highlights a number of social-economic issues which hamper the
overall development of the IYLM community and must be considered as part of evidence-based planning
for the municipality.
Economic indicators in the situational analysis illustrate that IYLM has considerable potential for
economic growth. The tertiary sector is the biggest sector in terms of employment and economic output
with the secondary and primary sectors producing significantly less. This is problematic since it is the
latter sectors that tend to drive economic growth in poorly developed rural municipalities such as IYLM.
Chapter 3 of the IDP later elaborates further on the specific projects undertaken by the municipality that
seek to rectify the imbalances between economic sectors through stimulating growth in both the primary
and secondary sectors.
Spatial Analysis and Rational
The spatial analysis reflects the strategies, policies and maps that assist the municipality to plan
strategically in terms of the implementation of projects. The spatial analysis adds detail to the situational
analysis through presenting a geographical outline of the situation in the municipality. To this end the
Spatial Development Framework (SDF) for IYLM as been e reviewed and adopted by the Council on the 24
June 2013. The municipality has a GIS that shows all the municipal elements from the schools, clinics,
municipal offices and assets, governmental institutions, municipal boundary and all the settlements within
the municipality.
The following are regarded as key issues of spatial development within IYLM:
Dispersed settlements patterns and pockets of development at urban centres surrounded by
scattered underdeveloped rural villages, which implies great costs to achieve access to basic
services and infrastructure;
Need to systematically address the fragmented nature of development to promote the integration
of urban and rural areas over time (phased development approach which will optimise on existing
capacity and resources to generate the most spin-off effects from investment);
Prioritisation of different levels of investment to ensure on going sustainable development and
spin-off effects for continued economic growth in the IYLM area; and
Limited economic activity outside of urban centres.
The Service Delivery Profile
The service delivery profile of IYLM takes a clustered approach in considering the municipal status quo
with regards to existing backlogs, levels of service provision, and institutional arrangements within the
District and Local Municipality. Service delivery is differentiated between that of Technical Services, Social
Needs, Economic Planning and Development, and the Finance, Governance and Administration clusters.
Each cluster is examined in depth, considering the municipality’s position in relation to services aligned to
each cluster, as well as those areas where the municipality faces specific challenges, such as financing the
requisite backlogs eradication within Technical Services. Other challenges related to Disaster Management
arrangements with the District Municipality and considerations related to environmental health are also
noted.
Development strategies, projects and programmes
As part of the IDP process Council undertook an exercise to develop a vision for its current term of office.
A product of the political leadership of the municipality, the following Vision was formulated:

Intsika Yethu IDP 2014-2015
Page 16
“A people centred, developmentally focused rural local municipality in which all of its inhabitants have
access to quality service delivery and participate in vibrant and well-balanced social and economic
development”.
This institutional Vision was supported with the institutional raison d’etre, its Mission for being. That
Mission is as follows:
“Endeavours to advance its developmental local government mandate through a sustained focus on
sound and accountable governance, physical and social infrastructure appropriate for sustainable
development in our Municipal area”.
IYLM adopts the “Batho Pele Principles”, together with other underlying principles aligned to this value
framework, which include the following: Democracy, as realised through consultation, transparency, and
accountability; Respect & Courtesy; Responsiveness; Quality Services; Redress; and Value for Money.
These strategic intentions are supported by a clear alignment between organisational goals and objectives,
and service delivery targets across each of the five key performance areas of local government. This section
provides a detailed breakdown of the high-level service delivery targets and is substantiated with a list of
funded and unfunded projects over the Medium Term Expenditure Framework (MTEF) to advance these
objectives. It also represents the integration of various National, Provincial, District, and Local imperatives
in that Provincial projects within the municipal area are also clearly identified. The formulation of strategic
objectives in particular takes cognisance of those priorities and strategies already being advanced across
the three spheres of government and reinforces them.
Performance Management System
The IDP 2014/2015 includes Performance Management System (PMS) requirements applicable to IYLM.
These are derived from legislation relevant to the local municipality and with consideration of the service
level outputs prioritised annually by the municipality.
In this chapter the current IYLM PMS is assessed. Through this process, it is established that IYLM seeks
to review its current PMS and develop a new system during the 2012/2013 financial year. A framework for
the development of a comprehensive PMS is consequently included, which covers issues such as: roles of
stakeholders, performance indicators, performance targets, publishing of performance reports and the
PMS in relation to the IDP.
A first draft of the performance information component of the Service Delivery Budget Implementation
Plan (SDBIP) is also provided as these service delivery targets broken down over four quarters provide the
basis for Section 57 Performance Agreements, as per the MSA.
Financial Plan and Budget
The Municipality has developed a financial strategy in order to respond to the various priorities and
initiatives which are budgeted for as part of the IDP process. The council’s overall Financial Strategy is
structured into the following core components to allow for a clearer understanding of the overall task:
Revenue enhancement and maximisation strategies;
Asset management strategies;
Financial management strategies;
Capital financing strategies;
Operational financing strategies;
Strategies to enhance cost‐effectiveness; and
Free Basic Services and indigent support.
ENGAGEMENT
Local
Municipality
SITUATIONAL
ANALYSIS

Intsika Yethu IDP 2014-2015
Page 17
IYLM has recognised that there are other factors that could impact on the success of their financial
strategy such as financial risks which can be summarised as follows:
Limitation on revenue raising capacity due to high poverty indices;
Growth within debt composition associated with low level service offerings;
Financial distress- ratio analysis- specific on working capital elements;
Containment of personnel costs within set benchmarks as established within the budget process;
Governance and administration costs as a percentage of own revenue;
Increases associated with deferred maintenance and backlog eradication.
The section ends with a breakdown of the municipal budget over the MTEF and a brief overview of the
organisations audit history.
Overall, the IDP 2014/15 represents the collective efforts of IYLM staff, Council, and citizens in the crafting
of a strategic plan for the development of the municipal area, responsive to the needs and aspirations of its
citizens, informed by the technical skills and abilities of the administration, and within the limitations of the
scarce resource available to it.

Intsika Yethu IDP 2014-2015
Page 18
Chapter 1: Introduction and Planning Process
(Part A) Introduction
The IDP is the key planning instrument available to local government in the pursuit of decentralised,
strategic, participatory, implementation-orientated, coordinated and integrated development. Preparing
an IDP is not only a legal requirement in terms of the legislation but it is an imperative towards realising
the municipality’s major developmental responsibility to improve the quality of life of its citizens. The IDP
process creates platforms to enhance service delivery by securing the buy-in of all relevant role-players and
provides government departments and other social partners with a clear framework for realising the
municipality’s developmental goals and objectives.
Section 25 of the Municipal Systems Act, No 32, 2000 prescribes the following:
“Each municipal council must, within a prescribed period after the start of its elected term, adopt a single,
inclusive and strategic plan for the development of the municipality which:
(a) Links, integrates and co-ordinates plans and takes into account proposals for the development of the
municipality;
(b) Aligns the resources and capacity of the municipality with the implementation of the plan;
(c) Forms the policy framework and general basis on which annual budgets must be based;
(d) Complies with the provisions of this Chapter; and
(e) Is compatible with national and provincial development plans and planning requirements binding on
the municipality in terms of’ legislation.”
In accordance with the aforementioned prescript, Intsika Yethu Local Municipality (IYLM) has compiled
an Integrated Development Plan (IDP) in document form. This document is the sum of all the various
plans, strategies and goals that IYLM shall pursue over the next five years. The document takes into
consideration pertinent issues within the municipality and plots a way forward in terms of responding to
these issues which are of paramount importance to the well-being of the IYLM community.
IYLM therefore seeks to present in this document an integrated plan that will:
Link all of the municipal plans across the sectors in a coherent and effective manner;
Present the way forward through outlining the municipality’s goals, strategies, and objectives over
the next five years;
Be a source of information regarding the current situation in the municipality especially with
regard to the social circumstances of the municipality’s inhabitants and the institutional situation
within the municipal structures; and
Link the municipality’s plans and strategies to provincial and national mandates.
Ultimately the IDP of IYLM should act as the pillar upon which the municipality’s developmental approach
rests. The plan should inform and guide all projects that are focused on improving the lives of the
community; this is in keeping with national government’s “Batho Pele” approach of putting people first.

Intsika Yethu IDP 2014-2015
Page 19
(Part B) The Planning Process
1. The IDP Process Plan
In order to ensure certain minimum quality standards and proper coordination between and within
spheres of government in development of Integrated Development Plan (IDP), Section 28(1) and 29(1) (a)
and (b) of Municipal Systems Act of 2000 prescribes that the Council of the municipality must within the
prescribed period after the start of its elected term, “adopt a process set out in writing to guide the
planning, drafting, adoption and review of its IDP. This plan must include the following:
A programme specifying the time frames for the different planning steps;
Appropriate mechanisms, processes and procedures for consultation and participation of local
communities, organs of state, traditional authorities and other role players in the IDP drafting
process;
An indication of the organisation arrangements for the IDP process;
Mechanisms for integration and alignment.”
In compliance with the provisions of the Act as stipulated above, the LED and Planning Department of
IYLM submitted the following breakdown as part of the preparation for the crafting of the Integrated
Development Plan of the new Council for their term of office.
Table 1: Distribution of Roles and Responsibilities in the IDP process
Actors Role and Responsibilities
Executive Committee Recommends the Process Plan to Council;
Overall management, coordination and monitoring of
process and drafting of IDP;
Approves nominated persons to be in charge of the
different roles, activities and responsibilities;
Overall management and coordination of planning
process;
Public Participation; and
Ensures the annual business plans, budget and land use
management decisions are linked to and based on the
IDP
Municipal Council Political decision making body;
Oversees the development and review of the IDP;
Considers, adopts and approves process plan and IDP;
and
Adopts the Integrated Development Plan, Budget and
SDBIP.
Municipal Manager (MM) The MM utilized the Section 59 provisions of the
Municipal Systems Act to delegate the responsibility to
the Economic Development and Planning Director.
In terms of the process plan the IDP Manager was

Intsika Yethu IDP 2014-2015
Page 20
Actors Role and Responsibilities
tasked to:
Prepare the Process Plan for adoption by the
Municipal Council;
Manage the local municipal IDP by ensuring that all
daily planning activities were performed within an
efficient and effective consideration of available time,
financial and human resources;
Encourage an inclusive participatory planning
process and compliance with the action programme;
Facilitate the horizontal and vertical alignment of the
various internal and external departmental
programmes;
Ensure that the planning process outcomes were
properly documented;
Manage service providers engaged in the municipal
IDP process;
Chair the IDP Steering Committee;
Nominate persons in charge of different roles;
Respond to comments on the draft reviewed IDP
from the public;
Adjust the IDP in accordance with the comments of
the MEC for Local Government & Traditional Affairs;
and
Coordinate with various government departments
and other HODs to ensure that all the projects,
strategies and objectives of the local municipality are
shared and distributed amongst government
departments so that they might incorporate them in
their planning process and vice versa.
Chris Hani District Participate in the IYLM IDP Representative Forum; and
Provide relevant documentation and budget
information for planned projects and locations within
Intsika Yethu Municipal Area for the IDP 2012-2017.
Councillors/Ward Committees and
CDWs Major link between municipal government and
residents;
Link the planning process to their wards or
constituencies;
Set out a Municipal Vision, Mission, and Values;
Contribute to the Goal and Strategic Objective
formulation for the term of office;
Organise public consultation and participation;
Coordinate participation of Ward Committees in the
IDP Representative Forum;
Ensure proper documentation of the results of the

Intsika Yethu IDP 2014-2015
Page 21
Actors Role and Responsibilities
planning of the IDP document; and
Adjust the IDP in accordance with the MEC for Local
Government’s proposals.
Municipal and Government officials Provide relevant technical, sector and financial
information for analysis for determining priority issues;
Contribute technical expertise in the consideration and
finalisation of Strategic Objectives, Strategies,
Performance Indicators, and identification of Projects;
Provide departmental operational and capital
budgetary information;
Responsibility for the preparation of project proposals,
the integration of projects and sector programmes;
Responsibility for preparing amendments to the draft
IDP for submission to the municipal Council for
approval and the MEC for Local Government for
alignment; and
Preparation of all business plans for different
programmes and Projects for the IDP 2012-2017.
Community at large Represent their interests, contribute knowledge and
ideas (Rep forum);
Inform interest groups, communities and
organisations;
Analyse issues, determine priorities, and reach
consensus;
Participate in designing project proposals;
Discuss and comment on the draft IDP;
Monitor performance in implementation; and
Conduct meetings with groups, other communities, and
Traditional Leaders to prepare for follow up on relevant
planning activities.
The IYLM Process Plan was presented and approved by Council on the August 2015 and submitted to the
Department of Local Government and Traditional Affairs. Although there has been considerable deviation
from the adopted process plan, the following presents the schedule applied to the drafting of the
Integrated Development Plan, and continues to apply to the public consultation process going forward.
The details of the activities for the Process Plan are included in the table below.

Intsika Yethu IDP 2014-2015
Page 22
1. ACTION PLAN:
ACTIVITY PLAN MECHANISM KEY FOCUS AREA RESPONSIBLE TIME FRAME
PLANNING PHASE
Draft IDP process plan that guide the planning , drafting, adoption and review of the IDP (MSA, s 28)
EXCO Meeting IDP and Budget Process plan tabled to to EXCO
IDP Manager / Municipal Manager
12August 2013
Presentation of IDP process plan and Budget plan to the Council
Council Meeting Adoption by the council
Municipal Manager
13August 2013
Give notice to local community of particulars of the process , (MSA s28)
Advert Advertisement IDP Manager 30 August 2013
IGR Meeting: IGR meeting To consider comments /proposals received from MEC, DPLGTA, AG (MSAs 32) and any other comments/ proposals received from councillors, ward committees and other role players.
Office of the Municipal Manager
26th September 2013
Municipal Score Card
Assessment of the performance of the municipality and submit a section 72 report on the assessment to the mayor, provincial Treasury and national treasury.
Municipal Performance Management Systems
Office of the Municipal Manager
10 October 2013

Intsika Yethu IDP 2014-2015
Page 23
ANALYSIS PHASE
Finance Committee
Revision of draft estimates
OPEX Preparations Preliminary discussion of Finance committee, to revise Tariff increases, salary increase, general expenses, repairs and Maintenance. Key future changes to be reflected considering all strategies and studies, Develop priority areas, reflect on all factors that could potentially impact on future budgets.
Finance committee Municipal Manager CFO
27 September 2013
Technical Steering Committee
IDP Steering committee meeting
Hold a self-assessment dialogue to review performance of the municipality and determine short comings and weakness. Identify and plug gaps as identified by AG and Internal Audit Committee. Also discuss Infrastructure plan for the municipality
Municipal Manager CFO, Infrastructure Manager IDP Manager
11 October 2013
IGR Meeting IGR Meeting Preparation for community needs programme.
Municipal Manager IDP Manager
15 October 2013
Ward IDP review Process
Ward Base Planning Sessions
Present the programme for community needs collection to the Councillors. Community needs collection, prioritised and ranked by ward residents.
Office of the Speaker EXCO members Ward Councillors Municipal Manager Municipal Directors IDP Manager
21 October -29 October 2013
Special Finance Committee
Revision of draft estimates
OPEX Preparations To prepare draft capital and operational plan with cost and revenue estimates for IDP. HOD’s to access
Fin Com Municipal Manager IDP Manager
October 2013

Intsika Yethu IDP 2014-2015
Page 24
human Resource component of the operating budget for the next year and for the two outer years.
Technical IGR meeting
IGR Meeting Reflection on community needs and path way forward. Assess provincial strategic plan and sector plans
Sector Departments HOD IDP Manager Municipal Manager
4 November 2013
Information Session CHDM Desk work
District Rep Forum
Brief on how far the different municipality are with the review their IDP and if they are still aligning with District IDP
District IDP Manager
28 November 2013
STRATEGIES PHASE REVIEW OF VISION, MISSION ,STRATEGIES, PROGRAMME AND PROJECTS
IDP Rep Forum IDP Forum meeting
EXCO / Council lekgotla to review and update the Vision, Mission, Objectives.
Municipal Manager IDP Manager
06 February 2014
IDP Steering Committee
IDP Steering Committee meeting
Refining municipal strategies, Objectives KPA’s, KPI and targets so as to influence the budget. Set and agree on IDP priority programmes/projects and Strategies.
Municipal Manager Directors
February 2014
Strategic Planning
Strategic Session Quarterly performance reporting. HOD’s to present IDP Projects / Programmes, Capital and Operational budgets, Service delivery backlogs, HR issues (institutional capacity), Financial situation, Spatial socio- economic, and environment.
Municipal Manager HOD
February 2014

Intsika Yethu IDP 2014-2015
Page 25
High level SDBIB EXCO HOD’s to present their Implementation plans i.e. Define indicators, outputs and targets; identify major activities, time frames and responsibilities, Setting targets and key performance indicators , outlining the Projects cost and institutional resources needed. Also invite communities to make their inputs.
Municipal Manager All HOD’s
13 February 2014
Budget discussions
EXCO Finalise alteration if applicable. Submission of altered draft budget to Mayor and EXCO. Integrate and align Budget and IDP
EXCO Municipal Manager CFO
04 March 2014
ALIGNMNET AND INTERGRATION
Horizontal and Vertical alignment with District, Province, National
Technical team Steering Committee
Integrated sectoral programme, (LED, HIV, Poverty Alleviation, Gender Equity etc) Consolidated monitoring /performance management system, Disaster Management plan, institutional Plan, Reference to sector plans.
All Head of Department
21 March 2013
Approval of draft Budget
Council Submission of EXCO report on draft budget and draft IDP to full Council
Mayor Municipal Manager CFO
27 March 2014
Submit draft IDP and SDBIP
Advert Submit draft copies of IDP and budget to DLGTA and Provincial Treasury
IDP Manager 9 April 2014

Intsika Yethu IDP 2014-2015
Page 26
Publication of the draft IDP/Budget
IDP Manager Advertising the draft budget and draft IDP for public comments for a period of 21 days Consolidate project proposals in terms of location and sector
IDP Manager April 2013
Publication of the draft IDP/Budget and invitation to local community and stakeholders for comments and inputs and submission to Provincial Treasury
Advertisement Draft IDP / Budget advertised for public comments for 21 days
IDP Manager 03 April 2014
Draft IDP and Budget
Mayoral Imbizo IDP/ Budget Road show public hearings.
Mayor EXCO Municipal Manager Directors IDP Manager Budget Office
22- 24 April 2014
IGR Technical meeting
IGR meeting Integration
Municipal Manager office
15 May 2014
APPROVAL PHASE
Adoption Council Meeting Final Adoption of the IDP and Budget
IDP Manager Municipal Manager Council
28 May 2014
Submission of the final IDP
MEC IDP submission
IDP Manager June 2014
PERFOMANCE MANAGEMENT SYSTERM
SDBIP and PMS SDBIP and PMS Submission of draft Services delivery and implementation plan with in 14days after the approval of the budget to the mayor. Submission of draft annual performance agreements for the next year to the mayor
Municipal Managers office
June 2014

Intsika Yethu IDP 2014-2015
Page 27
SDBIP Management Approval of SDBIP within 28day after the approval of the budget. Loading accounting system with new budget data Implementation of SDBIP
Mayor June 2014
Public awareness with 14 days after the approval.
Advert Advertising in all public viewing places and media.
IDP Manager July 2014
The above process plan is in compliance with the provision of Chapter 4 of the MSA, as amended, and
allows for meaningful participation in IDP processes via the established forums. In terms of Section 32(2)
of the MSA, the Provincial MEC for Local Government and Traditional Affairs is authorised to provide
suggestions and advice based on the findings of the IDP analysis. In this regard MEC comments for
2014/15 IDP have been instrumental in guiding the planning process in writing up the IDP. The MEC
comments received by IYLM were helpful in addressing gaps during the drafting of the IDP. The
municipality has considered the comments, although the specific municipal responses were not necessarily
captured in the IDP. Accordingly the IDP has been prepared in accordance with the assessment of IYLM as
required in terms of Section 41 of the MSA.

Intsika Yethu IDP 2014-2015
Page 28
1.1 Mechanisms and Procedures for Public Participation
One of the most exciting opportunities of the planning and budgeting process is the potential for
involvement of community and stakeholder organisations in the process. This insures that the IDP
addresses the real issues that are experienced by the citizens of IYLM. The Constitution stipulates that one
of the objectives of the municipality is “to encourage the involvement of communities and community
organisations in the matters of local government”. The White Paper on Local Government also puts
emphasis on the role and significance of public participation. Participation varies from internal to external
stakeholders inclusive of IGR clusters (various municipal departments) Portfolio Committees, Community
Development Workers, Ward Councillors, Ward Committees, Local Tourism Organisation, the Executive
Committee and Council, Traditional Councils, IDP Representatives Forums, etc. Regardless of the
stakeholder, the engagement and participation creates an opportunity for more robust engagement,
ownership, and ultimately a more credible IDP going forward.
The aforementioned stakeholders have already interacted with the document and will continue to be
engaged in the process of refining the draft IDP in the following manner:
Use the IDP Representative Forum to critique, verify, and add additional information;
Use the IDP Representative Forum to ensure that community priorities are adequately reflected in
the IDP;
Engage Councillors’ and Community Development Workers to call meetings to keep communities
informed on the IDP processes;
Request feedback on municipal progress;
Use newspaper advertisements to inform communities of the process;
Distribute pamphlets/summary books on IDP’s & budget;
Make the IDP & budget available for public comment; and
Make the IDP & budget documents accessible to all members of the public.
The following table provides an overview of the various participation mechanisms employed across the
different phases of the IDP process.
Table 2: Participation mechanisms for different Phases
Planning Phase Participation Mechanism
Analysis Community meetings
Stakeholder meetings
CBP/ward committees
Strategies Technical committee craft strategies
Project Technical committees with selected representatives of
stakeholder organisation
Integration IDP Representative Forum
Approval IDP Representative Forum
Public discussion, consultation process
Community meetings

Intsika Yethu IDP 2014-2015
Page 29
Planning Phase Participation Mechanism
Stakeholder meeting
Opportunity for comments from the public
Monitoring of implementation IDP representative Forum
Community meetings
Stakeholder meetings
The municipality’s Community Participation Strategy has informed this process and provided for the
involvement of the public in identification of key issues that inform the resources the production of a
credible IDP. Furthermore, public comment and engagement on the draft document has further enhanced
its credibility in this regard.
1.1.1 Ward committees and CDWs
One of the intrinsic features of the Integrated Development Planning process undertaken by the IYLM is
the involvement of community and stakeholder organisations in the process. Participation of affected and
interested parties ensures that the Integrated Development Plan (IDP) addresses the core developmental
issues experienced by the citizens of a municipality. To further strengthen community engagement the
municipality has in collaboration with its constituencies established 21 Ward Committees of ten members
each, with Ward Councillors acting as Chairpersons.
Through the engagements with the Ward Councillors, Ward Committee members and CDWs, the following
issues were identified as having the potential to negatively affect their functionality:
Lack of understanding and clarity on the roles and responsibilities;
The different literacy levels and the general understanding of Local Government between Ward
Committees, CDWs and Ward Councillors;
Poor coordination of Ward Committees and community meetings;
Lack of commitment of some of the Ward Committee members and support staff; and
Lack of reports and/or attendance registers.
Ward Committees are central to the IDP planning process, as supported by legislation. As representatives
of the developmental aspirations and needs of the Wards, they also form an information
assimilation/dissemination mechanism between a municipal Council and the community. The Ward
Committees are also crucial to the development, implementation, monitoring and reporting of municipal
performance on the service delivery targets and planned interventions as presented in the municipal IDPs.
1.1.2 Issues identified by Wards within IYLM
This section of the Situational Analysis is required by Chapter 4 of the Municipal Systems Act of 2000.
IYLM has been actively involved in the community participation meetings and has considered all the needs
identified in previous IDP Reviews and consultation at various ward level. The Municipality is in a process
of preparing local area plans (Ward Based Plans) which serve as a good base for the IDP and helps the
municipality in making well informed planning and budget decisions. The local area plan is the process of
facilitation where communities are assisted in developing plans. This process serves to enhance the public
participation in the IDP process; hence the plans are articulated in the IDPs of the municipalities.

Intsika Yethu IDP 2014-2015
Page 30
These issues identified by IYLM communities provide a firm starting point for a more robust examination
of the developmental status quo as part of the Situational Analysis of the IDP 2014-2015
Key priorities agreed with communities
The following are agreed as top ten development priorities for Intsika Yethu in 2015/16.
CONSOLIDATED IYM PRIORITY NEEDS
ROADS
WATER AND SANITATION
ELECTRICITY
HOUSING
HEALTH(CLINICS AND HOSPITAL)
AGRICULTURE(dry land crop production, shearing sheds; dipping tanks; fencing of lands)
EDUCATION
SAFETY AND SECURITY
PUBLIC AMENITIES
SPORT FIELDS
TRANSPORT(BUSES TO COLLECT PEOPLE FROM VILLAGE TO TOWN)
SASSA (GRANTS)
SMME DEVELOPMENT
Intsika Yethu IDP 2014-2015
Page 31
Chapter 2: Situational Analysis
(Part A) An Institutional Review
Introduction This section of the Integrated Development Plan provides an overview of the current status quo within
IYLM. The section is aimed at painting a picture of the current situation in IYLM that has assisted in the
identification of key issues to be addressed over the medium term as well as their prioritisation. The
Situational Analysis covers information such as demographics, employment information, socio-economic
data, economic data, governance and organisational information, and service delivery. In addition, this
section elaborates upon crucial spatial considerations identified within IYLM’s Spatial Development
Framework (SDF). It is hoped that after reading this section the reader will have gained a comprehensive
understanding of the current situation in IYLM and the challenges and opportunities facing the
municipality.
But before going into further detail of socio-economic status quo, it is important to contextualise the
municipality’s situation by presenting the various municipal powers and functions.
2. Institutional Profile
2.1 Municipal Powers and Functions
In order to develop a fully functional Municipality in line with the developmental mandate of Local
Government, it is necessary to be aware of the municipal powers and functions as they were Gazetted, and
directed by the MEC of Local Government and Traditional Affairs in the Eastern Cape Province.
The Constitution of the Republic of South Africa (Act 108 of 1996), Section 156, Section 229 and the
Municipal Structures Act (Act 117 of 1998, Section 84) provides a broad framework for the allocation of
powers, duties and functions between District and Local Municipalities. Since a Municipality has executive
authority in respect of, and has the right to administer the local government matters listed in Part B of
Schedule 4 and Part B of Schedule 5. Much confusion still prevails regarding which of the two tiers of Local
Government is responsible for various functions. This confusion not only lies between the District
Municipality and Local Municipality, but also between the District Municipality and Provincial and
National Departments.
Firstly, the powers of municipalities as institutions of Local Government, one of the three spheres of
government, are recognized and protected in the Constitution. Secondly, the exercise of municipal
legislative power is no longer a delegated function subject to administrative review, but a political process,
influenced by the considerations and input of elected Councillors, representing the will of the municipal
residents. The Constitution provides that municipalities have legislative and executive powers over the
functional areas listed in Schedules 4B and 5B of the Constitution. Section 156(1) and (2) and the two lists
of functional areas in Schedules 4B and 5B constitute the primary source of power for Local Government.
The constitutional allocation of ‘original powers’ to Local Government produces at least two areas of
overlap, namely supervisory overlap and overlap between matters listed in the Schedules. The Constitution
does not allocate the matters in Schedule 4B and 5B exclusively to Local Government; National and
Provincial Government may also regulate those matters. The Local Government matters listed in Schedule
4B are part of the concurrent provincial and national legislative competence “to the extent set out in
section 155(6) (a) and (7)”. Similarly, the Local Government matters listed in Schedule 5B are part of the
exclusive provincial competence “to the extent set out for provinces in section 155(6) (a) and (7)”. National

Intsika Yethu IDP 2014-2015
Page 32
and Provincial Governments have the authority to ensure that municipalities adequately perform in
respect of these matters. The Constitution provides that, subject to section 151(4), a by-law that conflicts
with national or provincial legislation is invalid.
Section 155(6) (a) of the Constitution states that Provincial Government has a duty to monitor and support
Local Government in its jurisdiction. The Province must assert legislative and executive power in order to
promote the development of local government’s capacity to perform its functions and manage its affairs
and they may do so by regulating municipal executive authority, thus ensuring the municipalities’ effective
performance of their functions in respect of listed local government matters. Taken together, these
competencies are considerable and facilitate a measure of Provincial Government control over the manner
in which municipalities administer those matters in Part B of Schedules 4 and 5. This control is not purely
administrative. It could encompass control over municipal legislation to the extent that such legislation
impacts on the manner of administering Local Government matters.
Another consideration relates to the role and function of traditional leaders and how they are to be
incorporated into the Local Government structures and procedures in future. The Traditional Leadership
and Governance Framework Act (Act 41 of 2003) provide that the MEC for Local Government and
Traditional Affairs appoint representatives of traditional leaders to participate in the Council as provided
in the Municipal Systems Act (Act 32 of 2000). In this regard the issue of land administration between the
Municipality and the traditional leaders is a challenge that needs to be addressed. The challenge arises
when traditional leaders continue to allocate land to communities without engaging the municipality to
ascertain issues relating to township establishment and land development requirements generally. This
may result in communities occupying sites in which no services have been provided and where no formal
procedures are followed.
This situation leads to a host of other challenges which including health related problems, occupation of
land not suitable for human settlement, compounding existing challenges of poverty eradication. IYLM
and relevant traditional leadership structures must devise a system of engagement and cooperation in
order to address this challenge.
It is obvious that without clarity on power, duties and functions (responsibilities) between these
institutions it becomes very difficult to design strategies and formulate projects and budget accordingly.
This has been a significant problem in the IYLM IDP development process in the past. It is in this regard
that, this issue is identified by IYLM and is essential that a concerted effort be sustained in order to resolve
matters pertaining to the allocation of powers, duties and functions pertaining to all disciplines.
As far as powers and functions are concerned, CHDM performs certain functions within IYLM.
Additionally, due to existing low capacity in some areas, CHDM will, in consultation with Local
Municipalities, enter into a contract with the external service provider to supplement capacity. It remains a
two-way commitment between a Local Municipality and the District Municipality to build adequate
capacity for accelerated service delivery. Below is a table of the Powers and Functions distributed between
CHDM and IYLM as authorised, and as per the status quo.

Intsika Yethu IDP 2014-2015
Page 33
Table 3: Division of Powers and functions between CHDM and IYLM
Services CHDM
authorised
powers
IYLM
authorised
powers
IYLM Status
Quo
Part B of Schedule 4
of the Constitution of
RSA
Air Pollution No Yes No
Building regulation No Yes Yes
Child care facilities No Yes Yes
Electricity and gas
reticulation
Yes No No (Eskom)
Fire fighting Yes Yes No
Local Tourism Yes Yes Yes (Resolve
w/ CHDM)
Municipal Airports Yes Yes No
Municipal Health Yes Yes No SLA
Municipal planning Yes Yes Yes
Municipal Public Works Yes Yes Yes
Pontoons and Ferries No Yes Yes
Municipal public transport Yes Yes Yes (only Infra.
Provision)
Sanitation Yes Yes Yes (SLA)
Storm water No Yes Yes
Trading regulation No Yes Yes
Water Yes Yes Yes (SLA)
Part B of Schedule 5
of the Constitution of
RSA
Beaches & amusement
facilities
No Yes No
Billboards &
advertisements
No Yes Yes
Cemeteries, parlours &
crematoria
No Yes Yes
Cleansing No Yes Yes
Control of public nuisance No Yes Yes
Control of undertakings
that sell liquor
No Yes Yes
Facilities for
accommodation, care &
burial of animals
No Yes Yes
Fences & Fencing No Yes Yes
Licensing and controlling
of undertakings that sell
food to the public
No Yes Yes
Licensing of dogs No Yes No
Local amenities No Yes Yes
Local Sports facilities Yes Yes Yes
Markets Yes Yes Yes
Municipal abattoirs Yes Yes No

Intsika Yethu IDP 2014-2015
Page 34
Services CHDM
authorised
powers
IYLM
authorised
powers
IYLM Status
Quo
Municipal parks &
recreational facilities
No Yes Yes
Municipal roads Yes Yes Yes
Noise pollution No Yes Yes
Pounds No Yes Yes
Public places No Yes Yes
Refuse removal dumps &
solid waste disposal
Yes Yes Yes
Street lighting No Yes Yes
Street trading No Yes Yes
Traffic and parking No Yes Yes
From Section 84(1)
of Municipal
Structures Act of
1998
Receipt, distribution and
allocation of grants
Yes No No
Imposition and collection
of taxes, levies, and duties
Yes No Yes
The above table illustrates the powers and functions that IYLM is authorised to perform (in the second
column) against the functions and responsibilities actually performed (in the third column) the last
column present a status quo, the CHDM functional responsibilities are shown in first column. Where a
yes appears in both columns, it means that the function is shared between District and Local municipality.
2.2 Municipal Council and institutional governance
The Local Government Elections of May 2011 saw the African National Congress (ANC) retain its control
of the Intsika Yethu Municipal Council, receiving nearly 90% of the total votes cast in the election. Of the
72,149 registered voters, 43,716 turned out for the election across all 21 wards, a total of 60.59% of the
potential electorate. Twenty-one Councillors were elected to represent their Wards while another twenty-
one were elected from a Proportional Representation ballot, bringing the Municipal Council to 42 in total.
Table 4: Voting results of the Local Government Elections of May 2011 for IYLM
Leading parties Ward votes and
%
Party votes and % Ward Prop. Rep Total
1st ANC 37165 87.83% 37956 88.35% 21 16 37
2nd COPE 1908 4.51% 1958 4.56% - 2 2
3rd UDM 1656 3.91% 1466 3.41% - 2 2
4th PAC 517 1.22% 555 1.29% - 1 1
Others 1068 2.52% 1025 2.39% - - -
Total 42314 100.00% 42960 100.00% 21 21 42
Within the Municipal Council, Councillors elected from the Proportional Representation list make-up the
Executive Committee of Municipality and hold various portfolio positions to which they apply political
leadership and guidance towards the delivery of services to the citizens of IYLM.

Intsika Yethu IDP 2014-2015
Page 35
The following positions are currently held within IYLM:
Mayor: Ms K Vimbayo
Speaker: Mr J Cengani
Chief Whip: Mr Myathaza
Mayoral Executive Committee Members-
Infrastructure, Development & Planning: Ms Khanyisa Mdleleni
Community Services: Ms NA Tshangana-Nkota
Local Economic Development: Mr W Mdwayingana
Corporate Services: Ms N Ntsaluba
Treasury & Budget: Mr Nobhongoza
Special Programmes: Mr Toni
In addition to the 8 Councillors above, 34 other Councillors make-up the Intsika Yethu Local Municipal
Council. The total list of Ward and Proportional Representation Councillors follows below.
Table 5: Municipal Councillors for IYLM
Ward Councillors Wards Proportional Representation
Councillors
Cllr Holta Mhlawevoti Hewu 1 1 Cllr Koliswa Vimbayo
Cllr Neliswa Portia Gadeni 2 2 Cllr Jongumzi Cengani
Cllr Madoda Lawrence Papiyana 3 3 Cllr Ntombazipheli Nkota-Tshangana
Cllr Manyewu Shasha 4 4 Cllr Noloyiso Kolosa Ntsaluba
Cllr Dudu Kaspile 5 5 Cllr Myolise Toni
Cllr Mahkwenkwane Henry Mahali 6 6 Cllr Kanyiswa Florence Mdleleni
Cllr Nophelo Magaga 7 7 Cllr Saziso Myataza
Cllr Nozuko Sygnoria Mafanya 8 8 Cllr William Ndamthini Mdwayingana
Cllr Monde Armon Mbotshane 9 9 Cllr Mandisi Mbebe
Cllr Mwezi Innocent Bikitsha 10 10 Cllr Noloyiso Ntloko
Cllr Zweloxolo Mxi 11 11 Cllr Zonwabele Shepher Matshikiza
Cllr Vuyokazi Gladys Matomela 12 12 Cllr Velile Sobekwa
Cllr Siphiwo Mkunyana 13 13 Cllr Phumzile Nqandela
Cllr Malibongwe Gulubela 14 14 Cllr Nobom Bani
Cllr Albertinah Nokwetu Royi 15 15 Cllr Nokwakha Jada
Cllr Noloyiso Mto 16 16 Cllr Nayisile Headman Mgodeli
Cllr Noxolo Faith Nowandile
Dangazela
17 17 Cllr Nomgcobo Albertina Somdyala
Cllr Noxolile Mavis Hexana 18 18 Cllr Monwabisi Zulu
Cllr Mayenzeke Yamile 19 19 Cllr Humphrey Sangolibanzi Nobongoza
Cllr Zukiswa Qayiya 20 20 Cllr Sizwe Tame
Cllr Nontembiso Baleka 21 21
Supportive of the good governance function within IYLM are a number of structures and positions that
fulfil a variety of roles and functions. An overview of these bodies and groups will also highlight some of
the achievements of the previous term.
2.3 Committees of Council

Intsika Yethu IDP 2014-2015
Page 36
IYLM has both Section 79 and Section 80 Committees established as per legislative requirements to
support the good governance function of Council. Within the municipality Section 79 Committees fall
under the Speaker’s Office and fulfil key governance functions of predominantly an administrative
oversight nature, whereas Section 80 Committees are standing committees aligned to the various
functional areas for service delivery within the municipality under the Mayor’s office. In the previous term
some of the Section 79 Committees were unable to fulfil their duties adequately, in part because of a failure
to delegate responsibilities adequately as required in Section 79 of the Municipal Finance Management Act
(MFMA).
2.4 Community Development Workers (CDWs)
CDWs within IYLM are the foot-soldiers for service delivery and accountable governance. Based within the
Local Municipality’s LMs 21 wards, these workers compile monthly reports for submission to the Speaker’s
Office and to the Department of Local Government and Traditional Affairs detailing the conditions on the
ground.
In the previous term, CDWs played an instrumental role in the identification of service delivery
shortcomings and assisted in ensuring a number of interventions were carried out to address these issues.
They also played a prominent role in publicising and mobilising residents to target part in government
sector gatherings and meetings.
2.5 Ward Committees
Following the re-demarcation process conducted by the Demarcation Board during the previous term,
IYLM saw its Ward composition change from 23 Wards to the current 21 Wards. Each Ward has
representation of ten committee members of which the Ward Councillor acts as Chairperson at meetings
and is responsible for holding meetings within their respective Wards.
Every Ward Committee within Intsika Yethu Municipal Area is considered functional and active, partially
due to the successes of the previous term in which each Ward had its own programme of action. Ward
Councillors regularly furnish reports on meetings and service delivery progress to the Speaker’s Office to
keep the municipality informed and ensures accountability.
2.6 Finances and Financial Management
Given the poverty rate within the municipality and the high grant dependency of many IYLM citizens, the
municipality is not yet financially viable in terms of a local revenue base, and remains reliant upon its
Equitable Share allocations and MIG funding to undertake its core functions in the area of basic services
and infrastructure provision. Capital expenditure has remained a priority within IYLM and has been
bolstered in recent years by a growing and increasingly capable staffing complement.
The information provided below gives an overview of IYLM’s finances over the previous two years as well
as a projection for 2013/2014. It details a considerable increase in operational expenditure while showing
a relatively stable allocation for capital projects.

Intsika Yethu IDP 2014-2015
Page 37
Table 6: IYLM Budget Allocations 2010-2013
Budget 2011/2012
Capital Operating Total
R 20,270,000 R 114,374,000 R 134,644,000
Budget 2012/2013
Capital Operating Total
R 22,500,000 R 118,974,000 R 141,474,000
Budget 2013/2014
Capital Operating Total
47,149,000 155,070,700 202,219,700
Source: Gaffney’s Local Government in South Africa Yearbook 2011-2013, p. M134
Over the previous term IYLM experienced some challenges in effectively applying the funds available to it
in a transparent and accountable manner. Nevertheless, IYLM has been proactive in its approach to
dealing with graft and fraud by developing a Fraud Prevention Policy that seeks “the ultimate eradication
of fraud, corruption, theft and maladministration by means of the application of the full spectrum of both
pro-active and re-active measures at their disposal.”1
Performance in terms of a clean administration fluctuated considerably. After beginning the term with an
Adverse audit opinion for 2006-2007, the LM regressed before improving to a qualified audit opinion in
2008/2009 and regressing again to a Disclaimer the following year.
Table 7: Audit outcomes for IYLM from 2006-2011
2006/2007 2007/2008 2008/2009 2009/2010 2010/2011
Adverse Disclaimer Qualified Disclaimer Disclaimer
Source: Auditor General Local Government Annual Reports 2006-2011
At the close of the 2010/2011 financial year, IYLM was the last of all Eastern Cape municipalities to finalise
its Annual Financial Statements, delaying the findings of the Auditor General, and eventually receiving a
Disclaimer. It has subsequently engaged on the findings identified by the Auditor General and taken
proactive steps to rectifying some of the issues raised.
Prior to the release of the 2010/2011 audit findings of the Auditor General, IYLM had already compiled an
Audit Turnaround Action Plan for the financial year ended 30 June 2013. The plan provides a detailed
breakdown of the Auditor General’s findings, management comments in response, along with a stated plan
of action and the status of that plan of action, including a date by which the action should be completed.
This document forms the basis of the municipality’s response to the Auditor General’s findings and is
evidence of the due consideration given.
One of the challenges IYLM faces in this regard is that it does not have a standalone audit committee
within the municipality, but instead enjoys a shared service provided by CHDM. Despite the existence of
Section 79 and Section 80 committees, and an Internal Audit section, IYLM has struggled in its efforts to
achieve a clean administration. Support in preparation of the compilation of its Annual Financial
Statements is an area the municipality still requires assistance in.
As the municipality forges onwards into the new term, the failure to comply and continued
maladministration will be a focal area requiring sustained effort to ensure improvement towards the
achievement of a clean audit for 2014, as per the national target of COGTA.
1 IYLM, Fraud and Prevention Policy, 2009, p. 2
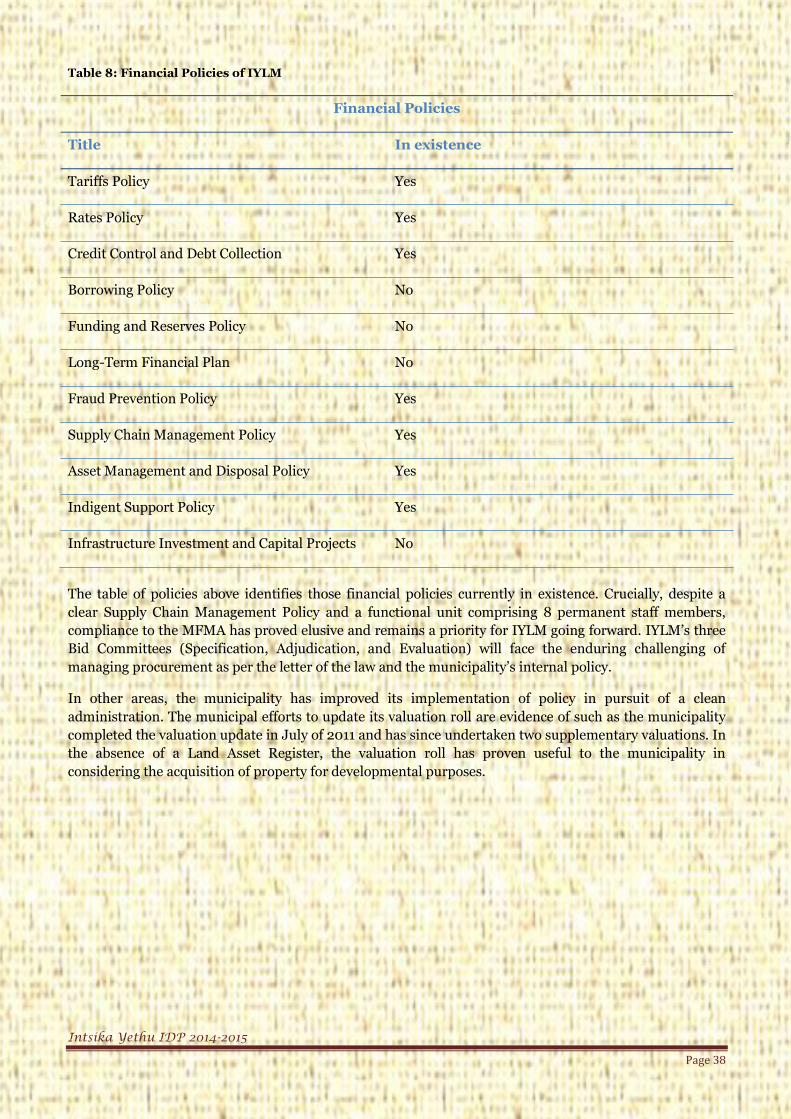
Intsika Yethu IDP 2014-2015
Page 38
Table 8: Financial Policies of IYLM
Financial Policies
Title In existence
Tariffs Policy Yes
Rates Policy Yes
Credit Control and Debt Collection Yes
Borrowing Policy No
Funding and Reserves Policy No
Long-Term Financial Plan No
Fraud Prevention Policy Yes
Supply Chain Management Policy Yes
Asset Management and Disposal Policy Yes
Indigent Support Policy Yes
Infrastructure Investment and Capital Projects No
The table of policies above identifies those financial policies currently in existence. Crucially, despite a
clear Supply Chain Management Policy and a functional unit comprising 8 permanent staff members,
compliance to the MFMA has proved elusive and remains a priority for IYLM going forward. IYLM’s three
Bid Committees (Specification, Adjudication, and Evaluation) will face the enduring challenging of
managing procurement as per the letter of the law and the municipality’s internal policy.
In other areas, the municipality has improved its implementation of policy in pursuit of a clean
administration. The municipal efforts to update its valuation roll are evidence of such as the municipality
completed the valuation update in July of 2011 and has since undertaken two supplementary valuations. In
the absence of a Land Asset Register, the valuation roll has proven useful to the municipality in
considering the acquisition of property for developmental purposes.

Intsika Yethu IDP 2014-2015
Page 39
2.7 Human resources
Given the various developmental challenges facing IYLM, a robust and capacitated human resource base is
a necessity for driving local government’s developmental mandate. In this respect, IYLM has shown
considerable progress over the previous term, positioning the municipality well for the 2012-2017 period
ahead. As a recipient of two VUNA Awards for its success and professionalism in hiring and retaining
skilled staff, the municipality has made remarkable progress towards making capacity shortcomings a
thing of the past. All the IYM post has the job description.
Table 9: Approved posts per Department circa 2010
MM’s
Office
Community
Services
LED Finances Corp.
Services
Water Service
&
Infrastructure
Total
16 104 07 32 59 71+63=134 352
Source: IYLM HR Strategy 2011-2012
In 2013 IYLM had a vacancy rate of 30%, and it has since made considerable progress in filling posts
through an annual prioritisation process that identifies key vacancies within the institution for
recruitment. This approach has yielded considerable successes for the organisation as it has continuously
increased its staffing complement in scarce skills areas and prioritised functional areas such as Technical
Services. On an annual basis IYLM considers the funded vacancies within the organisation and prioritises
critical posts for service provision before advertising posts and embarking on a planned recruitment
process. However, given the current employee expenses, 17 posts have been prioritised for the 2012/2013
financial year and have been filled.
Despite these achievements, the Technical Services directorate (inclusive of Water & Sanitation
Provisioning) held the highest vacancy rate within the organisation, the majority of the 17 filled posts were
from the this directorate. Subsequently, this vacancy rate has been lowered to approximately 5%,
attributed to the post prioritisation process undertaken by Corporate Services. Recent progress in
appointing staff will assist this crucial Directorate in carrying out its key powers and functions more
effectively, so as to avoid the shortfall in spending of MIG allocations that has been a challenge for the
department in the past.
At present, IYLM’s Human Resource Strategy 2011/2012 has been reviewed and adopted by the council in
2012/2013 financial year so that the organisation’s HR plans are more closely reflective of the current
developmental trajectory of IYLM. This revised document, coupled with the extensive policies and
manuals already established by the Corporate Services Directorate, will provide a firm basis for a
responsive and critical post- prioritised, recruitment of staff.
The following figures provide a representation of the existing organisational structures within IYLM per
Directorate. The following provides a visual representation and breakdown of the posts, as well as some
brief narrative speaking to the functions and responsibilities that the two highest levels of management
within the municipality are responsible for.

Intsika Yethu IDP 2014-2015
Page 40
Figure 1: Municipal Manager’s Office organisational structure
Municipal ManagerEC135-1310-01-1
Events CoordinatorEC135-1310-08-20
TG 12Vacant
Office ManagerEC135-1310-01-3
TG 18Bekebu
Admin Officer TsomoEC135-1310-06-15
TG 18V N Ngwane
Data CapturerEC135-1310-07-18
TG 07Vacant
Communications Officer
EC135-1310-05-14TG 12
Z Ntshangana
Community Liason officer
EC135-1310-02-7TG 12
X Manqoba
Employee Relations Specialist
EC135-1310-08-19TG 17Maliti
Rapid Response OfficerEC135-1310-02-198
TG 12Vacant
Mayoral Protection Officer
EC135-1310-02-5TG 08
S. Peter
Media Liaison officerEC135-1310-02-8
TG 12Vacant
Secretary to MayorEC135-1310-02-4
TG 08V Sotondoshe
Chief Internal Auditor
EC135-1310-04-12TG 16
N Totongwana
Special Programmes unt Officer
EC135-1310-02-9TG 12
B Mboniswayo
SecretaryEC135-1310-01-2
TG 08Vacant
Secretary to SpeakerEC135-1310-02-10
TG 08Vacant
Internal Auditors X 3EC135-1310-04-13
TG 10S Landzela2 vacant
Manger Performance Management and
MonitoringEC135-1310-07-16
TG 15Vacant
PMS Coordinators x2EC135-1310-04-
TG12Vacant
Junior Internal Auditors X 2
EC135-1310-04-204TG 9
N NyenganeP Yashe
Monitoring & Evaluation OfficerEC135-1310-07-17
TG 12Vacant
Administration Officer EC135-1310-02-06
TG 08Vacant
Intsika Yethu Local Municipality EC135Municipal Manager Office: 1310
Public Participation OfficerTG 12
EC135-1310-02-245N Somdyala
Senior Manager Risk Management EC135-1310
TG 17M A Landingwe
Senior Officer Risk ManagementEC135-1310-
TG 13Vacant
Assistant Mnager Tsomo Unit
TG 16Kroto
Senior AdminOfficerTG 12
Vacant
Customer Care Practioner Tsomo Unit
TG 11
IT AuditEC135-1310-04-12
TG 12Vacant
MPAC CordinatorEC135-1310
TG 16N. Njilo
The organisational structure provided above shows the Municipal Manager’s responsibilities within IYLM inclusive of oversight for institutional
Communications, Internal Audit, Monitoring and Evaluation, risk Management as well as the Special Programmes Unit and Mayoral support.

Intsika Yethu IDP 2014-2015
Page 41
Figure 2: Corporate Services’ organisational structure
Director
Corporate
Services
EC135-1315-01-21
NameDirector Corporate
Services
Unique_ID ID1
TG 17 Human Resource ManagerEC135-1315-02-23
TG 17Vacant
Name
TG 17 Human
Resource
Manager Unique_ID ID2
Assistant HR Manager
EC135-1315-02-24TG 16
Vacant
EAP/ OHS
Practitioner
EC135-1315-02-
28
TG 12
L. Ncame
HR Officer
EC135-1315-02-
27
TG 12
S. T. Tyobeka
HR Admin Clerk
EC135-1315-02-
32
TG 08
Vacant
OHS Clerk
EC135-1315-02-
29
TG 08
Vacant
Data Capturer
EC135-1315-02-
33
TG 07
Vacant
Personnel OfficerEC135-1315-02-26
TG 12A. Xashimbe
Personnel ClerkEC135-1315-02-31
TG 08N. Mangcu
Assistant Manager HRD
EC135-1315-03-34TG 16
Vacant
Learnership and Training
CoorordinatorEC135-1315-03-37
TG 10B. Dubula
Skills
Development
Facilitator
EC135-1315-03-36
TG 12
N. Machasa
Manager HR Administration
EC135-1315-04-38TG 17
Vacant
Assistant Manager Administration
EC135-1315-04-39TG 16
N. XegoCommittees
Admin Assistant
EC135-1315-04-
42
TG 11
N. Nongauza
Committees
Clerks
EC135-1315-04-
43
TG 07
Vacant
Customer Care
Practitioner
EC135-1315-04-40
TG 11
S. Yotsi
Receptionist/
Frontline Officers
X6
EC135-1315-04-41
TG 06
L. Magunyaza
Supervisor House Keeping
EC135-1315-04-44TG 07
N. Mbizo
Cleaners & MessengersEC135-1315-04-45
TG 03N. Nqwebo
N. Mbuce
N. Dyantyi
N. Funa
V. Gulubele
N. Haka
N. Mandyoli
N. Mqhayi
N. Mpengesi
N. Mqoqi
V. Mqomboti
P.N. Ntsebeza
N. Sipani
S. Poko
N. Mlindazwe
N. Sihoyi
N. Mgandela
X. Mavuam
N. Mlotywa
T. Balfour
T. Mlondleni
N. Mjiba
S. Xuza
V. Nqilo
S. Msutu
N. Hluta
S. Mboto
Assistant Manager Records
EC135-1315-06-50TG 16
G. Dekeda
Supervisor Registry
EC135-1315-06-51TG 09
Vacant
Mail ClerkEC135-1315-06-54
TG 06L. Kililizwe
Registry ClerksEC135-1315-06-53
TG 08V. Kopman
S.Mxoli
Typists & Filling
Clerks
EC135-1315-06-
52
TG 07
P. Matanzima
X. Sihele
Chief Information Officer/ ICT
AdministratorEC135-1315-05-46
TG 16L. Luke
Help Desk Technician
EC135-1315-05-48TG 09
Vacant
Desktop Technicians
EC135-1315-05-49TG 09
Vacant
Secretary
EC135-1315-01-22
TG 08
Anele
Intsikayethu Local Municipality: EC135Corporate Services Department: 1315
Fleet Management Officer
EC135-1320-02-64TG 12S. Sam
Fleet DriversEC135-1320-02-65
TG 07
Phohlwana,2X Vacant
Fleet Management Clerk
EC135-1320-02-249TG 08
N.Mfulathelwa
Data CapturerEC135-1315-02-33
TG 07N. Mnyanda
Data CapturerEC135-1315-02-33
TG 07N Mangcu
ICT OFFICEREC135-1315-05-47
TG 12Vacant
The Director of Corporate Services is the technical head of two divisional functions, namely human resource management and administration, inclusive of
Information and Communication Technology, Council Committee Administration, Fleet management as well as Customer Care and Records Management.

Intsika Yethu IDP 2014-2015
Page 42
Figure 3: Finances organisational structure
Chief Financial Officer (CFO)
EC135-1320-01-54
Admin ClerkTG 09
EC135-1320-01-56Vacant
Assistant Manager SCMTG 16
EC135-1320-02-57K. Tyalimpi
Procurement OfficerTG 12
EC135-1320-02-61N. Ntanga
Dispatch Clerk Cofimvaba & Tsomo
TG 08EC135-1320-02-62
T. Shasha & U. Toro
Receiving ClerkTG 08
EC135-1320-02-63M. Ngcobo
SCM OfficerTG 12
EC135-1320-02-58S. Masiko
Creditors ClerksTG 08
EC135-1320-02-59Z. Ngqondi
Accounts ClerkTG 08
EC135-1320-02-60A. Mazwi
Secretary to CFOTG 08
EC135-1320-01-55Vacant
Senior Accountant Financial Management
TG 18EC135-1320-04-75
N. Zengethwa
Asset Management OfficerTG 12
EC135-1320-04-76O. Mbotshane
Budget & Reporting officerTG 12
EC135-1320-04-77K. Mdingi
Senior Accountant Revenue
TG 16EC135-1320-03-66
N. Toni
Expenditure OfficerTG 12
EC135-1320-03-69F. Bushula
Accounts ClerksTG 08
EC135-1320-03-70T. Bontshi
Data CapturerTG 07
EC135-1320-03-71N. Mdlulwa
Revenue & Credit Control Officer
TG 12EC135-1320-03-72
A. Mbilini
CasheirsTG 07
EC135-1320-03-74N. Mthontsi
N. Biyana
Debtors ClerkTG 08
EC135-1320-03-73B. Diko
Senior Accountant Expenditure
EC135-1320-03-60TG 16
A. Lunika
Stores Control OfficerEC135-1320-02-202
TG 12 B. Ndima
Payroll Clerk TG 08
EC135-1320-04-238S. Magula
Intsika Tethu Local municipalit: EC135Finance Department: 1320
Payroll OfficerTG 12
EC135-1320-04-238Nonesi Mguca
Financial SystemAdministrator
TG 12Vacant
Supply Chain ClerkTG 08EC135
Vacant
Reconciliations ClerkEC135-1320
TG 082X Vacant
Annual Financial Statements Pre- Audit
TG 16Vacant
Budget Officer Grants & Reporting
TG 12Vacant
Asset Management ClerkTG 08
Vacant
The following organisational structure shows the Chief Financial Officer as the senior manager responsible for the collection and management of organisational
revenue, as well as tasked with the responsibility of overseeing the financial arrangements. In addition, the CFO oversees all Supply Chain Management within
IYLM and is responsible for the registry of institutional assets, payroll administration. The CFO is also responsible for five internships that are not currently
provided for within the above organisational structure.

Intsika Yethu IDP 2014-2015
Page 43
Figure 4: Local Economic Development organisational structure
Director LEDMr K. Maceba
Division Manager Research and Business Development
EC-135-1325-04-92TG16
Vacant
Division Manager IDPEC135-1325-02-80
TG 16 Vacant
Division Manager LEDEC135-1325-03-83
TG 16Z. Marala
Senior ResearcherEC135-1325-04-93
TG 13Vacant
Data CapturerEC135-1325-04-94
TG 07Vacant
Programme Manager Tourism
EC135-1325-03-89TG 13
H. Zingitwa
Programme Manager Agriculture & Forestry
EC135-1325-03-86TG 13
B. Mrubata
Programme Manager SMME Development
EC135-1325-03-84TG 13
M. Booi
LED Officer SMME Development
EC135-1325-03-85TG 12
Vacant
LED Officer TourismEC135-1325-03-90
TG 12Vacant
Admin ClerkEC135-1325-03-91
TG 08N. Mkhuzangwe
LED Officer Poverty Alleviation
EC135-1325-03-87TG 12
M. Pumaphi
LED Officer ConservationEC135-1325-03-88
TG 12Vacant
Coordinator Integrated Development Planning
EC135-1325-03-83TG 12
Vacant
Intsikayethu Local Municipality:135Local Economic Development:1325
SecretaryEC135-1325-01-79
TG 8T. Zinganto
The Director of Local Economic Development has responsibilities inclusive of the Integrated Development Plan formulation and consultation process, as well as
some performance management responsibilities. LED related projects and programmes focus upon Agriculture, Forestry, Tourism, and Enterprise
Development, while the directorate also has some research capabilities and functions, as well as includes some interns.

Intsika Yethu IDP 2014-2015
Page 44
Figure 5: Community Services organisational structure
Assistant Manager Community ServicesEC135-1333-03-108
TG 15M Nondzaba
2 X LibrarianEC135-1333-03-111
TG 09Vacant
2 X Library AssistantEC135-1333-03-112
TG 06Vacant
Community Services Officer
EC135-1333-03-113TG 12
L N Ntlombe
Disaster Management Officer
EC135-1333-03-209TG 09vacant
Assistant Manager Environmental Health
EC135-1333-02-97TG 16
A Ntengenyane
2X Cofimvaba Landfill Operators Tsomo/CofimvabaEC135-1333-02-101
TG 09Vacant
Superintendent Parks Gardens & Cemeteries
EC135-1333-02-105TG 10
Vacant
Grass CuttersEC135-1333-02-106
TG 05Fumile
MaqandaMemani
X 1 Vacant
Unit Supervisor x 2EC135-1333-02-102
TG 08Madotyeni
Ngwane
Refuse Drivers X 4EC135-1333-02-103
TG 07Sogoni
TyabilizweDywili
1 Vacant
Chief Traffic & Law Enforcement OfficerEC135-1333-04-119
TG 14M Vuza
Chief Licensing OfficerEC135-1333-04-127
TG 14A Memese
Licensing OfficersEC135-1333-04-128
TG 11Vacant
Traffic Examiner (DLTC)
EC135-1333-04-130TG 11
M Sokujika
Traffic Examiner (VCT)
EC135-1333-04-129TG 11
Vacant
eNatis SupervisorEC135-1333-04-131
TG 10Z Ntozini
eNatis ClerkEC135-1333-04-132
TG 08JuweleKoyo
Herdsmen Cofimvaba EC135-1333-04-126
TG 04 Mdingi
XhakalegushaMadobo
MkunjulwaBam
Tswele
Principal Traffic Officers X 2
EC135-1333-04-1TG 12
Vacant
By-Law Enforcement Officers X 2
EC135-1333-04-232G 12
Vacant
Traffic WardensEC135-1333-04-122
TG 07PotyeSiyo
MtendesheMagaqa
Songelwa
SecretaryEC135-1333-01-96
TG 08Y Tyeni
Director Community Services
EC135-1333-01-95
General Worker X 12EC135-1333-02-104
TG 03 Golotile
MkrweqePeter
JokwanaMa-Awu
SisusaNgcabashe
KaveMoko
ChulayoJack
M. BantomN. Makongwa
General WorkersCofimvaba
EC135-1333-02-107TG 03
X 6 Vacant
General WorkersCofimvaba X 4
EC135-1333-02-107TG 03
Vacant
Manager Community Services
EC135-1333-03-211
TG16 vacant
Manager Law Enforcement &
LicensingEC135-1333-1-210
TG 16 vacant
Fire FightersEC135-1333-03-112
TG 07BooiGcali
Pondoyi
Intsikayethu Local Municipality: EC135Community Services: 1333
Inspector Security Services x 2
EC135-1333-03-239TG 10
Vacant
4X Security Supervisors
EC135-1333-03-207TG 08
M JandaL.V Kelembe
2 Vacant
Security OfficersEC135-1333-03-117
TG 06TsomoMpofuRweshe
MatintelaMaliwa
BozoMqombothi
HlazoNqimfa
Mgqwashu
Security OfficersEC135-1333-03-117
TG 06Cofimvaba
GaladaZikhaliMfikeli
GqamaneTotiToni
MbetheZondaniMvithi
VimbayoNxesi
Mgweba Ngqele
NdabangayePato
Ndatya Makaph
M. VukapiMtwazi p
Senior Traffic OfficerEC135-1333-04-120
TG 11 X 5Vacant
Traffic OfficerEC135-1333-04-1
TG 10 X 5DazaKulaBidli
MtiyaGqobhoka
Traffic Offence ClerkEC135-1333-04-121
TG 08Kelembe
Pound Masters x 2Ec135-1333-04-124
TG 07L. Gwantshu
D. krutani
Environmental Management Officer
TG 12EC135-1333-02-1
K. Gantsho
Superintendent Disposal & TransferEC135-1333-02-240
TG 10Vacant
Free Basic Services Supervisor
EC135-1333-03-67 TG 09
P Ntlokwana
Assistant FBS Coordinator
EC135-1333-03-68TG 07
Senior IndegentTG 12
EC135-1333-1-203 N. Qaba
Peace OfficersEC135-1333-04-123
TG 7Xhego
Mdwayingana
HIV AIDS Cluster Coordinator
EC135-1333-03-241TG 07
Programme Manager HIV AIDSEC135-1333-03-109
TG 14N. Jafta
HIV AIDS Cluster Coordinator
EC135-1333-03-241TG 07
3 X Cluster HIV AIDS Field Workers
EC 135-1333-01-254TG 05
Vacant
3 X Cluster HIV AIDS Field Workers TG 05
Vacant
The Director of Community Services oversees a broad set of services aimed at addressing social needs within the Intsika Yethu Municipal area. Responsibility
for Traffic Safety and enforcement is one of the key responsibilities, along with management of Environmental Health and Waste Removal services. Further
functions and services are including a special coordinator for HIV/AIDS, Fire and Disaster Management, as well as responsibilities for Pounds and Animal
Control.

Intsika Yethu IDP 2014-2015
Page 45
Figure 6: Technical Services organisational structure
Director Technical ServicesEC135-1335-01-134
SecretaryEC135-1335-01-135
TG 08Vacant
Unit Manager Building Control & Municipal Public
WorksEC135-1335-02-137
TG 15Vacant
Building Inspector x 2EC135-1335-02-142
TG 12M. Ntsebeza
1 Vacant
Technician ElectricalEC135-1335-02-143
TG 12
B. Ngewu
General Assistants x 2EC135-1335-02-145
TG 03Vacant
Technician Quantity SurveyEC135-1335-02-138
TG 12Vacant
Semi Skilled Construction Workers X 4
EC135-1335-02-140TG 05
Vacant
General WorkersEC135-1335-02-141
TG 03
A. TshanganaE Jokwana
G. NtsebezaS. Nkomana
T TomN.VellemZ. Qekele
N. QhayiyaN. Toyise
Unit Manager Housing & Estates
EC135-1335-05-159TG 15
Housing OfficerEC135-1335-05-161
TG 12Vacant
Legal Administration Officer
EC135-1335-05-160TG 12
Vacant
2 X Project ManagerEC135-1335-03-147
TG15S. Silinga1 Vacant
Unit Manager Roads & Transport
EC135-1335-04-149TG 15
L. Dudumashe
Superintendent Planning
EC135-1335-04-150TG 12
Vacant
Superintendent Roads and Storm Water
MaintenanceEC135-1335-04-151
TG 12
Vacant
Foreman Roads Construction
EC135-1335-04-154TG 11
Vacant
Heavy Plant OperatorsEC135-1335-04-155
TG 09
V. DilaN. Fungile
D. MadliwaL. GaladaG.TsokoDyantyi
Modapi.MSenteni.T
S. SomlotaSomlota.S
Mdunana. MSeplan. N
Mlozana. SA. Nabo Generals Workers
Heavy PlantEC135-1335-04-156
TG 03
Light Duty Operator X EC135-1335-04-157
TG 07
N. QhilikaX. Dyantyi
General Workers Light Plant
EC135-1335-04-158TG 03
Foreman Roads & Storm water
Maintenance X 2EC135-1335-04-152
TG 11S. Mandyoli
1 Vacant
General Workers Storm water
EC135-1335-04-153TG 03
Unit Manager Town Planning & Land UseEC135-1335-06-164
TG 16
A. Makanya
GIS TechnicianEC135-1335-06-165
TG 12Vacant
Technician Land Surveyor
EC135-1335-06-168TG 12
Z Rasonti
Technician Town Planning
EC135-1335-06-166TG 12
Vacant
Artisan Mechanic x3Fleet Maintanance
Plant & Earth Moving
Auto Electrical EC135-1335-04-200
TG 10Vacant
Technical Services Admin Officer
EC135-1335-01-201TG 08
Artisan Assistants X 4EC135-1335-04-203
TG 04Vacant
Senior Officer Land
&HousingEC135-1335-02=213
TG14 N. M. Mrwetyana
Building Control OfficerEC135-13350-02-214
TG14
N. Rols
Intsikayethu Local Municipality: EC135Technical Services Department: 1335
Assistant Housing Officers X 2EC135-1335-05-235
TG 8M. Ngcuka
Vacant
Estates OfficerEC135-1335-05-136
TG 12Vacant
Brick layerCarpenterPainterPlasterer
Brick layerCarpenterPainterPlasterer
Superintendent Plant and Fleet Maintenance EC135-1335-04-152
TG 12
Vacant
Superintendent Construction
EC135-1335-04-TG 12
S. Ngozi
Plant and Fleet Maintenance Administrator
EC135-1335-4-199TG 08
Vacant
Contract and SLA Coordinator
EC135-1335-03-246TG 13
Artisans Electricians X 2EC135-1335-02-144
TG 10vacant
Foreman Construction and Building Maintenance
EC135-1335-02-139TG 09
W . Makambe
ISD Coordinator EC135-1335-03-247
TG 13
vacant
Projects and Specialist Services Unit
EPWP CoordinatorEC135-1335-01-136
TG 11J. Ntungwa
General Assistant X 2EC135-1335-05-
TG 03Vacant
Civil Design TechnicianEC135-1335-06
TG 12Vacant
Assistant Estates OfficerEC135-1335-05-
TG 08
Vacant
The following shows the range of positions and functions which the Director of Technical Services oversees. This is inclusive of Electricity and Energy Access,
construction and maintenance of IYLM’s built infrastructure, including Community Facilities, Public Works, and Integrated Human Settlements.

Intsika Yethu IDP 2014-2015
Page 46
Figure 7: Water and Sanitation Provisioning organisational
structure
Area Manager Water & Provisioning
EC135-1335-01-170TG 18
Z.D Gqodo
Administration officer
EC135-1335-01-171TG 08
L. Zenani
Senior Technician Civil WorksEC135-1335-03-181
TG 15W. Nkwenkwezi
Superintendent Civil Works Urban
EC135-1335-03-183TG 12
S Ngabayena
DWARF Plumbers RuralEC135-1335-03-188
CHDM
Plumbers/Supervisor X2EC135-1335-03-185
TG 11Tsomo- Madihlaba CCofimvaba- Vacant
Assistant Plumbers Urban X 9
EC135-1335-03-186TG 06
N.NjatuT. BukuvaP. Lekeka
M.NtslubeN. MvadabaD. Moyake3 X Vacant
TLB OperatorEC135-1335-03-
184TG 09
Water Truck Drivers X 3
EC135-1335-03-182TG 9
N. SeplanaW. Ntswayi
Superintendent Electrical & Mechanical
EC135-1335-04-192TG 12
Vacant
Artisans x 6EC135-1335-04-193
TG 10 Mechanical x3
R mbesiS Ndilele1 vacant
Electrical x3Vacant
Artisan Assistant x6EC135-1335-04-194
TG 06Vacant
X3 ElectricalX3 Machanical
Senior Technician Water Quality
EC135-1335-02-173TG 15
M. Nkwenkwezi
Process Controller Clean Water
EC135-1335-02-175TG 09
N. PhemeZ. Mehlo
T. MbizweniL. Koyo
N. SaliwaV. Sondlo
S. KuseL. Madolwana
H.MzuzuS. Chwebeni
S. Thyulu
Assistant Controller Clean Water x12
EC135-1335-02-176TG 06
Vacant
Process Controller Grey Water x3
EC135-1335-02-178TG 09
Vacant
Assistant Controller Gey Water x3
EC135-1335-02-179TG 06
Vacant
WSP Senior Financial Controller
EC135-1335-02-216 TG 12
S. Rode
Revenue OfficerEC135-1335-04-196
TG 12Vacant
Meter ReadersEC135-1335-04-197
TG 06Nteta M
Customer CareEC135-1335-01-172
TG 11Vacant
Director Water Services
Superintendent Clear Water Quality X 3
EC135-1335-02-217 TG12
N. Jengeta2 Vacant
Assistant Customer Care X 2EC130-1335-01-232
TG 08Vacant
Expenditure OfficerEC135-1335-02-234
TG 12Vacant
Asset Fleet OfficerEC132-1335-02-233
TG 9 Vacant
Intsikayethu Local Municipality: EC135Water Service Provisioning: 1335
Superintendent civil Works Rural
EC135-1335-03-183TG 12
P. Njeje
Assistant Plumbers X 6 EC135-1335-03-185
TG 063 X VacantS. MafalalaY Mahlati
W. Khabingesi
Superintendent Grey Water
EC135-1335-02-217TG12
Vacant
Senior Technician Electrical and Mechanical
EC135-1335-04-191M limani
TG 15
Diesel Runner/ Truck Operator
EC135 1335-04-TG 07
J Gcaza
Expenditure ClerkEC135-1335-02-260
TG 08Vacant
Fleet and Asset Receivables Clerk
TG 08EC135-1336-02-258
Vacant
Purchasing Clerk EC135-1335-04-259
TG 08Vacant
Revenue ClerkEC135-1335-04-
TG 08E Shenxane
Revenue Cashier X 2EC135-1335-04-
TG 7Vacant
The Director Technical Services is also the head of the IYLM’s Water & Sanitation Provisioning, which has infrastructural responsibilities specifically
addressing water and sanitation, in close cooperation with CHDM, which is the Water Services Authority.

Intsika Yethu IDP 2014-2015
Page 47
Throughout IYLM’s back-offices, a range of well-developed institutional policies inform and prescribe key
organisational processes and functions crucial to its successful operations. This extensive policy set,
entailing more than 27 policies and 2 manuals, and the manner in which the policies are implemented and
adhered to, provides some explanation as to how the municipality has been so successful of late in this
regard.
Table 10: Existing Manuals of IYLM
The table on the following page provides an overview of all of the institutional policies for IYLM. Despite
this extensive list, there continue to be some policy gaps for consideration in the 2012-2017 period of the
IDP. Possible policies for consideration based on a benchmarking with other municipalities include:
Relocation Policy;
Private Work and Business Policy;
Job Evaluation Policy;
Sexual Harassment Policy;
Scarce Skills Policy; and
Succession Planning for Critical Posts Policy.
Notable in this list of potential policies is that of planning for the succession of critical posts. IYLM has had
the good fortune of relative stability amongst its senior management, but planning for the eventuality of
succession is inevitable to ensure a smooth administrative transition at the end of a contract or following
the departure of a Section 57 Manager.
Existing Manuals
Number Titles Year
IYLM-MAN 1 Delegation of Power Manual 2012/2013
IYLM- MAN 2 Access to Information Manual 2012/2013

Intsika Yethu IDP 2014-2015
Page 48
Table 11: Existing Institutional Policies of IYLM
Existing Institutional Policies
Policy Number Policy Year
IYLM-HR 1 Recruitment, Selection and placement Policy 2012/2013
IYLM-HR 2 Code of Conduct Policy 2012/2013
IYLM-HR 3 Acting and Acting allowance Policy 2012/2013
IYLM-HR 4 Subsistence and Travel Policy 2012/2013
IYLM-HR 5 Performance Management Policy 2012/2013
IYLM-HR 6 Termination of Service Policy 2012/2013
IYLM-HR 7 Reward and Recognition Policy 2012/2013
IYLM-HR 8 Overtime and Work on Sundays Policy 2012/2013
IYLM-HR 9 Standby Policy 2012/2013
IYLM-HR 10 Training and Development Policy 2012/2013
IYLM-HR 11 Leave of Absence Policy 2012/2013
IYLM-HR 12 Grievance Policy 2012/2013
IYLM-HR 13 Staff Movement Policy 2012/2013
IYLM-HR 14 Employee Assistance Programme Policy 2012/2013
IYLM-HR 15 Occupational Health and Safety Policy 2012/2013
IYLM-HR 16 Housing Policy 2012/2013
IYLM-HR 17 Telephone Usage Policy 2012/2013
IYLM-HR 18 HIV/AIDS Policy 2012/2013
IYLM-HR 19 Motor Vehicle Policy 2012/2013
IYLM-HR 20 Abscondment Policy 2012/2013
IYLM-HR 21 Attraction and Retention Strategy 2012/2013
IYLM-HR 22 Smoking Policy 2012/2013
IYLM-HR 23 Transport Policy 2012/2013
IYLM-HR 24 Funeral Policy 2012/2013
IYLM-HR 25 Records Management Policy 2012/2013
IYLM-HR 26 Farewell's Policy 2012/2013

Intsika Yethu IDP 2014-2015
Page 49
IYLM-HR 27 Night Work and Shift Policy 2012/2013
IYM- HR 28 Job Evaluation Policy 2012/1023
IYM-HR 29 EPWP Policy 2012/2013

Intsika Yethu IDP 2014-2015
Page 50
2.8 Employment Equity
In terms of Employment Equity, IYLM boasts Senior Management and a staffing complement consistent
with its organizational Employment Equity Plan, with only an under-representation of people with
disabilities, whereby there are currently not any within the organizational structure. There is also a slight
gender imbalance within the organization, with 59% of all staff male and 41% female. IYLM is currently
addressing employment equity through awareness raising initiatives including: formal written
communication, a policy statement including reference to employment equity, a summary of the
Employment Equity Act publically displayed, Employment Equity training, diversity management
programmes and discrimination awareness programmes. An existing Employment Equity Forum within
IYLM is the ideal and appropriate route to allow support from the management to monitor the
municipality’s status in this regard. The table below provides an organizational snap-shot of the
Employment Equity status quo within IYLM.
Table 12: Employment equity* within IYLM as at 13 January 2013
Occupational Levels
Male
Female
Foreign Nationals Total
A C I W A C I W Male Female
Top management 1 0 0 0 0 0 0 0 0 0 1
Senior management 03 0 0 0 02 0 0 0 0 0 05
Professionally qualified and
experienced specialists and
mid-management
25 0 0 0 21 0 0 0 0 0 46
Skilled technical and
academically qualified
workers, junior management,
supervisors, foremen, and
superintendents
53 0 0 0 18 0 0 0 0 0 71
Semi-skilled and
discretionary decision making 23 0 0 0 56 0 0 0 0 0 79
Unskilled and defined
decision making 46 0 0 0 31 0 0 0 0 0 77
TOTAL PERMANENT 151 0 0 0 128 0 0 0 0 0 279
Temporary employees 20 0 0 0 26 0 0 0 0 0 46
GRAND TOTAL 171 0 0 0 154 0 0 0 0 0 325
*A denotes African; C denotes Coloured; W denotes White; I denotes Indian; and PWD denotes People With Disabilities.

Intsika Yethu IDP 2014-2015
Page 51
2.9 Skills development
Another strong point for IYLM over the previous term was its skills development and training
programmes, as informed by its Training and Development Policy (IYLM-HR 10/08-09). In this area, the
municipality has set out on developing of its human resources component through the establishment of
structures and procedures enabling the realisation of staff and Council’s innate potential.
A Municipal Skills Development Forum exists to assist and advise the organisation on human resource
related matters, including skills auditing and monitoring of training. Furthermore, the municipality has
provided for extensive skills development opportunities that include: in-service training; experiential
training and internships; learnerships; Adult Basic Education and Training (ABET); and undertaking
further studies. It also provides study assistance for staff as well as bursaries for both undergraduate and
postgraduate studies on the condition of returning for service as equivalent to the duration of the studies.
A Workplace Skills Plan (WSP) with all the training interventions to be done by the municipality each and
every year is developed by the Skills Development Facilitator (SDF) with the assistance of the Skills
development Forum. The plan is submitted to LGSETA and it is through the implementation of this plan
that the municipality receives grants to assist with the training interventions.
2.10 Information Communication Technology (ICT)
Information Communication Technology (ICT) is one of the most vital services to the Municipality as it is
used to pay salaries, provide information to key decision making, communicate with internal and external
stakeholders, market the Municipality to potential investors and funders, pay service providers, Manage
and report on financial position of the Municipality, management of assets of the municipality, etc. It is
therefore very important for a Municipality to sustain this service in order to ensure that is stable and
more importantly available whenever needed. The principal responsibility of the ICT unit is to be
responsible for a constant, protected, reachable and steadfast ICT infrastructure which is available 98% of
the time. The primary focus for ICT should then be on ensuring that 98% uptime of its services.
The purpose of this section is to provide electronic communication and information management to
the municipality.
This section responsible for the following:-
Data and Systems Security
Antivirus solutions
IT Policies
IT Governance
IT Disaster Recovery planning
Systems and Data backups
Master Systems Plan (ICT Strategy)
Electronic communication (e.g. Internet, Intranet, Website and E-mails)
E-Governance
Payroll and financial systems
IT Support (Computers, printers, faxes, etc.)
IT Risks register
IT Trainings
Network infrastructure and servers
Telephone management
Electronic Performance management system

Intsika Yethu IDP 2014-2015
Page 52
IT Service Level Agreement (SLA)
IT policies were reviewed and adopted by council where all security issues, confidentiality and access to
information are dealt with.
Alignment of ICT to national KPA’s is elaborated in our Master Systems Plan (MSP) which is the ICT
strategy for the Municipality. MSP also aligns ICT with Municipal IDP.
2.10.1 ICT Steering committee
An ICT steering committee has been established to drive ICT and to ensure that it is aligned to the
business. The committee is also responsible for approving ICT strategies, projects, policies and also
ensuring that they are implemented.
The Chief Information Technology Officer (CITO) is required to submit a monthly ICT report to the
steering committee covering the activities performed by ICT during the month and identifying the risks.
This allows the committee to monitor and evaluate ICT performance. The ICT steering committee must
convene monthly and must drive the implementation of Master Systems Plan (MSP).
2.10.2 ICT Organogram
1. Chief Information Technology Officer (CITO) – Filled
2. IT Officer – Vacant
3. IT Technician – Vacant
4. Help Desk Technician - Vacant
2.10.3 ICT Strategic Objectives
To fulfil this mission, ICT Unit will, in partnership with the Municipality‘s Business Units seek to:
Provide a secure IT infrastructure which delivers appropriate levels of data Confidentiality,
Integrity and Availability.
Ensure access to appropriate skills and resources.
Incorporate effective governance and Project Management practices to promote a close alignment
between IT and Business Units.
Maximise value for money from existing and future technology investments.
Incorporate best environmental practices into its IT operations.
ICT Unit will achieve these objectives by focussing on the continuous development of its People, its
Processes and its Technology
2.10.4 Providing a Secure IT Infrastructure
Data security is the most crucial aspect of any ICT infrastructure. The ICT section must maintain
confidentiality and integrity of user’s data at all times. The IT Policies must classify data and must also be
enforced in order to protect the data.
a must be upheld in order to ensure that Councillors, Officials and Customers data which is protected
under the Protection of Private Information Act is guaranteed; this will prevent lawsuits and other actions
which may be taken against the Municipality.
Data Integrity must be achieved by ensuring that all data stored on the server is credible and that access
controls are applied to ensure that the data has not fabricated and comes from a reliable source. The role

Intsika Yethu IDP 2014-2015
Page 53
of data creators is to ensure that the data generated is a true reflection of the reality and where possible
information must be verifiable.
Data Availability means that the ICT division must ensure that users have access to data at all times and
must also ensure that data and systems are made available to authorised users only. The Municipality will
slowly migrate to cloud computing which will ensure that data is available at all times to the users.
(Part B) The Development Context and Socio-Economic Profile
3. Socio-Economic Profile
3.1 Demographic Profile
This section provides a detailed analysis of the population of IYLM and provides some key insights into
demographics, socio-economic conditions, infrastructural service levels within the Municipal area and
environmental issues. The analysis lends weight to prioritisation of identified issues within the IYLM and
conveys some urgency with regards to what needs to be done first. The primary source of the information
below is taken from the Statistics South Africa, Census 2012
The table above shows us IYLM’s total population in relation to other LMs in the Chris Hani District
(CHDM). IYLM is the third largest LM in CHDM following Ingcobo LM in terms of the size of its
Statistics South Africa
Descriptive
Table 1
Geography by Gender
for Person weighted
Male Female Grand
Total
Inxuba Yethemba 31671 33889 65560
Tsolwana 15656 17625 33281
Inkwanca 10676 11295 21971
Lukanji 90619 100103 190723
Intsika Yethu 68797 76575 145372
Emalahleni 56620 62839 119460
Engcobo 71953 83560 155513
Sakhisizwe 30646 32936 63582
Grand Total 376638 418823 795461
Created on 18 March 2013
Statistics South Africa: Web page: www.statssa.gov.za
Support: [email protected]
SuperCROSS. Copyright © 1993-2013 Space Time Research Pty Ltd. All rights
reserved.

Intsika Yethu IDP 2014-2015
Page 54
population. IYLM population has decline from the 2001 census one of the reasons is the changes on
demarcations. There are two wards that have relocated to Idutywa and Engcobo that cause Engcobo to be
the second largest in terms of population at CHDM.
Residents of IYLM are predominantly rural, living in small villages which cluster around the relatively
larger towns such as Cofimvaba and Tsomo. IsiXhosa is the most spoken language as a mother tongue
within the municipality; census 2011 showed that around 87% of the people in the municipality were
Xhosa 1st language speakers. IYLM is an almost racially homogenous municipality; Census 2011 estimates
the percentage of Blacks/Africans in IYLM at 99%. IYLM has a higher female than male population, as is
the case with the most other LMs in CHDM. The larger female population may be attributed to the general
tendency of males of working age to migrate to other areas where employment opportunities are more
available. Further research is required before we can conclude that the disparities between the male and
female populations of IYLM and CHDM are due to outward migration of males, but such a trend is widely
acknowledged throughout rural municipalities.
Statistics South Africa Descriptive Table 1 Age in completed years by Gender for Person weighted, EC135: Intsika Yethu

Intsika Yethu IDP 2014-2015
Page 55
Number Percentage
Male Female Grand Total Male Female Grand Total
0 – 4 8971 8565 17536 6.2 5.9 12.1
5 – 9 9129 8827 17955 6.3 6.1 12.4
10 – 14 9017 7975 16992 6.2 5.5 11.7
15 – 19 9438 8146 17584 6.5 5.6 12.1
20 – 24 5579 4984 10563 3.8 3.4 7.3
25 – 29 4049 3587 7635 2.8 2.5 5.3
30 – 34 2825 2995 5820 1.9 2.1 4.0
35 – 39 2584 3244 5828 1.8 2.2 4.0
40 – 44 2126 3580 5706 1.5 2.5 3.9
45 – 49 2310 3967 6277 1.6 2.7 4.3
50 – 54 2555 4174 6729 1.8 2.9 4.6
55 – 59 2468 3857 6326 1.7 2.7 4.4
60 – 64 2386 3488 5873 1.6 2.4 4.0
65 – 69 1848 2446 4294 1.3 1.7 3.0
70 – 74 1632 2665 4297 1.1 1.8 3.0
75 – 79 886 1675 2562 0.6 1.2 1.8
80 – 84 611 1383 1994 0.4 1.0 1.4
85 + 384 1017 1401 0.3 0.7 1.0
Grand Total 68797 76575 145372 47.3 52.7 100.0
Statistics South Africa: Census 2011 Web page:
www.statssa.gov.za
The above graph demonstrates that IYLM has a relatively young population with the majority of
inhabitants falling under the age of 5-9. The graph shows a very sharp dip in numbers after the teens with
very few people falling in the middle age category. For example the number of people aged 15-19 is roughly
2 times larger than the number of people in the 40-44 categories. There are a number of factors that can be
associated with the youthful population of IYLM including high mortality rates amongst middle-aged
people caused by diseases such as HIV/AIDS and the out-migration of working age adults out of the area
in search of employment opportunities elsewhere. These factors are recognizable in many other
municipalities that have similar demographics to IYLM; however, there is no conclusive research within
IYLM to explain the youth bulge.
3.2 Poverty Rate in IYLM
The level of poverty in IYLM remains worryingly high. The table below, taken from ECSECC data, shows us
that the majority of people in the municipality can be classified as poor or living in poverty. The table
shows that the percentage levels of poverty in IYLM have decreased over time, and this is a trend that is
visible not only in IYLM but also in CHDM and the Eastern Cape Province as a whole. Poverty in the
municipality seems to have been at its most acute point in the year 2000 when South Africa was
experiencing significant economic problems. The poverty rate then dropped after the country had
recovered to reach its lowest rate of since the democratic transition.

Intsika Yethu IDP 2014-2015
Page 56
Table 13: Poverty rates from 1995-2010
Poverty rates from 1995-2010 Estimate
YEAR 1995 2000 2005 2010
Eastern Cape
Province
50% 58.03% 56.26% 53.48%
Chris Hani
District
Municipality
57% 64% 60.26% 57.03%
Intsika Yethu
Local
Municipality
63.3% 68.8% 61.6% 56.4%
It is extremely important to note that measurements and perceptions of what poverty is vary from source
to source thus another source may see far more or far less poverty in the same area based on the normative
judgment which is driven by a certain understanding of what constitutes poverty. In addition there are
always various levels of poverty. The most severe level of poverty in South Africa is known as “indigent”,
this refers to a person who lacks the most basic necessities of a decent life such as:
Water;
Sanitation;
Energy;
Refuse removal;
Food and clothing; and
Housing.
IYLM maintains an Indigent Policy from 2009 which aims to ensure that households that cannot afford
municipal services are given access to the most basic municipal functions. The policy elaborates upon what
exactly constitutes an indigent household in the IYLM context. Given the historical legacies of
underdevelopment from the pre-democratic era, IYLM carries a heavy burden in terms of an indigent
population. Further socio-economic analysis provides more insights into the dynamics of IYLM.
3.3 Income and Employment data
The tables and graphs provided below tell us that the majority of people within IYLM do not receive any
income at all. However, this could be misleading because youth of school going age are also included in the
measurement and they generally do not receive income. Of those who do receive an income, most receive
between R1 to R400. This is considered to be very low income by national standards.
IYLM is a low income area; however, income levels alone do not sufficiently convey the full range of social
circumstances that people are facing. It should also be noted that many of the people listed as having an
income in this graph are not formally employed but receive government grants which are classified as
income.

Intsika Yethu IDP 2014-2015
Page 57
Chart 4: Proportion of monthly income of IYLM residents by income bracket
Statistics South Africa
Labour Force
Table 1
Individual monthly income by Gender
for Person weighted, EC135: Intsika Yethu
Male Female Total
No income 26570 29047 55617
R 1 - R 400 24036 22843 46878
R 401 - R 800 2311 2919 5231
R 801 - R 1 600 9994 15192 25187
R 1 601 - R 3 200 1061 1078 2139
R 3 201 - R 6 400 749 810 1559
R 6 401 - R 12 800 645 920 1565
R 12 801 - R 25 600 377 497 874
R 25 601 - R 51 200 86 91 177
R 51 201 - R 102 400 10 10 21
R 102 401 - R 204 800 11 13 24
R 204 801 or more 15 15 29
Created on 11 March 2009
Statistics South Africa: Web page: www.statssa.gov.za
Male
No income
R 1 - R 400
R 401 - R 800
R 801 - R 1 600
R 1 601 - R 3 200
R 3 201 - R 6 400
R 6 401 - R 12 800
R 12 801 - R 25 600
R 25 601 - R 51 200

Intsika Yethu IDP 2014-2015
Page 58
Table 14: Social Grants recipients as a percentage of total population
Type of grant No. of recipients % of total population
Old age pension 8420 5.60%
Disability Grant 2922 1.75%
Child support grant 21 767 13.80%
Care dependency grant 540 0.32%
Foster care grant 34 0.02%
Grant in aid 99 0.05%
Social relief 2 0.00%
Multiple social grants 0 0%
Institutions 331 19%
Source: Gaffneys Local Government in South Africa-Official Yearbook, 2011-2013. Pg: M135
The number of people who receive grants in IYLM is substantial, even considering the extent of IYLM’s
indigent population. The table above tells us that the largest grant is the Child support grant which covers
21 767 people or 13.80% of IYLM’s entire population. Although there is a heavy concentration of youth
across the country’s age distribution, the distribution of grants suggests that fewer of these households
receive social welfare support than one would be inclined to believe. However, updated information from
the South African Social Security Agency indicates that approximately 48 807 people receive grants within
IYLM, at least in the current year 2014/15, meaning more than a quarter of the population is grant
dependent. This translates to more than R35 million per month that is spent on social grants in IYM.
More and above this, approximately R1 270 000 spent on food parcels.
Chart 1: Employment opportunities across economic sectors

Intsika Yethu IDP 2014-2015
Page 59
Table 1
Type of sector by Official employment status for Person weighted, EC135: Intsika Yethu
Employed
Eastern
Cape
Chris Hani
DM
Intsika Yethu
LM
In the informal
sector
148 812 15 431 2 012
In the formal sector 735 818 69 524 7 204
Private household 120 999 12 239 1 280
Source: Statistics SA, census 2011
IYLM is characterised by high unemployment rates with 44% of the working population being officially
unemployed in 2009, as in seeking work opportunities but unable to find them. ECSECC estimated that
this number would decrease slightly in 2010 to around 42%. There has been a reasonable drop in the rate
of unemployment over the last 10 years since 2002 when unemployment stood at 54%. The largest
employment sector in IYLM is the tertiary sector which employs 74% of all employed people within the
formal sector. The largest numbers of people employed within the tertiary sector are involved in general
government. ECSECC estimated that there would be about 4263 people working in general government in
2010.
Chart 2: Employment opportunities within the informal sector
Source: ECSECC, Statistics Database, 2011.
When looking at employment figures in the South African context one should always consider analysis of
the informal sector. In IYLM, the informal sector remains a significant source of income for many of the
residents and therefore deserves to be mentioned in any analysis of income and employment within the

Intsika Yethu IDP 2014-2015
Page 60
IYLM. According to Chart 6, the tertiary sector is the biggest source of income within the informal sector.
ECSECC explains that the majority of individuals earning an income from the tertiary sector of the
informal sector in IYLM are involved in the wholesale and retail trade 61%. The secondary sector
accounted for an estimated 24.44% of employment within the informal sector, the biggest industry within
this sector is the construction industry which accounts for 67% of all employment within the secondary
sector of the informal economy.
The primary sector accounted for only 8.40% of all employment within the informal sector. Agriculture
and fishing accounted for 100% of all employment opportunities within the primary sub-sector of the
informal sector. It is interesting to note that the informal sector mirrors the formal sector in terms of the
predominance of the tertiary sector as a means of employment and the inability of the 2nd and especially
the 3rd sectors to create employment. Furthermore ECSECC data shows that primary sector industries such
as agriculture and fishing have been contracting in terms of their ability to create employment. In 1995 the
agriculture and fishing industry employed 30% and 25% of all working people in IYLM within the formal
and informal sectors respectively; in 2010 ECSECC data forecasted that this industries share of the
workforce would fall to 8% in the formal sector and 13.8% in the informal sector. This is problematic in
that IYLM has not seen convincing growth in any other sector that could supplement the decline in the
agricultural and fishing industries.

Intsika Yethu IDP 2014-2015
Page 61
3.4 Human Development Index
The level of development is a complex measure to capture in any society. Indeed much of the data
previously presented in this situational analysis speaks to aspects of development. Nevertheless there are
important internationally recognised indicators of development that should be looked at in order for one
to gain a good understanding of what kind of society is being analysed. The Human Development Index
(HDI) is possibly the most internationally recognised measure of a society’s standards of living. This is a
comparative measure which looks at indicators such as life expectancy, literacy and education.
Table 15: HDI for the Eastern Cape, District and IYLM
FORECAST
1995 2000 2005 2010
Eastern Cape
Province
0.4757 0.4968 0.5171 0.4828
Chris Hani
District
Municipality
0.4156
0.4296 0.4512 0.4126
Intsika Yethu
Local
Municipality
0.3712 0.3891 0.4123 0.3731
Source: ECSECC, Statistics Database, 2011
The HDI of a particular group is displayed by a measurement between 1 and 0, the closer to 1 a society is,
the higher the level of development on the other groups that measure closer to 0 are classified as less
developed. The HDI looks specifically at life expectancy, education and income per capita in order to
calculate the level of development of a given society or group.
The table above presents development indicators spanning over a number of years for IYLM, CHDM and
the Eastern Cape Province. The ECSECC data shows that IYLM maintains a relatively low HDI, well
beneath the national average. In 2010 ECSECC forecasted that IYLM’s HDI would be 0.3731 which is
below the national and the provincial averages of 0.5501 and 0.4828 respectively. This means that IYLM is
a poorly developed society by local and international standards.

Intsika Yethu IDP 2014-2015
Page 62
3.5 Inequality
Chart 3: Inequality within CHDM with special focus on IYLM
Source: Chris Hani Municipality Demographic Profile, 2009
The Gini Coefficient is a statistic which measures inequality in a society. The measurement varies from “0”
(a perfectly equal society) to “1” a society in which one household or individual possesses complete wealth
whilst everyone else earns nothing. In reality there are no completely equal or unequal societies i.e. “0” or
“1”. Most societies will have a measurement ranging between 0.25 (fairly equal) and 0.75 (highly unequal).
Nationally South Africa ranks as one of the most unequal societies on earth with a gini co-efficient score of
0.67 according to the World Bank. IYLM has a gini co-efficient of 0,58 which could be considered fairly
unequal by international standards but is rather low by national standards, indeed IYLM is the least
unequal municipality within CHDM. Whilst the relatively lower levels of inequality in IYLM may be
interpreted as positive in the sense that higher inequality has the potential to cause social instability, it is
important to remember that lower levels of inequality in IYLM could be caused by general poverty, in
other words many people are equally poor.

Intsika Yethu IDP 2014-2015
Page 63
3.6 Economic Data
Chart 4: Gross Value Added contribution (2010) as a percentage per Local Municipality within Chris Hani
District
Source: ECSECC, Statistics Database, 2011.
Chart 5: GVA contribution of IYLM across economic sectors
Source: ECSECC, Statistics Database, 2011.
The above graphs illustrate the Gross Value added (GVA) with regards to IYLM. GVA basically refers to the
measure of the value of goods and services in a certain area. Chart 8 illustrates the GVA contribution of the
different local municipalities to the CHDM whilst Chart 9 shows IYLM GVA across different economic
sectors: namely primary, secondary and tertiary sectors. The primary sector of an economy includes all

Intsika Yethu IDP 2014-2015
Page 64
economic activities that are concerned with extracting or harvesting products from the earth. In IYLM
these products include primarily the following:
Agriculture;
Fishing and forestry; and
Mining and quarrying.
The secondary sector of an economy includes all those activities concerned with manufacturing finished
goods. Prominent IYLM secondary economic activities include the following:
Food;
Beverages and tobacco;
Textiles;
Clothing and leather goods;
Wood;
Paper;
Publishing and printing;
Petroleum products;
Chemicals;
Rubber and plastic;
Metals, metal products;
Machinery and equipment;
Electrical machinery and apparatus, Radio and TV, instruments, watches and clocks;
Transport equipment, Furniture and other manufacturing, Electricity;
Water; and
Construction.
The tertiary sector of the economy is concerned with providing services. The tertiary sector of IYLM
includes the following:
Wholesale and retail trade;
Catering and accommodation services;
Transport and storage;
Communication;

Intsika Yethu IDP 2014-2015
Page 65
Finance and insurance;
Business services;
Community;
Social and personal services; and
General government.
Notably, Chart 9 illustrates that the tertiary sector is the primary contributor in terms of GVA of IYLM
with the secondary and primary sectors contributing significantly less. Such a bias towards the tertiary
sector hinders economic growth in an area such as IYLM because it is the primary and secondary sectors
that should drive the growth of the local economy since they are far more labour intensive and have far
greater capacity to stimulate beneficiation. This is not to say that the tertiary sector is not important
however it is the primary and particularly the secondary sectors that can grow the economy.
3.7 Comparatives Advantages
An analysis of Intsika Yethu economy indicates that is high levels of concentration with high dependency
on community services. This lack of diversification exposes the municipality makes the municipality more
vulnerable to external shocks and is one of the reasons for its inability to create jobs. There is a need
therefore to insure the diversification of the local economy. To achieve this analysis of the local economy
indicates that sectors with a comparative advantage at Intsika Yethu are community services, agriculture,
trade and construction. These are the sectors the LED strategy has identified as key to unlocking the
economic potential of the municipality which was adopted on the 20th of April in 2007. In addition to this
tourism has been identified as having potential for growth economic.

Intsika Yethu IDP 2014-2015
Page 66
(Part C) Spatial Orientation
4. Spatial Analysis and Rationale
This section necessitates that, the strategies, policy and maps reflect spatial implication with regard to
ward investment in urban and rural setting. It is inherent therefore that, the principles of the National
Spatial Development Planning (NSDP) and Provincial Spatial development Planning (PSDP) be applied to
ensure sustainable planning e.g. densification, mixed use as well as mitigation and adaption strategies
relating to climate change.
The Spatial Development Framework for IYLM has been reviewed and adopted by the Council on the 24
of June 2013. This is in response to requirements of Section 26 (e) of the Municipal Systems Act, 2000
(Act No 32 of 2000), that requires every municipality to formulate a spatial development framework (SDF)
as part of the contents of its IDP to provide basic guidelines for a land use management systems of the
municipality. This further necessitates that, the spatial analysis must consider the broad economic sectors
and key structuring elements (nodes & corridors) since it is important that areas of need, potential
(existing and latent) and decline are shown spatially. The IYLM‘s Reviewed SDF: 2009/2010 illustrates
future development perspectives and desired growth, direction and pattern of spatial development and
growth in the municipality.
There are two types of settlement patterns in IYLM, namely rural and urban, with urban centres in
Cofimvaba and Tsomo. These urban centres possess a relative level of urban sprawl. Within IYLM there
are approximately 213 rural settlements which are sparsely scattered all over the 21 wards within the
municipal area with the largest concentration pockets found along the main access routes.
4.1 Spatial Overview
There are several issues that relate to IYLM with regard to spatial development, the following are regarded
as key issues:
Dispersed settlements patterns and pockets of development at urban centres surrounded by
scattered underdeveloped rural villages, which implies great costs to achieve access to basic
services and infrastructure;
Need to systematically address the fragmented nature of development to promote the integration
of urban and rural areas over time (phased development approach which will optimise on existing
capacity and resources to generate the most spin-off effects from investment);
Prioritisation of different levels of investment to ensure ongoing sustainable development and
spin-off effects for continued economic growth in the IYLM area; and
Limited economic activity outside of urban centres.
There is a need to build on the agricultural and tourism potential of the area and target investment to other
LED related initiatives and programmes taking place outside of the urban centres that have potential for
growth and to generate economic spin-off.

Intsika Yethu IDP 2014-2015
Page 67
Map 1: Spatial Priorities
Source: IYLM Spatial Development Framework Review, 2010/11

Intsika Yethu IDP 2014-2015
Page 68
4.2 Prioritized Secondary Nodes
IYLM has rural nodes that are the focus for development planning of the livelihoods support in
agricultural development. These rural nodes are forming a key target area for land reform and rural
housing development projects. It is reported that, the rural settlements were not formally planned and the
need for rationalisation has been identified.
Map 2: Key nodes and corridors of IYLM
According to the IYLM the SDF identifies Cofimvaba and Tsomo as special development areas or most
important development nodes that are to receive attention for development given their roles as service
centres to 214 rural settlements within 21 wards. The two towns are to be complemented by prioritised
secondary nodes spread across the local municipality. These are rural nodes, which will be the focus for
promoting sustainable livelihoods; agricultural development, land reform and rural housing development.
Development issues identified in relation to the rural secondary nodes relate to the densification of these
areas to create the economies that will make it possible to provide services in these areas. The economic
sectors identified critical to stimulating economic development in these areas are agriculture and tourism.
Within proximity to Cofimvaba the following rural nodes have been identified: Qamata, Bilatye, Sabalele
and Lubisi. These areas are within reasonable travelling distance from Cofimvaba, with Qamata and
Bilatye being only 15 km away, Sebalele 20 km away and Lubisi 25 km away. Ncora is the only rural node
identified in the SDF which is within 20 km from Tsomo and just more than 20 km from Cofimvaba.

Intsika Yethu IDP 2014-2015
Page 69
The area is characterized by a gently sloping landscape and is encompassed by valleys. The incised hilltops
and mountain found in the entire region are of similar altitude. The dominant geological types are volcanic
intrusions and sandstone of the Clarens Group which is generally resistant to erosion. Below the
sandstone are the red and purple mudstones together withshale. The soils in the area are categorized as
shallow to moderately deep and highly weathered. Soil erosion has been caused by over grazing and
dispersive soils in most areas in the Intsika Yethu. Most of the well-known forms of erosion including
sheet, rill, gully, piping, head ward, stream-bankerosion, land and mudslides and piping all occur in the
Intsika Yethu mainly due to poor land management practices. For more detailed information it is captured
on the municipal SDF which is currently reviewed.
These include rivers, dams and wetlands.
Rivers
There are four primary drainage systems
Xonxa River
Ncora River
Lubisi River
Tsojana River
The area also has several perennial rivers and four dams, the major of the latter being the Xonxa,
Tsojana, Ncora and Lubisi dams.
Dams
Three of the above listed rivers have been dammed to create large water impoundments suitable for large
Scale irrigation schemes. These are;
Ncora Dam
Lubisi Dam
Tsojana Dam

Intsika Yethu IDP 2014-2015
Page 70
Table 16: Prioritised Secondary Nodes
NCORA QAMATA BILATYE SABALALE LUBISI
The area has
history of
agricultural
development
There is a
need for
more
funding of
irrigation
schemes to
work to its
potential.
There is
existing
infrastructur
e which
could be
improved
and utilized
for training
and
development
of skills for
the nearby
communities
There is a
need for
funding to
improve
existing
irrigation
schemes
Fish farming
will have to
be
investigated
The area has a lot
of agricultural
potential currently in
a small scale and will
be developed for
maize production for
commercial purposes
Construction of
shearing sheds
Piggery
Establish of
community gardens
The need for
Environmental
Impact Assessment
as part of planning
for all proposed
developments which
have potential to
change the current
land uses as well as
upgrading of
infrastructure
Protection and
preservation of
natural vegetation is
suggested
There is also a need
to investigate
possibly of a game
reserve coupled with
proper management
and fencing
The area has
been
earmarked
for wheat
production
and
development
of an
agricultural
village
Other
projects like
construction
of dipping
tanks and
piggery will
add value to
the livelihood
of the
community.
The following
has to be
considered;
Assessment
of the
available
resources like
dams and
making
proper use for
the proposed
development
Investigations
of possible
land suitable
for wheat
production
This area has
a potential for
tourism
development
but it needs to
be improved
through the
proposed
national
Monument.
Other tourist
attractions
areas will
have to be
identified and
developed to
ensure a
holistic
tourism route
There provisions
for all relevant
environmental
legislation would
have to be complied
with
Source: IYLM Spatial Development Framework Review, 2010/11

Intsika Yethu IDP 2014-2015
Page 71
4.3 Development Corridors
Development corridors are characterized by higher order ribbon-like development along routes that would
otherwise be classified as movement corridors. Different types of corridors can be distinguished such as
development corridors, movement corridors, and activity corridors. The R61 from Queenstown through
Cofimvaba, Ngcobo to Mthatha has been identified as the East Corridor, one of the four major
development corridors in the Chris Hani District SDF.
This section deals with the synopsis of key issues contained within the IYLM SDF. The municipality has
resolved to make use of the cluster approach to the implement and facilitate the Integrated Development
Plan, through the utilisation of the following clusters; Technical Service Cluster, Social Needs Cluster,
Economic Development Cluster and Finance, Governance and Administration Cluster. The later cluster is
cuts across all other clusters thus ensuring the effective and efficient operation over the cluster system.
The development nodes approach links to the small towns’ development strategy.

Intsika Yethu IDP 2014-2015
Page 72
Map 3: Special Development Areas
Source: IYLM Spatial Development Framework Review, 2010/11

Intsika Yethu IDP 2014-2015
Page 73
Table 17: Development Zones
Settlement Zone
Type
Locality and
description
Rational for Zone
Development
Key proposal
Cofimvaba and
Surrounds
(Formalisation/
Densification
Settlement Zone)
Located at Cofimvaba
town and surrounds, the
area encompasses some
8 settlements including
Cofimvaba town and
houses about 16 000
people.
The zone is identified to
emphasize the strategic
objective of
concentrating new
settlement
development in a
planned and formalized
fashion within the urban
precincts of the
existing town.
Greenfields
development as well as
upgrading
of informal settlements.
Formalisation and
development of Model 1-
type settlement in areas
outwards from the
central urban precincts
of Cofimvaba as
guided by the Municipal
SDF.
Local planning
processes (formalization
/ institutional upgrade)
are proposed t0
accommodate
growing pressures and
institute land use
management system.
Formulation of a
Commonage
Management
Plan is prioritized.
Tsomo
(Formalisation/
Densification
Settlement Zone)
Located at Tsomo town. Tsomo town is to
provide a spatial
indication that formal
urban settlement should
be prioritised in the
existing urban centres.
Note that little or no
demand for residential
units is registered at
Tsomo town and the
area should not be
developed prior to
efforts being
concentrated at
Cofimvaba in the short
medium term (5-year
planning period) unless
a specific need arise.
Formalization and
development of small-
scale
Model 1-type settlement
in suitable
areas outwards from the
central urban
precincts of Tsomo as
guided by the
Municipal SDF.
Little pressure for
growth is identified at
Tsomo, therefore should
continue as a minor
service centre with no
large scale housing
development.
Mtshingeni Area
(Development
Support
Zone)
Located at Mtshingeni
area, which
encompasses 2
rural settlements,
accommodating about
4,000 people.
Area is identified as a
Development Support
Zone as it has been
gazetted as a valid
restitution claim.
Need for development
planning to direct
capital investment
programmes for local
development based on
the gazetted land claim.

Intsika Yethu IDP 2014-2015
Page 74
Settlement Zone
Type
Locality and
description
Rational for Zone
Development
Key proposal
Zone identified to
receive Local Planning
Processes in
collaboration RLCC for
appropriate investment
of development funds in
the area.
Area to support
settlement, rural
livelihood initiative,
tourism and agricultural
development.
Local planning
processes aimed at
formalization and
development of existing
Model 2 type settlement.
Bilatye and Qamata
(Development
Support
Zone)
Located in portions of
Wards 4 and 5, in the
irrigation scheme
areas of Bilayte and
Qamata and includes
some 4 settlements with
an estimated population
of 13 000 people.
Area is identified as a
Development Support
Zone because of the
importance of the
irrigation schemes of
Bilatye and Qamata,
which represent areas of
significant investment
in infrastructure over a
period of time to realize
commercial benefit from
agriculture.
Revitalisation of these
irrigation schemes is a
priority development
initiative and the
resolution of land rights
issues in these areas
is of great importance in
achieving sustainable
development outcomes.
Local planning
processes aimed at
investigating land rights
The area is a
LED/agricultural
development focus area
and the realisation of
the value of investments
in infrastructure in the
Zone is linked to the
resolution of land rights
issues in the local
areas.
Lubisi “cluster”
(Development
Support
Zone)
Portions of Wards 6 and
7, and encompassing the
Lubisi Dam and some 13
settlements, which
house 15 000 people.
IYLM identified this
area as where LED
initiatives have been
prioritized.
Lubisi is identified to
support Local Planning
Processes in the area,
aimed at integrating
with LED initiatives
(tourism potential)and
enhancing development
outcomes.
Local planning
processes aimed at the
formalisation of Model
2- type settlements
and the resolution of
land rights issues
The area has been
identified by the LM as
a focus area for LED
activities, including
Small Business
Development.

Intsika Yethu IDP 2014-2015
Page 75
Map 4: Development Zones
Source: IYLM Spatial Development Framework Review, 2010/11
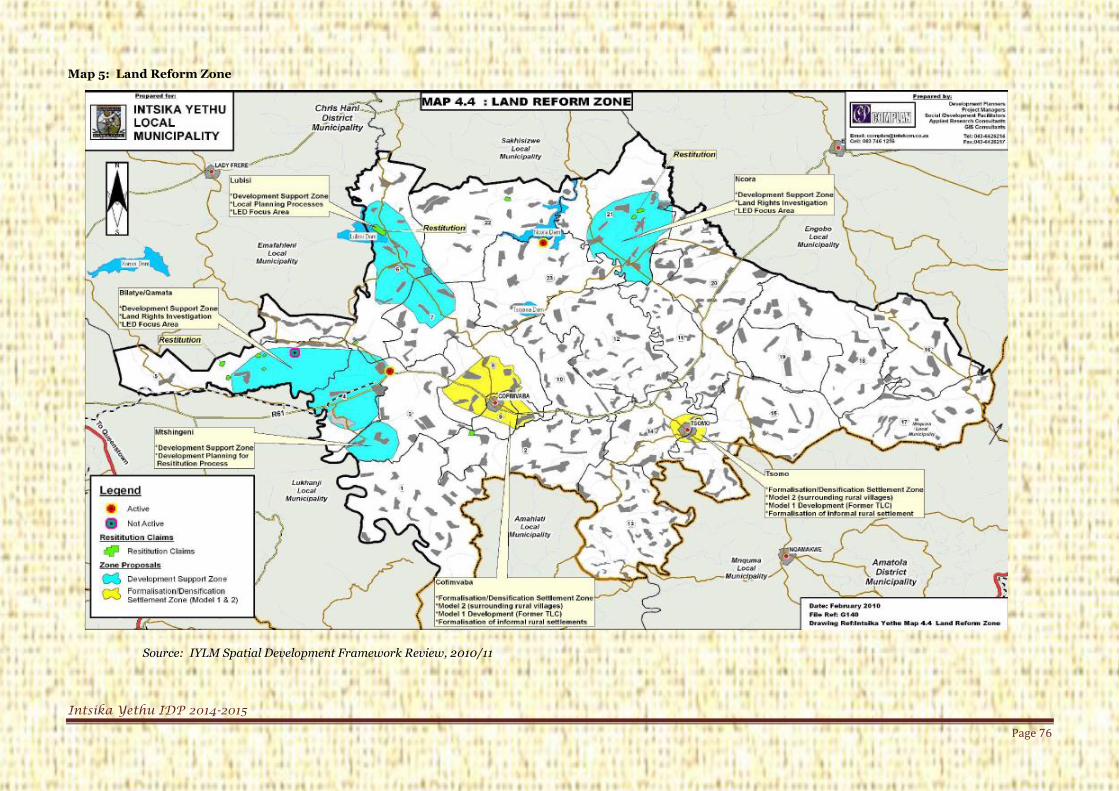
Intsika Yethu IDP 2014-2015
Page 76
Map 5: Land Reform Zone
Source: IYLM Spatial Development Framework Review, 2010/11

Intsika Yethu IDP 2014-2015
Page 77
(Part D) Service Delivery Profile
5. Service Delivery Profile and the Clusters
This section provides an analysis of the service delivery profile of IYLM with specific reference to the
backlogs facing the municipality. The National government has set out the National target for eradication
of service delivery backlogs. These targets are aligned to Millennium development goals (MDG’s) and
outcomes approach targets, hence a consistent effort should be made to achieving the targets. Access to
social and economic services enables people to participate more meaningfully in their economy.
5.1 Cluster Model integration and coordination
The municipality has resolved to make use of the cluster approach to the implement and facilitate the
Integrated Development Plan, through the utilisation of the following clusters; (1) Technical Service
Cluster, (2) Social Needs Cluster, (3) Economic Development Cluster and (4) Finance, Governance and
Administration Cluster. The latter cluster cuts across all other clusters thus ensuring the effective and
efficient operation over the cluster system. It is recommended that all these clusters have a programme of
action which culminates into the Performance Score Card and SDBIP. Cluster system can allow more
involvement of (s57 Managers), Portfolio Committee Members of the municipality who are responsible for
the availability of quality and relevance of information provided under their respective Key Performance
Areas in the IDP. Consequently the cluster system allows the (s57 Managers) to prioritise the support to
the IDP and increase efforts towards improving the quality of information and input to the IDP regarding
their KPAs. It is through the improvement on individual KPAs that the quality of IDPs will improve and
enhanced by the same commitment from Council Portfolio Committees. Such commitment should be
present throughout the duration of the IDP-Cycle since the ultimate quality of forward planning (IDP) is
best informed by the situational analysis which is the mirror of the municipality in as far as its existing
conditions is concerned.
The cluster approach in this regard deals with the following issues:
Table 18: Cluster approach
Technical
Service Cluster
Social Needs
Cluster
Finance, Governance
& Admin Cluster
Economic Development
and Planning Cluster
Infrastructure
Planning &
Development
Senior Manager
Community Service
Senior Manager
Municipal Manager Economic Development &
Planning Senior Manger
Water supply
provision
Sanitation
service provision
Electricity
Street lighting
Roads and
Storm Water
Land
Administration
and Housing
Municipal Public
Education (early
childhood &adult
learning
programmes)
Municipal Health
(Health) &
Hygiene
promotion)
Special
Programmes
(including Aids,
Disabled, Youth
&Women)
Functional
Administration/
Administration
oversight
Intergovernmental
Relations
Policies & By laws
Public
Participation
Support to Council
political
leadership and
CDWs
Local Economic
Development
(Agriculture, Forestry,
Tourism, SMME’s)
Poverty alleviation
Markets
Street trading
Local Tourism
Environmental
Management
Municipal planning (IDP,
SDF, PMS,SDBIP & LED)

Intsika Yethu IDP 2014-2015
Page 78
Technical
Service Cluster
Social Needs
Cluster
Finance, Governance
& Admin Cluster
Economic Development
and Planning Cluster
Works
Facilitation of
EPWP
implementation
Public Safety &
Traffic (Safety
and Security)
Public space and
Parks
Disaster
Management-Fire
fighting
Waste
Management
Refuse Removal
& transfer
stations
Public Transport
Community
Facilities
Cremation and
Cemeteries
Cleansing
Pound
Management
Licensing of
liquor selling
outlets
Licensing of dogs
Control and
inspection of food
& beverage
outlets
Financial viability
Budgeting
Financial reporting
and credit control
Property Valuation
and billing
systems
Risk & Asset
Management Plan
Equity Plan and
Transformation
Telecomm nation
5.2 Technical Service Cluster
5.2.1 Free Basic Services and Social Infrastructure
In the provision of basic services and social infrastructure IYLM has increased its capacity and staffing
complement steadily over the years, expanding the breadth and depth of its service delivery. Currently
IYM’s Free Basic Unit has the following staff complement, Senior Indigent Coordinator,Assistant Free
Basic Services Coordinator, Indigent Clerk Intern.
IYM provides Alternative Energy to 3000 households, Electricity to 5800 households, Water to 7000
households, Refuse removal and Sanitation to 16 households. There is a functional Free Basic Forum
which oversees the updating of the Indigent Register. The Forum operates according to the guidelines
outlined in the Indigent Policy. The local Free Basic Forum representatives attend both the district and
provincial forums.

Intsika Yethu IDP 2014-2015
Page 79
However, serious gaps remain in the integration of its infrastructure provision. At this time the
municipality does not have an Integrated Service Delivery (ISD) Unit, nor does it have a Comprehensive
Infrastructure Plan (CIP) outlining the institutional requirements and financial viability of service delivery
at this time. However, it does have a Community Liaison Office tasked with interfacing with the public
around service delivery matters and it has initiated the process to engage a service provider to assist in the
development of a CIP for the municipality. It is expected that such a plan will be adopted by Council over
the new term. For the time being, IYLM takes an issue-to-issue approach to addressing its service delivery
backlogs and challenges.
The following is an overview of the municipality’s status quo in this regard.
Refusal Removal or disposal: The provision of the refuse removal is only provided in the urban areas
of Cofimvaba and Tsomo and is collected on daily basis according to the collection schedule developed.
Only 2% of households have access to weekly refuse removal services, and only 1% receives regular or ad-
hoc collection from the municipality. Another 1% is reported to be using communal dumps while 36% is
underserved. About 60% in mostly rural areas burn their waste or dispose it within their yards.
The IYM has the following staff complement for Refuse.
1 Assitant Manager – Enviromental Management
1 Enviromental management Officer
2 x Supervisors ( Tsomo & Cofimvaba)
5 x truck drivers (4 permanent and 1 on one year contract)
9 x general workers
30 x casual workers who work on a three month rotational basis
Refuse Equipment used is as follows:
1 x compactor truck
1 x cage truck
2 x tractors
15 skip bins for communal areas
80 refuse bins
Waste is disposed at a licensed landfill site in Cofimvaba. At the landfill site there are two cooperatives
who conduct the sorting of waste on site and bail the reclaimed materials for selling to recycling market.
There is a Transfer station at Tsomo which is also licensed.
The operations, maintenance and operations of the landfill site are outsourced to a service provider for a
five year period which expires in 2014. The refuse removal service is implemented through a Littering,
Dumping and Waste Management By law. The municipality also subscribes to the Waste Information
System on a monthly basis for waste data as the landfill site has a weighbridge. Public awareness
programmes are conducted annually with relevant stakeholders.
Currently there is a R5 million Greening and Beautification Project funded by Department of
Environmental Affairs which is implemented in both Cofimvaba and Tsomo for a 12 month period.
The municipality also plans to implement other Waste Minimisation and Open Space Rehabilitation
projects whose deliverables will include:

Intsika Yethu IDP 2014-2015
Page 80
The construction of a Buy Back centre and upgrading of sorting area.
Providing waste collection in high density and informal areas through Household Contractors.
Clearing of illegal dump sites in both Cofimvaba and Tsomo.
The municipality is also supported by the Chris Hani District Municipality in various ways and worth
mentioning is the development of the Integrated Waste Management Plan for 2011- 2012. The IYM is
finalising the Environmental Sector Plan for 2013 -2014. The district will assist the municipality in
establishing a Waste Forum in 2013 -2014.
Roads and Transport: The Department of Roads and Transport of the Province of the Eastern Cape has
made a strategic decision to assist Local and District Municipalities with the establishment of transport
forums by making standard guidelines available for these authorities. In respect of the above, Intsika
Yethu established its Road and Transport forum and is functional as we speak. It is comprised of the
following stakeholders; SAPS, Dept. of Health, SASSA, Dept. of Public Works, Dept. of Home Affairs,
Dept. of Correctional Services, and Public Transport Owners (Bus and Taxi Association. Meetings are held
once a quarter and special meetings are convened when necessary. Currently there is a taxi rank at
Cofimvaba town that accommodates Buses also and Tsomo town is under construction.
IYLM’s road network is mainly made of gravel roads which need upgrading and maintenance services.
Tarred roads are found along the R61 linking major Towns of Queenstown and Mthatha through Tsomo to
the N2 in the East London direction. The municipality is also conscious of the number of citizens that rely
on walking and has undertaken an expansion and upgrading of walkways throughout public areas and
along certain public paths complete with the expansion of community lighting, as provided for under the
Projects and Programmes section of this document. IYLM currently makes use of the CHDM Integrated
Transport Plan (ITP) in supporting transport service provision throughout the municipal area. The
municipality however is in the process of developing its own Local Integrated Transport plan which will
focus on Local on transportation (ITP) and Storm Water Management Plan. Currently Service Provider
has been appointed towards that end. Also, the municipality currently lacks a Roads Master Plan but is
giving due consideration to the development of such a plan. A Storm Water Management Plan is currently
in draft, and still being revised before being submitted to Council.
5.2.1.1 Summary of existing backlogs within IYLM circa 2010
Table 19: Progress against backlogs within IYLM
Type of backlog Backlogs
Census
2001
Backlogs
eradicated up
to 2009/2010
Remaining
backlogs
Backlogs
eradicated
at the end of
2012/2013
Backlogs at
the start of
2014/2015
Road
infrastructure
(incl. Storm
Water)
1320 kms 125 kms 1195 kms 1014 950 kms
Refuse Removal 23 Wards 2 Wards 21 Wards 0 Wards 21 Wards
Street Lighting 240 Villages 1 Village 239 Villages 1 Village 238 villages
Community
facilities
56 buildings 12 buildings 44 buildings 0 buildings 44 buildings
The above table indicates the existing infrastructure backlogs within IYLM and considers a backlog to be
any infrastructure needs .
Municipal service delivery on these issues is challenged by the low revenue base of the municipality from
which it finances the provision of these services. At this time, approximately 20% of IYLM’s own revenue

Intsika Yethu IDP 2014-2015
Page 81
is used to fund capital projects and infrastructure developments, with the remainder financed by
government grants. However, given the backlogs detailed above, IYLM will need to expand its revenue
base while increasing and effectively applying all government grants if it seeks to make a serious indent
into the extensive backlogs it faces over the new term. At this time, the municipality does not have any
other sources of infrastructure investment but the potential to pursue the possibility of public/private
partnerships remains.
Table 20: Funding sources for addressing service delivery backlog
SOURCE OF
FUNDING
2009/2010 2010/2011 2011/2012 TOTAL
AVAILABLE
FUNDING
REQUIRED
SHORTFALL/
Surplus
MIG R
21,563,804
R
25,934,894
R
31,461,000
R 78,959,698 R
1,471,751,360
R
1,405,666,360
DWAF R
26,000,000
R
27,000,000
R
28,000,000
R 81,000,000
MUNICIPAL R
10,400,000
R
12,000,000
R
15,000,000
R 37,400,000
TOTAL R
54,986,000
R
60,564,000
R
68,935,000
R
184,485,000
R
1,471,751,360
-R
1,287,266,360
Electricity: IYLM receives the supply of electricity through Eskom; the major towns of Cofimvaba and
Tsomo are served with electricity. The High Voltage (HV) Electrical Power line extends from
Komani/Qamata 1132KV to Qolweni/Manzana 166KV. Another power line extends from Cala/Elliot 166kv
to Butterworth/Noora 166kv. About 66% households have access to electricity. According to RSS (2006)
surveys the electricity backlog amounted to 44% of total demand, which has subsequently declined. The
municipality is challenged in this area in that it is not the authority, nor the provider, and therefore it
remains reliant on Eskom for the provision of electricity rollout to villages. This is further challenged by a
funding shortage to address the existing backlogs the municipality has facilitated to get funding from the
Department of Minerals and Energy (DoE.
Housing: In terms of IYLM Housing Sector Plan (2008-2012) the area has municipal commonage land
which is available for future housing developments. The sites are well located in relation to work
opportunities and social services. IYLM is currently revising the existing Housing Sector Plan which will
provide a more updated and comprehensive outline of the trajectory of the municipality in this regard. In
particular, informal settlements were previously omitted from the Housing Sector Plan, but are now being
duly considered along with the migratory patterns of the municipal area which has seen at worst, a
considerable out-migration of young people, and at best, a stasis in population growth. A Migration Plan is
also proposed for consideration as part of Annexure A to this document.
One of the bigger challenges in this regard is in the implementation of housing provision which IYLM does
not have the power to do. Municipal capacity is said to be sufficient to support the provision and
expansion of most bulk services in this regard, but the onus for actual implementation of housing
provision rests with the Provincial Department of Human Settlements. For example, the municipality
currently has plans for approximately 4302 households submitted to the provincial department (608 in
Joe Slovo, 431 in Enyanisweni at Cofimvaba,263 in Tsomo) constituting both rural and urban. It has
made financial provision for the roll-out and extension of bulk services to these areas but remains reliant
on approval from the Provincial Department in order to proceed. Another challenge is the issue of land
claims around Cofimvaba town which hinders housing development plan. As the mitigating factor, the
municipality is currently using a strategy of joint planning with communities involved, as much as Law
requires no development in areas that have claims.
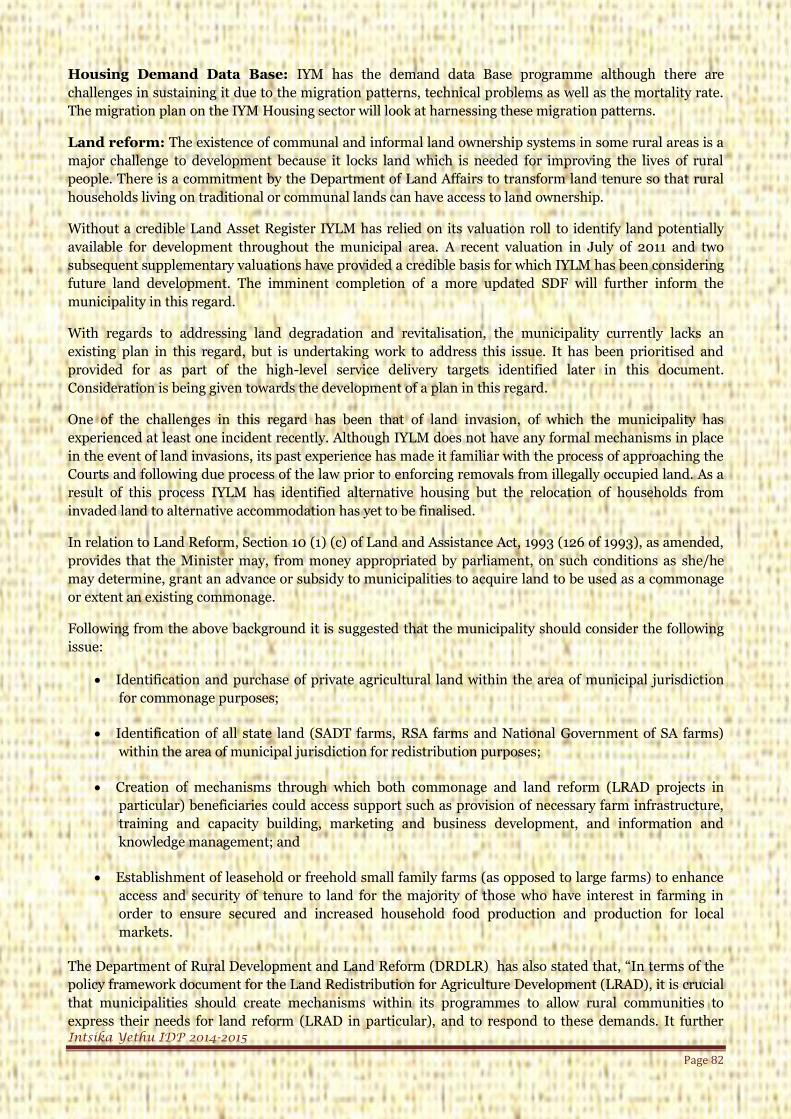
Intsika Yethu IDP 2014-2015
Page 82
Housing Demand Data Base: IYM has the demand data Base programme although there are
challenges in sustaining it due to the migration patterns, technical problems as well as the mortality rate.
The migration plan on the IYM Housing sector will look at harnessing these migration patterns.
Land reform: The existence of communal and informal land ownership systems in some rural areas is a
major challenge to development because it locks land which is needed for improving the lives of rural
people. There is a commitment by the Department of Land Affairs to transform land tenure so that rural
households living on traditional or communal lands can have access to land ownership.
Without a credible Land Asset Register IYLM has relied on its valuation roll to identify land potentially
available for development throughout the municipal area. A recent valuation in July of 2011 and two
subsequent supplementary valuations have provided a credible basis for which IYLM has been considering
future land development. The imminent completion of a more updated SDF will further inform the
municipality in this regard.
With regards to addressing land degradation and revitalisation, the municipality currently lacks an
existing plan in this regard, but is undertaking work to address this issue. It has been prioritised and
provided for as part of the high-level service delivery targets identified later in this document.
Consideration is being given towards the development of a plan in this regard.
One of the challenges in this regard has been that of land invasion, of which the municipality has
experienced at least one incident recently. Although IYLM does not have any formal mechanisms in place
in the event of land invasions, its past experience has made it familiar with the process of approaching the
Courts and following due process of the law prior to enforcing removals from illegally occupied land. As a
result of this process IYLM has identified alternative housing but the relocation of households from
invaded land to alternative accommodation has yet to be finalised.
In relation to Land Reform, Section 10 (1) (c) of Land and Assistance Act, 1993 (126 of 1993), as amended,
provides that the Minister may, from money appropriated by parliament, on such conditions as she/he
may determine, grant an advance or subsidy to municipalities to acquire land to be used as a commonage
or extent an existing commonage.
Following from the above background it is suggested that the municipality should consider the following
issue:
Identification and purchase of private agricultural land within the area of municipal jurisdiction
for commonage purposes;
Identification of all state land (SADT farms, RSA farms and National Government of SA farms)
within the area of municipal jurisdiction for redistribution purposes;
Creation of mechanisms through which both commonage and land reform (LRAD projects in
particular) beneficiaries could access support such as provision of necessary farm infrastructure,
training and capacity building, marketing and business development, and information and
knowledge management; and
Establishment of leasehold or freehold small family farms (as opposed to large farms) to enhance
access and security of tenure to land for the majority of those who have interest in farming in
order to ensure secured and increased household food production and production for local
markets.
The Department of Rural Development and Land Reform (DRDLR) has also stated that, “In terms of the
policy framework document for the Land Redistribution for Agriculture Development (LRAD), it is crucial
that municipalities should create mechanisms within its programmes to allow rural communities to
express their needs for land reform (LRAD in particular), and to respond to these demands. It further

Intsika Yethu IDP 2014-2015
Page 83
provides that the local Department of Agriculture in collaboration with the District and Local
Municipalities should ensure the congruence of LRAD projects with the IDPs. DRDA is expected to expand
support services to emerging farmers who are mainly characterised as being resource poor farmers. The
services that are rendered by the Department to farmers that are engaged primary in subsistence farming
on communal land will also continue to receive attention. The communal lands of the Province contribute
significantly to the social safety net in food security and village survival strategies.

Intsika Yethu IDP 2014-2015
Page 84
Map 6: Water Resources
Source: IYLM Spatial Development Framework Review, 2010/11
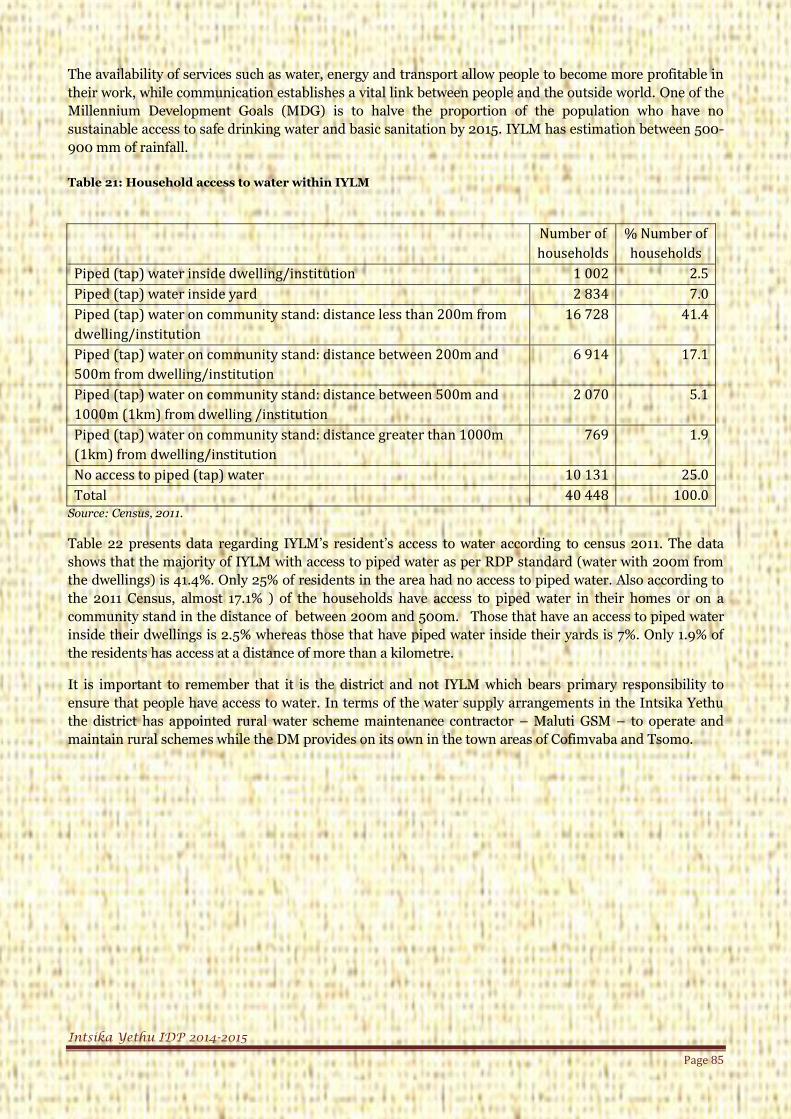
Intsika Yethu IDP 2014-2015
Page 85
The availability of services such as water, energy and transport allow people to become more profitable in
their work, while communication establishes a vital link between people and the outside world. One of the
Millennium Development Goals (MDG) is to halve the proportion of the population who have no
sustainable access to safe drinking water and basic sanitation by 2015. IYLM has estimation between 500-
900 mm of rainfall.
Table 21: Household access to water within IYLM
Number of
households
% Number of
households
Piped (tap) water inside dwelling/institution 1 002 2.5
Piped (tap) water inside yard 2 834 7.0
Piped (tap) water on community stand: distance less than 200m from
dwelling/institution
16 728 41.4
Piped (tap) water on community stand: distance between 200m and
500m from dwelling/institution
6 914 17.1
Piped (tap) water on community stand: distance between 500m and
1000m (1km) from dwelling /institution
2 070 5.1
Piped (tap) water on community stand: distance greater than 1000m
(1km) from dwelling/institution
769 1.9
No access to piped (tap) water 10 131 25.0
Total 40 448 100.0 Source: Census, 2011.
Table 22 presents data regarding IYLM’s resident’s access to water according to census 2011. The data
shows that the majority of IYLM with access to piped water as per RDP standard (water with 200m from
the dwellings) is 41.4%. Only 25% of residents in the area had no access to piped water. Also according to
the 2011 Census, almost 17.1% ) of the households have access to piped water in their homes or on a
community stand in the distance of between 200m and 500m. Those that have an access to piped water
inside their dwellings is 2.5% whereas those that have piped water inside their yards is 7%. Only 1.9% of
the residents has access at a distance of more than a kilometre.
It is important to remember that it is the district and not IYLM which bears primary responsibility to
ensure that people have access to water. In terms of the water supply arrangements in the Intsika Yethu
the district has appointed rural water scheme maintenance contractor – Maluti GSM – to operate and
maintain rural schemes while the DM provides on its own in the town areas of Cofimvaba and Tsomo.

Intsika Yethu IDP 2014-2015
Page 86
Table 22: Household access to energy within IYLM
Household access to energy
Number of
households Percentage
None 77 0.2
Electricity 25988 64.3
Gas 112 0.3
Paraffin 6862 17
Candles 6490 16
Solar 919 2.3
Total 40448 100
Chart: showing household access to energy
Source: Statistics, Census, 2011.
IYLM with regards to electrification, only 64.3 % of households were estimated to be using electrical as a
source of energy for lighting in 2011. Paraffin is the second most used form of energy in IYLM with an
estimated 17% of households using it for energy. It is also noteworthy that 16% of households use candles
as a main source of lighting whereas 2.3% and 0.3% respectively use Solar and Gas as their source of
energy.
Eskom is the only electricity provider in IYLM. In the table solar energy which is an alternative energy
source supported by IYLM is categorized together with “unspecified” and “other” forms of energy. The
municipality’s role is currently to facilitate the implementation and communicate with Eskom regarding
areas of priority for connections. Backlogs in electricity connections remain high for most areas in the
municipality.

Intsika Yethu IDP 2014-2015
Page 87
Table 23: Household access to refuse removal within IYLM
Number of
households Percentage
Removed by local authority/private
company at least once a week
1151 2.8
Removed by local authority/private
company less often
173 0.4
Communal refuse dump 557 1.4
Own refuse dump 25456 62.9
No rubbish disposal 11897 29.4
Other 1215 3
Total 40448 100
Source: Census, Statistics, 2011.
Table 24 shows that 62.9% of households in IYLM reported having to dump their refuse themselves
instead of it being removed by authorities. 29.4% of households reported having no rubbish dumping
facilities at all. Only 2.8% reported having their refuse removed on a weekly basis by a local authority.
Such a situation has serious implications for the overall hygiene of residents in the area, especially because
table 22 shows that almost 25% of the residents use other sources of water like rivers, dams and lakes etc.
as their only source of water, therefore posing a great health risk since water which is used for drinking
and cooking could become exposed to harmful substances associated with refuse.
IYLM is responsible for providing refuse removal services to its areas of jurisdiction. Since the
establishment of IYLM municipality in 2000, this service has generally been provided to the urban areas
of Cofimvaba and Tsomo only. Rural areas generally use a range of temporary mechanisms such as their
own dumps within the yard, illegal dumping sites and mobile tankers.
Table 24: Household access to sanitation in IYLM
Number of
households
Percentage
None 15018 37.1
Flush toilet (connected to sewerage system) 918 2.3
Flush toilet (with septic tank) 373 0.9
Chemical toilet 711 1.8
Pit toilet with ventilation (VIP) 9124 22.6
Pit toilet without ventilation 12410 30.7
Other 1894 4.7
Total 40448 100
Source: Census, Statistics, 2011.
The table above gives a breakdown of the situation in IYLM regarding sanitation. It reveals that 37.1%
have no access to sanitation whereas 62.9% have access to various categories of sewage/ sanitation.
Looking at the 2011 estimates we can see that the majority (30.7%) of households use pit toilets without
ventilation and the second largest group is the pit latrine category which accounted for (22.7%). Chemical
toilets and VIP toilets are mainly used in rural areas with chemical toilets account to almost 1.8% of the
households. Only 2.3% of people were believed to be using flush with sewage system and 0.9% using flush
toilets with septic tank. Only 4.7% according to the census are not using any of the above.

Intsika Yethu IDP 2014-2015
Page 88
Chart 6: Access to Communication (2010 forecasts)
Source: ECSECC, Statistics Database, 2011
According to the ECSECC data, only 11% of residents in IYLM had access to a telephone in their own home
or access to their own cell phone. The largest proportion of households in IYLM (28%), rely on using a
nearby public phone for communication. Interestingly, 26% of households could only be categorised as
“unspecified” or “not applicable”, meaning that there is no information on what mode of communication
these households use. Either way what is striking about these statistics is the fact that an estimated 56% of
households in IYLM were still believed to be leaving their houses in order to communicate with others far
away because they have no other access within their houses e.g. cell phones, telephones etc..
Communication has become a vital part of life and business and a lack thereof easily impedes not only the
quality of life but also inhibits the ability of entrepreneurs, students, and other working professionals to
maximise opportunities that may come their way.
5.2.2 Human settlements
The Chart below illustrates that 71% of houses in IYLM are Traditional dwellings. Only 21% of houses in
the municipality are brick structures. It is important to remember that many households in areas such as
IYLM prefer traditional dwellings rather than formal brick structures for cultural reasons. The
municipality maintains a formal housing waiting list which indicates that there are in excess of 2000
families which require housing in IYLM. Just what role the municipality will play in meeting the demand
for housing is yet to be clarified since IYLM is not a housing authority. The municipality is yet to formalise
Land Administration and Housing function.
Settlements in IYLM are typically clustered on ridges and along the roads with a variety of housing
structures built out of mud brick, block and brick walls. Roofing varies from thatch to tiles or to
corrugated iron. In the two towns of Tsomo and Cofimvaba, there are informal structures and back yard
shacks behind larger houses built from brick and blocks.

Intsika Yethu IDP 2014-2015
Page 89
Chart 7: Distribution of housing across IYLM
Source: ECSECC, Statistics Database, 2011.

Intsika Yethu IDP 2014-2015
Page 90
5.3 Social Needs Cluster
5.3.1 Education levels
In terms of Stats SA (2001) National Census education IYLM fairs very poorly in terms of education.
About 36, 7% of the population has no formal education while 24% have some primary schooling and 7%
have completed their primary schooling. About 23% are recorded to have secondary schooling and only
9% of the population have completed matric (Std.10 / Grade 12) and Higher education. There are a
number of reasons for the low levels of education in IYLM which include:
Parents lack the money to send children to school;
Lack of scholar transport (which is critical in providing mobility to scholars to access their
educational institutions) this results in poor scholar attendance and increased dropout rates in
many remote rural areas;
Regarding Scholar Transport Assistance, the policy guidelines from the Eastern Cape Provincial
Department of Education stipulates that public school learners who stay 5km (grade 4-12) as well
as 2,5lm (grade R-3 and physically challenged learners) or more away from nearest and
appropriate school should be provided with a subsidized transport to attend school, priority
should be given to learners in the most disadvantaged communities; and
Another dimension of the problem relates to inadequate School Nutrition program in rural schools
and farm schools and possible expansion to cater for all needy learners. According to MEC’s
School Community Co-operative Ilima Programmes (SCCIP), “learners who are hungry do not
have equal access to high quality education, and do not have access to opportunities for equal
education achievement and will ultimately not have access to further education and employment
opportunities that will change their social and economic circumstances”.
It should be acknowledge that in terms of Schedule 4 Part A of the Constitution, education at all levels,
excluding tertiary education falls under function areas of concurrent National and Provincial legislative
competence. This implies that all education related issues in the CHDM are dealt with by the Eastern Cape
Provincial Department of Education (EC-DoE). In recognising that education is a means of promoting
good citizenship as well as preparing our people for needs of a modern economy and democratic society,
the government must ensure progressive realisation of universal schooling, improving quality education
and eliminating disparities and inequalities. This requires a major renewal of schooling and education
system, by taking the following steps:
Work together with educators, learners, parents, school governing bodies and other stakeholders,
to make education the priority for all;
Making education free and compulsory for all children as well as ensuring increase in no-fee
schools particularly in impoverished areas;
Introduce a sustainable Early Childhood Education system that spans both public and private
sectors and gives children a head start on numeracy and literacy as well as strengthen support for
crèches and pre-schools in rural villages and urban centres;
Improve the quality of schooling, particularly performance in mathematics, science and
technology and language development. Measures should include provision of incentives for
mathematics and science teachers;

Intsika Yethu IDP 2014-2015
Page 91
Promote the status of teachers, ensuring the employment of adequate numbers, and improving
their remuneration and training, as an important part of the drive to ensure that quality teaching
becomes the norm;
Increase graduate output in areas of skills shortages. This must include measure to streamline
Sector Education and Training Authorities (SETAs), Further Education and Training (FET’s) and
other institutions to address existing and forecast skills shortages;
Place Further Education and Training colleges at the centre of a popular drive to transfer skills;
Encourage government to embark on the re-opening of teacher training colleges within the District
or where appropriate in IYLM;
Revive the role of state owned enterprises in skills development to support the economy;
Extend School feeding schemes to all poor primary and high schools, particularly in the remote
rural impoverished areas, provision of scholar transport and exemption of school fees to needy
children;
Conducting vigorous education and awareness programme to tackle the HIV and AIDS pandemic;
Profile new education facilities in the growth points of the IYLM;
Engage private sector to be more involved in ABET; and
Strengthen safety and security at schools.
Judging from the above, it is clear that, lack of facilities and basic services at schools may have significant
negative impact on the development of learners at schools, which could be partly manifest in low pass
rates. Thus, for these challenges to be adequately addressed there needs to be greater alignment,
coordination and support between Local Municipality, District and EC-DoE.

Intsika Yethu IDP 2014-2015
Page 92
Chart 8: Educational levels of over-21 year olds
Chart 12 gives the percentage breakdown of the level of education of over 21 year olds. From the
information we can see that the biggest portion (39%) of over-21 year olds in IYLM have gone only as far
as primary school whilst 31% have gone as far as secondary school. 21 % of over 21 year olds have no
formal schooling, these individuals together with those who have not completed primary school would be
viewed as functionally illiterate (functional literacy in South Africa is often viewed as the ability to read
and write in an everyday context, an ability that one usually obtains at grade 7 level under normal
circumstances). The high levels of illiteracy and low levels of educational achievement in IYLM have an
impact upon the kind and nature of employment that the potential workforce aims to find. Generally
poorly educated and uneducated people will seek lower skilled jobs especially in the primary sector, this is
problematic in an area such as IYLM where we have learnt from previous graphs that it is in fact the
tertiary sector and not the primary sector which is offering the most jobs (these jobs tend to be higher
skilled jobs).
Table 25: Educational qualification levels within IYLM
Qualification Number of individuals
Degree 508
Post-matric diploma/certificate 242
Matric 4860
Diploma/certificate (without matric) 1078
Secondary Schooling (without matric) 22,818
Primary schooling 29164
No schooling 15160
Source: Gaffney’s Local Government in South Africa Yearbook 2011-2013, p. M134

Intsika Yethu IDP 2014-2015
Page 93
5.3.2 Health Care Issues
According to CHDM: IDP Review 2010/11 and in reference to Global Insight (2007), a graph depicting a
population growth trends during 1996 to 2007 where population with and without HIV and AIDS reflects
a decline in HIV/AIDS infection rate and anticipated mortality rates. The CHDM: IDP Review 2010/11
further provides that, the epidemiological analysis conducted reflects that, “Gastrointestinal diseases are
most prevalent for which adult patients are admitted to hospitals, making up some 20% of the cases
followed by respiratory conditions, which contribute 18%”. In terms of health care capacity the National
norm is one clinic per 10 000 people and the national average figure for nurses per 100 000 people is 12
nurses. Within IYLM there are 2.7 nurses per 100 000 people which is well below the adequate ratio.
Furthermore the analysis of available beds per 1000 population indicates that IYLM (1:1482) is below the
national average of 1:750. This indicates a low bed occupancy rate. Regarding the access to emergency
services, IYLM experiences serious problems in transporting urgent patients, it is reported that it takes
more than 3 hours to secure transport.
The area is adequately served with primary health care facilities as per RSS (2006) survey. 72.3% of the
households have access to clinics. There are 37 clinics, 4 mobile service points supporting 86 points and a
single district hospital. The main challenge is to improve the quality of specialist doctors and reliable
supply of medication.
Irrespective of the above status quo, the government is determining to end the huge inequalities that exist
in public and private sector by making sure that these sectors work together. It should be mentioned that,
as promulgated in the Constitution, Schedule 4 Part A, and the health service is a functional area of
National and Provincial legislative competence. In terms of Section 155 (6) (a) the Provincial government
must provide for the monitoring and support of local government in the Province, this function can be
assigned to a municipality in terms of Section 156 of the Constitution. The District municipalities have a
function of rendering Municipal Health Services (MHS) traditionally known as Environmental Health
Services) in the areas of their jurisdiction as promulgated in the Municipal Structures Act of 1998 and
National Health Act 2003. According to the CHDM IDP Review 2010/11, there is an uneven distribution of
environmental health services in the District, this situation is expected to be addressed when the power
and function of Municipal Health Service (MHS) becomes a District power and function. It is reported
that, the MHS-devolution processes is currently under way in CHDM as envisaged by the Section 78
Investigation and the developed Strategic Plan in respect of the provision of the Municipal Health Services
in the district will result into the transfer of the provincially employed Environmental Health Practitioners
(EHP) to CHDM. The major challenge confronting South Africa, CHDM and IYLM, today is the scourge of
HIV/AIDS epidemic, which is likely to pose a severe challenge for development for many years to come. In
the on-going attempts to actively manage the HIV/AIDS pandemic, the CHDM has facilitated the support
and strengthening of the Local AIDS Councils (LACs). IYLM should consider eliminating risks associated
with their high water quality degradation in streams and rivers. This can constitute an influencing factor
in the spread of cholera epidemic or infection hence sanitation and water projects should be augmented by
Assessment studies of quality and condition. This brings us to the dire need to monitor the quality of both
water and sewerage treatment works discharges to main water course.
Again the government has identified the following priorities that must inform a major improvement in the
health care system:
Reduce the impact of HIV/AIDS on individual, families, communities and society by expanding
access to appropriate treatment, care and support;
Strengthen fight against AIDS through collaboration with partners at all levels of society and
accelerate implementation of HIV and AIDS and STI plans;

Intsika Yethu IDP 2014-2015
Page 94
Strengthen formal partnership against AIDS at all levels of our society including the strengthening the
South African National AIDS Council (SANAC);
Improve quality of health services and physical infrastructure revitalization; and
Increase the employment of community health workers, which will be linked to improvement of the
district health system.
In relation to health issues within IYLM it is evident that, in order to effectively and equitable provide the
Municipal Health Services (MHS) the CHDM will have to sign Service Level Agreements (SLA) and
Memorandum of Agreement (MoU) with the municipality and the Eastern Cape Department of Health
(EC-DoH) in reference to the Section 78 investigation that is underway. In return the CHDM will also,
have to find funding sources towards performing functions assigned to it, of which one of those functions
will be the development, implementation and monitoring of MHS by-laws.
5.3.3 Community Facilities
According to IYLM SDF, IYLM has 16 community halls but the quality of some of the facilities needs to be
improved and maintained. The Municipality intends to provide each ward with a community hall. Intsika
Yethu is in great need of library facilities. There are currently no library facilities for the community to
access important information. Provision of these libraries is vital and should be considered. There are
sports and recreation grounds in the Intsika Yethu area but majority of the sports fields are in a poor state
and need to be renovated. Community halls provides local communities with recreational facilities and
may be used as pension payouts, while libraries enables learners to access important information required
for their studies. Sport and recreation facilities promote the health and welfare of the people living in an
area.
5.3.4 Safety and Security
According to IYLM SDF, there are 3 police stations to look after the safety and security of the community.
These are located in Bolotwa, Cofimvaba and Tsomo. The municipality participates in local Community
Policing Forums aimed at mobilizing all affected stakeholders against incidences of crime. In terms of
policing facilities there are three 3 police station in IYLM located in Cofimvaba, Tsomo and Bolotwa. The
Municipality participates in community policing forums aimed at mobilising all affected stakeholders
against incidents of crime. In order to maintain low levels of crime in IYLM, more safety and security
services such as mobile police services need to be provided. In this regard the Eastern Cape Provincial
Crime Prevention Strategy has a key focus area which is strengthening Communities against crime
through community- based, primary prevention approaches: e.g. Innovative public education “messaging”
strategies, community-based interventions programmes and community-based activities aimed at
increasing the strength, capacity and resilience of individuals, families and communities in relation to the
known risk factor for crime.
5.3.5 Cremation and Cemeteries
According to Intsika Yethu SDF: May 2010, There are a total of 146 unlicensed/ unregistered cemeteries
distributed within the wards of the municipal area which need some improvement and re-organization to
ensure effective delivery. It should be acknowledged that most of these cemeteries have not undergone
geo-technical investigation to avoid the likelihood to underground water contamination.
5.3.6 Waste Management
Waste is an undesirable or superfluous by-product, emission, or residue of nay process or activity, that has
been discarded, accumulated or been stored for the purpose of discarding or processing. Waste products

Intsika Yethu IDP 2014-2015
Page 95
may be gaseous, liquid or solid or any combination thereof and may originate from domestic, commercial
or industrial activities and include sewages sludge, radioactive waste. In this regard the municipality must
put measures in place to ensure that all the landfill sites are equipped with facilities such as weigh bridges
and other data capturing equipment, security and other essentials, this is in compliance with the
Department of Water and Forestry (DWAF) minimum standards. In relation to economic development
through waste management a Waste Recycling projects has potential economic impact i.e. whist reducing
the amount of municipal solid waste generated and disposed of at the municipal waste disposal sites by
encourage waste avoidance, minimizing reclamation and recycling.
According to IYLM’s Integrated Waste Management Plan (2005) it was reported that waste generation
growth estimates should be linked to economic growth, population wealth and population growth, thus
population dynamics determines a waste generation growth patterns.
The table below indicates population growth trends in relation to Waste Generation Rate (Kgs per person)
in IYLM. The Municipality is also considering the alignment of its Integrated Waste Management Plan and
Waste Management Strategy with that of the CHDM, this is currently underway.
Table 26: IYLM Waste Generation Rates in relation to population growth trends
Expected population growth trends
Area 2006 2007 2008 2009 2010 2011
IYLM 184,308 185,211 185,843 186,044 185,934 186,031
Growth Rate
(1.40%)
184,308 185,211 185,843 186,044 185,932 186,031
Expected waste generation rates in IYLM
Area 2006 2007 2008 2009 2010 2011
IYLM 147869.8 150087.8 152339.1 154624.2 156943.6 159297.7
Generation
Rate (0.75%)
147869.8 150087.8 152339.1 154624.2 156943.6 159297.7
TOTAL 147870 150088 152339 154624 156944 5159298
Source: IYLM Integrated Waste Management Plan, 20o5.
In light of the above reflection of waste generation trends, it is clear that IYLM needs to better differentiate
its approach to waste management in order to provide information on the types of waste disposed and
track the volumes of waste recycled in the area. The main challenge in this regard is the management of
the illegal dumping activities and enforcement of by-laws. Currently IYLM is facilitating a waste recycling
co-opt project in its attempt to minimize waste and stimulate local economic development.
The municipality is operating a licensed landfill site, licensed number: EC/CH/A/15/001-2011 located in
Cofimvaba and used for waste disposal. The license of the landfill site was granted in terms of Section
49(1) (a) of the National Environmental Management: Waste Act, Act no. 59 of 2008. Furthermore, there
are clear regulations regarding the kind waste which may not be accepted on the landfill site. IYLM has
developed an environmental by-law relating to Dumping, Littering and Waste Collection. The by-law
regulates all “waste-management activities,” that involves the generation, reduction and minimisation of
waste and waste handling. This includes the separation, storage, collection, and transfer of waste, and
waste treatment. Waste treatment includes the recovery of waste, recovery being the recycling,

Intsika Yethu IDP 2014-2015
Page 96
reclamation and re-use of waste, and disposal of waste. The by-law further provides for the separation of
waste into different kinds determined by the nature of the waste. It also allows for charges to be made
payable for the removal of waste from premises or dumping of waste at a disposal site under the control of
the Municipality. The by-law further regulates potential illegal dumping through the control of all
dumping, littering, and other pre-determined contraventions. The by-law provides various offences
clauses which can result in financial penalties and in the most extreme instances, convictions. The by-law
is further enhanced by the existence of the Peace Officers employed by the municipality in order to enforce
it and ensure citizens act within the parameters of the law.
5.3.7 Disaster Management
Disaster Management remains a District Municipality function as per provision of the section 156, section
229 and the Municipal Structures Act (Act 117 of 1998), however IYLM is operating a disaster
management centre within the municipality.
At Intsika Yethu Municipality in terms of the structure we have one Disaster Management Officer, one
disaster volunteer and a receptionist. The disaster officials conduct assessments and compile incident
report to the District and Province, and participate in in disaster awareness campaigns. They also form
part of the disaster and emergency committee during planning of high profile events.
In terms of fire response we have a fire unit that consist of three permanently employed staff members.
They respond to all types of fires ranging from domestic, veld and industrial fires. Lukhanji Local
Municipality and Chris Hani District Municipality provide support when necessary.
5.3.8 Climate Change
Climate Change Forum exists in Chris Hani District Municipality and Intsika Yethu Municipality
participates in that forum. Intsika Yethu Municipality does not have climate change forum of its own.

Intsika Yethu IDP 2014-2015
Page 97
Map 7: Overviews of empty land and flood lines within IYLM
Strategic Density Increases:
- Densification and infill development at strategic points provide the opportunity of ensuring increased activity in the centre and ensure that necessary thresholds to support business activity is present in the centre.
- New developments of various income levels must therefore be promoted in area C,D and E.
Flood Line Protection:
- The protection of the flood line is critical for safety reasons and for protecting the river and maximising the tourism opportunities that can be realised for the rivers natural value.

Intsika Yethu IDP 2014-2015
Page 98
IYLM is not immune to emergencies and disasters and occasionally suffers the impact of various human-
induced and natural hazards that have the potential to kill, injure, destroy and disrupt. In terms of Section
54 (1) b of the Disaster Management Act, “the council of Chris Hani District Municipality, acting after
consultation with the relevant Local Municipality, is primarily responsible for the co-ordination and
management of local disasters that occur in its area”. Furthermore, Section 54 (2) states that a District
Municipality and the relevant Local Municipality may, despite subsection 54 (1) (b), agree that the Council
of the Local Municipality assumes primary responsibility for the coordination and management of a local
disaster that has occurred or may occur in the area of the Local Municipality”. Within the region, the
primary responsibility of coordination rest with local municipalities.
Regarding a Disaster Management Centre, Section 43 of the Disaster Management Act of 2002 states that
“each District municipality must establish in its administration a disaster management centre for its
municipal area in consultation with and operate such a centre in partnership with local municipalities”. In
this respect IYLM is reliant primarily on CHDM in the event of a disaster for managing the rollout of
disaster relief and mitigation.
IYLM has initiated the development of a Fire Response Plan and Fire and Emergency Guide Plan that will
assist in the overall preparation and management of fires. Primarily, the plans aim:
To prevent and combat veld, forest, mountain and chemical fires throughout the municipality;
To minimize the impact of veld fires where occurrences cannot be prevented;
To determine the various role players in cases of veld fires;
Determine a practical approach to be adopted by the municipality in endeavour of minimizing fires
through prevention, including early warning systems, mitigation and response strategies;
To provide guidance on the provision of fire fighting services including fighting of specialized fires
such as mountain, veld and chemical fires; and
To provide a standard regulation through by-laws for the prevention, management and controlling of
fires in the region.
However, there are considerable impediments for IYLM in the total preparation for fire and emergency
eventualities. These challenges include:
Building sufficient fire fighting and rescue capacity;
Improving the response time;
Establishing a local Disaster Management Centre;
Capacitating the Fire Protection Associations; and
Identification of suitable land in the event of temporary or permanent relocations.
IYLM currently has a central database for the tracking of fires across locations, dates and times. The main
challenge in this regard in the prevention and mitigation of veld fires as they remain the most serious
threat in this regard.

Intsika Yethu IDP 2014-2015
Page 99
5.3.8 Environmental Management
IYLM has a functional environmental unit in place lead by the Assistant Manager: Environmental
Management and an Environmental Management Officer, dealing with environmental challenges within
the municipal area. Currently the Environmental Management Unit is implementing a R5 million
Greening and Beautification Project within Tsomo and Cofimvaba. The project is sponsored by the
Department of Economic Development Environmental Affairs and Tourism.
In addition to these specific initiatives, IYLM is also cognisant of the global issue of climate change which
may have important implications on all climatic variables, especially temperature and rainfall. Although
the direction and degree of climate change and its impact at municipal level is still unknown, it is expected
that temperatures may increase and while rainfalls may become less frequent, yet more intense, leading to
a greater frequency and intensity of draughts and floods. Given the rural nature of the municipality,
climate change has a potentially serious impact on agricultural activities. IYLM’s proactive role in local
economic development thus means that drought resistant crops may need to be investigated in mitigation
of the potential effects of climate change. Consequently a disaster management plan for the municipality
will also have to respond to severe climate conditions e.g. thunder storms’, lightning and hail. The
municipality will develop a climate change strategy on the completion of the District Climate Change
Strategy.
A Climate Change Strategy has become a necessity in IDPs for the category A (Metros) and C (District
Municipalities). It is however advisable that category B (Local Municipalities) also adopts the District
Climate Change Strategy Framework and determines exactly how they integrate into the District’s plans.
Climate change is however defined in the National Climate Change Response Policy as an on-going trend
of changes in the earth’s general weather conditions because of an average rise in the temperature of the
earth’s surface often referred to as global warming. This rise in the average temperature is due, primarily,
to the increased concentration of gases known as greenhouse gases (GHG) in the atmosphere that are
emitted by human activities. These gases intensify a natural phenomenon called the “greenhouse effect” by
forming an insulating layer in the atmosphere that reduces the amount of the sun’s heat that radiates back
into space and therefore has the effect of making the earth warmer.
5.4 Economic Development and Planning Cluster
5.4.1 Local Economic Development
Local Economic development (LED) occurs when communities, government and the business sector act in
partnership to engage in local activities to improve local social-economic conditions by making use of local
resources and opportunities. In the MFMA Municipal Budget Circular No.58 for 2012/13, for the Medium
Term Revenue and Expenditure Framework, it suggests that municipalities focus on maximizing their
contribution to job creation by supporting labour intensive LED projects. This necessitates that, the
municipality plays a critical role in creating an enabling environment for investments and other activities
that lead to job creation: This can be obtained by;
Ensuring that service providers use labour intensive approaches;
Ensuring that service delivery and capital projects use labour intensive methods wherever
appropriate;
Participating fully in the Expanded Public Works Programme; and
Implementing interns programmes to provide young people with on-the-job training.

Intsika Yethu IDP 2014-2015
Page 100
IYLM and all its stakeholders and civil society have commitment in creating an enabling environment for
local economic; this is captured in the LED Strategy and Implementation Plan: 2020 has a Vision for the
municipal area.
The Vision for LED:
‘A vibrant developmental municipality that seeks to provide sound governance and ensure sustainable
development of its economy and people in an effective and efficient manner.’
The following are the strategic pillars for driving economic development within IYLM:
Coherent agrarian system that promotes agro-processing;
Institutional innovation and good governance that is complimentary to economic growth and
development;
Promote SMME development biased towards rural industrialisation;
Increased forestry productivity and creation of processing hubs; and
Develop human capability through training and skills development.
The following are the Anchor Projects identified within the Local Economic Development Strategy for
implementation within the Municipal area:
High value crop production and processing;
Livestock (Beef & sheep) Improvement and commercialisation;
Fruit(Stone Fruit) production, processing and packaging;
Facilitate afforestation;
Promotion of cultural activities utilising available indigenous knowledge; and
Develop and market tourist destinations.
5.4.2 Chris Hani Growth and Development Summit
As part of the National Growth and Development Summit Agreement provinces and district municipalities
were tasked with convening inclusive district and provincial summits. CHDM was the first to hold its
summit in the Eastern Cape Province. The CHDM identified six priority sectors, namely: a) Agriculture
and Agro-processing; b) Forestry and wood processing; c) Tourism; d) Construction; e) Manufacturing;
Trade and Business Services. These sectors are consistent with the sectors that the Intsika Yethu LED
Strategy has identified.
The priority actions identified in the District Growth and Development Strategy (DGDS) include the
following: Land and Agrarian Reform, Forestry, Timber and Wood Processing, Tourism Development,
Exploitation of Mining Resources, Manufacturing, Construction, Trade Services, Enabling Business
Environment
Intsika Yethu IDP 2014-2015
Page 101
5.4.3 Economic opportunities within IYLM
Beside the recommendations indicated in the Intsika Yethu LED Strategy 2020 concerning institutional
arrangements, the municipality should explore the rich tourism potential by developing of priority tourism
clusters, which could become the key journey components in the IYLM LED Strategy 2020 action plan.
5.4.4 Tourism
According to the White paper on Development and Promotion of Tourism in South Africa (1996), Local
Municipality has the responsibility of planning, development and maintenance of Tourism product in
their areas of Jurisdiction. In line with this principles, the Tourism plan for IYLM, Responsible Tourism
Sector Plan (2008). The vision for tourism development in the IYLM area is:
Vision for Tourism
‘A responsible and sustainable tourism destination of choice for historical and adventurous experiences
in the Eastern Cape’
Mission for Tourism
‘To become a responsible and sustainable tourism destination of choice in the Eastern Cape, providing
historical and adventurous experiences by 2020 to benefit the local communities’.
The focus of the strategy is on marketing, product development, infrastructure development, human
resource development and an appropriate institutional framework that will support tourism development
in the area. This is achieved through the following Strategic goals and objectives:
Goal 1: To develop new tourism products to grow the destination;
Goal 2: To increase the participation of Local Communities in the tourism industry of the IYLM;
Goal 3: To ensure a high quality visitor experience in the IYLM; and
Goal 4: To extensively market IYLM as a tourism destination.
The following table details the tourism offerings, location, and type to provide an overview of tourism
within IYLM.

Intsika Yethu IDP 2014-2015
Page 102
Table 27: Tourism Facilities in IYLM
Number Facility Name Town Sector/Type of Product
1 St Marks Town Centre Cofimvaba Historical
2 Lumanyano Cultural Group Cofimvaba Cultural Group
3 Old St Marks Church Cofimvaba Old Church Building 152 years old
4 Lumanyano Sewing Project Cofimvaba Sewing Project
5 Mava's Pottery Cofimvaba Pottery Art & Design
6 Nobandla Gospel Group Cofimvaba Music Entertainment & Gospel
music
7 Nomayisi Project St Marks Sewing, beading & clay pots
8 Sijongile Adult Project Tsomo Traditional Garments
9 Vuyisile Mini Youth Dev
Forum
Tsomo Woodwork, furniture
manufacturing
10 Vukani Catering & Baking Co-
op LTD
Qwili
Location/Tsomo
Catering, cultural dancers,
traditional healers, gospel choir
11 Sijongile Adult Project Mtshabe/Tsomo Cultural Group
12 Someleze Sewing Project Tsomo Cultural, Heritage, Historical
13 Mzamomhle Gospel Group Tsomo Gospel Group & Carpentry
14 St Joseph Apostolic Church of
SA
Tsomo Historical church
15 Qwili Ilitha Sewing Co-
operative
Tsomo Cultural &
16 Masizakhe Boomplas Cofimvaba Cultural
17 Qamata Irrigation Canals Qamata Agricultural
18 Zanoxolo Bolotwa Cultural
19 Zenzeleni Cultural Group Bolotwa Cultural
20 Siyavuya Bolotwa Cultural
21 Zimele Rural Development Qamata Cultural & Heritage
22 Ndungwana Vukani Arts &
Craft
Qutsa Cultural
23 Amigo Catering Cofimvaba Cultural
24 Cultural activities & moral
regeneration
Komkhulu
Location/Tsomo
Cultural
25 Qamata Tourism Centre Cofimvaba Historical
26 Qamata Traditional Council Qamata Cultural, heritage
27 Masakhane Project Cofimvaba Cultural
28 Nosilence Tonjeni Tsomo Cultural
29 Mr Zamile Nyeka Tsomo Cultural
30 Mpakamisi Kunene Tsomo Cultural
31 Nosimo Crafters Tsomo Cultural
32 Nothembile Mdlekeza Tsomo Cultural
33 Nothusile Jam-Jam Tsomo Cultural
34 Nothembile Sonyabashe Tsomo Heritage
35 Mateke Mazomba Tsomo Cultural
36 Mbulukweza Crafters Tsomo Cultural
37 Mncedi Kunene Tsomo Cultural
38 Qwili Junior Secondary
School
Tsomo Cultural, heritage
39 St Marks Town Centre Cofimvaba Historical
40 Lumanyano Cultural Group Cofimvaba Cultural Group

Intsika Yethu IDP 2014-2015
Page 103
Source: IYLM TSP: 2008
5.4.4.1 Tourism sector SWOT analysis
This section discusses the strengths, weaknesses, opportunities and threats (SWOT) of the tourism sector
of Intsika Yethu identified as critical in transforming the local economy. The information below has been
extracted from the Responsible Tourism Sector Plan.
Table 28: Tabulation of strength, weaknesses, opportunities and threats
STRENGTHS WEAKNESSES
Heritage sites
Rich political history
Availability of human capacity
Government support
Poor marketing of the area
Lack of product development
Unavailability of tourism statistics
Lack of adequate infrastructure to
promote sports and recreation
Lack of adequate skills for tourism
management, tour guiding, tour
operation, sport management and
promotion of cultural activities
Limited Access to funds
Lack of Infrastructure
Lack of Co-ordination & Integration
OPPORTUNITIES THREATS
Hiking and horse trails
Events
Fishing opportunities in the major dams
(Lubisi and Ncora)
Lubisi dam provide opportunities for
development of water sports
R61
Linkages with the liberation route
Crime levels poses a huge threat to
potential tourists
Global change
The potential tourism cluster’s to be identified in IYLM will be aimed at improving tourism spread within
the area. The potential clusters are; Mining Cluster (show casing local mining activities & tours), Eco-
Nature Cluster ( enhancing Nature Reserve and surrounding s areas), Cultural, Historical & Political
cluster and utilization of heritage sites: and Rural Conference facility Cluster (exploiting potential of
conference market, team building exercise venues logistically positioned around Cofimvaba and Tsomo.
5.4.4.2 Tourism demand
The demand side of tourism focuses on those needs and motivations that drive individuals to become
tourists, how these needs and motivations are shared by other people and how this becomes the basis for
defining tourist segments and markets, and how these tourist segments ultimately drive the movements of
tourists from one country and region to the next. Tourists take holidays in the hope that these holidays will
satisfy, either partially or wholly, various needs and desires. It is the task of the marketer to transform
needs into desires by making the individual aware of the various ways in which his or her needs can be
satisfied.
The following diagram indicates the specific interests of international visitors to South Africa from
Europe, Asia and the USA with regards to tourism.

Intsika Yethu IDP 2014-2015
Page 104
Figure 8: Availability of activities within Provinces
Existing tourism facilities are currently under-utilized and under-developed, the upgrading of the
associated infrastructure, revitalization and expansion of tourism facilities, enhancing economic
development with regional significance and relevance, especially for the previously disadvantaged
community areas. This can be achieved through development of Tourism Belt- development as one of the
anchor projects of the LED Strategy development aimed at unlocking the tourism development potential
of the area. The following table indicates heritage tourism initiatives within IYLM.
Table 29: Heritage Tourism initiatives
Programme Name Location
(Ward & Village)
Nature of Activities
Lubisi Development Centre
Lubisi (Ward 20) Accommodation
Craft
Youth Training
Sabalele Heritage Sabalele (Ward 1) Heritage Site
Caves
Tsomo Old Prison Tsomo Town Tourist Centre
St Marks Anglican Church St Marks
Ngcongcolorha Falls
Chris Hani Memorial lane &
Statue
In addition to tourism initiatives, IYLM boasts a strong range of sports and recreational tournaments and
events. The following table provides a brief overview of annual events and activities, including the
infamous Mayor’s Cup.

Intsika Yethu IDP 2014-2015
Page 105
Table 30: Sports and Recreation
Programme Name Location
(Ward & Village)
Nature of Activities
Mayor’s Cup
Wards 1 – 21 Netball
Soccer
Sport Hubs Magwala All Codes
Traditional Dance &
Music
All Wards Traditional Dance
Indigenous
Traditional Music
The existing tourism initiatives have a potential in creating jobs, and can be seen as integral to the existing
Tourism Strategy. The upgrading of the associated infrastructure has a potential to unlock the Small
Medium and Micro Enterprise (SMMEs), which have a massive potential where cooperative formations
are a form of economic emancipation.

Intsika Yethu IDP 2014-2015
Page 106
Map 8: Tourism
Source: IYLM Spatial Development Framework Review, 2010/11

Intsika Yethu IDP 2014-2015
Page 107
5.4.5 Agriculture
Agriculture is the largest industry within the primary sector in IYLM. However this industry remains small
and underdeveloped when compared to the entire economy of the municipality. What is most notable
about the Agricultural sector in IYLM is the fact that as an industry, agriculture is decreasing in terms of
the absolute size that it contributes to the IYLM economic output. In 1996, The Agricultural sector
contributed 18.6% to the local economy; this figure had fallen to 14.6 by 2005. Subsequently the
Agriculture industry is also offering fewer employment opportunities in recent years. Currently only
around 0.4% of employed individuals in IYLM are employed in the Agricultural industry.
Opportunities in the agricultural sector are prevalent despite the fact that the industry continues to
perform poorly. As stated in the SWOT analysis, IYLM has good grazing land and soil which is suitable for
intense commercial grazing. There are a number of projects that have been embarked upon by the IYLM
with the intension of harnessing the potential of the agriculture industry. These include:
Irrigation and agricultural projects from Lubisi to Ncora Dams; and
Crop production in the entire municipality
Table 31: Agriculture SWOT Analysis
Strengths Weaknesses
Organised farmers union
Support System from government
Expertise within government and private
sector
Availability of land for various agricultural
commodities
Established irrigation infrastructure
Lack of Information
Lack of Integration towards
agricultural development
Poor co-ordination amongst the
various role players
Poor planning
Poor infrastructure
Opportunities Threats
High potential soils and grazing land for
intensive commercial farming systems;
Value addition
Market Linkages
Job Creation
Partnerships (PPP)
Stone Fruit
Intensive Goat Production Programme
Natural disasters (Veld Fires,
Storm, Dry spells);
Source: IYLM 2020 LED Strategy and Implementation Plan, 2007

Intsika Yethu IDP 2014-2015
Page 108
Map 9: Proposals Local Economic Development (Agriculture – Crops and Forestry)
Source: IYLM Spatial Development Framework Review, 2010/11
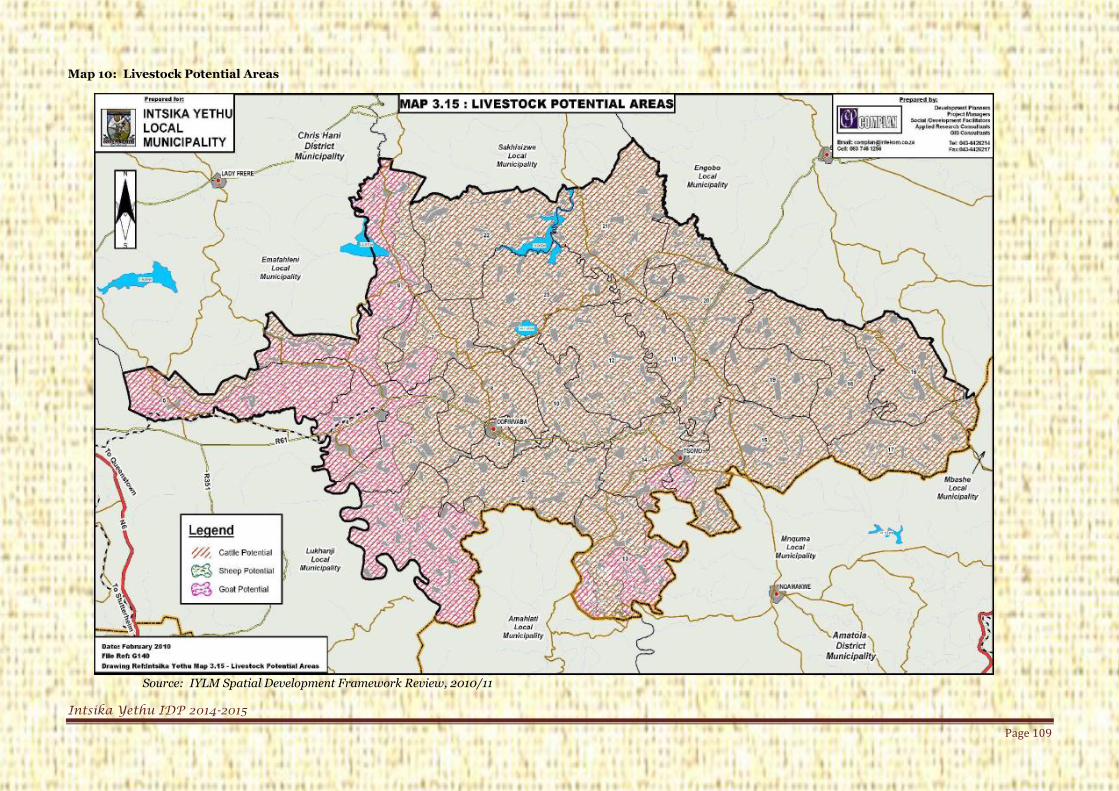
Intsika Yethu IDP 2014-2015
Page 109
Map 10: Livestock Potential Areas
Source: IYLM Spatial Development Framework Review, 2010/11

Intsika Yethu IDP 2014-2015
Page 110
5.4.6 Forestry
Forestry is the second largest industry within the primary sector after agriculture in IYLM. According to
ECSECC data, forestry is an industry that has been declining over the past 10 years; this reflects a general
trend of economic contraction within the primary sector. Just as with Agriculture, there is great potential
within the forestry industry despite the fact that it continues to perform poorly in terms of economic
output. IYLM has available natural forests which could be utilised for forestry. Furthermore there is also
open land that could be used for expansion of current forests. As an industry, forestry has the potential to
stimulate growth of secondary sector industries such as furniture manufacturing.
The potential of IYLM to develop a flourishing forestry industry is something which has been recognised
not only by the local municipality, but also by the District Municipality. CHDM has categorised the
growth of a forestry, timber and wood processing industry as one of its priorities in terms of the Growth
and development summit. Forestry within IYLM features prominently within CHDM plans for the district,
for example CHDM plans to establish medium size sawmill to benefit Intsika Yethu and Engcobo
Municipalities. The district also plans to facilitate aforestation in IYLM among other areas.
Table 32: Forestry SWOT analysis
Strengths Weaknesses
Availability of Natural forests
Availability of land for forestry
expansion purposes
Pro-poor biased government
legislation and policies;
Availability of labour force
Private sector interest in partnering
with communities
Lack of information and knowledge of
government policy on forestry expansion,
transfer of Category B and C plantations
No clearly defined role of the municipality in
forestry development including woodlots and
commercial plantations
Poor road network and other infrastructure;
Lack of funding to expand current production
scale;
Shortage of appropriate skills;
Poor co-ordination resulting in lack of
implementation
Poor leadership in forestry development by
the municipality
Complex land tenure system
Opportunities Threats
Furniture manufacturing
DWAF programmes to support
community afforestation initiatives
Willingness of well-established
forestry companies to enter into
partnerships and invest in
community a forestation
programmes
Integration of forestry development
into agriculture
Increasing forestry market
Natural disasters
Manmade disasters such as fires, arson
Environment hazards
Complex tenure arrangements
Source: IYLM 2020 LED Strategy and Implementation Plan, 2007

Intsika Yethu IDP 2014-2015
Page 111
Map 10: Forestry
Source: IYLM Spatial Development Framework Review, 2010/11

Intsika Yethu IDP 2014-2015
Page 112
5.4.7 Environment Management
It is essential that, the District Municipality assist the municipality in both technical and financially to
develop and implement the environmental management function, the state of air, water, waste, bio-
diversity and land are some of the key elements in determining the state of environment. Linked to
tourism potential of the area, endangered areas are even spread throughout the Municipality as the
original ecosystem has been reduced and that the functioning or existence is under threat land cannot with
stand loss of natural area through disturbance or development. The following wards have been earmarked
as some of endangered areas in IYLM: Ward; 1, 13, 14, 16, 17, and 18.
Environmental Sensitivity areas: IYLM has least areas covered by sensitive landscape compared
with other local municipality in the District Municipality area. This results into priority environmental
management issues within the municipal area to cover slope gradient, vegetation, conservation and
degraded land. There are factors which identify the sensitivity of the environment as prescribed are ( areas
of with sheet erosion and gully erosion present, degraded land, wetlands (including dams), vegetation
types sensitive to development ( e.g. South Eastern Mountain Grassland and sub-arid Thorn Bushveld)
The need for development of environmental management policy is:
To enhance a safe and healthy environment;
To direct sustainability and responsible planning decision-making;
To spearhead sustainable development;
To improve environmental governance throughout the Municipality; and
To create environmental awareness and commitment within the Municipality.
Intsika Yethu IDP 2014-2015
Page 113
Chapter 3: Development Priorities, Strategic Objectives,
Strategies and Projects
6. Vision, Mission, and Key Performance Areas
This chapter of the IDP provides an overview of the strategic intentions of IYLM and presents prioritised
issues which the municipality seeks to address over the medium term. This section therefore
systematically prioritizes all the issues that have surfaced from the situational analysis and community
consultations and presents what the organisation seeks to achieve in relation to these issues over the next
five years.
Although local government is the sphere closest to communities at the heart of government’s development
agenda, the Constitution requires that governance at the local level be subject to national and provincial
legislation. Section 25 (1) (e) of the Municipal Systems Acts clearly states that an IDP adopted by a
Municipal Council must be compatible with national and provincial development plans and planning
requirements binding on the municipality in terms of legislation. The synergy, alignment and coordination
between the various development plans and strategic imperatives of the three spheres of government (i.e.
IDP, PGDP, NSDP, National Outcomes Approach, etc) is vital in order to achieve proper coordination and
alignment of development initiatives within the region and locality.
In order to ensure that local government interventions drive the desired socio-economic changes in line
with government’s development agenda, integrated planning, monitoring and reporting of municipal
initiatives is crucial. Government’s emphasis upon an outcomes orientation for all interventions, inclusive
of projects implemented by Sector Departments, necessitates that strategic considerations regarding the
allocation of scarce resources are made to best address prioritised issues. This section contributes towards
a shared understanding of the priority issues of communities, and how this has informed the broader
strategic developmental trajectory of the municipality, ultimately in pursuit of better coordination,
alignment of programmes and improved impact on the ground.
As the Council elected in May 2011 has sought to ensure direction and guidance in driving local
development, it has produced a renewed Vision, Mission, and Values for the IYLM. But in order to ensure
these strategic intentions translate into the achievement of outcomes on the ground for citizens, it needs to
be clear how Council’s political directions cascade through a clear organisational logic towards the
realisation of IYLM’s constitutional mandate of developmental local government.
The figure below provides a visual representation of the logic that informs how the strategic direction of
IYLM, as formulated by Council, finds expression from the Vision statement of the municipality, down to
the Projects on the ground. The apex strategic statement is that of the Vision of IYLM, derived from the
shared Values of its people and political leadership, and articulating a future in which the Priority Issues
have been sufficiently addressed. Institutional purpose in relation to the stated Vision is expressed
through the organisation’s Mission, articulating what shall be done towards the realisation of that desired
future. This Mission is then supported by a set of Goals, roughly aligned to the Key Performance Areas of
local government. These Goals are unpacked and expressed at a lower level as Strategic Objective
statements, identifying the intended benefits of IYLM’s course of action over the medium term, as
informed by the Priority Issues identified by communities, staff, Council, and through compilation of the
Situational Analysis. These Priority Issues emanate from the ground up, and are addressed through all
levels of the organisation’s strategic intentions, although most directly at the Strategic Objectives level.
How the Strategic Objectives are realised is thereby dependent upon the Strategies employed by the
municipality, and specifically the Projects through which these Strategies are operationalized and
implemented on the ground. In this manner, a clear logic of strategic intention flows from the top of the

Intsika Yethu IDP 2014-2015
Page 114
organisation down, all along the way informed by other practical, legislated, and political imperatives
ranging from broader policy positions to budget and financial considerations.
Figure 9: A visual representation of the hierarchy of strategic intent of IYLM
6.1 Vision and Mission
The Vision:
“A people centred, developmentally focused rural local municipality in which all of its inhabitants have
access to quality service delivery and participate in vibrant and well-balanced social and economic
development”.
The Mission:
“Endeavours to advance its developmental local government mandate through a sustained focus on
sound and accountable governance, physical and social infrastructure appropriate for sustainable
development in our Municipal area”.
6.2 Principles and Values of IYLM
IYLM adopts the “Batho Pele Principles”, together with other underlying principles aligned to this value
framework, which include the following: Democracy, as realised through consultation, transparency, and
accountability; Respect & Courtesy; Responsiveness; Quality Services; Redress; and Value for Money.
The IYLM in consultation with its local communities, as part of its Council and IDP representative
processes, adopted the following set of values, in line with the above. These values are to guide how the

Intsika Yethu IDP 2014-2015
Page 115
Municipality performs its mandate, as well as how it interacts with those who remain the owners of
development (i.e. its inhabitants as the beneficiaries of development and service delivery).
To be responsive to the needs of citizens and partner-local municipalities.
To be transparent, accountable and participative in our dealings with each other and our partners.
To cultivate a work ethic focused on performance, achievement and results.
To promote and pursue key National, Provincial and local development goals.
To ensure a representative organisation.
To be democratic in the pursuance of our objectives.
To show mutual respect, trust and ensure high levels of co-operation and discipline in our dealing
with one another.
6.3 Key Performance Areas, Clusters, and Goals
The clustering within the Situational Analysis distinguished between external service provision across
three clusters, that of Technical Services; Social Needs; and Economic Development and Planning. These
externally oriented clusters are intersected by the fourth cross-cutting cluster, that of the Finance,
Governance, and Administration Cluster, which has a more inward orientation. These clusters are
consistent with the five Key Performance Areas of local government, with the caveats that Municipal
Transformation, Finance, and Good Governance are within one cluster together, whereas Social Needs
and Technical Services represent the separation of the Basic Service Delivery Key Performance Area into
two distinct clusters.
Figure 10: The convergence of KPAs, Clusters, and Goals for the IDP 2012-2017
In terms of alignment and addressing priority issues identified across the five (5) KPAs and four (4)
Clusters, IYLM set six (6) Goals consistent with each of its main administrative functions over the medium
KPAs
1. Municipal Transformation &
Organisational Development
2. Basic Services and
Infrastructure
3. Local Economic Development
4. Municipal Financial Viability
& Management
5. Good Governance & Public
Participation
CLUSTERS
1. Technical Services
2. Social Needs
3. Economic Development and
Planning
4. Finance, Governance, and
Administration
GOALS
1. Institutional development
2. Municipal planning,
maintenance & infrastructure
provision
3. Provide social infrastructure
4. Job creation through
enterprise formations,
business retention & expansion
5. Building financial viability
6. Good governance & oversight
IYLM Strategic
Nexus
Intsika Yethu IDP 2014-2015
Page 116
term. These Goals are aligned to each of the 5 KPAs, except where Basic Services and Infrastructure is
separated into two distinct Goals, one addressing Social Needs and the other addressing Infrastructure
and Technical Services. Meanwhile, Finance, Governance and Administration all have their own respective
Goals, within this single Cluster. IYLM therefore presents in subsequent sections of this chapter details of
how its organisational Goals and Strategic Objectives will address Priority Issues through the
implementation of specific Strategies and the tracking of progress via performance indicators. In order to
focus on a developmental trajectory that will ensure progressive realization of the Vision of the Council as
stated above, and derived from the institutional Mission, the Council has resolved to focus on six (6) Goals
as follows:
To provide effective and efficient human resource and administrative services within IYLM towards
institutional development and good governance, supported by enhanced information and
communication technology;
To provide sound municipal planning, maintenance, and infrastructure provision that delivers for the
needs and aspirations of IYLM citizens;
To provide quality social services and social infrastructure for the communities of IYLM, while
ensuring public safety, promoting improved public health, and supporting sustainable environmental
management;
To support enterprise formations, retention and expansion of businesses and initiatives that provides
job opportunities and income to the people of IYLM;
To build the financial viability of IYLM through integrated planning, management, and good
governance for a clean administration; and
To ensure good governance and effective oversight within IYLM.
6.4 Goals and Strategic Objectives
6.4.1 Institutional development
Goal- To provide effective and efficient human resource and administrative services within IYLM towards
institutional development and good governance, supported by enhanced information and communications
technology.
This Goal will be realised through the achievement of the following Strategic Objectives within the Key
Performance Area of Municipal Transformation and Organisational Development and the Finance,
Governance and Administration Cluster:
To improve the skills sets of IYLM Council and staff in line with their Personal Development Plans
(PDPs).
To improve the well-being of IYLM staff and Council for better service delivery.
To improve the institutional performance of IYLM through the cascading of the institutional
performance management system.
To improve access to information for Council, staff, and citizens of IYLM.
To increase the satisfaction levels of citizens with regards to IYLM services.

Intsika Yethu IDP 2014-2015
Page 117
To enhance governance through application of standing rules and orders of IYLM.
To increase the organisational capacity of IYLM in annual prioritised work areas.
To achieve equitable representation of Municipal staff in line with organisation’s transformation
agenda.
6.4.2 Municipal planning, maintenance & infrastructure provision
Goal – To provide sound municipal planning, maintenance, and infrastructure provision that delivers for
the needs and aspirations of IYLM citizens.
This Goal will be realised through the achievement of the following Strategic Objectives within the Key
Performance Area of Basic Services & Infrastructure and the Technical Services Cluster:
To improve road infrastructure networks within IYLM for greater mobility of people, goods, and
services.
To achieve integrated land-use for sustainable human settlements within IYLM.
To improve access to basic water & sanitation to citizens of IYLM.
To improve access to electricity to citizens of IYLM.
6.4.3 Provide social infrastructure and quality social services
Goal- To provide quality social services and social infrastructure for the communities of IYLM, while
ensuring public safety, promoting improved public health, and supporting sustainable environmental
management.
This Goal will be realised through the achievement of the following Strategic Objectives that fall with the
Key Performance Area of Basic Services & Infrastructure and the Social Needs Cluster:
To improve the well-being of vulnerable groups within IYLM.
To reduce HIV/AIDS related mortalities within IYLM.
To reduce the incidence of road accidents within IYLM.
To increase household access to refuse removal services within IYLM.
To limit the risk of fires and disasters to communities within IYLM.
To improve the environmental sustainability of IYLM.
To improve access to public amenities and recreational facilities for people within IYLM.
To improve the security and care of all animals within IYLM.
To reduce the incidence of crime within IYLM.
6.4.4 Job creation, enterprise formation, business retention and expansion
Intsika Yethu IDP 2014-2015
Page 118
Goal- To support enterprise formations, retention and expansion of businesses and initiatives that
provides job opportunities and income to the people of IYLM.
This Goal will be realised through the achievement of the following Strategic Objectives that fall within the
Key Performance Area of Local Economic Development and the Economic Development and Planning
Cluster:
To improve the agricultural sector contribution to the local economy of IYLM.
To improve the forestry sub-sector’s contribution to the local economy of IYLM.
To enhance tourism sector’s contribution to the local economy of IYLM.
To grow enterprises involved in beneficiation and value-addition within IYLM.
To increase employment opportunities (temporal and permanent) within IY Municipal area.
To contribute to the environment sustainability of Instika Yethu through prevention of soil erosion
and removal of alien species.
6.4.5 Building financial viability
Goal- To build the financial viability of IYLM through integrated planning, management, and good
governance for a clean administration.
This Goal will be realised through the achievement of the following Strategic Objectives that fall within the
Key Performance Area of Financial Management and Viability and the Finance, Governance, and
Administration Cluster:
To improve the accuracy of the IYLM’s financial planning and reporting.
To achieve best value for money through effective supply chain management within IYLM.
To improve financial management capacity within IYLM.
To strengthen the governance and control environment over all financial matters within IYLM.
To achieve an unqualified audit opinion in the Municipality by 2014 and beyond.
To increase revenue generation within IY Municipal area.
6.4.6 Good governance and oversight
Goal- To ensure good governance and oversight within IYLM.
This Goal will be realised through the achievement of the following Strategic Objectives within Good
Governance and Public Participation Key Performance Area and the Finance, Governance and
Administration Cluster:
To strengthen the functionality of Ward Committees within IYLM.
To improve communication within the IYLM.
To improve Council Oversight and support to the political leadership within IYLM.

Intsika Yethu IDP 2014-2015
Page 119
To ensure codification, implementation of the by-laws, powers and functions.
To ensure effective Integrated Development Planning within the Municipality.
To ensure the participation of traditional leaders in service delivery.

Intsika Yethu IDP 2014-2015
Page 120
PR
IOR
ITY
IS
SU
E
IMPROVE SERVICE DELIVERY SOCIO-ECONOMIC DEVELOPMENT BUILDING INSTITUTIONAL CAPACITY AND
FINANCIAL VIABILITY
Water shortages & drought
Limited infrastructure
Vast distances between places
Poor road and transport infrastructure
Low employment opportunities
HIV & AIDS social impact
Dependency on social grants
Access to services
Low revenue base
Indigent population
Reliance on grants
Skills limitations
Greater intergovernmental coordination for
service delivery
Land use management
Community facilities
Road and storm water drainage
Implementation of free basic services
Need for clinics
Programme dealing with Vulnerable Groups
Lack of coordination with sectors/ partners
Roles and responsibilities
Implementation of by-laws
Non-compliance with MFMA
Filling prioritised posts
1. Infrastructure
Development and Service Delivery
1. Local Economic Development
2. Integrated Development
Planning Implementation
within and Inter-Spherical
Planning
1. Basic service provision
and pro-poor planning
2. Skills development and
community capacity
building
1. Good Governance, Community
Participation and
Intergovernmental Relations
2. Municipal Financial Viability and
Management
3. Performance Management,
Monitoring & Evaluation
TECHINCAL SERVICE CLUSTER ECONOMIC DEVELOPMENT AND
PLANNING CLUSTER SOCIAL NEEDS CLUSTER
FINANCE GOVERNANCE & ADM
CLUSTER
LGTAS/Outcome 9
P
LGTAS/Outcome 9/CHDM Priorities
P
NSDP / PGDP/ DGDS
PRINCIPLES
P
ENGAGEMENT
Local
Municipality
SITUATIONAL
ANALYSIS

Intsika Yethu IDP 2014-2015
Page 121
6.5 The Three Year Implementation Plan
This section of the Integrated Development Plan outlines detailed Strategic Objectives, Strategies and
Performance Indicators meant to track progress in addressing Priority Issues and realising the Goals
across, and within, each of the Key Performance Areas over the next five years. The targets set over the
medium term become the strategic basis for later cascading into the organisations Performance
Management System (PMS). Furthermore, these indicators and their targets are specifically informed by
existing District, Provincial, and National imperatives and considerations. Some of the indicators included
are taken directly from the Local Government Performance Management Regulations, Schedule to the
Municipal Systems Act. Also, note there is a distinction between the Technical Service Cluster and the
Social Needs Cluster within the Basic Services & Infrastructure Key Performance Area, as both Clusters
have their own respective Goals.
The three year Implementation Plan is then followed by the Projects and Programmes section, which
provides a brief breakdown of the different projects and programmes planned for the Medium Term
Expenditure Framework (MTEF). This section presents an integrated presentation of all of the scheduled
projects and programmes to be implemented, including their spatial distribution, cost and source of
funding, as well as duration over the next three years. In instances where funding was unavailable for
some projects, but their potential to address an identified issue in line with organisational Goals and
Strategic Objectives, these projects were included under the banner of ‘Unfunded’. These project tables
represent an attempt to integrate and align all planned initiatives within IYLM in terms of addressing the
issues identified as part of the Situational Analysis, and emanating from the public participation

Intsika Yethu IDP 2014-2015
Page 122
Annexure 1
KPA 1: Financial Management and Viability
Cluster: Finance, Governance and Administration
Strategic objective: To improve revenue collection
KPA Strategy KPI Baseline indicator Annual target
2015-2016 2016-2017 2017-2018
Revenue By ensuring accurate
billing.
Accurate billing
Incorrect categorisation
of debtors within the
billing system
12 accurate billing
reports.
12 accurate billing
reports.
12 accurate billing
reports.
By implementing
revenue enhancement
strategy
Implemented revenue
enhancement strategy.
Reviewed revenue
enhancement strategy
which is currently sitting
at 32% in terms of own
revenue collection
60% own revenue
collected by 30
June 2016
65 % own
revenue collected
by 30 June 2017
75 % own revenue
collected by 30 June
2018
By implementing credit
control policy
Implemented credit control
policy
credit control policy in
place
Implementation
of credit policy
Fully
implementation
of credit policy
Fully implementation
of credit policy
Strategic objective: To ensure that expenditure incurred is aligned to approved budget and IDP

Intsika Yethu IDP 2014-2015
Page 123
KPA
Strategy KPI Baseline indicator Annual target
2015-2016 2016-2017 2017-2018
Expenditure
management
By spending according to
votes
100% spending according to
approved budget and IDP
Budget not spent
according to approved
budget and aligned to IDP.
Ensure that
spending is
within 5% over
/under of the
approved budget
by 30 June 2016.
Ensure that
spending is
within 5% over
/under of the
approved budget
by 30 June 2017.
Ensure that spending is
within 5% over /under
of the approved budget
by 30 June 2018.
Strategic objective: To have an effective and efficient SCM and asset management processes
KPA Strategy KPI Baseline indicator Annual target
2015-2016 2016-2017 2017-2018
Supply Chain
Management
By centralisation of SCM
processes
Centralised SCM processes Decentralised SCM
processes
100% centralised
SCM process by
30 June 2016.
100% centralised
SCM process by
30 June 2017.
100% centralised
SCM process by 30
June 2018.
By safeguarding and
ensuring accountability over
Credible assets register and Not all assets are in both
General ledger and asset
All assets are in
both General
All assets are in
both General
All assets are in
both General

Intsika Yethu IDP 2014-2015
Page 124
KPA Strategy KPI Baseline indicator Annual target
2015-2016 2016-2017 2017-2018
assets general ledger register. ledger and asset
register by 30
June 2016
ledger and asset
register by 30
June 2017
ledger and asset
register by 30
June 2018
Strategic objective: To ensure effective budget planning and reporting mechanisms
KPA Strategy KPI Baseline indicator Annual target
2014-2015 2015-2016 2016-2017

Intsika Yethu IDP 2014-2015
Page 125
KPA Strategy KPI Baseline indicator Annual target
2014-2015 2015-2016 2016-2017
Budget Planning
and Reporting
By ensuring that budget
structure/ system enables
accurate and reliable
financial reporting.
Well cash backed budgeting
Currently, budget is not
realistic and cash backed.
Budget
according to the
guaranteed
Sources of
revenue and
spending
according to the
revenue
received
Budget
according to the
guaranteed
Sources of
revenue and
spending
according to the
revenue
received
Budget according
to the guaranteed
Sources of
revenue and
spending
according to the
revenue received
Monthly/Quarterly/Midterm
and Annual financial reporting.
Inaccurate reports
12 Signed
accurate S71
reports, 2
accurate S72
reports and 4
quarterly
accurate
reports.
12 Signed
accurate S71
reports, 2
accurate S72
reports and 4
quarterly
accurate reports
12 Signed
accurate S71
reports, 2
accurate S72
reports and 4
quarterly accurate
reports
Strategic objective: To improve compliance to financial prescripts and internal controls

Intsika Yethu IDP 2014-2015
Page 126
KPA
Strategy KPI Baseline indicator Annual target
2015-2016 2016-2017 2017-2018
Legislative
Compliance and
Internal Control
By aligning all BTO
policies to legislation
and Implementing
internal controls
according to MFMA.
Aligned policies and
documented internal
controls by 30th June 2016
High degree of non-
compliance to policies,
financial prescripts and
poor internal control
Environment
Aligned,
approved BTO
policies and
documented
procedure
manuals
Aligned,
approved BTO
policies and
documented
procedure
manuals
Aligned, approved
BTO policies and
documented
procedure
manuals
Strategic objective: To obtain a clean audit opinion by 2017
KPA
Strategy KPI Baseline indicator Annual target
2015-2016 2016-2017 2017-2018
Audit
Outcomes
Improvement
By monitoring internal
controls, quarterly
management accounts and
ensure proper oversight
Unqualified audit report
received by 2016
Qualified Audit opinion
received in 2013/14
financial year
Unqualified
Audit Opinion by
30 June 2016
Unqualified
Audit Opinion by
30 June 2017
Clean Audit

Intsika Yethu IDP 2014-2015
Page 127
By monitoring
implementation of risk
register
Completed and
implemented risk register
Risk register in place Mitigate risks
identified in the
risk register by
30 June 2016.
Mitigate risks
identified in the
risk register by
30 June 2017
Mitigate risks
identified in the
risk register by 30
June 2018.
By monitoring
implementation of audit
action plan
Completed and
implemented audit action
plan
Audit plan is in place To clear 2014/15
audit findings by
AG by 30 June
2016.
To clear 2015/16
audit findings by
AG by 30 June
2017
To clear 2016/17
audit findings by
AG by 30 June
2018
Municipal Institutional development and Transformation
Cluster: Finance, Governance and Administration
Strategic objective: To ensure proper creation, maintenance, use, access and disposal of records at IYM
KPA Strategy KPI Baseline indicator Annual target
2015-2016 2016-2017 2017-2018
Records
Management
By strengthening and
implementing proper
records classification
systems.
Sound records
classification system.
Misfiling of documents,
no proper referencing
and security for the
records. Unauthorised
access to records
storage areas.
At least one records
management
workshop targeted for
all departments.(Filling,
referencing ,security
and unauthorised
access to records
storage )
At least Two
records
management
workshop targeted
for all
departments.
At least two
records
management
workshop targeted
for all
departments.

Intsika Yethu IDP 2014-2015
Page 128
KPA Strategy KPI Baseline indicator Annual target
2015-2016 2016-2017 2017-2018
By following the proper
procedures on the
disposal of records
Records disposed -of
Records no longer in use
not disposed- of
One successful disposal
of records that are no
longer in use
One successful
disposal of records
that are no longer
in use
One successful
disposal of records
that are no longer
in use.
By ensuring that all
outgoing and incoming
correspondence is
captured and referenced.
Controlled incoming and
outgoing correspondence.
All correspondence
received is date stamped
and registered.
File movement register
is in use.
All received
correspondence is
registered.
Recording of all
incoming and outgoing
correspondence.
Recording of all
incoming and
outgoing
correspondence.
Recording of all
incoming and
outgoing
correspondence.

Intsika Yethu IDP 2014-2015
Page 129
KPA Strategy KPI Baseline indicator Annual target
2015-2016 2016-2017 2017-2018
By following access to
information procedure
manual on documents
requested.
Prompt reply/ response
on information requests.
Turnaround time is at
least one working day on
information requested
2014/2015.
At least within 30 days
turnaround time on
information requested.
At least within 30
days turnaround
time on
information
requested.
At least within 30
days turnaround
time on
information
requested.

Intsika Yethu IDP 2014-2015
Page 130
Strategic objective: To improve the skills development for councillors and staff of IYM.
KPA Strategy KPI Baseline indicator Annual target
2015-2016 2016-2017 2017-2018
Skills
development
By implementing trainings
and learnership
programmes to councillors
and staff according to work
place skills plan (WSP).
Number of trainings and
learnerships programmes
held for both councillors and
staff according to WSP.
One learnership
programme on
fundamental literacy
competency and One AET
learner ship programme
was conducted to
employee in 2014/15.
The following
trainings and
learner ship
programmes will
be undertaken
by 30 June 2015:
- Training of
18 EEP
Forum
members,
- Learnership
programme
for 10 Cllrs
- Skills
Programme
on fleet
managemen
t and
Transport
for 8
Two learnership
and six trainings
targeted
Two learnership
and six trainings
targeted

Intsika Yethu IDP 2014-2015
Page 131
employees
- skills
programme
on basic
cleaning
conditions
for 10
employees
- Five
employees
on records
mgmnt
learnership
programme
and
- Ten
employees
for financial
study
assistance
Strategic objective: To provide effective administration service and support to council of IYM

Intsika Yethu IDP 2014-2015
Page 132
KPA Strategy KPI Baseline indicator Annual target
2015-2016 2016-2017 2017-2018
Support to
council and
committee
services
By ensuring standing rules
and orders of the council are
applied.
Compiled, signed council
agendas and distributed
seven days in advance.
Council agendas are still
not distributed seven days
in advance.
Ensure that all
forty two
councillors and
eight traditional
leaders sign for
receipt of all
Council agendas
seven days in
advance
At least four
council agendas
compiled and
distributed
council seven
days in advance.
At least four
council agendas
compiled and
distributed council
seven days in
advance.
By ensuring councillor
benefits are correctly
implemented.
Councillor benefits that are
implemented according to
government gazette.
Councillor benefits are
fully implemented
according to the
government gazette
All 42 councillors
receive their
benefits as
stipulated in the
government
gazette
All 42 councillors
receive their
benefits as
stipulated in the
government
gazette
All 42 councillors
receive their
benefits as
stipulated in the
government
gazette

Intsika Yethu IDP 2014-2015
Page 133
Strategic objective: To improve institutional performance of IYM
KPA Strategy KPI Baseline indicator Annual target
2015-2016 2016-2017 2017-2018
Performance
Management
System
By implementing
performance management
system.
Cascaded PMS to the level
below senior managers.
PMS is implemented at the
level of senior managers
only.
Cascade PMS to
the level of
assistant
managers,
Project
managers and
other strategic
officials.( work
plans )
Cascade PMS to
the level below
assistance
managers and
Project
managers.
Cascade PMS to all
employees of IYM.
By conducting employee
satisfaction survey.
Conducted employee
satisfaction survey and
report.
One survey conducted and
its recommendations
implemented 2014/2015
At least one
employee
satisfaction
survey
conducted by 30
June 2016.
Impact
assessment ( last
survey)
Conduct at least
one employee
satisfaction survey

Intsika Yethu IDP 2014-2015
Page 134
Strategic objective: To ensure proper monitoring and management of all IYM fleet.
KPA Strategy KPI Baseline indicator Annual target
2015-2016 2016-2017 2017-2018
Fleet Management
services
By implementing vehicle
recovery and fleet
monitoring system.
Developed and
implementable fleet
recovery and monitoring
system.
Currently fleet
management systems are
in place but the objectives
of fleet management not
fully achieved.
Fully
Implementation
of vehicle
recovery and
fleet monitoring
system
Implementation
of vehicle
recovery and
fleet monitoring
system
Implementation of
vehicle recovery
and fleet
monitoring system
Strategic objective: To ensure compliance, equitable representation of municipal staff in line with organisation’s transformation agenda

Intsika Yethu IDP 2014-2015
Page 135
KPA Strategy KPI Baseline indicator Annual target
2015-2016 2016-2017 2017-2018
Employment Equity By implementing employment
equity plan (EEP).
Implemented EEP.
Non-compliance to the EEP
Recruit
according to the
EEP to meet the
target and goals
by June 2016.
Recruit
according to the
EEP to meet the
target and goals.
Recruit according
to the EEP to meet
the target and
goals.
By having functional and
capacitated employment equity
committee
Functional and
capacitated
Employment equity
committee
Employment equity
committee capacitated
and functioning properly.
One training and
one awareness
workshop
targeted for both
councillors and
staff
(committee) on
employment
equity
regulations by 30
June 2016.
Four meetings
targeted for
2015/16
Two training and
two awareness
workshop
targeted for both
councillors and
staff on
employment
equity
regulations by 30
June 2016.
Four meetings
targeted for
2016/17
Three training and
three awareness
workshop targeted
for both
councillors and
staff on
employment
equity regulations
by 30 June 2017.
Four meetings
targeted for
2017/18

Intsika Yethu IDP 2014-2015
Page 136
Strategic Objectives: To improve the well-being of staff and council of IYM
KPA
Strategy KPI Baseline indicator Annual target
2015-2016 2016-2017 2017-2018
Employee assistance
programme and
occupational health
and safety
By implementing health and
wellness programmes.
Number of health and
wellness programmes
undertaken.
Two wellness programmes
were undertaken in
2014/15.
Two wellness
programmes
targeted for
implementation
by 30 June 2016
Three wellness
programmes.
Four wellness
programmes.
Strategic Objectives: To motivate and sustain employees of IYM
KPA
Strategy KPI Baseline indicator Annual target
2015-2016 2016-2017 2017-2018
Human resource
management.
By providing employees with
fringe benefits.
Fringe benefits provided to
employees.
Medical Aid subsidy,
pension subsidy, cell
phone allowance, car
allowance, 13th cheque,
performance bonus and
Ensure provision
of the following
fringe benefits to
employees:
Medical Aid
Ensure provision
of the following
fringe benefits to
employees:
Medical Aid
Ensure provision
of the following
fringe benefits to
employees:
Medical Aid

Intsika Yethu IDP 2014-2015
Page 137
KPA
Strategy KPI Baseline indicator Annual target
2015-2016 2016-2017 2017-2018
housing subsidy provided
in 2014/15.
subsidy, cell
phone
allowance, 13th
cheque,
performance
bonus and
housing subsidy.
subsidy, cell
phone
allowance, 13th
cheque,
performance
bonus and
housing subsidy
subsidy, cell phone
allowance, 13th
cheque,
performance
bonus and housing
subsidy
Strategic Objectives: To set up functional and efficient administration systems
KPA
Strategy KPI Baseline indicator Annual target
2015-2016 2016-2017 2017-2018

Intsika Yethu IDP 2014-2015
Page 138
KPA
Strategy KPI Baseline indicator Annual target
2015-2016 2016-2017 2017-2018
Organisational
development
(Leave management
)
(Employee
management)
By implementing electronic
system for monitoring work
attendance of all employees.
Uni - clock system in place
and fully operational
Introduction of electronic
system in 2014/15
Usage of attendance
registers.
Uni - clock
system in place
and fully
operational by
30 June 2016.
Uni - clock
system in place
and fully
operational.
Uni - clock system
in place and fully
operational
Online application of leave
Online application of leaves
Usage of leave books.
On line leave
applications by
30 June 2016.
On line
application of
leave.
On line application
of leave.
By safe keeping employee
records.
Created employee files and
updated information in all
employee files.
Updated employee files
Update
employee files
on a monthly
basis.
Update
employee files
on a monthly
basis.
Update employee
files on a monthly
basis.

Intsika Yethu IDP 2014-2015
Page 139
KPA
Strategy KPI Baseline indicator Annual target
2015-2016 2016-2017 2017-2018
By ensuring claims for S&T ,
overtimes, standby, sleep
overs and shift allowance
are calculated using the right
formulas and in line with
relevant policies.
Register for all claim forms
received.
Stamped and signed claim
forms.
All claims are registered,
calculated, signed and
stamped.
Ensuring that
Claims for S&T,
overtimes,
standby, sleep
overs and shift
allowance are
calculated using
the right
formulas and in
line with
relevant policies
on a monthly
basis.
Ensuring that
claims for S&T ,
overtimes,
standby, sleep
overs and shift
allowance are
calculated using
the right
formulas and in
line with
relevant policies
on a monthly
basis.
Ensuring that
claims for S&T ,
overtimes,
standby, sleep
overs and shift
allowance are
calculated using
the right formulas
and in line with
relevant policies
on a monthly
basis.
Strategic Objectives: To build capacity of the organisation through population of the organogram
KPA
Strategy KPI Baseline indicator Annual target
2014-2015 2015-2016 2016-2017

Intsika Yethu IDP 2014-2015
Page 140
Recruitment and
selection
By ensuring open and
transparent recruitment
processes and procedures.
Advertised posts on notice
boards, local and national
newspapers.
22 Posts advertised and
filled by 2014/2015
Advertising and
filling of critical
posts as per
reviewed
organogram
Advertising and
filling of critical
posts as per
reviewed
organogram
Advertising and
filling of critical
posts as per
reviewed
organogram
By implementing agreed
organogram
Filled position in the
organogram in line with
municipal needs and
affordability
Reviewed organisational
structure
Filling of funded
vacant posts as
per organogram
and budget
available
Filling of funded
vacant posts as
per organogram
and budget
available
Filling of funded
vacant posts as
per organogram
and budget
available

Intsika Yethu IDP 2014-2015
Page 141
Strategic Objectives: To develop institutional policies and by-laws.
KPA Strategy KPI Baseline indicator Annual target
2015-2016 2016-2017 2017-2018
Policies and By- laws By developing,
implementing, reviewing
municipal policies and
facilitating Gazetting of
municipal by – laws.
Developed, and reviewed
municipal policies
Policies are reviewed
on an annual basis.
Reviewal of all
municipal policies by
end of first quarter.
Reviewal of
policy annually.
Reviewal of policy
annually.
Gazetted municipal By- laws
By –laws are gazetted
on submission.
Gazette all submitted
by- laws by 30 June
2016
Gazetting and
publicizing by-
laws for
awareness and
by in.
Gazetting and
publicizing by-laws
for awareness and
by in.
By conducting awareness
workshops on HR Policies
Awareness workshops on
HR policies conducted
Awareness workshop
on HR policies done
annually
One awareness
workshop on HR
policies to be
conducted and each
and every employee
receive and sign Code
of Conduct
One awareness
workshop on HR
policies to be
conducted
One awareness
workshop on HR
policies to be
conducted

Intsika Yethu IDP 2014-2015
Page 142
Strategic objective: To promote and maintain sound employee relations
KPA Strategy KPI Baseline indicator Annual target
2015-2016 2016-2017 2017-2018
Employee relations By having bilateral meetings
with shop stewards on
quarterly basis.
Number of bilateral
meetings with shop
stewards
No structured meetings in
place with Shop stewards.
Four quarterly
bilateral
meetings with
shop stewards
by 30 June 2016.
Four quarterly
bilateral
meetings with
shop stewards
by 30 June 2017
Four quarterly
bilateral meetings
with shop
stewards by 30
June 2018
By having monthly LLF
meetings.
Monthly LLF meetings.
Monthly LLF meeting
2014/2015.
Monthly LLF
meetings(12) by
30 June 2016
Monthly LLF
meetings(12) by
30 June 2017
Monthly LLF
meetings(12) by
30 June 2018
By capacitating employees,
shop stewards on
employees relations.
Training of employees, shop
stewards on employee
relations.
One training programme
conducted 2014/2015.
One Training for
Employees, shop
steward and
managers on
employee
relations and
two awareness
programmes by
the end of June
2016
One Training for
Employees, shop
steward and
managers on
employees’
relations.
One Training for
Employees, shop
steward and
managers on
employees’
relations.

Intsika Yethu IDP 2014-2015
Page 143
KPA Strategy KPI Baseline indicator Annual target
2015-2016 2016-2017 2017-2018
Promotion and maintenance
of discipline to employees.
Number of conducted
disciplinary hearings and
awareness provided on
disciplinary
issues/procedures
Employees are aware of
code of conduct.
One training on
disciplinary skills
for managers
and supervisors
and one
awareness on
disciplinary code
of conduct to all
employees by 30
June 2016
One training on
disciplinary skills
for managers
and supervisors
and one
awareness on
disciplinary code
of conduct to all
employees by 30
June 2017
One training on
disciplinary skills
for managers and
supervisors and
one awareness on
disciplinary code
of conduct to all
employees by 30
June 2018

Intsika Yethu IDP 2014-2015
Page 144
KPA 2: Good Governance and Public Participation
Cluster: Finance, Governance and Administration
Strategic objective: To strengthen the functioning of ward committees
KPA Strategy KPI Baseline indicator Annual target
2015-2016 2016-2017 2017-2018
Ward committee
support
Through capacity
building and provision
of resources
Trained ward
committees
1training has been
conducted on
legislation in
2014/2015 financial
year
1 training of 210 ward
committees by 30 June 2016
1 training of 210 ward
committees by 30 June
2017
2 training of 210 ward
committees by 30
June 2018.
Resourced ward
committees
Limited resources for
ward committees
All 210 ward committees to
be provided with
resources(cell phone,
stipend, stationary )
All 210 ward committees
to be provided with
resources(cell phone,
stipend, stationary
All 210 ward
committees to be
provided with
resources(cell phone,
stipend, stationary
Strategic objective: To have well informed communities that participates in the affairs of IYM
KPA Strategy KPI Baseline indicator Annual target

Intsika Yethu IDP 2014-2015
Page 145
2015-2016 2016-2017 2017-2018
Good Governance By conducting community
satisfaction survey.
Conducted community
satisfaction survey
2015/2016
One community
satisfaction survey
conducted in 2014/2015
One
documented
community
satisfaction
survey
conducted by 30
June 2016
One
documented
community
satisfaction
survey
conducted by 30
June 2017
One documented
community
satisfaction survey
conducted by 30
June 2018
By capacitating public
participation stakeholders
forum
Capacitated Public
participation stakeholder’s
forum
Public participation forum
has been established in
2014/2015 financial year
2 training
targeted by 30
June 2016
1 training
targeted by 30
June 2017
1 training targeted
by 30 June 2018
By conducting IGR meetings Number of IGR meetings
conducted
Four IGR meetings
conducted in 2014/15.
Four IGR
meeting
convened on a
quarterly basis
Four IGR
meetings
convened on a
quarterly basis
Four IGR forums
convened on a
quarterly basis
By strengthening
communication with all IYM
stakeholders
Adopted Annual report in
compliance with relevant
legislation.
2013/14 Annual report
One compiled
Annual report:
2014/15
Annual report.
Annual report.

Intsika Yethu IDP 2014-2015
Page 146
Strategic objective: To strengthen council support and oversight within IYM
KPA Strategy KPI Baseline indicator Annual target
2015-2016 2016-2017 2017-2018
Good Governance Functional Audit committee
that regularly report to the
council
Audit committee reports
and minutes submitted to
the council.
Structured reporting to the
council 2014/2015.
Four quarterly
meetings and
two Audit
committee
reports
submitted to the
council by June
2016.
Four quarterly
meetings and
two Audit
committee
reports
submitted to the
council by June
2017.
Four quarterly
meetings and two
Audit committee
reports submitted
to the council by
June 2018.
Functional risk and anti-
fraud committee that
regularly report to
accounting officer and Audit
committee
Documented and approved
risk management
framework and anti- fraud
and corruption strategy
The Risk Management
framework, Anti-fraud and
corruption strategies
reviewed in 2014/2015
Reviewed and
approved risk
management
framework (Risk
assessment
reports) and anti-
fraud and
corruption
strategy by 30
June 2016.
Reviewed and
approved risk
management
framework (Risk
assessment
reports) and anti-
fraud and
corruption
strategy by 30
June 2017.
Reviewed and
approved risk
management
framework (Risk
assessment
reports) and anti-
fraud and
corruption
strategy by 30
June 2017.

Intsika Yethu IDP 2014-2015
Page 147
KPA Strategy KPI Baseline indicator Annual target
2015-2016 2016-2017 2017-2018
By providing oversight on
behalf of the Council
Adopted MPAC reports in
compliance to relevant
guidelines
Four quarterly reports
submitted 2014/2015
Four quarterly
MPAC reports by
30 June 2016
Four quarterly
MPAC reports
per annum by 30
June 2017
Four quarterly
MPAC reports per
annum by 30 June
2018
Strategic objective: To monitor and evaluate performance of S56/S57 Managers
KPA Strategy KPI Baseline indicator Annual target
2015-2016 2016-2017 2017-2018
Good Governance By developing performance
agreement and conduct
quarterly performance
evaluation processes.
Conducted and developed
Performance evaluation
reports of s56/57 Managers
Only senior Mangers /
directors are evaluated on
PMS.
Two
performance
evaluation
reports by 30
June 2016
(s56/s57
managers).
Two
performance
evaluation
reports by 30
June 2017
Two performance
evaluation reports
by 30 June 2018.

Intsika Yethu IDP 2014-2015
Page 148
Strategic objective: To ensure effective communication internally and externally at IYM
KPA Strategy KPI Baseline indicator Annual target
2015-2016 2016-2017 2017-2018
Communication Intensify
implementation of
communication strategy
through workshops
Workshop conducted
on communication
strategy
Communication
strategy has been
developed in the
2014/2015 financial
year
1 Workshop
(internally) and 1
workshop
(externally).
Implementation of
communication strategy
Implementation of
communication strategy
By strengthening
communication within
the institution both
internal and external
Well informed
employees and
communities
Continuous media
briefings
Hold quarterly
media briefings
with both
electronic and print
media by 30 June
2016
Hold quarterly media
briefings with both
electronic and print
media by 30 June 2017
Hold quarterly media
briefings with both
electronic and print
media by 30 June 2018

Intsika Yethu IDP 2014-2015
Page 149
KPA Strategy KPI Baseline indicator Annual target
2015-2016 2016-2017 2017-2018
Two external
newsletters and 12
internal newsletter
Two external
newsletters and 12
internal newsletters
by 30 June 2016
Two external
newsletters and 12
internal newsletter by
30 June 2017
Two external
newsletters and 12
internal newsletter by
30 June 2018
Conducted staff
meetings, distribution
of notices, memo and
update of website
Structured staff
meetings, notices,
memos, and website
Quarterly staff
meetings , updated
website
Quarterly staff meetings
, updated website
Quarterly staff meetings
, updated website

Intsika Yethu IDP 2014-2015
Page 150
KPA Strategy KPI Baseline indicator Annual target
2015-2016 2016-2017 2017-2018
By strengthening
communication with
communities through
presidential hotline and
complaint management
system.
By responding to the
complaints within
30days
Responded to
complaints within 30
days as turnaround
time.
Address and
respond to all
registered
community
complaints and
suggestions
Address and respond to
all registered
community complaints
and suggestions
Address and respond to
all registered
community complaints
and suggestions
Strategic Objective: To establish well- secured and compliant information, communication technology systems
KPA Strategy KPI Baseline indicator Annual target
2015-2016 2016-2017 2017-2018
ICT By maintaining and
upgrading ICT systems.
Upgraded and
maintained ICT systems
Continuous upgrading
and maintenance of ICT
systems
Maintenance and
upgrade of ICT
systems by 30 June
2016
Maintenance and
upgrade of ICT
systems by 30 June
2017.
Installation of fibre
optic cables
Maintenance and
upgrade of ICT
systems by 30 June
2018
Installation of fibre
optic cables.
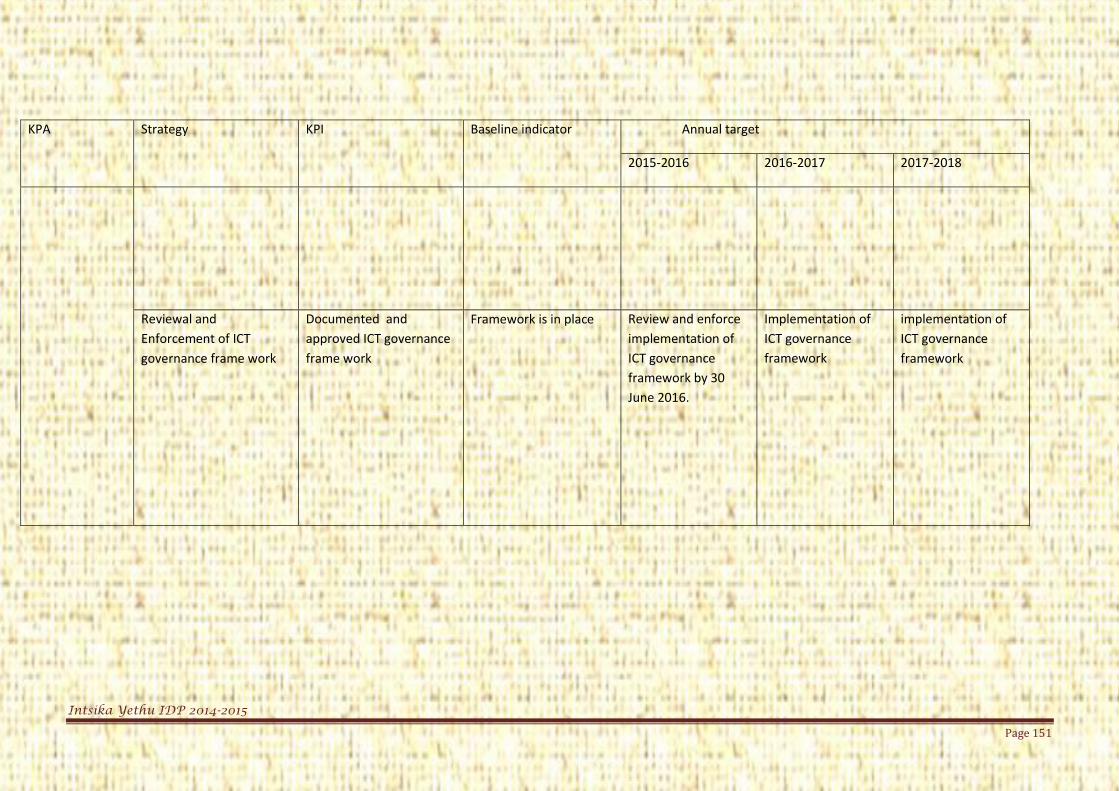
Intsika Yethu IDP 2014-2015
Page 151
KPA Strategy KPI Baseline indicator Annual target
2015-2016 2016-2017 2017-2018
Reviewal and
Enforcement of ICT
governance frame work
Documented and
approved ICT governance
frame work
Framework is in place
Review and enforce
implementation of
ICT governance
framework by 30
June 2016.
Implementation of
ICT governance
framework
implementation of
ICT governance
framework

Intsika Yethu IDP 2014-2015
Page 152
Strategic objective: To ensure integration of all vulnerable groups within IYM
KPA Strategy KPI Baseline indicator Annual target
2015-2016 2016-2017 20172018
SPU By mainstreaming SPU
programme within the IYM.
Mainstreamed SPU
programmes in all IYM
departments.
Fragmented SPU
programmes.
Mainstream all
SPU programmes
within IYM by 30
June 2016.
Mainstream all
SPU programmes
within IYM by 30
June 2017.
Mainstream all
SPU programmes
within IYM by 30
June 2018
By organising Youth through
sport.
Youth participation in
Mayors Cup
One Mayors Cup hosted in
2014/15.
Host one
Mayors Cup by
30 June 2016
Stage one
Mayors Cup by
30 June 2017
Stage one Mayors
Cup by 30 June
2018

Intsika Yethu IDP 2014-2015
Page 153
Strategic objective: To ensure the honouring of national calendar days
KPA Strategy KPI Baseline indicator Annual target
2015-2016 2016-2017 2017-2018
National days
celebration
By celebrating all the
national calendar days
National calendar events
honoured.
Six national celebrations
were honoured (youth
month, Mandela day,
women day, world Aids
day Chris Hani month and
disability month.
Honouring of
National
Calendar days:
Youth month,
Mandela day,
Women day,
Heritage day,
World Aids day,
and 16 days of
activism.
Honouring of
National
Calendar days:
Youth month,
Mandela day,
Women day,
Heritage day,
World Aids day ,
16 days of
activism
Honouring of
National Calendar
days: Youth
month, Mandela
day, Women day,
Heritage day,
World Aids day ,
16 days of activism
Strategic objective: To promote inward investment in order to stimulate economic growth of IYM (MM’s OFFICE)
KPA Strategy KPI Baseline indicator Annual target
2015-2016 2016-2017 2017-2018
Administration By lobbying potential
investors in IYM
Number of potential
investors attracted.
Lack of inward investments
in the area
Attract at least
one potential
investor in IYM
by 30 June 2016
Attract at least
one potential
investor in IYM
by 30 June 2017
Attract at least
one potential
investor in IYM by
30 June 2018

Intsika Yethu IDP 2014-2015
Page 154
Strategic objective: To ensure sound financial and asset management of the IYM (MM’S OFFICE)
KPA Strategy KPI Baseline indicator Annual target
2015-2016 2015-2016 2016-2017
Financial viability
and Asset
Management
By maintaining sound
financial administration
Approved budget and signed
financial reports (s71and
s72).
Approved budget and
signed financial reports.
Approved
budget and
Signed off s71 &
s72 report
submitted to
treasury on
legislated time.
Approved
budget and
Signed off s71 &
s72 report
submitted to
treasury on
legislated time.
Approved budget
and Signed off s71
& s72 report
submitted to
treasury on
legislated time.
By safe guarding and
maintaining asset
management
Asset register must be GRAP
compliant
Asset register is not fully
compliant
Fully GRAP
compliant asset
register
Fully GRAP
compliant asset
register
Fully GRAP
compliant asset
register

Intsika Yethu IDP 2014-2015
Page 155
KPA 1: Basic Service & Infrastructure
Cluster: Social Needs Cluster
Strategic objective: To reduce HIV related mortalities within IYM by 1% to 11.5 by 2017
KPA Strategy KPI Baseline indicator Annual target
2015-2016 2016-2017 2018-2019
HIV/AIDS By providing awareness
campaigns and war room
intervention to communities
of IYM in HIV/ AIDS related
issues.
Conducted awareness
campaigns and war room
intervention in all 21 wards.
1Training conducted in
each quarter for all wards
in the 2014/2015 financial
year
1 awareness
campaign in each
ward (war room
and community
dialogues) by 30
June 2016
1 awareness
campaign in each
ward
1 awareness
campaign in each
ward
By establishing and reviving
HIV/ AIDS forums.
Established forums and
revived HIV/AIDS forums
Ground diggers forum,
NGO Forums, Support
group
1 HIV /AIDS
forum and 1 War
room forum
targeted by 30
June 2016.
1 HIV /AIDS
forum targeted
1 HIV /AIDS forum
targeted
By facilitating the
implementation of food
Security programme for
vulnerable groups and
Food gardens for people
living with HIV/AIDS and
vulnerable individuals
21 fully functional house
Hold gardens in all wards
for vulnerable and for
people living with HIV /
Fully functional
households
gardens in 10
wards for
vulnerable and
Fully functional
households
gardens in 15
wards for
vulnerable and
Fully functional
households
gardens in all 21
wards for
vulnerable and

Intsika Yethu IDP 2014-2015
Page 156
KPA Strategy KPI Baseline indicator Annual target
2015-2016 2016-2017 2018-2019
HIV/AIDS in all IYM wards AIDS HIV/AIDS
individuals
HIV/AIDS
individuals
HIV/AIDS
individuals
By conducting local AIDS
council meeting
Number of meeting held Functional quarterly
meetings and conduct
community dialogues
Four LAC
meetings
targeted by 30
June 2016
Four LAC
meetings
targeted by 30
June 2017
Four LAC meetings
targeted by 30
June 2018
Honouring of calendar
events related to HIV/ AIDS
Number of calendar events
honoured
World Aids Day, 16 days of
activism, candle light
Honoured anti-
poverty
programme, 16
days of activism,
candle light
memorial
Honoured anti-
poverty
programme, 16
days of activism,
candle light
memorial
Honoured anti-
poverty
programme, 16
days of activism,
candle light
memorial

Intsika Yethu IDP 2014-2015
Page 157
Strategic objective: To Reduce Road Traffic accidents through intensified law enforcement.
KPA Strategy KPI Baseline indicator Annual target
2015-2016 2016-2017 2017-2018
Traffic Safety By conducting massive
traffic operations in
collaboration with other law
enforcement agencies
No of Road blocks, traffic
inspections and speed
checking’s conducted
10 massive operations and
daily traffic inspections
conducted in 2014/2015
financial year
12 massive
operations and
daily traffic
inspections
conducted
14 massive
operations and
daily traffic
inspections
conducted
14 massive
operations and
daily traffic
inspections
conducted
By conducting traffic
education programs to road
users and schools
Number of traffic
education programs
conducted to road users
and schools
10 traffic education
programs conducted in
2014/2015
10 traffic
education
programs
conducted for
road users and
schools
10 traffic
education
programs
conducted for
road users and
schools
10 traffic
education
programs
conducted for
road users and
schools
To formalise relations with
other sector departments
e.g. Dept of Justice and
SAPS
Number of meetings
attended
Quarterly meetings held in
2014/2015 financial year
1meeting with
government
department per
quarter
1meeting with
government
department per
quarter
1meeting with
government
department per
quarter

Intsika Yethu IDP 2014-2015
Page 158
KPA Strategy KPI Baseline indicator Annual target
2015-2016 2016-2017 2017-2018
Licensing By complying with national
standards and regulations
of Dept of Transport
regarding the issue of
licenses
Maintained Zero query
compliance report issued
by Dept of Transport
No queries with regard to
issues of compliance in
2014/2015 financial year
Four compliant
reports with
national standards
and regulations of
Dept of Transport
by 30 June 2016
Four compliant
reports with
national standards
and regulations of
Dept of Transport
by 30 June 2016
Four compliant
reports with
national standards
and regulations of
Dept of Transport
by 30 June 2016

Intsika Yethu IDP 2014-2015
Page 159
Strategic objective: To ensure compliance to traffic regulations and enhance revenue within IYM
KPA Strategy KPI Baseline indicator Annual target
2015-2016 2016-2017 2017-2018
Licensing By issuing licences to all
road users and vehicles
Number of registered and
licensed motor vehicles,
issued learners and driving
licence(s).
registration and licensing
of motor vehicles, 1375
tested learners , 1264
driving licence in
2014/2015
Registration and
licensing of motor
vehicles, learners
and driving
licence, renewals
of driving licences
and increase
revenue by 8% of
the current
revenue collected
Registration and
licensing of motor
vehicles, learners
and driving
licence, renewals
of driving licences
and increase
revenue by 8% of
the current
revenue collected
Registration and
licensing of motor
vehicles, learners
and driving
licence, renewals
of driving licences
and increase
revenue by 8% of
the current
revenue collected

Intsika Yethu IDP 2014-2015
Page 160
Strategic objective: To provide support to indigent households within IYM
KPA Strategy KPI Baseline indicator Annual target
2015-2016 2016-2017 2017-2018
Indigent households
support
By registration and
verification of indigent
households in all wards
Indigent register Indigent register available
for 2014/2015
6000 indigent
households to be
included in
2015/16 indigent
register.
6 100 indigent
households to be
included in
2016/17 indigent
register.
6300 indigent
households to be
included in
2017/18 indigent
register
By conducting awareness
campaigns to communities
of IYM in all wards
Number of awareness
campaign’s conducted
21 awareness campaigns in
all wards conducted
2014/2015
1 awareness
campaign in each
ward
1 awareness
campaign in each
ward
1 awareness
campaign in each
ward
By reviewing indigent
steering committee in all
wards
Number of steering
committee reviewed and
established
1 Indigent Steering
committee established in
each ward
Reviewal of
indigent steering
committee in all
21 wards by 30
June 2016
Reviewal of
indigent steering
committee in all
21 wards by 30
June 2017
Reviewal of
indigent steering
committee in all
21wards by 30
June 2018
Strategic objective: To ensure provision of waste management services to residences within IYM
KPA Strategy KPI Baseline indicator Annual target

Intsika Yethu IDP 2014-2015
Page 161
2015-2016 2016-2017 2017-2018
Waste Management Strengthening of waste
management cooperation
with community of IYM
Number of households
served and waste bins
provided.
60 waste bins procured
and 1996 household
served on the 2014/205
financial year
Provide 30 waste
bins and clean
daily in order to
have a good
aesthetic town
throughout the
year
Provide 30 waste
bins and clean
daily in order to
have a good
aesthetic town
throughout the
year
Provide 30 waste
bins and clean
daily in order to
have a good
aesthetic town
throughout the
year
Strengthening of waste
management cooperation by
doing awareness campaign
and educational to
community of IYM
Awareness campaigns
conducted and Improved
aesthetic appearance of IYM
communities.
Improved cooperation by
business and communities
of IYM on waste collection
schedule.
Quarterly
awareness
campaigns and
enforcement of
waste
management
bylaw
Quarterly
awareness
campaigns and
enforcement of
waste
management
bylaw
Quarterly
awareness
campaigns and
enforcement of
waste
management
bylaw
Strategic objective: To ensure environmental sustainability in IYM
KPA Strategy KPI Baseline indicator Annual target
2015-2016 2016-2017 2017-20118
Environmental By complying with NEMA Compliant Landfill site and There is compliance with Maintained Maintained Maintained

Intsika Yethu IDP 2014-2015
Page 162
Management (National Environmental
Management Act)
transfer station. Landfill site and transfer
station permits.
Environmental sector plan.
compliance with
landfill site and
transfer station
permits through
reports from
DEDEAT.
compliance with
landfill site and
transfer station
permits through
reports from
DEDEAT.
compliance with
landfill site and
transfer station
permits through
reports from
DEDEAT.
Cemeteries By maintaining cemeteries
according to the
environmental health
standards
Maintained cemeteries
according to environmental
health standards
Cemeteries not maintained
according to the cemetery
norms and standards
Bi monthly
Intensive
cleaning of
cemeteries both
in Tsomo and
Cofimvaba
Bi Monthly
Intensive
cleaning of
cemeteries both
in Tsomo and
Cofimvaba
Bi Month Intensive
cleaning of
cemeteries both in
Tsomo and
Cofimvaba
Strategic objective: To minimise the risk of fires and disaster incidents in all communities of IYM
KPA Strategy KPI Baseline indicator Annual target
2015-2016 2016-2017 2017-2018
Fire fighting and
disaster
management
Provision of fire beaters,
awareness campaign and
revival of fire committees
Provided fire beaters,
awareness campaigns
conducted and revived fire
committees
Ignorance by communities
with regard to fire
prevention.
1 Awareness
campaign
conducted in
each ward by
2015/2016
1 Awareness
campaign
conducted in
each ward by
2016/2017
1 Awareness
campaigns
conducted in each
ward by
2017/2018
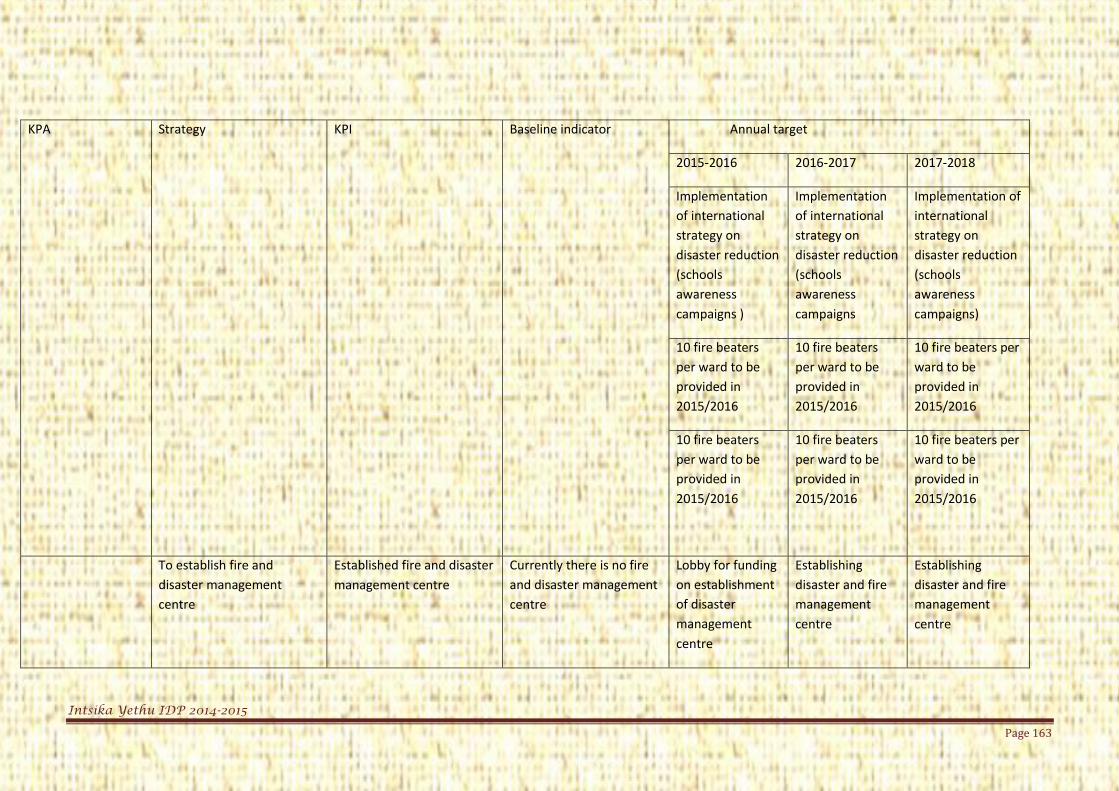
Intsika Yethu IDP 2014-2015
Page 163
KPA Strategy KPI Baseline indicator Annual target
2015-2016 2016-2017 2017-2018
Implementation
of international
strategy on
disaster reduction
(schools
awareness
campaigns )
Implementation
of international
strategy on
disaster reduction
(schools
awareness
campaigns
Implementation of
international
strategy on
disaster reduction
(schools
awareness
campaigns)
10 fire beaters
per ward to be
provided in
2015/2016
10 fire beaters
per ward to be
provided in
2015/2016
10 fire beaters per
ward to be
provided in
2015/2016
10 fire beaters
per ward to be
provided in
2015/2016
10 fire beaters
per ward to be
provided in
2015/2016
10 fire beaters per
ward to be
provided in
2015/2016
To establish fire and
disaster management
centre
Established fire and disaster
management centre
Currently there is no fire
and disaster management
centre
Lobby for funding
on establishment
of disaster
management
centre
Establishing
disaster and fire
management
centre
Establishing
disaster and fire
management
centre
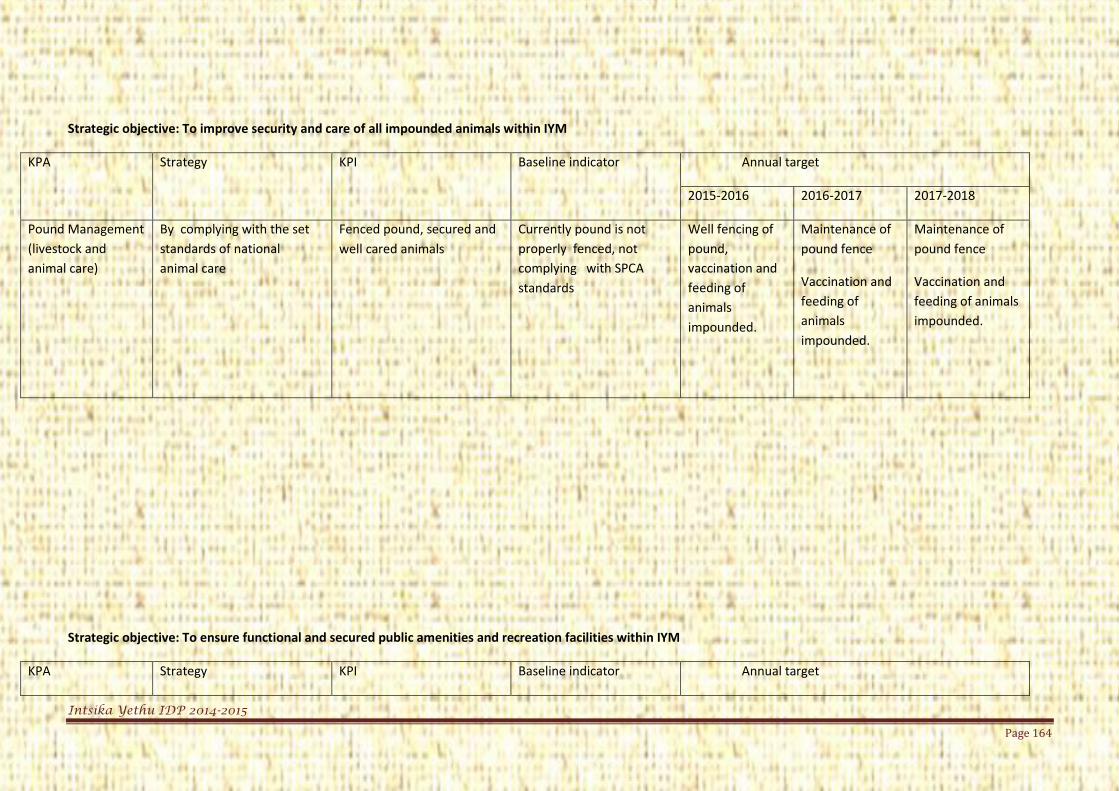
Intsika Yethu IDP 2014-2015
Page 164
Strategic objective: To improve security and care of all impounded animals within IYM
KPA Strategy KPI Baseline indicator Annual target
2015-2016 2016-2017 2017-2018
Pound Management
(livestock and
animal care)
By complying with the set
standards of national
animal care
Fenced pound, secured and
well cared animals
Currently pound is not
properly fenced, not
complying with SPCA
standards
Well fencing of
pound,
vaccination and
feeding of
animals
impounded.
Maintenance of
pound fence
Vaccination and
feeding of
animals
impounded.
Maintenance of
pound fence
Vaccination and
feeding of animals
impounded.
Strategic objective: To ensure functional and secured public amenities and recreation facilities within IYM
KPA Strategy KPI Baseline indicator Annual target

Intsika Yethu IDP 2014-2015
Page 165
2015-2016 2016-2017 2017-2018
Public Amenities By providing access and
security to public amenities.
Improved access and well
secured public amenities.
Improved access to public
amenities and well
established hall
committees
Provide security
and establish
stadium
committees by
30 June 2016
Provide security
by 30 June 2017
Provide security by
30 June 2018
Strategic objective: To provide security for all municipal assets
KPA Strategy KPI Baseline indicator Annual target
2015-2016 2016-2017 2017-2018
Security Services By providing security to all
municipal premises
Security services in all
municipal assets
Limited security services
Development of
security plan.
Appointment of 10
Security
personnel.
Provision of
security system in
Implementation
of security plan
Implementation
of security plan
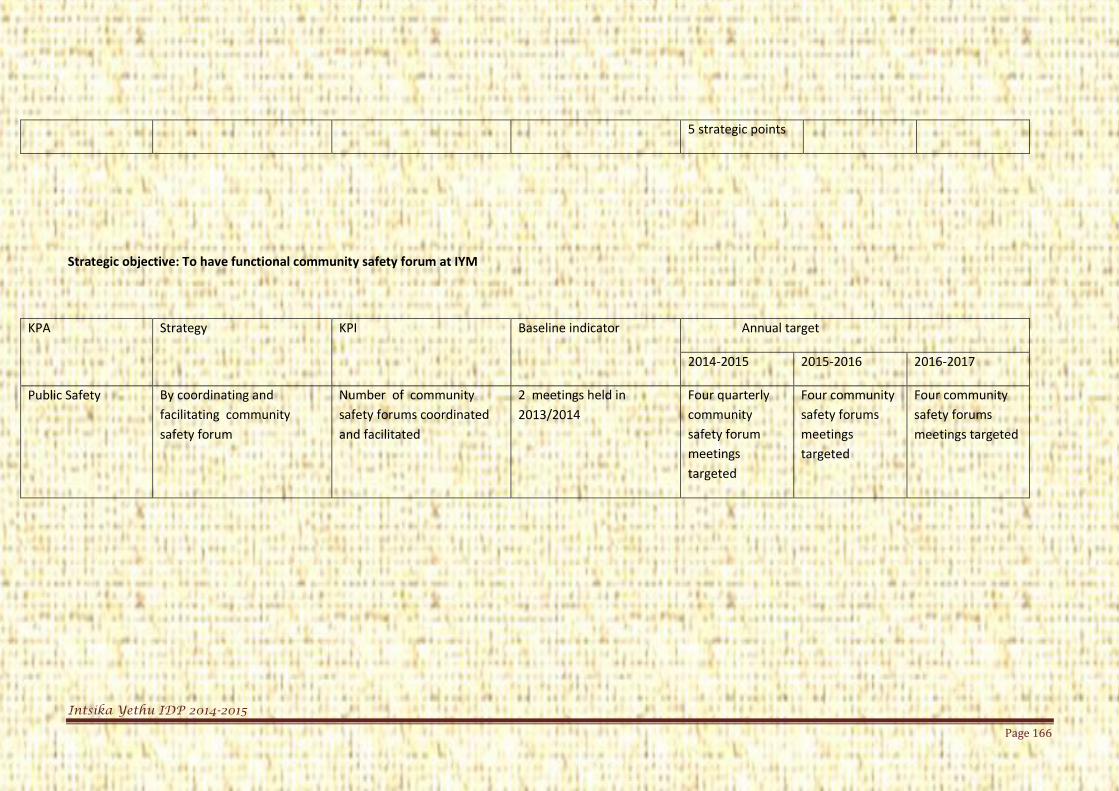
Intsika Yethu IDP 2014-2015
Page 166
5 strategic points
Strategic objective: To have functional community safety forum at IYM
KPA Strategy KPI Baseline indicator Annual target
2014-2015 2015-2016 2016-2017
Public Safety By coordinating and
facilitating community
safety forum
Number of community
safety forums coordinated
and facilitated
2 meetings held in
2013/2014
Four quarterly
community
safety forum
meetings
targeted
Four community
safety forums
meetings
targeted
Four community
safety forums
meetings targeted

Intsika Yethu IDP 2014-2015
Page 167
Basic Service Delivery and Infrastructure development
Cluster: Technical Service Cluster
Strategic Objective: To improve road and transport infrastructure networks within IYM for greater mobility of people, goods and services.
KPA Strategy KPI Baseline indicator Annual target
2015-2016 2016-2017 2017-2018
Road and
Transport
planning
Through our Integrated
transport plan and storm
water management plan
we will construct and
maintain road, transport
and stormwater
infrastructure network by:
- Utilising our in-
house
construction
and maintenance unit.
- External
No of Km’s constructed
18 km’s constructed in
2014//2015 financial
year
Construction of
Ngxwashu access
road (3km) with
associated storm
water drainage
Maintainance of
Ngxwashu access
road and storm
water drainage
Maintainance of
Ngxwashu access
road and storm
water drainage
Construction of
Mthwaku access
road (3km) with
associated storm
water drainage
Maintenance of
Mthwaku access
road and storm
water drainage
Maintenance of
Mthwuku access
road and storm
water drainage

Intsika Yethu IDP 2014-2015
Page 168
KPA Strategy KPI Baseline indicator Annual target
2015-2016 2016-2017 2017-2018
resources
Construction of
Qhumanco access
road (4km) with
associated storm
water drainage
Maintenance of
Qhumanco
access road and
storm water
drainage
Maintainance of
Qhumanco access
road and storm
water drainage
10 km’s constructed in
2014//2015 financial
year
Construction of Forty
to Mawusheni access
road (20km) with
associated storm
water drainage
Maintenance of
Forty to
Mawusheni
access road and
storm water
drainage
Maintenance of
forty to
Mawusheni ccess
road and storm
water drainage
Construction of
Xhume to
Mnyamandawo
access road (11 km)
with associated
storm water
drainage
Maintenance of
Xhume to
Mnyamandawo
access road and
storm water
drainage
Maintenance of
Xhume to
Mnyamandawo
access road and
storm water
drainage
No of km maintained 30 km maintained in
2014/2015
30 km maintained. 30 km
maintained
40 km
maintained.

Intsika Yethu IDP 2014-2015
Page 169
KPA Strategy KPI Baseline indicator Annual target
2015-2016 2016-2017 2017-2018
No of km
constructed(surface/blacktop)
Upgrading of
Cofimvaba streets to
surfaced standards
Preparation of
Business Plan and
Technical report
Upgrading of
Cofimvaba
streets to surface
standards phase
2 By 30th June
2017
Upgrading of
Cofimvaba streets
to surface
standards phase 2
By 30th June 2018
ITP and Stormwater management
plan developed and adopted by
Council
ITP and Stormwater
management plan has
been developed and
adopted by Council in
2014/2015
Reviewal and update
of ITP and
Stormwater
management by 30
June 2016.
Reviewal and
update of ITP and
Stormwater
management
Reviewal and
update of ITP and
Stormwater
management
No. of intermodal facilities that
are prioritised and completed
One intermodal facility
completed (Cofimvaba)
One intermodal
facility to be
completed (Tsomo)
One intermodal
facility to be
completed
Two intermodal
facility to be
completed
Certified vehicle testing station
constructed.
No vehicle testing
station in place
currently
Vehicle testing
station constructed
by June 2016.
Maintenance of
vehicle testing
station
Maintenance of
vehicle testing
station
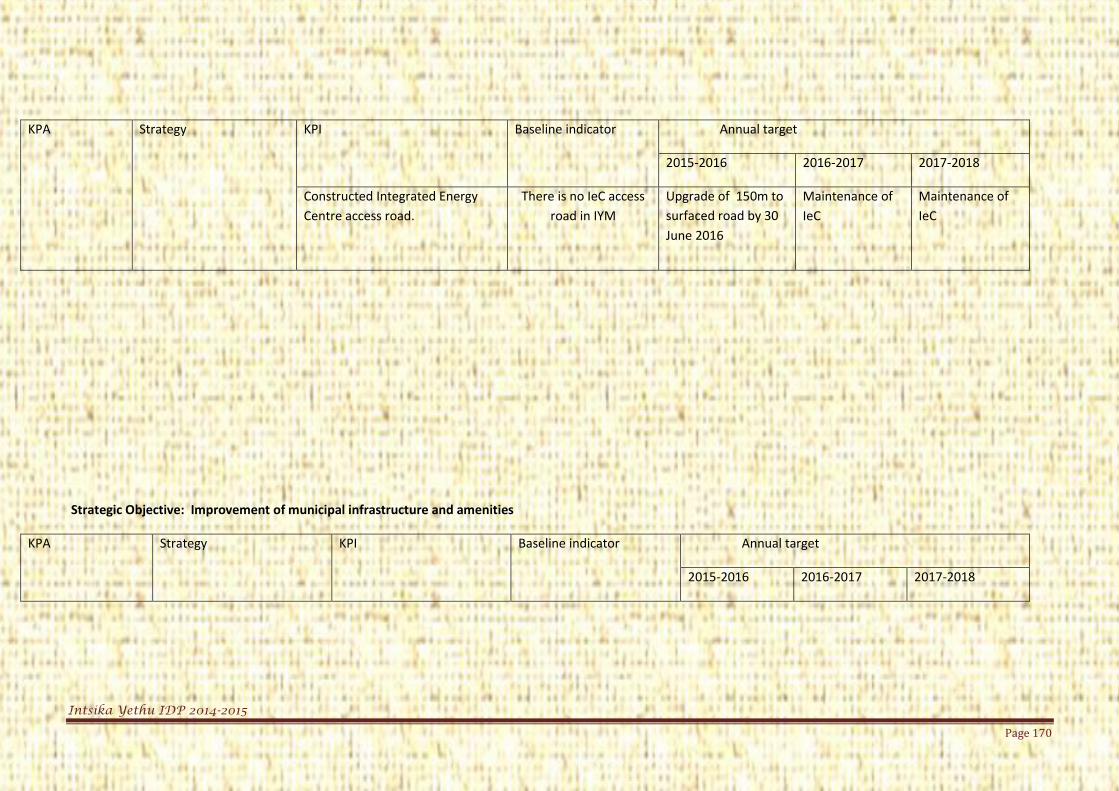
Intsika Yethu IDP 2014-2015
Page 170
KPA Strategy KPI Baseline indicator Annual target
2015-2016 2016-2017 2017-2018
Constructed Integrated Energy
Centre access road.
There is no IeC access
road in IYM
Upgrade of 150m to
surfaced road by 30
June 2016
Maintenance of
IeC
Maintenance of
IeC
Strategic Objective: Improvement of municipal infrastructure and amenities
KPA Strategy KPI Baseline indicator Annual target
2015-2016 2016-2017 2017-2018

Intsika Yethu IDP 2014-2015
Page 171
KPA Strategy KPI Baseline indicator Annual target
2015-2016 2016-2017 2017-2018
Municipal public
works
By utilising our maintenance
plan , we will keep condition
of our infrastructure in
good/acceptable condition
by:
- Utilising our in-house construction and maintenance unit
- External resources - Small towns
development plan
Number of
infrastructure/assets
maintained and constructed
Construction and
Completed Wellness
centre (building)
Construction of
Cofimvaba public
toilets by 30
June 2016.
Construction of
Tsomo public
toilets by 30
June 2017.
Upgrade of Tsomo
sport field, Council
Chambers, Server
room and Registry
will be
No. of infrastructure/assets
maintained and constructed
Planning of 6 additional
Lubisi chalets by 30 June
2015.
Detailed designs
and registration
of the project to
MIG
Actual
construction of
chalets
Chalets
operational
No. of infrastructure/assets
maintained and constructed
One fully functioning land
fill site in Cofimvaba and
one Transfer station
(Tsomo)
Construction of
one cell in
Cofimvaba by
30th June 2016
Maintenance of
landfill site
Maintenance of
landfill site
No. of infrastructure/assets
maintained and constructed
Seven and fifteen high
masts in Tsomo and
Cofimvaba respectively.
Construction of
160 Cofimvaba
street lights
phase 3
Maintenance of
Cofimvaba street
lights
Maintenance of
Cofimvaba street
lights
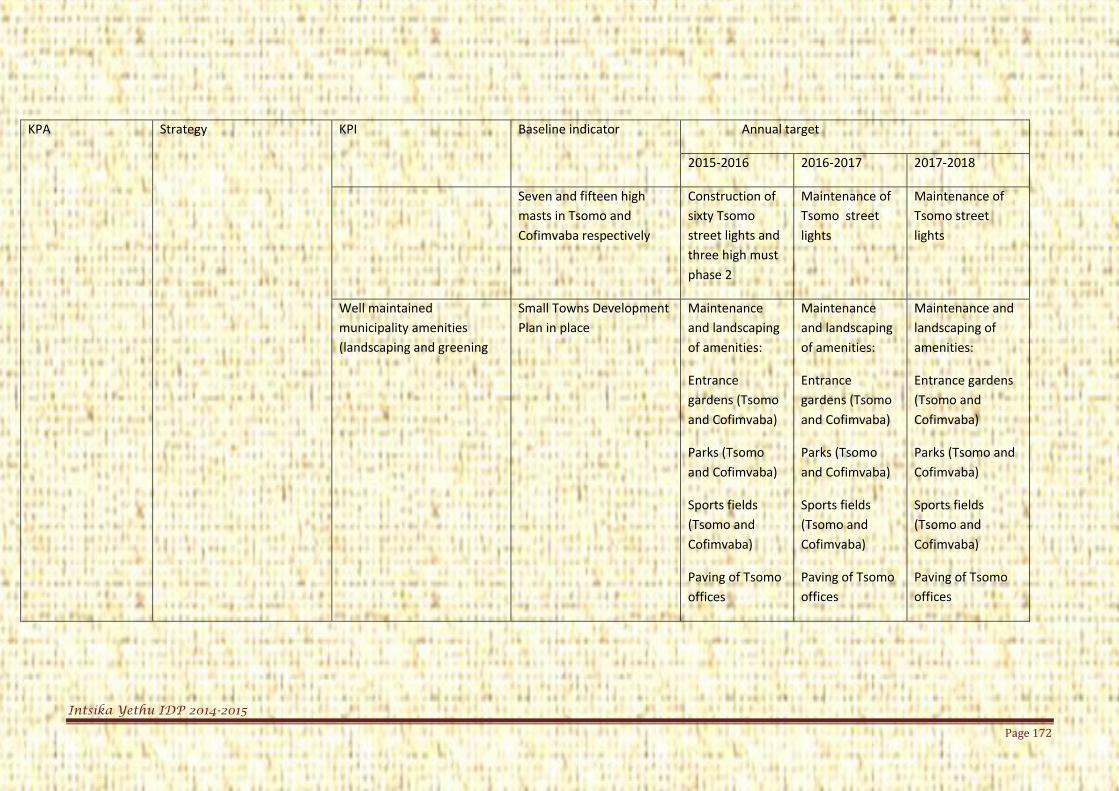
Intsika Yethu IDP 2014-2015
Page 172
KPA Strategy KPI Baseline indicator Annual target
2015-2016 2016-2017 2017-2018
Seven and fifteen high
masts in Tsomo and
Cofimvaba respectively
Construction of
sixty Tsomo
street lights and
three high must
phase 2
Maintenance of
Tsomo street
lights
Maintenance of
Tsomo street
lights
Well maintained
municipality amenities
(landscaping and greening
Small Towns Development
Plan in place
Maintenance
and landscaping
of amenities:
Entrance
gardens (Tsomo
and Cofimvaba)
Parks (Tsomo
and Cofimvaba)
Sports fields
(Tsomo and
Cofimvaba)
Paving of Tsomo
offices
Maintenance
and landscaping
of amenities:
Entrance
gardens (Tsomo
and Cofimvaba)
Parks (Tsomo
and Cofimvaba)
Sports fields
(Tsomo and
Cofimvaba)
Paving of Tsomo
offices
Maintenance and
landscaping of
amenities:
Entrance gardens
(Tsomo and
Cofimvaba)
Parks (Tsomo and
Cofimvaba)
Sports fields
(Tsomo and
Cofimvaba)
Paving of Tsomo
offices

Intsika Yethu IDP 2014-2015
Page 173
Strategic Objective: To achieve integrated land use planning for sustainable human settlements within IYM
KPA Strategy KPI Baseline
indicator
Annual target
2015-2016 2016-2017 2017-2018
Land use
planning,
Building
control and
human
settlements
By utilising our SDF,Housing
sector plan ,Small towns
Development Plan and
building control bylaws we will
establish and Guide:
- Building control - Mixed use
settlements(townships)
- Guidance of land use plans
- Beneficiary Admin - SPLUMA
No. of formalised
settlements.
Thabo village
township, infill
applications
were
established in
2013/14
Formalisation of the
following townships:
- Mandela View - Section C - Extension 4 - Nkanini. - Extension of Polly
Township
- Approval of submission to COGTA
- Pegging
Formalisation of the
following townships:
- Mandela View - Section C - Extension 4 - Nkanini. - Extension of
Polly Township
(Approval of township
establishment and
submitting to survey
generals office)
Formalisation of
Ekuphumleni Township,
Re of Erf 186 (Approval of
submissions to COGTA,
Pegging
Formalisation of
Ekuphumleni Township,
section C/ Extension 4
Formalised and
planned
cemeteries in
Cemetery site
has reached its
burial capacity
Formalisation of cemetery
site ( Planning and data
collection)
Formalisation of
cemetery site ( Approval
of environmental studies
New sites functional

Intsika Yethu IDP 2014-2015
Page 174
KPA Strategy KPI Baseline
indicator
Annual target
2015-2016 2016-2017 2017-2018
place
)
Number of
coordinated
meetings with
Department of
Human
Settlements in all
IYM Projects
Four meetings
coordinated in
2014/15
Facilitating 4 sessions (1per
quarter ) for the
establishment of following
housing project(s) at
- Nyanisweni Ext 500
(Erf 186)
- Magwala
- Mandela View
- Nkanini
- 340
destitute/emergen
cy
- Lubisi 1000
- Ntsongeni 130
- Vuyisile 1000
- Chris Hani 1000
- Joe Slovo 150
- Nyanisweni 150
- Tsomo Ext 2 (262)
Facilitating 4 sessions
(1per quarter ) for the
establishment of the
following housing
projects at Nyanisweni
Ext 500 (Erf 186)
- Magwala
- Mandela View
- Nkanini
- 170 destitute
- 170 emergency
- Lubisi 1000
- Ntsongeni 130
- Vuyisile 1000
- Chris Hani 1000
- Joe Slovo 150
- Nyanisweni 150
- Tsomo Ext 2
(262)
- Tsomo Ext 4(700)
Facilitating 4 sessions
(1per quarter ) for the
establishment of the
following housing
project at Nyanisweni Ext
500 (Erf 186)
- Magwala
- Mandela View
- Nkanini
- 170 destitute
- 170 emergency
- Lubisi 1000
- Ntsongeni 130
- Vuyisile 1000
- Chris Hani 1000
- Joe Slovo 150
- Nyanisweni 150
- Tsomo Ext 2
(262)
- Tsomo Ext 4(700)
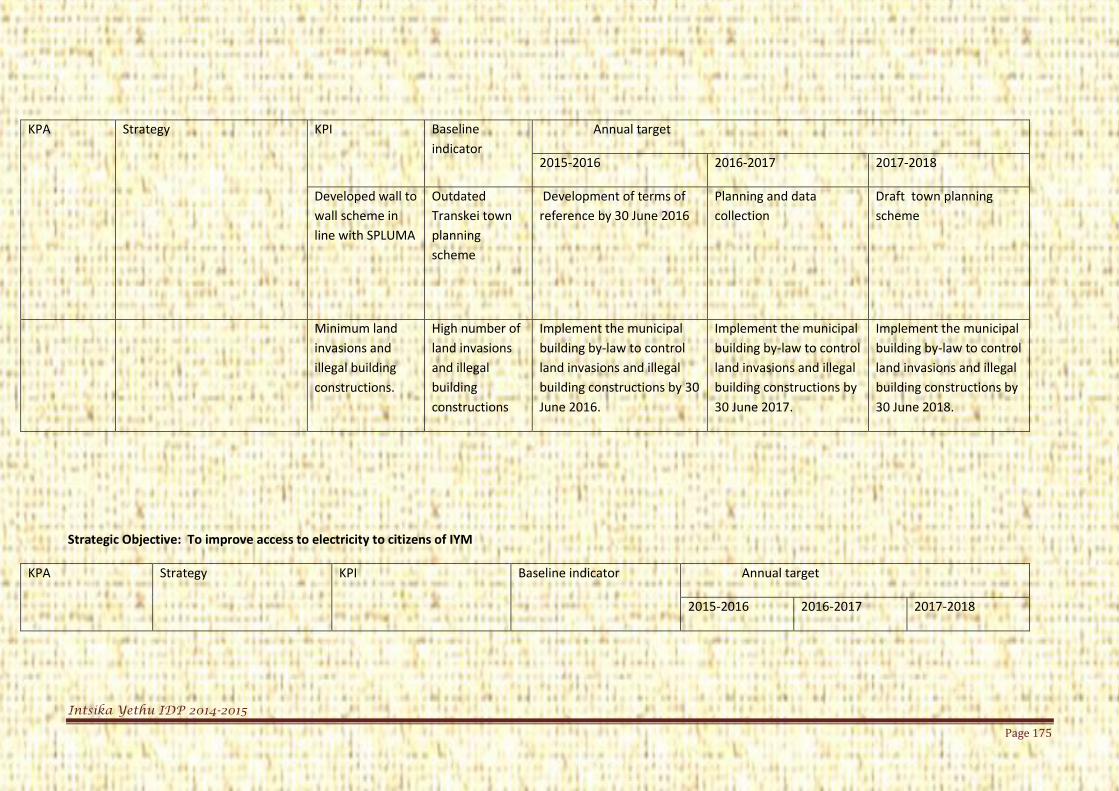
Intsika Yethu IDP 2014-2015
Page 175
KPA Strategy KPI Baseline
indicator
Annual target
2015-2016 2016-2017 2017-2018
Developed wall to
wall scheme in
line with SPLUMA
Outdated
Transkei town
planning
scheme
Development of terms of
reference by 30 June 2016
Planning and data
collection
Draft town planning
scheme
Minimum land
invasions and
illegal building
constructions.
High number of
land invasions
and illegal
building
constructions
Implement the municipal
building by-law to control
land invasions and illegal
building constructions by 30
June 2016.
Implement the municipal
building by-law to control
land invasions and illegal
building constructions by
30 June 2017.
Implement the municipal
building by-law to control
land invasions and illegal
building constructions by
30 June 2018.
Strategic Objective: To improve access to electricity to citizens of IYM
KPA Strategy KPI Baseline indicator Annual target
2015-2016 2016-2017 2017-2018
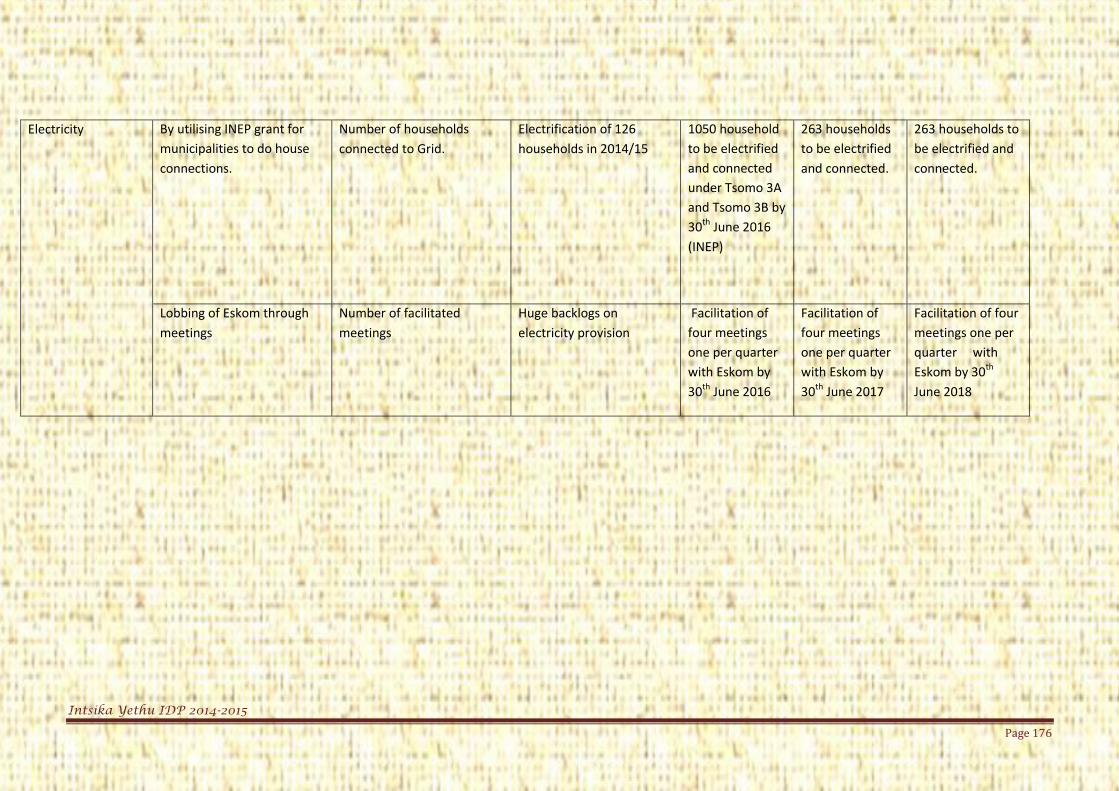
Intsika Yethu IDP 2014-2015
Page 176
Electricity By utilising INEP grant for
municipalities to do house
connections.
Number of households
connected to Grid.
Electrification of 126
households in 2014/15
1050 household
to be electrified
and connected
under Tsomo 3A
and Tsomo 3B by
30th June 2016
(INEP)
263 households
to be electrified
and connected.
263 households to
be electrified and
connected.
Lobbing of Eskom through
meetings
Number of facilitated
meetings
Huge backlogs on
electricity provision
Facilitation of
four meetings
one per quarter
with Eskom by
30th June 2016
Facilitation of
four meetings
one per quarter
with Eskom by
30th June 2017
Facilitation of four
meetings one per
quarter with
Eskom by 30th
June 2018

Intsika Yethu IDP 2014-2015
Page 177
KPA 1: Local Economic Development
Cluster: Economic Development and Planning
Strategic Objective: To resuscitate primary agricultural production and unlock the latent potential in IYM.
KPA Strategy KPI Baseline indicator Annual target
2015-2016 2016-2017 2017-2018
Agricultural
Development
By providing much needed
support for primary crop
production and livestock
improvement to identified
communities within IYM.
Number of hectares planted. 512 hectares planted in
2014/2015
300 hectares to
be planted.
500 hectares to
be plant.
550 hectares to be
plant.
Constructed shearing shed
One shearing shed
constructed in 2014/2015.
Construct two
shearing sheds
by 30 June 2016.
To construct
three shearing
sheds in 2016/17
To construct four
shearing sheds in
2017/18
Constructed dipping tank Constructed one dipping
tank in 2010/11
Construct one
dipping tank by
30 June 2016
To construct two
dipping tanks in
2016/17
financial year
To constructed
three dipping
tanks in 2017/18
financial year
Refurbished dipping tanks Three dipping tanks were
refurbished in 2010/11
financial year
Refurbish two
dipping tanks by
30 June 2016
Refurbish three
dipping tanks in
2016/17
financial year.
Refurbish four
dipping tanks in
2017/18 financial
year.

Intsika Yethu IDP 2014-2015
Page 178
Consistent cattle intakes into
the custom feeding pens
175 cattle were taken in at
Gxwalubomvu and Ncora
custom feeding for the
2014/2015 financial year
Two operating
custom feeding
projects with
animals all the
year round.
Two operating
custom feeding
projects with
animals all the
year round.
Two operating
custom feeding
projects with
animals all the
year round.
Strategic Objective: To assist formal and informal businesses involved in job creation activities and value - addition within IYM
KPA Strategy KPI Baseline indicator Annual target
2015-2016 2016-2017 2017-2018

Intsika Yethu IDP 2014-2015
Page 179
KPA Strategy KPI Baseline indicator Annual target
2015-2016 2016-2017 2017-2018
SMME Development By providing support to our
SMMEs in the form of:
workshops, training and
working capital.
Number of trainings,
workshops and working capital
provided.
Two workshop and three
trainings were held in
2014/2015
Two
workshops and
two training
targeted for
formal/inform
al businesses
by 30 June
2016.
At least four
trainings and
two workshops
targeted for the
year2017
At least four
trainings and two
workshops
targeted for the
year 2018
No. of businesses supported
No SMME supported with
working capital,.
Two SMME‘s
targeted for in
the 2015/2016
financial year.
At least three
informal
businesses
targeted with
working capital.
At least three
informal
businesses
targeted with
working capital.
By developing and
regulating operations of
formal and informal
businesses in IYM
Regulated and coordinated
formal and Informal
businesses
Un- coordinated and
unregulated informal
traders within the
municipality
To have
regulated and
coordinated
formal and
To have regulated and coordinated formal and informal trading
To have regulated
and coordinated
formal and
informal trading

Intsika Yethu IDP 2014-2015
Page 180
KPA Strategy KPI Baseline indicator Annual target
2015-2016 2016-2017 2017-2018
informal
trading by 30
June 2016
by 30 June 2017 by 30 June 2018
By developing credible
business plans with an aim
of lobbying for funds.
Number of business plans developed.
No credible ready-made
business plans at IYM
Develop at
least three
business plans
to source
funds by 30
June 2016
Develop at least
four business
plan to source
funds by 30 June
2017
Develop at least
five business plan
to source funds by
30 June 2018
By strengthening and
capacitating business
associations/fora in IYM.
Provided capacity building
programmes to business
associations/ fora
IYM business structures
not fully capacitated.
Two capacity
building
workshops
targeted for
organised
business
structures by
30 June 2015
Three capacity
building
workshops for
business
structures by 30
June 2016
Four capacity
building
workshops for
business
structures by 30
June 2017

Intsika Yethu IDP 2014-2015
Page 181
Strategic Objective: To market culture, heritage and develop tourism at IYM
KPA Strategy KPI Baseline indicator Annual target
2015-2016 2016-2017 2017-2018
Tourism and
heritage
development
By marketing culture and
heritage tourism products of
IYM.
Number of events /shows
attended and hosted to
market, culture and
heritage tourism products
Attended two tourism
marketing shows and
hosted 1 event in 2014/15
to showcase our products
Attend atleast
two marketing/
trade shows to
showcase our
products.
Source funds for
the tourism and
heritage.
Source funds for
the tourism and
heritage products.
By supporting LTO as well as
tourism businesses.
Supported LTO structure and
tourism businesses
We linked members of the
LTO i.e. crafter with Tsomo
High and Cofimvaba
Outfitter as potential
market in 2014/2015.
Three tourism
businesses
targeted for
support with
working capital
in 2015/16.
Attend at least
three marketing/
trade shows
Source funding
for the
implementation
of business plan.
Attend at least
three marketing/
trade shows
Source funding for
the
implementation of
business plan

Intsika Yethu IDP 2014-2015
Page 182
Strategic Objective: Growth and development of Egg and vegetable production enterprises in IYM
KPA Strategy KPI Baseline indicator Annual target
2014-2015 2015-2016 2016-2017
Income
Generating
Enterprise
By providing support to Egg
and vegetable producing
projects
Supplied feed , layers, inputs
(seedlings and fertilizer) and
medicine
2 projects supplied with
feed , layers and medicine
Two projects to
be supported
with feed, layers,
and trays in
2015/16
financial year
Source funding
for the
extension of the
layer structures
Source funding for
the extension of
the layer
structures
Support one
vegetable
projects with
seedlings and
production
inputs.
Support at least
two vegetable
project with
inputs
Support at least
three vegetable
project with inputs

Intsika Yethu IDP 2014-2015
Page 183
KPA Strategy KPI Baseline indicator Annual target
2014-2015 2015-2016 2016-2017
Support at least
three projects
with Feed and
medicine
Support at least
four Egg projects
with Feed and
medicine
Strategic Objective: To facilitate creation of job opportunities within IYM
KPA Strategy KPI Baseline indicator Annual target
2015-2016 2016-2017 2017-2018
Job creation
By lobbing funding for job
creation programmes
through CWP and EPWP
programmes
Facilitated funding and
number of jobs created.
1342 jobs created in both
EPWP and CWP 2014/15
Facilitate
creation of at
least 1000 jobs
through CWP
and EPWP
programmes.
1600 jobs to be
created
1800 jobs to be
created
Strategic Objective: To develop a credible IDP and SDBIP in IYM

Intsika Yethu IDP 2014-2015
Page 184
KPA Strategy KPI Baseline indicator Annual target
2015-2016 2016-2017 2017-2018
Municipal
Planning ( IDP
& SDBIP)
By reviewing, updating and
ensuring compliance of IDP
and SDBIP with statutory
requirements.
Reviewed and adopted IDP
and SDBIP within the
legislated time.
IDP and SDBIP are
reviewed annually
according to legislation
Credible IDP with
the high rating
and credible
SDBIP for
2015/16
financial year
Credible IDP with
the high rating
and credible
SDBIP for
2016/17
financial year
Credible IDP with
the high rating and
credible SDBIP for
2017/18 financial
year

Intsika Yethu IDP 2014-2015
Page 185
Projects and Programmes
The projects and programmes provided below are planned initiatives that will be undertaken within the municipal area within the MTEF. They represent the
vehicles which will drive the progress towards those service delivery targets set in the previous section, as well as give a clear indication of which Provincial
Departments plan to implement programmes or projects within the area. Financial allocations and budgets for the MTEF are provided for those projects that
have been prioritised and identified for IYLM.
KPA 1: Municipal Transformation and Organisational Development:
Corporate services
KPA Programme/Project description Ward Source of funding Funding years
2015-2016 2016-2017 2017-2018
Skills development Training expenses Equitable share R 350 000.00 R 378 000.00 R 415 800.00
Interns training and CPMD Programme
FMG R516 245.80 R546 704.30 R 576 773.04
Staff Well being Occupational Health & Safety Programme (OHS)
Equitable share R327 000.00 R346 293.00 R365 339.12
Employee Assistance Programme (EAP)
Equitable Share R 218 000.00 R230 862.00 R243 559.41
Fleet Management Motor Vehicle monitoring Equitable Share R216 157.50 R228 910.80 R241 500.89
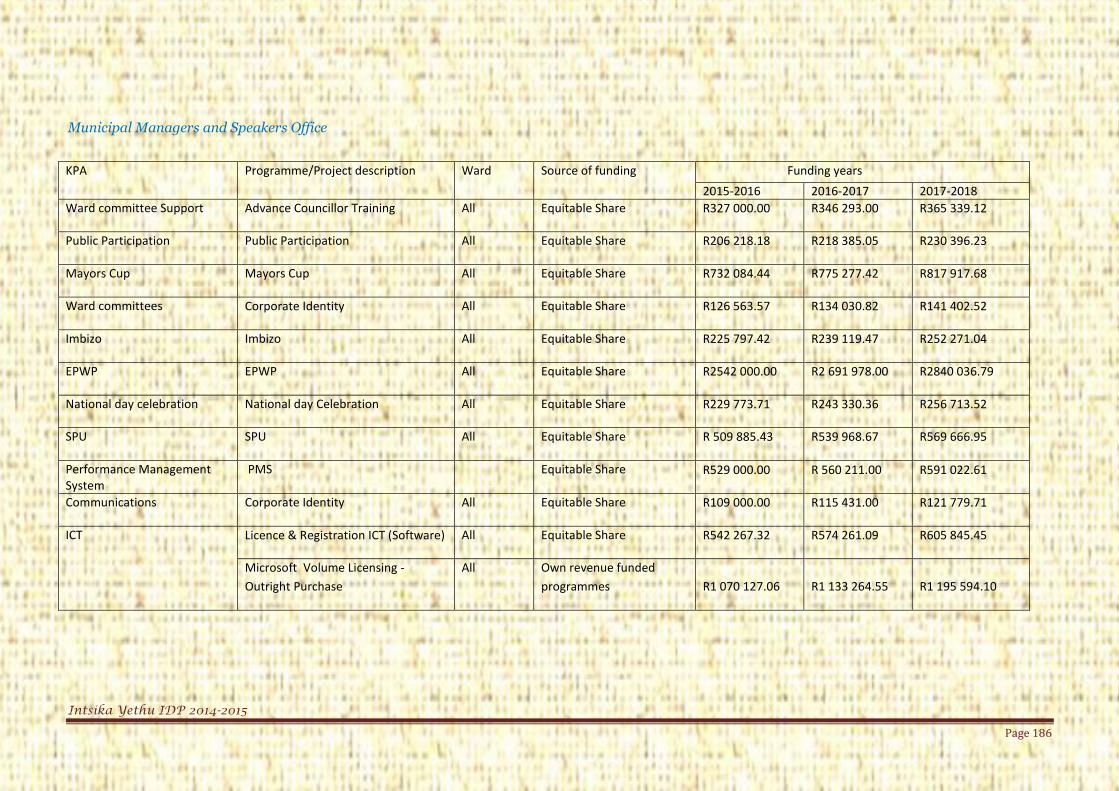
Intsika Yethu IDP 2014-2015
Page 186
Municipal Managers and Speakers Office
KPA Programme/Project description Ward Source of funding Funding years
2015-2016 2016-2017 2017-2018
Ward committee Support Advance Councillor Training All Equitable Share R327 000.00 R346 293.00 R365 339.12
Public Participation Public Participation All Equitable Share R206 218.18 R218 385.05 R230 396.23
Mayors Cup Mayors Cup All Equitable Share R732 084.44 R775 277.42 R817 917.68
Ward committees Corporate Identity All Equitable Share R126 563.57 R134 030.82 R141 402.52
Imbizo Imbizo All Equitable Share R225 797.42 R239 119.47 R252 271.04
EPWP EPWP All Equitable Share R2542 000.00 R2 691 978.00 R2840 036.79
National day celebration National day Celebration All Equitable Share R229 773.71 R243 330.36 R256 713.52
SPU SPU All Equitable Share R 509 885.43 R539 968.67 R569 666.95
Performance Management System
PMS Equitable Share R529 000.00 R 560 211.00 R591 022.61
Communications Corporate Identity All Equitable Share R109 000.00 R115 431.00 R121 779.71
ICT Licence & Registration ICT (Software) All Equitable Share R542 267.32 R574 261.09 R605 845.45
Microsoft Volume Licensing -
Outright Purchase
All Own revenue funded
programmes R1 070 127.06 R1 133 264.55 R1 195 594.10

Intsika Yethu IDP 2014-2015
Page 187
KPA 2: Basic Services and Infrastructure
KPA Programme/Project description Ward Source of funding Funding years
2015-2016 2016-2017 2017-2018
Electricity Jwayi INEP R4 081 000.00 R21 180 000.00 R22 344 900.00
Sodom INEP R4 331 250.00
Ncatsheni INEP R2 887 500.00
Ntwashini INEP R5 409 250.00
Besi INEP R1 713 250.00
Ntabeni INEP R1 577 750.00
MCAMBALALA/BHOLOTWA 2a 15/16
ESKOM R 9 000 000 .00 R 10 260 000 .00
Cofimvaba Extension 15/16 ESKOM R 8 800 000 .00 R 10 032 000 .00
MCAMBALALA/BHOLOTWA Ph B 15/16
ESKOM R 4 000 000 .00 R 4 560 000 .00
Tsomo Rural Extensions ESKOM R 3 600 000 .00 R 4 104 000 .00
Cofimvaba Type1; 2 & 3 Infills ESKOM R 3 775 000 .00 R 4 303 500 .00
Cofimvaba Extension 15/16 Link Line ESKOM R 2 500 000 .00 R 2 850 000 .00
MCAMBALALA/BHOLOTWA 2a 15/16 Link Line
ESKOM R 2 200 000.00 R 2 508 000 .00
Road and Transport Planning (MIG Committed Projects) Fourty to Mawusheni Access Road
MIG R1 180 000.00 R1 249 620.00 R1 318 349.10
Ngqwura to Zwelixolie Access Road MIG R 1 770 000.00 R1 874 430.00 R1 977 523.65

Intsika Yethu IDP 2014-2015
Page 188
KPA Programme/Project description Ward Source of funding Funding years
2015-2016 2016-2017 2017-2018
Mtwaku Access Road MIG R1 770 000.00 R1 874 430.00 R1 977 523.65
Ngxwashu Access Road MIG R1 770 000.00 R1 874 430.00 R1 977 523.65
Qumanco Access Road
MIG R1 910 000.00 R 2 022 690.00 R2 133 937.95
Xume to Nobhokwe Access Road MIG R1 770 000.00 R1 874 430.00 R1 977 523.65
Upgrading gravel to surface (Tsomo Road and Storm water
MIG R4 471 085.26 R 4 734 879.29 R4 995 297.65
Traffic Testing station MIG R12 626 875.04 R13 371 860.67 R14 107 313.00
Cofimvaba Lighting &High Mast
phase 3
MIG
R7 812 953.70 R8 273 917.97 R8 728 983.46
Tsomo street lights& high Mast Phase 2
MIG R 5 032 986.00 R5 329 932.17 R5 623 078.44
Lubisi Development centre chalets 20 Own revenue funded programmes
R1 635 000.00 R1 731 465.00 R1 826 695.58
Qamata IEC Equitable Share R 1 700 000.00 R1 800 300.00 R1 899 316.50
Road Maintenance (Routen) Equitable Share R3 276 500.00 R3 469 813.50 R3 660 653.24
Landfill (Construction of a Cell) Equitable Share R1 122 700.00 R 1 188 939.30 R1 254 330.96
PMU MIG R2 018 100.00 R2 137 167.90 R2 254 712.13
Land use planning and human settlements
Town Planning and Land Use/ Land Survey
Equitable Share R848 982.37 R 899 072.33 R948 521.31

Intsika Yethu IDP 2014-2015
Page 189
Cleanest Town and Small town Revitalisation
DEDEA R1m
Human Settlement Tsomo Ext 2(263) 8 Human Settlement R450 000.00
Chris Hani Heritage 1000 Human Settlement R7 800 000.00
Ntsongeni 130 rural Human Settlement R1 250 000.00
Lubisi 1000 Human Settlement R2 140 000.00
Cofimvaba Sewer (Bulk line and treat works)
Cofimvaba – Water Ratification Phase 2
15 CHDM R500 000.00 R2 000 000.00 R2 000 000.00
Sanitation 8 CHDM R3 000 000.00 R5 000 000.00 R5 000 000.00
Sanitation 3 CHDM R3 500 000.00 R7 000 000.00 R7 000 000.00
Phase3 7 CHDM - R7 000 000.00 R7 000 000.00
Phase 3 1 CHDM - R5000 000.00 R5 000 000.00
Phase 3 2 CHDM - R2 000 000.00 R2 000 000.00
Qamata water Project (877) CHDM R14 831 999.80 R1000 000 00 R1 590 117.33
Intsika Yethu Sanitation- Amanzabantu
CHDM R4 000 000.00 R2 000.000.00 R2 000 000.00
Cofimvaba Water reticulation CHDM R5 000 000 .00 - -
Cluster 8 Sanitation( Wards 15,16,17,18,19)
CHDM R7 000 000.00 R12 000.000.00 R12 000 000.00
Cluster 4Ncora Zone A Village CHDM R12 000 0000 R1 590 117.33 -
Cluster 9 water backlog (ward 13) CHDM R88 000 000.00 R90 000 000.00 -

Intsika Yethu IDP 2014-2015
Page 190
Cluster 4 Water Backlog CHDM R65 000 000.00 R58 000 000.00
Basic Services and Infrastructure (Social Needs Cluster)
KPA Programme/Project description Ward Source of funding Funding years
2015-2016 2016-2017 2017-2018
Indigent households support Free Basic services Equitable Share R4 680 000.00 R4 956 120.00 R5 228 706.60
Department of Social Development KPA Programme/Project description Ward Source of funding Funding years
2015-2016 2016-2017 2017-2018
Community development Household Food Gardens (Zidulini) Ward 09 DoS R125 000
Diphini Ward 16 DoS R100 000
Community Nutrition Dev. Centre (Maqwathini)
Ward 19 DoS R116 000
Department of Health Infrastructure KPA Programme/Project description Ward Source of funding Funding years
2015-2016 2016-2017 2017-2018
Department of Health Sikhoba Clinic Replacement DoH R100 000.00

Intsika Yethu IDP 2014-2015
Page 191
KPA 3: Local Economic Development
Local Economic Development and planning KPA Programme/Project description Ward Source of funding Funding years
2015-2016 2016-2017 2017-2018
Agricultural Development (Livestock Improvement Programme)
Sheep Shearing Shed Equitable Share R 1 900 000.00 R 2 012 100.00 R2 122 765.50
Dry land crop production Equitable Share R2 000 000.00 R2118 000.00 R2234 490.00
Construction of dipping tanks Equitable Share R850 000.00 R900 150 .00 R949 658.25
Custom feeding programme Equitable Share R886 672.73 R938 986. 42 R990 630.62
Refurbishment of Dipping tanks Equitable Share R271 200.63 R287 201.00 R302 997.58
SMME Development SMME Support Initiates All Equitable Share R141 700.00 R150 060.30 R158 313.62
Income Generating Enterprise
Intsika Yethu Egg Producers All Equitable Share R163 500.00 R173 146.50 R182 669.56
Business Management Business Plan Development Equitable Share R545 000.00 R 577 155.00 R608 898.53
Tourism & Heritage development
Tourism development and Marketing
All Equitable share
IDP/ SDBIP IDP Documents Equitable Share R104 478.09 R110 642.30 R116 727.63
Qamata Feed Mill Rural Industries CHDM R30 000 000.00
Ulibo Primary Co- operative Fencing CHDM R350 000.00
Lulwando Co- operative Fencing Poultry structure CHDM R500 000.00
Ndisalinga Co-operative Fencing CHDM R300 00.00
Kwakhanya Co-operative Fencing CHDM R280 000.00
Laphuma Langa Sawmill Storage shed, operational factory facility
R1 500.000.00

Intsika Yethu IDP 2014-2015
Page 192
KPA Programme/Project description Ward Source of funding Funding years
2015-2016 2016-2017 2017-2018
Fallow Field Multi- Purpose Fencing of arable land R1000 000.00
Infrustructrue 6 Dipping Tanks Renovations DRDAR R390 000.00
Eastern Cape Department of Rural Development and Agrarian Reform
KPA Programme/Project name and description: CASP
Ward Source of funding Funding years
2015-2016 2016-2017 2017-2018
Siyazondla Dry land production 7 DRDAR R3200.00
Dry land production 16 DRDAR R3200.00
Dry land production 13 DRDAR R3200.00
Dry land production 16 DRDAR R3200.00
Dry land production 10 DRDAR R3200.00
Dry land production 6 DRDAR R3200.00
Dry land production 7 DRDAR R3200.00
Dry land production 13 DRDAR R3200.00
Dry land production 6 DRDAR R3200.00
Dry land production 16 DRDAR R3200.00
Dry land production 18 DRDAR R3200.00
Dry land production 16 DRDAR R3200.00
Dry land production 13 DRDAR R3200.00
Dry land production 8 DRDAR R3200.00
Dry land production 13 DRDAR R3200.00
Dry land production 10 DRDAR R3200.00
Dry land production 16 DRDAR R3200.00
Dry land production 8 DRDAR R3200.00
Dry land production 7 DRDAR R3200.00

Intsika Yethu IDP 2014-2015
Page 193
KPA Programme/Project name and description: CASP
Ward Source of funding Funding years
2015-2016 2016-2017 2017-2018
Dry land production 10 DRDAR R3200.00
Dry land production 13 DRDAR R3200.00
Dry land production 13 DRDAR R3200.00
Dry land production 7 DRDAR R3200.00
Dry land production 16 DRDAR R3200.00
Dry land production 16 DRDAR R3200.00
Dry land production 21 DRDAR R3200.00
Dry land production 21 DRDAR R3200.00
Dry land production 1 DRDAR R3200.00
Dry land production 1 DRDAR R3200.00
Dry land production 12 DRDAR R3200.00
Dry land production 12 DRDAR R3200.00
Dry land production 5 DRDAR R3200.00
Dry land production 7 DRDAR R3200.00
Dry land production 7 DRDAR R3200.00
Dry land production 12 DRDAR R3200.00
Dry land production 12 DRDAR R3200.00
Dry land production 11 DRDAR R3200.00
Dry land production 19 DRDAR R3200.00
Dry land production 21 DRDAR R3200.00
Dry land production 12 DRDAR R3200.00
Dry land production 5 DRDAR R3200.00
Dry land production 5 DRDAR R3200.00
Dry land production 5 DRDAR R3200.00
Dry land production 12 DRDAR R3200.00
Irrigation Production 4 DRDAR R3200.00
Irrigation Production 4 DRDAR R3200.00
Irrigation Production 4 DRDAR R3200.00
Irrigation Production 4 DRDAR R3200.00
Irrigation Production 4 DRDAR R3200.00
Irrigation Production 17 DRDAR R3200.00

Intsika Yethu IDP 2014-2015
Page 194
KPA Programme/Project name and description: CASP
Ward Source of funding Funding years
2015-2016 2016-2017 2017-2018
Irrigation Production 17 DRDAR R3200.00
Irrigation Production 17 DRDAR R3200.00
Irrigation Production 17 DRDAR R3200.00
Irrigation Production 18 DRDAR R3200.00
Irrigation Production 18 DRDAR R3200.00
Irrigation Production 18 DRDAR R3200.00

Intsika Yethu IDP 2014-2015
Page 195
6.7 Unfunded Projects and Programmes
The following section provides a breakdown of those proposed projects and their locations currently without
budget allocations or secured funding. Despite the absence of funding, these projects represent an expressed
interest and possible project for inclusion and funding in the outer years of the MTEF.
6.7.1 KPA 1: Municipal Transformation & Organisational Development
KPA: Municipal Transformation & Organisational Development
Dept. Issue Project/Programme Ward/ Locations
Staff
Responsible
IYLM Corporate Services
Performance Management
Cascading of PMS and capacity
building to lower levels (performance
recognition and rewards)
N/A Dir. Corp
Services
Access to information
Development of Master System plan N/A Dir. Corp
Services
Archive centre N/A Dir. Corp
Services
Electronic document management
system
N/A Dir. Corp
Services
Organisational capacity
Job description reviews and job
evaluations
N/A Dir. Corp
Services
Recruitment of staff N/A Dir. Corp
Services
Attraction and retention strategy to
draw diverse staff to IYLM
N/A Dir. Corp
Services
Skills development
Organisational development plan
implementation (training etc.)
N/A Dir. Corp
Services
Skills audit N/A Dir. Corp
Services
Staff well-being
Wellness centre N/A Dir. Corp
Services

Intsika Yethu IDP 2014-2015
Page 196
6.7.2 KPA 2: Basic Services and Infrastructure
KPA: Basic Services and Infrastructure (Technical Cluster)
Dept. Issue Project/Programme Ward/ Locations
Staff
Responsible
IYLM Planning and Infrastructure
Road construction submissions
Upgrading Gravel Roads to Surface Nyanisweni and Nyanisweni
Ext; Ext 2; Polly; Thabo
Village; Ext 1; Tsomo Ext 2;
Mzomhle Bridge; Tsomo
Town; Main Street to Landfill
Site (Cofimvaba); Tsomo
Internal Facilities; Bholility
Access Road/Bridge; From
40 to Mawusheni; Mthwaku
Bridge; Rehabilitation of
Stormwater Infrastructure;
Mdlokolo to Sijugongolweni
Dir. Plan. &
Infra.
Building Control and Municipal Public Works
Tsomo Offices N/A Dir. Plan. &
Infra.
Paving of Urban Centres N/A Dir. Plan. &
Infra.
Restoration of Cofimvaba Community
Hall
N/A Dir. Plan. &
Infra.
Provision of Community Halls N/A Dir. Plan. &
Infra.
St. Marks Community Lighting N/A Dir. Plan. &
Infra.
Housing and Estate
Nyanisweni Extension Lighting N/A Dir. Plan. &
Infra.
Thabo Village Community Lighting N/A Dir. Plan. &
Infra.
Street Lights along R61 (Traffic Dep
to Town)
N/A Dir. Plan. &
Infra.
IYLM Municipal Manager's Office
Customer care and satisfaction
Customer care survey (asses the
satisfaction of the customers)
N/A MM & Dir.
Corp Services

Intsika Yethu IDP 2014-2015
Page 197
KPA: Basic Services and Infrastructure (Technical Cluster)
Dept. Issue Project/Programme Ward/ Locations
Staff
Responsible
Nyanisweni Extension and
Nyanisweni
N/A Dir. Plan. &
Infra.
Joe Slovo N/A Dir. Plan. &
Infra.
Ext 7 (Cofimvaba) N/A Dir. Plan. &
Infra.
Land Fill Site N/A Dir. Plan. &
Infra.
Ext 4 & Section C N/A Dir. Plan. &
Infra.
Town Planning and Land Use
Rural Housing (Voucher) N/A Dir. Plan. &
Infra.
Rural Housing (Veteran) N/A Dir. Plan. &
Infra.
Planning and Survey Rural Roads N/A Dir. Plan. &
Infra.
Emergency Housing N/A Dir. Plan. &
Infra.
Project Management Unit N/A Dir. Plan. &
Infra.
Water & Sanitation
Ext 4 & Section C (Water & Sewer) N/A Dir. Plan. &
Infra.
Upgrading Sewer Plant (Cofimvaba &
Tsomo)
N/A Dir. Plan. &
Infra.
Nyanisweni Ext Internal Services
(Water & Sewer)
N/A Dir. Plan. &
Infra.
Extension 7 N/A Dir. Plan. &
Infra.
Thabo Village Sewer Reticulation N/A Dir. Plan. &
Infra.
Augmentation of Water & Sewer from
Landfill Site to Water Reticulation
Cofimvaba
N/A Dir. Plan. &
Infra.
Alternative Waterline from Tsjoana to
Cofimvaba Town
N/A Dir. Plan. &
Infra.
Tsomo (Mzomhle Water & Sewer)
Reticulation
N/A Dir. Plan. &
Infra.
Tsomo Ext 2 to Tsomo Town (Bulk
Line)
N/A Dir. Plan. &
Infra.
Rehabilitation of Road to Tsojana
Water Treatment Plant
N/A Dir. Plan. &
Infra.
Surfacing of Raod from Town to
Water Treatment Plant
N/A Dir. Plan. &
Infra.

Intsika Yethu IDP 2014-2015
Page 198
KPA: Basic Services and Infrastructure (Technical Cluster)
Dept. Issue Project/Programme Ward/ Locations
Staff
Responsible
Tshacana Water Scheme N/A Dir. Plan. &
Infra.
Mtingweni Water Scheme N/A Dir. Plan. &
Infra.
Eradication of Backlog Sanitation &
Water
N/A Dir. Plan. &
Infra.
Electrification
Electrification of Wards Ward 3; Ward 9; Ward 11;
Ward 19; Ward 20; Ward 21;
Ward 8; Ward 6; Ward 14
Dir. Plan. &
Infra.
Electrification Extensions All Wards Dir. Plan. &
Infra.
Clinics
Tsomo Town Ward 8 Dir. Plan. &
Infra.
Qwili Ward 11 Dir. Plan. &
Infra.
Mhlahlane Ward 10 Dir. Plan. &
Infra.
Road construction submissions
Ward 1 (6 km) Ngxwashu=3km;
Mmnqweni/Banzi=3km
Dir. Plan. &
Infra.
Ward 2 (11km) Bolokoldlela=4km;
Nomphimgelo to
Mpomvane= 4km; Mr
Samfumfu to Graveyard=
3km
Dir. Plan. &
Infra.
Ward 3 (13km) Mtwaku= 3km;
Bolotwa=5km; Bilatye= 5km
Dir. Plan. &
Infra.
Ward 4 (14km) Ntlonze= 3km; Holi= 11km Dir. Plan. &
Infra.
Ward 5 (30km) Deckets Hills to Cube=8km;
Qamata Basin to
Mampingweni=10km; Jarha
Access Road=12km
Dir. Plan. &
Infra.
Ward 6 (13km) Mbulukweza Clinic to
J.S.S.=3km; Mphathiswa
Shop to Emarahleni= 5km;
Pagel Shop to Mtshanyane
Dir. Plan. &
Infra.
Ward 7 (7km) Lower Qutsa to
Mdenne=3km; Kwebulana
from Tar Road via Clinic to
Kwebulana J.S.S.=3km;
Camama Ceshire Home=1km
Dir. Plan. &
Infra.
Ward 8 (19km) Maduma to Frystad= 16km;
Miya Access Road= 3km
Dir. Plan. &
Infra.

Intsika Yethu IDP 2014-2015
Page 199
KPA: Basic Services and Infrastructure (Technical Cluster)
Dept. Issue Project/Programme Ward/ Locations
Staff
Responsible
Ward 9 (38,5km) Xume to Mobhokwe=
19,5km; Catshile to Diphini=
19km;
Dir. Plan. &
Infra.
Ward 10 (63km) Nomfenazana to
Bolitye=20km; Mnyangule to
Mfihlaneni=20km;
Ngozini=4km; From Tar
Road to Bishop Mboniswa=
19km
Dir. Plan. &
Infra.
Ward 11 (22km) Somawala via Sgubudinini to
Ntabeni=4km' Ndwamkulu
via Khekhe to
Mdibaniso=3km;
Makwababa to Kose=15km
Dir. Plan. &
Infra.
Ward 12 (13km) Ngqwara to Zwelixolile=3km;
Barrini to Kose Bridge=7km;
Ephikweni to Malalane= 3km
Dir. Plan. &
Infra.
Ward 13 (45km) Zicubeni Access Road=4km;
Nkomfeni Access Road=
4km; From forty to
Mawusheni then Branch
Turn-off to Lukhanyisweni
S.S.S.=30km; Hange to
Chiteka= 7km
Dir. Plan. &
Infra.
Ward 14 (7km) Ezintlanti=1km; Polly=3km;
Nyanisweni=3km
Dir. Plan. &
Infra.
Ward 15 (12km) Isikhoba=5km; Cube=4km;
Qolweni=3km
Dir. Plan. &
Infra.
Ward 16 (45km) Ncunguzo S.S.S. &
J.S.S.=3km; Mahlatini Access
Road= 3km; Nqcaza Access
Road=4km; From T255
Tsojana to R61 Qombolo=
30km; Ngonyama= 5km
Dir. Plan. &
Infra.
Ward 17 (13km) Qumanco Access Road=4km;
Sgangeni Access Road=3km;
Matafeni to Ndenna= 6km
Dir. Plan. &
Infra.
Ward 18 (13km) Ndmanambe Access
Road=5km; Lower Neora
Access Road=4km;
Kulongqayi Access
Road=4km
Dir. Plan. &
Infra.
Ward 19 (19km) Mission Access Road=8km;
Dikeni Access Road=6km;
Mnqanqeni Access Road=
5km
Dir. Plan. &
Infra.

Intsika Yethu IDP 2014-2015
Page 200
KPA: Basic Services and Infrastructure (Technical Cluster)
Dept. Issue Project/Programme Ward/ Locations
Staff
Responsible
Ward 20 (16km); Mtetuvumile Access
Road=7km; Lower Seplan to
Emhlonyaneni=5km; Lubisi
to Mampondweni=4km
Dir. Plan. &
Infra.
Ward 21 (55km) Mcambalala Access Road=
15km; Nxelesa to
Mtshanyane= 10km;
Ngxabangu to
Nongqongwana=5km;
Hoyana Access Road=5km
Dir. Plan. &
Infra.
KPA: Basic Services and Infrastructure (Social Needs Cluster)
Dept. Issue Project/Programme Ward/ Locations
Staff
Responsible
IYLM Community Services
Vulnerable Groups
Public-private partnerships N/A Dir. Com
Services
Food Security Projects N/A Dir. Com
Services
Traffic Safety
Traffic Equipment
N/A Dir. Com
Services
Vehicle Pound N/A Dir. Com
Services
Traffic learning centre N/A Dir. Com
Services
Vehicle Testing Centre N/A Dir. Com
Services
By-law development
N/A Dir. Com
Services
Properly marked signs and roads N/A Dir. Com
Services
Waste management
Establish a buy-back centre
N/A Dir. Com
Services
Upgrade waste disposal site
infrastructure
N/A Dir. Com
Services
Waste processing plant
N/A Dir. Com
Services
Environmental management & municipal health

Intsika Yethu IDP 2014-2015
Page 201
KPA: Basic Services and Infrastructure (Social Needs Cluster)
Dept. Issue Project/Programme Ward/ Locations
Staff
Responsible
Regular checks and sampling of
businesses
N/A Dir. Com
Services
SLA with the District
N/A Dir. Com
Services
Fire and Disaster Risk Management
Fire committee capacity building
N/A Dir. Com
Services
Acquire new fire and disaster
resources
N/A Dir. Com
Services
Establishment of a satellite disaster
and fire station
N/A Dir. Com
Services
Public amenities
Community and Sport Committee
briefings and for a
N/A Dir. Com
Services
Upgrade existing halls N/A Dir. Com
Services
ECD Centres N/A Dir. Com
Services
New sports facilities N/A Dir. Com
Services
Upgrade public amenities N/A Dir. Com
Services
Clean and Green Cofimvaba N/A Dir. Com
Services
Public safety
Functional Community Safety
Forums
N/A Dir. Com
Services
Street lighting in urban areas N/A Dir. Com
Services
Fully equiped security and response
unit
N/A Dir. Com
Services
By-law development N/A Dir. Com
Services
Animal care
Outreach N/A Dir. Com
Services
New sites and re-location of existing
Pounds
N/A Dir. Com
Services
Place of safety for stray animals N/A Dir. Com
Services
Eastern Cape Department of Health
Community facilities

Intsika Yethu IDP 2014-2015
Page 202
KPA: Basic Services and Infrastructure (Social Needs Cluster)
Dept. Issue Project/Programme Ward/ Locations
Staff
Responsible
Community Hospitals (2) Ncora & Tsomo N/A
Clinics (3) Mahlubini; Ntshingeni;
Ngxabanyu
N/A
6.7.3 KPA 3: Local Economic Development
KPA: Local Economic Development
IYLM Local Economic Development
Agriculture
Expansion of Nguni Beef Production
Programme
N/A Dir. LED
Goat Improvement Project N/A Dir. LED
Support to poultry and piggery projects
with processing potential
N/A Dir. LED
Feedlot establishments and
marketing/auction pans
N/A Dir. LED
High Value Crop Production
Programmes (at Qamata, Ncora,
Bilatye)
Qamata, Ncor, and Bilatye Dir. LED
Massive Food Production Programmes(
Maize and Sorghum in almost all
wards)
N/A Dir. LED
Intensive Cash Crop Production
Programme under dryland conditions(
e.g Potatoes, Butternuts, Pumpkins,
Beans)
N/A Dir. LED
Establishment of the Fruit
Cluster(Stone Fruit) with processing
and Packaging plants.
N/A Dir. LED

Intsika Yethu IDP 2014-2015
Page 203
KPA: Local Economic Development
Related Value-adding Programmes for
all the aboe i.e Agro-processing plants
(Milling Plants, Wool processing plants,
etc)
N/A Dir. LED
Farmer's Day N/A Dir. LED
Eastern Cape Department of Rural Development and Agrarian Reform
KPA Programme/Project name and description: CASP
Ward Source of funding Staff responsible
Mthingwevu Shearing shed
19 DRDAR Dir LED
Mawusheni Shearing shed
13 DRDAR Dir LED
Nyongwana Shearing shed
5 DRDAR Dir LED
Luthuli Shearing shed 7 DRDAR Dir LED
Mcambalala Shearing shed
20 DRDAR Dir LED
Mhlahlane Shearing shed 10 DRDAR Dir LED
Dlakavu Shearing shed 3 DRDAR Dir LED
Mkwinti Shearing shed 13 DRDAR Dir LED
Singeni Dipping Tank 4 DRDAR Dir LED
Nomadabambe Dipping Tank
18 DRDAR Dir LED
Lubisi Dipping Tank 20 DRDAR Dir LED
Mtshabe Dipping Tank 10 DRDAR Dir LED
Xume Dipping Tank 9 DRDAR Dir LED
Ngudle Dipping Tank 13 DRDAR Dir LED
Crop production
Noncedo Maize Project: Gcibhala
6 DRDAR Dir LED

Intsika Yethu IDP 2014-2015
Page 204
KPA: Local Economic Development
Programme: Siyakhula (Inputs, Mechanisation & Chemicals
Lukhozi Maize Project: Mhlahlane
10 DRDAR Dir LED
Ntlutha Yethu Maize Project: Luthuli
6 DRDAR Dir LED
Mcuncuzo Maize Project: Hoyana
16 DRDAR Dir LED
Nyoka Maize Project: Nyoka
7 DRDAR Dir LED
Mgxobhozweni Maize project: Mgxobhozweni
13 DRDAR Dir LED
Mtyamde Maize Project: Mtyamde
16 DRDAR Dir LED
Qombolo Maize Project: Zanendyebo
7 DRDAR Dir LED
Ngojini Maize Project: Lower Tsojana
10 DRDAR Dir LED
Lower Makhwababa Maize Project: Kwatshatshu
12 DRDAR Dir LED
Nqumakala Maize Project: Nqumakala
18 DRDAR Dir LED
Chamama Maize Project : Chamama
7 DRDAR Dir LED
Ndlangisa Maize Project: Kwandlangisa
7 DRDAR Dir LED
Sgubudu Maize Project: Sgubudu
6 DRDAR Dir LED
Ncora Flats Maize Project: Ncora
17 DRDAR Dir LED
Ndenxa Maize Project: Sigangeni
17 DRDAR Dir LED
Botani Maize Project: Maqomeni
17 DRDAR Dir LED
Emathafeni Maize Project: Kwajumba
17 DRDAR Dir LED
Nongqayi Maize Project: Chotho
18 DRDAR Dir LED
Nomadambi Maize Project : Nomadambe
18 DRDAR Dir LED
Lower Ncora Maize Project: Jojweni
18 DRDAR Dir LED
Damane Maize Project: Damane
18 DRDAR Dir LED
Fameni Maize Project: Fameni
18 DRDAR Dir LED
Ngcacha Maize Project: Ngcacha
18 DRDAR Dir LED
Section 1 Maize Project: 4 DRDAR Dir LED

Intsika Yethu IDP 2014-2015
Page 205
KPA: Local Economic Development
Qamata
Section 2 Maize Project: Qamata
4 DRDAR Dir LED
Section 3Maize Project: Qamata
4 DRDAR Dir LED
Section 4 Maize Project : Qamata
4 DRDAR Dir LED
Section5 Maize Project: Qamata
4 DRDAR Dir LED
SMME and Cooperative Support
SMMEs and Cooperative Information
and Support Programme
N/A Dir. LED
Business Information Centre N/A Dir. LED
Feasibility Study and Development of
an Incubator and/or Local Industrial
Park
N/A Dir. LED
Refurbishment and proper
management of former TRANSIDO
Units
N/A Dir. LED
Develop a Small Mining Support
programme in partnership with DME
N/A Dir. LED
Magwala Development – Retail centre,
Hotel with conference facility and a
filling station.
15/ Magwala AA Dir. LED
Market development for various goods
and services produced at Intsika Yethu.
N/A Dir. LED
Tourism
Tourism information centre N/A Dir. LED
Craft development N/A Dir. LED
Mbulu waterfalls N/A Dir. LED

Intsika Yethu IDP 2014-2015
Page 206
KPA: Local Economic Development
Forestry Development
Dissemination of information to
communities on Forestry Protocols
N/A Dir. LED
Mapping of potential areas and issuing
of licenses to communities
N/A Dir. LED
Facilitate funding and partnerships for
forestry development
N/A Dir. LED
Facilitate transfer of Categories B & C
Plantations
N/A Dir. LED
Development of forestry value adding
activities:
N/A Dir. LED
Charcoal Production N/A Dir. LED
Small scale furniture making ventures N/A Dir. LED
6.7.4 KPA 4: Financial Management and Viability
KPA: Financial Management and Viability
Dept. Issue Project/Programme Ward/ Locations
Staff
Responsible
IYLM Finance
Revenue generation
Lease review N/A CFO
VAT Review N/A CFO
Customer care and service
Data cleansing N/A CFO
Supply Chain Management
Credible Supplier Database N/A CFO
Suppliers Training N/A CFO
Legislative compliance
Review and Document Internal
Controls
N/A CFO
Review of all finance and related
policies for MFMA and GRAP 17
alignment
N/A CFO

Intsika Yethu IDP 2014-2015
Page 207
Development of a procedure manual N/A CFO
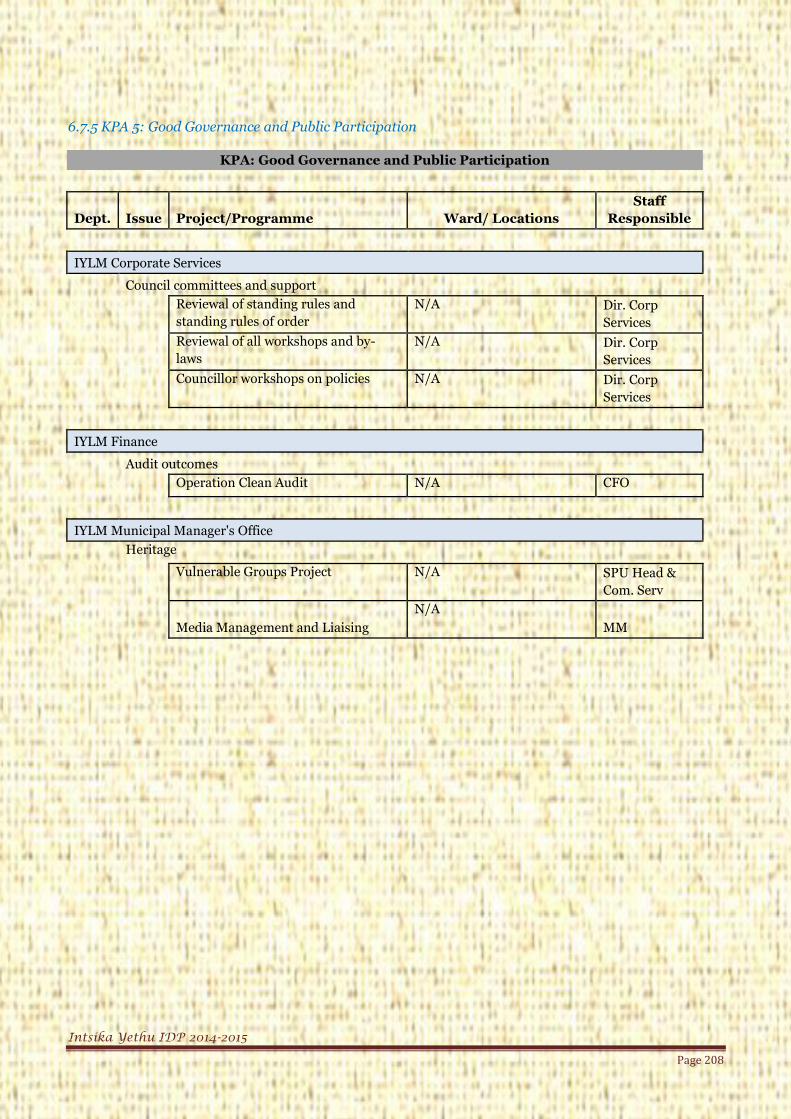
Intsika Yethu IDP 2014-2015
Page 208
6.7.5 KPA 5: Good Governance and Public Participation
KPA: Good Governance and Public Participation
Dept. Issue Project/Programme Ward/ Locations
Staff
Responsible
IYLM Corporate Services
Council committees and support
Reviewal of standing rules and
standing rules of order
N/A Dir. Corp
Services
Reviewal of all workshops and by-
laws
N/A Dir. Corp
Services
Councillor workshops on policies N/A Dir. Corp
Services
IYLM Finance
Audit outcomes
Operation Clean Audit N/A CFO
IYLM Municipal Manager's Office
Heritage
Vulnerable Groups Project N/A SPU Head &
Com. Serv
Media Management and Liaising
N/A
MM

Intsika Yethu IDP 2014-2015
Page 209
Chapter 4: Performance Management System
7. Introduction
According to the Municipal Planning and Performance Management Regulations (2001), a Performance
Management System (PMS):
“entails a framework that describes and represents how the municipality's cycle and processes of
performance planning, monitoring, measurement, review, reporting and improvement will be
conducted, organised and managed, including determining the roles of the different role-players”.
PMS is therefore integral to the realisation of the IDP’s strategic objectives since it elaborates upon the
level of performance that will be required in order for the municipality to reach its objectives. In addition
to this, the PMS also inculcates better performance into the organisation. The practice of using
performance information to identify shortcomings in a municipality’s strategy and doing regular and
continual reporting becomes central to the municipal functioning when done regularly and
comprehensively. A PMS therefore has other positive spin-offs such as promoting a culture of
performance management among the municipality’s office bearers and councillors and in its
administration of affairs in a manner that is economical, efficient, effective and accountable (this
according to Section 38 of the Municipal Systems Act). This chapter seeks to give a broad overview of the
performance management framework currently in place in IYLM.
Some of the issues that will be covered in this chapter include different roles and responsibilities of the
council and the municipal manager in terms of the PMS. The chapter shall also look at the various core
components of the PMS which include institutional performance management framework on the one hand
and individual performance model on the other. The chapter shall also cover key concepts relating to PMS
such as performance indicators and targets and expand on why these concepts are so important to a
comprehensive PMS. Possibly the most important aspect that this chapter will cover will be the link
between PMS and the IDP. This chapter will demonstrate how the PMS in IYLM will help to better realise
the strategic objectives and goals that have been discussed in other chapters of this IDP.
It is important that the reader notes the fact that IYLM has plans to has reviewed its PMS that was
developed in 2008/9. The new PMS is an improvement on the current performance management
framework which emerges from the Performance Management Policy of 2008/09.
Before presenting IYLM performance management framework it is important that the reader gains a sense
of the importance of PMS for all municipalities. This shall be done by briefly giving a legislative
background to PMS which is the foundation upon which performance management within local
government rests.
7.1 Legislative background
The importance of PMS pted legislation making it part and parcel of governance at the local level. The two
main pieces of legislation that shall be presented in this regard are the:
Municipal Systems Act No 32 of 2000; and
The Municipal Planning and Performance Management Regulations of 2001 (Schedule to the MSA).

Intsika Yethu IDP 2014-2015
Page 210
These two pieces of legislation are what informs IYLM performance management framework from which
the new PMS will eventually emerge. Throughout this chapter reference will be made to these two pieces
of legislation in order to motivate IYLM’s stance on PMS. In addition to legislation, IYLM has just
reviewed its Performance Management Policy it adopted in 2008/09 which in itself references the two
aforementioned legislation as a source of opinion.
In accordance with section 38 of the Municipal Systems Act 32 of 2000, “A municipality must establish a
Performance Management System”. Section 39 dictates further that “The executive committee or
executive mayor of a municipality must:
a) Manage the development of the municipality’s Performance Management System;
b) Assign responsibilities in this regard to the municipal manager; and
c) Submit the proposed system to the municipal council for adoption.
In order to monitor its PMS, a municipality should implement a number of activities. The Municipal
Systems Act sets out a number of activities that would assist the municipality in achieving this end. These
activities are referred to as core components and are located in section 49 of the act. Beneath is a summary
of these core components.
IYLM is expected to set appropriate key performance indicators as a yardstick for measuring performance,
including outcomes and impact, with regard to the municipality’s development priorities and objectives
set out in its IDP.
a) Set measurable performance targets with regards to each of those development priorities and
objectives;
b) Monitor performance, and measure and review performance at least once a year;
c) Take steps to improve performance with regards to those priorities and objectives where
performance targets are not met; and
d) Establish a process of reporting.
The Municipal Planning and Performance Management Regulations of 2001 elaborates on the details of
what the Performance Management System should entail. According to these regulations “A
municipality's performance management system entails a framework that describes and represents how
the municipality's cycle and processes of performance planning, monitoring, measurement, review,
reporting and improvement will be conducted, organised and managed, including determining the roles of
the different role-players”.
The Municipal Planning and Performance Management Regulations provide for the following
requirements that a Performance Management System should meet in order for it to be credible. The
following are listed as primary requirements of the regulations:
a) PMS complies with all the requirements set out in the Act
b) Demonstrates how it is to operate and be managed from the planning stage up to the stages of
performance and reporting;

Intsika Yethu IDP 2014-2015
Page 211
c) Clarifies the roles and responsibilities of each role-player, including the local community, in the
functioning of the system;
d) Clarifies the processes of implementing the system within the framework of the Integrated
Development Planning process;
e) Determines the frequency of reporting and the lines of accountability for performance;
f) Relates to the municipality's employee performance management processes; and
g) Provides for the procedure by which the system is linked to the municipality's integrated
development planning processes.
7.2 IYLM’s Performance Management System
IYLM has an existing Performance Management System policy which was developed in the 2008/09 and
has just been reviewed in 2012/13 financial year and it is that policy that will inform the PMS that will
used by the institution going forward. As already indicated this is how our PMS will unfold:
7.2.1 Role of the Council
In line with the Municipal Systems Act (Act No. 32 of 2000), the Municipal Council commits to
participating in the development of its performance management system through the Executive
Committee and shall:
a) Oversee the development of the municipality’s performance management system.
b) Assign responsibilities in this regard to the Municipal Manager who shall submit the proposed
system to the Municipal Council for adoption, and establish mechanisms to monitor and review
the performance management system.
Through the development of the new PMS, the Municipal council will set out clear roles and
responsibilities with regard to the key elements of a sound PMS which are planning, monitoring,
measurement, review, and reporting and performance assessment. The council, The Municipal Manager,
section 57 managers and the audit committee shall all have distinct roles in terms of the key elements
given above.
7.2.2 Role of the community
In addition to developing distinct responsibilities for officials, IYLM also envisages a key role for the
community to play in terms of the development process of the PMS. Measures shall be put in place in
order to allow the community to have a role in terms of setting performance indicators and targets.
Community involvement is in keeping with section 42 of the Municipal Systems Act which stipulates the
following:
“A municipality, through appropriate mechanisms, processes and procedures established in terms of
Chapter4, must involve the local community in the development, implementation and review of the
municipality’s performance, management system. 30 and, in particular, allow the community to

Intsika Yethu IDP 2014-2015
Page 212
participate in the setting of appropriate key performance indicators and performance targets for the
municipality.”
The table beneath aims to give a broad outline of what a more comprehensive take on role and
responsibilities would look like.
Table 33: Comprehensive table displaying the different roles in the PMS process
Actor Roles and Responsibilities
Role of the council Participates in strategic planning and agenda
setting, endorses targets, and reviews reports.
Role of the Municipal manager Plans, monitors, review, reports, and ensure
effective performance assessments.
Role of the s57 managers Plans, sets targets, signs agreements, implements,
reports, and assessed, learning from the review.
Role of the Audit Committee Quality assures and monitors the planning,
reporting, verification, and assessments.
Role of the community Contributes to identification of issues and receives
reports back on progress made.
The table above thus presents a broad framework for the manner in which roles and responsibilities will
be organised to operationalize our PMS.
7.2.3 Performance Indicators
The regulations inform us that performance indicators should be set by the council within the PMS. These
indicators should be derived from the priorities and objectives of the municipality as stated in the IDP.
The performance indicators in question should be measurable, relevant, objective and precise. The council
shall ensure that the performance indicators apply to all its units and all service providers that it enters
into a service delivery agreement with. As mentioned earlier the council also has a responsibility to ensure
that the performance indicators used shall also reflect the input of the community. The council shall
comply with all these requirements stated above in accordance with section 9 of the Municipal Planning
and Performance Management Regulations, 2001. Section 9 goes further to inform us that all
municipalities should be cognisant of the General Key indicators which apply to all municipalities, they are
listed beneath:
The following general key performance indicators are prescribed in terms of Municipal Planning and
performance management Regulation (796, August 2001) read with Chapter 3 of MSA.
a) The percentage of households with access to basic level of water, sanitation, electricity and solid
waste removal.
Water
- At Intsika Yethu Municipality the 2011 Census shows that the coverage as per RDP standard
(i.e. piped water within 200m) is 75% and only 25% of the households do not have. And out of
the 75% with access to water:

Intsika Yethu IDP 2014-2015
Page 213
41.4% of the households have access to piped water in the distance of less than 200m
from the dwellings.
17.1% have an access in the distance between 200m and 500m from the dwellings.
7% have access inside the yards.
2.5% have access inside their dwellings and
Only 1% have got an access at the distance of greater than 1km.
Sanitation
- The Census 2011 reveals that the overall coverage by sanitary latrines at Intsika Yethu is 62.9%
whilst 39.1 have none. The breakdown of the sanitation access is as follows:
Flashed toilets ( connected t0 sewerage system ) is 2.3%
Flashed toilets ( with septic tank) is 0.9%
Chemical toilets – 1.8%
Pit toilet with ventilation (VIP) – 22.6%
Pit toilet without ventilation – 30.7%
Other – 4.7%
Electricity
- Current coverage(basic use of electricity for lighting) at Intsika Yethu Municipality with
regards to electricity according to census 2011, is estimated at 64.3:
Households that uses paraffin as a source of energy is 17%
Household that uses candles as a source of energy is 16%
Households that uses solar as a source of energy is 2.3%
Households that uses gas as a source of energy is 0.3%
Households that have none is 0.2%
Solid Waste Removal
- According to 2011 census 62.9% of households remove their own refuse instead of it being by
authorities. The distribution of households by mode of refuse removal is as follows:
Removed by local authority at least weekly is 2.8%
Removed by local authority less often is 0.4%
Communal refuse dump is 1.4%
Own refuse dump is 62%
No rubbish disposal is 29.4%
Other is 3%
b) The percentage of households earning less than R1100 per month with access to free basic services
according to IYM indigent registrar is 8%%.
c) The percentage of a municipality's capital budget actually spent on capital projects identified for a
2012/2013 financial year in terms of the municipality's integrated development plan is 1.15%.
d) The number of jobs created through municipality's local economic development initiatives
including capital projects is 3658
e) The number of people from employment equity target groups employed in the three highest levels
of management in compliance with a municipality's approved employment equity plan is 325.
f) The percentage of a municipality's budget actually spent on implementing its workplace skills plan
is 0.99%; and

Intsika Yethu IDP 2014-2015
Page 214
g) Financial viability as expressed by the following ratios:
(i)
Where-
'A' represents debt coverage
'B' represents total operating revenue received
'C' represents operating grants
'D' represents debt service payments (i.e. interest + redemption) due within the financial year
(ii)
Where-
'A' represents outstanding service debtors to revenue
'B' represents total outstanding service debtors
'C' represents annual revenue actually received for services
(iii)
Where-
'A' represents cost coverage
'B' represents all available cash at a particular time
'C' represents investments
'D' represents monthly fixed operating expenditure.
After considering the general performance indicators as stated above, the council shall formulate a
number of performance indicators for its PMS based on inputs that they have received from the
community regarding issues which are of paramount importance to them. Performance indicators shall be
reviewed on an annual basis.
7.2.4 Performance Targets
After developing a set of performance indicators, the council shall develop relevant targets for those
indicators. Performance targets should have the following qualities according to section 12 of the
Municipal Planning and Performance Management Regulations, 2001:
(a) Be practical and realistic;
(b) Measure the efficiency, effectiveness, quality and impact of the performance of the municipality,
administrative component, structure, body or person for whom a target has been set;
A= B-C
D
A= B
C
A= B+C
D
Intsika Yethu IDP 2014-2015
Page 215
(c) Be commensurate with available resources;
(d) Be commensurate with the municipality's capacity; and
(e) Be consistent with the municipality's development priorities and objectives set out in its integrated
development.
The setting of targets shall assist the municipality in terms of measuring performance because these
targets shall be audited annually as part of the municipality’s internal auditing processes determined by
the Auditor-General.
7.2.5 Publishing of Performance Reports and the Annual Reports
IYLM acknowledges the importance of publishing the results of its performance to the broader public.
This is not only a democratic imperative but also a healthy tool for performance management since it
facilitates accountability and builds a culture of performance drives work into the organisation. A number
of different platforms shall be used in order to bring performance management closer to the broader
community. Publicising performance information is also a legal requirement and is clearly stated in the
Municipal Systems act section 41 (e), which stipulates:
A Municipality must-establish a process of regular reporting to:
a) The council, other political structures, political office bearers and staff of the municipality; and
b) The public and appropriate organs of state.
An annual report of PMS should also be compiled and made available to the general public. The annual
report should include a detailed report of the municipality’s performance and the performance of any
service provider that was contracted to the municipality during the financial period under scrutiny. The
annual report also gives details regarding performance indicators to be set for the following year. Lastly
the annual report will highlight all those areas in which the municipality is in need of improvement. In
addition to the annual report are quarterly reports which IYLM compiles and releases which support the
findings of the annual report. These key documents ensure that continuous monitoring of performance is
taking place. Ideally the annual report which reflects performance management should not stand alone
but should rather form part of the overall municipal annual report so that it may gain centrality and be
seen as crucial to the municipality’s strategy.

Intsika Yethu IDP 2014-2015
Page 216
7.2.6 The PMS in relation to the IDP
Any credible PMS should be based on the IDP of that same municipality. As mentioned before, the performance indicators that are formulated within a
municipality’s PMS should be based on the priorities and objectives that emerge from that same municipality’s IDP or SDBIP. Thus the council’s PMS shall
be informed by the IDP. In other words, if the IDP fulfils the planning role, then the PMS fulfils implementation and monitoring role.
The table beneath is an example of how Key Priority Areas have been classified in IYLM’s IDP we can see from the table that from each priority emerges an
objective and a strategy to achieve that objective. From the objectives emerge indicators which are given details in terms of time and amount under the
targets. The indicators and targets are the responsibility of the accounting officer whose duties it is to ensure that the targets are met. The table therefore
demonstrates the link between the IDP and the PMS. This link is created through the progression from the key elements of integrated planning i.e.
prioritising, strategic objectives, and setting strategies to the key elements of performance management i.e. indicators, measurement, performance targets
and detailing roles and responsibilities.
Table 34: Integration of the strategic planning with the PMS
STRATEGIC PLANNING (IDP) PERFORMANCE MANANGEMENT (PMS)
Strategic
Objective
Strategic Objective is a statement of intention that seeks to identify the intended benefit and
beneficiaries within IYLM in relation to the organisation’s functions and provision of services.
Priority Issue Strategy Indicator Baseline
Annual Targets
Staff responsible
2012/13
2013/14
2014/15
2015/16
2016/17

Intsika Yethu IDP 2014-2015
Page 217
The Priority Issues
are those issues
identified through
the Situational
Analysis and
community
consultations to
ensure responsive
planning that
provides a common
basis for action.
The strategy
represents
how the
municipality
is going to
achieve the
objective in
relation to the
identified
priority.
The
measurement
of performance
that is used to
track progress
towards
achieving an
objective.
Refers to the
status quo of
the given
indicator, prior
to the
beginning of
the new IDP
cycle, usually
an
approximation
for the
financial year
2011/2012 or
most recent
available data.
This is the
expression of the
specific level of
performance that an
institution or
individual aims to
achieve on a year by
year basis, and can
be further broken
down into quarterly
targets within a
given financial year.
The post responsible
for ensuring that the
performance
indicators are
tracked and the
targets are achieved.

Intsika Yethu IDP 2014-2015
Page 218
7.3 Institutional Performance Management
At the beginning of every financial year IYLM shall compile a balanced scorecard which will be specifically
meant for assessing the performance of the municipality as an organisation. The balanced scorecard shall
be reviewed by the municipality’s Balanced Scored Card Review Forum/Structure. This structure shall sit
quarterly to assess the progress of the municipality in terms of reaching its targets. The institutional
performance management approach is important because it allows for an overall picture of the
municipality and how managers are working together as an organisation in order to reach their targets.
The challenge for IYLM is to develop a comprehensive mechanism that will allow for the entire institution
to be properly assessed on a continuous basis in a manner that will provide credible information that can
be used to improve the municipality’s all-round performance. At present the municipality uses a method
that ranks the municipality’s performance according to three levels. As seen from the table beneath
municipal performance can fall under the “RED” bracket which represents poor performance that needs
urgent attention; The “AMBER” bracket which represents delivery that is only just meets the needs of the
municipality and is therefore close to poor performance; or the green bracket which bracket represents
satisfactory performance.
One should bear in mind that the table in question is a simplification of the actual process which in reality
would involve the assessment of many indicators and targets based on the municipality’s strategic
objectives and KPA’s.
Table 35: Institution Performance Achievement Rating
KEY ROBOT LIGHT ACHIEVEMENT
PERCENTAGE
PERFORMANCE
DESCRIPTION
RED 50% and Lower Problem Area - Delivery below
par (Needs urgent attention)
AMBER Lower than 100% but
Higher than 50%
Delivery borders on danger area -
If performance does not improve
will turn red
GREEN 100% and Above Delivery levels acceptable - keep
momentum, sustain and improve
where there is room
7.4 Individual Performance Management
Assessing individual performance is an integral part of performance managements as it presents details
about a municipality’s performance that may not necessarily by visible from an institutional perspective.
Individual performance management elucidates upon specific areas of excellence, competence and
shortfalls within the municipality. IYLM uses a performance agreement to document the agreement
between the employee of the municipality and the manager on behalf of the municipality. The
performance agreement document possesses the details of what exactly is expected of the employee for the
financial year in question. It is also an opportunity for the strategic objectives and goals as stated in the
IDP of the municipality to be cascaded into the actual work of officials and managers.

Intsika Yethu IDP 2014-2015
Page 219
The core components of a performance agreement include the following:
Output Plan: details the outputs which the employee has to deliver upon. Targets are crafted in
relation to the performance indicators that will demonstrate the employees progress in terms of
achieving his/her outputs.
Competency plan: this refers to the skills and knowledge that an employee should acquire in order to
achieve the outputs as set out in the output plan.
Personal Development plan: these are the interventions that are needed to reduce or eliminate the
shortfall between the skills and knowledge that the employee possesses and the skills and knowledge
needed to dispense his/her duties in such a way that the outputs of the position in question are met.
7.4.1 The Performance Assessment process
This section highlights the current performance process which is being utilised within the IYLM
institution. The current process should be seen as a benchmark for the planned comprehensive PMS that
is going to be realised in the coming term.
According to the Performance management policy, quarterly performance appraisals are conducted for all
contracted staff of the municipality. The table beneath is a representation of the schedule of when the
appraisals take place throughout the year. The table shows us that the appraisal schedule will be set in
accordance with schedule that the municipality uses. Appraisals shall be conducted for all staff members
by their immediate superiors, and will be based on the performance indicators as explained in the output
plan of the employee.
Table 36: Appraisal schedule of the IYLM PMS
INTERVAL PERIOD EVALUATION DEADLINE
First quarter (July – September) 2nd week of October
*Second quarter (October – December) 2nd week of January
Third quarter (January – March) 2nd week of April
*Fourth (last) quarter (April – June) 2nd week of July
A rating scale is used to show the employees performance in terms of the indicators. The table beneath is
an example of how an employee would be rated.
Table 37: Performance Rating Scale of the IYLM PMS
PERFORMANCE RATING
SCALE (score)
Rating (%) Rating Definition
1 0 – 49 Unacceptable Performance
2 50 – 99 Performance NOT fully effective
3 100 – 149 Fully Effective
4 150 – 199 Performance Significantly above
expectation
5 200 + Outstanding Performance

Intsika Yethu IDP 2014-2015
Page 220
The table demonstrates how an employee is rated on a score of 1 to 5. A score of 1 is the lowest score and
thus is categorised as unacceptable performance on the part of the employee. This indicates that the
employee has failed to satisfy the requirements for his or her duties as outlined by the indicators attached
to the performance agreement which the employee signed. In most cases managers will have to take action
to try and motivate the employee to improve performance because it is well below an acceptable standard.
A score of 5 is indicative of outstanding or excellent performance. As a percentage this score is represented
by 200% which is well above what is expected from the employee. Technically speaking a score of 5 means
that the employee went beyond what was expected of him or her in terms of the Performance Agreement.
In such cases managers will usually reward the employee for such outstanding performance in order to
incentivise the sustenance of the high work standards that the employee has demonstrated.
7.4.2 Rewarding and correcting good and poor performance
This is an important step in terms of maintaining good performance on the one hand and eliminating poor
performance on the other. Currently, IYLM has a number of performance incentives for good
performance. A performance bonus ranging from 5% to 14% of the all-inclusive remuneration package
may be paid to a Municipal Manager and Managers directly accountable to him or her. The breakdown
according to performance is as follows:
A score of 130% to 149% shall be awarded a performance bonus ranging from 5% to 9%.
A score of 150% and above shall be awarded a performance bonus ranging from 10% to 14%.
In terms of poor performance the council will usually implement training in order to get the employees
performance to the necessary levels, assistance shall be given to the employee with the intention of
imparting the necessary skills and knowledge so that the employee could be able to meet the objectives as
set out in his or her performance agreement. Where performance is consistently poor to the point of being
unacceptable, council will have to take stronger measures. These actions may include, invoking an
incapacity clause against the employee which could result in the employee being relieved of some duties or
in the total termination of contract.
7.5 Performance Audit
After completing the performance measurements (both institutional and individual), the results should be
audited. IYLM will do an internal audit of the results and also avail the results to the Auditor-General to
review on an annual basis as this is in keeping with the Municipal Systems Act which states the following
in section 45:
“The results of performance measurements in must be audited-
(a) As part of the municipality’s internal auditing process: and
(b) Annually by the Auditor-General”

Intsika Yethu IDP 2014-2015
Page 221
First Draft High Level Service Delivery Budget Implementation Plan (SDBIP)
The SDBIP is an important tool as IYLM moves from conceptualising the strategic delivery of services to
the application of those ideas and intentions in the tangible development of communities. In line with
MFMA Circular 13, this first draft of the SDBIP takes a high level approach and includes only the first
three of five components of the SDBIP. These include: monthly projections of revenue to be collected from
each source; monthly projections of expenditure for each vote; and quarterly projections of service
delivery targets and performance indicators for each vote.
This information is still in an early stage of development and therefore still lacks: the ward information for
expenditure and service delivery; as well as a detailed capital works plan broken down over three years.
Furthermore, the performance information component only addresses quarterly projections for the
annual targets derived from the 5 Year Implementation Plan, and does not provide for allocations per vote
yet.
Nevertheless, the SDBIP is a vital tool for IYLM in monitoring in year performance and reporting.
Crucially, it represents a draft of the contract between the Mayor, Councillors, IYLM administration, and
the broader community that will be developed and finalised within a month of the approval of the budget.
The following is a credible first draft of the expected revenue, expenditure, and service delivery targets.
This first draft will form the basis for further refinement and development of the SDBIP 2012/2013.
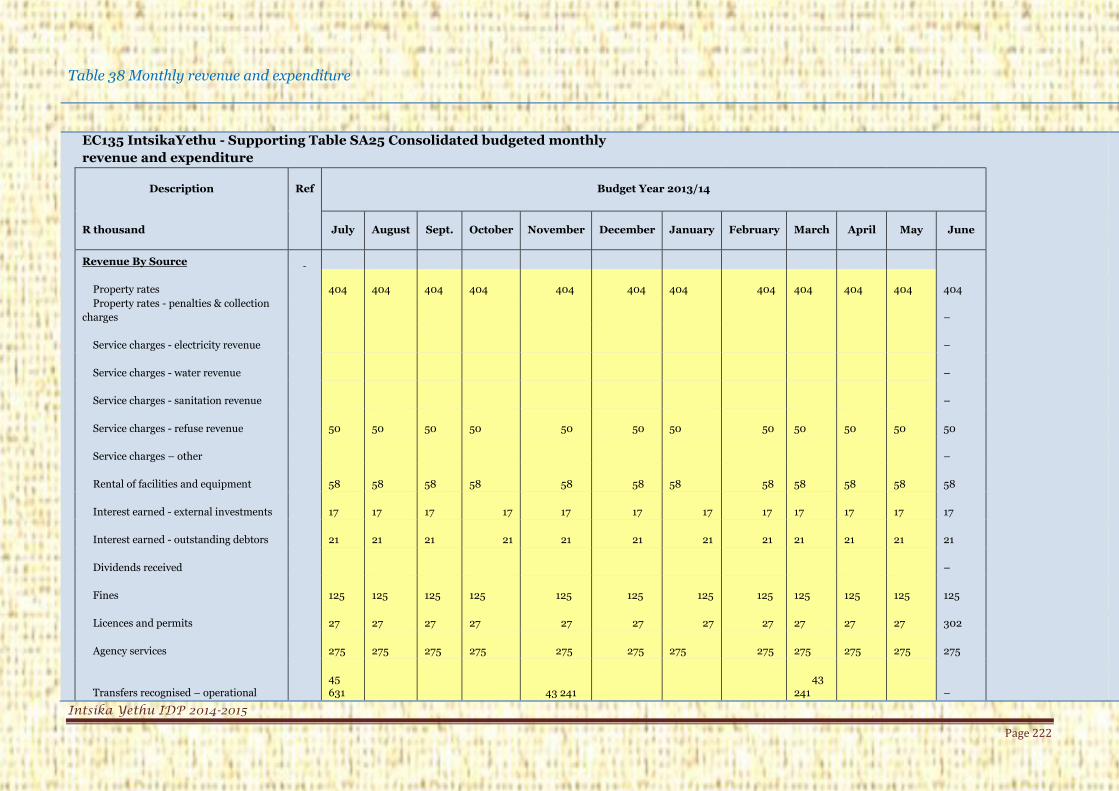
Intsika Yethu IDP 2014-2015
Page 222
Table 38 Monthly revenue and expenditure
EC135 IntsikaYethu - Supporting Table SA25 Consolidated budgeted monthly
revenue and expenditure
Description Ref Budget Year 2013/14
R thousand July August Sept. October November December January February March April May June
Revenue By Source
Property rates
404
404
404
404 404 404
404 404
404
404
404
404
Property rates - penalties & collection
charges
–
Service charges - electricity revenue
–
Service charges - water revenue
–
Service charges - sanitation revenue
–
Service charges - refuse revenue
50
50
50
50 50 50
50 50
50
50
50
50
Service charges – other
–
Rental of facilities and equipment
58
58
58
58 58 58
58 58
58
58
58
58
Interest earned - external investments
17
17
17 17 17 17 17 17
17
17
17
17
Interest earned - outstanding debtors
21
21
21 21 21 21 21 21
21
21
21
21
Dividends received
–
Fines
125
125
125
125 125 125 125 125
125
125
125
125
Licences and permits
27
27
27
27 27 27 27 27
27
27
27
302
Agency services
275
275
275
275 275 275
275 275
275
275
275
275
Transfers recognised – operational
45
631 43 241
43
241
–

Intsika Yethu IDP 2014-2015
Page 223
Other revenue
914
914
914
914 914 914 914 914
914
914
914
914
Gains on disposal of PPE
–
Total Revenue (excluding capital
transfers and contributions)
47
521
1
890
1
890
1
890 45 131 1 890
1
890
1
890
45
131
1
890
1
890
2
165
Expenditure By Type
Employee related costs
6 138
6
138
6
138
6
138 6 138 6 138
6
138 6 138
6
138
6
138
6
138
6
149
Remuneration of councillors
1
110
1
110
1
110
1
110 1 110 1 110
1
110 1 110
1
110
1
110
1
110
1
116
Debt impairment
500
–
Depreciation & asset impairment
3
700
–
Finance charges
21
21
21 21 21 21 21 21
21
21
21
21
Bulk purchases
–
Other materials
–
Contracted services
38
38
38
38 38 38
38 38
38
38
38
38
Transfers and grants
250
250
250
250 250 250
250 250
250
250
250
250
Other expenditure
5
015
5
015
5
015
5
015 5 015 5 015
5
015 5 015
5
015
5
015
5
015
5
015
Loss on disposal of PPE
–
Total Expenditure
12
571
12
571
12
571
12
571 12 571 12 571
13
071
12
571
12
571
12
571
16
271
12
588
Surplus/(Deficit)
34
950
(10
681)
(10
681)
(10
681) 32 560
(10
681)
(11
181)
(10
681)
32
560
(10
681)
(14
381)
(10
423)
Transfers recognised – capital
8
760 8 760
8
761
8
761
–
Contributions recognised – capital
1
009
1
009
1
009
1
009 1 009 1 009
1
009 1 009
1
009
1
009
1
009
1
009
Contributed assets
–
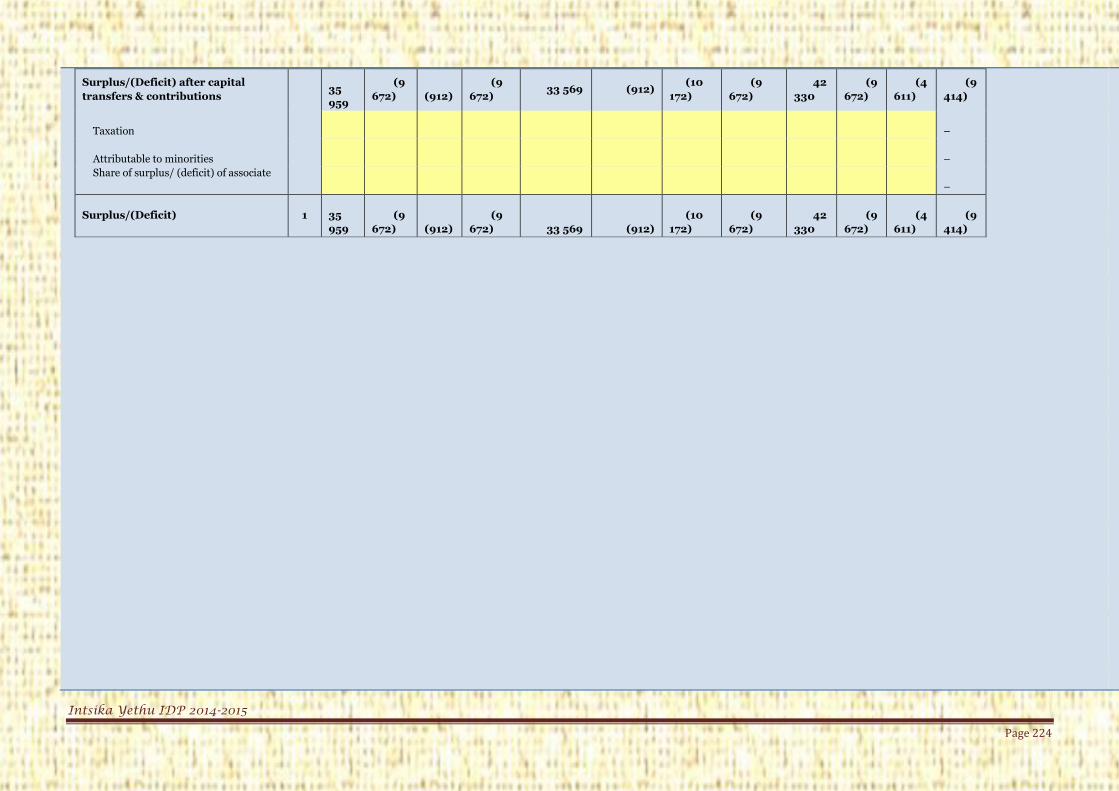
Intsika Yethu IDP 2014-2015
Page 224
Surplus/(Deficit) after capital
transfers & contributions
35
959
(9
672)
(912)
(9
672) 33 569 (912)
(10
172)
(9
672)
42
330
(9
672)
(4
611)
(9
414)
Taxation
–
Attributable to minorities
–
Share of surplus/ (deficit) of associate
–
Surplus/(Deficit) 1
35
959
(9
672)
(912)
(9
672) 33 569 (912)
(10
172)
(9
672)
42
330
(9
672)
(4
611)
(9
414)

Intsika Yethu IDP 2014-2015
Page 225
EC135 IntsikaYethu - Supporting Table SA26 Consolidated budgeted monthly
revenue and expenditure (municipal vote)
Description Ref Budget Year 2013/14
R thousand July August Sept. October November December January February March April May June
Revenue by Vote
Vote 1 - Exco and Council
–
Vote 2 - Municipal Manager
225
225
–
Vote 3 - Corporate Services
–
Vote 4 - Infrastructure
Planning and Development
3
983
3
983
3 983
3
983 3 983 3 983
3
983 3 983
3
983
3
983
3
983
3
983
Vote 5 - Community Services
294
294
294
294 294 294
294 294
294
294
294
294
Vote 6 - Budget and Treasury
40
140 40 140
40
140
–
Vote 7 - Local Economic
Development
3
3
3
3 3 3 3 3
3
3
3
3
Vote 8 - Water Services
2
500
2
500
2 500
2
500 2 500 2 500
2
500 2 500
2
500
2
500
2
500
2
500
Vote 9 - [NAME OF VOTE 9]
–
Vote 10 - [NAME OF VOTE
10]
–
Vote 11 - [NAME OF VOTE
11]
–
Vote 12 - [NAME OF VOTE
12]
–
Vote 13 - [NAME OF VOTE
13]
–
Vote 14 - [NAME OF VOTE
14]
–
Vote 15 - [NAME OF VOTE
15]
–
Total Revenue by Vote 6 6 46 919 6 779 7 6 46

Intsika Yethu IDP 2014-2015
Page 226
46
919
779 7
004
779 004 779 919 6 779 6 779 6 779
Expenditure by Vote to be
appropriated
Vote 1 - Exco and Council
1 644
1
644
1
644
1
644 1 644 1 644
1
644 1 644
1
644
1
644
1
644
1
644
Vote 2 - Municipal Manager
869
869
869
869 869 869
869 869
869
869
869
869
Vote 3 - Corporate Services
1 205
1
205
1
205
1
205 1 205 1 205
1
205 1 205
1
205
1
205
1
205
1
205
Vote 4 - Infrastructure
Planning and Development
1 770
1
770
1
770
1
770 1 770 1 770
1
770 1 770
1
770
1
770
1
770
1
770
Vote 5 - Community Services
1 964
1
964
1
964
1
964 1 964 1 964
1
964 1 964
1
964
1
964
1
964
1
964
Vote 6 - Budget and Treasury
2 276
2
276
2 276
2
276 2 276 2 276
2
276 2 276
2
276
2
276
2
276
2
276
Vote 7 - Local Economic
Development
694
694
694
694 694 694
694 694
694
694
694
694
Vote 8 - Water Services
2
500
2
500
2 500
2
500 2 500 2 500
2
500 2 500
2
500
2
500
2
500
2
500
Vote 9 - [NAME OF VOTE 9]
–
Vote 10 - [NAME OF VOTE
10]
–
Vote 11 - [NAME OF VOTE
11]
–
Vote 12 - [NAME OF VOTE
12]
–
Vote 13 - [NAME OF VOTE
13]
–
Vote 14 - [NAME OF VOTE
14]
–
Vote 15 - [NAME OF VOTE
15]
–
Total Expenditure by Vote
12
923
12
923
12
923
12
923 12 923 12 923
12
923
12
923
12
923
12
923
12
923
12
923
Surplus/(Deficit) before
assoc.
33
997
(6
143)
(5
918)
(6
143) 33 997
(6
143)
(5
918)
(6
143)
33
997
(6
143)
(6
143)
(6
144)
Taxation

Intsika Yethu IDP 2014-2015
Page 227
–
Attributable to minorities
–
Share of surplus/ (deficit) of
associate
–
Surplus/(Deficit) 1
33
997
(6
143)
(5
918)
(6
143) 33 997
(6
143)
(5
918)
(6
143)
33
997
(6
143)
(6
143)
(6
144)

Intsika Yethu IDP 2014-2015
Page 228
EC135 Intsika Yethu - Supporting Table SA27 Budgeted monthly revenue and expenditure (standard classification)
Description Ref
R thousand July August Sept. October November December January February March April May JuneBudget Year
2014/15
Budget Year
+1 2015/16
Budget Year
+2 2016/17
Revenue - Standard
Governance and administration 11,913 11,913 11,913 11,913 11,913 11,913 11,913 11,913 11,913 11,913 11,913 8,012 139,060 171,774 181,222
Ex ecutiv e and council 11,913 11,913 11,913 11,913 11,913 11,913 11,913 11,913 11,913 11,913 11,913 8,012 139,060 171,774 181,222
Budget and treasury office – – – –
Corporate serv ices – – – –
Community and public safety 138 138 138 138 138 138 138 138 138 138 138 635 2,155 2,283 2,408
Community and social serv ices 138 138 138 138 138 138 138 138 138 138 138 635 2,155 2,283 2,408
Sport and recreation – – – –
Public safety – – – –
Housing – – – –
Health – – – –
Economic and environmental services 4,113 4,113 4,113 4,113 4,113 4,113 4,113 4,113 4,113 4,113 4,113 (27) 45,214 48,364 51,024
Planning and dev elopment 2 2 2 2 2 2 2 2 2 2 2 (0) 18 19 20
Road transport 4,111 4,111 4,111 4,111 4,111 4,111 4,111 4,111 4,111 4,111 4,111 (27) 45,195 48,344 51,003
Env ironmental protection – – – –
Trading services – – – – – – – – – – – – – – –
Electricity – – – –
Water – – – –
Waste w ater management – – – –
Waste management – – – –
Other – – – –
Total Revenue - Standard 16,164 16,164 16,164 16,164 16,164 16,164 16,164 16,164 16,164 16,164 16,164 8,620 186,429 222,420 234,654 28,218 28,218 28,218 28,218 28,218 28,218 28,218 28,218 28,218 28,218
Expenditure - Standard
Governance and administration 883 883 883 883 883 883 883 883 883 883 883 107,607 117,317 124,239 131,072
Ex ecutiv e and council 400 400 400 400 400 400 400 400 400 400 400 31,322 35,719 37,826 39,907
Budget and treasury office 300 300 300 300 300 300 300 300 300 300 300 61,874 65,172 69,017 72,813
Corporate serv ices 183 183 183 183 183 183 183 183 183 183 183 14,411 16,426 17,395 18,352
Community and public safety 283 283 283 283 283 283 283 283 283 283 283 14,914 18,029 19,093 20,143
Community and social serv ices 283 283 283 283 283 283 283 283 283 283 283 14,914 18,029 19,093 20,143
Sport and recreation – – – –
Public safety – – – –
Housing – – – –
Health – – – –
Economic and environmental services 500 500 500 500 500 500 500 500 500 500 500 37,429 42,926 45,459 47,959
Planning and dev elopment 200 200 200 200 200 200 200 200 200 200 200 7,740 9,939 10,525 11,104
Road transport 300 300 300 300 300 300 300 300 300 300 300 29,690 32,988 34,934 36,855
Env ironmental protection – – – –
Trading services – – – – – – – – – – – – – – –
Electricity – – – –
Water – – – –
Waste w ater management – – – –
Waste management – – – –
Other – – – –
Total Expenditure - Standard 1,666 1,666 1,666 1,666 1,666 1,666 1,666 1,666 1,666 1,666 1,666 159,951 178,273 188,791 199,174
Surplus/(Deficit) before assoc. 14,499 14,499 14,499 14,499 14,499 14,499 14,499 14,499 14,499 14,499 14,499 (151,330) 8,156 33,630 35,479
Share of surplus/ (deficit) of associate – – – –
Surplus/(Deficit) 1 14,499 14,499 14,499 14,499 14,499 14,499 14,499 14,499 14,499 14,499 14,499 (151,330) 8,156 33,630 35,479
References
Budget Year 2014/15Medium Term Revenue and Expenditure
Framework
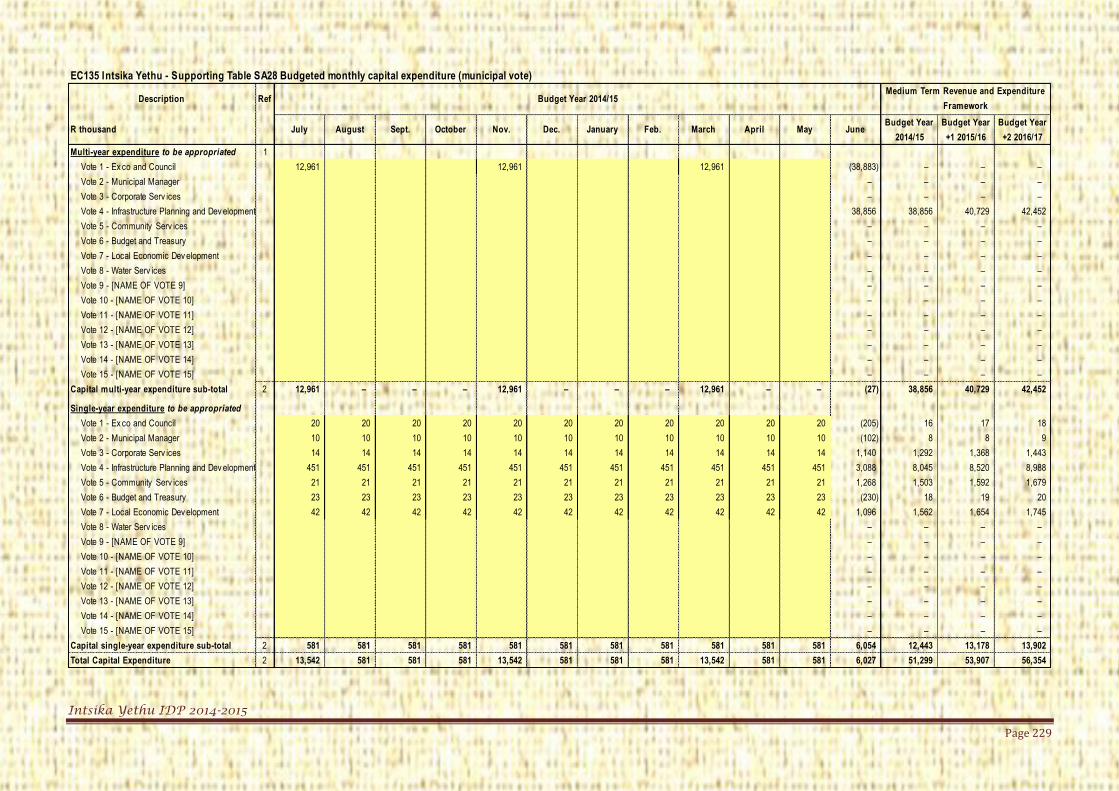
Intsika Yethu IDP 2014-2015
Page 229
EC135 Intsika Yethu - Supporting Table SA28 Budgeted monthly capital expenditure (municipal vote)
Description Ref
R thousand July August Sept. October Nov. Dec. January Feb. March April May JuneBudget Year
2014/15
Budget Year
+1 2015/16
Budget Year
+2 2016/17
Multi-year expenditure to be appropriated 1
Vote 1 - Ex co and Council 12,961 12,961 12,961 (38,883) – – –
Vote 2 - Municipal Manager – – – –
Vote 3 - Corporate Serv ices – – – –
Vote 4 - Infrastructure Planning and Dev elopment 38,856 38,856 40,729 42,452
Vote 5 - Community Serv ices – – – –
Vote 6 - Budget and Treasury – – – –
Vote 7 - Local Economic Dev elopment – – – –
Vote 8 - Water Serv ices – – – –
Vote 9 - [NAME OF VOTE 9] – – – –
Vote 10 - [NAME OF VOTE 10] – – – –
Vote 11 - [NAME OF VOTE 11] – – – –
Vote 12 - [NAME OF VOTE 12] – – – –
Vote 13 - [NAME OF VOTE 13] – – – –
Vote 14 - [NAME OF VOTE 14] – – – –
Vote 15 - [NAME OF VOTE 15] – – – –
Capital multi-year expenditure sub-total 2 12,961 – – – 12,961 – – – 12,961 – – (27) 38,856 40,729 42,452
Single-year expenditure to be appropriated
Vote 1 - Ex co and Council 20 20 20 20 20 20 20 20 20 20 20 (205) 16 17 18
Vote 2 - Municipal Manager 10 10 10 10 10 10 10 10 10 10 10 (102) 8 8 9
Vote 3 - Corporate Serv ices 14 14 14 14 14 14 14 14 14 14 14 1,140 1,292 1,368 1,443
Vote 4 - Infrastructure Planning and Dev elopment 451 451 451 451 451 451 451 451 451 451 451 3,088 8,045 8,520 8,988
Vote 5 - Community Serv ices 21 21 21 21 21 21 21 21 21 21 21 1,268 1,503 1,592 1,679
Vote 6 - Budget and Treasury 23 23 23 23 23 23 23 23 23 23 23 (230) 18 19 20
Vote 7 - Local Economic Dev elopment 42 42 42 42 42 42 42 42 42 42 42 1,096 1,562 1,654 1,745
Vote 8 - Water Serv ices – – – –
Vote 9 - [NAME OF VOTE 9] – – – –
Vote 10 - [NAME OF VOTE 10] – – – –
Vote 11 - [NAME OF VOTE 11] – – – –
Vote 12 - [NAME OF VOTE 12] – – – –
Vote 13 - [NAME OF VOTE 13] – – – –
Vote 14 - [NAME OF VOTE 14] – – – –
Vote 15 - [NAME OF VOTE 15] – – – –
Capital single-year expenditure sub-total 2 581 581 581 581 581 581 581 581 581 581 581 6,054 12,443 13,178 13,902
Total Capital Expenditure 2 13,542 581 581 581 13,542 581 581 581 13,542 581 581 6,027 51,299 53,907 56,354
Budget Year 2014/15Medium Term Revenue and Expenditure
Framework

Intsika Yethu IDP 2014-2015
Page 230
EC135 Intsika Yethu - Supporting Table SA29 Budgeted monthly capital expenditure (standard classification)
Description Ref
R thousand July August Sept. October Nov. Dec. January Feb. March April May JuneBudget Year
2014/15
Budget Year
+1 2015/16
Budget Year
+2 2016/17
Capital Expenditure - Standard 1
Governance and administration 66 66 66 66 66 66 66 66 66 66 66 1 732 775 817
Ex ecutiv e and council 30 30 30 30 30 30 30 30 30 30 30 0 331 351 370
Budget and treasury office 23 23 23 23 23 23 23 23 23 23 23 0 248 263 278
Corporate serv ices 14 14 14 14 14 14 14 14 14 14 14 (0) 152 161 170
Community and public safety 21 21 21 21 21 21 21 21 21 21 21 (0) 235 249 262
Community and social serv ices 21 21 21 21 21 21 21 21 21 21 21 (0) 235 249 262
Sport and recreation – – – –
Public safety – – – –
Housing – – – –
Health – – – –
Economic and environmental services 493 493 493 493 493 493 493 493 493 493 493 0 5,423 5,743 6,059
Planning and dev elopment 42 42 42 42 42 42 42 42 42 42 42 (0) 466 493 520
Road transport 451 451 451 451 451 451 451 451 451 451 451 0 4,957 5,250 5,539
Env ironmental protection – – – –
Trading services – – – – – – – – – – – – – – –
Electricity – – – –
Water – – – –
Waste w ater management – – – –
Waste management – – – –
Other – – – –
Total Capital Expenditure - Standard 2 581 581 581 581 581 581 581 581 581 581 581 0 6,389 6,766 7,139
Funded by:
National Gov ernment 12,961 12,961 12,961 (27) 38,856 40,729 42,452
Prov incial Gov ernment – – – –
District Municipality – – – –
Other transfers and grants 2,000 2,000 2,000 – 6,000 13,178 13,902
Transfers recognised - capital 14,961 – – – 14,961 – – – 14,961 – – (27) 44,856 53,907 56,354
Public contributions & donations – – – –
Borrowing – – – –
Internally generated funds 6,443 6,443 – –
Total Capital Funding 14,961 – – – 14,961 – – – 14,961 – – 6,416 51,299 53,907 56,354
Budget Year 2014/15Medium Term Revenue and Expenditure
Framework

Intsika Yethu IDP 2014-2015
Page 231
EC135 Intsika Yethu - Supporting Table SA30 Budgeted monthly cash flow
MONTHLY CASH FLOWS
R thousand July August Sept. October November December January February March April May JuneBudget Year
2014/15
Budget Year
+1 2015/16
Budget Year
+2 2016/17
Cash Receipts By Source 1
Property rates 405 405 405 405 405 405 405 405 405 405 405 405 4,865 5,152 5,436
Property rates - penalties & collection charges – – –
Serv ice charges - electricity rev enue – – –
Serv ice charges - w ater rev enue – – –
Serv ice charges - sanitation rev enue – – –
Serv ice charges - refuse rev enue 19 19 19 19 19 19 19 19 19 19 19 19 234 248 261
Serv ice charges - other 1,045 1,045 1,045 1,045 1,045 1,045 1,045 1,045 1,045 1,045 1,045 1,045 12,542 13,282 14,013
Rental of facilities and equipment 20 20 20 20 20 20 20 20 20 20 20 20 237 251 265
Interest earned - ex ternal inv estments 25 25 25 25 25 25 25 25 25 25 25 25 299 316 334
Interest earned - outstanding debtors – – –
Div idends receiv ed – – –
Fines 21 21 21 21 21 21 21 21 21 21 21 21 250 265 279
Licences and permits 117 117 117 117 117 117 117 117 117 117 117 117 1,400 1,483 1,564
Agency serv ices 30 30 30 30 30 30 30 30 30 30 30 30 364 385 407
Transfer receipts - operational 39,578 39,578 39,578 1,647 120,382 127,485 134,496
Other rev enue – – –
Cash Receipts by Source 41,261 1,683 1,683 1,683 41,261 1,683 1,683 1,683 41,261 1,683 1,683 3,330 140,573 148,867 157,055
Other Cash Flows by Source
Transfer receipts - capital 14,952 14,952 14,952 – 44,856 47,503 50,115
Contributions recognised - capital & Contributed assets – – –
Proceeds on disposal of PPE – – –
Short term loans – – –
Borrow ing long term/refinancing – – –
Increase (decrease) in consumer deposits – – –
Decrease (Increase) in non-current debtors – – –
Decrease (increase) other non-current receiv ables – – –
Decrease (increase) in non-current inv estments – – –
Total Cash Receipts by Source 56,213 1,683 1,683 1,683 56,213 1,683 1,683 1,683 56,213 1,683 1,683 3,330 185,429 196,369 207,170
Cash Payments by Type
Employ ee related costs 5,338 5,338 5,338 5,338 5,338 5,338 5,338 5,338 5,338 5,338 5,338 5,337 64,053 67,832 71,563
Remuneration of councillors 1,135 1,135 1,135 1,135 1,135 1,135 1,135 1,135 1,135 1,135 1,135 1,135 13,622 14,426 15,219
Finance charges 16 16 16 16 16 16 16 16 16 16 16 16 190 201 212
Bulk purchases - Electricity – – –
Bulk purchases - Water & Sew er – – –
Other materials – – –
Contracted serv ices 519 519 519 519 519 519 519 519 519 519 519 519 6,231 6,599 6,962
Transfers and grants - other municipalities – – –
Transfers and grants - other – – –
Other ex penditure 4,170 4,170 4,170 4,170 4,170 4,170 4,170 4,170 4,170 4,170 4,170 4,170 50,035 52,987 55,902
Cash Payments by Type 11,178 11,178 11,178 11,178 11,178 11,178 11,178 11,178 11,178 11,178 11,178 11,178 134,131 142,045 149,857
Other Cash Flows/Payments by Type
Capital assets 14,952 14,952 14,952 – 44,856 47,503 50,115
Repay ment of borrow ing – – –
Other Cash Flow s/Pay ments 3,058 3,058 3,058 3,058 3,058 3,058 3,058 3,058 3,058 3,058 3,058 3,058 36,700 38,865 41,003
Total Cash Payments by Type 29,188 14,236 14,236 14,236 14,236 29,188 14,236 14,236 29,188 14,236 14,236 14,236 215,687 228,413 240,975
NET INCREASE/(DECREASE) IN CASH HELD 27,025 (12,553) (12,553) (12,553) 41,977 (27,505) (12,553) (12,553) 27,025 (12,553) (12,553) (10,906) (30,258) (32,043) (33,806)
Cash/cash equiv alents at the month/y ear begin: 27,025 14,472 1,918 (10,635) 31,342 3,836 (8,717) (21,270) 5,755 (6,799) (19,352) – (30,258) (62,302)
Cash/cash equiv alents at the month/y ear end: 27,025 14,472 1,918 (10,635) 31,342 3,836 (8,717) (21,270) 5,755 (6,799) (19,352) (30,258) (30,258) (62,302) (96,107)
Medium Term Revenue and Expenditure
FrameworkBudget Year 2014/15

Intsika Yethu IDP 2014-2015
Page 232
Chapter 5: Financial Plan and Budget
8. Financial Viability In accordance with the outcomes of the latest assessment conducted on the financial position, the IYLM
remains financially sustainable and is able to meet its financial commitments.
Significant reforms within the adoption of new accounting standards, being Generally recognised
Accounting Practice (GRAP), coupled with significant reforms within Municipal Budgeting and Reporting
Regulations has significantly enhanced the credibility, sustainability, transparency, accuracy and
reliability of financial planning, management and reporting within the IYLM
In meeting the demands associated with modernised practices towards sustaining and enhancing financial
viability; and addressing the specific needs of Intsika Yethu LM within the context of limited resources
and mounting service delivery expectations, has necessitated that a comprehensive integrated approach
towards financial sustainability be developed.
In terms of the approach adopted, the report will clearly define financial risks which have been identified
as being a financial threat to the long termed sustainability of the organisation, linked to key challenges,
with a detailed focus on effective strategies employed to mitigate against financial threats and weaknesses,
concluded by a detailed analysis of the service delivery package and associated financial implications on
the operations, statement of financial position and cash flows for the MTREF 2013/2014- 2015/2016
which collectively aim to position Intsika Yethu LM on a sustainable approach to service delivery.
8.1 Financial risks
In order to maintain and improve on the financial efficiencies and position of Intsika Yethu LM, certain
risks need to be managed, while financial management practices need to be continuously improved.
The key financial risks confronting the Municipality can be summarised as follows:
Limitation on Revenue Raising Capacity due to high poverty indices;
Growth within Debt Composition associated with Low level Service Offerings;
Financial Distress- ratio analysis- specific on Working capital elements;
Containment of personnel costs within set benchmarks as established within the budget process;
Governance and Administration costs as a percentage of own revenue;
Increases associated with deferred maintenance and backlog eradication.
8.2 Key Challenges
Achieving an unqualified audit report;
Affordability of a desired Organisational Structure;
The need to improve customer care;
The need to ensure legal compliance through all procedures and programmes.

Intsika Yethu IDP 2014-2015
Page 233
8.3 Financial Strategies
The Financial Strategy has been formulated to ensure that the IYLM maximises all available opportunities
that would enhance Councils financial strength especially considering the cost‐shift environment that has
been created with the implementation of assigned powers and functions.
Council’s overall Financial Strategy is structured into the following core components to allow for a clearer
understanding of the overall task:
Revenue enhancement and maximisation Strategies;
Asset Management strategies;
Financial Management Strategies;
Capital Financing Strategies;
Operational Financing Strategies;
Strategies to Enhance Cost‐effectiveness; and
Free Basic Services and indigent Support.
These segments are intended to provide operational guidance to staff to assist them in achieving identified
objectives and goals.
Importantly the Strategies formulated are deemed to be primary mitigating tool against the financial risks
identified, and giving effect to the objectives of the Integrated Development Plan, through ensuring that
the performance targets as per the Budget underlying the IDP are achieved.
The strategies are premised on ensuring compliance with adopted financial policies, modelled on
modernised reform practices applicable to Local Government.
8.3.1 Revenue Enhancement and Maximisation Strategy
The purpose of this strategy is to ensure that all possible avenues are explored to maximise the receipt of
any monies available to Council by way of intergovernmental transfers and Grants or Donations, including
expanding the billing database and maximising income opportunities on every registered serviced site
within the LM’s jurisdiction.
The second component of this strategy focuses on strengthening and building capacity within credit
control and debt management practices and processes of Council, ensuring the attainment and exceeding
of collection rates in line with key budgetary requirements.
The third component of the strategy focuses on maximising the registration of households eligible for
participation within the Free Basic Services (FBS) programme of Council, this component is aimed at
arresting spiralling debts associated with this user group, and limiting consumption of services in line with
the FBS allocation threshold.
In line with the strategy employed, Council has formalised the appointment of a debt collection agency on
a contingency arrangement over the next three years to undertake revenue enhancement and debt
reduction, with a special focus on skills transfer to a dedicated internal unit.
A comprehensive revenue enhancement strategy is undertaken and it includes:

Intsika Yethu IDP 2014-2015
Page 234
Cleaning of the debtor database to ensure that all consumers are levied for all services received at
the correct tariff for such service.
Reviewing and formalising an indigent policy for the municipality.
Ensuring that all consumers that qualify in respect of such approved indigent policy are registered.
Implementing credit control measures to significantly improve payment levels and ensure that
consumers that can pay do so.
Reviewing Council’s tariff policy in respect of the subsidy of free basic services and to ensure that
the actual cost of services is recovered through the respective tariffs.
Restructuring of the operational budget to ensure that the budget is cash funded and that it
reflects actual payment levels in respect of bad debt provision.
Investigating distribution losses in respect of electricity and water to ensure that electricity and
water purchased is billed
Appointment of a debt collection agency to assist in collecting outstanding debt
8.3.2 Subsidies and Grants
In order for Intsika Yethu LM to obtain maximum benefit from external monies available, a policy laying
out the relevant procedures has been put in place within the Institution to ensure that all grants,
donations and subsidies are investigated, applied for and received at the appropriate times. The policy will
ensure that Council receives maximum benefit from external funding available.
8.3.3 Credit Control and Debt Collection Policy
The Policy sets out to control and manage the recovery of outstanding debt due to Council. This policy is in
place and is subject to regular updates. The policy lays down the basis for distribution of accounts,
collection procedures, interest and penalties to be charged in the event of non‐payment, with strong focus
on management reporting requirements pursuant of key legislative requirements and performance
management.
Giving effect to the administration of this policy, Council through the appointment of a revenue
accountant has invested in a Revenue Management and Debt collection System fully compliant with
Municipal Bylaws and objects of the policy framework, the system effects have result in macro approach to
debt management and collection being effected, in an effective and efficient manner, maximise the return
on investment and per household.
The Municipality currently bills all its debtors on a monthly basis as per the norms and standards of
revenue management. The Municipality has an updated Valuation roll which is currently being used to bill
the Municipal debtors, and the supplementary valuation roll is conducted annual as prescribed by the
standards
8.3.4 Tariff Policy
This policy sets key guidelines on what should be considered when pricing services and guiding principles
for the compilation of water, sanitation, solid waste and other services. This policy is subject to constant
review, given significant reforms within the water sectors, which impact on the price cost of services
rendered, and ultimately on the sustainability of trading services.
8.4 Asset Management

Intsika Yethu IDP 2014-2015
Page 235
8.4.1 Asset Management Strategies
The purpose of the strategy is to optimise the use of all assets under the control of IYLM, given the
financial exposure and the revenue streams earned by the Municipality in the rendering of services to the
community.
8.4.2 Asset Management Policy
This policy is deemed necessary in order to facilitate the effective management, control and maintenance
of the assets. The policy is in place and is subject to regular review. The prime objectives of the policy are
to ensure that the assets of Intsika Yethu are properly managed and accounted for by:
Ensuring the accurate recording of asset information;
The accurate recording of asset movements;
Exercising strict control over all assets;
Providing correct and meaningful management information;
Compliance with Council’s Insurance Policy and Payment Procedure;
Effecting adequate insurance of all assets; and
Maintenance of Council’s Assets.
The implication of this policy on the administration and planning of assets has been profound, in that the
organisation has a comprehensive understanding of all assets under the Management Control of the
Municipality, has an acute understanding of the conditions and remaining lifespan etc of the asset base, all
of which are aimed at ensuring that sound financial planning occurs, especially around investment
choices and reserve creation to safe guard against ageing infrastructure; the Funding and Reserves policy
is directly influenced through the outcomes of the annualised conditional assessment on all infrastructural
assets.
It is envisaged that strict adherence to policy framework will continue to be applied in order to protect the
resource of the community, and ensure the continued viability of the Municipality.
8.4.3 Asset Movement System
At the time of commissioning a GRAP compliant Asset Register, an asset tracking system using bar‐coded
discs and scanners was put in place. With the completion of the Asset Register, the asset tracking system is
now fully operational.
The system allow for regular audits of all assets to be completed in a shorter time frame and therefore
allowing for more regular updates of the register.
8.5 Financial Management Strategies
The purpose of this strategy is to ensure that the Financial Systems in place at IYLM are of such quality to
allow for the generation of accurate and timely reporting at all times.
The Strategy has culminated in the institution being able to effectively make informed decisions around
service delivery, identify financial risks and impeding financial problems, through having an acute

Intsika Yethu IDP 2014-2015
Page 236
understanding of the financial affairs of the Municipality, through a simplified qualitative analysis being
provided based on the in year reports focusing on budgeted performance( revenue, expenditure, capital);
impact of the trading activity on the financial position and cashflows within the Organisation, this is in
compliance with international standards on in year reporting.
8.5.1 Budget and Finance Reform
A considerable amount of time and effort has been expended on ensuring that IYLM has the capacity to
deliver on the finance and budget reporting requirements as prescribed by National Treasury. The
institution has reaffirmed its commitment to the development of capacity to service local government
interest within financial management and administration and as such has invested huge amount towards
this program over the 2013/2014- 2015/2016 MTREF.
The process is being overseen by a Finance Standing committee and significant progress has been made in
some areas. Specific tasks being performed are:
Employment of interns and short term contract workers;
Reconciliation of assets;
Training;
Supply Chain Management;
Liability Management;
Revenue Management; and
Financial Systems Reporting.

Intsika Yethu IDP 2014-2015
Page 237
8.5.2 Operational Financing Strategies
The purpose of this strategy is to assess the viability (IA) of any association or alliance or partnership that
may arise from time to time. IYLM has been assigned various functions and authorities by the MEC for
Local Government, Housing and Traditional Affairs or Structures Act.
8.5.3 Strategies to Enhance Cost Effectiveness
The purpose of this strategy is to ensure that IYLM employs the most cost effective operating practices.
Importantly, this strategy is driven on the principles enshrined within the Costing policy, which amongst
other things advocates that the sustainability of IYLM is not primarily driven on resource generation
capacity, rather a combination of effective resource utilisation, premised on cost conscious decision
making practices and processes.
8.5.4 Benchmarking and Performance Indicators
A set of performance indicators will be developed and implemented to test the effectiveness and efficiency
of the Municipality. Benchmarking these against similar organisations will allow for regular internal
assessment and upgrading.
These bench mark indicators will supplement the battery of indicators that have been developed as part of
the new budget reporting formats and regulations, aimed at gauging the efficacy of financial performance
and management.
8.5.6 Training and Development of Staff
Training sessions and courses are continually being planned to ensure that all financial as well as non-
financial, senior staff and councillors will be in a better position to evaluate the financial position of the
Municipality. The Council also has an approved skills development plan, which is being implemented and
is used to guide training of both Councillors and Officials.
8.5.7 Cost Effectiveness
All departments of the IYLM are challenged continually with identifying the most cost effective means of
operating by employing the methods commonly associated with BOP (Best Operating Practices).
8.6 Free Basic Services
8.6.1 The indigent support policy
The basic principles of this policy are captured by indicating that the policy is to ensure that poor
households are not denied their constitutional right of access to services, the Intsika Yethu LM is required
to implement an indigent support policy that makes adequate financial provision to ensure the provision
of efficient and sustainable services to all residents within the area of jurisdiction.
The indigent support policy is an integral part of the Intsika Yethu’s tariff policy that is developed and
implemented in a transparent manner to ensure the sustainability of local public services to all of its
citizens at an affordable cost.
The indigent policy is intended to provide poor households on going access to a specified level of service.

Intsika Yethu IDP 2014-2015
Page 238
The subsidies contained in the policy should not compromise the quality or efficiency of service delivery.
Critically as part of Intsika Yethu LM commitment to improve continued access to service and provide a
basket of free services as part of the poverty alleviation programme.
8.7 Actual expenditure and revenue for 2013/2014
The following tables provide an overview of IYLM’s actual expenditure and revenue over the last financial
year audited, 2013/2014. From the tables provided it is clear that IYLM’s challenges remain with the cost
of employing staff. Unlike in previous years, the municipality has been particularly effective in utilizing the
grants allocated to it for infrastructure development. Furthermore, it has also managed to collect more
revenue than was originally planned.
Table 39: IYLM budgeted expenditure versus actual expenditure 2013/2014
Budget 2013/14 Actual 2013/2014
Variance
Audited
PERSONNEL COSTS Employee costs-Salaries 74364308 73443912 98.76%
Executive Committee and Council costs- Salaries
14235594 12729295 89.42%
SUB-TOTAL 67448870 85133469
GENERAL EXPENDITURE 69607687 49625248 71.29%
Repairs and maintenance of infrastructure
6452267 2302368 35.68%
SUB-TOTAL 32503930
CAPITAL PROJECTS 63516900 58005441 91.32%
TOTAL EXPENDITURE 228176756 196106264
There is a positive performance of budget over the actual in the year under review, which is an improvement on the
management of budget.
Table 40: IYLM budgeted revenue versus actual revenue 2013/2014
REVENUE BUDGET Budget 2013/14 Actual 2013/2014 Variance
Audited
EQUITABLE SHARE 99 780 000 99780000 100.00%
MIG 36043000 3604300 100%
WATER SERVICES 27203988 26627374 97.88%
FMG 1550000 1550000 100.00%
INEP 11000000 11000000
100%
MSIG 890 000 890000 100.00%
OTHER INCOME 25863081 23344865 90.26%
TOTAL REVENUE 202330069 199235239 101.60%

Intsika Yethu IDP 2014-2015
Page 239
Table 42: IYLM Government Grants and Subsidies Allocation
8.8 Financial Plan and Budget Statement
This plan is prepared in terms of Section 26 (h) of the Local Government: Municipal Systems Act, as
amended, which stipulates that a financial plan must be prepared as part of the Integrated Development
Plan.
The three year financial plan includes an Operating Budget and Capital Budget informed by the IDP
priorities. It takes into account the key performance areas of the IDP. All programmes contained in the
budget are reflected in the IDP. The review of the Municipality’s IDP has a ripple effect on the budget.
In addition to being informed by the IDP, the municipal fiscal environment is influenced by a variety of
macro-economic control measures. National Treasury determines the ceiling of year-on-year increases in
the total Operating Budget. Various government departments also affect municipal service delivery
through the level of grants and subsidies.
SUPPORTING TABLE PREVIOUS YR
PREVIOUS YR Current Year
Budgeted Year +1 Budgeted Year +1
2011/12
2012/13 2013/14
2014/15 2015/16
GOVERNMENT GRANTS AND SUBSIDIES - ALLOCATIONS
Actual Budgeted
Budgeted Budgeted
Budgeted
R'000 R'000
R'000 R'000
R'000
1. Equitable Share
78,414,940
88,676,000
99,780,000
115 999 000 145 974 000
2.
Municipal Systems Improvement Grant
790,000 800,000
890,000 934 000
930 000
3. Municipal Infrastructure Grant
25,935,000
31,461,000 35,042,0 00
38 856 000 40 362 000
4.
Finance Management Grant
1,500,000 1,500,000
1,550,000 1,600 000
1,675 000
5 . Integrated National Electrification Programme Grant
- 25,000,000
11,000,000
6 000 000
20 000 000
6 . EPWP
- 1,000,000
1,000,000 1 849 000
, Total Grants and Subsidies - National Government
106,639,940
148 ,437,000 1 4 9 ,262,000
165 238 000
208 941 000

Intsika Yethu IDP 2014-2015
Page 240
Table 41: Indicative 3 Year MTEF Draft Budget for IYLM
BUDGET COST CODES DESCRIPTION MEDIUM TERM BUDGET FRAMEWORK
PERSONNEL BASE LINE TOTAL
2015-2016 BUDGET
2016-2017 BUDGET
2017-2018
COUNCILLORS -
Basic Salary Councillors 10 331 800.33 10 941 376.54 11 543 152.25
Travelling allowance Councillors 2 243 223.04 2 375 573.20 2 506 229.72
Cellphone Allowance Councillors 973 497.21 1 030 933.55 1 087 634.89
Data Cards Councillors 157 248.00 166 525.63 175 684.54
Risk Policy for Councillors (service delivery protest) 461 260.80 488 475.19 515 341.32
-
EMPLOYEES -
Annual Bonus 4 013 877.22 4 250 695.97 4 484 484.25
Bargaining Council Levies 46 018.70 48 733.81 51 414.17
Basic Salary Employees 45 344 610.82 48 019 942.86 50 661 039.72
Cellphone Allowance employees 798 744.07 845 869.97 892 392.82
Housing Subsidy 2 086 290.76 2 209 381.92 2 330 897.92
Medical Aid Employees 3 197 407.74 3 386 054.79 3 572 287.81
Night Shift Allowance/ Shift Allowance/ Standby 289 616.75 306 704.13 323 572.86
Pension Fund employees 8 692 438.80 9 205 292.69 9 711 583.79
Relief Personnel 2 361 216.00 2 500 527.74 2 638 056.77
SALGA Levies 425 271.06 450 362.05 475 131.96

Intsika Yethu IDP 2014-2015
Page 241
Skills Development Levies(UIF/SDL) 965 826.53 1 022 810.30 1 079 064.86
Vehicle Travel Allowance 6 937 004.43 7 346 287.69 7 750 333.52
TOTAL 89 325 352.26 94 595 548.04 99 798 303.19
- - -
GENERAL EXPENSES - - -
Accomodation & Meals 1 035 769.00 1 096 879.37 1 157 207.74
Advertisements( Recruitment/IMBIZO/IDP/SDBIP/Valuation Roll/AFS/Budget Process
949 243.30 1 005 248.66 1 060 537.33
Annual Audit Committee fee 114 264.00 121 005.58 127 660.88
Annual Finacial Statements 2 540 000.00 2 689 860.00 2 837 802.30
Annual Report 198 000.00 209 682.00 221 214.51
Audit Fees 5 486 000.00 5 809 674.00 6 129 206.07
Bank Charges 201 180.02 213 049.64 224 767.37
Books & Publication 63 480.00 67 225.32 70 922.71
Camping equipment and accomodation 26 450.00 28 010.55 29 551.13
Catering 249 793.80 264 531.63 279 080.87
Cleaning Material 21 160.00 22 408.44 23 640.90
Conferences Venues and facilities(Strat Plan) 158 700.00 168 063.30 177 306.78
Consulting Fees (Engineering Planning) 1 007 956.57 1 067 426.01 1 126 134.44
Electricity 412 118.58 436 433.58 460 437.43
Engeneering and planning software costs 84 640.00 89 633.76 94 563.62

Intsika Yethu IDP 2014-2015
Page 242
Fuel & Oil (Motor Vehicles) 2 225 147.47 2 356 431.17 2 486 034.88
Fuel & Oil (Plant & Machinery) 3 174 000.00 3 361 266.00 3 546 135.63
Hire of Equipment & Vehicles 211 600.00 224 084.40 236 409.04
IDP Document/ SDBIP Document 104 478.09 110 642.30 116 727.63
Insurance - for Assets 960 540.00 1 017 211.86 1 073 158.51
Legal Fees 1 672 327.70 1 770 995.03 1 868 399.76
Licence & Registration ICT (Software) 542 267.32 574 261.09 605 845.45
Loan Repaymnet (DBSA) 1 058 000.00 1 120 422.00 1 182 045.21
Material & Stores 63 480.00 67 225.32 70 922.71
Motor Vehicle Repairs & Mantainance 2 381 505.10 2 522 013.90 2 660 724.67
Motor Vehicle Registration & Licences 954 697.24 1 011 024.38 1 066 630.72
Motor Vehicle Tracker Monitoring Management System 216 157.50 228 910.80 241 500.89
Office Equipment Rental (Leased equipment) 1 439 960.64 1 524 918.32 1 608 788.83
Office Equipment Repairs 74 060.00 78 429.54 82 743.16
Perfomance Management System 529 000.00 560 211.00 591 022.61
Postage 2 645.00 2 801.06 2 955.11
Pound Costs 10 580.00 11 204.22 11 820.45
Printing & Stationery 84 640.00 89 633.76 94 563.62
Proffesional Fees (Internal Audit/ Engineering/Traffic/Land Fill Site Management/GIS/Town Planner/
79 836.68 84 547.04 89 197.13
Protective Clothing 264 500.00 280 105.50 295 511.30
Provision for Bad Debts 1 798 600.00 1 904 717.40 2 009 476.86
Provision for Depreciation of Assets 37 030 000.00 39 214 770.00 41 371 582.35
Repairs & Mantainance Buildings 3 041 813.48 3 221 280.48 3 398 450.90

Intsika Yethu IDP 2014-2015
Page 243
Security Services/System-Motor Vehicles x 70 units 198 271.65 209 969.68 221 518.01
Security Sytems (Rental) RED GUARD 110 838.33 117 377.79 123 833.57
Subsistance & Travelling Reimbursement 988 910.00 1 047 255.69 1 104 854.75
Telephone - Data Line Rental 407 050.32 431 066.29 454 774.94
Telephone - Dignet Rental (VPN/ Internet) 393 576.00 416 796.98 439 720.82
Telephone - Usage ( Consumption ) 966 552.17 1 023 578.75 1 079 875.58
Training Expense 412 620.00 436 964.58 460 997.63
Transport - Flight Charges/ Tickets 859 665.15 910 385.40 960 456.59
Uniform - Staff 31 740.00 33 612.66 35 461.36
VAT Recovery Commission Expenditure 1 491 028.19 1 578 998.85 1 665 843.78
TOTAL GENERAL EXPENSES 76 328 843.31 80 832 245.07 85 278 018.55
OTHER OPERATING EXPENDITURE - - -
- - -
INFRASTRUCTURE PLANNIING AND DEVELOPMENT - - -
Town Planning and Land Use/ Land Survey 848 982.37 899 072.33 948 521.31
Road Maintenance (routen) 3 276 500.00 3 469 813.50 3 660 653.24
BUDGET AND TREASURY OFFICE - - -
FMG & MSIG - - -
Intergrated Financial System (Pastel & Payday) & (SCOA) 736 018.34 779 443.42 822 312.81
Interns Training & CPMD Programme 516 245.80 546 704.30 576 773.04
Interns ( Salaries ) 573 754.20 607 605.70 641 024.01
Asset Register (Revaluation of assets & asset register) 981 000.00 1 038 879.00 1 096 017.35

Intsika Yethu IDP 2014-2015
Page 244
Valuation Roll 1 308 000.00 1 385 172.00 1 461 356.46
OHS (Occupational health Safety Program and Compliance) 327 000.00 346 293.00 365 339.12
Wellness Programmes and EAP 218 000.00 230 862.00 243 559.41
COMMUNITY SERVICES DEPARTMENT - - -
Free Basic Services 4 680 000.00 4 956 120.00 5 228 706.60
Social needs 171 800.00 181 936.20 191 942.69
HIV AND AIDS Community Projects 100 000.00 105 900.00 111 724.50
Traffic Cards 100 000.00 105 900.00 111 724.50
LOCAL ECONOMIC DEVELOPMENT - - -
Business Plan Development 545 000.00 577 155.00 608 898.53
Dry Land Crop Production 2 000 000.00 2 118 000.00 2 234 490.00
Dipping Tanks 850 000.00 900 150.00 949 658.25
Refurbishment Of Dipping Tanks 271 200.63 287 201.47 302 997.55
Custom Feeding 886 672.73 938 986.42 990 630.67
SMME support initiatives 141 700.00 150 060.30 158 313.62
Eggs 163 500.00 173 146.50 182 669.56
ADMIN-MAYOR'S OFFICE - - -
Entertainment 240 224.44 254 397.68 268 389.55
Imbizo 525 797.42 556 819.47 587 444.54
Mayor's Cup 732 084.44 775 277.42 817 917.68
National day Celebration 229 773.71 243 330.36 256 713.52
EPWP 2 542 000.00 2 691 978.00 2 840 036.79
Offical Activities 728 189.00 771 152.15 813 565.52

Intsika Yethu IDP 2014-2015
Page 245
Pauper Burial 35 043.50 37 111.07 39 152.18
SPU 1 044 885.43 1 106 533.67 1 167 393.02
Contigencies 850 000.00 900 150.00 949 658.25
ADMIN-SPEAKER'S OFFICE - - -
Advance Councillor Training 327 000.00 346 293.00 365 339.12
Capacity Building 203 433.24 215 435.80 227 284.77
Ward Committees (Stipend) 3 296 160.00 3 490 633.44 3 682 618.28
Corporate Identity 235 563.57 249 461.82 263 182.22
Public Participation 206 218.18 218 385.05 230 396.23
- -
OTHER OPERATING EXPENDITURE 29 891 747.00 31 655 360.07 33 396 404.88
TOTAL OPERATING EXPENDITURE 195 545 942.57 207 083 153.18 218 472 726.61
CAPITAL EXPENDITURE - - -
OWN REVENUE FUNDED PROGRAMMES - - -
- - -
ICT Systems and Software Licensing 1 070 127.06 1 133 264.55 1 195 594.10
Motor Vehicles x 3 1 250 000.00 1 323 750.00 1 396 556.25
Office furniture & equipment 109 000.00 115 431.00 121 779.71
TRAFFIC MGT EQIUPT SYSTEM 350 000.00 370 650.00 391 035.75
EQUITABLE SHARE FUNDED PROGRAMMES - - -
Intangible Assets - (Computer Software/ M-Vehcl monitoring) 325 664.96 344 879.19 363 847.54
TRUCKS 3 400 000.00 3 600 600.00 3 798 633.00

Intsika Yethu IDP 2014-2015
Page 246
Sheep shearing sheds (Wool improvement programme) 1 900 000.00 2 012 100.00 2 122 765.50
IEC – QAMATA 1 700 000.00 1 800 300.00 1 899 316.50
Landfill (Contruction of a Cell) 1 122 700.00 1 188 939.30 1 254 330.96
MIG FUNDED PROGRAMMES - - -
PMU FUND 2 018 100.00 2 137 167.90 2 254 712.13
Upgrading gravel to surface (Tsomo Roads&stormwater) 4 471 085.26 4 734 879.29 4 995 297.65
Traffic Testing Station 12 626 875.04 13 371 860.67 14 107 313.00
Tsomo Street Lights & High Mast Phase 2 5 032 986.00 5 329 932.17 5 623 078.44
Cofimvaba Lighting &high mast phase 3 7 812 953.70 8 273 917.97 8 728 983.46
Fourty to Mawusheni Access Road 1 180 000.00 1 249 620.00 1 318 349.10
Xume to Nobhokwe Access Road 1 770 000.00 1 874 430.00 1 977 523.65
Mtwaku Access Road 1 770 000.00 1 874 430.00 1 977 523.65
Qumanco Access Road 1 910 000.00 2 022 690.00 2 133 937.95
Ngxwashu Access Road 1 770 000.00 1 874 430.00 1 977 523.65
INEP 20 000 000.00 21 180 000.00 22 344 900.00
TOTAL CAPITAL EXPENDITURE 71 589 492.01 75 813 272.04 79 983 002.01
TOTAL EXPENDITURE 267 135 434.59 282 896 425.23 298 455 728.62
REVENUE
BUDGETED REVENUE BUDGETED REVENUE BUDGETED REVENUE
- - -
BTO - Rental Income 109 833.33 116 313.50 122 710.74
BTO - Interest Received 325 428.22 344 628.48 363 583.05

Intsika Yethu IDP 2014-2015
Page 247
BTO - Tender Receipt 70 265.20 74 410.84 78 503.44
COM - Agency Fees 396 725.12 420 131.90 443 239.16
COM – Cemetry 4 905.00 5 194.40 5 480.09
COM - Learners Licence & Driving Licence 1 526 000.00 1 616 034.00 1 704 915.87
COM - Pound Fees 113 471.48 120 166.30 126 775.44
COM – Telecentre 32 700.00 34 629.30 36 533.91
COM - Town Hall Hire Receipt 33 080.70 35 032.47 36 959.25
COM - Traffic Fines 287 500.00 304 462.50 321 207.94
DEBTORS - Rates Receipts 3 919 150.95 4 150 380.86 4 378 651.80
DEBTORS - Refuse Receipts 404 940.10 428 831.57 452 417.30
DEBTORS - Rent Building 540 785.00 572 691.32 604 189.34
DEBTORS - SARS VAT RECOVERY 9 940 187.90 10 526 658.99 11 105 625.23
GRANTS - EPWP INCENTIVES 1 271 000.00 1 345 989.00 1 420 018.40
GRANTS - Equitable Share 145 974 000.00 154 586 466.00 163 088 721.63
GRANTS – FMG 1 675 000.00 1 773 825.00 1 871 385.38
GRANTS – INEP 20 000 000.00 21 180 000.00 22 344 900.00
GRANTS – MIG 40 362 000.00 42 743 358.00 45 094 242.69
GRANTS – MSIG 930 000.00 984 870.00 1 039 037.85
LED - Business Licence 19 866.50 21 038.63 22 195.75
TECH - Plan Approval Fees 55 494.08 58 768.23 62 000.48
TECH - Plant Hire 314 465.00 333 018.44 351 334.45
TOTAL 228 306 798.59 241 776 899.70 255 074 629.19
NET PROFIT(DEFICIT) (38 828 636.00) (41 119 525.53) (43 381 099.43)

Intsika Yethu IDP 2014-2015
Page 248

Intsika Yethu IDP 2014-2015
Page 249
8.9 Financial Recovery Plan
The Municipality has not uncounted any financial difficulties for the past 3 years, but to deal with such
instances in the near unforeseeable future, the Municipality has developed policies in the form of
Borrowing and Financing policy including our interactive corporation with organs of state (e.g. Treasury
and Local Government) to close any gaps before they transpire.
8.10 Summarized Financial Statements
It is the responsibility of the accounting officer to make sure that the annual financial statements are
prepared based on the prescribed format and submitted to Auditor General on time as prescribed by the
MFMA. The Financial Statements listed below relate to the last 2 years of audited financial information
2012/2013 financial years.

Intsika Yethu IDP 2014-2015
Page 250
Intsika Yethu Municipality
Financial Statement for the year ended 30 June 2013
Statement of Financial Position as at 30 June 2013
Figures in Rand Note(s) 2013 Restated 2012
Assets Current Assets 5 91 076 212 049 Inventories 6 3 668 533 20 498 009 Other Receivables 7 7 418 543 2 161 078 Receivables from non-exchange transactions 8 722 959 6 008 018 VAT receivable 9 6 038 748 938 413 Receivables from exchange transactions 10 7 722 364 6 859 152 25 662 223 36 676 719 Non-Current Assets 3 544 331 384 528 715 658 Property, plant and equipment 4 649 726 355 473 Intangible assets 544 981 343 529 071 131 Total Assets 570 643 566 565 747 850 Liabilities Current Liabilities Payables from exchange transactions 14 24 398 568 29 856 507 Unspent conditional grants and receipts 11 9 463 726 1 386 981 Provisions 12 906 675 404 165 Short-term borrowings 13 465 739 367 233 35 234 708 32 014 886 Non-Current Liabilities Long-term borrowings (DBSA) 13 8 297 504 8 763 242 Total Liabilities 43 532 212 40 778 128 Net Assets 527 111 354 524 969 722 Reserves Revaluation reserve 22 831 223 22 831 223 Other NDR 407 153 589 487 751 464 Accumulated surplus 97 126 542 14 387 035 Total Net Assets 527 111 354 524 969 722

Intsika Yethu IDP 2014-2015
Page 251
Intsika Yethu Municipality
Financial Statement for the year ended 30 June 2013
Statement of Financial Performance
Figures in Rand Note(s) 2013 Restated 2012
Revenue Revenue from exchange transaction Service charges 16 4 258 163 2 899 388 Rental of facilities and equipment 24 885 378 757 618 Income from agency services 512 904 461 826 Licences and permits 1 123 773 846 919 Other income 18 2 434 856 4 798 800 Interest receive-investment 41 874 49 450 Total revenue from exchange transactions 9 256 948 9 814 001 Revenue from non-exchange transactions Taxation revenue Property rates 15 8 987 332 3 726 368 Transfer revenue Government grants& subsidies 17 167 227 042 128 197 618 Total revenue from non-exchange transaction 176 214 374 131 923 986 Total revenue 185 471 322 141 737 987 Expenditure Personnel 20 75 974 944 63 857 787 Remuneration of councillors 21 9 158 525 5 047 598 Depreciation and amortisation 22 33 999 990 32 829 271 Finance costs 23 492 051 618 973 Repairs and maintenance 4 481 394 3 432 462 Bulk purchases 26 598 936 1 118 250 Grants and subsidies paid 25 5 423 898 6 350 008 General expenses 19 47 816 506 79 461 764 Total expenditure 177 946 244 192 716 113 Operating surplus (deficit) 7 525 078 (50 978 126 Gain or Loss on disposal of asset 283 015 90 794 Surplus (deficit) for the year 7 808 093 ( 50 887 332)

Intsika Yethu IDP 2014-2015
Page 252
Intsika Yethu Municipality
Financial Statement for the year ended 30 June 2013
Statement of Changes in Net Assets
Figures in Rand Revaluation reserve Other NDR Total reserves Accumulated surplus Total net asset
Opening balance as previously reported -485 937 394 485 937 394 85 088 654 571026 048
Adjustments
Prior year adjustments - 1 814 070 1 814 070 (19 814 287) (18 000 217)
Balance at 01 July 2012 Restated 487 751 464 487 751 464 65 274 367 553 025 831
Changes in net assets
Surplus for the year - - (50 887 332) (50 887 332
Property Revalued 22 831 223 - 22 831 223 - 22 831 223
Total changes 22 831 223 22 831 223 (50 887 332) (28 056 109
Balance at 01 July 2012 22 831 223 487 751 464 510 582 687 14 387 035 524 969 722
Restated
Changes in net assets
Correction of error - 31 442 267 - 31 442 267 - 31 442 267
Surplus for the year - - - 7 808 093 7 808 093
Prior year adjustments - (112 040 142) (112 040 142) 74 931 414 (37 108 728
Total changes (80 597 875) (80 597 875) 82 739 507 2 141 632
Balance at 30 June 2013 22 831 223 407 153 589 429 984 542 97 126 542 527 111 354
Note(s)

Intsika Yethu IDP 2014-2015
Page 253
Intsika Yethu Municipality
Financial Statement for the year ended 30 June 2013
Cash Flow Statement
Figures in Rand Note(s) 2013 Restated 2012
Cash flows from operating activities
Receipts
Grants 39 029 424 24 657 081
Interest income 41 874 49 450
Other receipts 59 185 714 282 739 600
98 257 012 307 446 131
Payments
Employee costs (18 126 717) (13 925 919
Finance costs (492 051) (618 973)
(18 618 768 )( (14 544 892
Net cash flows from operating activities 27 79 638 244 292 901 239
Cash flow from investing activities
Purchase of property, plant and equipment 3 (78 197 009) (306 549 580)
Proceeds from sale of property, plant and equipment 3 283 015 90 794
Purchase of other intangible assets 4 (493 806) (335 333)
Net cash flows from investing activities (78 407 800) (306 794 119)
Cash flows from financing activities
Movement in long-term borrowings (dbsa) (367 232) 9 130 475
Other non-cash item - 202 083
Net cash flows from financing activities (367 232) 9 332 558
Net increase/(decrease)in cash and cash equivalents 863 212 (4 560 322)
Cash and cash equivalents at the beginning of the year 6 859 152 11 419 474
Cash and cash equivalents at the end of the year 10 7 722 364 6 859 152
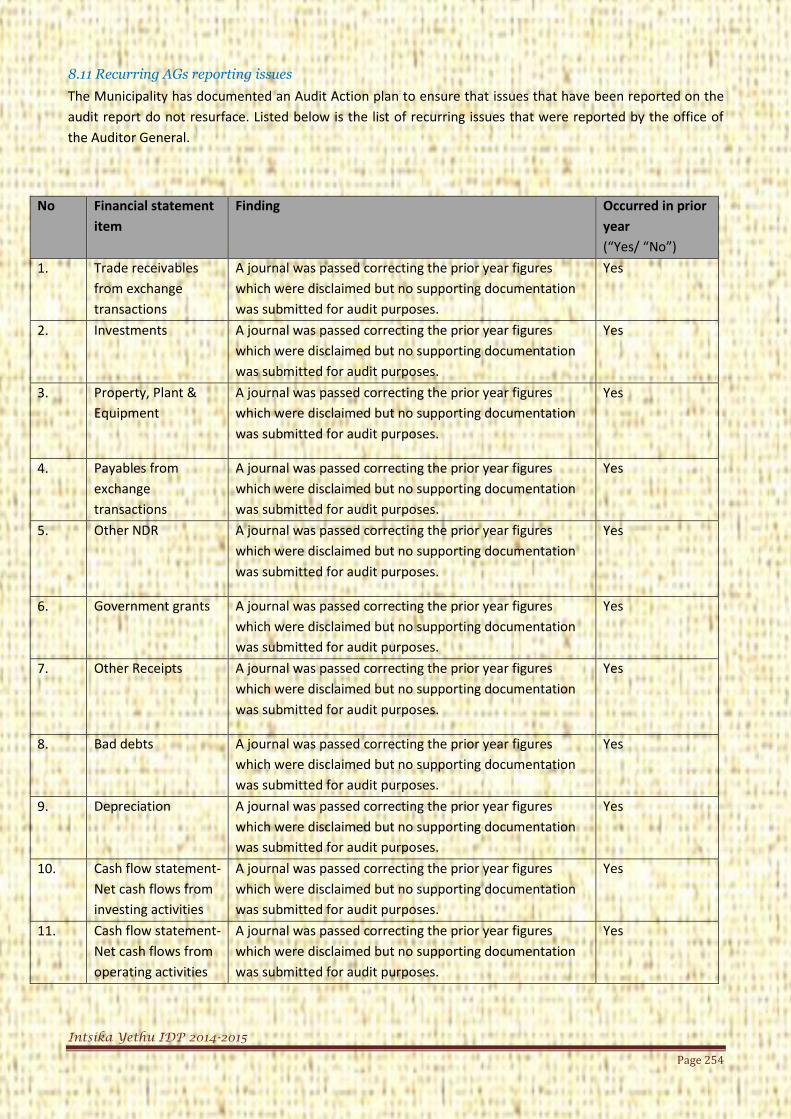
Intsika Yethu IDP 2014-2015
Page 254
8.11 Recurring AGs reporting issues
The Municipality has documented an Audit Action plan to ensure that issues that have been reported on the
audit report do not resurface. Listed below is the list of recurring issues that were reported by the office of
the Auditor General.
No Financial statement
item
Finding Occurred in prior
year
(“Yes/ “No”)
1. Trade receivables
from exchange
transactions
A journal was passed correcting the prior year figures
which were disclaimed but no supporting documentation
was submitted for audit purposes.
Yes
2. Investments A journal was passed correcting the prior year figures
which were disclaimed but no supporting documentation
was submitted for audit purposes.
Yes
3. Property, Plant &
Equipment
A journal was passed correcting the prior year figures
which were disclaimed but no supporting documentation
was submitted for audit purposes.
Yes
4. Payables from
exchange
transactions
A journal was passed correcting the prior year figures
which were disclaimed but no supporting documentation
was submitted for audit purposes.
Yes
5. Other NDR A journal was passed correcting the prior year figures
which were disclaimed but no supporting documentation
was submitted for audit purposes.
Yes
6. Government grants A journal was passed correcting the prior year figures
which were disclaimed but no supporting documentation
was submitted for audit purposes.
Yes
7. Other Receipts A journal was passed correcting the prior year figures
which were disclaimed but no supporting documentation
was submitted for audit purposes.
Yes
8. Bad debts A journal was passed correcting the prior year figures
which were disclaimed but no supporting documentation
was submitted for audit purposes.
Yes
9. Depreciation A journal was passed correcting the prior year figures
which were disclaimed but no supporting documentation
was submitted for audit purposes.
Yes
10. Cash flow statement-
Net cash flows from
investing activities
A journal was passed correcting the prior year figures
which were disclaimed but no supporting documentation
was submitted for audit purposes.
Yes
11. Cash flow statement-
Net cash flows from
operating activities
A journal was passed correcting the prior year figures
which were disclaimed but no supporting documentation
was submitted for audit purposes.
Yes

Intsika Yethu IDP 2014-2015
Page 255
No Financial statement
item
Finding Occurred in prior
year
(“Yes/ “No”)
12. Cash & cash
equivalent
Comparative figure that was disclaimed in the prior year
not corrected and no supporting documentation was
provided for audit purposes.
Yes
13. Cash and Bank
equivalents
No supporting documentation submitted Yes
14. Cash and Bank TB does not agree to the balance disclosed in the AFS Yes
15. Cash and Bank Reconciling items and bank reconciliation not cleared
timorously
Yes
16. Immovable assets Infrastructure assets not on the register and not verified Yes
17. Movable assets Depreciation not correctly calculated Yes
18. Operational
expenditure
Amounts recorded do not agree to supporting
documentation
Yes
19. Payables Trade payables with credit balances Yes
20. SCM Request for quotation not advertised for at least 7 days Yes
21. Provisions Supporting documentation for landfill site still in a draft
format
Yes
22. Receivables Interest not levied or incorrectly levied on debtors account Yes
23. Reserves Limitation of scope on non-distributable reserves
movements
Yes
24. Revenue New connections not billed for water Yes
25. Unauthorised
expenditure
Overspending not recognised as unauthorised expenditure Yes
26. Vat Vat disclosed on cash basis instead of accrual basis Yes
8.12 Internal Controls
The Municipality has a functional Audit Committee that reports to the Council on a quarterly basis. This
committee with the assistance of the Internal Audit unit ensures that the municipality has effective internal
controls in place, these controls are tested on a regular basis to ensure that they are effective.
There is a Risk Manager, which is a new post that has recently been created within the Municipality, there has
been a risk management framework and risk policy that has recently been documented and communicated to
the staff members. Risk assessment/ management is the responsibility of management and management
ensures that this assessment is conducted on a yearly basis.
Every year during the preparation of the Financial Statement the Municipality prepares an accounting file
which is in line with the treasury regulations as to the format of the file and all the contents that are to be on
the file are documented and filed

Intsika Yethu IDP 2014-2015
Page 256
9.1 Financial Policies
9.1 Amendments to Budget Related Policies
The MFMA and the Budget and Reporting Regulations require budget related policies to be reviewed, and
where applicable, be updated on an annual basis.
A review of the existing budget related policies indicated that significant changes are required at this stage.
The following amended budget related policies are submitted herewith for final adoption:
Rates Policy
Supply Chain Management Policy
Cash and Investment Policy
Fleet Management Policy
9.2 New Policies proposed
Borrowing Policy
Funding and Reserves Policy
Policy related to long term financial plan
Policy relating to infrastructural investment and capital projects
Budget Implementation Plan
Policies related to Management of losses
Policy on Pauper Burials
Policy on Lease of Property
Policy on Unauthorized/irregular and wasteful expenditure
Policy on Contingent Liabilities
Policy on Related Party Disclosures
Policy on VAT
Policy on delegation of authority
Policy on catering
Policy on GRAP Disclosures
Policy on Journal Entries
Policy on Capital Commitments
9.3 History of Audit Reports
Qualification 2008/2009
Disclaimer 2009/2010

Intsika Yethu IDP 2014-2015
Page 257
Disclaimer 2010/2011
Disclaimer 2011/2012
Adverse 2012/2013
IYLM has developed an action plan to address all the audit queries and has strengthened the internal audit
unit for the better monitoring of the implementation of this plan.
10. Supply Chain Management and Contract Management
10.1 Supply Chain Management Processes and Procedures
Supply Chain Management Policy is in place for financial year under review and is due for reviewal
for the next financial year 2015/2016. Supply Chain Management Processes and Procedures are in
place and were communicated to all departments through workshops.
10.2 Bid Committees
There are three bid committees: bid specification, bid evaluation and bid adjudication committee.
When the municipality contracts for goods or services, it makes use of competitive bidding / a public
call for tenders for contracts over R200 000 as well as for long term contracts. A competitive bidding
process generally consists of different stages, for example, compiling bid specifications, advertising
the bid, the receipt and evaluation of bids, and the award and implementation of the contract. The
Municipal Supply Chain Management Regulations require a municipality’s Supply Chain
Management Policy to provide for a committee system to oversee the different stages. Bid committee
system consists of a bid specification committee, a bid evaluation committee and a bid adjudication
committee. The challenge pertaining to the implementation of the committee system is the lack of
training of bid committee members to clearly understand the roles of responsibilities.
Recommendation
To build capacity of bid committee members who serve on bid specification, bid evaluation and bid
adjudication committees so that all members are equipped with elements of SCM model that apply to
bid committee system. Training will help them apply knowledge of applicable regulatory framework
to ensure compliance and will educate them about the importance of ethical conduct at all stages of
bid committee process.
10.3 Contract management
Contract management is the proactive monitoring, review and management of contractual terms
secured through the procurement process to ensure that what is agreed is actually delivered by
suppliers or partners. Contract Register is maintained and updated regularly.
Currently SCM does not have contract management officer and propose to have a staff dedicated to
contract management as this function is very key in ensuring compliance with the terms and
conditions agreed and documenting and agreeing any changes or amendments that may arise during
contract implementation or execution

Intsika Yethu IDP 2014-2015
Page 258
Chapter 6: Approval
This FINAL IDP Review 2015/16 was be tabled to council for adoption on the 26 May 2015 and thereafter,
comments were invited from affected and interested parties via an advert in local papers and municipal website.
The interested groups and or all stakeholders (communities, NGO’s,CBO’s ) were given at least 21 working days
from the date of advert to make their comments to be included in the final IDP.
Following receipt of comments from various interests groups and local communities via ward consultative
engagements and mayoral Imbizos, inputs were considered and drafted into a FINAL document.
A separate sector departmental engagement was organised during this comments period in order to invite and
discuss their comments and inputs in terms of their planned 2015/16 commitments in our municipality.
Thereafter, the drafting team produced a FINAL IDP review 2015/16 document which was tabled to council on
the 26 May 2015 together with budget for adoption and implementation with effect from 01 July 2015.
Copies of final IDP and Budget were then forwarded to relevant authorities such as MEC for local government
in the province, the District and other development agencies that will be lobbied to contribute to the
development agenda of municipality.
DECLARATION OF ADOPTION
Council resolution date for adoption of the Draft IDP document:
............26/05/2015.......................
SIGNATURES
............................................. ...................................
Z. Shasha DATE
MUNICIPAL MANAGER
.............................................. ...................................
K. Vimbayo DATE
MAYOR

Intsika Yethu IDP 2014-2015
Page 259
Annexure A: Strategy and Sector Plan Overview
The following provides an overview of plans and strategies currently in existence with IYLM and indicates
the year in which they were adopted. Where plans and strategies are in existence, they were considered
and informed the compilation of the IDP 2012-2017.
Table 1: Existing Strategies and Plans
Existing Strategies and Plans
Title Financial Year Adopted
Human Resource Strategy 2009/2010
Fire Response Plan 2008/2009
Fraud and Prevention Plan 2009/2010
HIV/AIDS Strategy 2009/2010
Tourism Strategy 2008/2009
LED Strategy 2007/2008
Small Towns Development Plan 2010/2011
Spatial Development Framework 2008/2009
Workplace Skills Plan 2008/2009
Employment Equity Plan 2008/2009
Audit Turnaround Plan 2011/2012 (March)
Waste Management Plan 2011/2012
Ward AIDS Council Plan 2011/2012
SDF Review 2012/2013
The table below gives an overview of those plans or strategies currently under development within IYLM
or currently in existence with the District Municipality. Where a document is in progress, it could not be
said to have an influence on the content of the document, whereas plans that were with CHDM were
implicitly considered in the compilation of the IDP.
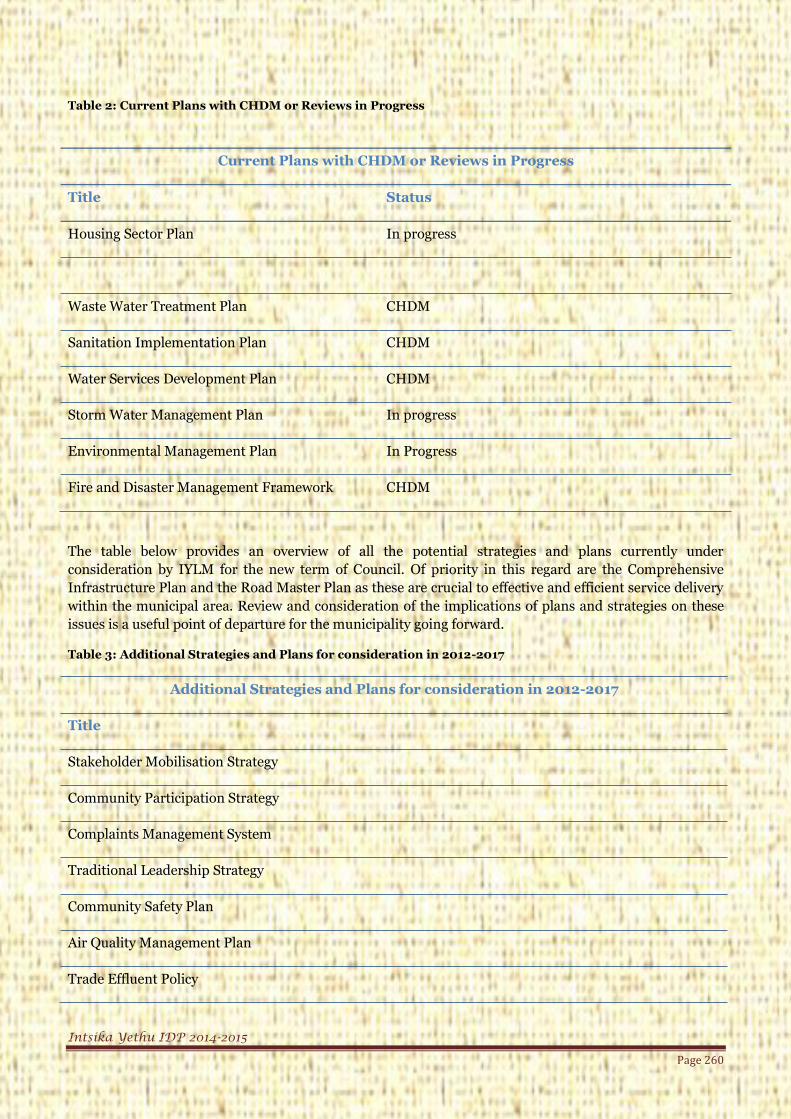
Intsika Yethu IDP 2014-2015
Page 260
Table 2: Current Plans with CHDM or Reviews in Progress
The table below provides an overview of all the potential strategies and plans currently under
consideration by IYLM for the new term of Council. Of priority in this regard are the Comprehensive
Infrastructure Plan and the Road Master Plan as these are crucial to effective and efficient service delivery
within the municipal area. Review and consideration of the implications of plans and strategies on these
issues is a useful point of departure for the municipality going forward.
Table 3: Additional Strategies and Plans for consideration in 2012-2017
Additional Strategies and Plans for consideration in 2012-2017
Title
Stakeholder Mobilisation Strategy
Community Participation Strategy
Complaints Management System
Traditional Leadership Strategy
Community Safety Plan
Air Quality Management Plan
Trade Effluent Policy
Current Plans with CHDM or Reviews in Progress
Title Status
Housing Sector Plan In progress
Waste Water Treatment Plan CHDM
Sanitation Implementation Plan CHDM
Water Services Development Plan CHDM
Storm Water Management Plan In progress
Environmental Management Plan In Progress
Fire and Disaster Management Framework CHDM

Intsika Yethu IDP 2014-2015
Page 261
Additional Strategies and Plans for consideration in 2012-2017
Title
Leachate Management Plan
Integrated Transport Plan
Roads Master Plan
Migration Plan
Land Degradation and Revitalisation Plan
Land Asset Register
Comprehensive Infrastructure Plan