introduction. we do experiments in human-computer interaction because we want to know... is...
TRANSCRIPT

Introduction
Experiments in HCI
We do experiments in Human-Computer Interaction because we want to know ...
Is product A better than product B?
What is good and bad about X?
Testing design principles and methods
Etc. etc.

Experiments in HCI Experimentation in HCI is all about
people
As they will use the products we develop
But we also – less often - do experiments without human involvement e.g. testing software capabilities Strictly speaking this is not HCI, but
usually a people-oriented aim

Experiments in HCI
Raw materials for experiments:
People On their own horribly complex and
varied things to test ... And we usually run tests with groups
of people!
Computer interfaces And software, experiences, designs, art,
etc. etc.
Experiments in HCI
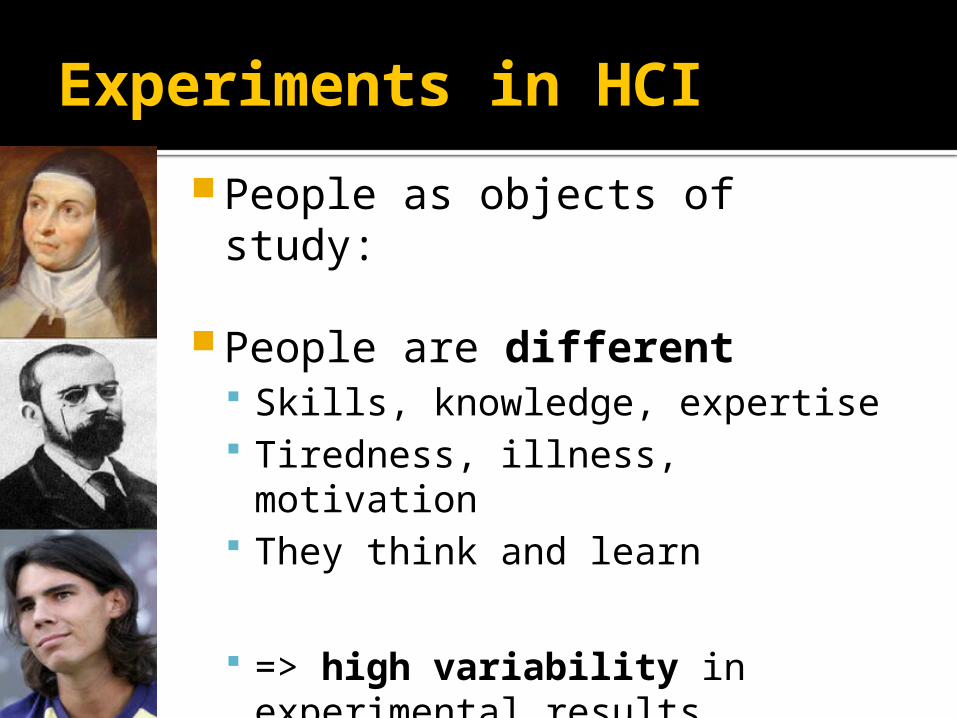
People as objects of study:
People are different Skills, knowledge, expertise Tiredness, illness, motivation They think and learn
=> high variability in experimental results
=> hard to obtain significant results

Experiments in HCI
People are also subject to complex effects, that are hard to control for (measure the effect of) in experiments
Time of day effects Tiredness, post-lunch dip, etc.
Transfer effects Learning and interference
Experiments in HCI
Other problem is that of context: Experiments can be done in the field or the laboratory Each their own strengths and
weaknesses
Since we usually involve groups of people, we have problems with accounting for the effect of social dynamics ... and group relationships – how do
they impact on what we want to measure?

Experiments in HCI Finding subjects for experiments is (also)
challenging
Nearly always, we have specific criteria that we would like participants to fulfill Females, age 30+, driving a powder-blue prius, who
likes liqourice
Often we do not have the money to pay people, so
hard to get the right ones
This leads to the problem of most Psychology and HCI experimental research being done with Psychology and Computer Science undergraduate students But how representative are they of the target
population we are interested in?

”Statistics is the least
of your problems!”
Alan Dix, ”Avoiding Damned Lies”
Statistics
Statistics is a tool for analyzing data from experiments and deriving meaning from them
Statistics is a logical process – each type of problem has one or more statistical methods that can be employed
If you can identify the problem, you can find the statistical test to use
Finding help/guides for statistical tests is pretty easy

Statistics
Statistics is primarily used when we are looking for ”broad and shallow” results Using surveys, data logging, large
experiments When using quantitative methods (i.e.
Getting numbers as data) If we want meaning – in-debt
knowledge about just a few subjects, we use qualitative methods (numbers as data) Video logs, not post-task walkthroughs,
anecdotal evidence, etc.
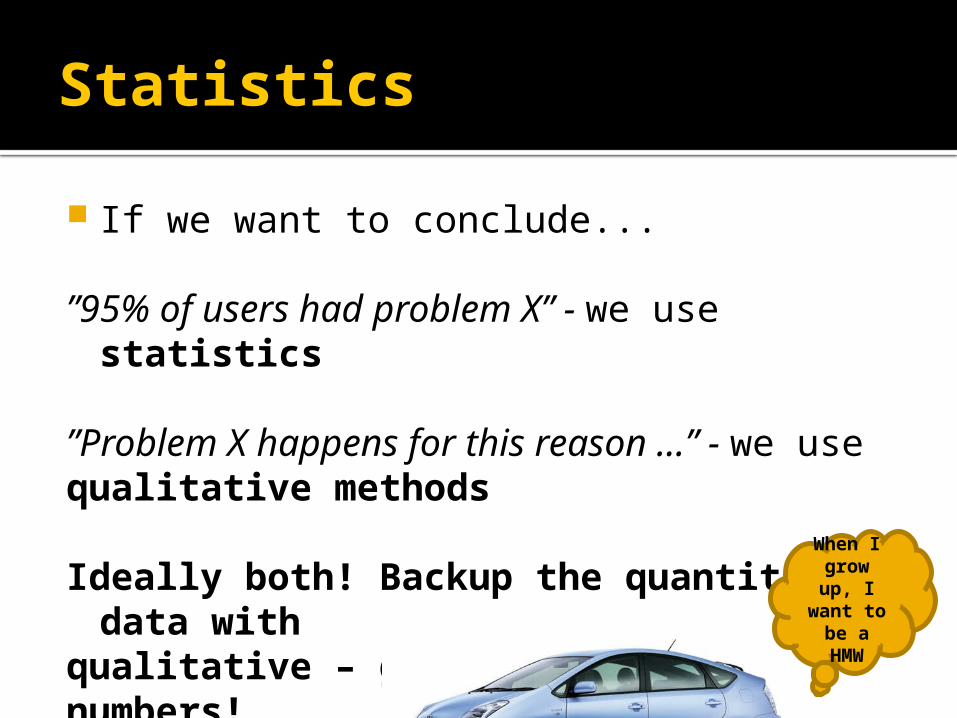
Statistics
If we want to conclude...
”95% of users had problem X” - we use statistics
”Problem X happens for this reason ...” - we use
qualitative methods
Ideally both! Backup the quantitative data with
qualitative – give meaning to the numbers!
When I grow up, I
want to be a HMW

Statistics
Statistics are an incredibly powerful tool for an HCI person (interaction design, usability, whatever ...)
In this course, focus on applying statistical methods to analyze experimental data
Some qualitative methods also, but mostly this is in the course Target Group Analysis

A powder-blue prius

The rest of the lecture
Practical information about the course
Course objectives
Course textbooks
Course plan
Exercise: Table-top hockey experiment

About your course convener Center for Computer Games Research
Mostly teaches at DDK-line
Empirical researcher: Science by experimentation
Mostly focused on experiments with humans (annoying bastards!)
User experience analysis in interactive applications Games, websites, etc.
Practical information
Lectures Wednesday 10-12 in room: 4A22
Exercises Wednesdays 13-15 in room: 4A58
Exercises starts at 13.00 – ends at 15.00 (you can stay longer if you wish!)
Handouts for exercises on the course website (generally the week before):
http://experimentdesign.wordpress.com
Things to know ...
Read the course handbook carefully – it contains important information (it is available on the website)
On the website you will find handouts, exercise guides and other documents used in the course, as well as updates and messages from the course convener:
http://experimentdesign.wordpress.com
Aims of the course:
Basic grounding in research skills and research methodology
Designing and running experiments
Data analysis using statistics, SPSS and Excel
Writing up studies using standard presentation conventions
Designing questionnaires and fielding surveys
Ethics in research
Laws of interaction design

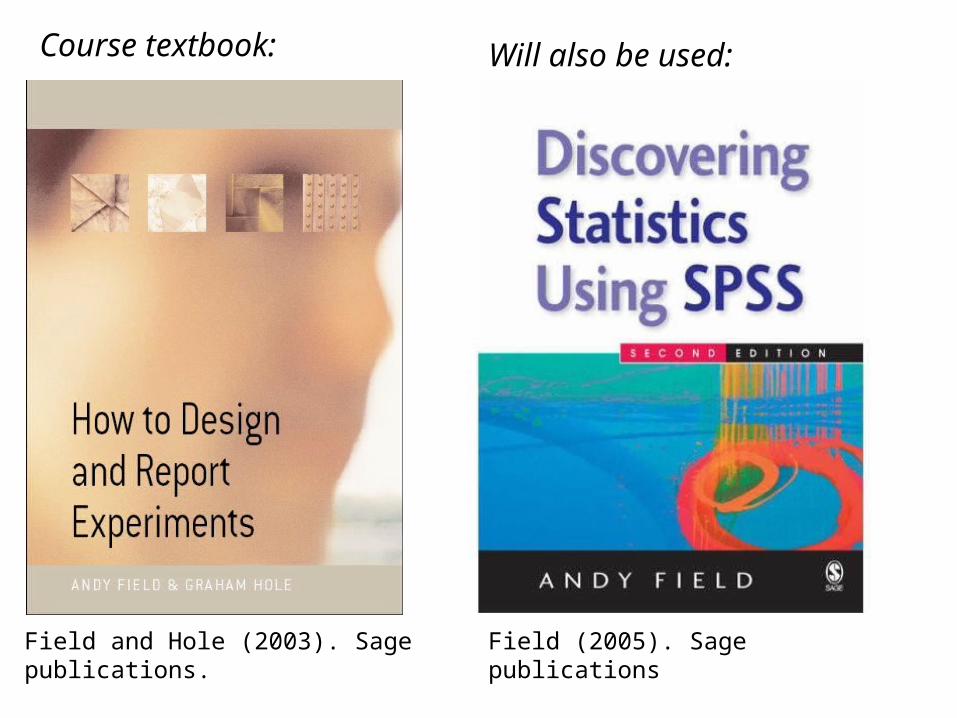
Course textbook:
Field and Hole (2003). Sage publications.
Sage, 2006
Will also be used:
Field (2005). Sage publications

Don´t loose your textbook
You will be using it throughout the course

Other good statistics textbooks:
Pearson / Prentice Hall 2005 Pearson / Prentice Hall 2004

Exam and assessment
The course will be assessed 100% via the final exam
Exam is written, with aids, on a PC, but minus internet access.
Exam will focus on testing your understanding of the principles taught in the course
It will focus on problem solving and thinking, not remembering the curriculum word by word
Note that changes may happen …
During the course there will be an assortment of assignments, some to be handed in, some to present, during the semester These do not count towards your grade Without doing them you will learn nothing …

Getting assistance
This is a method course, which can be intimidating
If you need help, get help – problems are easier to fix early on
Primary help: Ask you co-students and the people in your group
Secondary: Contact the course convener during office hours
Office hours: Thursday 10.30-12.00, Monday 10-30-12. Room 4B06.
DO NOT disturb outside office hours
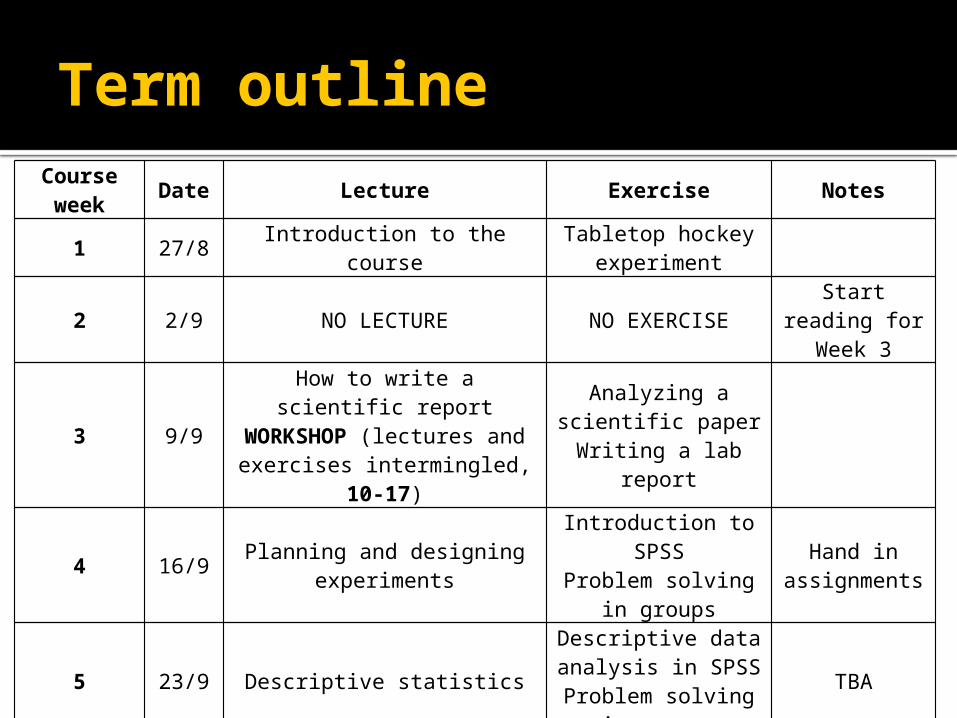
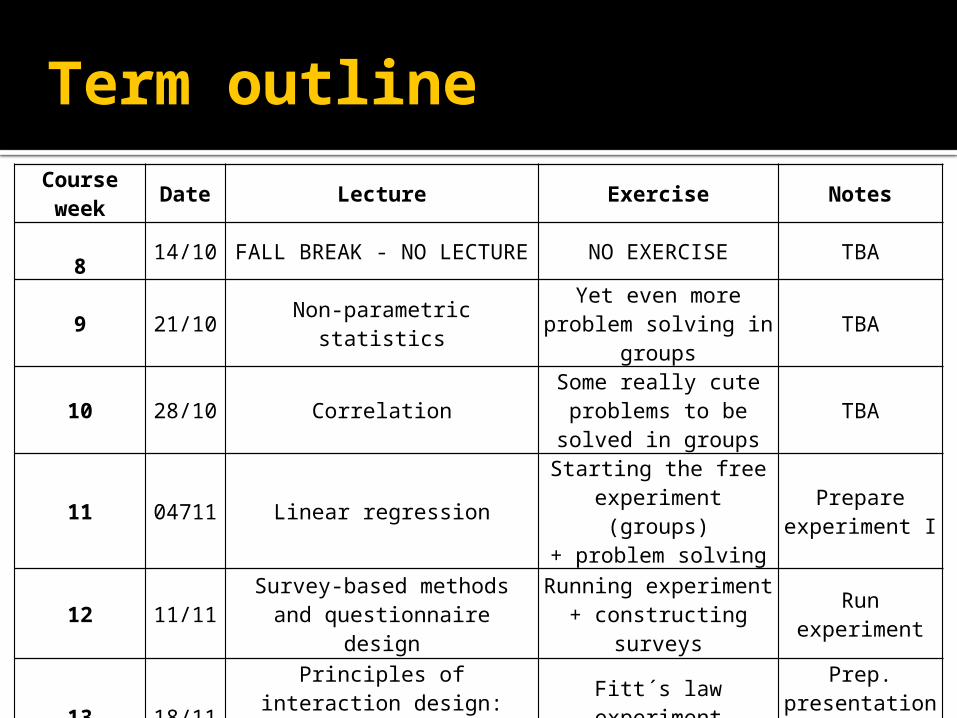
Term outlineCourse week Date Lecture Exercise Notes
1 27/8 Introduction to the courseTabletop hockey
experiment
2 2/9 NO LECTURE NO EXERCISEStart reading for
Week 3
3 9/9How to write a scientific report
WORKSHOP (lectures and exercises intermingled, 10-17)
Analyzing a scientific paper
Writing a lab report
4 16/9 Planning and designing experimentsIntroduction to SPSSProblem solving in
groups
Hand in assignments
5 23/9 Descriptive statistics
Descriptive data analysis in SPSS
Problem solving in groups
TBA
628/9 and 29/9
28/9 lecture, room 4A22 10-12: The normal distribution and
hypothesis testing
29/9 Exercise, room 2A52 13-15: Creating graphs in
ExcelProblem solving in groups
TBA
7 7/10 Parametric statisticsPerforming ANOVA in SPSS & other fun tasks
TBA
Term outline
Course week Date Lecture Exercise Notes
8 14/10 FALL BREAK - NO LECTURE NO EXERCISE TBA
9 21/10 Non-parametric statisticsYet even more problem
solving in groupsTBA
10 28/10 CorrelationSome really cute problems
to be solved in groupsTBA
11 04711 Linear regressionStarting the free
experiment (groups)+ problem solving
Prepare experiment I
12 11/11Survey-based methods and
questionnaire designRunning experiment
+ constructing surveysRun experiment
13 18/11Principles of interaction design: Fitt´s law and the Power Law of
Practice
Fitt´s law experiment (groups)
Prep. presentation of experiment
14 02/12Ethics in research
Introduction to the examPresentations of
experiment resultsTBA
Reading
Each week there will be some core reading From Field & Hole Or from the compendium
Some weeks there is also optional reading suggested – strongly encouraged that you read this (I will be watching you ...)
Plagiarism and collusion
Plagiarism: Passing of someone else´s work or ideas as your own. Don´t do it – risk being expelled or
taking the course again
Collusion: Working with someone else and claiming that the jointly-produced work is entirely your own Important point: When NOT working in
groups, your work must be unique to you

Questions?

Tabletop hockey experiment
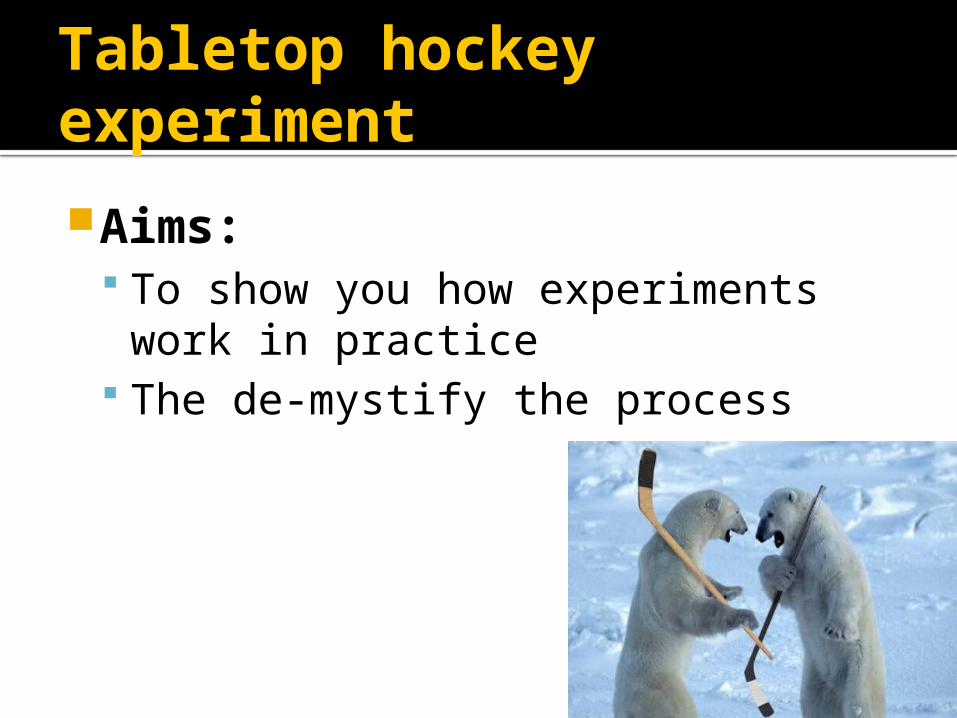
Tabletop hockey experiment
Aims: To show you how experiments work
in practice The de-mystify the process
Outline
Testing how far an improvised hockey puck travels under different conditions
Two factors (or conditions) are involved: Shot type Puck placement along stick
Each factor has two levels (or values): Shot type: Wrist shot, slap shot Puck placement: Near end of stick,
middle of stick

Outline
So we have 2 factors with 2 levels: This is called a ”two level factorial design” – a very traditional experiment design in engineering sciences
The aim is to test all possible combinations of factors and levels – here 4:Value A Value B
Factor 1 Short end of stick Long end of stick Factor 2 Slap shot Wrist shot
Outline
In order to make sure our results are valid, we need to run each combination multiple times
Do 10 shots with each combination. Record distance travelled for each shot
Make sure you set up each shot exactly according to the guidelines – otherwise you introduce experimental error
Outline
Follow the experimental procedure in the handout
The handout is on the course website:www.experimentdesign.wordpress.com
Follow the guidelines for how to analyze the experimental data + answer the questions given
When everyone are done we will discuss the results jointly in class

Questions?