introduction to the georgia student growth model
DESCRIPTION
Introduction to the Georgia Student Growth Model. Understanding and Using SGPs to Improve Student Performance. Why focus on student growth?. Previously, we have focused on status … What percentage of students met state expectations? - PowerPoint PPT PresentationTRANSCRIPT

Introduction to the Georgia Student Growth ModelUnderstanding and Using SGPs to
Improve Student Performance
1
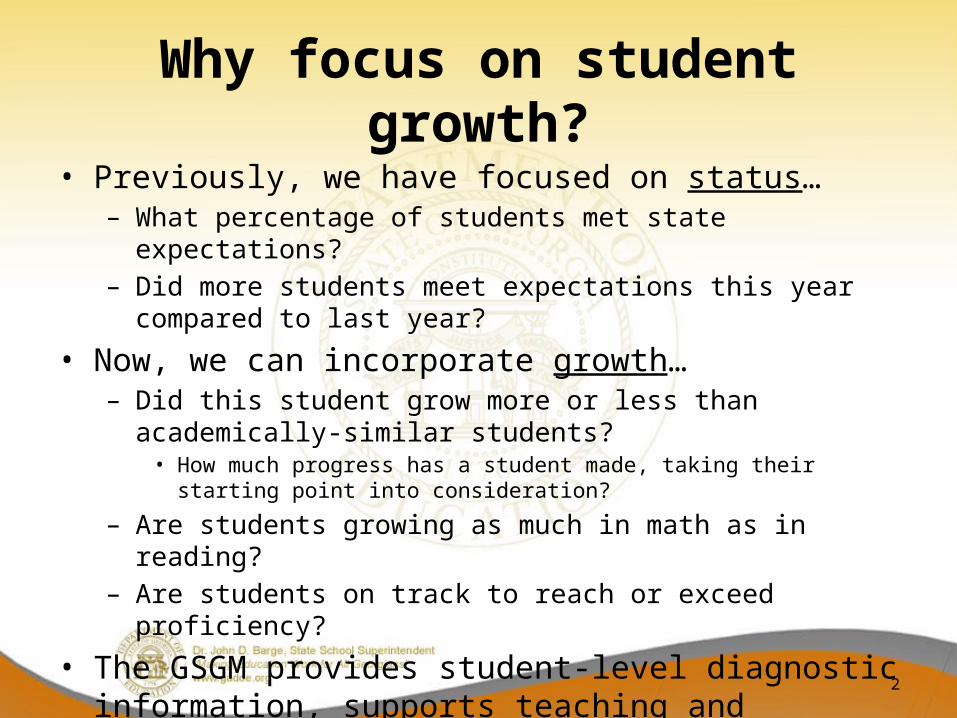
Why focus on student growth?• Previously, we have focused on status…
– What percentage of students met state expectations?– Did more students meet expectations this year compared to last year?
• Now, we can incorporate growth…– Did this student grow more or less than academically-similar students?
• How much progress has a student made, taking their starting point into consideration?
– Are students growing as much in math as in reading? – Are students on track to reach or exceed proficiency?
• The GSGM provides student-level diagnostic information, supports teaching and learning, enhances accountability (CCRPI), and serves as one of multiple indicators of educator effectiveness (TKES and LKES).
2

Growth Under NCLB
• How many students have made it over the proficiency bar (% Meets/Exceeds)?
• Inferences about growth are made longitudinally across different cohorts of students
3
School 2008 2009 2010 2011
Acme ES 80 85 91 96
Clubhouse ES 75 79 86 90
Fraggle ES 73 75 74 71No growth?
Fast growth, different starting points

What do we know about student-level growth?
• All information about student test performance has been collapsed into 3 criterion-referenced levels
• We cannot compare scale scores as the tests are not vertically scaled
• Leaves many important questions about progress unanswered
4
Grade 4 5 6 7 8Marvin M. Meets Meets DNM DNM DNMOlive O. Meets Meets Meets Meets MeetsDonald D. Meets Meets Meets Exceeds Exceeds

Understanding Percentiles
5
A distribution, for example, of height, weight, or academic growth
50% 50%
50th percentile
The 50th percentile is the value below which 50% of the distribution lies.

Student Change in Status
6
16% 50%
If a student goes from scoring better than 16% of all students in grade 4 to scoring better than 50% of students in grade 5, would this be evidence that growth had occurred?
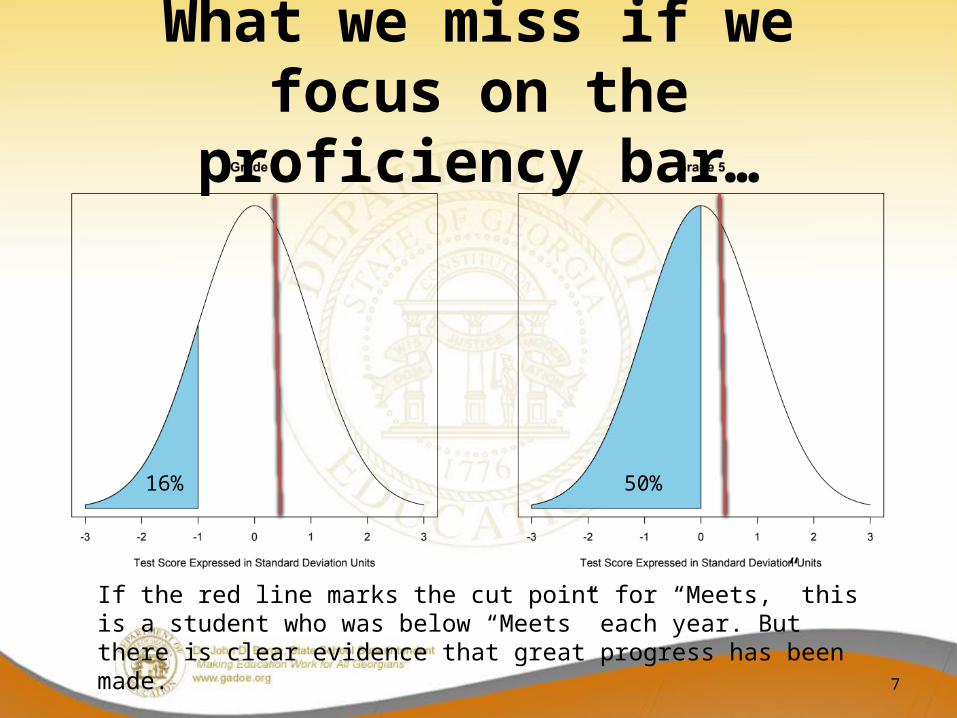
What we miss if we focus on the proficiency bar…
7
16% 50%
If the red line marks the cut point for “Meets,” this is a student who was below “Meets” each year. But there is clear evidence that great progress has been made.

Student Growth Percentiles• A student growth percentile (SGP) describes a student’s
growth relative to academic peers– Academic peers are other students statewide with a similar score
history– This ensures a student’s starting point is considered when measuring
his or her growth• Growth percentiles range from 1 to 99
– Lower percentiles indicate lower academic growth and higher percentiles indicate higher academic growth
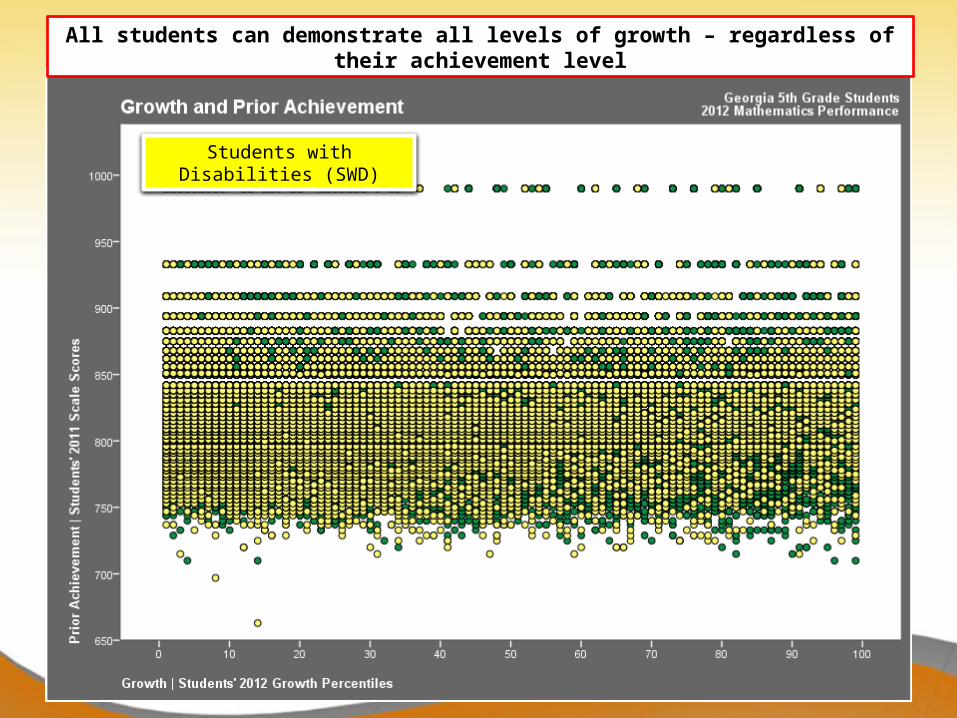
• All students, regardless of their achievement level, have the ability to demonstrate all levels of growth
9
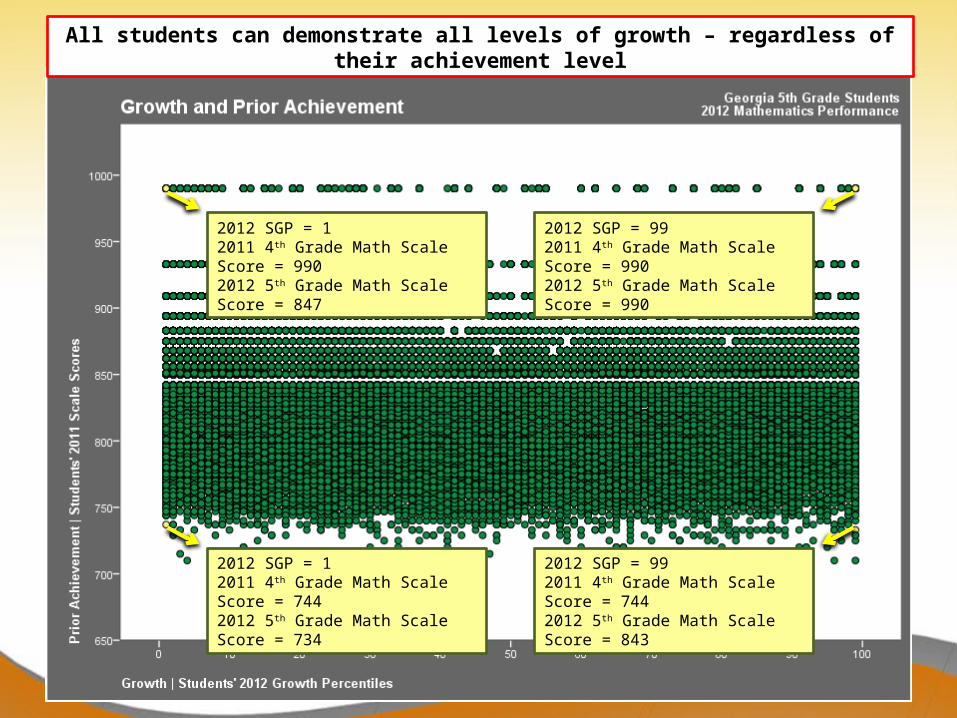
2012 SGP = 12011 4th Grade Math Scale Score = 9902012 5th Grade Math Scale Score = 847
2012 SGP = 992011 4th Grade Math Scale Score = 9902012 5th Grade Math Scale Score = 990
2012 SGP = 12011 4th Grade Math Scale Score = 7442012 5th Grade Math Scale Score = 734
2012 SGP = 992011 4th Grade Math Scale Score = 7442012 5th Grade Math Scale Score = 843
All students can demonstrate all levels of growth – regardless of their achievement level
All students can demonstrate all levels of growth – regardless of their achievement level
Students with Disabilities (SWD)
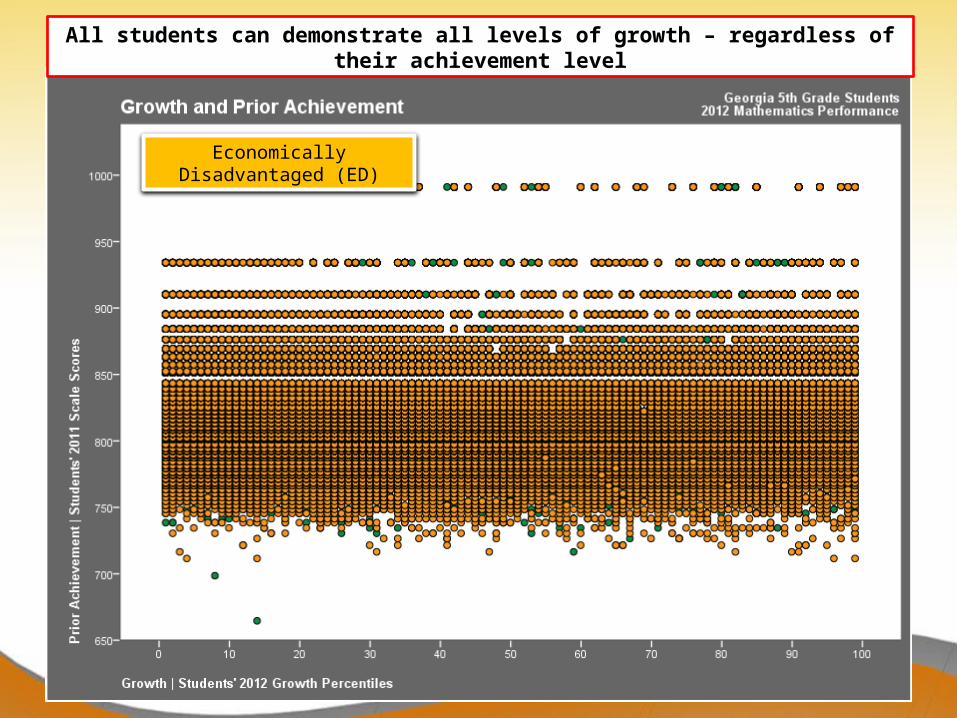
All students can demonstrate all levels of growth – regardless of their achievement level
Economically Disadvantaged (ED)

All students can demonstrate all levels of growth – regardless of their achievement level
English Language Learners (ELL)
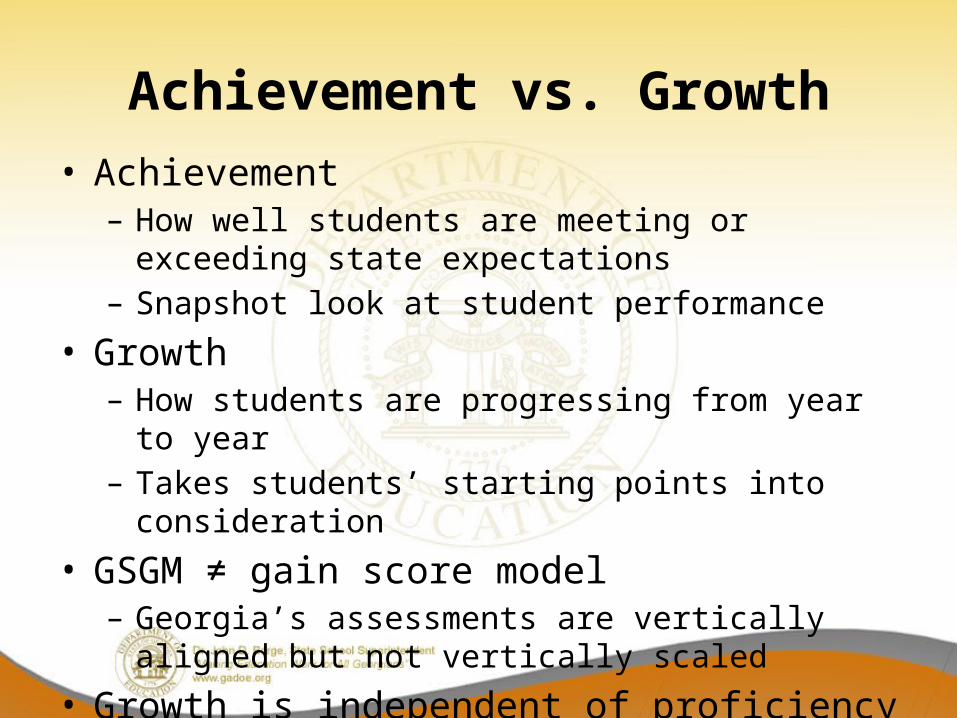
Achievement vs. Growth• Achievement
– How well students are meeting or exceeding state expectations
– Snapshot look at student performance• Growth
– How students are progressing from year to year– Takes students’ starting points into consideration
• GSGM ≠ gain score model– Georgia’s assessments are vertically aligned but not
vertically scaled• Growth is independent of proficiency cuts
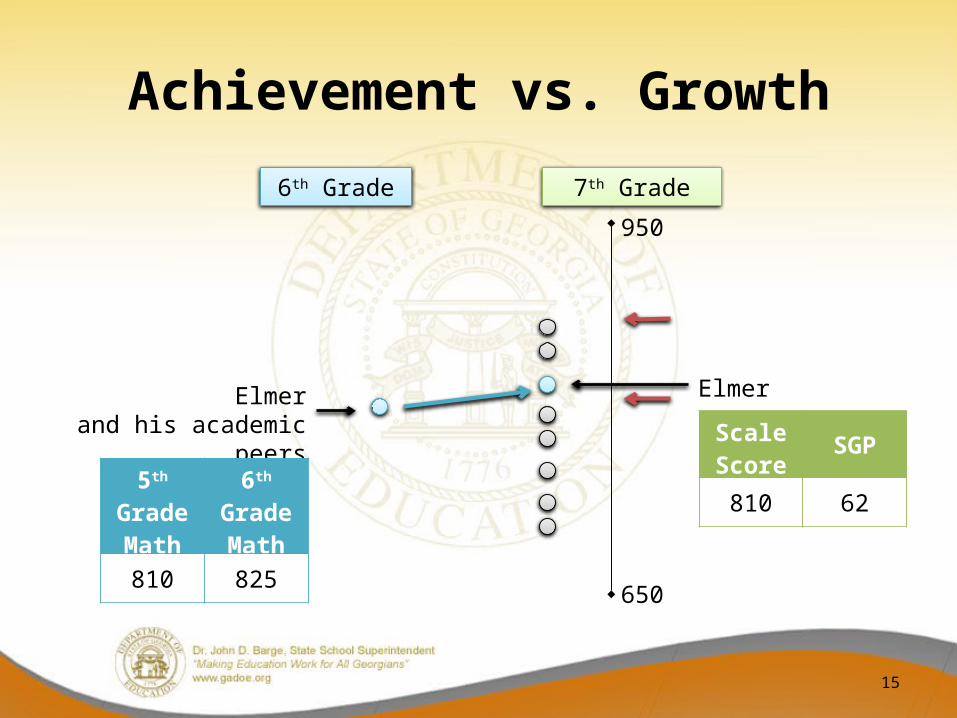
Achievement vs. Growth
15
650
950
Elmerand his academic peers
5th Grade Math
6th Grade Math
810 825
7th Grade
Elmer
Scale Score SGP
810 62
6th Grade
Transitioning to New Assessments
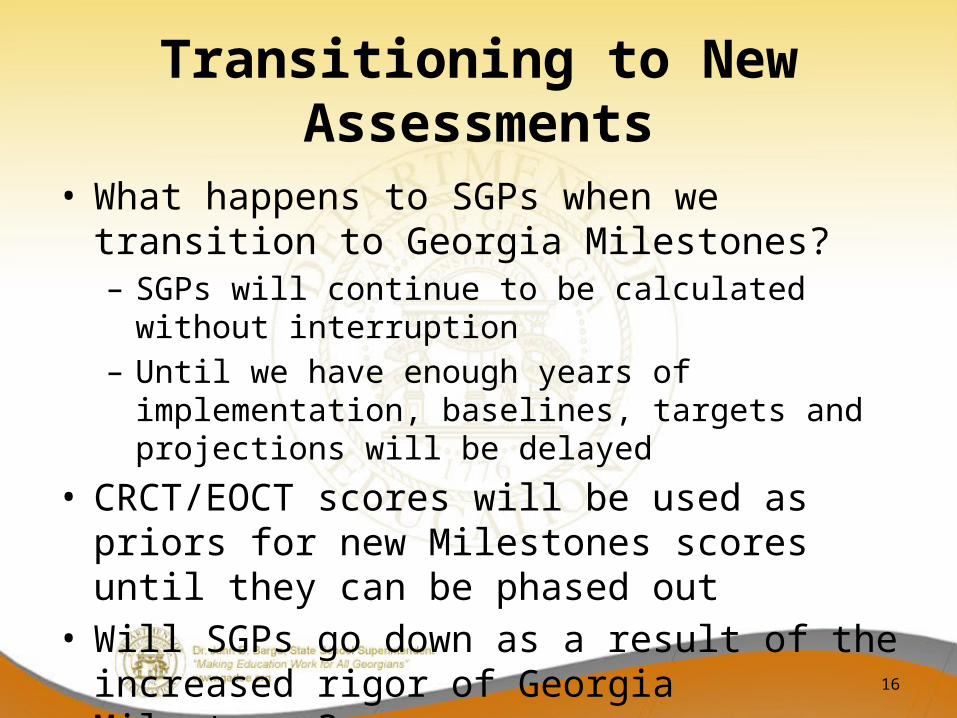
• What happens to SGPs when we transition to Georgia Milestones?– SGPs will continue to be calculated without interruption– Until we have enough years of implementation, baselines,
targets and projections will be delayed• CRCT/EOCT scores will be used as priors for new
Milestones scores until they can be phased out• Will SGPs go down as a result of the increased rigor
of Georgia Milestones?– No because…
16
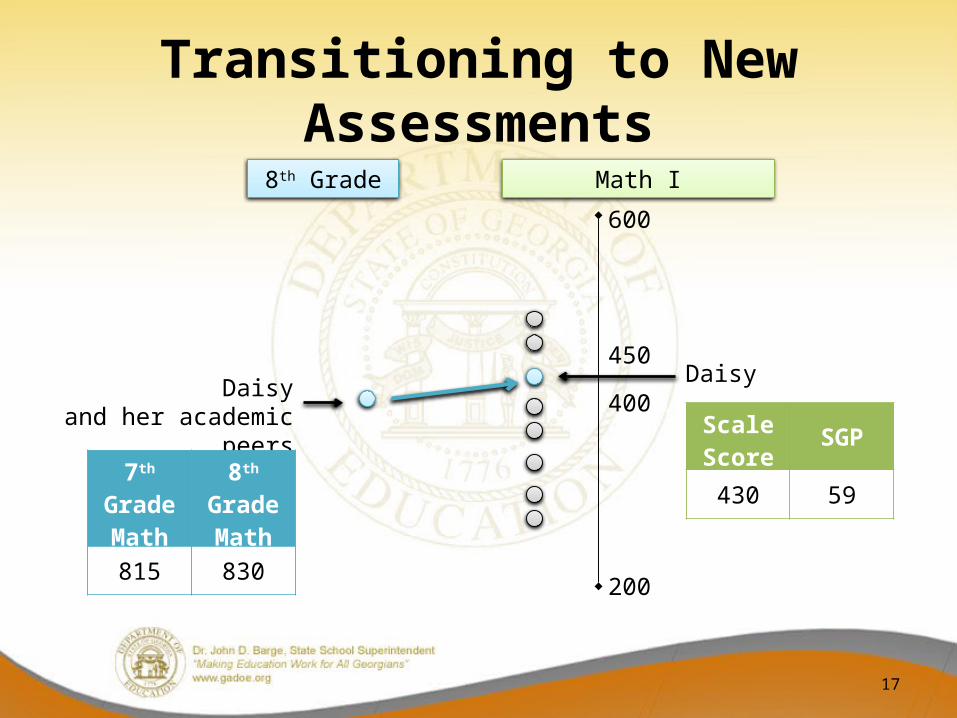
Transitioning to New Assessments
17
200
600
Daisyand her academic peers
7th Grade Math
8th Grade Math
815 830
450
400
Math I
Daisy
Scale Score SGP
430 59
8th Grade
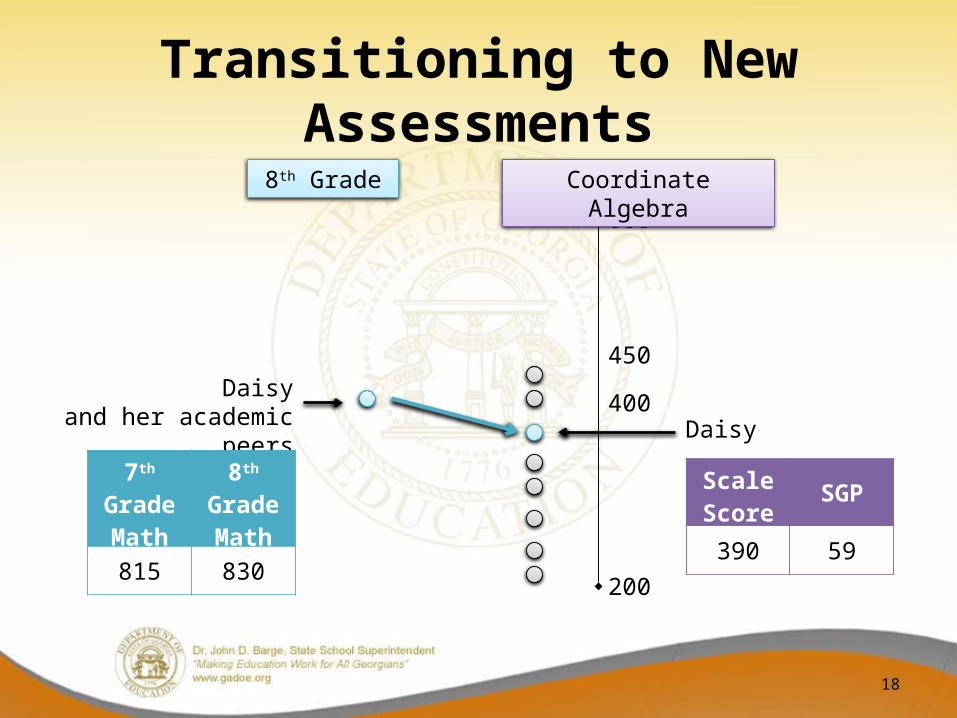
Transitioning to New Assessments
18
200
600
Daisyand her academic peers
7th Grade Math
8th Grade Math
815 830
450
400
Coordinate Algebra
Daisy
Scale Score SGP
390 59
8th Grade
EOCT Test Progressions
• For EOCTs, both prior achievement and test sequence (including year taken) must be considered.
• While most EOCT students will receive SGPs, those participating in uncommon sequences (small N) will not receive SGPs
• Most common sequences:– ELA: CRCT reading/ELA → 9th Grade Lit → American Lit– Math: CRCT math → Coordinate Algebra → Analytic Geometry– Science: CRCT science → Physical Science/Biology → Biology/Physical
Science– Social Studies: CRCT social studies → US History → Economics
19

Cohort- and Baseline-Referenced SGPs• Cohort-referenced SGPs
– A student’s growth is relative to academically-similar students in the state that year
– Student and school growth is relative to the state– Can continue to be reported during an assessment transition
• Baseline-reference SGPs– A baseline is used as a reference point so change in statewide growth
can be used from year to year– A student’s growth is relative to academically-similar students from
the baseline– All students can demonstrate lower or higher growth than students in
the baseline– Cannot continue to be reported during an assessment transition
20
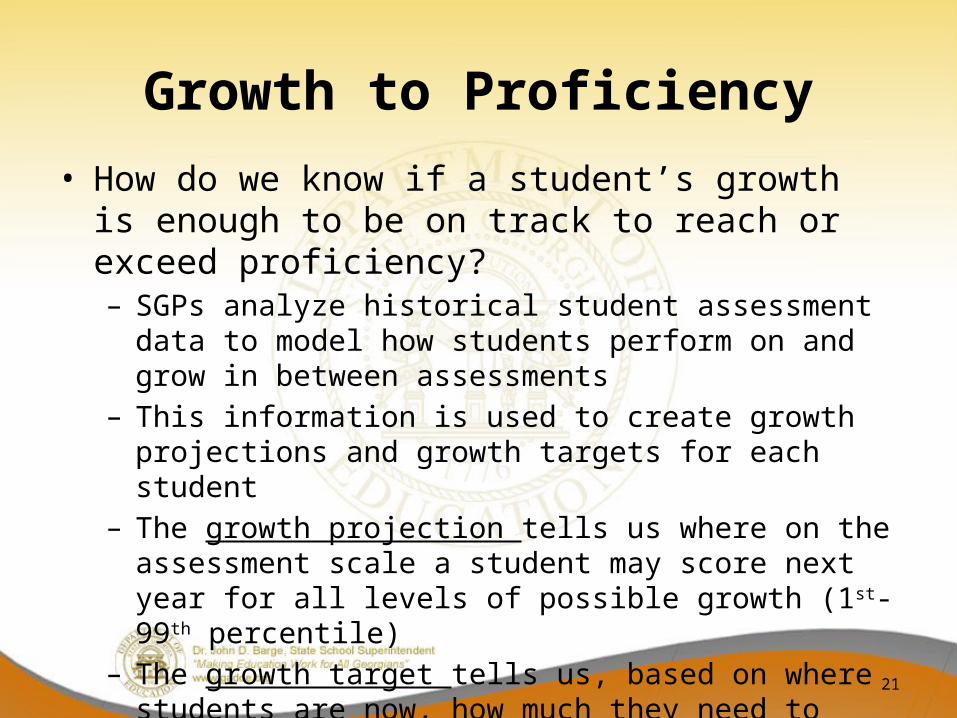
Growth to Proficiency• How do we know if a student’s growth is enough to be
on track to reach or exceed proficiency?– SGPs analyze historical student assessment data to model how
students perform on and grow in between assessments– This information is used to create growth projections and
growth targets for each student– The growth projection tells us where on the assessment scale a
student may score next year for all levels of possible growth (1st-99th percentile)
– The growth target tells us, based on where students are now, how much they need to grow to reach or exceed proficiency in the future
21
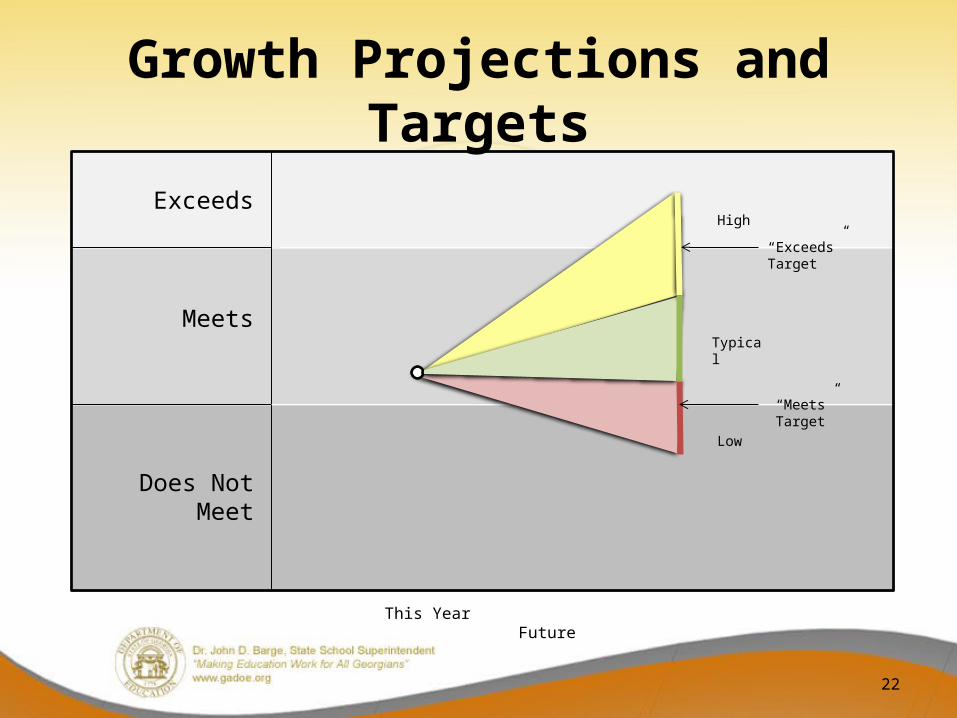
Growth Projections and Targets
22
Exceeds
Meets
Does Not Meet
This Year Future
High
Typical
Low
“Meets” Target
“Exceeds” Target
Student Growth Levels• Low (1-34), Typical (35-65), and High (66-99)• Levels were set using information about the
interaction between student growth and status-based achievement– A student who demonstrates low growth generally will
regress academically (i.e., not maintain his/her current level of achievement)
– A student who demonstrates typical growth generally will maintain or improve academically
– A student who demonstrates high growth generally will make greater improvement academically
23
CRCT SGP Example
• Example 1 (real data, fake names)– Acme Middle School
• Only middle school in district• Has 3 6th-grade mathematics teachers
– Mr. W.E. Coyote• Taught 6th grade mathematics in 2012• Taught 116 students in 5 classes
24

How did Mr. Coyote’s students do on the 6th grade mathematics CRCT?
25
12 scored Does Not
Meet
85 scored Meets
19 scored Exceeds
90% of students (104 of 116) met the state standard
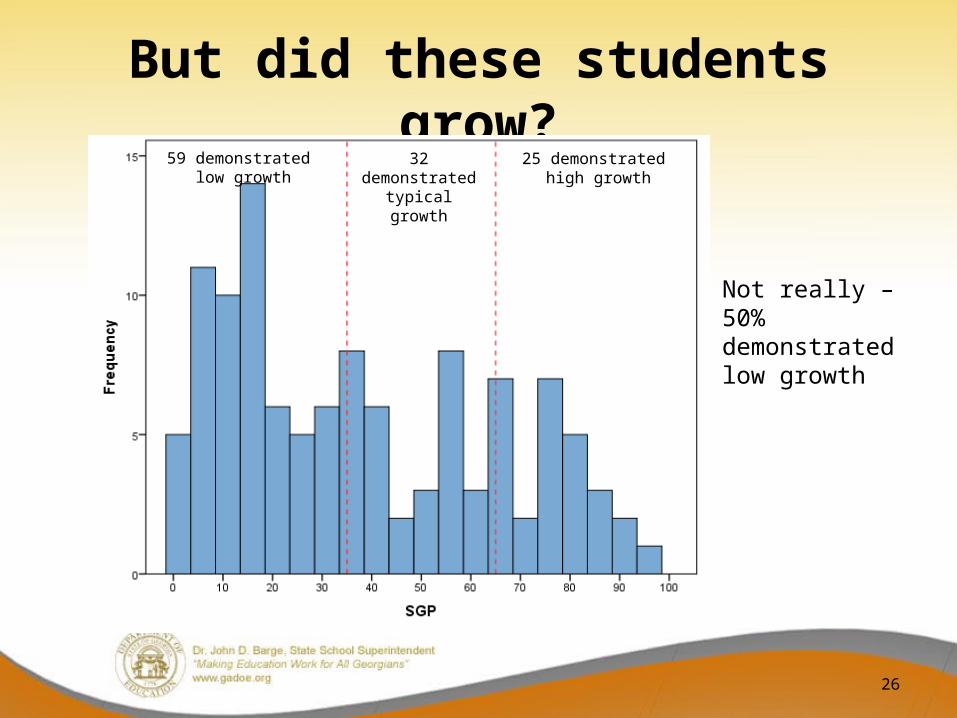
But did these students grow?
26
59 demonstrated low growth
32 demonstrated typical growth
25 demonstrated high growth
Not really – 50% demonstrated low growth
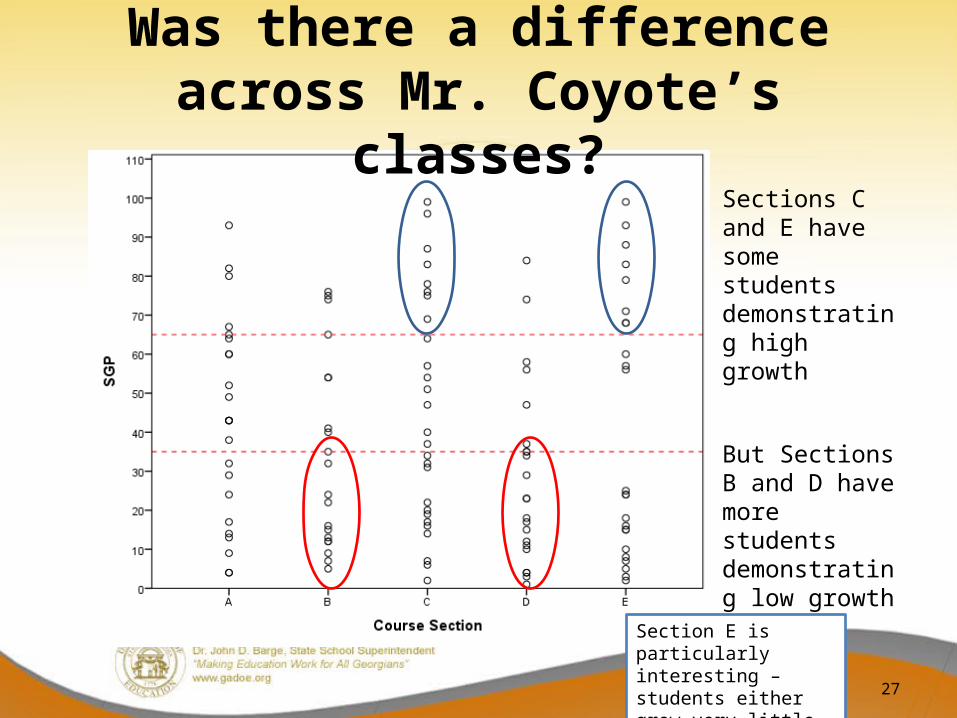
Was there a difference across Mr. Coyote’s classes?
27
Sections C and E have some students demonstrating high growth
But Sections B and D have more students demonstrating low growth
Section E is particularly interesting – students either grew very little or a lot

Was there a difference across student performance levels?
28
Why did students who
started the year below
standards not grow much
with this teacher?
Why did these
students grow more than other
students with the same
prior performance
level?
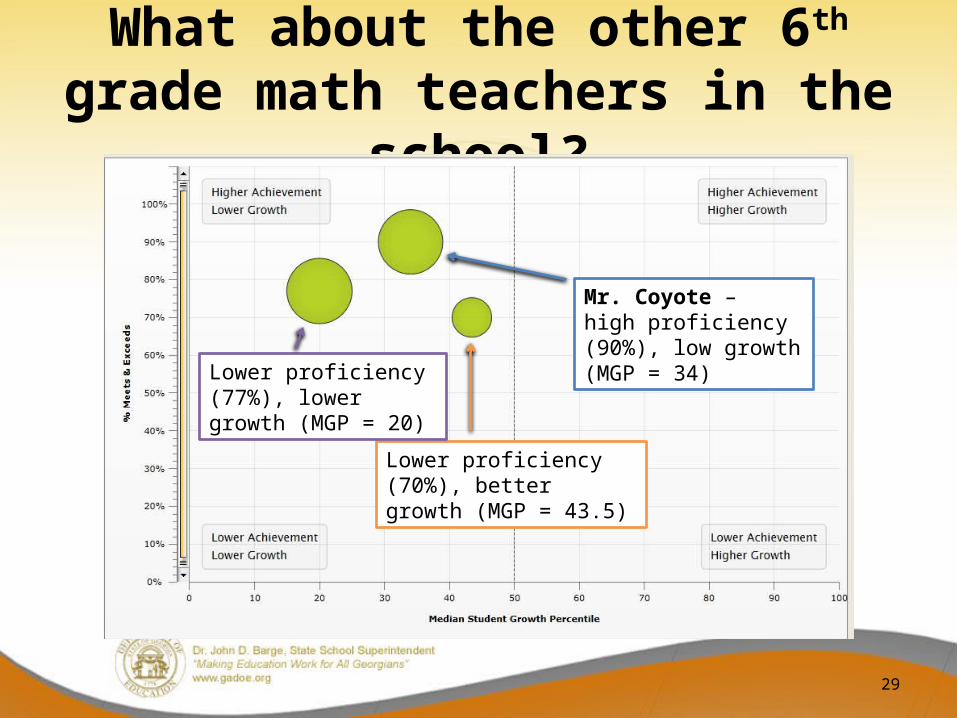
What about the other 6th grade math teachers in the school?
29
Mr. Coyote – high proficiency (90%), low growth (MGP = 34)
Lower proficiency (70%), better growth (MGP = 43.5)
Lower proficiency (77%), lower growth (MGP = 20)
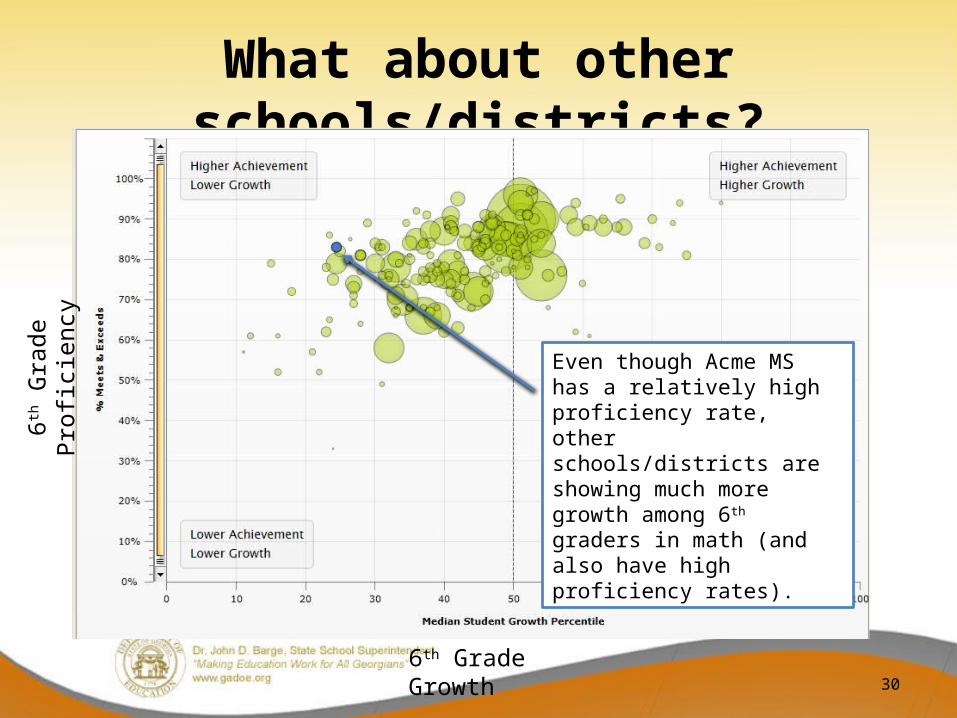
What about other schools/districts?
30
Even though Acme MS has a relatively high proficiency rate, other schools/districts are showing much more growth among 6th graders in math (and also have high proficiency rates).6th
Gra
de P
rofic
ienc
y
6th Grade Growth
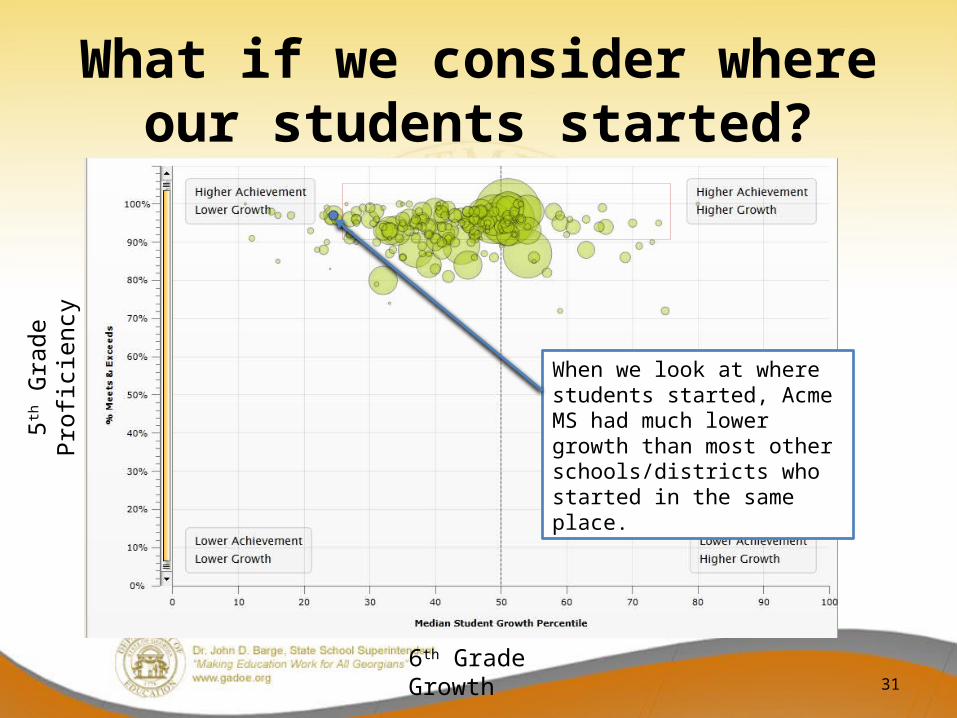
What if we consider where our students started?
31
When we look at where students started, Acme MS had much lower growth than most other schools/districts who started in the same place.5th
Gra
de P
rofic
ienc
y
6th Grade Growth
EOCT SGP Example
• Example 2 (real data, fake names)– Clubhouse High School
• Urban• One of many high schools in district• Has 12 9th-Grade Literature teachers in 2012
– Ms. M. Mouse• Taught 9th Grade Literature in 2012• Taught 28 students in 3 classes
32
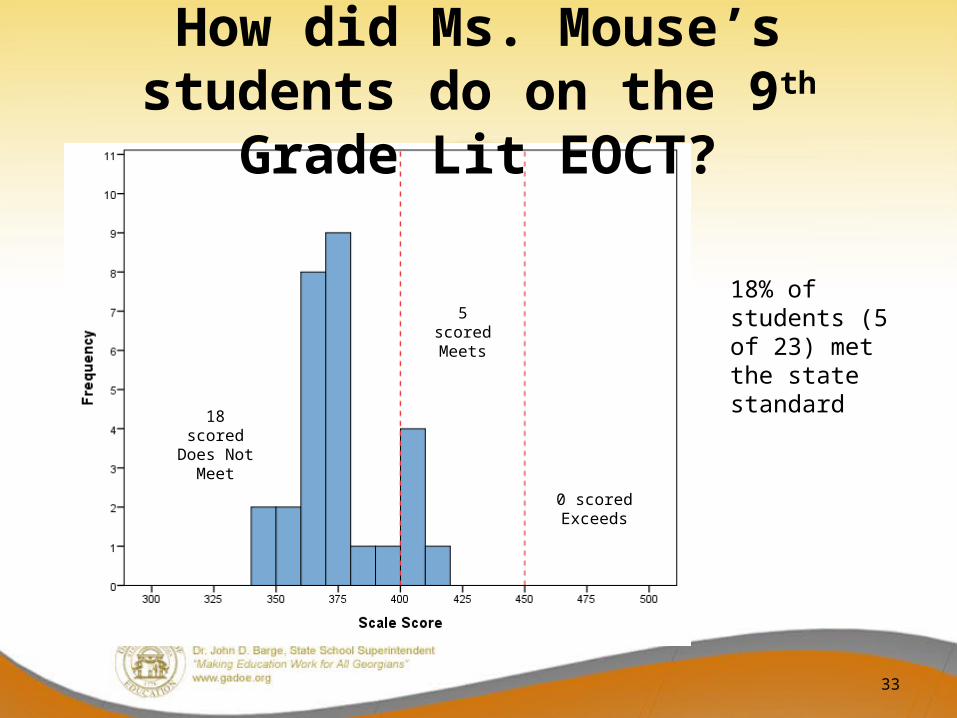
How did Ms. Mouse’s students do on the 9th Grade Lit EOCT?
33
18 scored Does Not
Meet
5 scored Meets
0 scored Exceeds
18% of students (5 of 23) met the state standard

But did these students grow?
34
3 demonstrated low growth
11 demonstrated typical growth
14 demonstrated high growth
Yes – 89% demonstrated typical or high growth
MGP = 66

Was there a difference across Ms. Mouse’s classes?
35
All students in Section A demonstrate typical or high growth
Some students in Sections B and C didn’t grow quite as much

What about the other 9th Grade Lit teachers in the school?
36
Ms. Mouse – low proficiency (18%), high growth (MGP = 66)
9th G
rade
Lit
Pro
ficie
ncy
9th Grade Lit Growth

What if we consider where students started?
37
Ms. Mouse – She taught most of the low-achieving students, but they still demonstrated high growth8th
Gra
de P
rofic
ienc
y
9th Grade Lit Growth

What if we consider where students started – across the district?
38
Ms. Mouse – Had more student growth than most other teachers with students of similar prior achievement levels
All 9th Grade Lit teachers in this district
8th G
rade
Pro
ficie
ncy
9th Grade Lit Growth

Resources• Introduction to SGPs video• GSGM Visualization Tool (SLDS)
– Information restricted based on role– Additional enhancements in development
• Student growth reports for parents– Sample reports– Sample letter– Interpretation videos
• GSGM tutorial series• Coming soon – public visualization tool (school- and district-
level results only)
39
Questions?
• For questions regarding the Georgia Student Growth Model, please contact:
Melissa Fincher, Ph.D.Associate Superintendent of Assessment and [email protected] or (404) 651-9405
Allison Timberlake, Ph.D.Program Manager, Growth [email protected] or (404) 463-6666
gsgm.gadoe.org
40