introduction to the amnis imaging flow cytometry
TRANSCRIPT
Flow Cytometry Plus High
Content Imaging on the
ImageStream® MKII
Amal El-Mabhouh, PhD
Field applications Scientist
Introduction to the Amnis
Imaging Flow Cytometry

complexity simplified. | © Copyright 2019 Luminex Corporation 2
Now Part of LuminexAmnis® and Guava® Flow Cytometry Systems
complexity simplified. | © Copyright 2019 Luminex Corporation 3
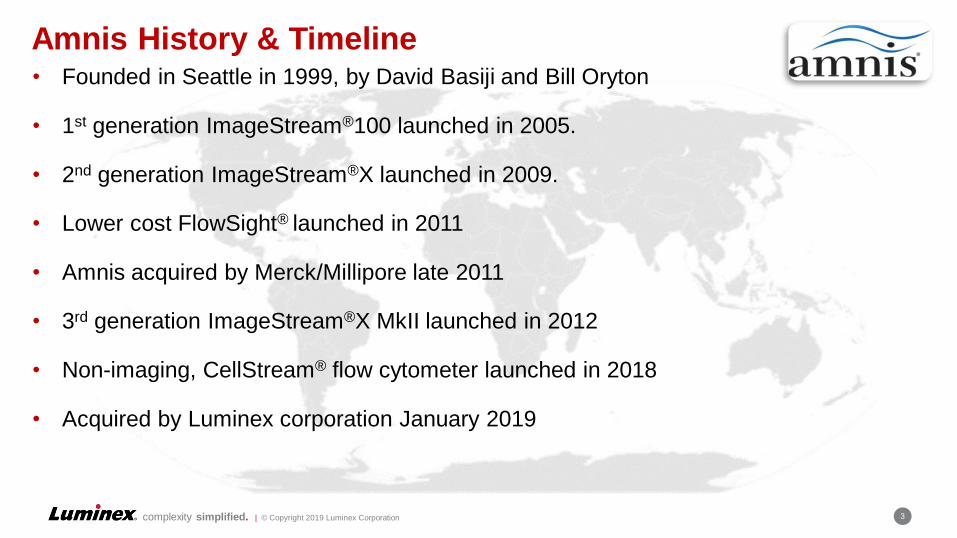
Amnis History & Timeline• Founded in Seattle in 1999, by David Basiji and Bill Oryton
• 1st generation ImageStream®100 launched in 2005.
• 2nd generation ImageStream®X launched in 2009.
• Lower cost FlowSight® launched in 2011
• Amnis acquired by Merck/Millipore late 2011
• 3rd generation ImageStream®X MkII launched in 2012
• Non-imaging, CellStream® flow cytometer launched in 2018
• Acquired by Luminex corporation January 2019

complexity simplified. | © Copyright 2019 Luminex Corporation 4
Imaging Cytometry Allows for Probe Quantification
and Location
4

complexity simplified. | © Copyright 2019 Luminex Corporation 5
Standard Cytometry with Visual Confirmation
Human PBMC
60X Magnification
CD45-AF488
Nucleus-DRAQ5
Darkfield
10,000 cells imaged
CD45 vs SSC
basophils
eosinophils
monocytes
lymphocytes
neutrophils
Sid
e s
catt
er
Inte
nsity
CD45 AF488
complexity simplified. | © Copyright 2019 Luminex Corporation 6
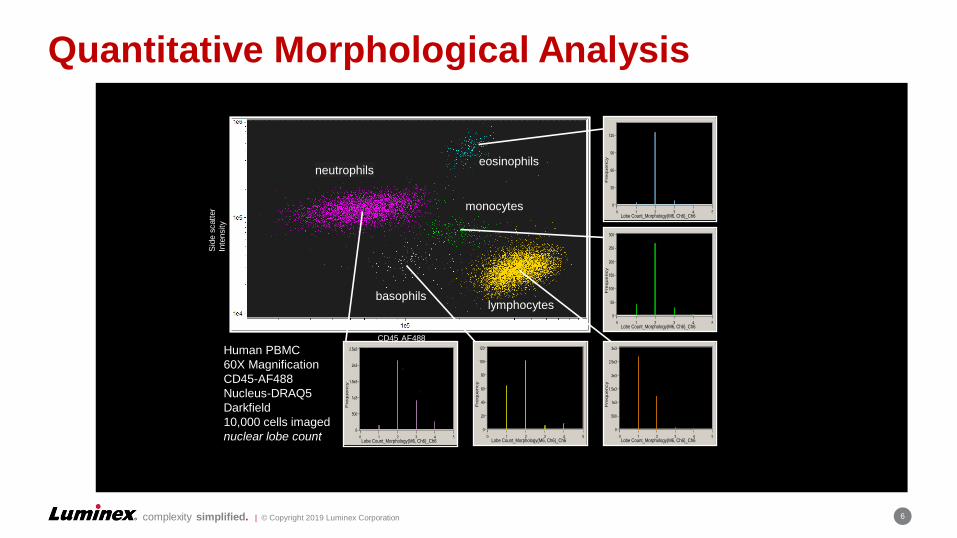
Quantitative Morphological Analysis
Human PBMC
60X Magnification
CD45-AF488
Nucleus-DRAQ5
Darkfield
10,000 cells imaged
nuclear lobe count
basophils
eosinophils
monocytes
lymphocytes
neutrophils
Sid
e s
catt
er
Inte
nsity
CD45 AF488
0 1 2 3 4 5
0
500
1e3
1.5e3
2e3
2.5e3
Lobe Count_Morphology(M6, Ch6)_Ch60 1 2 3 4 5
Fre
quency
0
500
1e3
1.5e3
2e3
2.5e3
Lobe Count_Morphology(M6, Ch6)_Ch6
Fre
qu
en
cy
Neutrophils
0 1 2 3 4 5
0
20
40
60
80
100
120
Lobe Count_Morphology(M6, Ch6)_Ch60 1 2 3 4 5
Fre
quency
0
20
40
60
80
100
120
Lobe Count_Morphology(M6, Ch6)_Ch6
Fre
qu
en
cy
Basophils
0 1 2 3 4 5
0
500
1e3
1.5e3
2e3
2.5e3
3e3
Lobe Count_Morphology(M6, Ch6)_Ch60 1 2 3 4 5
Fre
quency
0
500
1e3
1.5e3
2e3
2.5e3
3e3
Kidney nuclei
Lobe Count_Morphology(M6, Ch6)_Ch6
Fre
qu
en
cy
Lymphocytes
0 1 2 3 4 5
0
50
100
150
200
250
300
Lobe Count_Morphology(M6, Ch6)_Ch60 1 2 3 4 5
Fre
quency
0
50
100
150
200
250
300
Lobe Count_Morphology(M6, Ch6)_Ch6
Fre
qu
en
cy
Monocytes
0 1 2 3 4 5
0
30
60
90
120
Lobe Count_Morphology(M6, Ch6)_Ch60 1 2 3 4 5
Fre
quency
0
30
60
90
120
Lobe Count_Morphology(M6, Ch6)_Ch6
Fre
qu
en
cy
Eosinophils

complexity simplified. | © Copyright 2019 Luminex Corporation 7
Flow Cytometry with ImagesImaging Flow Cytometry= Best of Both Worlds
Combines the speed, sensitivity and phenotyping abilities of flow cytometry
7
Single, focused
R3R3R3
R4R4R4
R3R3R3
R4R4R4
1e70 1e3 1e61e51e4-1e3
Intensity_Ch04
1e3
0
1e4
-1e3
1e5
1e7
1e6
Inte
nsity
_Ch0
5 Population Count %Gated Mean Ch04 Mean Ch05
R3-R4- 1846 62.5 642 50
R3 507 17.2 986 264836
R4 439 14.9 219405 419
R2
......
1e4 1e7-1e3 1e61e50 1e3
Intensity_Ch04
0.5
2
0
1
1.5
Nor
mal
ized
Fre
quen
cy
…with the detailed imagery and functional insights of microscopy.
Imaging flow cytometry enables applications that can’t be performed by
flow cytometry or microscopy alone.
complexity simplified. | © Copyright 2019 Luminex Corporation 8
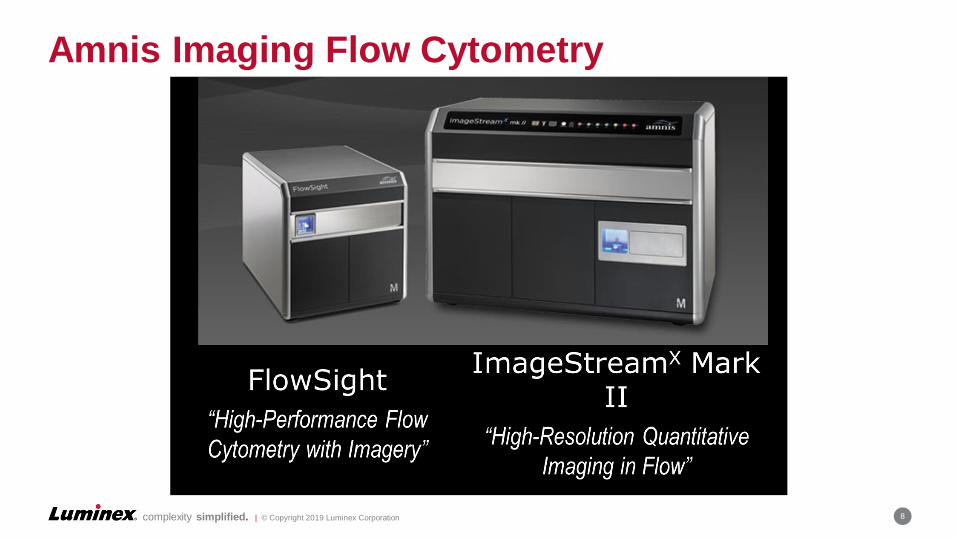
Amnis Imaging Flow Cytometry
8
complexity simplified. | © Copyright 2019 Luminex Corporation 9
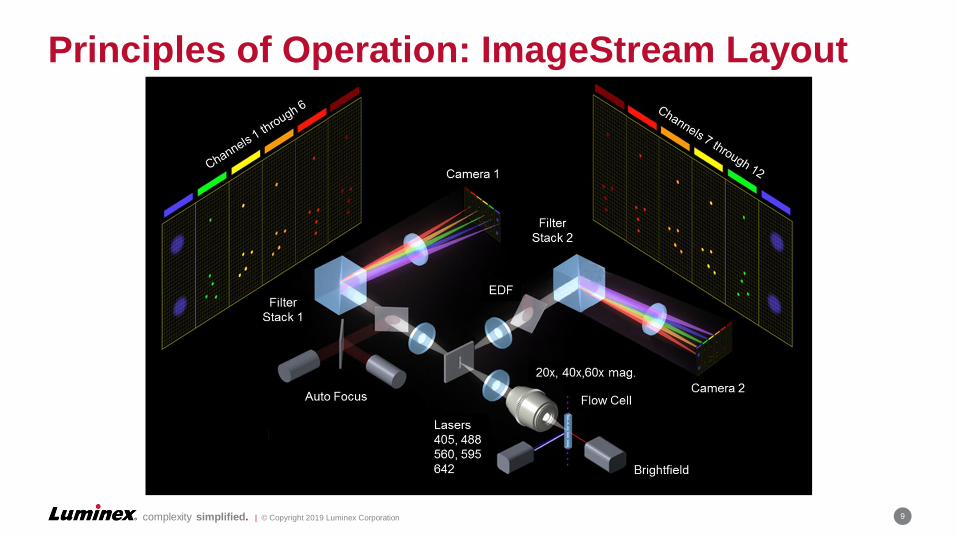
Principles of Operation: ImageStream Layout
9
complexity simplified. | © Copyright 2019 Luminex Corporation 10
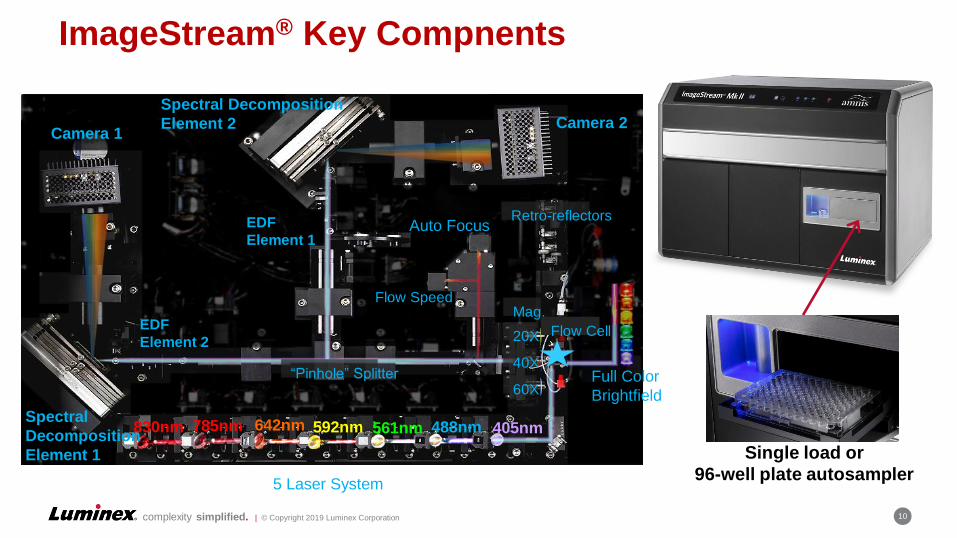
ImageStream® Key Compnents
Single load or
96-well plate autosampler
Camera 1Camera 2
Spectral
Decomposition
Element 1
Spectral Decomposition
Element 2
Auto Focus
Flow Speed
“Pinhole” Splitter
Retro-reflectors
20X
40X
60X
785nm 642nm 592nm 561nm 488nm 405nm830nm
Mag.
EDF
Element 1
EDF
Element 2Flow Cell
5 Laser System
Full Color
Brightfield
complexity simplified. | © Copyright 2019 Luminex Corporation 11
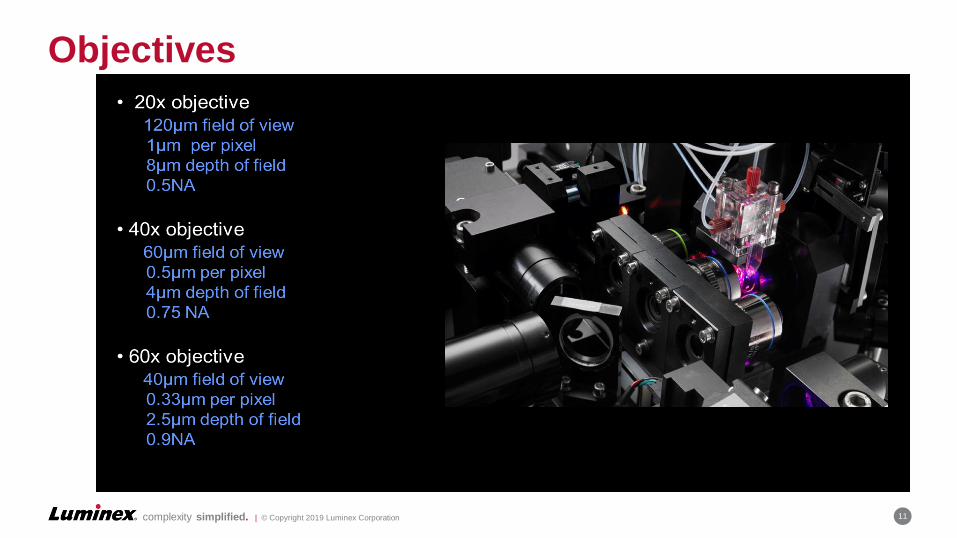
Objectives
11
complexity simplified. | © Copyright 2019 Luminex Corporation 12
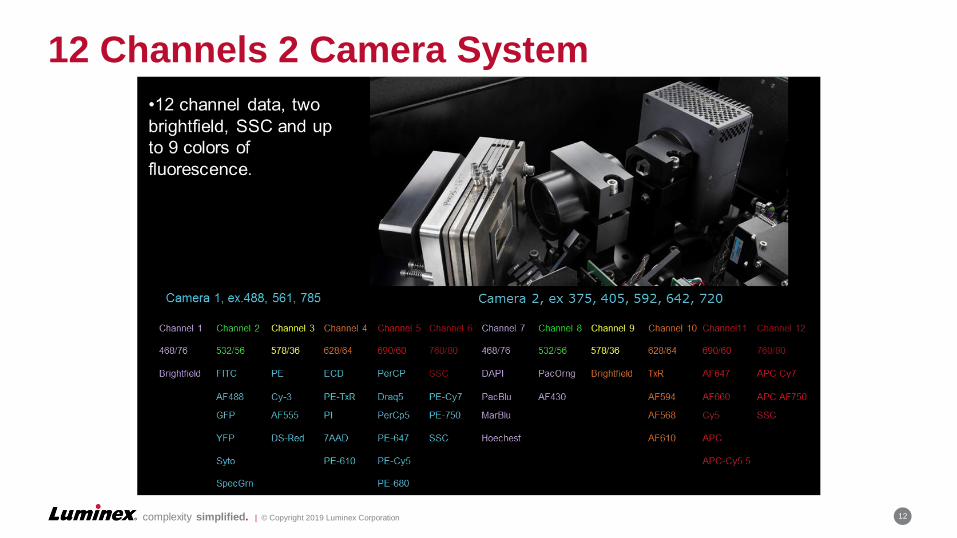
12 Channels 2 Camera System
12
complexity simplified. | © Copyright 2019 Luminex Corporation 13
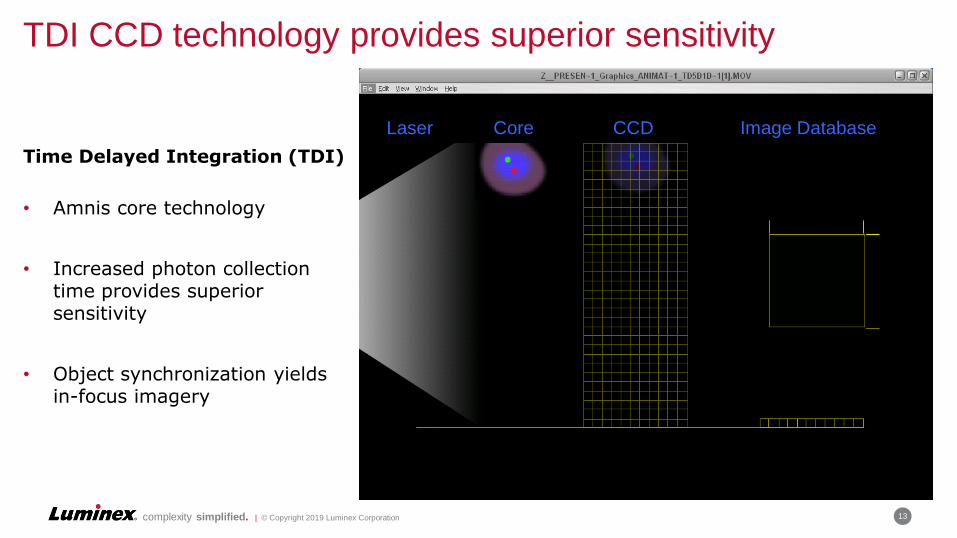
TDI CCD technology provides superior sensitivity
Laser Core CCD Image Database
Time Delayed Integration (TDI)
• Amnis core technology
• Increased photon collection time provides superior sensitivity
• Object synchronization yields in-focus imagery

complexity simplified. | © Copyright 2019 Luminex Corporation 14
Objectives
14

complexity simplified. | © Copyright 2019 Luminex Corporation 15
Data From Amnis Imaging Flow Cytometers
15

Ease of Use
16
complexity simplified. | © Copyright 2019 Luminex Corporation 17
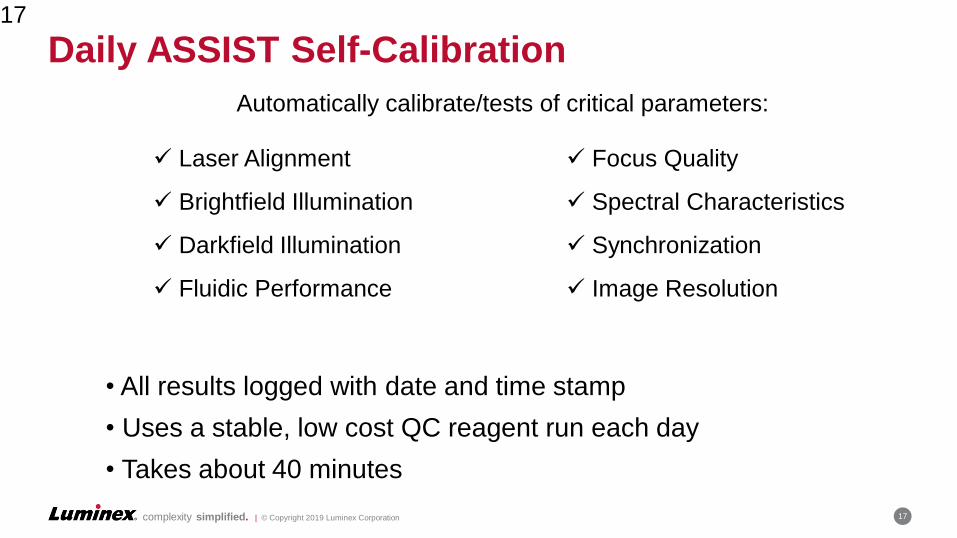
Daily ASSIST Self-Calibration17
Laser Alignment
Brightfield Illumination
Darkfield Illumination
Fluidic Performance
Focus Quality
Spectral Characteristics
Synchronization
Image Resolution
• All results logged with date and time stamp
• Uses a stable, low cost QC reagent run each day
• Takes about 40 minutes
Automatically calibrate/tests of critical parameters:

complexity simplified. | © Copyright 2019 Luminex Corporation 18
Simple Instrument Operation
18

complexity simplified. | © Copyright 2019 Luminex Corporation 19
IDEAS Image Analysis Software
1
• Wizards for simplified
image analysis.
Including Feature Finder.
• Automated
compensation for
complex color
combinations.
• Building blocks for
assisted analysis.
• 85 features per channel,
14 function masks, and
user defined features
help advanced users
with quantitative imaging
applications.
Tabular DataImage Gallery
Workspace

Quantitative Image Cytometry
20
complexity simplified. | © Copyright 2019 Luminex Corporation 21
Amnis Cytometry• The ImageStream statistical microscopy platform advances research…
But How??
• Science-driven conclusions require
Collection of critical data sets
Objective analysis backed by statistics
• The value of Amnis image cytometry is:
• The benefit that statistics brings to microscopy
• The benefit that imagery brings to cytometry
• The benefit of multiplexed single cell measurements
21
complexity simplified. | © Copyright 2019 Luminex Corporation 22
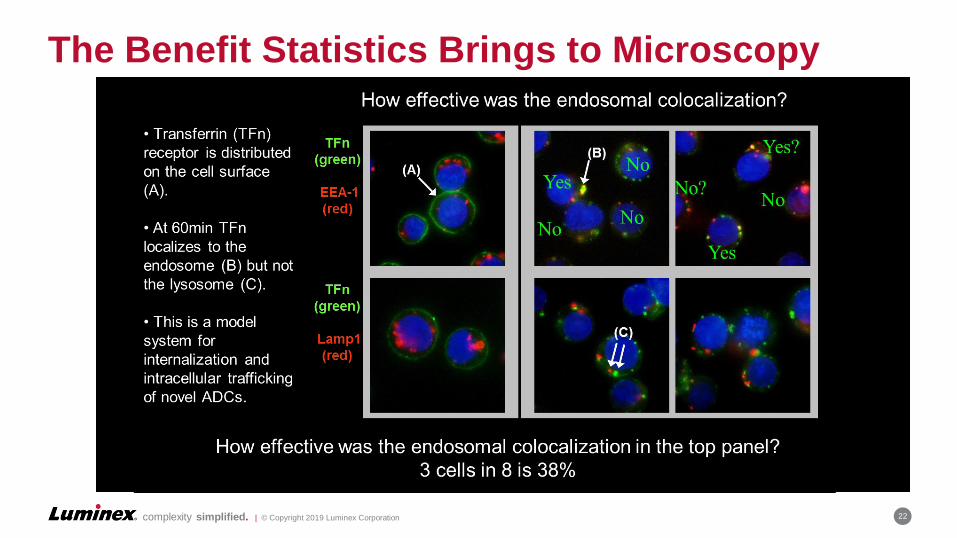
The Benefit Statistics Brings to Microscopy
22

complexity simplified. | © Copyright 2019 Luminex Corporation 23
The Benefit Imagery Brings to Cytometry
23
Cytometry typically measures intensity.
Focus
1e70 1e3 1e61e51e4-1e3
Intensity_MC_Ch07 DAPI
1e3
0
1e4
-1e3
1e5
1e7
1e6
Inte
nsity
_M
C_C
h11 A
ctn
647
Total
Intensity
Max
Intensity
Mean
Intensity
244881 889 335
244881280 135
244881856 359
These three cells have the same intensity.

complexity simplified. | © Copyright 2019 Luminex Corporation 24
The Benefit Imagery Brings to Cytometry
24
Total
Intensity
Max
Intensity
Mean
Intensity
244881 889 335
244881280 135
244881856 359
Cytometry typically measure intensity.
These three cells have the same red intensity.
Measuring not only total intensity but the location of the intensity can
characterize unique subsets of cells.
The cells differ greatly in the size, shape and location of that intensity.
complexity simplified. | © Copyright 2019 Luminex Corporation 25
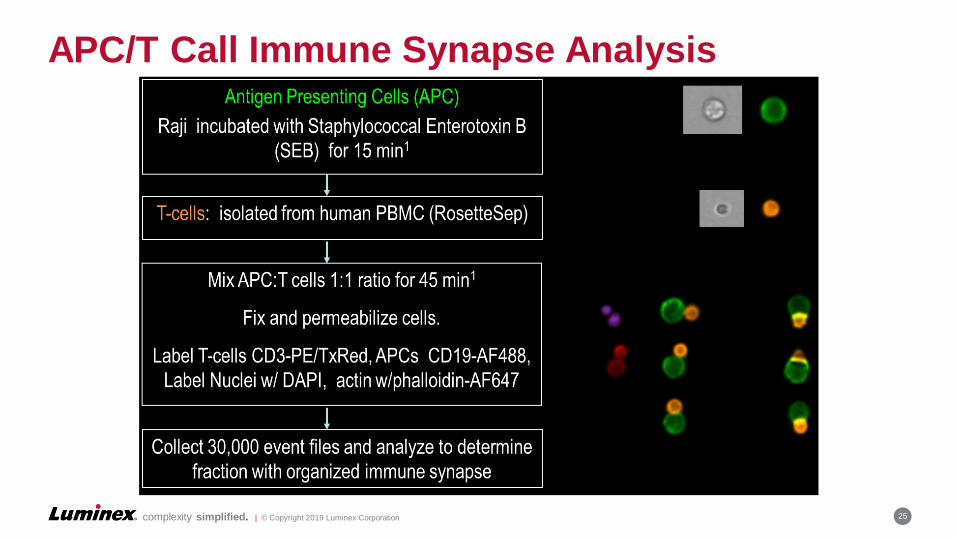
APC/T Call Immune Synapse Analysis
complexity simplified. | © Copyright 2019 Luminex Corporation 26
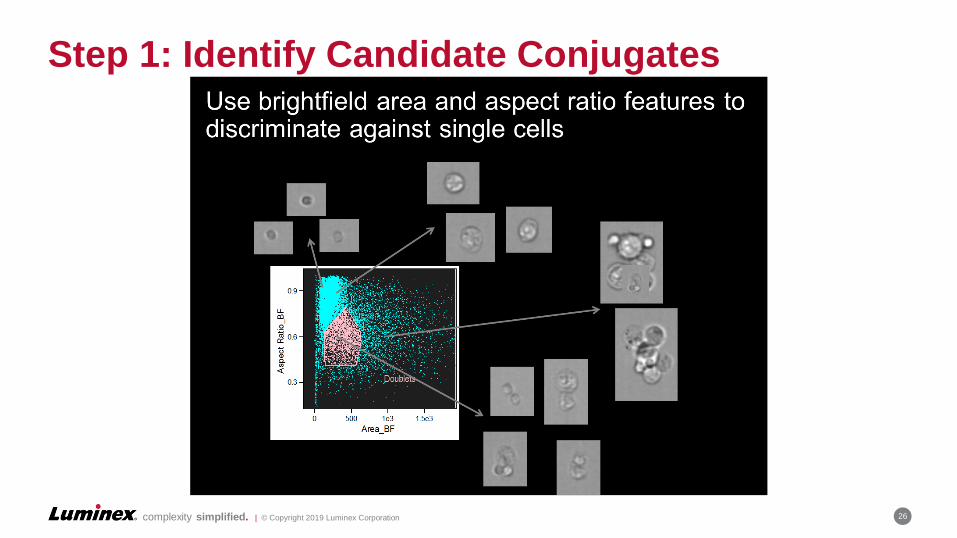
Step 1: Identify Candidate Conjugates

complexity simplified. | © Copyright 2019 Luminex Corporation 27
Step 2: Identify CD3+/CD19+ Conjugates
Doublets
......
1e51e4-1e3 0 1e3
Intensity_CD19_AF488
-1e4
1e5
1e4
1e3
0
-1e3
Inte
nsity
_CD
3_P
E-T
R
Double Positive
Use CD3-TxRed and CD19-AF488 intensity on putative conjugates to identify double positives
FS

complexity simplified. | © Copyright 2019 Luminex Corporation 28
Step 3: Identify Conjugates with One APC
Double Positive
......
0 1e3500 1.5e3
Area_CD19_AF488
0.6
0.9
0.3
Aspect
Ratio_C
D19_A
F488
CD19+
Use Aspect Ratio and Area of CD19-AF488 imagery of double positives to identify conjugates with one APC

complexity simplified. | © Copyright 2019 Luminex Corporation 29
CD19+
......
1000 300200 400
Area_CD3_PE-TR
0.8
0.2
0.4
0
1
0.6
Asp
ect
Rat
io_C
D3_
PE
-TR CD3+
Use Aspect Ratio and Area of CD3-PE/TxRed imagery of single APC conjugates to ID T-Cell/APC conjugates
Step 4: Identify Conjugates with One T-Cell

complexity simplified. | © Copyright 2019 Luminex Corporation 30
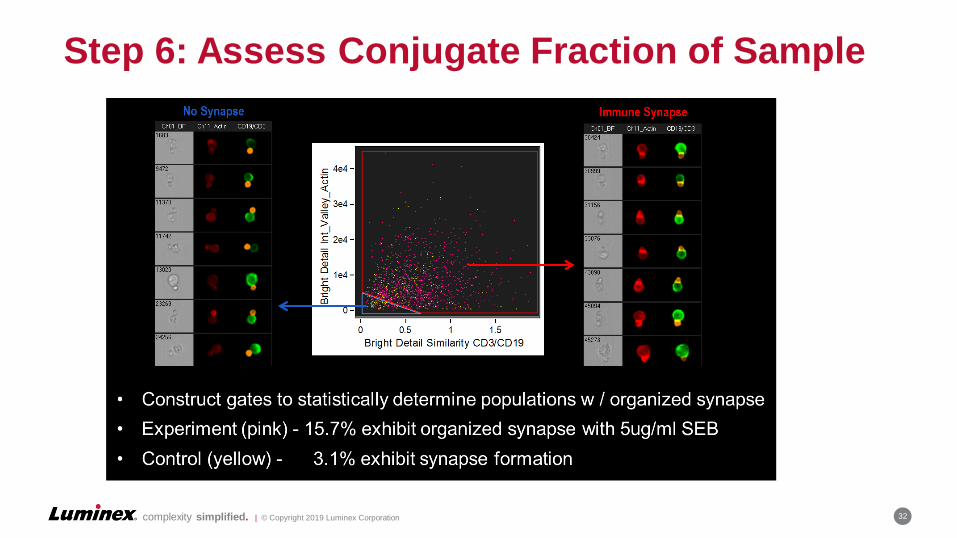
Step 5A: Analyze Synapse Using Actin Image
• Recruitment of actin at the synapse results in a high local pixel intensity
• “Valley Mask” on DAPI nuclear image isolates synapse region
• Increased intensity of actin within Valley mask indicates synapse formation
Cell conjugates with no organized immunological synapse
Cell conjugates with an organized immunological synapse
Low synapse intensity
High synapse
intensity

complexity simplified. | © Copyright 2019 Luminex Corporation 31
Automatic identification of the immune synapse by masking
complexity simplified. | © Copyright 2019 Luminex Corporation 32
Step 6: Assess Conjugate Fraction of Sample
complexity simplified. | © Copyright 2019 Luminex Corporation 33
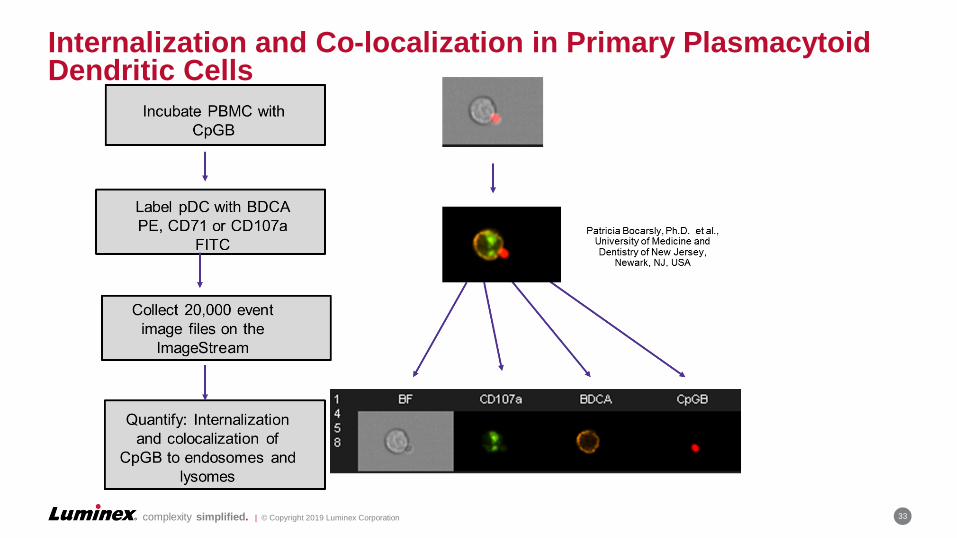
Internalization and Co-localization in Primary Plasmacytoid Dendritic Cells
33

complexity simplified. | © Copyright 2019 Luminex Corporation 34
Internalization and Co-localization in Primary Plasmacytoid Dendritic Cells
Cy5-CpGB Internalization on y-axis
Similarity Bright Detail (x-axis) used to
measure organelle colocalization
Co-localization score In
tern
ali
za
tio
n s
co
re

complexity simplified. | © Copyright 2019 Luminex Corporation 35
Internalization and Co-localization in Primary Plasmacytoid Dendritic Cells
35
24.6
CD71 (endosomes)
1.5 18.8
CD107a (lysosomes)
1.6 26.9 66.8
complexity simplified. | © Copyright 2019 Luminex Corporation 36
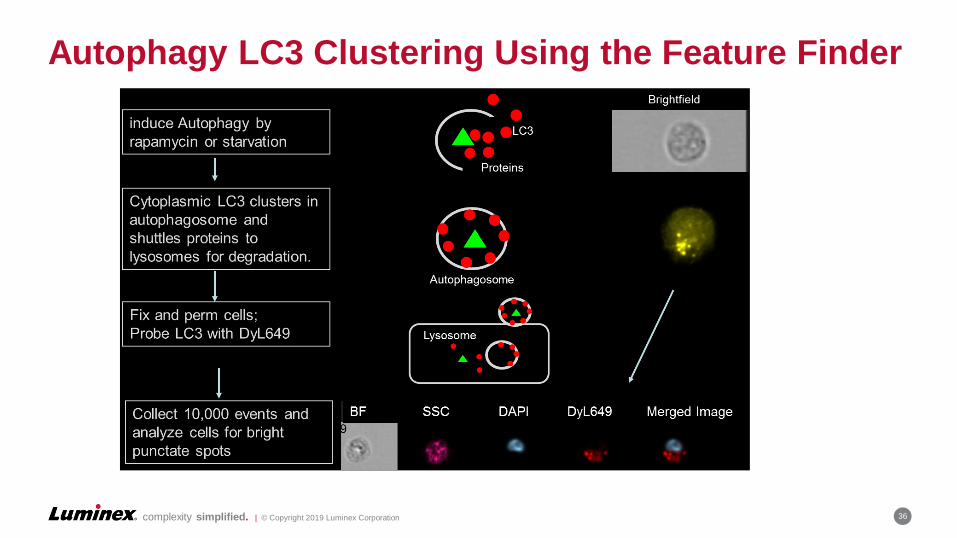
Autophagy LC3 Clustering Using the Feature Finder
complexity simplified. | © Copyright 2019 Luminex Corporation 37
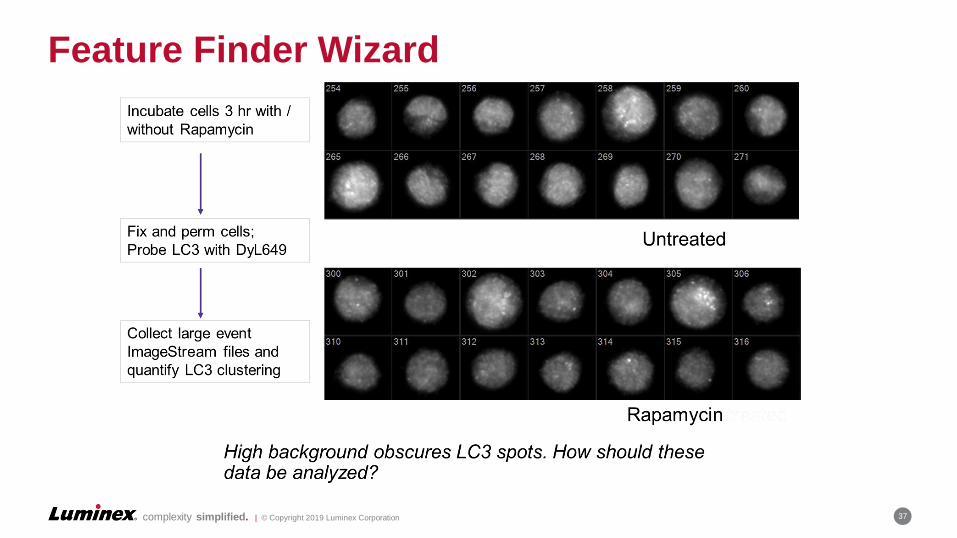
Feature Finder Wizard
complexity simplified. | © Copyright 2019 Luminex Corporation 38
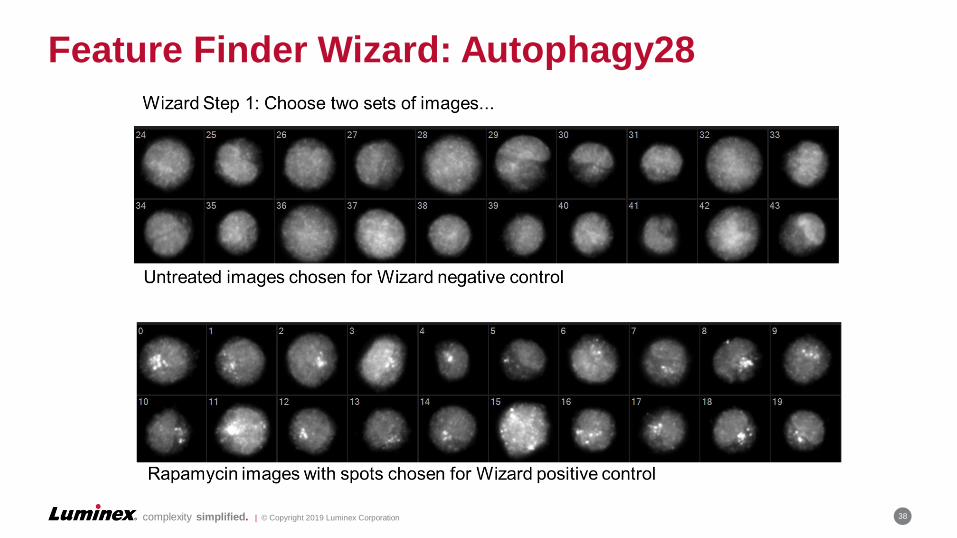
Feature Finder Wizard: Autophagy28

complexity simplified. | © Copyright 2019 Luminex Corporation 39
Feature Finder Wizard: Autophagy

complexity simplified. | © Copyright 2019 Luminex Corporation 40
Feature Finder Wizard: Autophagy

complexity simplified. | © Copyright 2019 Luminex Corporation 41
41
Cellular Exosomes Analysis
complexity simplified. | © Copyright 2019 Luminex Corporation 42
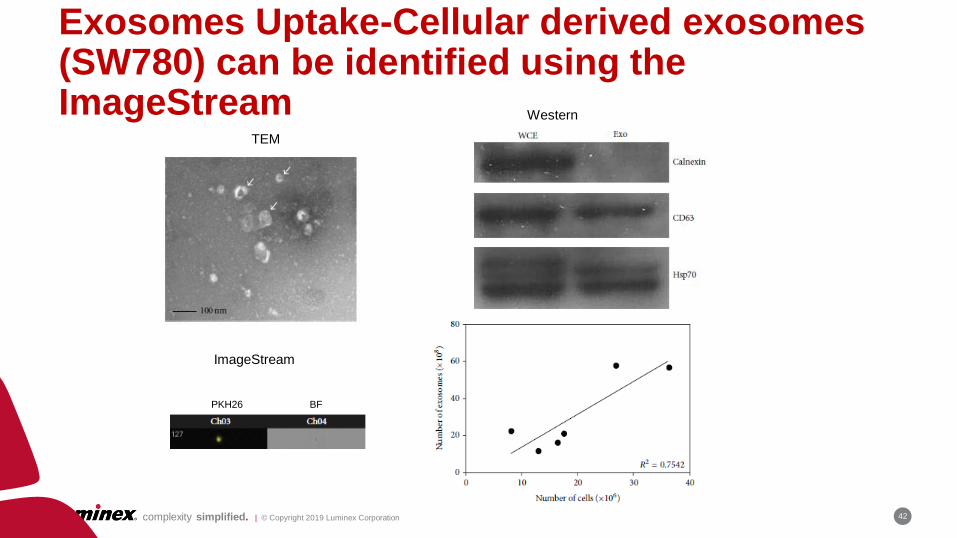
42 Exosomes Uptake-Cellular derived exosomes (SW780) can be identified using the ImageStream
TEM
Western
ImageStream
PKH26 BF

complexity simplified. | © Copyright 2019 Luminex Corporation 43
43
Exosomes Uptake- Uptake of SW780 Derived Exosomes with SW780 Cells
43
4hr. Incubation with exosomes
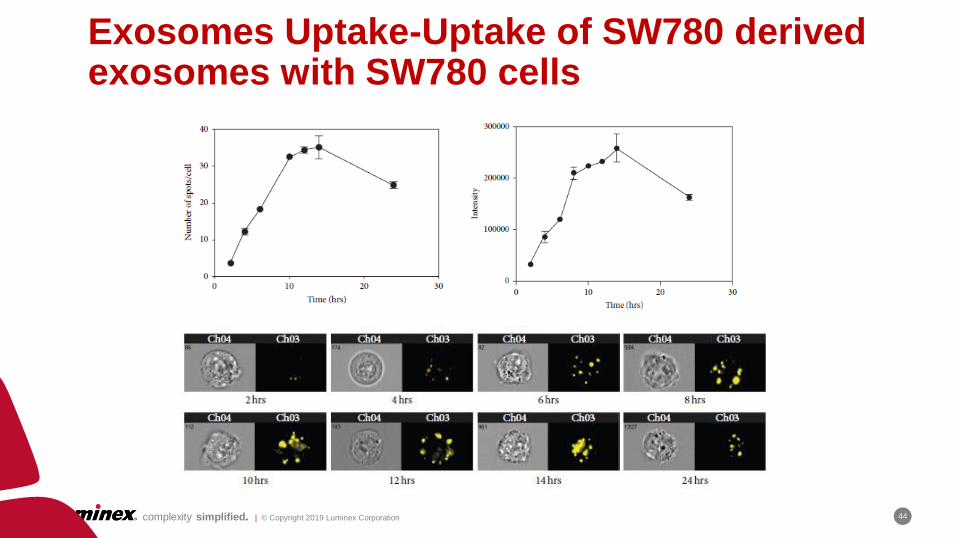
complexity simplified. | © Copyright 2019 Luminex Corporation 44
44
Exosomes Uptake-Uptake of SW780 derived exosomes with SW780 cells

complexity simplified. | © Copyright 2019 Luminex Corporation 45
45
Pre-treat cells or exosomes with Heparin for 30min. Incubate for 4hr.
Exosomes Uptake-Uptake of SW780 derived exosomes with SW780 cells

complexity simplified. | © Copyright 2019 Luminex Corporation 46
NFkB Translocation in THP-1 and PBMCs
46
Cell with full
Translocation
Cell without
translocation
Cell with some
translocation
Nuclear Extracts
Western Result:
Dark Band No Band Dim Band 2Dim Band 1
• Quantifying translocation cell-by-cell is essential with heterogeneous
samples and / or incomplete translocation

complexity simplified. | © Copyright 2019 Luminex Corporation 47
NFKB Translocation in Whole Blood Circulating pDC
47
Analyze nuclear
localization in pDC using
the ImageStreamx
BF CD123 BDCA2 DAPI NF-kB
Incubate whole blood
with R848
Immunophenotype for
pDC (CD123-PE /
BDCA2-PETxRed) and
stain for NF-kB and DAPI

complexity simplified. | © Copyright 2019 Luminex Corporation 48
NFKB Translocation in Whole Blood Circulating pDC
48
Intensity_CD123
Inte
nsit
y_B
DC
A2
CD123+BDCA-
pDC (CD123+BDCA+)
Eosinophil
BF SSC DAPI CD123 BDCA2
17139
17684
22815
25063
BF SSC DAPI CD123 BDCA2
16739
22664
23366
23556
BF SSC DAPI CD123 BDCA2
11419
23944
37536
53381

complexity simplified. | © Copyright 2019 Luminex Corporation 49
Translocation Using Similarity
49
S = -2.07 S = +2.82
7-AAD Pixel Intensity
NF
-kB
Pix
el In
ten
sity
7-AAD Pixel Intensity
NF
-kB
Pix
el In
ten
sity
Untranslocated Translocated
7-AAD
image
complexity simplified. | © Copyright 2019 Luminex Corporation 50
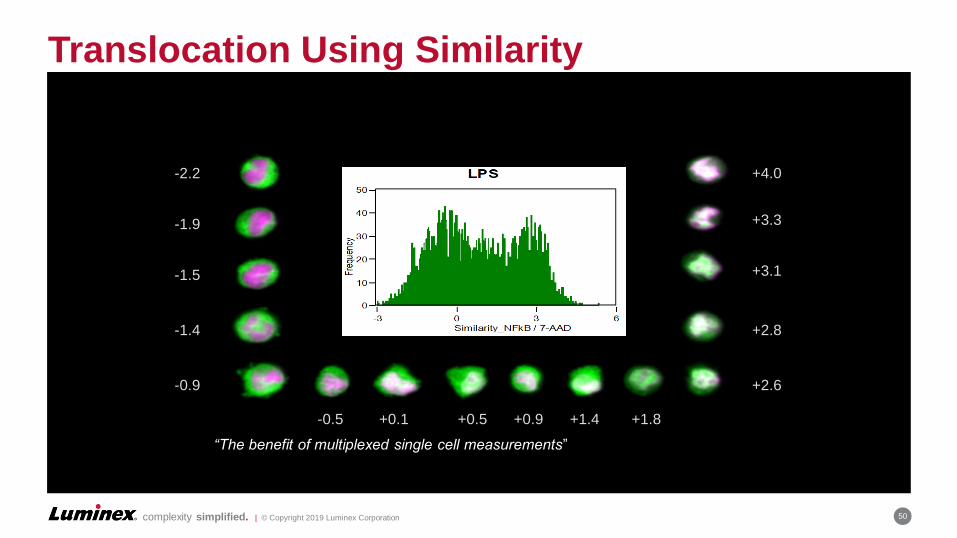
Translocation Using Similarity
50
-2.2
-1.9
-0.9
-1.4
-1.5
-0.5 +0.1 +1.4 +1.8
+2.6
+0.9+0.5
+4.0
+3.3
+3.1
+2.8
“The benefit of multiplexed single cell measurements”
complexity simplified. | © Copyright 2019 Luminex Corporation 51
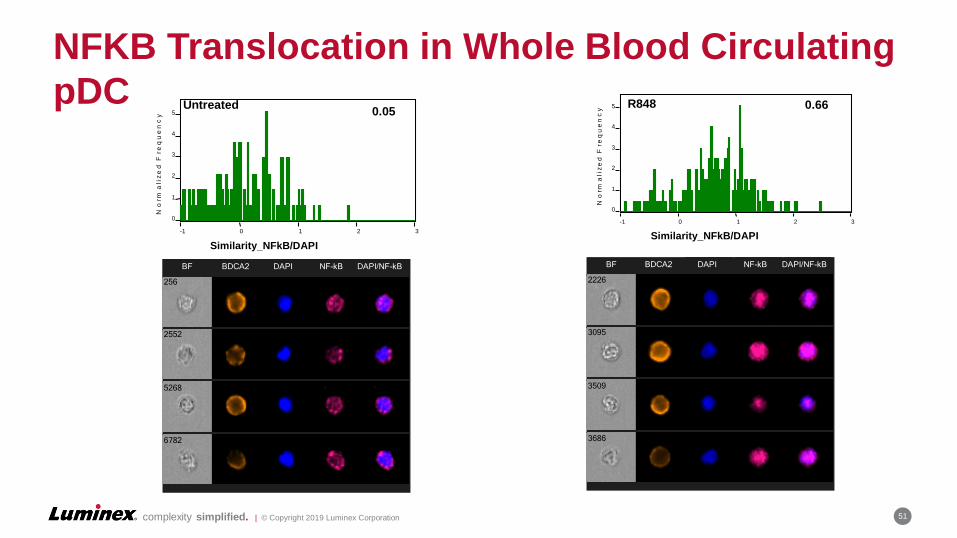
NFKB Translocation in Whole Blood Circulating
pDC
51
3-1 1 20
Similarity_NFkB/DAPI
0
4
5
2
3
1
No
r ma
liz
ed
Fre
qu
en
cy 0.05
Untreated
3-1 1 20
Similarity_NFkB/DAPI
0
2
3
4
1
5
No
r ma
liz
ed
Fre
qu
en
cy 0.66R848
BF BDCA2 DAPI NF-kB DAPI/NF-kB
256
2552
5268
6782
BF BDCA2 DAPI NF-kB DAPI/NF-kB
2226
3095
3509
3686

complexity simplified. | © Copyright 2019 Luminex Corporation 52
NFKB Translocation in Whole Blood Circulating
pDC
52
R848 - pDC activation
0.0
0.4
0.8
1.2
5 15 60
Time (min)
Sim
_N
FkB
/DA
PI,
Med
R848 - pDC activation
-0.4
0.0
0.4
0.8
1.2
0.00001 0.0001 0.001 0.01 0.1 1 10
[R848] (mg/mL)
Sim
_N
FkB
/DA
PI,
Med
complexity simplified. | © Copyright 2019 Luminex Corporation 53
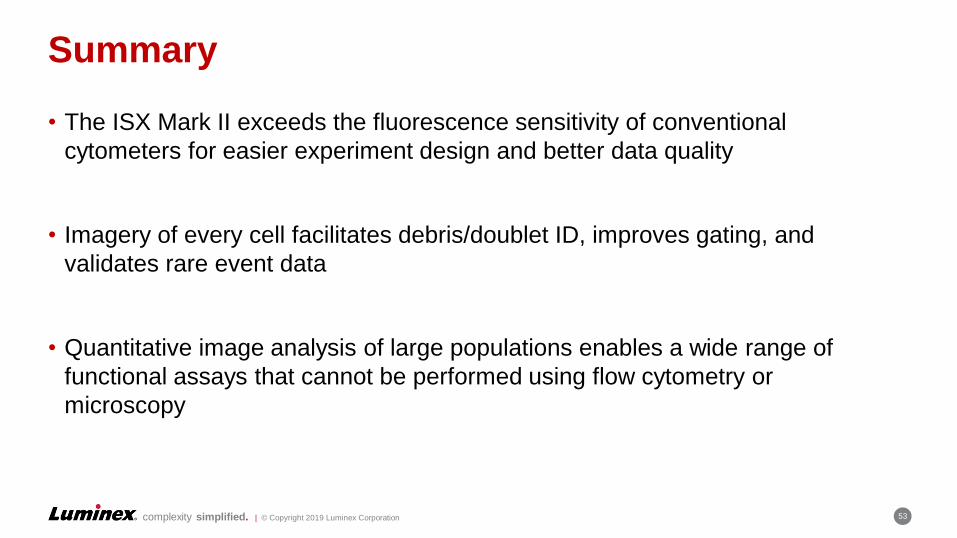
Summary
• The ISX Mark II exceeds the fluorescence sensitivity of conventional
cytometers for easier experiment design and better data quality
• Imagery of every cell facilitates debris/doublet ID, improves gating, and
validates rare event data
• Quantitative image analysis of large populations enables a wide range of
functional assays that cannot be performed using flow cytometry or
microscopy
53

Thank you For Your Attention

complexity simplified. | © Copyright 2019 Luminex Corporation 55
Data Acquisition Form
55

complexity simplified. | © Copyright 2019 Luminex Corporation 56
Sample Preparation• Select an appropriate cell type for the magnification. Typically 2um to 100um
diameter.
• Select fluorochromes appropriate for your lasers.
• Fluorescently label cells and resuspend in 50ul running buffer in 1.5ml tube.
• Prepare 10^6 cells per sample (this is 2x10^7th cells/ml).
• Label single color compensation controls.
• Label good biological controls so you know the experiment worked.
• To start, experiments should be limited to around 10 samples.
• Most FACS staining procedures should work. See “Current Protocols in Cytometry” and the protocols and tips in the Amnis knowledgbase.
56

complexity simplified. | © Copyright 2019 Luminex Corporation 57
Sample Quality
57