introduction to the 3d slicer platform - dartmouth...
TRANSCRIPT

Introduction to the 3D Slicer platformApril 19th, 2016
Alexis Girault, R&D Intern in Medical Computing

What will be covered● Introduction to 3D Slicer● Loading Data● Nodes & Module architecture● Layout and Slice Viewers● Volume visualization● Modules in pipeline● Saving/Closing a scene

CreditsThis slides integrate material available at:www.slicer.org/slicerWiki/index.php/Documentation/4.5/Training
It is built on prior work of:● Jean-Christophe Fillion-Robin, Technical Expert, Kitware Inc● Julien Finet, R&D Engineer, Kitware Inc● Sonia Pujol, Ph.D., SPL/BWH● Dominik Meier, Ph.D., SPL/BWH● Ron Kikinis, M.D., SPL/BWH
Portions of this work have been obtained under 3D Slicer Contribution and Software License Agreement

Introduction to 3D SlicerPART 1

What is 3D Slicer● Software platform for:
○ analysis (registration, interactive segmentation)○ visualization of medical images○ research in image guided therapy
● Extensible: powerful plugin capabilities
● Free + Open Source + Cross Platform

Behind the scene
Slicer is built every night on:● Windows● Linux● MacOSX

Online documentation
www.slicer.org/slicerWiki/index.php/Documentation/4.5

Over 100 modules
Slicer 4.5 contains over100 modules for image
segmentation, registration, and 3D visualization of medical
imaging data.

Nodes & Modules architecturePART 2

Data Types (1/3)Volume: structured grid, 3D image based ofvoxels of a certain size (image spacing)● Scalar volume: continuous voxel values● Label Map: discrete integer voxel values● Formats: mha, mhd, nrrd, dicom, ...
Model: polygonal mesh, 3D surface● 3D points and triangles● Points can hold data● Formats: vtk, vtp, stl

Data Types (2/3)Annotations: interactive markers● ROI : Region of interest (useful for cropping)● Fiducial: defines a 3D position (markups)● Ruler: measure distance between two positions
Accessible in the toolbar

Data Types (3/3)And much more:● Transforms● Lookup tables● Transfer Functions● Tables● Double Arrays● ...
Not really used in NIRFAST pipeline

MRML Nodes & Scene● MRML Library provides API for managing medical
image data types (Volumes, Models, Transforms, Fiducials, Cameras, etc) and their visualization.
● Each data type is represented by a special MRML node.
● A MRML Scene is a collection of MRML nodes.
Modules (1/3)● 3D Slicer plugin architecture allows to easily extend the
core platform. Those plugins are called modules.
● Those modules can be implemented in:○ C++○ Python○ Matlab (link to NIRFAST-Matlab)

Modules (2/3)Choose your modules fromthe module drop-down menu:
● Magnifying glass to search a module by name
● A list of all modules can be accessed at the top
● Main modules are in the section right below
● All modules can be accessed by category

Modules (3/3)How it works:
● Set input nodes (ex: CT volume)● Set input values (ex: threshold value, options)● Set output nodes (ex: new empty node)● Apply ➔ Output nodes updated based on inputs
Sometimes: user interaction needed (ex: segmentation)

Loading DataPART 3

Loading Data (1/2)Two options :
● File > Add Data
● Drag & Drop file in the application window
Same result : creation of a new object node

Loading Data (2/2)
This popup appears.Click here to add data

Loading DICOM (1/3)Two options :
● Module DICOM > Show DICOM Browser > Import
● Drag & Drop folder containing DICOM images
Same result : imports patient info in DICOM Browser

Loading DICOM (2/3)
Drap & drop DICOM folder inside Slicer
Press OK to load directory into DICOM database
Press Add Link to import the directory
Press OK to finish import
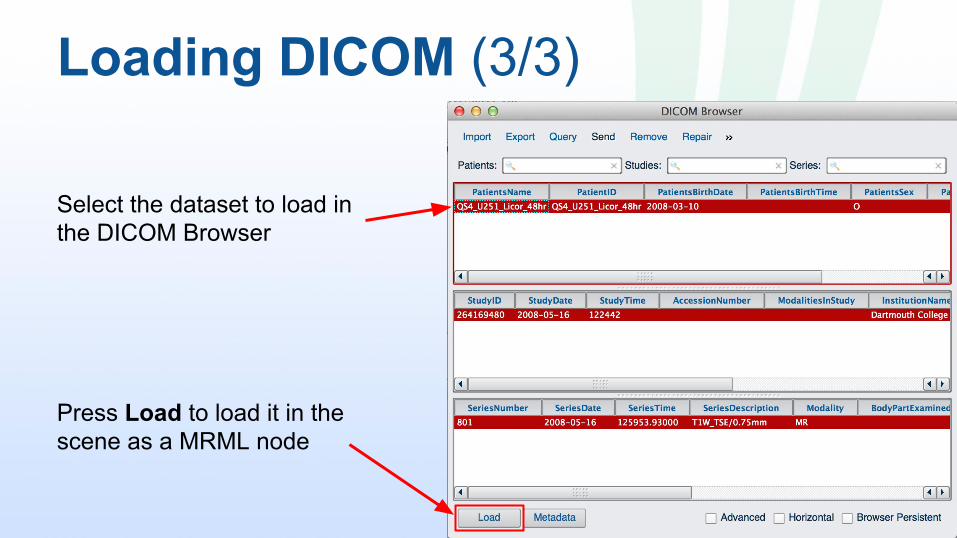
Loading DICOM (3/3)
Select the dataset to load in the DICOM Browser
Press Load to load it in the scene as a MRML node

List of nodes, allows you to:
● Edit node propertiesredirects you to the appropriate module
● Rename node● Delete node● Inspect node (bottom)
Data module

Layout and Slice ViewersPART 4

User Interface Overview
2D anatomicalslice viewers
3D Viewer
Main menu
Toolbar
Module GUI
Data Probe

Layout Manager
Press the layout icon in the toolbar to select a layout

Click on the eye icon to display the slices in
the 3D Viewer.
Click on the link icon to link all three 2D Viewers.
Link Slice viewers (1/2)

Link Slice viewers (2/2)

Slice viewer toolbar (1/3)
Position your mouseover the pin icon to display the slice viewer toolbar.
Re-center your slice withinthe window.(useful after changing the displayed volume)

Slice viewer toolbar (2/3)This shows the background volume and the view names.
Press the >> button to open the full viewer toolbar.

Slice viewer toolbar (3/3)The viewer bar has:
● 3 lines for:○ Label Map○ Foreground○ Background
● 3 columns for:○ Opacity○ Interpolation (on/off)○ Name of displayed node
display borders of labelmap only

Select displayed sliceMove the slider to display slice along the viewer axis.

Display multiple volumesClick on this icon to display multiple slices at once.

View controllers module
You can also access the viewer toolbars in the view controllers module.

Volume visualizationPART 5

Move volume in Viewer
Reset to original:Press
Zoom in:Shift + drag up
Zoom out:Shift + drag down
Translate:Ctrl + drag mouse
You can displace a slice in its view by pressing a specified key and dragging your mouse like explained below:

Window level
Darker:Drag mouse up
Brighter:Drag mouse down
More contrast:Drag mouse left
Less contrast:Drag mouse right
You can update the window level by dragging the mouse in the 2D Viewers.(To display the scalar bar, go in module Data Probe > Scalar Bar > Enable)

Volumes info/displayVolumes module offers:
● Volume Information○ Image dimensions, spacing, origin○ Scalar Range○ ...
● Display parameters○ Select lookup table (scalar value to RGB)○ Interpolate voxel values (smoothing)○ Select Window Level (manual, automatic)○ Set Threshold

Volume Rendering (1/2)
Select the Volume to render in 3D and click on the eye icon
You can select a Preset, slide the Shift slider, or unselect Shade to get a better rendering
Click on Synchronize with Volumes module to use the window level of the 2D viewer
More advanced options if needed

Volume Rendering (2/2)Use those options to manipulate the Region Of Interest that was created with the volume rendering.
You can manipulate the ROI annotation in the 3D and the 2D Viewers.
Uncheck Shade to properly visualize within the volume.

Modules in pipelinePART 6

Crop volume● Role: crop volume to region of interest
● Input volume: select volume to crop
● Input ROI: either:○ Create new AnnotationROI○ created in volume rendering○ created with annotation
● Crop! Creates a cropped file named:“inputname”-scale_1
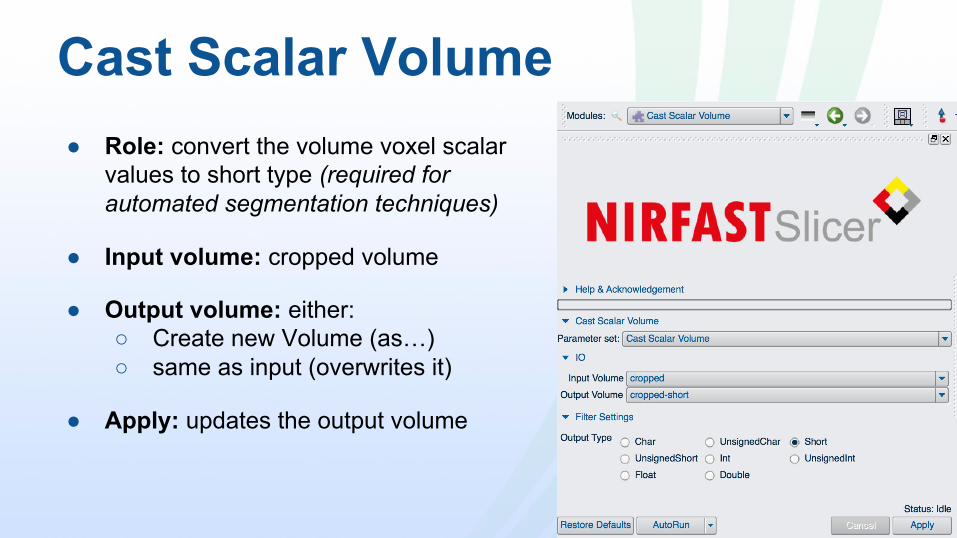
Cast Scalar Volume● Role: convert the volume voxel scalar
values to short type (required for automated segmentation techniques)
● Input volume: cropped volume
● Output volume: either:○ Create new Volume (as…)○ same as input (overwrites it)
● Apply: updates the output volume

Editor - Segment Tissue (1/3)When selecting the Editor module, a pop-up shows up to ask you what color table to use. Select GenericColors and press OK
Make sure the Master Volume is the volume you wish to segment, if not, select the good node here
This will create a node for your label map in Merge Volume
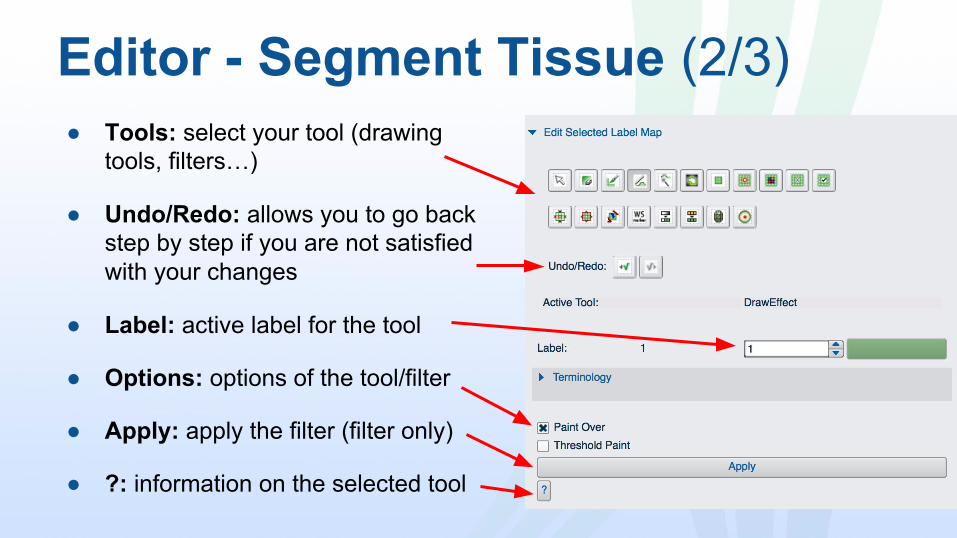
Editor - Segment Tissue (2/3)● Tools: select your tool (drawing
tools, filters…)
● Undo/Redo: allows you to go back step by step if you are not satisfied with your changes
● Label: active label for the tool
● Options: options of the tool/filter
● Apply: apply the filter (filter only)
● ?: information on the selected tool

Editor - Segment Tissue (3/3)
For detailed documentation on each tool and filters, go to:www.slicer.org/slicerWiki/index.php/Documentation/4.5/Modules/Editor
Web search keywords:Slicer wiki editor module

Create Mesh● Role: create NIRFAST volumetric mesh
and allows you to place the light sources and detectors
● Input Label Map: segmented volume
● Sources/Detectors: placed fiducials
● Output Mesh Dir/Name: path where the volumetric mesh will be saved
● Apply: launches NIRFAST-Matlab window

Import Optical Properties● Role: extract the point data of the VTK
volumetric mesh and resamples it in volumes for each optical property
● VTK Mesh: VTK file created after light reconstruction in NIRFAST-Matlab
● Bounding volume: either:○ original cropped volume○ none (will need to specify spacing)
● Apply: dynamically outputs volume nodes and display them accordingly

Saving/Closing a scenePART 7

Saving a scene (1/3)

Saving a scene (2/3)

Saving a scene (3/3)

Closing current Scene


Open source scientific computing
Collaborative Software R&D
● Algorithms & applications● Software process & infrastructure● Support & training● Open source leadership
Supporting all sectors
● Industry, government & academia

Customers & CollaboratorsOver 75 academic institutions including:
HarvardMITUniversity of California, BerkeleyStanford University California Institute of Technology Imperial College London Johns Hopkins University Cornell University Columbia University Dartmouth CollegeRobarts Research Institute University of Pennsylvania Rensselaer Polytechnic Institute University of Utah University of North Carolina
Over 50 government agenciesand labs including:
National Institutes of Health (NIH)National Science Foundation (NSF) National Library of Medicine (NLM) Department of Energy (DOE) Defense Advanced Research Projects Agency (DARPA) Army Research Lab (ARL) Air Force Research Lab (AFRL) Sandia (SNL)
Over 100 commercial companies in fields including: Automotive Aircraft Defense Energy technology Environmental sciences Finance Industrial inspection Oil & gas Pharmaceuticals Publishing

Successful small business● Founded in 1998, privately owned● More that 110 current employees, with 37% MSc, 47% Ph.D● $21.3 M revenue in 2013
Offices● Clifton Park, NY● Carrboro, NC● Santa Fe, NM● Lyon, France

● 2016 Winner of the Top Workplaces Award
● 2010, 2011, 2012, 2015 HPCwire Best HPC Visualization Product or Technology awarded to VTK and Paraview
● 2007 to 2013 Inc. Magazine's list of 5,000 fastest-growing private companies
● 2011 Inc. Top Small Company Workplaces Award
● 2011 Tibbetts Award for Outstanding Research
Awards

Current OpeningsWe're always looking for talented and motivated people. For more informationabout Kitware and available positions,visit http://jobs.kitware.com