introduction to statistics
TRANSCRIPT
Chapter 1:
Introduction to Statistics
PowerPoint Lecture Slides
Essentials of Statistics for the Behavioral Sciences Eighth Edition
by Frederick J Gravetter and Larry B. Wallnau

Learning Outcomes
• Know key statistical terms1
• Know key measurement terms2
• Know key research terms3
• Know the place of statistics in science4
• Understand summation notation5

• Statistics requires basic math skills
• Inadequate basic math skills puts you at
risk in this course
• Appendix A Math Skills Assessment helps
you determine if you need a skills review
• Appendix A Math Skills Review provides a
quick refresher course on those areas.
• The final Math Skills Assessment identifies
your basic math skills competence
Math Skills Assessment

1.1 Statistics, Science and
Observations
• “Statistics” means “statistical procedures”
• Uses of Statistics
– Organize and summarize information
– Determine exactly what conclusions are
justified based on the results that were
obtained
• Goals of statistical procedures
– Accurate and meaningful interpretation
– Provide standardized evaluation procedures

1.2 Populations and Samples
• Population
– The set of all the individuals of interest in a
particular study
– Vary in size; often quite large
• Sample
– A set of individuals selected from a population
– Usually intended to represent the population
in a research study

Figure 1.1Relationship between population and sample
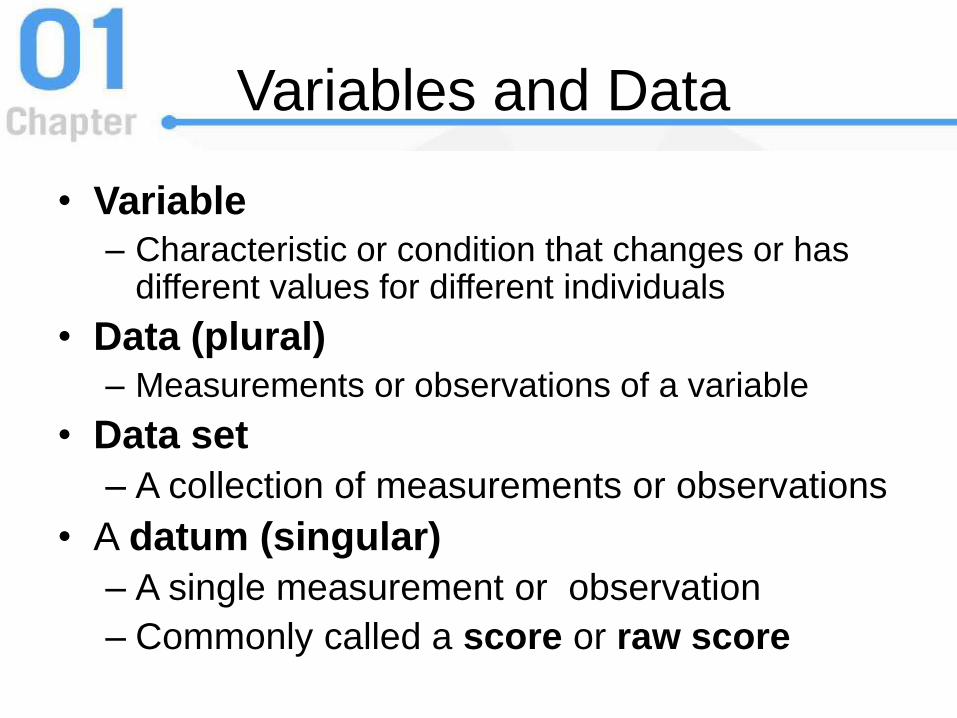
Variables and Data
• Variable
– Characteristic or condition that changes or has different values for different individuals
• Data (plural)
– Measurements or observations of a variable
• Data set
– A collection of measurements or observations
• A datum (singular)
– A single measurement or observation
– Commonly called a score or raw score

Parameters and Statistics
• Parameter
– A value, usually a
numerical value, that
describes a population
– Derived from
measurements of
the individuals in
the population
• Statistic
– A value, usually a
numerical value, that
describes a sample
– Derived from
measurements of
the individuals in
the sample
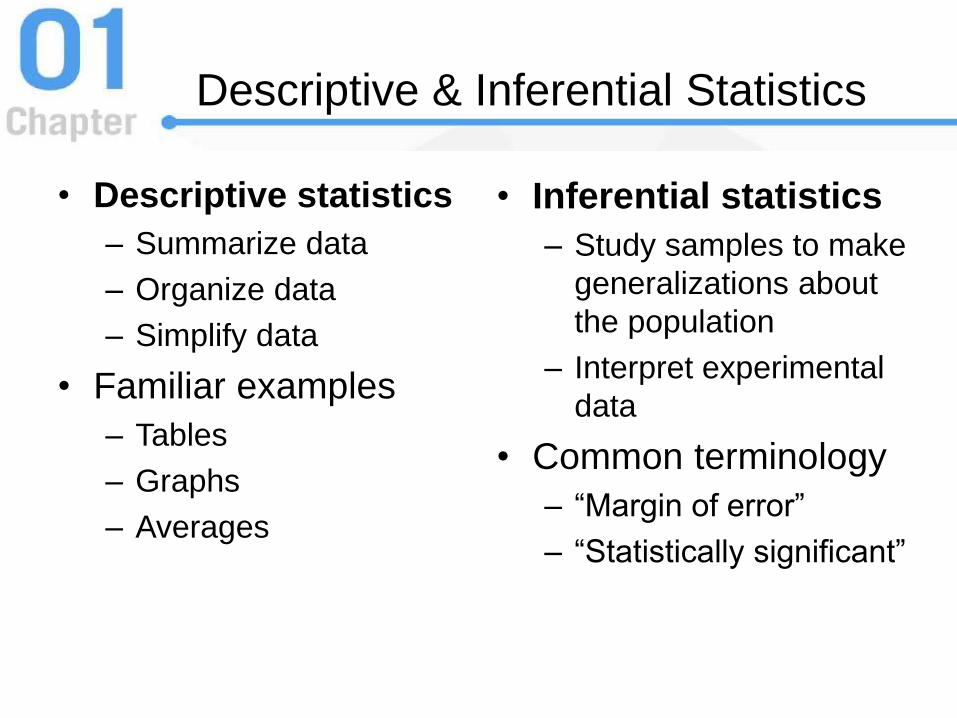
Descriptive & Inferential Statistics
• Descriptive statistics
– Summarize data
– Organize data
– Simplify data
• Familiar examples
– Tables
– Graphs
– Averages
• Inferential statistics
– Study samples to make
generalizations about
the population
– Interpret experimental
data
• Common terminology
– “Margin of error”
– “Statistically significant”

Sampling Error
• Sample is never identical to population
• Sampling Error
– The discrepancy, or amount of error, that
exists between a sample statistic and the
corresponding population parameter
• Example: Margin of Error in Polls– “This poll was taken from a sample of registered
voters and has a margin of error of plus-or-minus 4
percentage points” (Box 1.1)
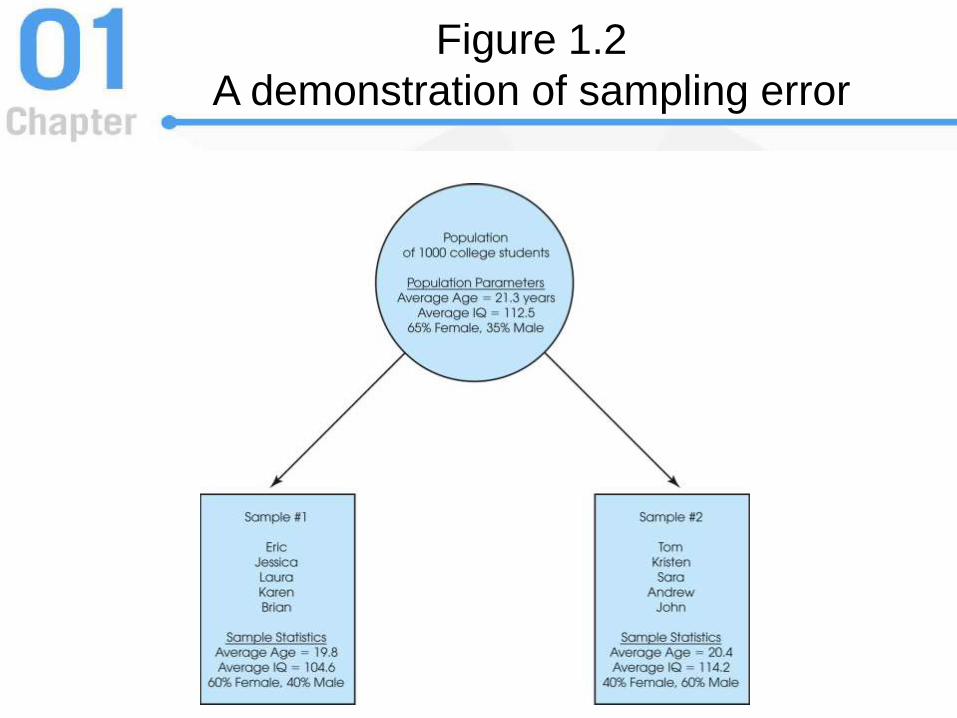
Figure 1.2
A demonstration of sampling error

Figure 1.3
Role of statistics in experimental research
Learning Check
• A researcher is interested in the effect of amount of sleep on high school students’ exam scores. A group of 75 high school boys agree to participate in the study. The boys are…
• A statisticA
• A variableB
• A parameterC
• A sampleD

Learning Check - Answer
• A researcher is interested in the effect of amount of sleep on high school students’ exam scores. A group of 75 high school boys agree to participate in the study. The boys are…
• A statisticA
• A variableB
• A parameterC
• A sampleD

Learning Check
• Decide if each of the following statements
is True or False.
• Most research studies use data from samplesT/F
• When sample differs from the population there is a systematic difference between groups
T/F

Learning Check - Answer
• Samples used because it is not feasible or possible to measure all individuals in the population
True
• Sampling error due to random influences may produce unsystematic group differences
False

1.3 Data Structures, Research
Methods, and Statistics
• Individual Variables
– A variable is observed
– “Statistics” describe the observed variable
– Category and/or numerical variables
• Relationships between variables
– Two variables observed and measured
– One of two possible data structures used to
determine what type of relationship exists
Relationships Between Variables
• Data Structure I: The Correlational Method
– One group of participants
– Measurement of two variables for each
participant
– Goal is to describe type and magnitude of the
relationship
– Patterns in the data reveal relationships
– Non-experimental method of study
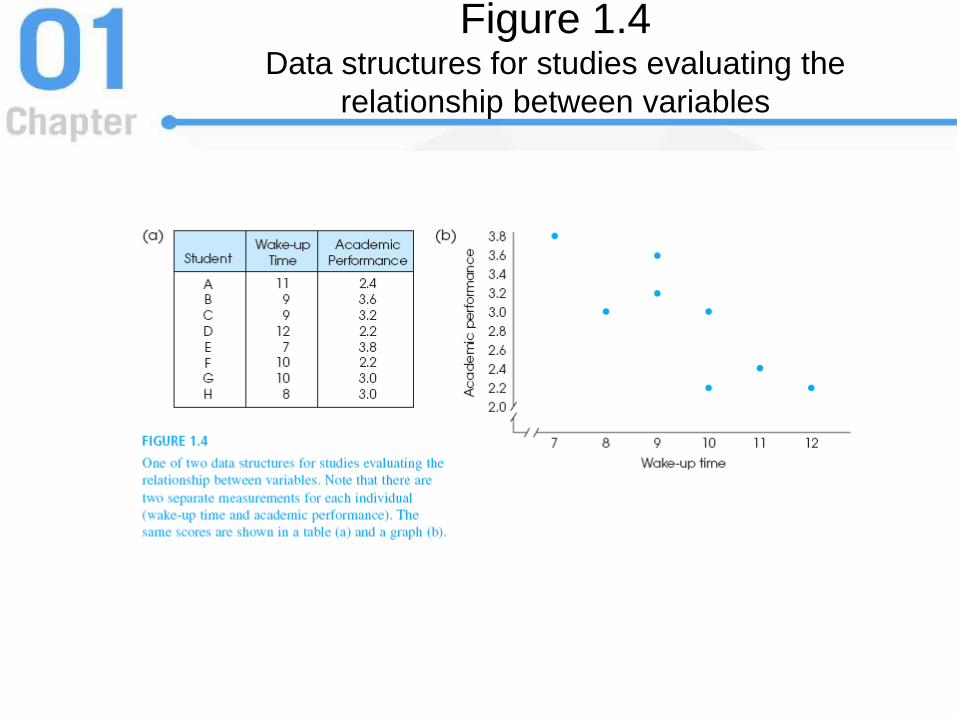
Figure 1.4Data structures for studies evaluating the
relationship between variables
Correlational Method Limitations
• Can demonstrate the existence of a
relationship
• Does not provide an explanation for the
relationship
• Most importantly, does not demonstrate a
cause-and-effect relationship between the
two variables

Relationships Between Variables
• Data Structure II: Comparing two (or more)
groups of Scores
– One variable defines the groups
– Scores are measured on second variable
– Both experimental and non-experimental
studies use this structure

Figure 1.5 Data structure for studies comparing groups
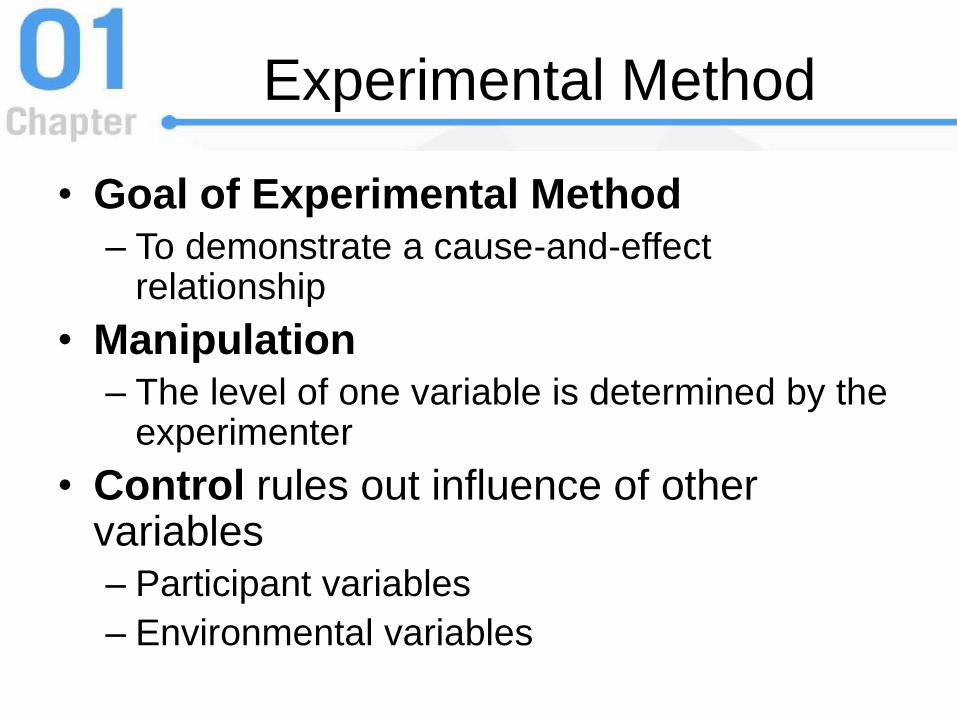
Experimental Method
• Goal of Experimental Method
– To demonstrate a cause-and-effect relationship
• Manipulation
– The level of one variable is determined by the experimenter
• Control rules out influence of other variables
– Participant variables
– Environmental variables

Figure 1.6
The structure of an experiment

Independent/Dependent Variables
• Independent Variable is the variable
manipulated by the researcher
– Independent because no other variable in the
study influences its value
• Dependent Variable is the one observed
to assess the effect of treatment
– Dependent because its value is thought to
depend on the value of the independent
variable
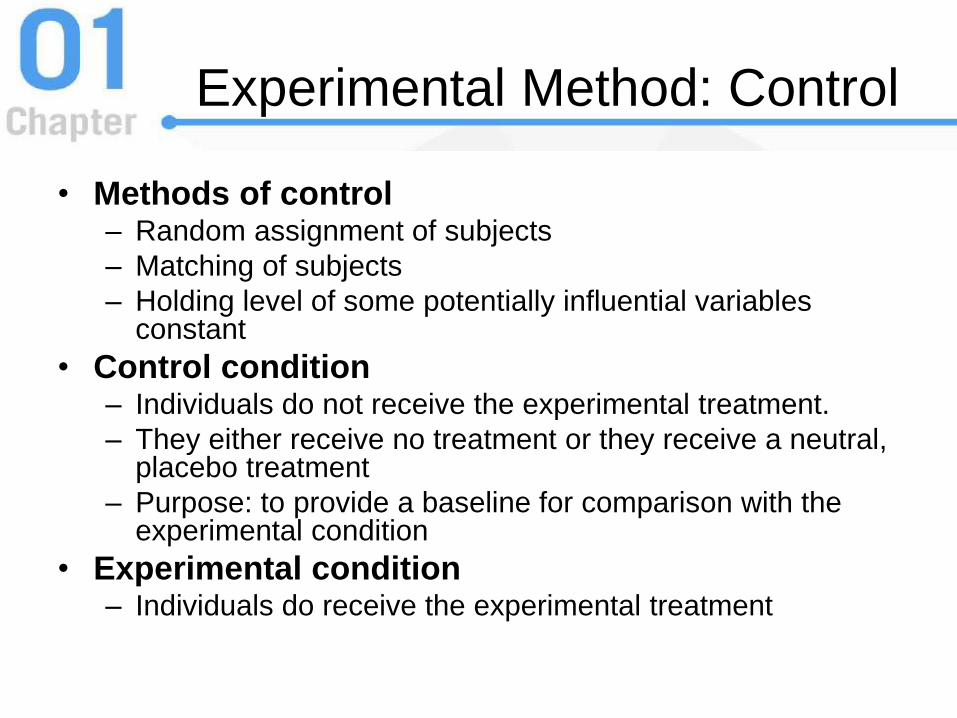
Experimental Method: Control
• Methods of control– Random assignment of subjects
– Matching of subjects
– Holding level of some potentially influential variables constant
• Control condition – Individuals do not receive the experimental treatment.
– They either receive no treatment or they receive a neutral, placebo treatment
– Purpose: to provide a baseline for comparison with the experimental condition
• Experimental condition – Individuals do receive the experimental treatment
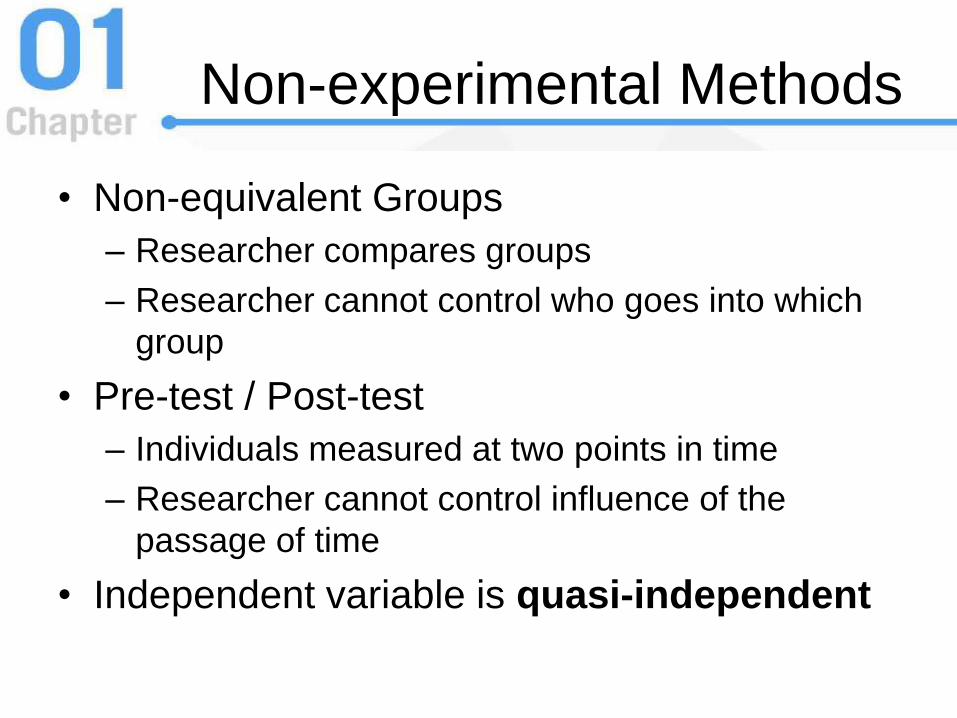
Non-experimental Methods
• Non-equivalent Groups
– Researcher compares groups
– Researcher cannot control who goes into which
group
• Pre-test / Post-test
– Individuals measured at two points in time
– Researcher cannot control influence of the
passage of time
• Independent variable is quasi-independent

Figure 1.7
Two examples of non-experimental studies
Insert NEW Figure 1.7

Learning Check
• Researchers observed that students exam
scores were higher the more sleep they
had the night before. This study is …
• DescriptiveA
• Experimental comparison of groupsB
• Non-experimental group comparison C
• CorrelationalD
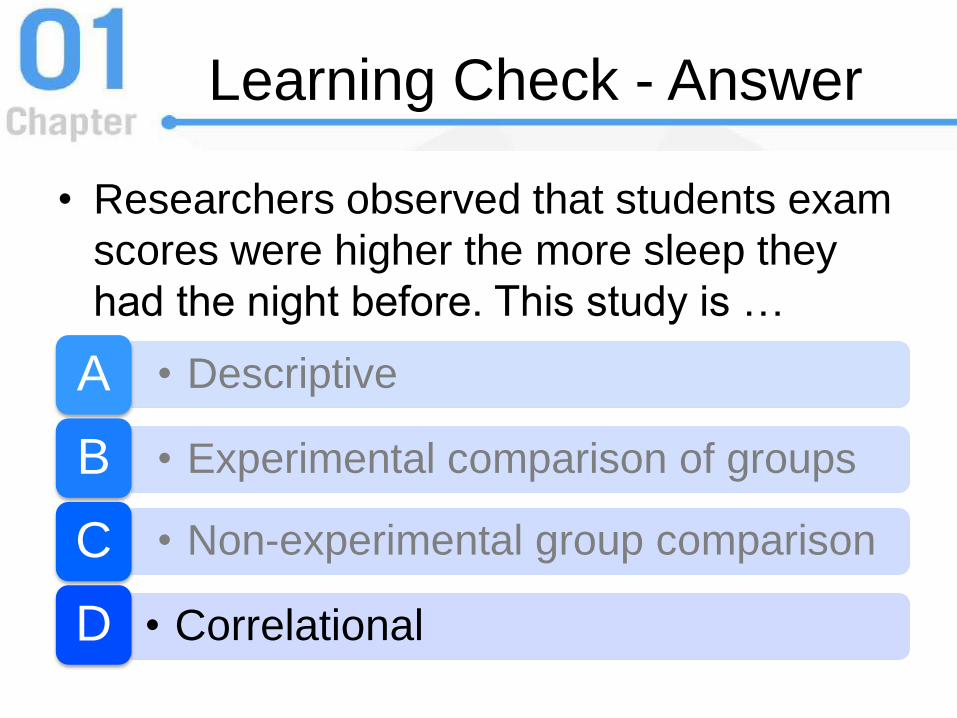
Learning Check - Answer
• Researchers observed that students exam
scores were higher the more sleep they
had the night before. This study is …
• DescriptiveA
• Experimental comparison of groupsB
• Non-experimental group comparisonC
• CorrelationalD
Learning Check
• Decide if each of the following statements
is True or False.
• All research methods have an independent variableT/F
• All research methods can show cause-and-effect relationshipsT/F

Learning Check - Answer
• Correlational methods do not need an independent variable
False
• Only experiments control the influence of participants and environmental variables
False

1.4 Variables and Measurement
• Scores are obtained by observing and
measuring variables that scientists use to
help define and explain external behaviors
• The process of measurement consists of
applying carefully defined measurement
procedures for each variable
Constructs & Operational Definitions
• Constructs
– Internal attributes or characteristics that cannot be directly observed
– Useful for describing and explaining behavior
• Operational Definition
– Identifies the set of operations required to measure an external (observable) behavior
– Uses the resulting measurements as both a definition and a measurement of a hypothetical construct

Discrete and Continuous
Variables
• Discrete variable
– Has separate, indivisible categories
– No values can exist between two neighboring
categories
• Continuous variable
– Have an infinite number of possible values
between any two observed values
– Every interval is divisible into an infinite
number of equal parts

Figure 1.8
Example: Continuous Measurement
Real Limits of Continuous
Variables
• Real Limits are the boundaries of each interval representing scores measured on a continuous number line
– The real limit separating two adjacent scores is exactly halfway between the two scores
– Each score has two real limits
• The upper real limit marks the top of the interval
• The lower real limit marks the bottom of the interval

Scales of Measurement
• Measurement assigns individuals or events to categories
– The categories can simply be names such as male/female or employed/unemployed
– They can be numerical values such as 68 inches or 175 pounds
• The complete set of categories makes up a scale of measurement
• Relationships between the categories determine different types of scales

Scales of Measurement
Scale Characteristics Examples
Nominal •Label and categorize
•No quantitative distinctions
•Gender
•Diagnosis
•Experimental or Control
Ordinal •Categorizes observations
•Categories organized by
size or magnitude
•Rank in class
•Clothing sizes (S,M,L,XL)
•Olympic medals
Interval •Ordered categories
•Interval between categories
of equal size
•Arbitrary or absent zero
point
•Temperature
•IQ
•Golf scores (above/below
par)
Ratio •Ordered categories
•Equal interval between
categories
•Absolute zero point
•Number of correct answers
•Time to complete task
•Gain in height since last
year

Learning Check
• A study assesses the optimal size (number
of other members) for study groups. The
variable “Size of group” is …
• Discrete and intervalA
• Continuous and ordinalB
• Discrete and ratioC
• Continuous and intervalD

Learning Check - Answer
• A study assesses the optimal size (number
of other members) for study groups. The
variable “Size of group” is …
• Discrete and intervalA
• Continuous and ordinalB
• Discrete and ratioC
• Continuous and intervalD

Learning Check
• Decide if each of the following statements
is True or False.
• Variables that cannot be measured directly cannot be studied scientifically
T/F
• Research measurements are made using specific procedures that define constructs
T/F

Learning Check - Answer
• Constructs (internal states) can only be observed indirectly, but can be operationally measured
False
• Operational definitions assure consistent measurement and provide construct definitions
True

1.5 Statistical Notation
• Statistics uses operations and notation
you have already learned
– Appendix A has a Mathematical Review
• Statistics also uses some specific notation
– Scores are referred to as X (and Y)
– N is the number of scores in a population
– n is the number of scores in a sample
Summation Notation
• Many statistical procedures sum (add up) a
set of scores
• The summation sign Σ stands for summation
– The Σ is followed by a symbol or equation that
defines what is to be summed
– Summation is done after operations in
parentheses, squaring, and multiplication or
division.
– Summation is done before other addition or
subtraction

Learning Check
• instructs you to …472 X

Learning Check - Answer
• instructs you to …472 X

Learning Check
• Decide if each of the following equations
is True or False.
22 XX
2 XXX

Learning Check - Answer
• When the operations are performed in a different order, the results will be different
False
• This is the definition of (ΣX)2True

AnyQuestions?
Concepts?
Equations?