introduction to root - royal holloway, university of...
TRANSCRIPT

Introduction to ROOTIntroduction to ROOTObjected-Oriented Data Analysis

In This TutorialIn This Tutorial
l Don’t need to know anything about PAW
l Any C++ code needed for tutorial will be presented
l Slides, example root files etc can be all found at http://www.pp.rhul.ac.uk/~taniamc/RootTutorial

OutlineOutlinel Comparison between ROOT and PAWl CINTl Setting up environment for ROOT and h2rootl Histograms and Trees (Ntuples)l INTERACTIVE SESSION 1 – pre-prepared ROOT files
l Presentation of histograms and treesl Statistics box, legends, text boxesl Functions: built-in and user-definedl INTERACTIVE SESSION 2 – presentation and functions
l Macrosl Fittingl TBrowser – the ROOT graphical interfacel INTERACTIVE SESSION 3 – macros and TBrowser
l Where to get more informationl Summary and wrap-up
Before Starting ROOTBefore Starting ROOT

CINT CINT –– ROOT’sROOT’s C++ InterpreterC++ Interpreter
l CINT is based on C++l CINT is not a compiler – can do things wrong sometimes
you won’t get warningsl ROOT needs to be restarted more often than you might likel Differences between CINT and C++:
– “->” can be replaced with “.”– the “;” at the end of lines can be omitted in interactive use
(not when running with macros!)– can use much simpler language to create objects/pointers:
e.g.: TH1F* myHisto = new TH1F; // a 1-D histogramequivalent to:
TH1F myHisto

ROOT TypesROOT Types
l Familiar C++ objects are there, names:– basic types: capitalised and have suffix “_t”:
int → Int_t float → Float_t
– Names of classes start with “T”:TDirectory, TFile, TTree, TH1F, TF1…
l Some ROOT types (classes):– TH1F - Histogram, containing Float_t objects (floats)– TDirectory – a directory– TTree – can store per-event info in branches and leaves– TF1 – 1-dimensional function, TF2, …

Running ROOTRunning ROOT
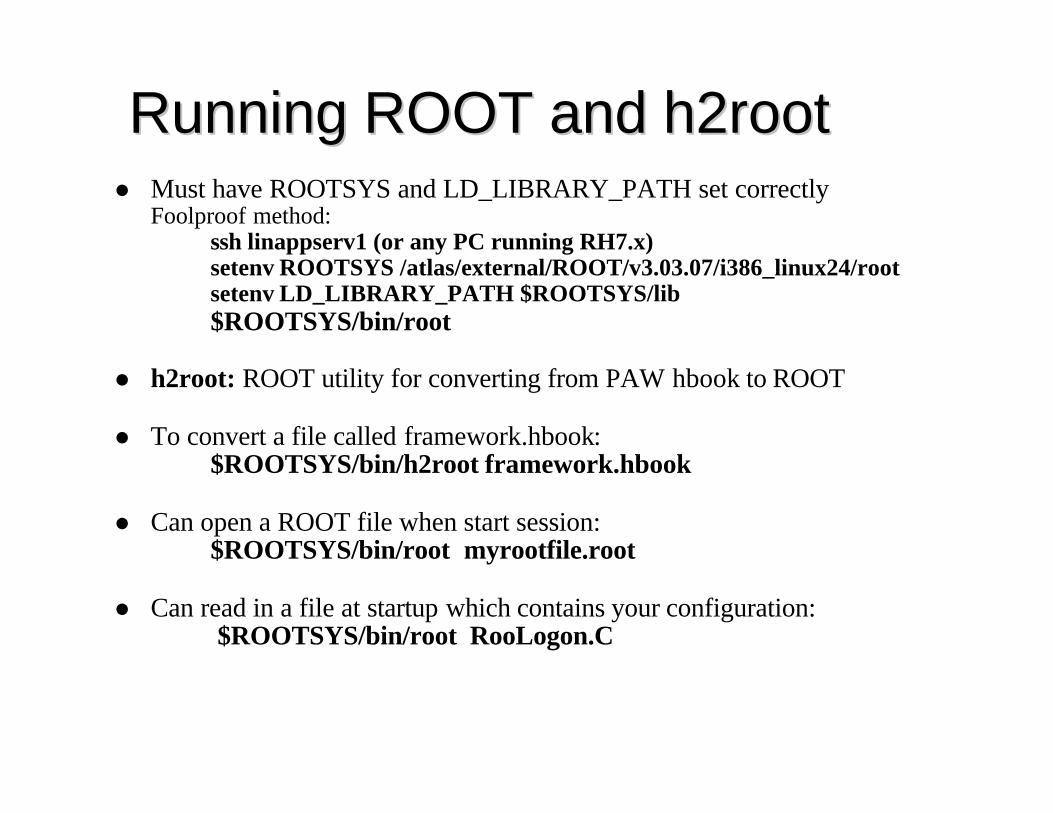
Running ROOT and h2rootRunning ROOT and h2rootl Must have ROOTSYS and LD_LIBRARY_PATH set correctly
Foolproof method:ssh linappserv1 (or any PC running RH7.x)setenv ROOTSYS /atlas/external/ROOT/v3.03.07/i386_linux24/rootsetenv LD_LIBRARY_PATH $ROOTSYS/lib$ROOTSYS/bin/root
l h2root: ROOT utility for converting from PAW hbook to ROOT
l To convert a file called framework.hbook:$ROOTSYS/bin/h2root framework.hbook
l Can open a ROOT file when start session:$ROOTSYS/bin/root myrootfile.root
l Can read in a file at startup which contains your configuration: $ROOTSYS/bin/root RooLogon.C

CommandsCommandsl CINT commands always start with a dot “.”, e.g:
.q – quit out of ROOT session
.! shellcommand – execute a shell command, e.g..! ls //normal unix list command
.? – help, get list of CINT commands
l Tab-completion of commands and filename calls– can help in finding available commands, e.g.
l TH1F h1 //define a histograml h1-> [tab] //lists all available functions of histo
class

ROOT ObjectsROOT Objects

ROOT Canvas and PadROOT Canvas and Padl canvas: graphics window where histograms are displayedl It is very easy to edit pictures on the canvas by clicking and
dragging objects and right-clicking to get various menusl A ROOT canvas is a TCanvas objectl Default canvas c1 created on first call to Draw()l Create a canvas with TCanvas canvas;l Actually: TCanvas *c1=new TCanvas(“c1”,””,800,600); l Update canvas (if make some changes): canvas->Update();l Tidy up canvas: canvas->Clear();l Initially, canvas has one pad which covers whole canvasl Split canvas into several TPads, e.g.: canvas->Divide(2,2);l Can plot different histograms on different padsl Change pad with canvas->cd(n)l Save the contents of the canvas: canvas->SaveAs(“file.ps”)l Can save as ps, eps or gif

Files, Histograms & TreesFiles, Histograms & Treesl Files contain directories, histograms and trees (ntuples)l Histograms have axes, title, lines, markers, FillStyles, …l Trees contain branches and leaves
A few file commands:l Open a file:
TFile f(“myfile.root”);l Inspect (list) contents with:
f->ls();l Change into a directory of the file with:
f->cd(“mydirectory”);l List the histograms in that directory:
gDirectory->ls();l Plot a histogram in that directory:
histo->Draw();

Histograms IHistograms I
l Declare histogram with:TH1F myhisto
l Make a first histogram:TH1F h_name(“h_name”, “h_title”, nbins, xlow, xhi);
h_name = name histo is referenced in ROOTh_title = name which appears on histo
l Now draw the (currently empty) histo:h1->Draw();
l Fill with a few entries:h1->Fill(1.);h1->Fill(3,10);h1->Draw(); //do this occasionally to update the histo
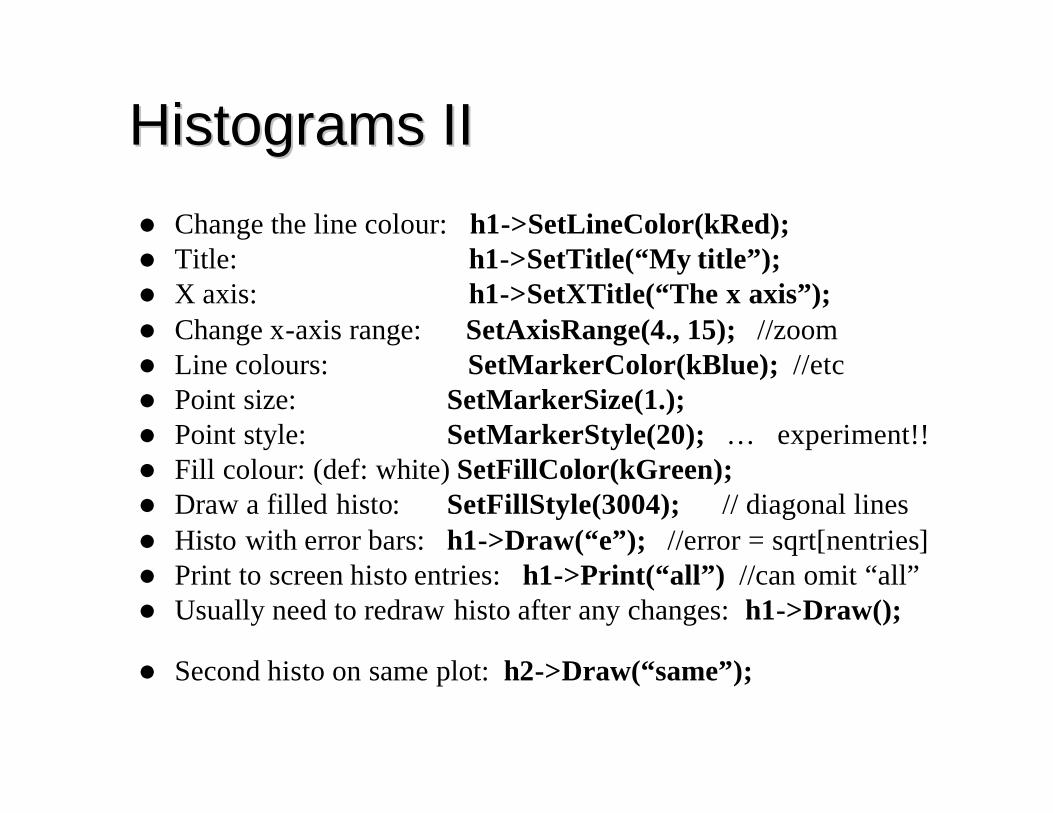
Histograms IIHistograms IIl Change the line colour: h1->SetLineColor(kRed);l Title: h1->SetTitle(“My title”);l X axis: h1->SetXTitle(“The x axis”);l Change x-axis range: SetAxisRange(4., 15); //zooml Line colours: SetMarkerColor(kBlue); //etcl Point size: SetMarkerSize(1.);l Point style: SetMarkerStyle(20); … experiment!!l Fill colour: (def: white) SetFillColor(kGreen);l Draw a filled histo: SetFillStyle(3004); // diagonal linesl Histo with error bars: h1->Draw(“e”); //error = sqrt[nentries]l Print to screen histo entries: h1->Print(“all”) //can omit “all”l Usually need to redraw histo after any changes: h1->Draw();
l Second histo on same plot: h2->Draw(“same”);
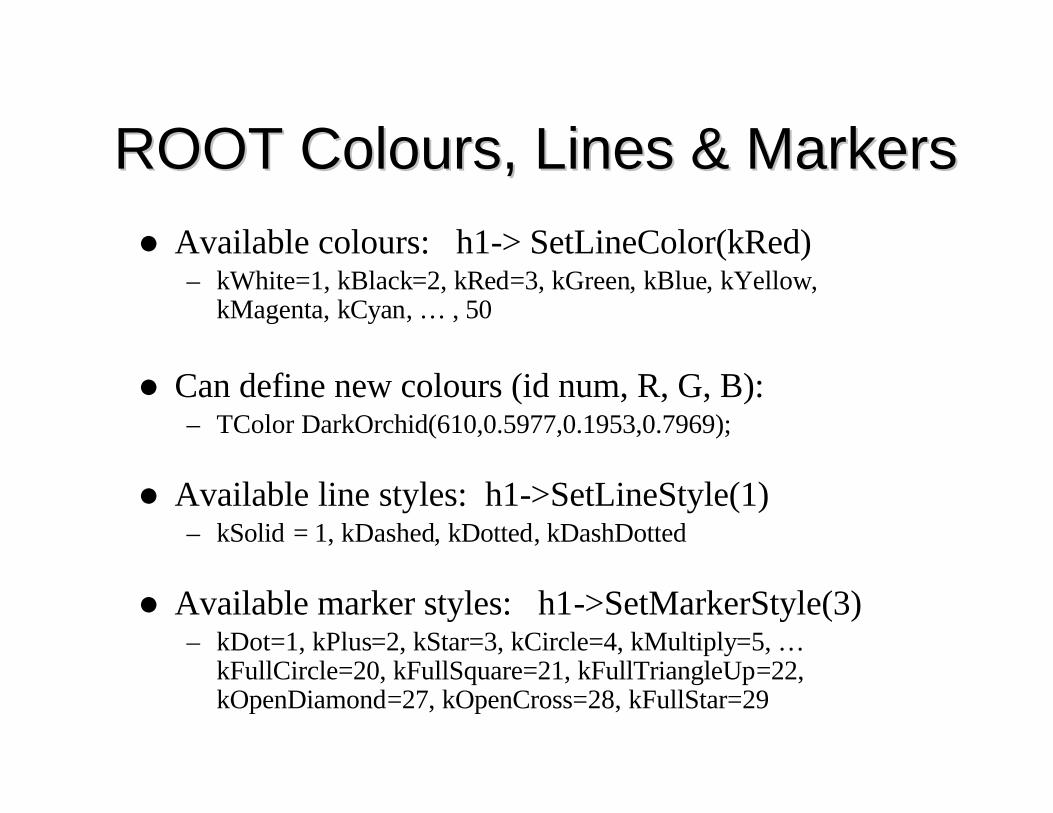
ROOT Colours, Lines & MarkersROOT Colours, Lines & Markersl Available colours: h1-> SetLineColor(kRed)
– kWhite=1, kBlack=2, kRed=3, kGreen, kBlue, kYellow, kMagenta, kCyan, … , 50
l Can define new colours (id num, R, G, B):– TColor DarkOrchid(610,0.5977,0.1953,0.7969);
l Available line styles: h1->SetLineStyle(1)– kSolid = 1, kDashed, kDotted, kDashDotted
l Available marker styles: h1->SetMarkerStyle(3)– kDot=1, kPlus=2, kStar=3, kCircle=4, kMultiply=5, …
kFullCircle=20, kFullSquare=21, kFullTriangleUp=22, kOpenDiamond=27, kOpenCross=28, kFullStar=29

INTERACTIVE SESSION 1INTERACTIVE SESSION 1Start ROOT and look at a pre-prepared root filel Logon to a Unix platform eg linappserv1l Make a directory to contain the ROOT files and macros for this tutoriall Copy the example files from my directory (see slide 2 for web location)l Start up a ROOT sessionl Open the file example1.rootl Look at the directory structure of the ROOT filel Change into the directory named “Manchester Analysis Histograms;1”
and draw a few of the histograms there– Clear the canvas, plot histo called “h1d2” with a blue line, plot histo called
“h1d3” with a red line on the same plot– For this histogram, set your own axis labels and title– Experiment by right-clicking on various parts of the histogram and seeing
the menus that arise, as well as dragging things, etc.l Close the ROOT session
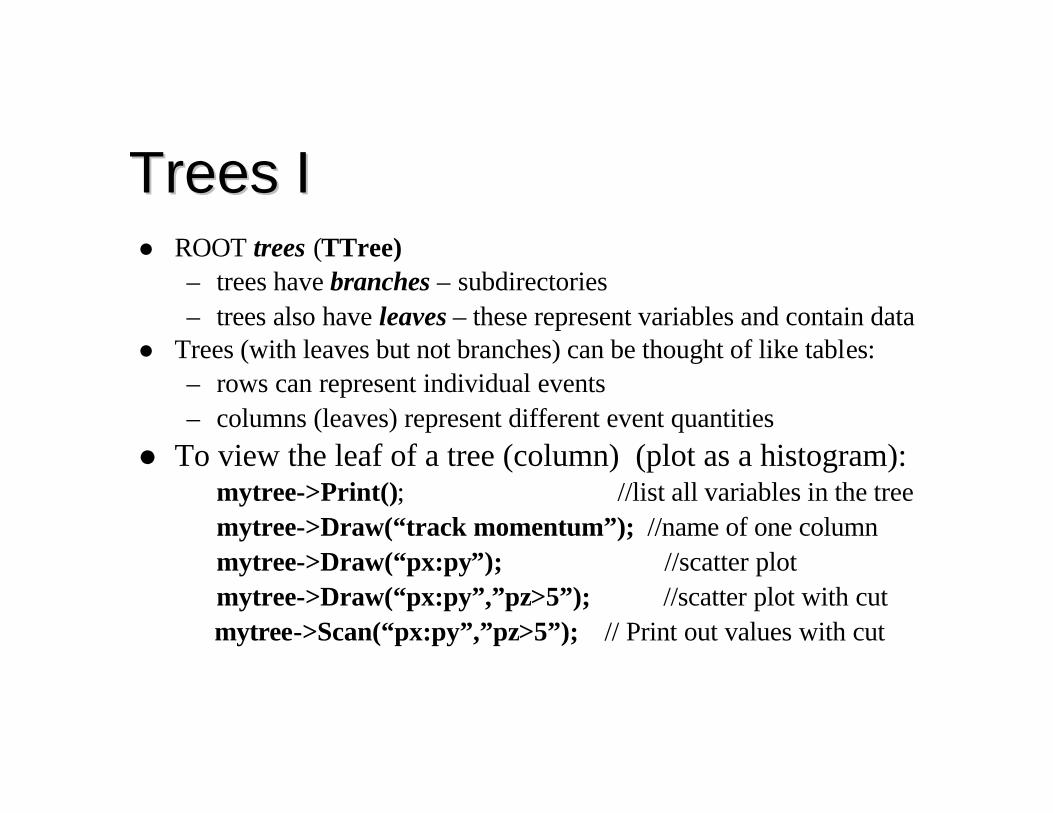
Trees ITrees Il ROOT trees (TTree)
– trees have branches – subdirectories– trees also have leaves – these represent variables and contain data
l Trees (with leaves but not branches) can be thought of like tables:– rows can represent individual events– columns (leaves) represent different event quantities
l To view the leaf of a tree (column) (plot as a histogram):mytree->Print(); //list all variables in the treemytree->Draw(“track momentum”); //name of one columnmytree->Draw(“px:py”); //scatter plotmytree->Draw(“px:py”,”pz>5”); //scatter plot with cutmytree->Scan(“px:py”,”pz>5”); // Print out values with cut

Statistics BoxStatistics Box
l Default placing – top rightl Various statistics can be displayed,
– histoname, mean, rms, number of entries, …
l To set up the stats box:gStyle->SetOptStat(); //default settingsgStyle->SetOptStat(0); //no stats boxh1->Draw(); //update canvasgStyle->SetOptStat(1111111); //turn all options onh1->Draw();gStyle->SetOptStat(11); //name & neventsh1->Draw();
LegendsLegends
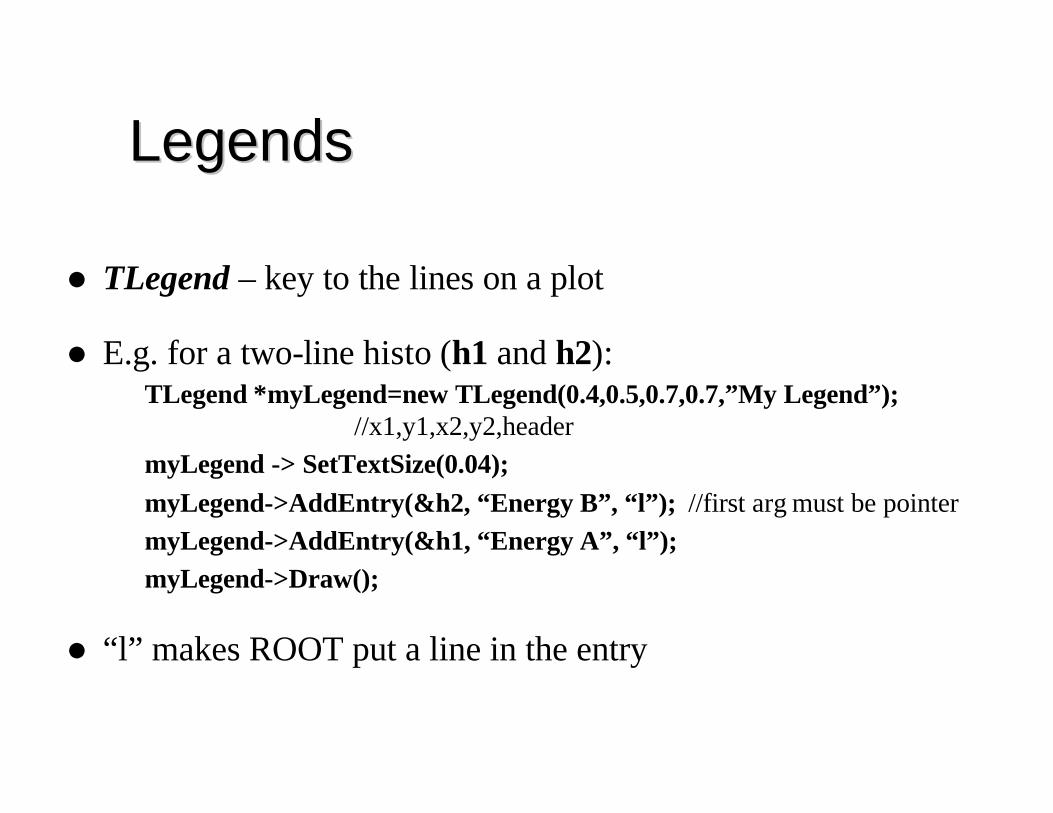
l TLegend – key to the lines on a plot
l E.g. for a two-line histo (h1 and h2):TLegend *myLegend=new TLegend(0.4,0.5,0.7,0.7,”My Legend”);
//x1,y1,x2,y2,headermyLegend -> SetTextSize(0.04);myLegend->AddEntry(&h2, “Energy B”, “l”); //first arg must be pointermyLegend->AddEntry(&h1, “Energy A”, “l”);myLegend->Draw();
l “l” makes ROOT put a line in the entry

Text BoxText Box
l Use text box (TPaveText) write on plots, e.g.:TPaveText *myText = new TPaveText(0.2,0.7,0.4,0.85, “NDC”);
//NDC sets coords relative to padmyText->SetTextSize(0.04);myText->SetFillColor(0); //white backgroundmyText->SetTextAlign(12);myTextEntry = myText->AddText(“Here’s some text.”);myText->Draw();
l Greek fonts and special characters:h1->SetYTitle(“B^{0} #bar{B^{0}}”); //must have brackets for suph1->SetTitle(“#tau^{+}#tau^{-}”);
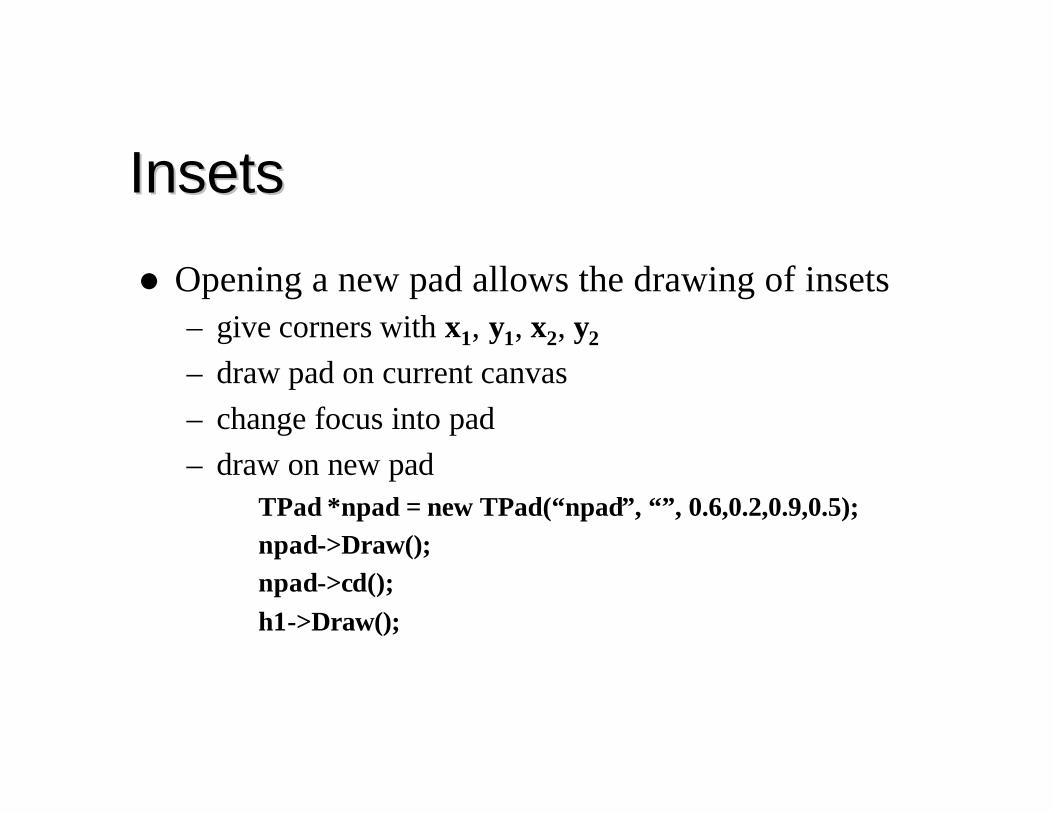
InsetsInsets
l Opening a new pad allows the drawing of insets– give corners with x1, y1, x2, y2
– draw pad on current canvas– change focus into pad– draw on new pad
TPad *npad = new TPad(“npad”, “”, 0.6,0.2,0.9,0.5);npad->Draw();npad->cd();h1->Draw();

FunctionsFunctions

Functions I Functions I –– Maths FunctionsMaths Functionsl ROOT has many predefined functions, e.g.
sin(x), exp(x), …, cd(), ls(), …l Many of the ROOT classes have associated functions, e.g.
Draw(), Print(), SetXTitle(), …l Easy to define new ROOT functions, e.g.
1-D function – type is TF1:TF1 *f1 = new TF1(“f1”, “x*sin(x)”,0,10);
2-D function – type is TF2:TF2 *f2 = new TF2(“f2”, “y*sin(x)”,0,10,0,20);
l Plot these functions withf1->Draw(); f2->Draw(“surf4”); //5 surface options for 2D
l Delete a function: f2->Delete(); //frees up name for later usel The sort of functions you really want are macros…
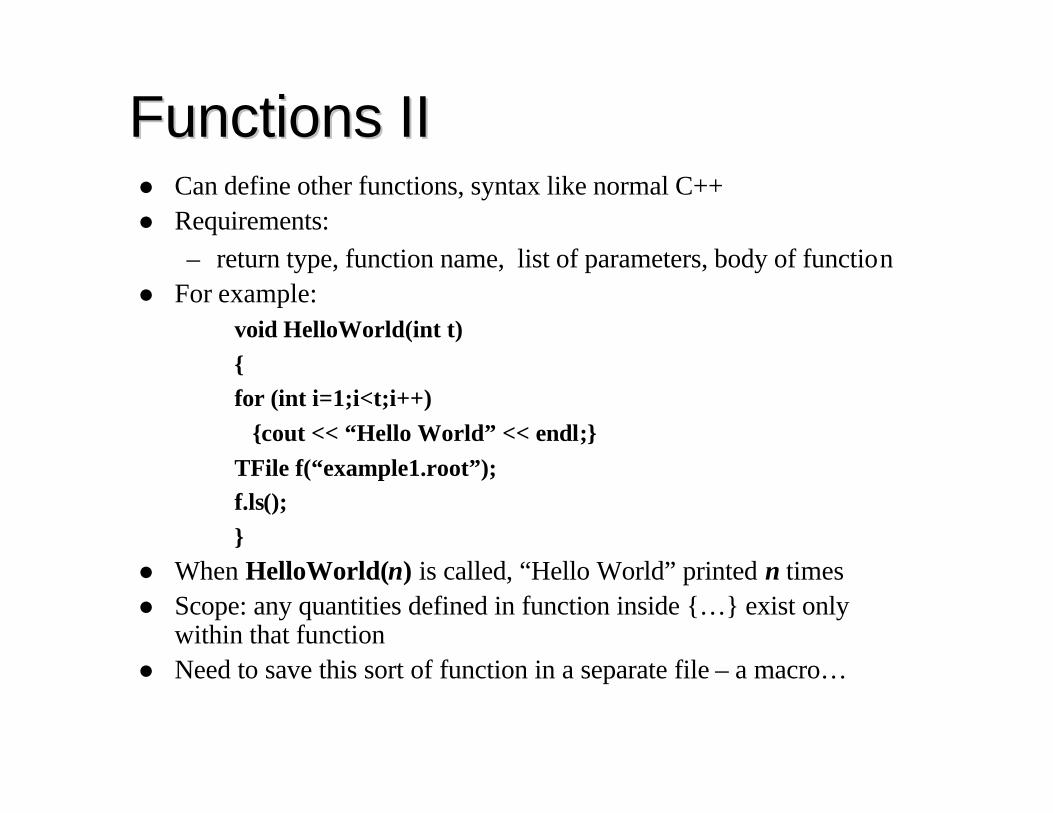
Functions IIFunctions IIl Can define other functions, syntax like normal C++l Requirements:
– return type, function name, list of parameters, body of functionl For example:
void HelloWorld(int t){for (int i=1;i<t;i++)
{cout << “Hello World” << endl;}TFile f(“example1.root”);f.ls();}
l When HelloWorld(n) is called, “Hello World” printed n timesl Scope: any quantities defined in function inside {…} exist only
within that functionl Need to save this sort of function in a separate file – a macro…

Functions III Functions III –– separate filesseparate filesl It’s useful (tidy) to define your functions in separate filesl For now, we’ll call these named macrosl Since they’re written in C++, use file extension .cc or .Cl E.g. the HelloWorld example on the previous slide
– save as HelloWorld.ccl Load functions into an interactive ROOT session with
.L HelloWorld.ccl Function now available to use in current ROOT sessionl Call your function like any other defined function:
HelloWorld(5);l Can define several functions in a single filel Can overload the functions (I.e. have two functions with same name,
but different parameter lists – this can be very useful!)l See your function in existence: .functions lists all available
functions (of which there are many!)

INTERACTIVE SESSION 2INTERACTIVE SESSION 2

INTERACTIVE SESSION 2INTERACTIVE SESSION 2Maths functions and named macrosl Make a ROOT canvasl Define the function cos(x)*sin(x) on range (0,100) and plot itl Draw the function 1/x*sin(x) on the same canvasl Add a legend to your plot for the two contributionsl Draw the two functions on separate pads on the same canvas
and put titles on bothl Save your final product as an EPS file
– Clear the canvas, define the 2D function cos(x)*sin(y) over (0,100) in x and (0,200) in y and plot it experimenting with the various surf options
– Add an inset showing the plot in the region (0,10) and (0,20)l Save this plot as a PS file and check it with ghostviewl Write a macro to do the 1D parts of this session
– Hint: scope means need a SaveAs, also should make Canvas– edit the macro so that, depending on the parameter passed, it’ll
do either the 1D parts of this session or the 2D parts
MacrosMacros
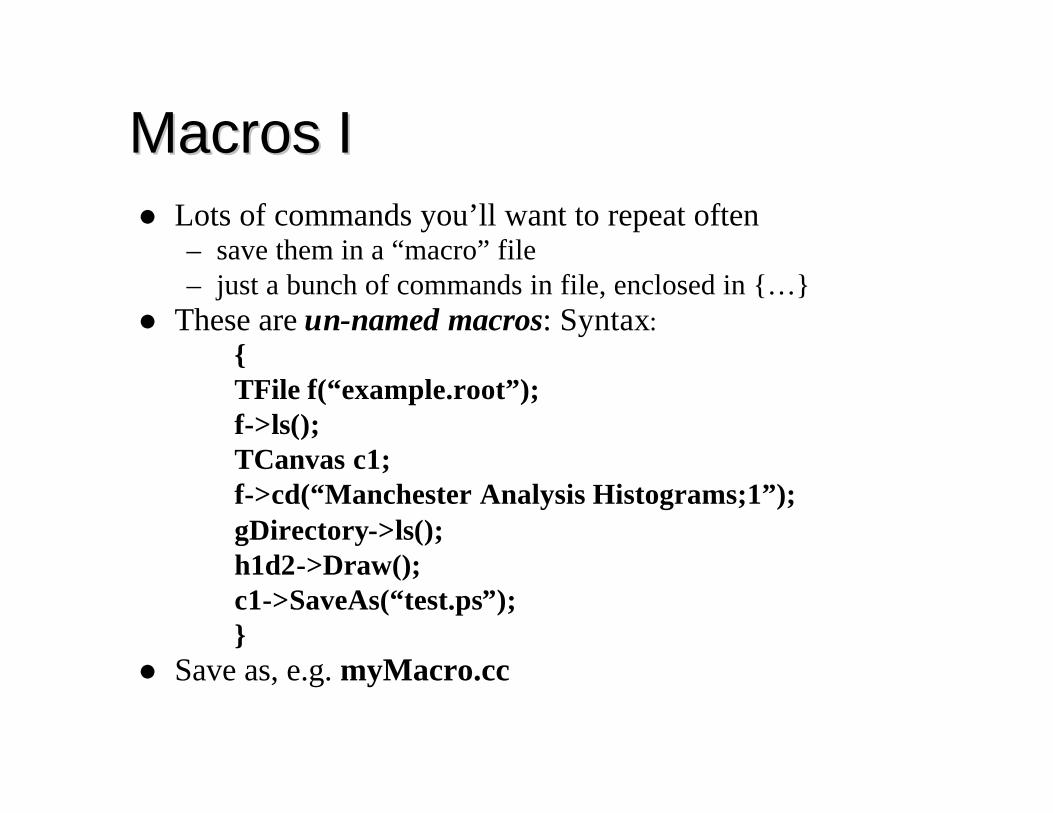
Macros IMacros Il Lots of commands you’ll want to repeat often
– save them in a “macro” file – just a bunch of commands in file, enclosed in {…}
l These are un-named macros: Syntax:{TFile f(“example.root”);f->ls();TCanvas c1;f->cd(“Manchester Analysis Histograms;1”);gDirectory->ls();h1d2->Draw();c1->SaveAs(“test.ps”);}
l Save as, e.g. myMacro.cc

Macros IIMacros IIl execute un-named macro:
.x myMacro.ccl Runs all the commands in that filel Combine named and un-named macros – build up an analysis job!l Macros can call and use other macrosl Syntax to load a macro from a file:
gROOT->LoadMacro(“myFile.cc”); (formal form of .L myFile.cc)
l If you will use the function frequently, better to have named macro (function) – particularly if you want options
l Scope works the same as in C++ – anything defined in a macro exists only inside that macro
Selection FunctionsSelection Functions
l For analysing ntuples(TTrees), may want to:– Book some histograms– Read in an event– Loop over particles– Fill some histograms– Manipulate some quantities– Make some cuts etc….
l ROOT can make a template class for you to do all this.

Selection FunctionsSelection Functionsl Template creation:
– T->MakeSelector(“myselect”)l Creates in your working directory 2 files:
– myselect.C (put your analysis code here)– myselect.h (defines all the variables available in the tree)– BEWARE: It will overwrite files of the same name which exist
there!l myselect.C contains member functions with specific
purposes:– Begin: Put code here for things you want done at the beginning
of the job (eg booking histograms). Executed once per job.– ProcessCut: Executed once per event. Put
cuts/analysis/histogram filling here. Return either kFALSE or kTRUE.
– ProcessFill: Executed only if kTRUE returned from ProcessCut. – Terminate: Called at end of job.
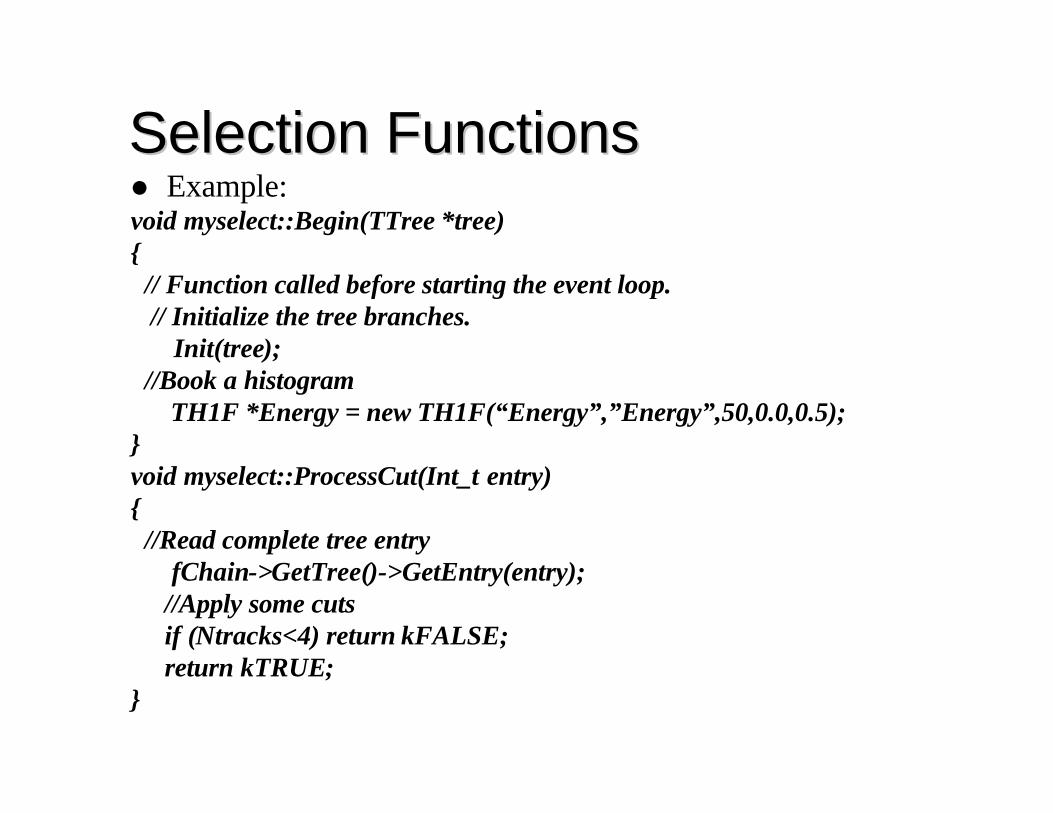
Selection FunctionsSelection Functionsl Example:void myselect::Begin(TTree *tree){
// Function called before starting the event loop.// Initialize the tree branches.
Init(tree);//Book a histogram
TH1F *Energy = new TH1F(“Energy”,”Energy”,50,0.0,0.5);}void myselect::ProcessCut(Int_t entry){
//Read complete tree entryfChain->GetTree()->GetEntry(entry);
//Apply some cutsif (Ntracks<4) return kFALSE;return kTRUE;
}
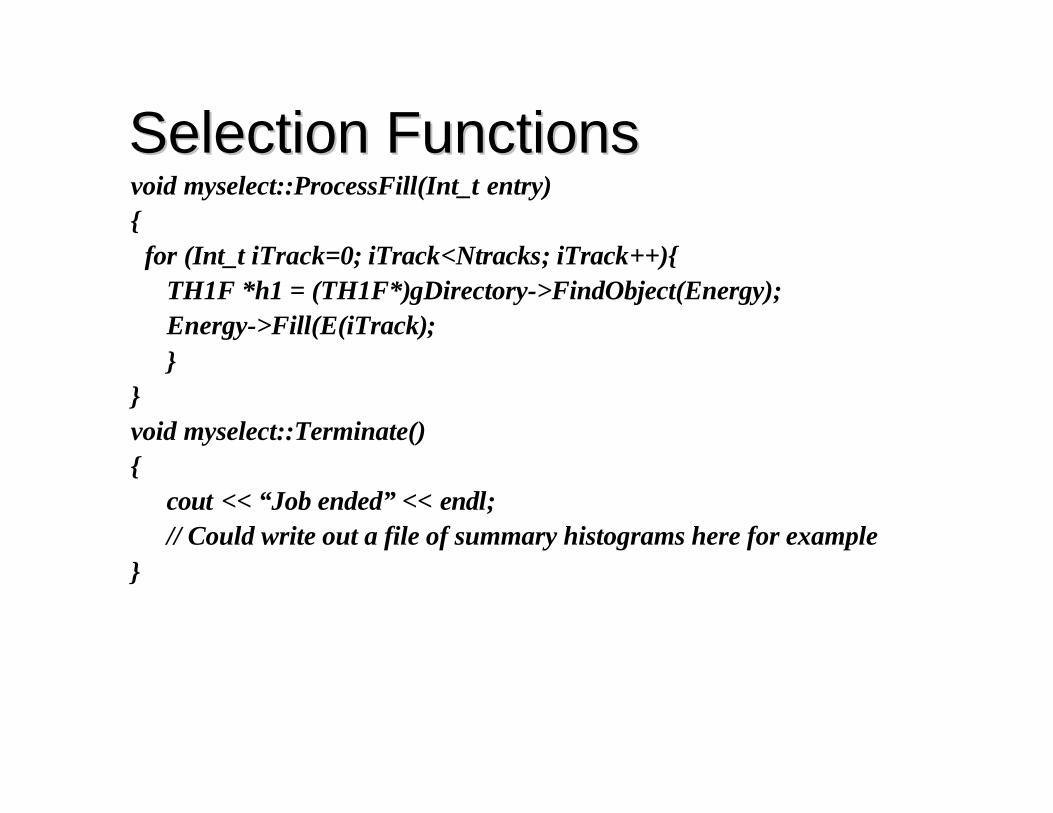
Selection FunctionsSelection Functionsvoid myselect::ProcessFill(Int_t entry){
for (Int_t iTrack=0; iTrack<Ntracks; iTrack++){TH1F *h1 = (TH1F*)gDirectory->FindObject(Energy);Energy->Fill(E(iTrack);}
}void myselect::Terminate(){
cout << “Job ended” << endl;// Could write out a file of summary histograms here for example
}

Selection FunctionsSelection Functionsl To execute selection function:
T.Process(“myselect.C”)or
T.Process(“myselect.C”,”some options”)(You can get the options in your code
TString option=GetOption()and query it using the TString class).
l If you have multiple ntuples, create a chain:TChain chain(“T”);chain.Add(“file1.root”);chain.Add(“file2.root”);chain.Process(“myselect.C”);

Fitting 1D FunctionsFitting 1D Functionsl Fitting in ROOT based on Minuit (ROOT class: TMinuit)l ROOT has 4 predefined fit functions, e.g.
gaus: f(x)=p0exp{-½[(x-p1)/p2]2} //3 paramsl Fitting a histogram with pre-defined functions, e.g.
h1->Fit(“gaus”); //landau, exp0, pol0->pol9h1->Fit(“landau”, “R”,””, 3.,15);– “R” says ‘fit only in range xmin → xmax’
l User-defined: 1-D function (TF1) with parameters:TF1 *myFit= new TF1(“myfit”,”[0]*sin(x) +[1]*exp(-[2]*x)”,0,2);
l Set param names (optional) and start values (must do):myFit->SetParName(0,”paramA”);myFit->SetParameter(0,0.75); //start value for param [0]
l Fit a histo:myHist->Fit(“myfit”);

Fitting IIFitting IIl Fitting with user-defined functions:
double myfunc(double *x, double *par){ double arg=0;
if (par[2]!=0) arg=(x[0]-par[1])/par[2];return par[0]*TMath::Exp(-0.5*arg*arg);
}l double *x is a pointer to an array of variables
– it should match the dimension of your histograml double *p is a pointer to an array of parameters
– it holds the current values of the fit parametersl Now in a root session:
.L myfunc.ccTF1 *f1=new TF1(“f1”,myfunc,-1,1,3);h1->SetParameters(10, h1->GetMean(), h1->GetRMS());h1->Fit(“f1”);
Fitting III Fitting III –– The Fit PanelThe Fit Panel
l Start a fit panel for your histo with:h1d1->FitPanel();
l ROOT’s fitting functions available at the click of a button
l Best part – slide panel – restrict fit range by grabbing edges of slide panel (bit just above “Fit” button) and watch lines showing fit range on your histo
l Update fit by hitting “Fit” button

Graphical InterfaceGraphical Interface
TBrowser TBrowser –– the ROOT GUIthe ROOT GUI
l The TBrowser is the ROOT graphical interface
l It allows quick inspection of files, histograms and trees
l Make one with:TBrowser tb;
l More formally:TBrowser *tb = new TBrowser;

Using the TBrowserUsing the TBrowser
l Start in ROOT with:TBrowser tb;
l Any files already opened will be in the ROOT files directoryl Directory ROOT session started in will be shown tool Otherwise click around your directories to find your filesl Click to go into chosen directoryl Double-click on any ROOT files you want to look at (you
won’t see an obvious response)l Now go into the ROOT files directoryl Selected files now therel Can click around files, directories, treesl Can view histograms and leaves

INTERACTIVE SESSION 3INTERACTIVE SESSION 3

INTERACTIVE SESSION 3INTERACTIVE SESSION 3Macros and the TBrowserl Write a macro to
– plot the function cos(x) as a histogramHint: (f1->GetHistogram())->Draw(); TH1F f1hist=(TH1F)(f1->Get…)
– fit it with a polynomial of degree 8– fit it with a Gaussian over one half period– define a function which a weighted sum of 1, cos(x/3),
x*cos(x/5), and refit over 0->20– experiment with the fit panel – look at different fit functions over
different rangesl (If time permits) Write and run an unnamed macro to load your
named macro from Session 2 and plot the 1D bits from Session 1l Make a TBrowserl Have a look around example1.rootl Split the canvas and plot several tree variables from ntp13 on the
same pad and on separate pads, using:– the graphical interface (clear canvas, and split it –you’ll need to
look around)– the command line to change focus on pads

Final CommentsFinal Comments
Where to Get More InformationWhere to Get More Informationl The ROOT homepage: http://root.cern.ch/
– examples, HOWTOs, tutorials, class information, ROOT source code– RootTalk mailing list – high traffic, great search facility
l It is searchable: http://root.cern.ch/root/Search.phtml– Eg Go here and type in a class name to see the class definition and
member functions.l Fermilab’s three-day ROOT course http://patwww.fnal.gov/root