introduction to probability -...
TRANSCRIPT
© C
arne
gie
Lear
ning
781
Introduction to Probability
13.1 Rolling, Rolling, Rolling . . .Defining and Representing Probability .........................783
13.2 Toss the CupDetermining Experimental Probability .........................797
13.3 Double Your FunDetermining Theoretical Probability ........................... 809
13.4 A Toss of a CoinSimulating Experiments .............................................. 819
13.5 Roll the Cubes AgainUsing Technology for Simulations .............................. 829
During the spring and
summer days in the United States, weather forecasters
feverishly review computer models and atmospheric pressure. These
factors and others help forecasters predict the chances of a tornado
forming. Many times, these predictions can save many
lives during bad weather.
462345_C2_CH13_pp781-864.indd 781 28/08/13 12:46 PM

© C
arne
gie
Lear
ning
782 • Chapter 13 Introduction to Probability
462345_C2_CH13_pp781-864.indd 782 28/08/13 12:46 PM
© C
arne
gie
Lear
ning
13.1 Defining and Representing Probability • 783
The weatherman forecasts a 60% chance of rain. A new drug is reported to
have a 0.5% chance of causing headaches. You have a 1 out of 4 chance of
guessing the answer to a multiple-choice question with four possible answers. All
of these statements have one thing in common—they attempt to predict the
future. In mathematics, you can use probability to determine what may happen in
the future. How else do you encounter probability in the real world?
Rolling, Rolling, Rolling . . . Defining and Representing Probability
Key Terms outcome
experiment
sample space
event
simple event
probability
complementary
events
equally likely
Learning GoalsIn this lesson, you will:
Differentiate between an outcome and an event for
an experiment.
List the sample space for an experiment.
Determine the probability for an event.
Determine the probability of the complement
of an event.
Understand that the probability for an event is
between 0 and 1 that can be expressed as a fraction,
decimal, or percent.
Determine that the sum of the probabilities of the
outcomes of an experiment is always 1.
462345_C2_CH13_pp781-864.indd 783 28/08/13 12:46 PM

© C
arne
gie
Lear
ning
784 • Chapter 13 Introduction to Probability
Problem 1 What Are the Chances?
A six-sided number cube has one number, from 1 through 6, on each of its faces. Number
cubes are often used when playing many board games.
1. Create a list of all the possible numbers that can appear on the top face if you roll a
six-sided number cube.
The numbers 1, 2, 3, 4, 5, and 6 are the outcomes that can occur when rolling a six-sided
number cube. An outcome is the result of a single trial of an experiment. An experiment
is a situation involving chance that leads to results, or outcomes. A list of all possible
outcomes of an experiment is called a samplespace. A sample space is typically
enclosed in brackets, { }, with commas between the outcomes.
2. List the sample space for the experiment of rolling a six-sided number cube.
An event is one or a group of possible outcomes for a given situation. A simpleevent is
an event consisting of one outcome. For example, in the number cube experiment, an
event could be rolling an even number. However, rolling a 5 is a simple event.
Probability is a measure of the likelihood that an event will occur. It is a way of assigning a
numerical value to the chance that an event will occur. The probability of an event is often
written as P(event). For example, in the number cube experiment, the probability of rolling
a 5 could be written as P(rolling a 5), or P(5). The probability of rolling an even number
could be written as P(rolling an even number), or P(even).
In general, the way to determine the probability of an event is:
probability 5 number of times an event can occur _________________________________ number of possible outcomes
.
462345_C2_CH13_pp781-864.indd 784 28/08/13 12:46 PM
© C
arne
gie
Lear
ning
3. What is the probability of rolling a 4, or P(4)? Explain your reasoning.
4. What is the probability of rolling a 6, or P(6)? Explain
your reasoning.
13.1 Defining and Representing Probability • 785
So, to determine P(4) consider how many
times a 4 can occur when you roll a six-sided
number cube.
To determine the probability of rolling an odd number, or P(odd), follow these steps:
Step1: First, list all the possible outcomes.
The possible odd numbers that can be rolled are 1, 3, and 5.
Step2: Add the number of outcomes.
There are 3 possible outcomes of rolling an odd number.
Step3: Use the equation to determine the probability of rolling an odd number.
P(odd) 5 number of times an odd can occur _______________________________ number of possible outcomes
5 3 times of rolling an odd number
______________________________ 6 number of possible outcomes
The probability of rolling an odd number is 3 out of 6 outcomes.
462345_C2_CH13_pp781-864.indd 785 28/08/13 12:46 PM
786 • Chapter 13 Introduction to Probability
© C
arne
gie
Lear
ning
5. Determine the probability of rolling an even number.
a. Which outcome or outcomes make up the event of rolling an even number?
b. Calculate the probability of rolling an even number.
6. Determine the probability of rolling a number that is not even.
a. Which outcome(s) make up the event of rolling a number that is not even?
b. Calculate the probability of rolling a number that is not even.
7. Determine the probability of rolling a number greater than 4.
a. Which outcome(s) make up the event of rolling a number greater than 4?
b. Calculate the probability of rolling a number greater than 4.
462345_C2_CH13_pp781-864.indd 786 28/08/13 12:46 PM

© C
arne
gie
Lear
ning
13.1 Defining and Representing Probability • 787
8. Determine the probability of rolling a number that is not greater than 4.
a. Which outcome(s) make up the event of rolling a number that is not greater
than 4?
b. Calculate the probability of rolling a number that is not greater than 4.
The pair of events in Questions 5 and 6 and the pair of events in Questions 7 and 8 are
called complementary events. Complementary events are events that consist of the
desired outcomes, and the remaining events that consist of all the undesired outcomes.
Together, complementary events include every possible outcome in the sample space.
The notation for the complement of an event is ~. For instance, suppose that P(even)
represents the probability of rolling an even number on a number cube. Then, P(~even)
represents the probability of not rolling an even number on a number cube.
9. Consider the events from Questions 5 and 6—“rolling an even number” and “rolling a
number that is not even.” What do you notice about the sum of the probabilities of
these two complementary events?
10. Consider the events from Questions 7 and 8—“rolling a number greater than 4” and
“rolling a number that is not greater than 4.” What do you notice about the sum of the
probabilities of these two complementary events?
462345_C2_CH13_pp781-864.indd 787 28/08/13 12:46 PM
788 • Chapter 13 Introduction to Probability
© C
arne
gie
Lear
ning
11. What is the sum of the probabilities of any two complementary events? Explain why
your answer makes sense.
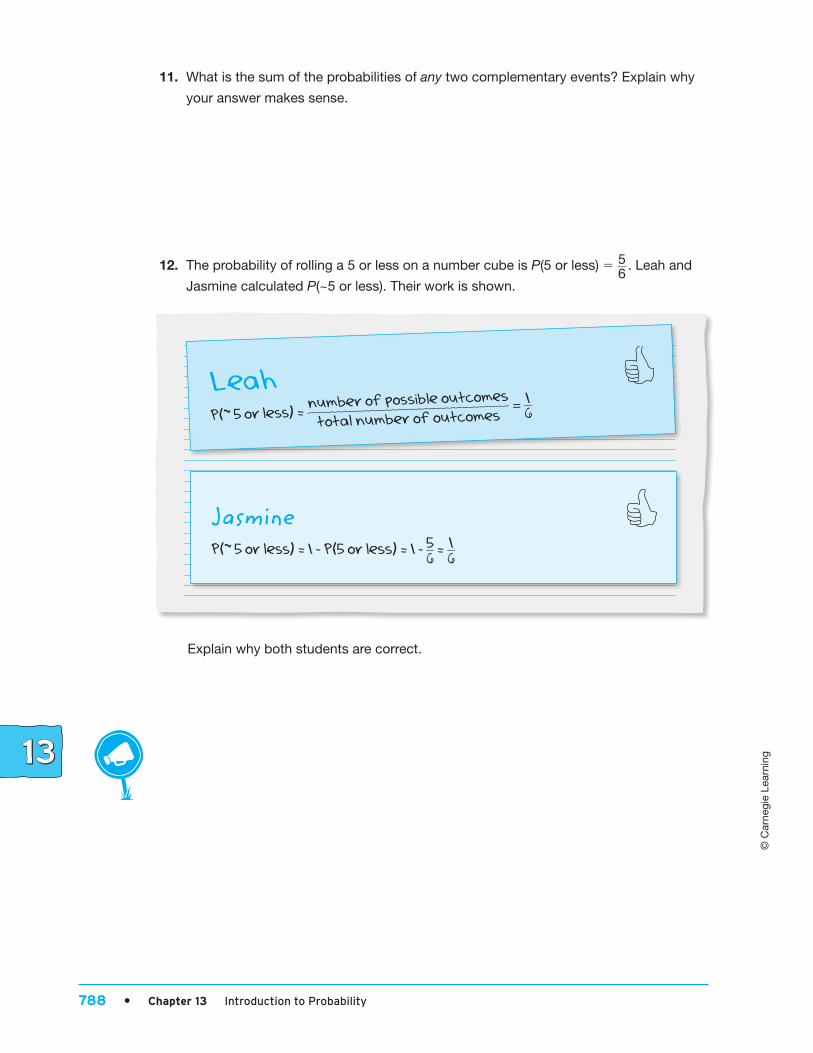
12. The probability of rolling a 5 or less on a number cube is P(5 or less) 5 5 __ 6 . Leah and
Jasmine calculated P(~5 or less). Their work is shown.
Explain why both students are correct.
LeahP(~ 5 or less) =
number of possible outcomes ______________________________
total number of outcomes = 1 __
6
JasmineP(~ 5 or less) = 1 - P(5 or less) = 1 - 5 __
6 = 1 __
6
462345_C2_CH13_pp781-864.indd 788 28/08/13 12:46 PM

© C
arne
gie
Lear
ning
13.1 Defining and Representing Probability • 789
Problem 2 Take A Spin!
Consider the spinner shown. Assume all sections are the same size. An experiment
consists of spinning the spinner one time.
X
3
5
Z
2
1
1. How many possible outcomes are there in the experiment? How did you
determine your answer?
2. List the sample space for the experiment.
3. Determine the probability that the spinner lands on a letter.
a. Describe the event.
b. Describe the possible outcomes in this event.
c. Calculate P(letter).
d. Describe the complement of this event.
e. Describe the possible outcomes of the complement of this event.
f. Calculate P(~letter).
462345_C2_CH13_pp781-864.indd 789 28/08/13 12:46 PM
790 • Chapter 13 Introduction to Probability
© C
arne
gie
Lear
ning
4. Determine the probability that the spinner lands on an odd number.
a. Describe the event.
b. Describe the possible outcomes in the event.
c. Calculate P(odd number).
d. Describe the complement of this event.
e. Describe the possible outcomes of the complement of this event.
f. Calculate P(~odd number).
5. Determine the probability that the spinner lands on a vowel.
a. Describe the event.
b. Describe the possible outcomes in the event.
c. Calculate P(vowel).
d. Describe the complement of this event.
e. Describe the possible outcomes of the complement of this event.
f. Calculate P(~vowel).
462345_C2_CH13_pp781-864.indd 790 28/08/13 12:46 PM
© C
arne
gie
Lear
ning
13.1 Defining and Representing Probability • 791
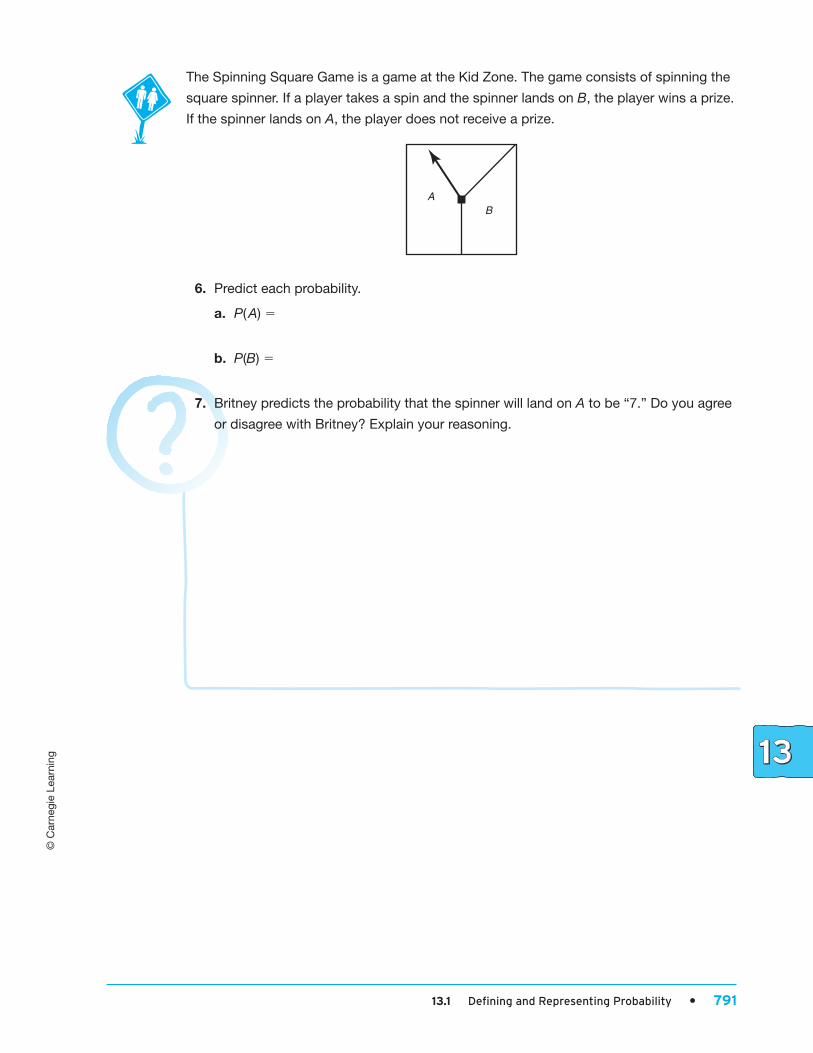
The Spinning Square Game is a game at the Kid Zone. The game consists of spinning the
square spinner. If a player takes a spin and the spinner lands on B, the player wins a prize.
If the spinner lands on A, the player does not receive a prize.
AB
6. Predict each probability.
a. P( A) 5
b. P(B) 5
7. Britney predicts the probability that the spinner will land on A to be “7.” Do you agree
or disagree with Britney? Explain your reasoning.
462345_C2_CH13_pp781-864.indd 791 28/08/13 12:46 PM
792 • Chapter 13 Introduction to Probability
© C
arne
gie
Lear
ning
Problem 3 Probabilities from 0 to 1
1. What is the greatest possible probability in any experiment? Explain your reasoning.
2. What is the least possible probability in any experiment? Explain your reasoning.
3. What is the probability of an event that is just as likely to occur as not occur?
Explain your reasoning.
The probability of an event occurring is a number between 0 and 1. If the event is certain
to happen, then the probability is 1. If an event is impossible to happen, then the
probability is 0. If an event is just as likely to happen as not happen, then the probability is
0.5, or 1 __ 2
. Probabilities can be expressed as fractions, decimals, or percents.
462345_C2_CH13_pp781-864.indd 792 28/08/13 12:46 PM

© C
arne
gie
Lear
ning
13.1 Defining and Representing Probability • 793
Complete the chart representing the different probabilities.
4.Fraction Decimal Percent
P(certain event)
P(event that is just as likely as unlikely to occur)
P(impossible event)
The number line shown represents the probabilities, from 0 to 1, of any event occurring.
0 1.0
impossible just as likely as unlikely
certain
unlikely likely
1–2
5. Estimate the probability of each event occurring. Then, place the letter corresponding
to the estimated probability of the event on the number line.
Fraction Decimal Percent
a. The next baby born at your local
hospital will be a boy.
b. It will snow in Arizona in July.
c. You will have homework tonight.
d. You will live to be over 100 years old.
462345_C2_CH13_pp781-864.indd 793 28/08/13 12:46 PM

794 • Chapter 13 Introduction to Probability
© C
arne
gie
Lear
ning
Problem 4 It’s In the Bag!
Suppose there are 2 blue, 3 green, and 5 yellow marbles in a bag. One marble will be
drawn from the bag.
1. List the sample space for the experiment.
2. Calculate each probability.
a. P(B) 5
b. P(G) 5
c. P(Y ) 5
When the probabilities of all the outcomes of an experiment are equal, then the
probabilities are called equallylikely.
3. Are the probabilities in the marble experiment equally likely? Explain your reasoning.
4. Determine the sum of all the probabilities.
P(B) 1 P(G) 1 P(Y ) 5
5. Determine the sum of the probabilities for all the outcomes of the first spinner in
Problem 2.
P(1) 1 P(2) 1 P(3) 1 P(5) 1 P(X ) 1 P(Z ) 5
6. Do you think the sum of the probabilities for all outcomes of any experiment will
always be 1? Explain your reasoning.
462345_C2_CH13_pp781-864.indd 794 28/08/13 12:46 PM
© C
arne
gie
Lear
ning
13.1 Defining and Representing Probability • 795
Talk the Talk
1. Do you think that the sum of the probabilities for all outcomes of some experiments
can be greater than 1? Explain your reasoning.
2. Write an event that has a probability of 1.
3. Write an event that has a probability of 0.
4. If P(~event X ) 5 1, what is P(event X )?
5. If P(~event Y ) 5 0, what is P(event Y )?
Be prepared to share your solutions and methods.
462345_C2_CH13_pp781-864.indd 795 28/08/13 12:46 PM

796 • Chapter 13 Introduction to Probability
© C
arne
gie
Lear
ning
462345_C2_CH13_pp781-864.indd 796 28/08/13 12:46 PM
© C
arne
gie
Lear
ning
13.2 Determining Experimental Probability • 797
Key Term experimental probability
Learning GoalsIn this lesson, you will:
Conduct trials of an experiment.
Predict the experimental probability of an event
using the results from the trials of an experiment.
Use proportional researching to predict the
probability of random events.
Toss the CupDetermining Experimental Probability
You are due for a win! Your luck will run out soon!
Have you ever heard someone say something like this about a game of chance?
People—especially people who don’t know a lot about probability—are sometimes
fooled into thinking that after a long series of losses or a long series of wins that
the next turn will produce different results.
Why is this thinking incorrect?
462345_C2_CH13_pp781-864.indd 797 28/08/13 12:46 PM
798 • Chapter 13 Introduction to Probability
© C
arne
gie
Lear
ning
Problem 1 It’s Time for the Cup Toss
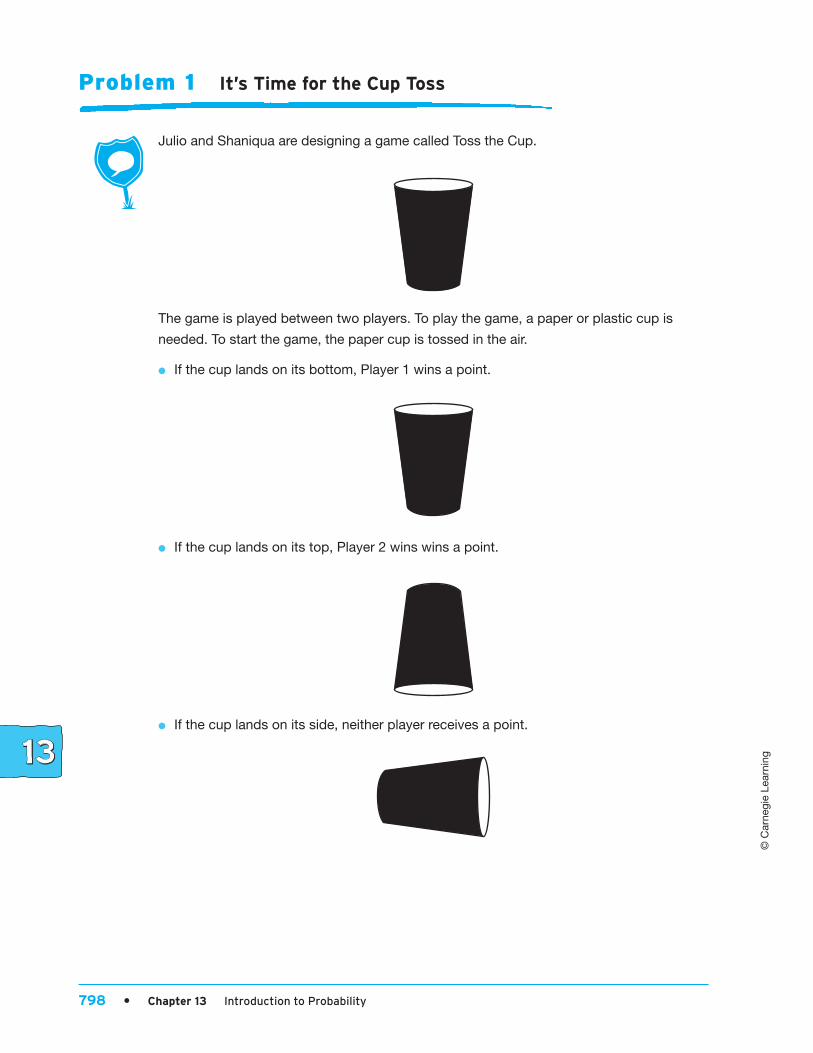
Julio and Shaniqua are designing a game called Toss the Cup.
The game is played between two players. To play the game, a paper or plastic cup is
needed. To start the game, the paper cup is tossed in the air.
● If the cup lands on its bottom, Player 1 wins a point.
● If the cup lands on its top, Player 2 wins wins a point.
● If the cup lands on its side, neither player receives a point.
462345_C2_CH13_pp781-864.indd 798 28/08/13 12:46 PM
© C
arne
gie
Lear
ning
13.2 Determining Experimental Probability • 799
1. Predict the probability for each position the cup can land.
2. List the sample space for the game.
3. Can you use the sample space to determine the probability that the cup lands on its
top, bottom, or side? Explain why or why not.
4. Do you think all the outcomes are equally likely? Explain your reasoning.
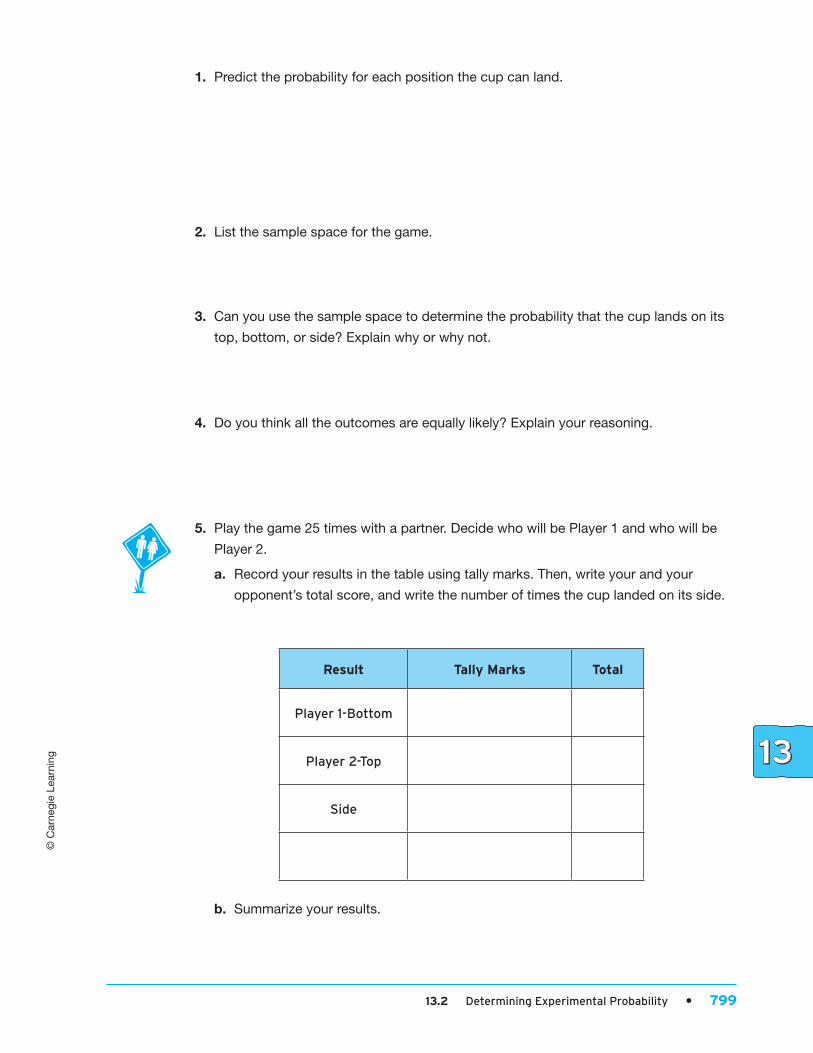
5. Play the game 25 times with a partner. Decide who will be Player 1 and who will be
Player 2.
a. Record your results in the table using tally marks. Then, write your and your
opponent’s total score, and write the number of times the cup landed on its side.
Result Tally Marks Total
Player 1-Bottom
Player 2-Top
Side
b. Summarize your results.
462345_C2_CH13_pp781-864.indd 799 28/08/13 12:46 PM
© C
arne
gie
Lear
ning
800 • Chapter 13 Introduction to Probability
Experimentalprobability is the ratio of the number of times an event occurs to the total
number of trials performed.
Experimental Probability 5 number of times the event occurs _______________________________ total number of trials performed
6. What is the experimental probability of the cup landing:
a. on its bottom?
b. on its top?
c. on its side?
7. Do you think this is a fair game to play? Why or why not?
8. When you toss a six-sided number cube, the probability of it landing on any of the
numbers from 1 through 6 is 1 __ 6 . Is it possible to determine the exact probability of the
cup landing on its top, bottom, or side? Explain your reasoning.
462345_C2_CH13_pp781-864.indd 800 28/08/13 12:46 PM
© C
arne
gie
Lear
ning
13.2 Determining Experimental Probability • 801
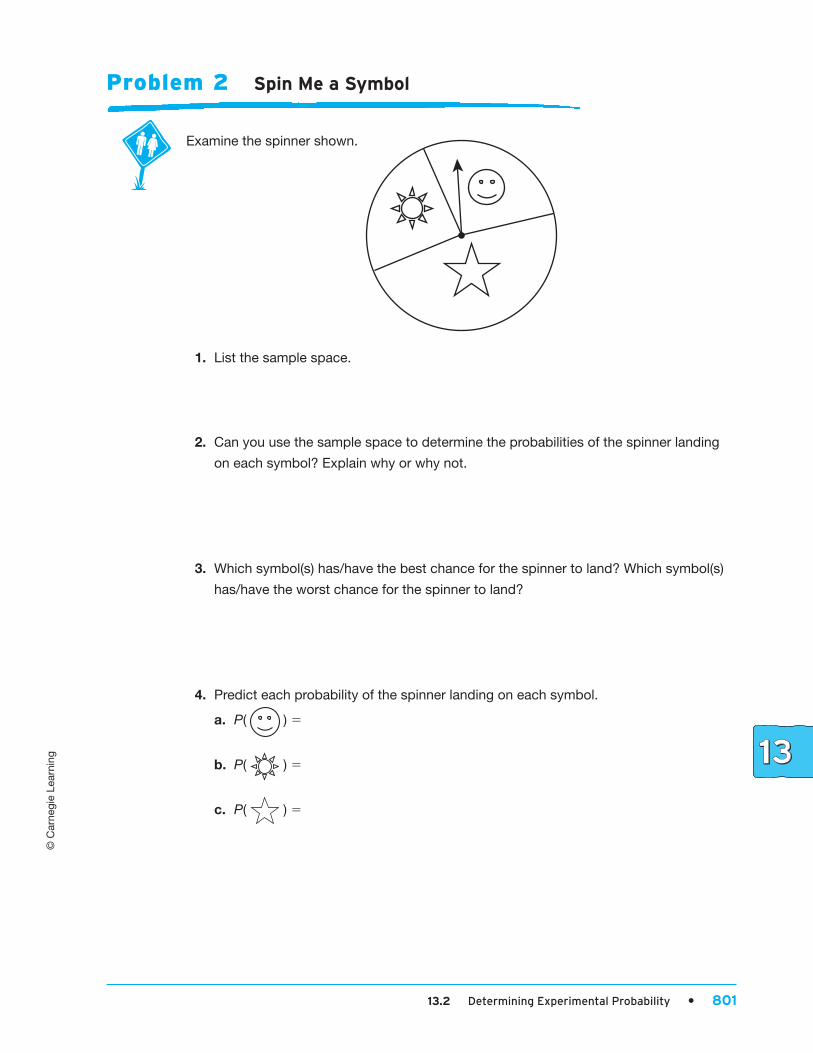
Problem 2 Spin Me a Symbol
Examine the spinner shown.
1. List the sample space.
2. Can you use the sample space to determine the probabilities of the spinner landing
on each symbol? Explain why or why not.
3. Which symbol(s) has/have the best chance for the spinner to land? Which symbol(s)
has/have the worst chance for the spinner to land?
4. Predict each probability of the spinner landing on each symbol.
a. P( ) 5
b. P( ) 5
c. P( ) 5
462345_C2_CH13_pp781-864.indd 801 28/08/13 12:46 PM
802 • Chapter 13 Introduction to Probability
© C
arne
gie
Lear
ning
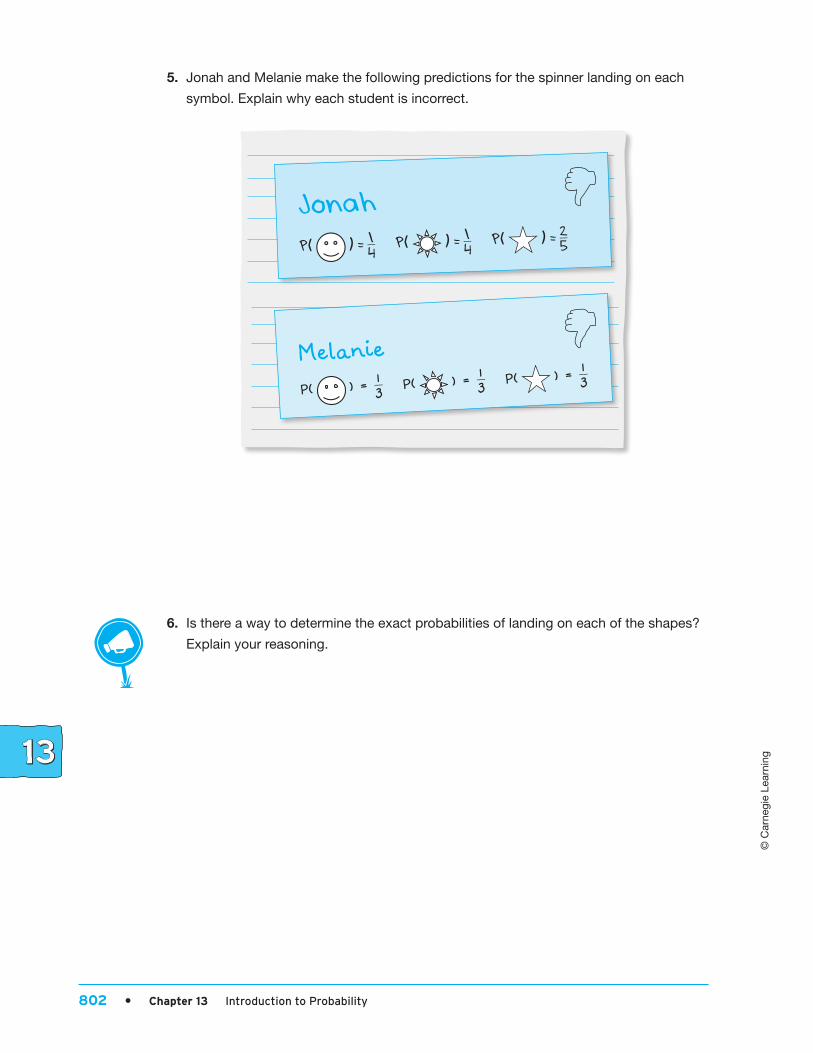
5. Jonah and Melanie make the following predictions for the spinner landing on each
symbol. Explain why each student is incorrect.
Jonah
P( ) = 1 __ 4 P( ) = 1 __
4 P( ) = 2 __
5
Melanie
P( ) = 1 __ 3 P( ) = 1 __ 3
P( ) = 1 __ 3
6. Is there a way to determine the exact probabilities of landing on each of the shapes?
Explain your reasoning.
462345_C2_CH13_pp781-864.indd 802 28/08/13 12:46 PM

© C
arne
gie
Lear
ning
13.2 Determining Experimental Probability • 803
Let’s determine the experimental probability of the spinner landing on each of the
symbols. Use a paper clip as the arrow part of the spinner. Place a pencil point through
the paper clip, and then on the center of the circle. Working with a partner, one person will
spin the spinner and the other person will record the result of each spin.
7. Spin the spinner 50 times and record the data using tally marks. Then, complete
the table.
Shape Tally Total Probability
8. Calculate the experimental probabilities using your data.
a. P( ) 5
b. P( ) 5
c. P( ) 5
9. Compare the experimental probabilities with your predictions from Question 2.
What do you notice? Why did this happen?
462345_C2_CH13_pp781-864.indd 803 28/08/13 12:46 PM
804 • Chapter 13 Introduction to Probability
© C
arne
gie
Lear
ning
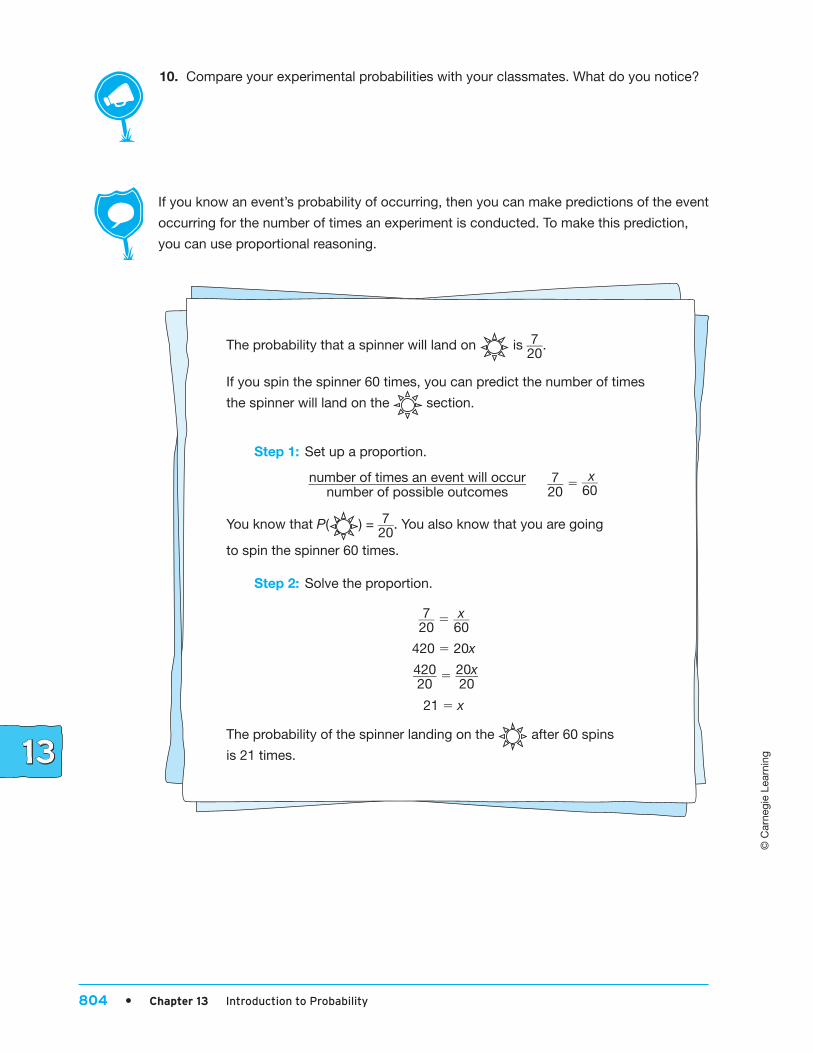
10. Compare your experimental probabilities with your classmates. What do you notice?
If you know an event’s probability of occurring, then you can make predictions of the event
occurring for the number of times an experiment is conducted. To make this prediction,
you can use proportional reasoning.
The probability that a spinner will land on is 7 ___ 20
.
If you spin the spinner 60 times, you can predict the number of times
the spinner will land on the section.
Step1: Set up a proportion.
number of times an event will occur ________________________________ number of possible outcomes
7 ___ 20
5 x ___ 60
You know that P( ) = 7 ___ 20
. You also know that you are going
to spin the spinner 60 times.
Step2: Solve the proportion.
7 ___ 20
5 x ___ 60
420 5 20x
420 ____ 20
5 20x ____ 20
21 5 x
The probability of the spinner landing on the after 60 spins
is 21 times.
462345_C2_CH13_pp781-864.indd 804 28/08/13 12:46 PM
© C
arne
gie
Lear
ning
13.2 Determining Experimental Probability • 805
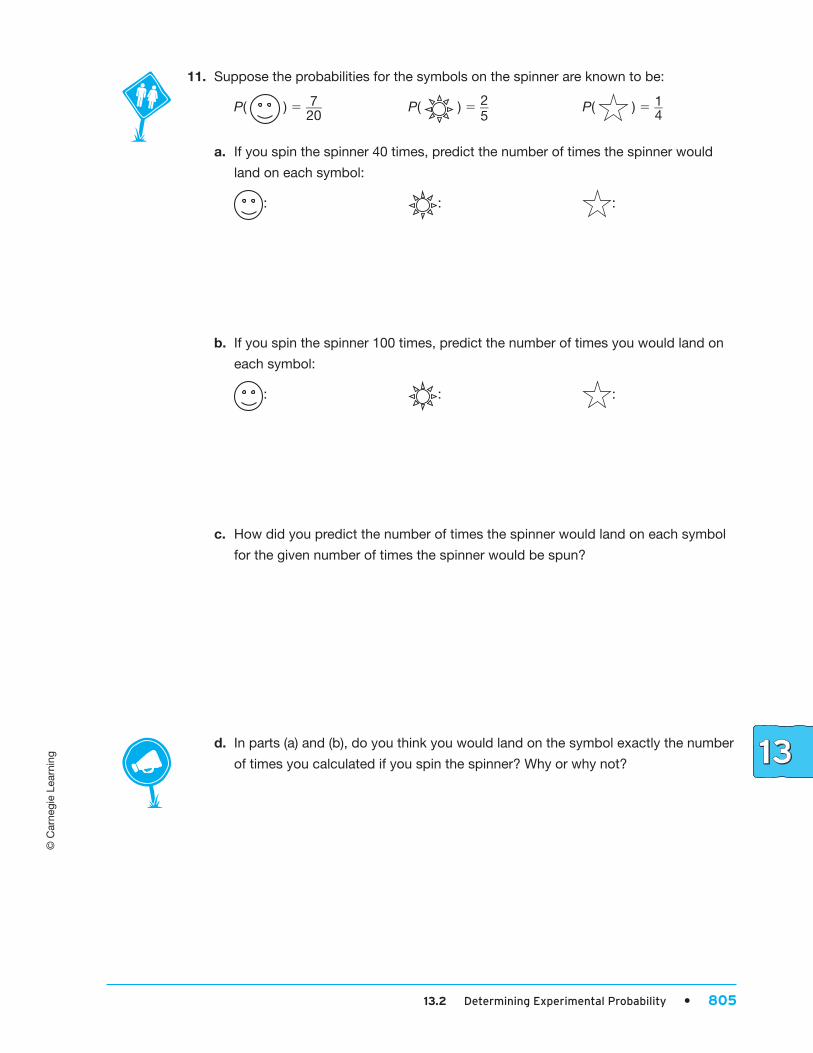
11. Suppose the probabilities for the symbols on the spinner are known to be:
P( ) 5 7 ___ 20
P( ) 5 2 __ 5
P( ) 5 1 __ 4
a. If you spin the spinner 40 times, predict the number of times the spinner would
land on each symbol:
: : :
b. If you spin the spinner 100 times, predict the number of times you would land on
each symbol:
: : :
c. How did you predict the number of times the spinner would land on each symbol
for the given number of times the spinner would be spun?
d. In parts (a) and (b), do you think you would land on the symbol exactly the number
of times you calculated if you spin the spinner? Why or why not?
462345_C2_CH13_pp781-864.indd 805 28/08/13 12:46 PM

© C
arne
gie
Lear
ning
806 • Chapter 13 Introduction to Probability
Problem 3 Even I Win, Odd You Win...
Joel and Hiram are playing a game using 2 six-sided number cubes. The number cubes
are rolled, and the sum of the 2 numbers shown is calculated. If the sum is even, Joel
wins a point. If the sum is odd, Hiram wins a point.
1. List the sample space for the possible sums in the game.
2. Do you think each of the outcomes is equally likely?
Explain your reasoning.
3. Who do you think has a better chance of winning this game?
Explain your reasoning.
Time to make your predictions.
462345_C2_CH13_pp781-864.indd 806 28/08/13 12:46 PM
© C
arne
gie
Lear
ning
13.2 Determining Experimental Probability • 807
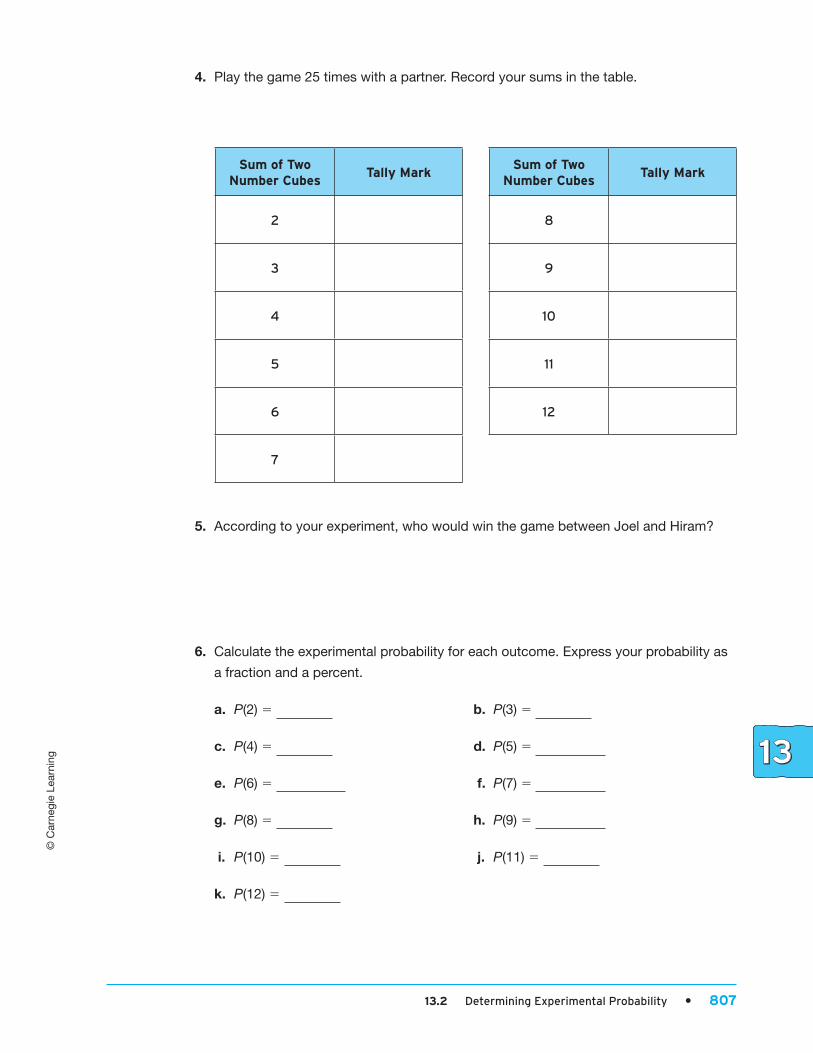
4. Play the game 25 times with a partner. Record your sums in the table.
Sum of Two Number Cubes
Tally MarkSum of Two
Number CubesTally Mark
2 8
3 9
4 10
5 11
6 12
7
5. According to your experiment, who would win the game between Joel and Hiram?
6. Calculate the experimental probability for each outcome. Express your probability as
a fraction and a percent.
a. P(2) 5 b. P(3) 5
c. P(4) 5 d. P(5) 5
e. P(6) 5 f. P(7) 5
g. P(8) 5 h. P(9) 5
i. P(10) 5 j. P(11) 5
k. P(12) 5
462345_C2_CH13_pp781-864.indd 807 28/08/13 12:46 PM
808 • Chapter 13 Introduction to Probability
© C
arne
gie
Lear
ning
7. How might you calculate the actual probability for each outcome?
8. Make a list of all of the possible outcomes when
rolling 2 six-sided number cubes.
9. How many different possibilities are there when rolling 2 six-sided number cubes?
10. Does the experimental probability of the game seem to match your prediction of the
winner? Explain your reasoning.
11. Do you think that each number that can be rolled with two number cubes have an
equally likely chance of occurring? Do you think it can affect the result of the game?
Be prepared to share your solutions and methods.
How can you organize your list to make sure you get all
the possibilities?
462345_C2_CH13_pp781-864.indd 808 28/08/13 12:46 PM
© C
arne
gie
Lear
ning
13.3 Determining Theoretical Probability • 809
Key Term theoretical probability
Learning GoalsIn this lesson, you will:
Calculate the experimental and theoretical probability
of an experiment.
Determine the difference between experimental and
theoretical probability.
Use proportional reasoning to predict probability of
random events.
Double Your FunDetermining Theoretical Probability
There are three doors. Behind one of the doors is a prize. Behind the other two
doors are donkeys. You choose one door. The game show host opens one of the
doors that you did not choose to reveal a donkey. Then, the host asks you if you
would like to stay on the door you chose or switch to the other unopened door.
Should you stay or switch? Or does it matter?
This famous probability problem is known as the Monty Hall problem—named after
the host of the game show Let’s Make a Deal, which featured this problem.
Surprisingly, the answer is that you should switch! When you switch you have a 2 __ 3
chance of getting the prize. If you stay, you have only a 1 __ 3
chance.
Can you figure out why you should switch every time? What if you had 100 doors
to choose from and after you made your choice, the game show host opened
98 doors to reveal 98 donkeys?
462345_C2_CH13_pp781-864.indd 809 28/08/13 12:46 PM
810 • Chapter 13 Introduction to Probability
© C
arne
gie
Lear
ning
Problem 1 Double Your Fun—Again!
Previously, Joel and Hiram were playing a game using 2 six-sided number cubes. The
number cubes were rolled, and the sum of the 2 numbers shown was calculated. If the
sum was even, Joel won a point. If the sum was odd, Hiram won a point. The experimental
probability (the ratio of the number of times an event occurs to the total number of trials
performed) was then calculated.
When you calculate the actual probability of an event before performing the experiment,
you are determining the theoretical probability. Theoreticalprobability is the
mathematical calculation that an event will happen in theory. The formula for theoretical
probability is the ratio of the number of desired outcomes to the total number of possible
outcomes, or the sample space.
Theoretical Probability 5 number of desired outcomes ________________________________ total number of possible outcomes
1. List the sample space for the game played by Joel and Hiram.
In the previous experiment of rolling 2 six-sided number cubes, each of the outcomes in
the sample space is not equally likely. One method to determine the probabilities of the
outcomes is to make a list of all the possibilities.
For example, (1, 1) could represent rolling a 1 on the first number cube and a 1 on the
second number cube. Another example, (1, 2) could represent rolling a 1 on the first
number cube and a 2 on the second number cube.
The list shown lists all the possibilities when rolling 2 six-sided number cubes.
(1, 1), (1, 2), (1, 3), (1, 4), (1, 5), (1, 6),
(2, 1), (2, 2), (2, 3), (2, 4), (2, 5), (2, 6),
(3, 1), (3, 2), (3, 3), (3, 4), (3, 5), (3, 6),
(4, 1), (4, 2), (4, 3), (4, 4), (4, 5), (4, 6),
(5, 1), (5, 2), (5, 3), (5, 4), (5, 5), (5, 6),
(6, 1), (6, 2), (6, 3), (6, 4), (6, 5), (6, 6)
2. How many different possibilities are there when rolling 2 six-sided number cubes?
462345_C2_CH13_pp781-864.indd 810 28/08/13 12:46 PM
© C
arne
gie
Lear
ning
13.3 Determining Theoretical Probability • 811
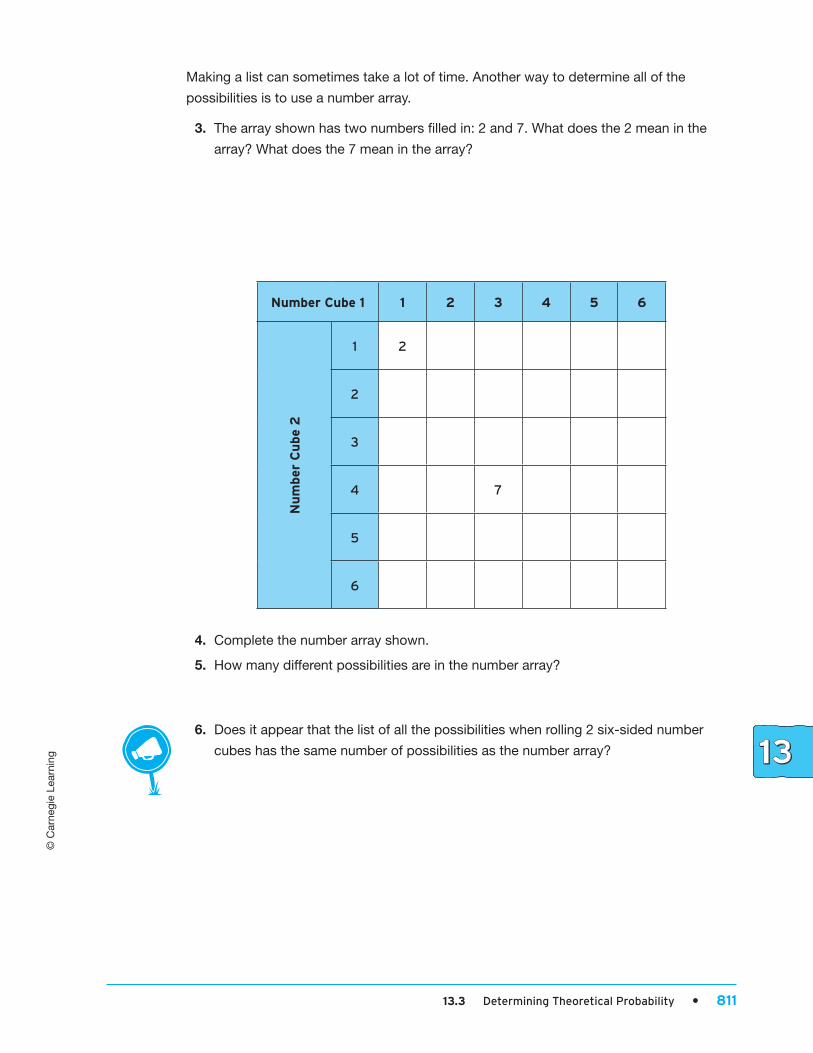
Making a list can sometimes take a lot of time. Another way to determine all of the
possibilities is to use a number array.
3. The array shown has two numbers filled in: 2 and 7. What does the 2 mean in the
array? What does the 7 mean in the array?
Number Cube 1 1 2 3 4 5 6N
um
ber
Cu
be
2
1 2
2
3
4 7
5
6
4. Complete the number array shown.
5. How many different possibilities are in the number array?
6. Does it appear that the list of all the possibilities when rolling 2 six-sided number
cubes has the same number of possibilities as the number array?
462345_C2_CH13_pp781-864.indd 811 28/08/13 12:46 PM
© C
arne
gie
Lear
ning
812 • Chapter 13 Introduction to Probability
7. Using the number array, determine the number of times each sum appears.
a. sum of 2 b. sum of 3
c. sum of 4 d. sum of 5
e. sum of 6 f. sum of 7
g. sum of 8 h. sum of 9
i. sum of 10 j. sum of 11
k. sum of 12
8. Calculate the theoretical probabilities for each sum.
a. P(2) 5 b. P(3) 5
c. P(4) 5 d. P(5) 5
e. P(6) 5 f. P(7) 5
g. P(8) 5 h. P(9) 5
i. P(10) 5 j. P(11) 5
k. P(12) 5
9. Is there an equally likely chance for each number to result from rolling 2 six-sided
number cubes according to the theoretical probabilities?
10. According to the theoretical probabilities, who should win the game?
Explain your reasoning.
462345_C2_CH13_pp781-864.indd 812 28/08/13 12:46 PM
© C
arne
gie
Lear
ning
11. Did the experimental probability of your experiment in the previous lesson match the
theoretical probability of the game? If not, why do you think the results of the
experimental and theoretical probabilities were different?
12. Calculate each probability when rolling 2 six-sided number cubes using your
number array. Explain your calculations.
a. P(same number shows on each number cube)
b. P(sum of the roll is a prime number)
c. P(sum of the roll is greater than 7)
d. P(sum of the roll is 1)
13. If the number cubes are tossed 180 times, how
many times do you predict the following sums
would occur?
a. 1 b. 4 c. 9
Remember, when you
know an event's probability of occurring, use proportional
reasoning to help you predict how often the event may occur for
the number of trials the experiment is conducted!
13.3 Determining Theoretical Probability • 813
462345_C2_CH13_pp781-864.indd 813 28/08/13 12:46 PM
© C
arne
gie
Lear
ning
814 • Chapter 13 Introduction to Probability
d. 10 e. 12 f. prime number
14. Kelsey claims that getting a sum of 4 when rolling two number cubes should be 1 out
of 11 since there are 11 possible outcomes. Do you agree with Kelsey’s claim? If not,
how could you convince Kelsey that her thinking is incorrect?
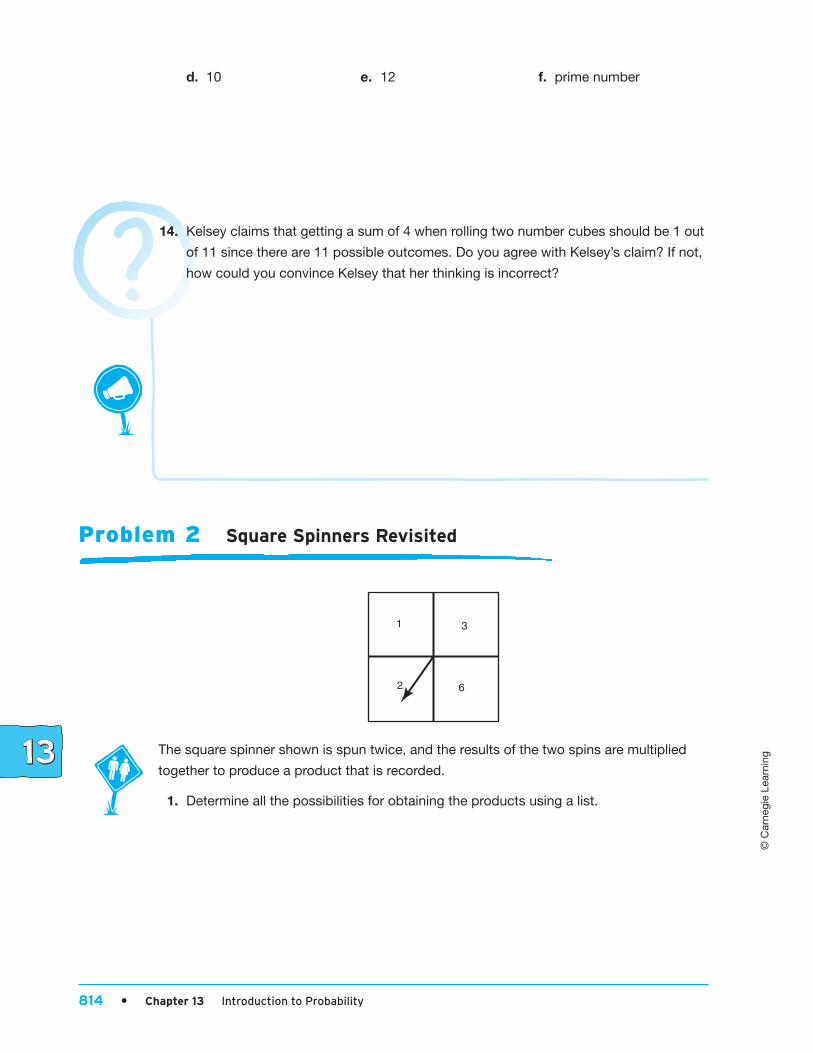
Problem 2 Square Spinners Revisited
1 3
2 6
The square spinner shown is spun twice, and the results of the two spins are multiplied
together to produce a product that is recorded.
1. Determine all the possibilities for obtaining the products using a list.
462345_C2_CH13_pp781-864.indd 814 28/08/13 12:46 PM
© C
arne
gie
Lear
ning
13.3 Determining Theoretical Probability • 815
2. List the sample space.
3. Are all outcomes equally likely? Explain your calculations.
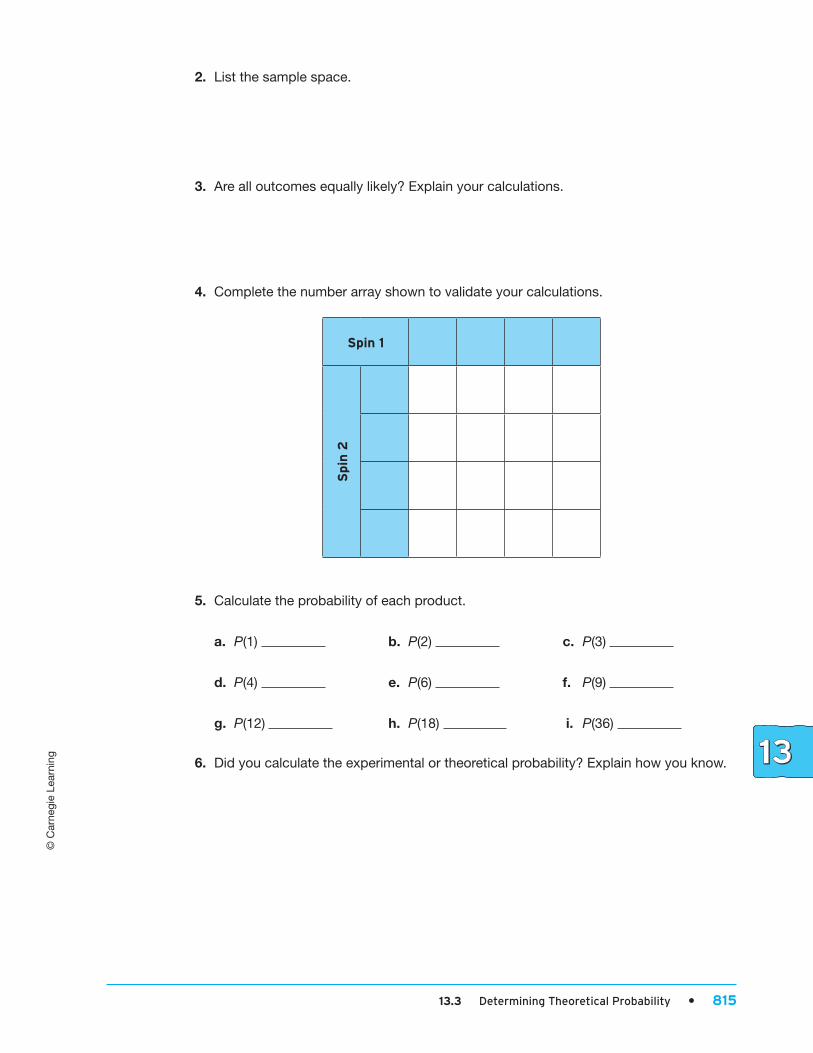
4. Complete the number array shown to validate your calculations.
Spin 1S
pin
2
5. Calculate the probability of each product.
a. P(1) b. P(2) c. P(3)
d. P(4) e. P(6) f. P(9)
g. P(12) h. P(18) i. P(36)
6. Did you calculate the experimental or theoretical probability? Explain how you know.
462345_C2_CH13_pp781-864.indd 815 28/08/13 12:46 PM

© C
arne
gie
Lear
ning
816 • Chapter 13 Introduction to Probability
7. Calculate each probability shown for the square spinner.
a. P(spin results in an even product)
b. P(spin results in an odd product)
c. P(spin results in a multiple of 3)
d. P(spin results in a perfect square)
e. P(spin results in a product is less than 50)
8. If the spinner is spun 200 times, how many times do you predict you would get
each product:
a. 2 b. 3
c. 6 d. 36
Remember, a perfect square
is the product of a factor multiplied by
itself!
462345_C2_CH13_pp781-864.indd 816 28/08/13 12:46 PM
© C
arne
gie
Lear
ning
13.3 Determining Theoretical Probability • 817
e. an even product f. an odd product
Talk the Talk
1. Explain the difference between experimental and theoretical probability.
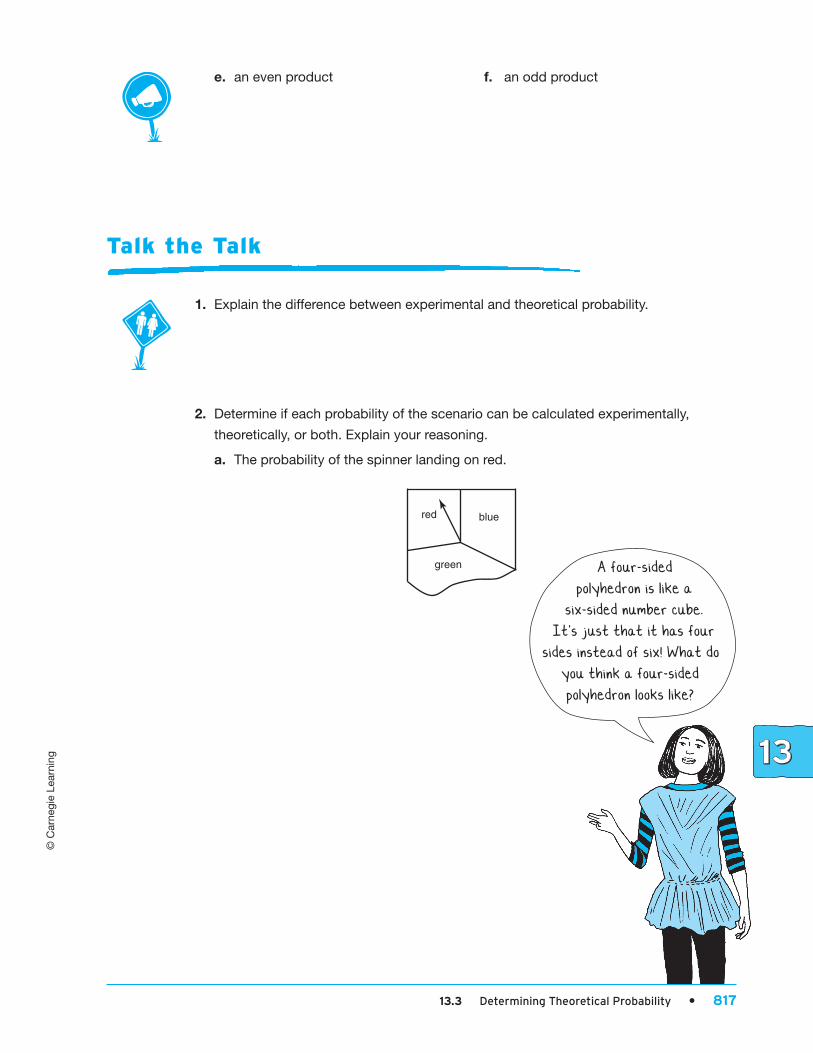
2. Determine if each probability of the scenario can be calculated experimentally,
theoretically, or both. Explain your reasoning.
a. The probability of the spinner landing on red.
red blue
green A four-sided polyhedron is like a
six-sided number cube. It's just that it has four
sides instead of six! What do you think a four-sided polyhedron looks like?
462345_C2_CH13_pp781-864.indd 817 28/08/13 12:47 PM

818 • Chapter 13 Introduction to Probability
© C
arne
gie
Lear
ning
b. P(sum of 4) when a four-sided number polyhedron with numbers 1 through 4 is
rolled twice.
c. Probability a particular medicine will cure a disease.
d. Probability a bridge will collapse given the bridge’s dimensions and appropriate
mathematical formulas.
Be prepared to share your solutions and methods.
462345_C2_CH13_pp781-864.indd 818 28/08/13 12:47 PM
© C
arne
gie
Lear
ning
13.4 Simulating Experiments • 819
Are you an honest person? Do you have integrity? Do you do what is right even
though there may not be laws telling you to do so? If yes, you may be described as
having probity. Talking about a person’s probity can be a way to gauge how
reliable their testimony may be in court.
Did you know that the word “probability” comes from the word “probity”? How are
these terms related? What are the similarities and differences in their meanings?
Key Terms simulation
trial
Learning GoalsIn this lesson, you will:
Conduct trials using a simulation to determine probability.
Conduct a large number of trials to demonstrate that
experimental probability approaches theoretical probability.
A Toss of a CoinSimulating Experiments
462345_C2_CH13_pp781-864.indd 819 28/08/13 12:47 PM

820 • Chapter 13 Introduction to Probability
© C
arne
gie
Lear
ning
Problem 1 Simulating Births of Girls and Boys
What percent of babies born at a hospital are girls? One way to answer the question is
to perform a simulation. A simulation is an experiment that models a real-life situation.
When conducting a simulation, you must choose a model that has the same probability of
the event.
1. What model might be appropriate for doing a simulation?
2. Describe the sample space for this situation.
3. What is the event you are trying to determine?
4. Suppose the probability of a family having a girl is 1 __ 2 .
What percent of babies born at a hospital would you expect to be girls?
Let’s use the toss of a coin as the model. Heads will represent the birth of a girl, and tails
will represent the birth of a boy.
5. If you toss a coin twice, list all the possible outcomes from this simulation.
6. Toss your coin 2 times.
a. How many of the coin tosses resulted in heads?
b. According to your simulation, what is the experimental probability of a baby girl
being born?
462345_C2_CH13_pp781-864.indd 820 28/08/13 12:47 PM
© C
arne
gie
Lear
ning
13.4 Simulating Experiments • 821
c. Share your results with your classmates. Then, create a dot plot of all the
experimental probabilities from your and your classmates’ simulations. Did everyone
end up with the same results of the theoretical probability of a girl being born?
0 11–4
1–2
3–4
Probability
7. Toss your coin 4 times.
a. How many of the coin tosses resulted in heads?
b. According to your simulation, what is the experimental probability of a baby girl
being born?
c. Share your results with your classmates. Then, create a dot plot of all the
experimental probabilities from your and your classmates’ simulations. How do
these results compare to the results from Question 6?
Probability
0 11–4
1–2
3–4
462345_C2_CH13_pp781-864.indd 821 28/08/13 12:47 PM
822 • Chapter 13 Introduction to Probability
© C
arne
gie
Lear
ning
8. Toss your coin 8 times.
a. How many of the coin tosses resulted in heads?
b. According to your simulation, what is the experimental probability of a baby girl
being born?
c. Share your results with your classmates. Then, create a dot plot of all the
experimental probabilities from your and your classmates’ simulations. How do
these results compare to the results from Questions 6 and 7?
Probability
0 11–4
3–4
1–2
18
38
58
78
Each time you repeat an experiment or simulation, it is called a trial.
9. Conduct 50 trials of the simulation. Record the results in the table using tally marks.
Result Tally TotalPercent
(total/50)
Heads
Tails
462345_C2_CH13_pp781-864.indd 822 28/08/13 12:47 PM
© C
arne
gie
Lear
ning
13.4 Simulating Experiments • 823
10. Share your results with your classmates. Then, create a dot plot of all the
probabilities. What do you notice?
Probability
0 11–4
1–2
3–4
11. What can you conclude about the experimental probability of an event and its
theoretical probability as the number of trials of the simulation increase?
You have demonstrated that the experimental probability of an event approaches the
theoretical probability when the number of trials becomes greater. This fact is very useful
in determining the probability of an event for which the experimental probability is difficult,
or impossible, to calculate.
462345_C2_CH13_pp781-864.indd 823 28/08/13 12:47 PM

824 • Chapter 13 Introduction to Probability
© C
arne
gie
Lear
ning
Problem 2 Test Guessing
Mr. Garcia, your history teacher, is giving a five-question multiple-choice test. Each
question has 4 possible answers. How many questions can you
expect to get correct simply by guessing?
1. Estimate the number of questions you expect to
get correct by guessing.
One model that you could use to simulate this problem
situation is a spinner divided into
4 sections that are the same size.
incorrect
incorrect incorrect
correct
2. According to the spinner shown, what is the probability of
correctly guessing the answer to one question?
3. Describe one trial of the experiment if you want to simulate
guessing on every question of the test.
4. Will one trial provide a good estimate of how many questions you should expect to
get correct? Explain your reasoning.
Of course, if you know the answer, you
don't have to guess. This is just an experiment and you
should probably study so that you don't have
to guess!
462345_C2_CH13_pp781-864.indd 824 28/08/13 12:47 PM
© C
arne
gie
Lear
ning
13.4 Simulating Experiments • 825
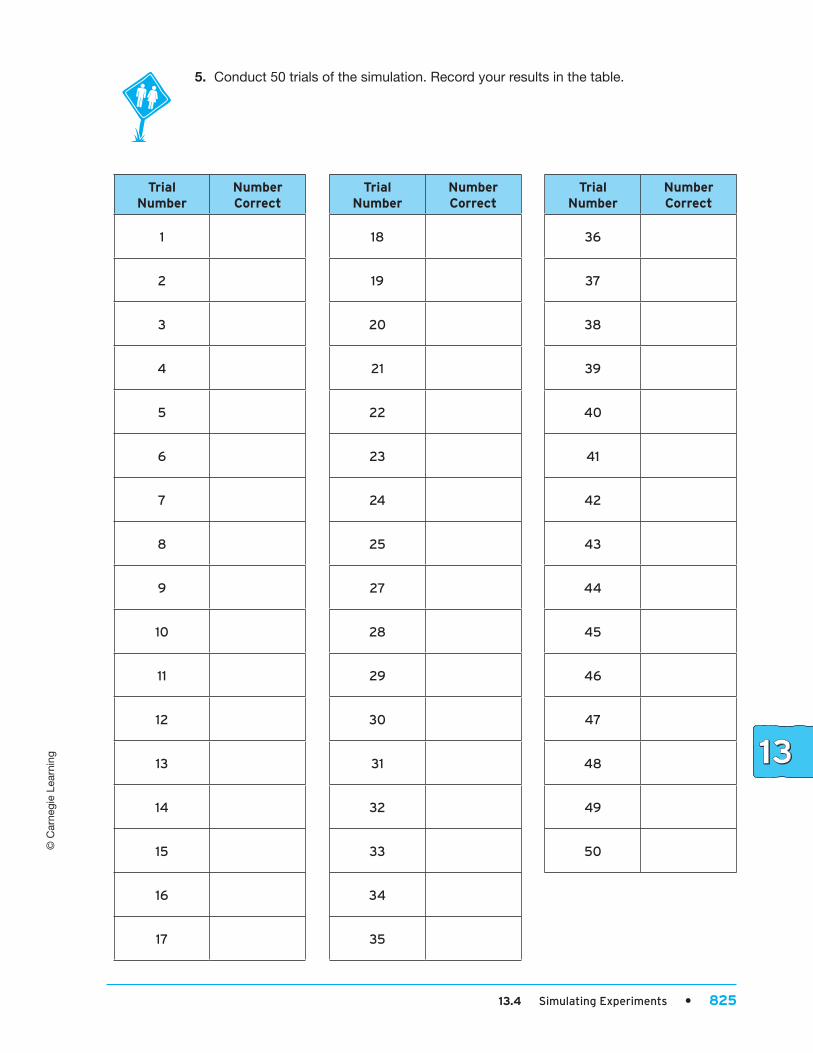
5. Conduct 50 trials of the simulation. Record your results in the table.
Trial Number
Number Correct
Trial Number
Number Correct
Trial Number
Number Correct
1 18 36
2 19 37
3 20 38
4 21 39
5 22 40
6 23 41
7 24 42
8 25 43
9 27 44
10 28 45
11 29 46
12 30 47
13 31 48
14 32 49
15 33 50
16 34
17 35
462345_C2_CH13_pp781-864.indd 825 28/08/13 12:47 PM
826 • Chapter 13 Introduction to Probability
© C
arne
gie
Lear
ning
6. Graph your results on the dot plot.
0 1 2 3 4 5
Number Correct
7. According to your simulation, about how many questions would you expect to get
correct on the test by only guessing?
8. Do you think purely guessing on a five question multiple-choice test will result in a
good grade on the test?
462345_C2_CH13_pp781-864.indd 826 28/08/13 12:47 PM
© C
arne
gie
Lear
ning
13.4 Simulating Experiments • 827
Talk the Talk
Describe a simulation to model each situation, and then describe one trial. Conduct the
simulation and answer the question.
1. How many questions would you get correct on a 10-question true/false test simply
by guessing?
Simulation:
Trial:
Conduct the simulation one time:
2. The game of MATHO requires you to roll a 6 on a number cube before you can begin
playing. How many times would you expect to roll the cube before you can begin
the game?
Simulation:
Trial:
Conduct the simulation 10 times and calculate the mean of your answers:
462345_C2_CH13_pp781-864.indd 827 28/08/13 12:47 PM
828 • Chapter 13 Introduction to Probability
© C
arne
gie
Lear
ning
3. Stefan claims he can read your mind. He gives you four cards: a red 1, a blue 2, a
blue 3, and a red 4. You draw one of the cards and look at it without showing Stefan.
a. If you ask Stefan to guess the color, what percent of the time could he
guess correctly?
Simulation:
Trial:
Conduct the simulation 10 times and count the number of times your card is
selected:
b. If you ask Stefan to guess the number, what percent of the time should he
guess correctly?
Simulation:
Trial:
Conduct the simulation 10 times and count the number of times your card is
selected:
Be prepared to share your solutions and methods.
462345_C2_CH13_pp781-864.indd 828 28/08/13 12:47 PM
© C
arne
gie
Lear
ning
13.5 Using Technology for Simulations • 829
Key Term spreadsheet
Learning GoalIn this lesson, you will:
Use technology to simulate a large number of trials of
an experiment.
Roll the Cubes AgainUsing Technology for Simulations
There are many different kinds of programs that generate what you might call
“random numbers.” But how can these programs do this? In order to generate
random numbers, some kind of code is needed to tell the computer what to
produce. But if a code exists, then the numbers can’t truly be random. In fact,
most programs generate what are called “pseudo-random numbers.” These are
numbers that are not random at all, but are generated to appear random. Only in
2010 was a program developed to produce truly random numbers. How is
randomness important in probability?
462345_C2_CH13_pp781-864.indd 829 28/08/13 12:47 PM
830 • Chapter 13 Introduction to Probability
© C
arne
gie
Lear
ning
Problem 1 Need Random Numbers? Spreadsheets Can Help!
Recall Joel and Hiram were playing a game using 2 six-sided number cubes. The two
number cubes were rolled and the sum of the two numbers was calculated.
1. Suppose you ran a simulation of this game as an experiment. How many times should
you run the simulation to get a good idea of the probabilities of each sum?
One way to simulate the experiment is to actually roll the number cubes. Another way to
simulate the experiment is to use a spreadsheet. A spreadsheet is a computer document
that allows you to organize information in rows and columns. Computer spreadsheets
typically have a number of tools such as mathematical formulas and functions that make it
easy to simulate experiments and analyze information.
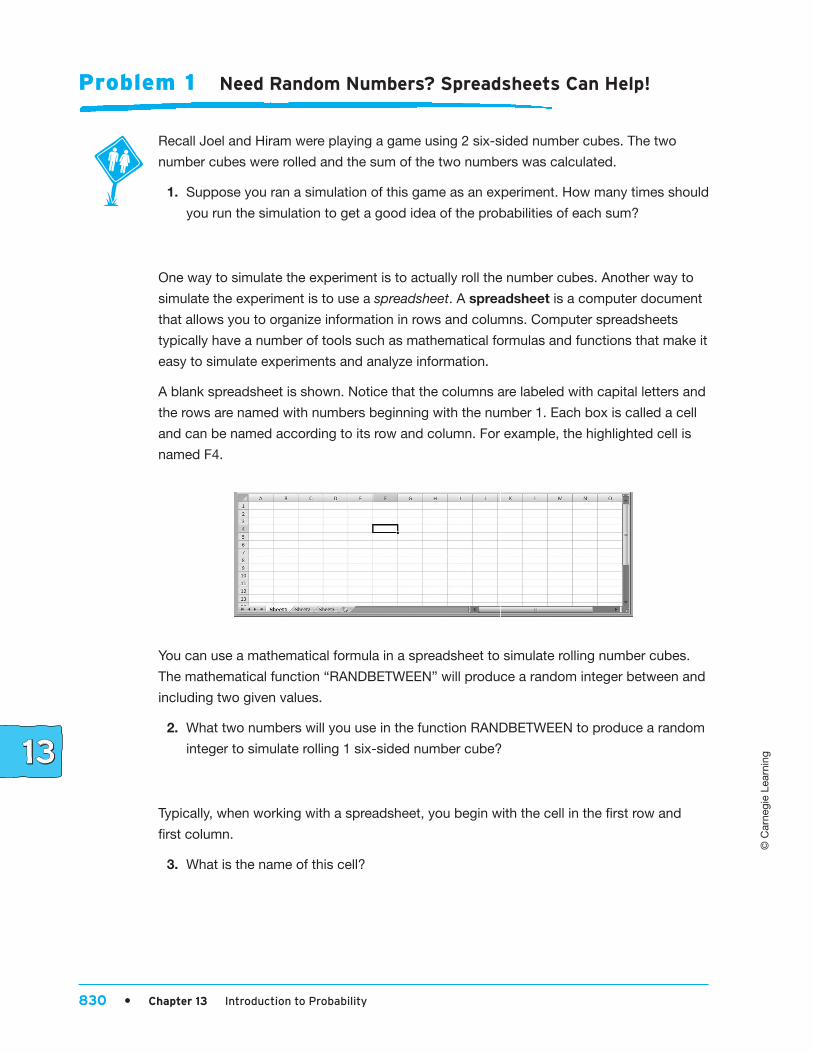
A blank spreadsheet is shown. Notice that the columns are labeled with capital letters and
the rows are named with numbers beginning with the number 1. Each box is called a cell
and can be named according to its row and column. For example, the highlighted cell is
named F4.
You can use a mathematical formula in a spreadsheet to simulate rolling number cubes.
The mathematical function “RANDBETWEEN” will produce a random integer between and
including two given values.
2. What two numbers will you use in the function RANDBETWEEN to produce a random
integer to simulate rolling 1 six-sided number cube?
Typically, when working with a spreadsheet, you begin with the cell in the first row and
first column.
3. What is the name of this cell?
462345_C2_CH13_pp781-864.indd 830 28/08/13 12:47 PM

© C
arne
gie
Lear
ning
13.5 Using Technology for Simulations • 831
Select a cell by clicking inside of it.
You always enter a formula in a spreadsheet by beginning with an “5” so that the program
knows it is a formula and not just a word or a number.
Formulas are entered in the function area.
4. Enter the formula 5RANDBETWEEN(1, 6) in the function area.
5. Press ENTER . What do you notice?
If you want to simulate rolling the number cube 10 times, you can type the formula in
10 cells, or use the “Fill” function. The “Fill” function pastes the same formula in all of the
cells you select.
The “Fill” function is indicated by a down arrow next to the word “Fill” on the upper right
side of the spreadsheet. Select cells A1 through A10. Then, click on the arrow next
to “Fill” and select “Down.”
6. What do you notice?
462345_C2_CH13_pp781-864.indd 831 28/08/13 12:47 PM
832 • Chapter 13 Introduction to Probability
© C
arne
gie
Lear
ning
Now let’s simulate the game Joel and Hiram were playing.
7. What are the possible outcomes for each roll?
8. Are all of the outcomes equally likely? Explain your reasoning.
9. Would it make sense to choose random numbers from 2 through 12?
Why or why not?
10. How can you simulate rolling two number cubes and calculating the sum?
One way to simulate rolling two number cubes and calculating the sum would be to enter
a set of random integers from 1 through 6 into column A and another set into column B.
You can then write a formula in column C to add columns A and B. Another approach
would be to write a formula to add two random numbers from 1 through 6 together to
get a sum.
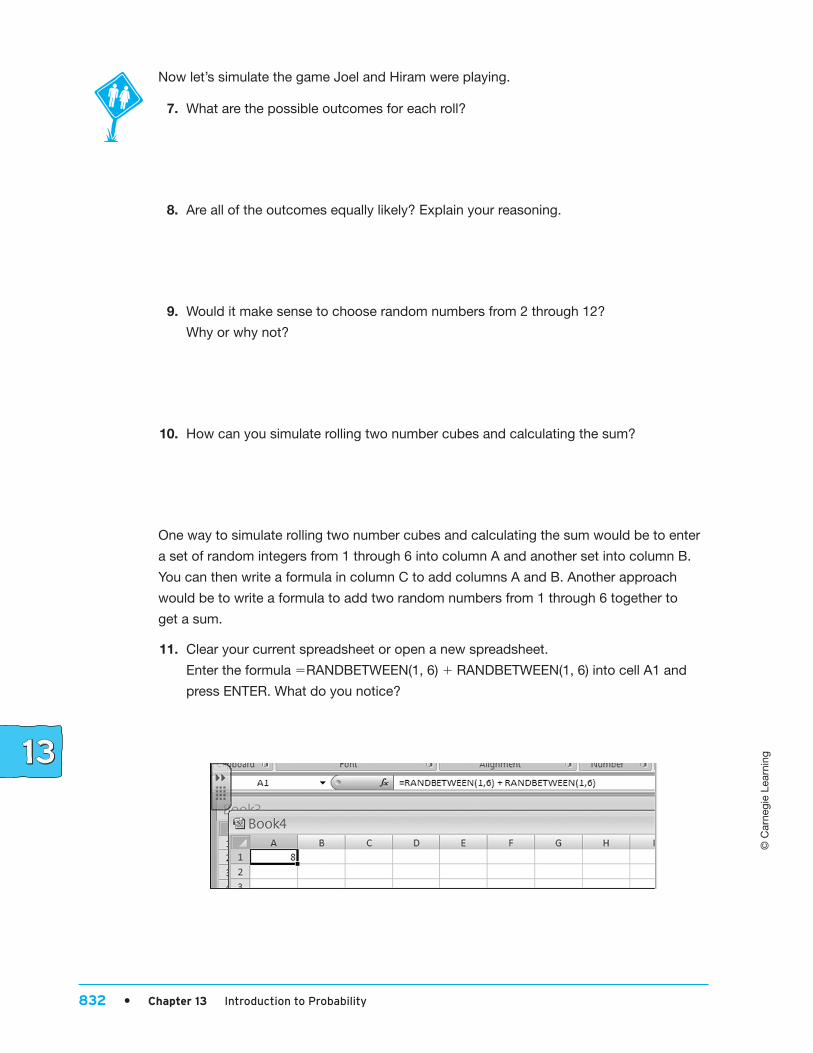
11. Clear your current spreadsheet or open a new spreadsheet.
Enter the formula 5RANDBETWEEN(1, 6) 1 RANDBETWEEN(1, 6) into cell A1 and
press ENTER. What do you notice?
462345_C2_CH13_pp781-864.indd 832 28/08/13 12:47 PM

© C
arne
gie
Lear
ning
13.5 Using Technology for Simulations • 833
12. How could you simulate 10 trials?
13. Simulate 10 trials. Then, record your results in the table shown.
Result Tally TotalProbability (decimal)
2
3
4
5
6
7
8
9
10
11
12
Total 10 10 1
462345_C2_CH13_pp781-864.indd 833 28/08/13 12:47 PM
834 • Chapter 13 Introduction to Probability
© C
arne
gie
Lear
ning
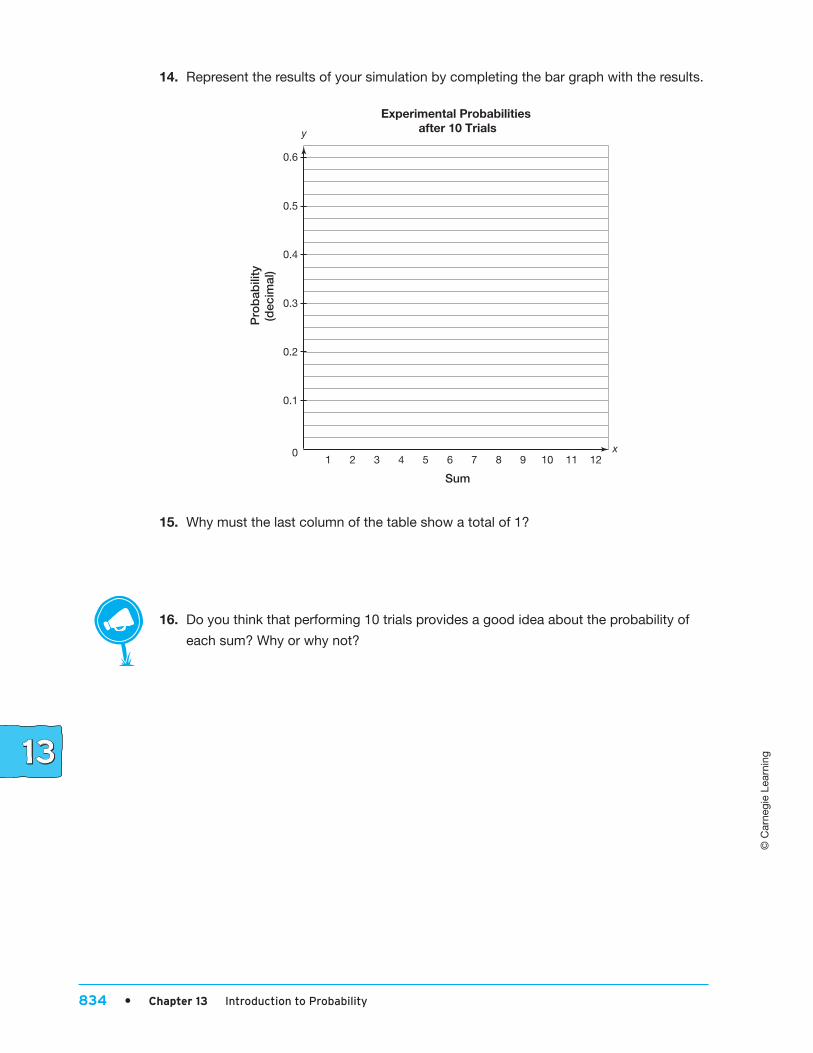
14. Represent the results of your simulation by completing the bar graph with the results.
0.4
0.3
0.2
0.1
0
Sum
(dec
imal
)P
rob
abili
ty
Experimental Probabilities after 10 Trials
2 4 6 8 91 3 5 7x
y
10 11 12
0.5
0.6
15. Why must the last column of the table show a total of 1?
16. Do you think that performing 10 trials provides a good idea about the probability of
each sum? Why or why not?
462345_C2_CH13_pp781-864.indd 834 28/08/13 12:47 PM
© C
arne
gie
Lear
ning
13.5 Using Technology for Simulations • 835
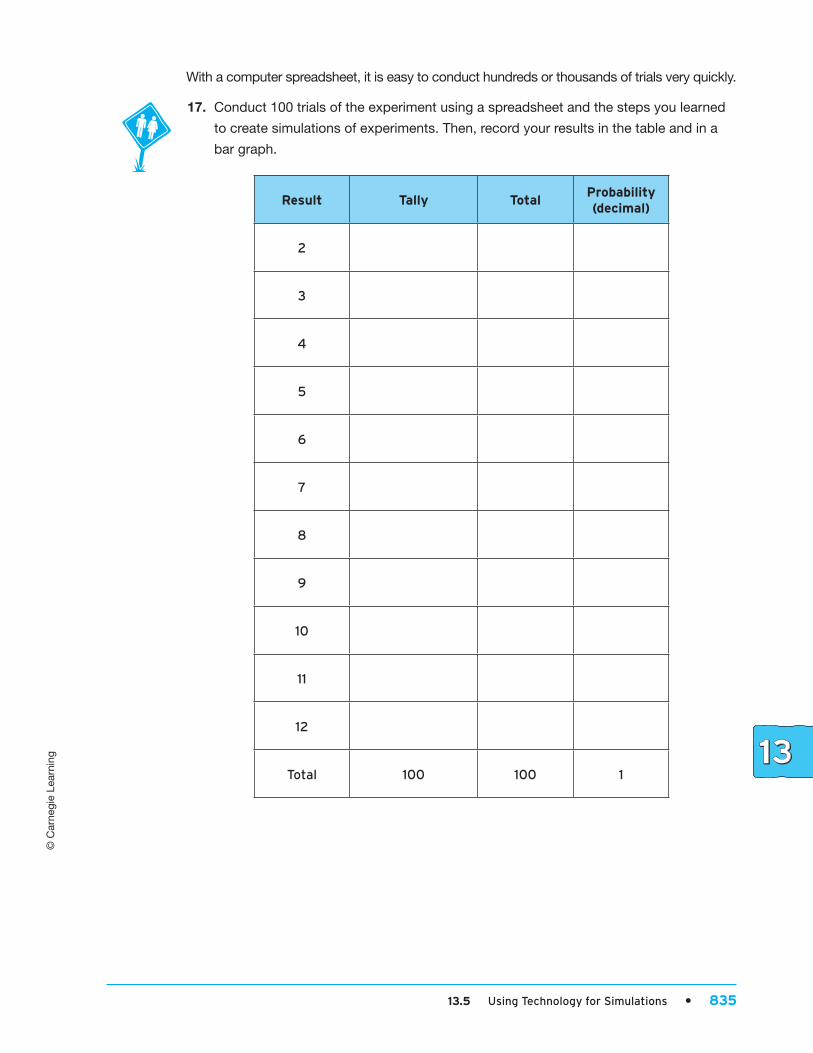
With a computer spreadsheet, it is easy to conduct hundreds or thousands of trials very quickly.
17. Conduct 100 trials of the experiment using a spreadsheet and the steps you learned
to create simulations of experiments. Then, record your results in the table and in a
bar graph.
Result Tally TotalProbability (decimal)
2
3
4
5
6
7
8
9
10
11
12
Total 100 100 1
462345_C2_CH13_pp781-864.indd 835 28/08/13 12:47 PM
© C
arne
gie
Lear
ning
836 • Chapter 13 Introduction to Probability
0.1
0.2
0.3
0.4
0.5
0.6
0
Sum
2 4 6 8 93 5 7x
y
10 11 12
Experimental Probabilitiesafter 100 Trials
Pro
bab
ility
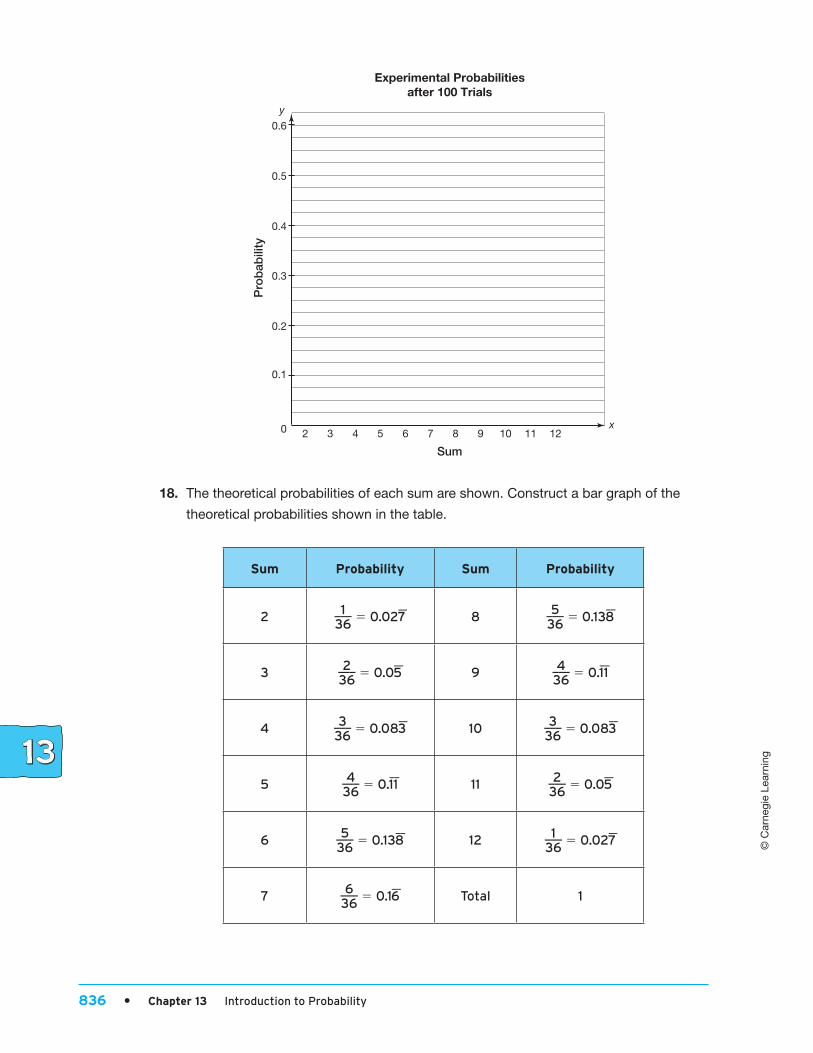
18. The theoretical probabilities of each sum are shown. Construct a bar graph of the
theoretical probabilities shown in the table.
Sum Probability Sum Probability
2 1 ___ 36
5 0.02 __
7 8 5 ___ 36
5 0.13 __
8
3 2 ___ 36
5 0.0 __
5 9 4 ___ 36
5 0. __
11
4 3 ___ 36
5 0.08 __
3 10 3 ___ 36
5 0.08 __
3
5 4 ___ 36
5 0. __
11 11 2 ___ 36
5 0.0 __
5
6 5 ___ 36
5 0.13 __
8 12 1 ___ 36
5 0.02 __
7
7 6 ___ 36
5 0.1 __
6 Total 1
462345_C2_CH13_pp781-864.indd 836 28/08/13 12:47 PM

© C
arne
gie
Lear
ning
13.5 Using Technology for Simulations • 837
19. Compare the two bar graphs. What do you notice? Do you think the 100 trials of this
experiment provided a good idea about the theoretical probabilities?
462345_C2_CH13_pp781-864.indd 837 28/08/13 12:47 PM
© C
arne
gie
Lear
ning
838 • Chapter 13 Introduction to Probability
Problem 2 Retest
Design and carry out a simulation for the five-question test guessing experiment using a
computer spreadsheet. Recall that each question had 4 answer choices, but only one
choice is the correct answer.
1. If there are 4 possible answers for each question, how many random numbers do you
need for each question?
2. Describe one trial.
Since there are 5 questions on the test, use 5 columns in the first row to simulate one trial
of guessing on the test. Type the formula 5RANDBETWEEN(1, 4) in cell A1 and fill RIGHT
to cell E1. Let the number 1 represent a correct guess and numbers 2, 3, and 4 represent
incorrect guesses.
3. List and interpret the results of your first trial.
4. Highlight the first row, and then fill down through row 25. What does filling down
through row 25 represent?
462345_C2_CH13_pp781-864.indd 838 28/08/13 12:47 PM

© C
arne
gie
Lear
ning
13.5 Using Technology for Simulations • 839
5. Record your results in the table shown.
Trial Number Number Correct Trial Number Number Correct
1 14
2 15
3 16
4 17
5 18
6 19
7 20
8 21
9 22
10 23
11 24
12 25
13
462345_C2_CH13_pp781-864.indd 839 28/08/13 12:47 PM
840 • Chapter 13 Introduction to Probability
© C
arne
gie
Lear
ning
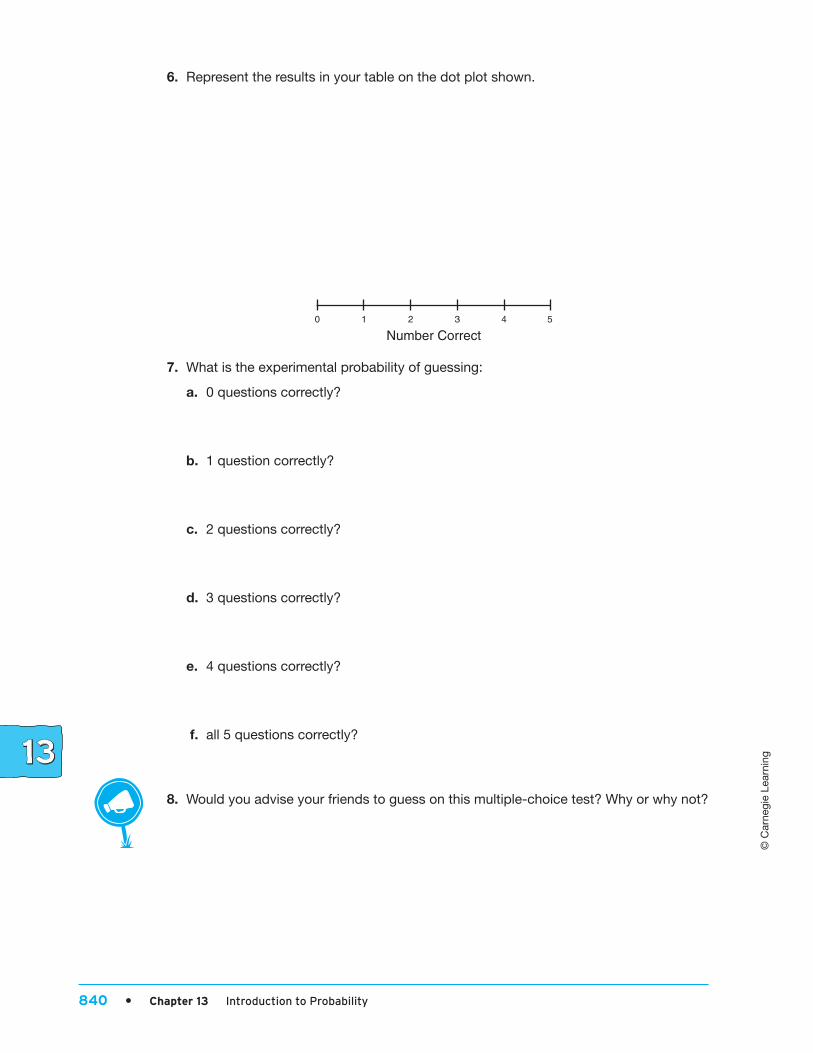
6. Represent the results in your table on the dot plot shown.
0 1 2 3 4 5
Number Correct
7. What is the experimental probability of guessing:
a. 0 questions correctly?
b. 1 question correctly?
c. 2 questions correctly?
d. 3 questions correctly?
e. 4 questions correctly?
f. all 5 questions correctly?
8. Would you advise your friends to guess on this multiple-choice test? Why or why not?
462345_C2_CH13_pp781-864.indd 840 28/08/13 12:47 PM
© C
arne
gie
Lear
ning
13.5 Using Technology for Simulations • 841
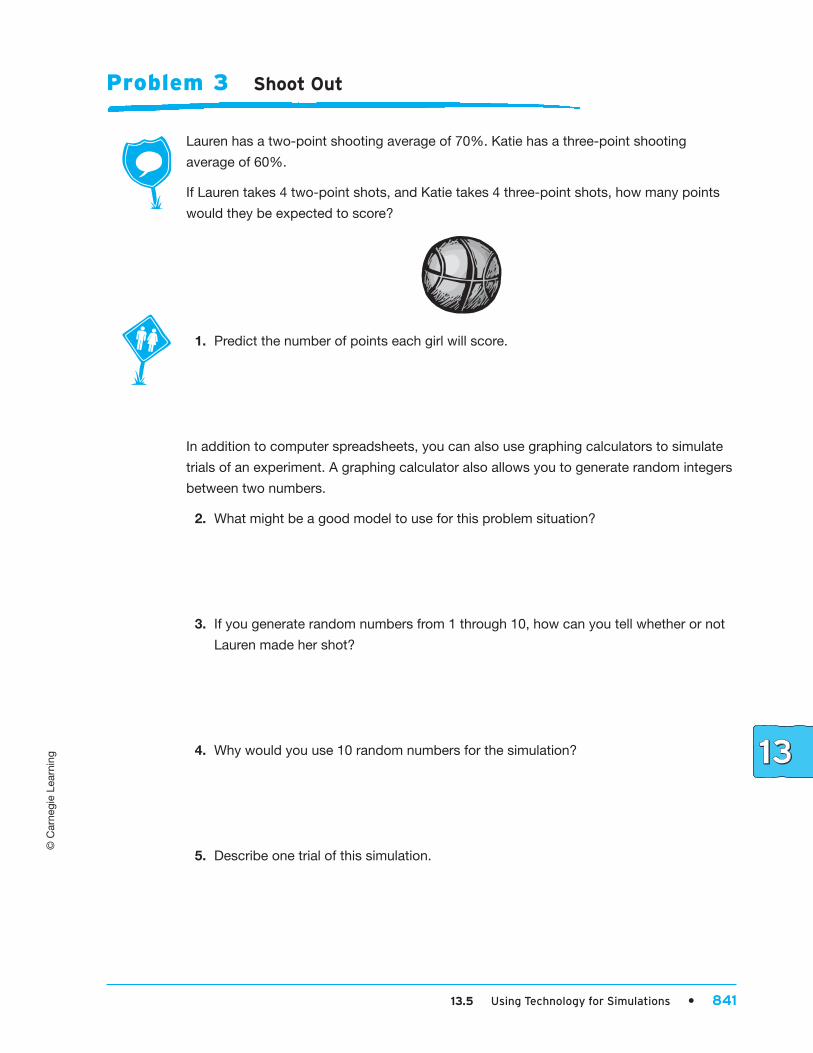
Problem 3 Shoot Out
Lauren has a two-point shooting average of 70%. Katie has a three-point shooting
average of 60%.
If Lauren takes 4 two-point shots, and Katie takes 4 three-point shots, how many points
would they be expected to score?
1. Predict the number of points each girl will score.
In addition to computer spreadsheets, you can also use graphing calculators to simulate
trials of an experiment. A graphing calculator also allows you to generate random integers
between two numbers.
2. What might be a good model to use for this problem situation?
3. If you generate random numbers from 1 through 10, how can you tell whether or not
Lauren made her shot?
4. Why would you use 10 random numbers for the simulation?
5. Describe one trial of this simulation.
462345_C2_CH13_pp781-864.indd 841 28/08/13 12:47 PM
© C
arne
gie
Lear
ning
842 • Chapter 13 Introduction to Probability
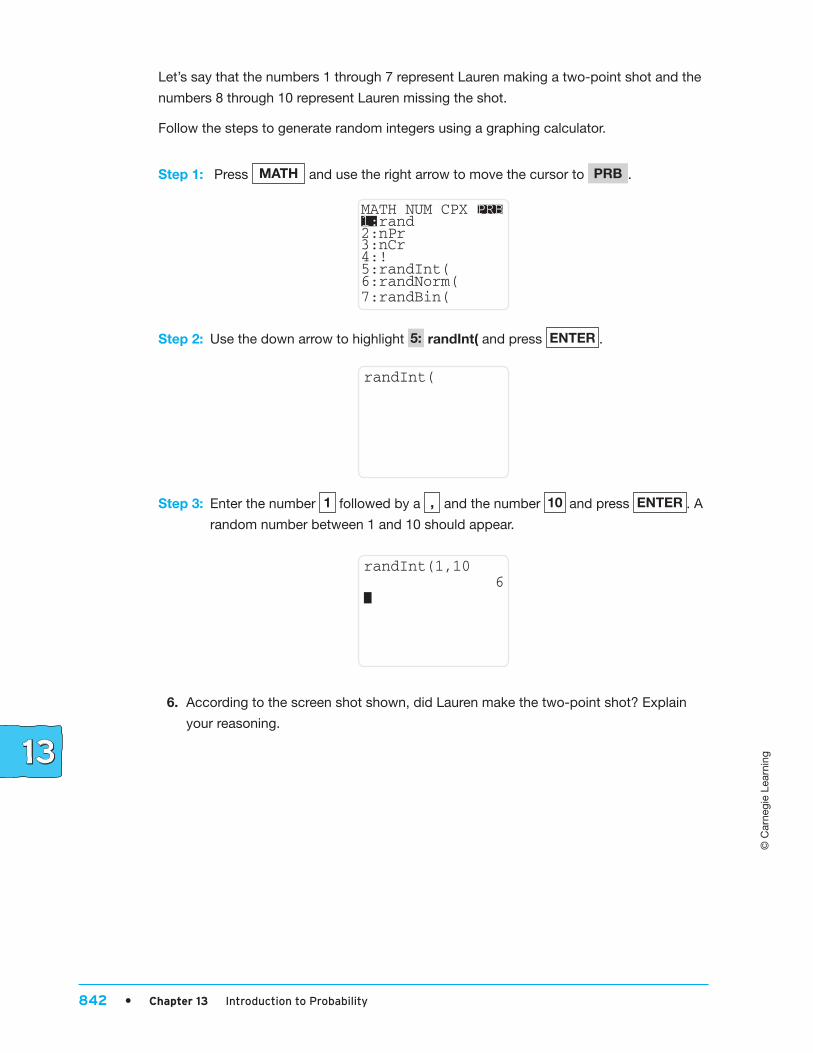
Let’s say that the numbers 1 through 7 represent Lauren making a two-point shot and the
numbers 8 through 10 represent Lauren missing the shot.
Follow the steps to generate random integers using a graphing calculator.
Step1: Press MATH and use the right arrow to move the cursor to PRB .
2:nPr3:nCr4:!
6:randNorm(7:randBin(
5:randInt(
MATH NUM CPX PRB1:rand
Step2: Use the down arrow to highlight 5: randInt(and press ENTER .
randInt(
Step3: Enter the number 1 followed by a , and the number 10 and press ENTER . A
random number between 1 and 10 should appear.
randInt(1,10 6█
6. According to the screen shot shown, did Lauren make the two-point shot? Explain
your reasoning.
462345_C2_CH13_pp781-864.indd 842 28/08/13 12:47 PM
© C
arne
gie
Lear
ning
13.5 Using Technology for Simulations • 843
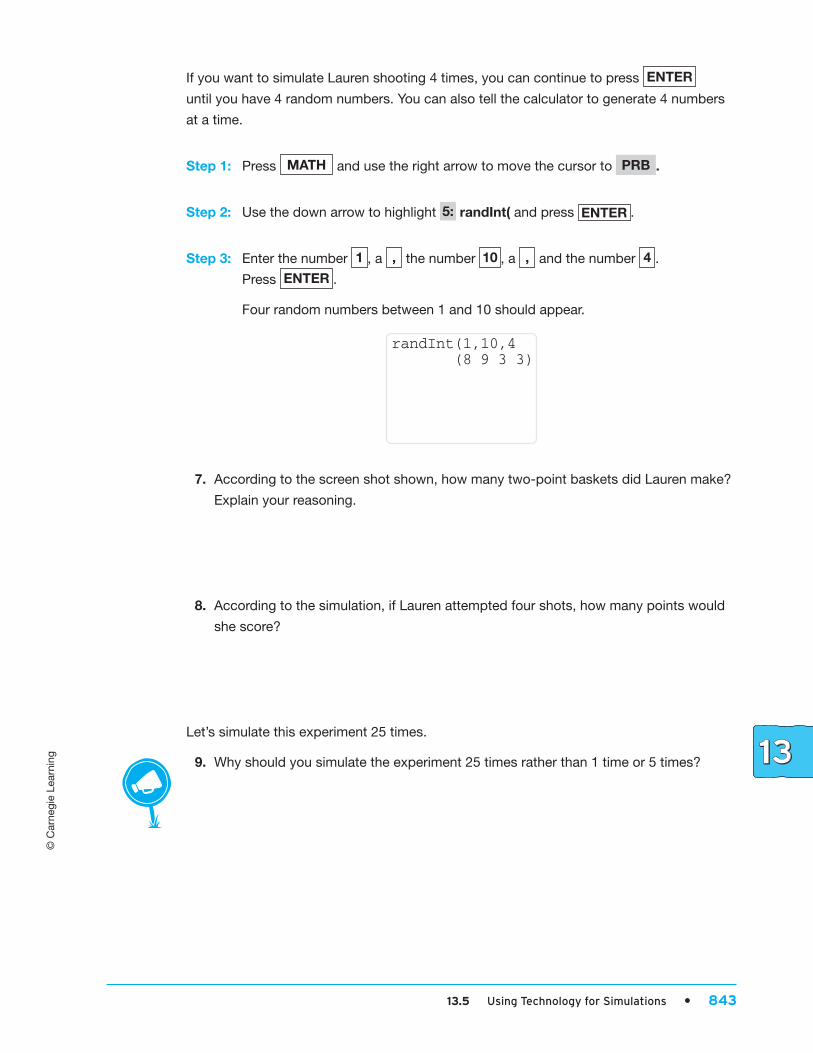
If you want to simulate Lauren shooting 4 times, you can continue to press ENTER
until you have 4 random numbers. You can also tell the calculator to generate 4 numbers
at a time.
Step1: Press MATH and use the right arrow to move the cursor to PRB .
Step2: Use the down arrow to highlight 5: randInt(and press ENTER .
Step3: Enter the number 1 , a , the number 10 , a , and the number 4 .
Press ENTER .
Four random numbers between 1 and 10 should appear.
randInt(1,10,4 (8 9 3 3)
7. According to the screen shot shown, how many two-point baskets did Lauren make?
Explain your reasoning.
8. According to the simulation, if Lauren attempted four shots, how many points would
she score?
Let’s simulate this experiment 25 times.
9. Why should you simulate the experiment 25 times rather than 1 time or 5 times?
462345_C2_CH13_pp781-864.indd 843 28/08/13 12:47 PM

844 • Chapter 13 Introduction to Probability
© C
arne
gie
Lear
ning
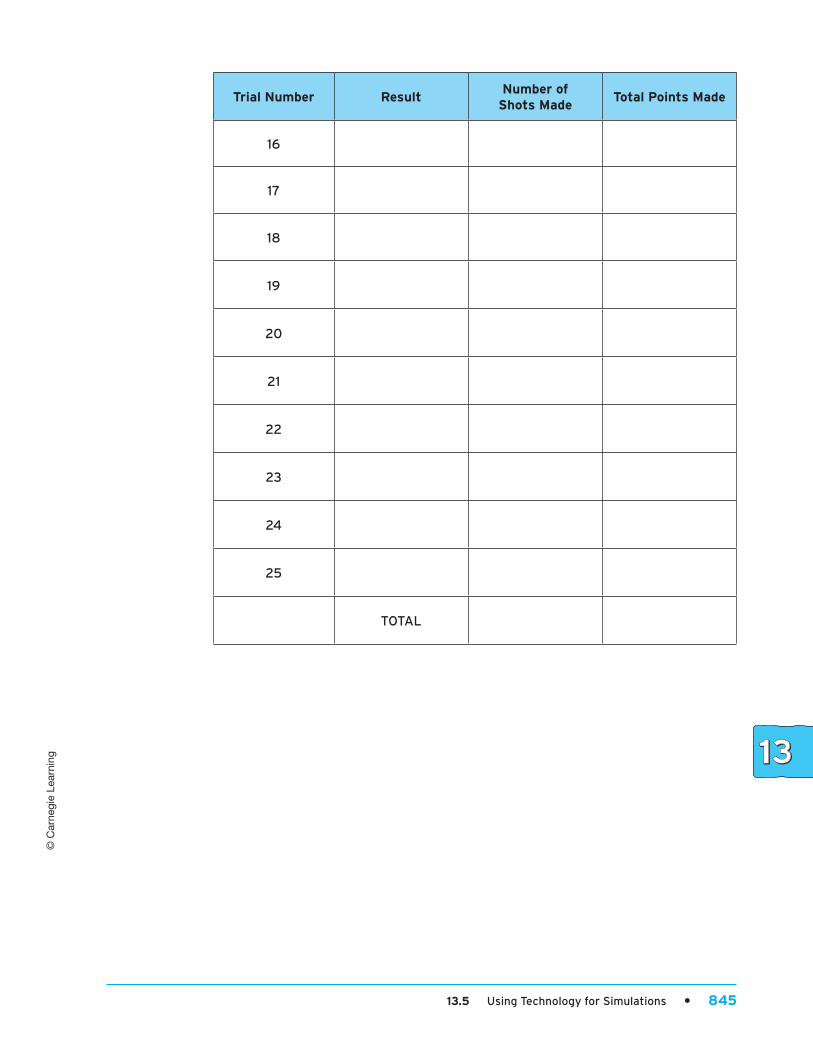
10. Simulate the experiment of Lauren shooting 4 shots 25 times. Record your
results in the table.
Trial Number ResultNumber of
Shots MadeTotal Points Made
1
2
3
4
5
6
7
8
9
10
11
12
13
14
15
462345_C2_CH13_pp781-864.indd 844 28/08/13 12:47 PM
© C
arne
gie
Lear
ning
13.5 Using Technology for Simulations • 845
Trial Number ResultNumber of
Shots MadeTotal Points Made
16
17
18
19
20
21
22
23
24
25
TOTAL
462345_C2_CH13_pp781-864.indd 845 28/08/13 12:47 PM

© C
arne
gie
Lear
ning
846 • Chapter 13 Introduction to Probability
11. Plot your results for the number of points Lauren scored from the simulation on the
dot plot. Then, make a prediction about how many points Lauren would be expected
to make if she attempted 4 shots. Explain your reasoning.
0 1 2 3 4 5 6 7
Lauren’s Points8 9 10 11 12
462345_C2_CH13_pp781-864.indd 846 28/08/13 12:47 PM
© C
arne
gie
Lear
ning
13.5 Using Technology for Simulations • 847
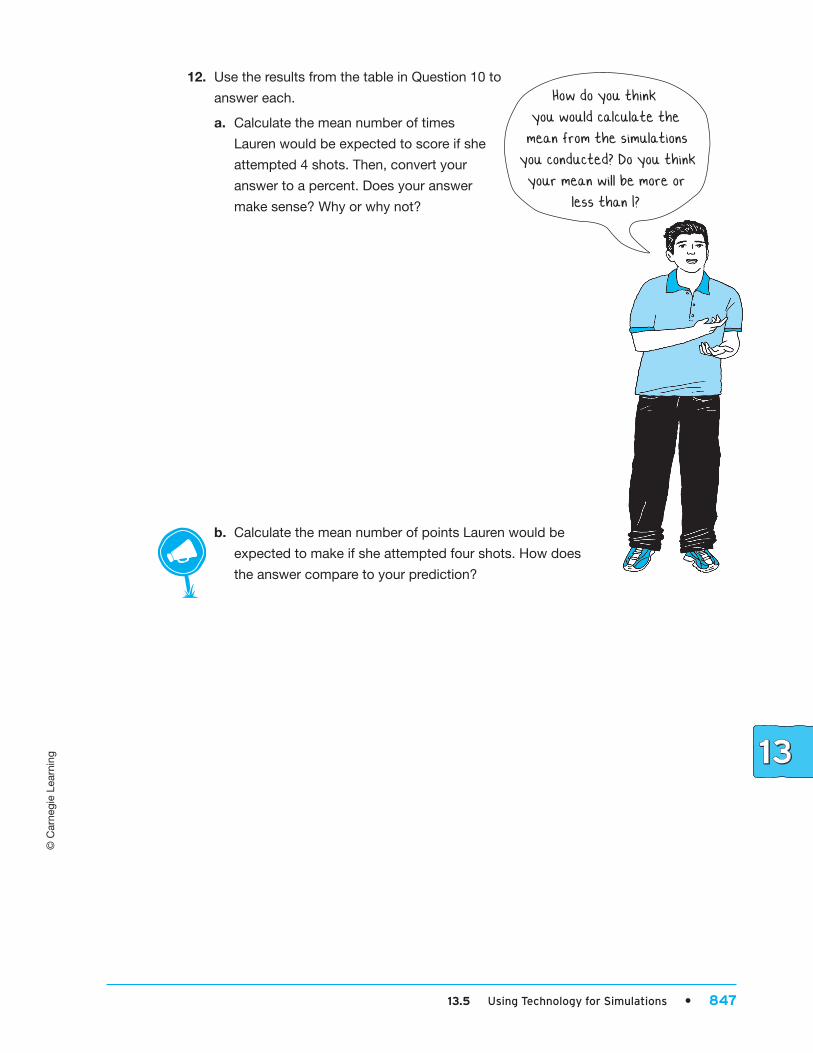
12. Use the results from the table in Question 10 to
answer each.
a. Calculate the mean number of times
Lauren would be expected to score if she
attempted 4 shots. Then, convert your
answer to a percent. Does your answer
make sense? Why or why not?
b. Calculate the mean number of points Lauren would be
expected to make if she attempted four shots. How does
the answer compare to your prediction?
How do you think you would calculate the
mean from the simulations you conducted? Do you think your mean will be more or
less than 1?
462345_C2_CH13_pp781-864.indd 847 28/08/13 12:47 PM
© C
arne
gie
Lear
ning
848 • Chapter 13 Introduction to Probability
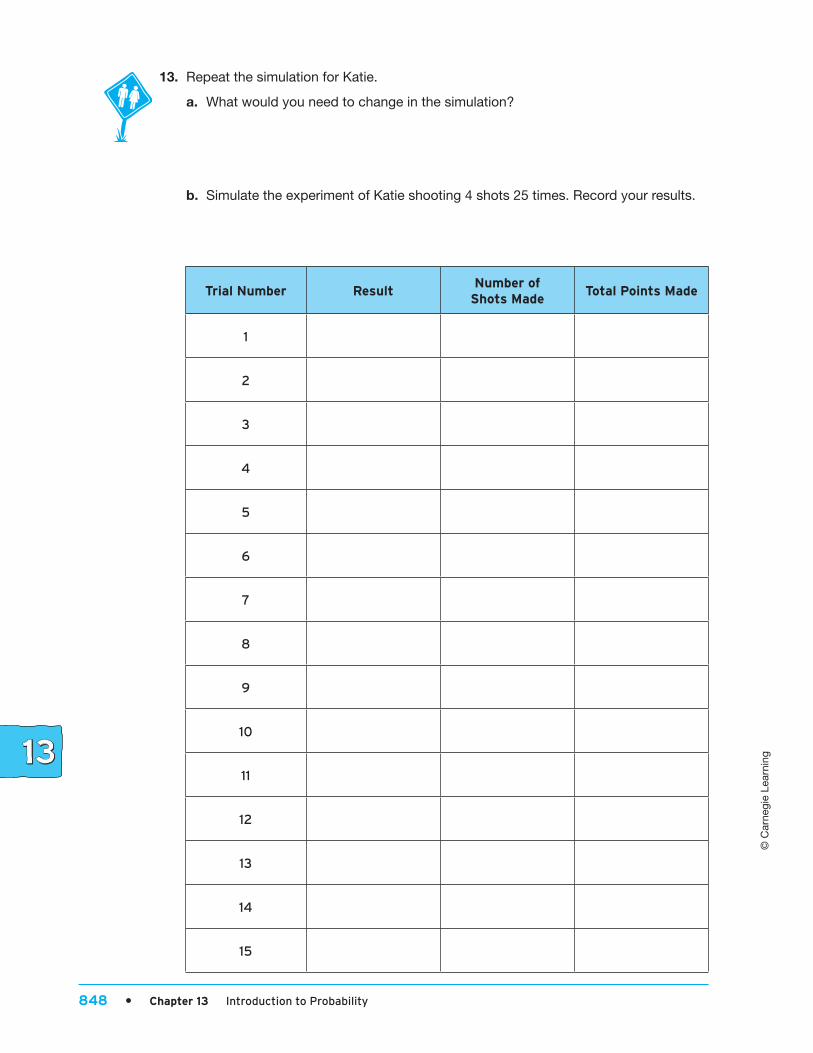
13. Repeat the simulation for Katie.
a. What would you need to change in the simulation?
b. Simulate the experiment of Katie shooting 4 shots 25 times. Record your results.
Trial Number ResultNumber of
Shots MadeTotal Points Made
1
2
3
4
5
6
7
8
9
10
11
12
13
14
15
462345_C2_CH13_pp781-864.indd 848 28/08/13 12:47 PM

© C
arne
gie
Lear
ning
13.5 Using Technology for Simulations • 849
Trial Number ResultNumber of
Shots MadeTotal Points Made
16
17
18
19
20
21
22
23
24
25
TOTAL
462345_C2_CH13_pp781-864.indd 849 28/08/13 12:47 PM
850 • Chapter 13 Introduction to Probability
© C
arne
gie
Lear
ning
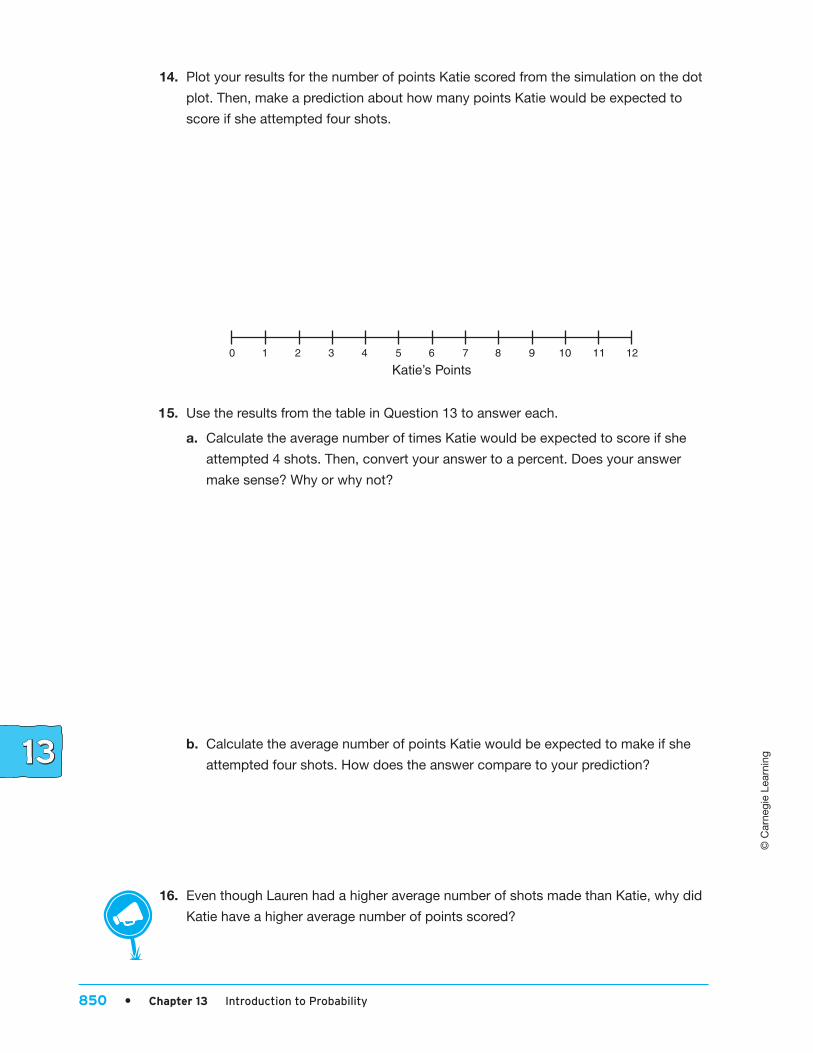
14. Plot your results for the number of points Katie scored from the simulation on the dot
plot. Then, make a prediction about how many points Katie would be expected to
score if she attempted four shots.
0 1 2 3 4 5 6 7
Katie’s Points8 9 10 11 12
15. Use the results from the table in Question 13 to answer each.
a. Calculate the average number of times Katie would be expected to score if she
attempted 4 shots. Then, convert your answer to a percent. Does your answer
make sense? Why or why not?
b. Calculate the average number of points Katie would be expected to make if she
attempted four shots. How does the answer compare to your prediction?
16. Even though Lauren had a higher average number of shots made than Katie, why did
Katie have a higher average number of points scored?
462345_C2_CH13_pp781-864.indd 850 28/08/13 12:47 PM
© C
arne
gie
Lear
ning
13.5 Using Technology for Simulations • 851
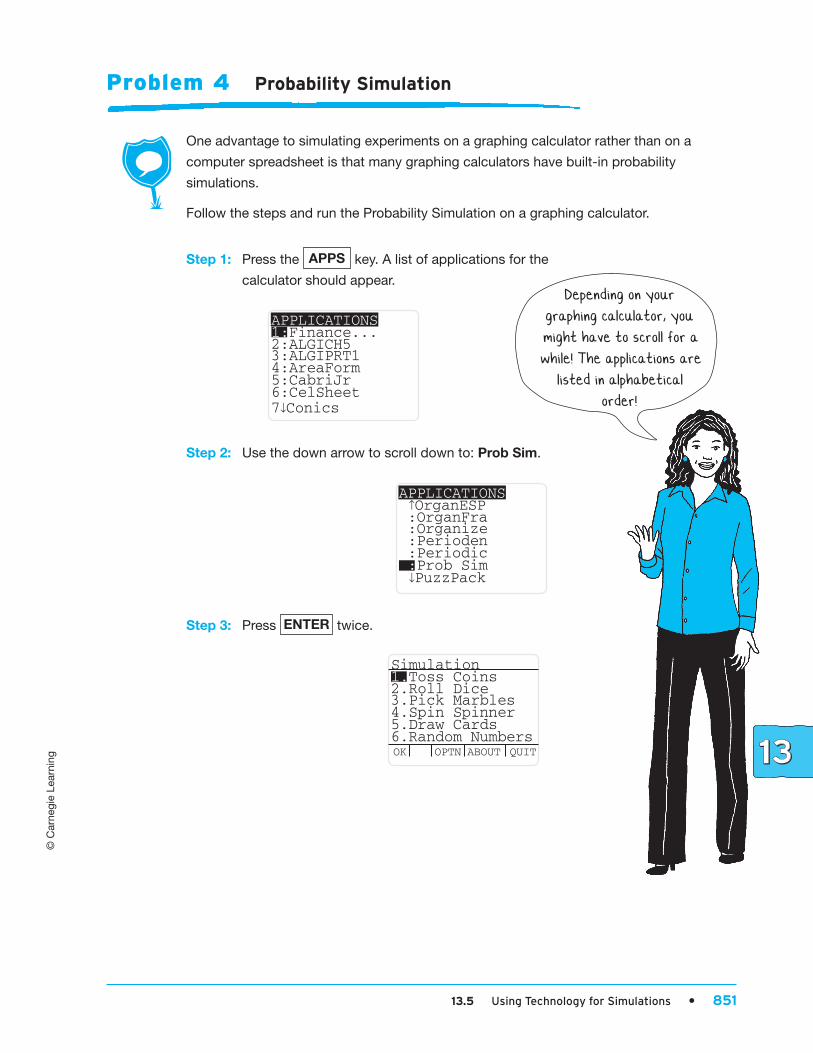
Problem 4 Probability Simulation
One advantage to simulating experiments on a graphing calculator rather than on a
computer spreadsheet is that many graphing calculators have built-in probability
simulations.
Follow the steps and run the Probability Simulation on a graphing calculator.
Step1: Press the APPS key. A list of applications for the
calculator should appear.
2:ALGICH53:ALGIPRT14:AreaForm
6:CelSheet7↓Conics
5:CabriJr
APPLICATIONS1:Finance...
Step2: Use the down arrow to scroll down to: ProbSim.
:OrganFra :Organize :Perioden
↓PuzzPack
:Periodic
APPLICATIONS ↑OrganESP
:Prob Sim
Step3: Press ENTER twice.
2.Roll Dice3.Pick Marbles4.Spin Spinner
6.Random NumbersOK OPTN ABOUT QUIT
5.Draw Cards
Simulation1.Toss Coins
Depending on your graphing calculator, you might have to scroll for a while! The applications are
listed in alphabetical order!
462345_C2_CH13_pp781-864.indd 851 28/08/13 12:47 PM
852 • Chapter 13 Introduction to Probability
© C
arne
gie
Lear
ning
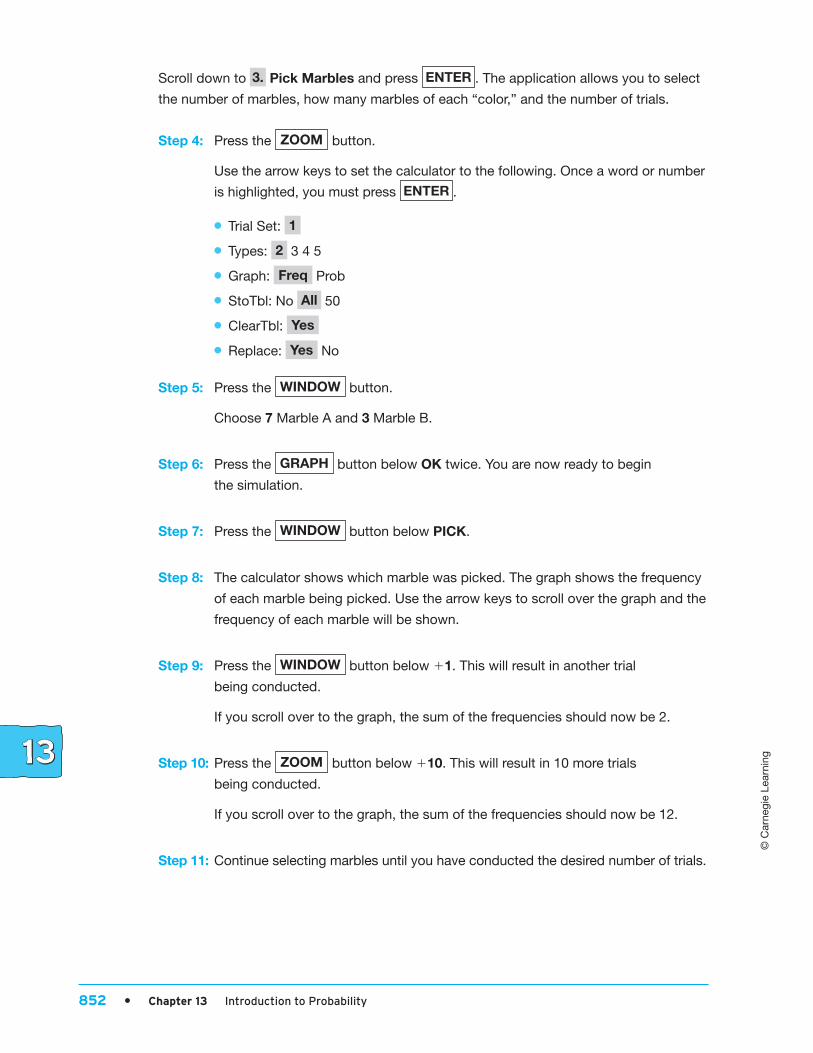
Scroll down to 3. PickMarblesand press ENTER . The application allows you to select
the number of marbles, how many marbles of each “color,” and the number of trials.
Step4: Press the ZOOM button.
Use the arrow keys to set the calculator to the following. Once a word or number
is highlighted, you must press ENTER .
● Trial Set: 1
● Types: 2 3 4 5
● Graph: Freq Prob
● StoTbl: No All 50
● ClearTbl: Yes
● Replace: Yes No
Step5: Press the WINDOW button.
Choose 7 Marble A and 3 Marble B.
Step6: Press the GRAPH button below OK twice. You are now ready to begin
the simulation.
Step7: Press the WINDOW button below PICK.
Step8: The calculator shows which marble was picked. The graph shows the frequency
of each marble being picked. Use the arrow keys to scroll over the graph and the
frequency of each marble will be shown.
Step9: Press the WINDOW button below 11. This will result in another trial
being conducted.
If you scroll over to the graph, the sum of the frequencies should now be 2.
Step10: Press the ZOOM button below 110. This will result in 10 more trials
being conducted.
If you scroll over to the graph, the sum of the frequencies should now be 12.
Step11: Continue selecting marbles until you have conducted the desired number of trials.
462345_C2_CH13_pp781-864.indd 852 28/08/13 12:47 PM
© C
arne
gie
Lear
ning
13.5 Using Technology for Simulations • 853
Problem 5 I’ve Lost My Marbles!
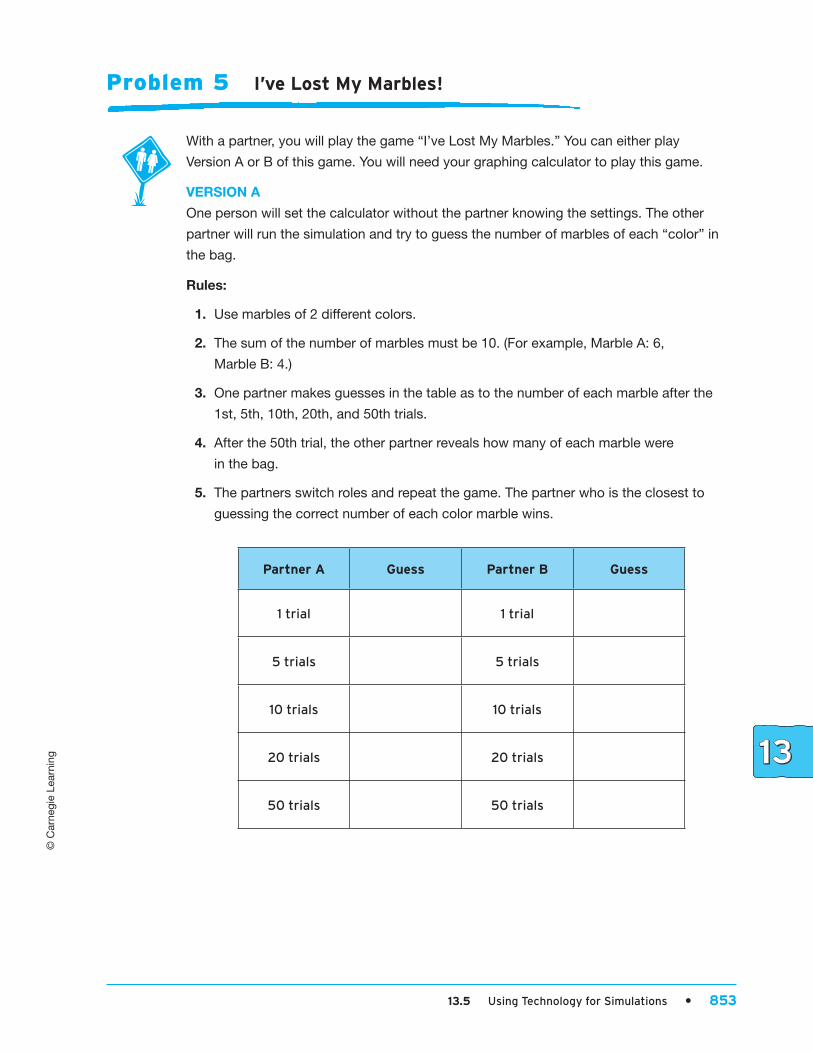
With a partner, you will play the game “I’ve Lost My Marbles.” You can either play
Version A or B of this game. You will need your graphing calculator to play this game.
VERSIONA
One person will set the calculator without the partner knowing the settings. The other
partner will run the simulation and try to guess the number of marbles of each “color” in
the bag.
Rules:
1. Use marbles of 2 different colors.
2. The sum of the number of marbles must be 10. (For example, Marble A: 6,
Marble B: 4.)
3. One partner makes guesses in the table as to the number of each marble after the
1st, 5th, 10th, 20th, and 50th trials.
4. After the 50th trial, the other partner reveals how many of each marble were
in the bag.
5. The partners switch roles and repeat the game. The partner who is the closest to
guessing the correct number of each color marble wins.
Partner A Guess Partner B Guess
1 trial 1 trial
5 trials 5 trials
10 trials 10 trials
20 trials 20 trials
50 trials 50 trials
462345_C2_CH13_pp781-864.indd 853 28/08/13 12:47 PM
© C
arne
gie
Lear
ning
854 • Chapter 13 Introduction to Probability
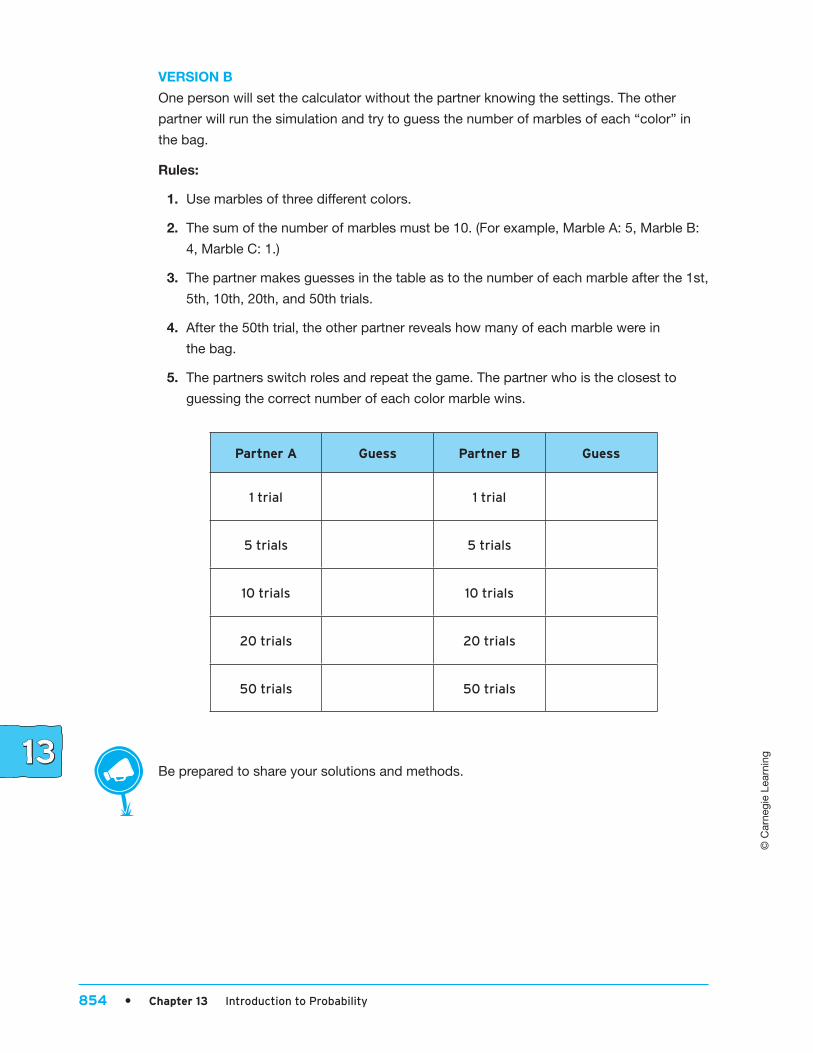
VERSIONB
One person will set the calculator without the partner knowing the settings. The other
partner will run the simulation and try to guess the number of marbles of each “color” in
the bag.
Rules:
1. Use marbles of three different colors.
2. The sum of the number of marbles must be 10. (For example, Marble A: 5, Marble B:
4, Marble C: 1.)
3. The partner makes guesses in the table as to the number of each marble after the 1st,
5th, 10th, 20th, and 50th trials.
4. After the 50th trial, the other partner reveals how many of each marble were in
the bag.
5. The partners switch roles and repeat the game. The partner who is the closest to
guessing the correct number of each color marble wins.
Partner A Guess Partner B Guess
1 trial 1 trial
5 trials 5 trials
10 trials 10 trials
20 trials 20 trials
50 trials 50 trials
Be prepared to share your solutions and methods.
462345_C2_CH13_pp781-864.indd 854 28/08/13 12:47 PM
© C
arne
gie
Lear
ning
Chapter 13 Summary • 855
Key Terms outcome (13.1)
experiment (13.1)
sample space (13.1)
event (13.1)
simple event (13.1)
Chapter 13 Summary
probability (13.1)
complementary events (13.1)
equally likely (13.1)
experimental probability (13.2)
Determining Sample Space
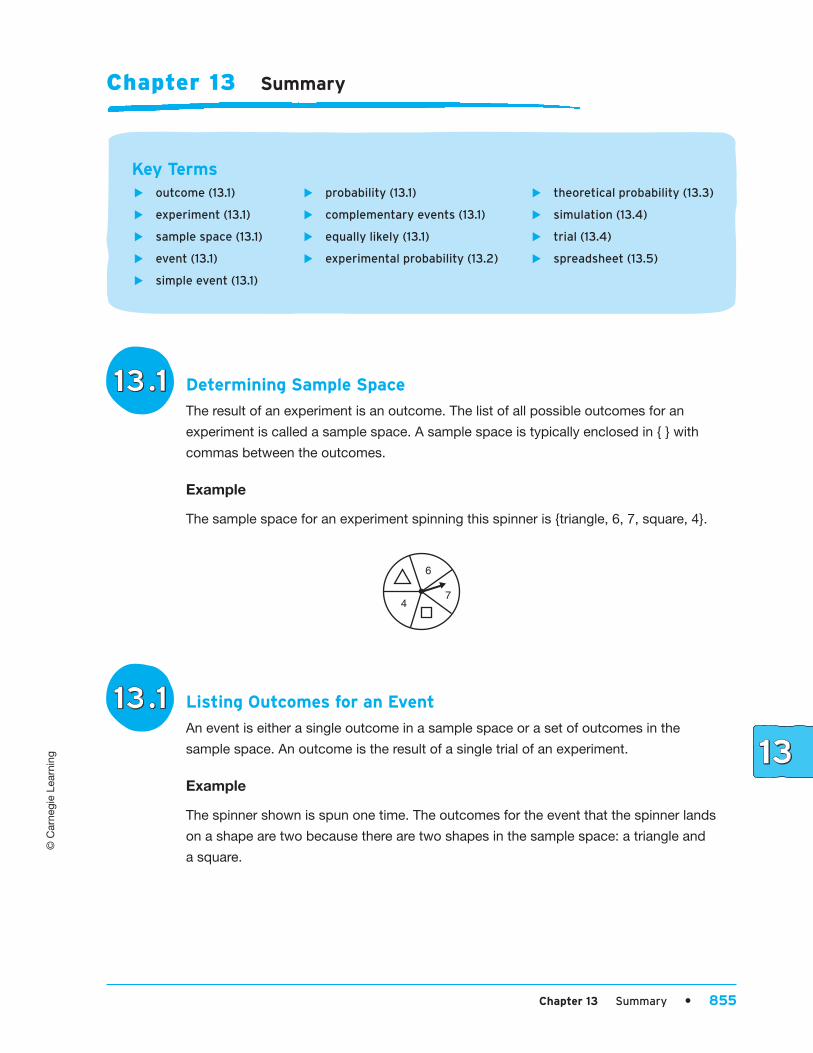
The result of an experiment is an outcome. The list of all possible outcomes for an
experiment is called a sample space. A sample space is typically enclosed in { } with
commas between the outcomes.
Example
The sample space for an experiment spinning this spinner is {triangle, 6, 7, square, 4}.
6
74
Listing Outcomes for an Event
An event is either a single outcome in a sample space or a set of outcomes in the
sample space. An outcome is the result of a single trial of an experiment.
Example
The spinner shown is spun one time. The outcomes for the event that the spinner lands
on a shape are two because there are two shapes in the sample space: a triangle and
a square.
theoretical probability (13.3)
simulation (13.4)
trial (13.4)
spreadsheet (13.5)
462345_C2_CH13_pp781-864.indd 855 28/08/13 12:47 PM
856 • Chapter 13 Introduction to Probability
© C
arne
gie
Lear
ning
Determining the Probability of a Complement of an Event
Complementary events are events that consist of the desired outcomes, and the
remaining events that consist of all the undesired outcomes. Together, complementary
events include every possible outcome in the sample space. The notation for the
complement of an event is ~. Subtraction can be used to determine the probability of a
complement of an event.
Example
Russell rolls a number cube one time.
P(~less than 5) 5 1 2 P(less than 5) 5 1 2 4 __ 6 5
2 __ 6 5 1 __ 3
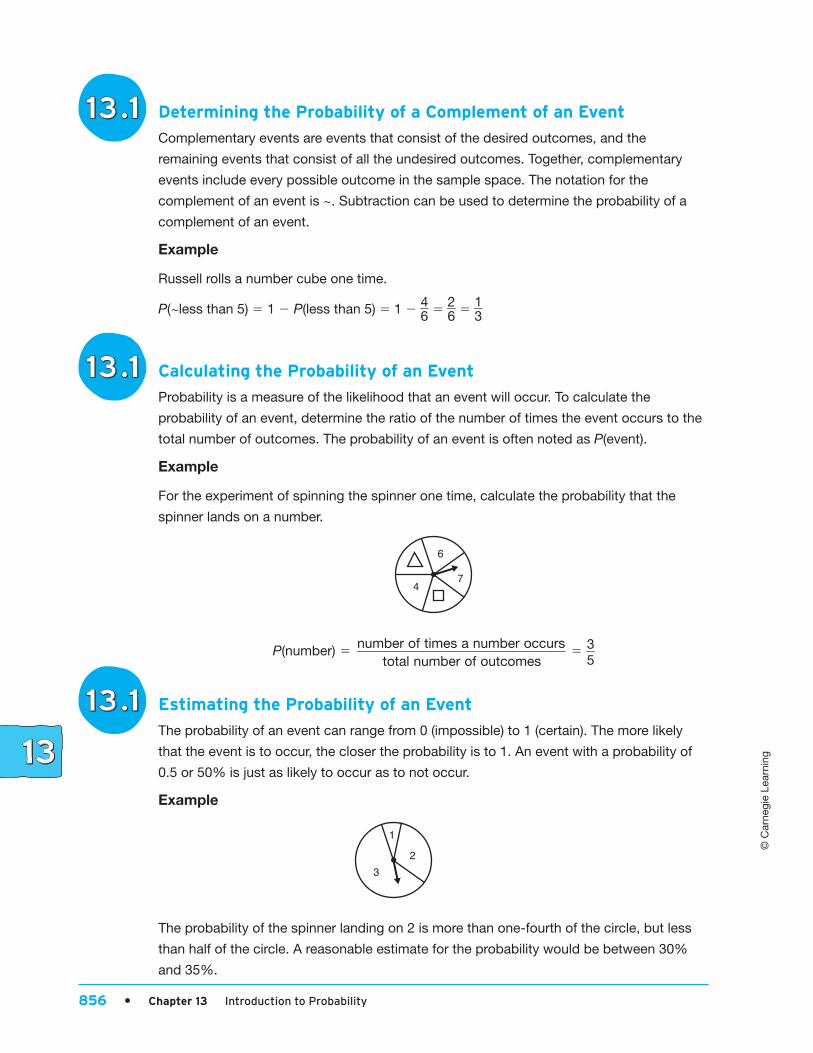
Calculating the Probability of an Event
Probability is a measure of the likelihood that an event will occur. To calculate the
probability of an event, determine the ratio of the number of times the event occurs to the
total number of outcomes. The probability of an event is often noted as P(event).
Example
For the experiment of spinning the spinner one time, calculate the probability that the
spinner lands on a number.
6
74
P(number) 5 number of times a number occurs _______________________________ total number of outcomes
5 3 __ 5
Estimating the Probability of an Event
The probability of an event can range from 0 (impossible) to 1 (certain). The more likely
that the event is to occur, the closer the probability is to 1. An event with a probability of
0.5 or 50% is just as likely to occur as to not occur.
Example
1
2
3
The probability of the spinner landing on 2 is more than one-fourth of the circle, but less
than half of the circle. A reasonable estimate for the probability would be between 30%
and 35%.
462345_C2_CH13_pp781-864.indd 856 28/08/13 12:47 PM
© C
arne
gie
Lear
ning
Chapter 13 Summary • 857
Estimating the Probability of an Everyday Event
Be careful saying that a probability is 0 or 1. The probability of an everyday event that is
unlikely to occur, but still possible, might best be estimated with a probability such as
0.000001.
Example
You can estimate the probability that it snows in the capital of Alaska on New Year’s Eve.
Because of its climate, it is very likely to snow in Alaska on a winter day. But it is not
certain to happen. A reasonable estimate of the probability is 80%.
Calculating the Probability of an Everyday Event
Situations involving chance are not limited to number cubes and spinners. Everyday
events can include games, weather, and even choosing apples.
Example
Sherri has 3 red delicious apples, 6 gala apples, and 5 golden delicious apples in a bag.
She chooses one apple without looking. The probability of Sherri choosing a gala apple
from the bag is shown.
P(gala) 5 number of times she can choose a gala apple
__________________________________________ total number of apples
5 6 ___ 14
5 3 __ 7
I don,t know about you, but
I can’t wait until I graduate from
high school!
462345_C2_CH13_pp781-864.indd 857 28/08/13 12:47 PM
858 • Chapter 13 Introduction to Probability
© C
arne
gie
Lear
ning
Calculating an Experimental Probability
Every running of an experiment is called a trial. Experimental probability is based on
several trials of the same experiment. For many experiments, a tally table is an easy way
to track the results of trials. To calculate an experimental probability, determine the ratio of
the number of times an event occurred in your experiment by the total number of trials you
performed for the experiment.
Experimental probabilities will vary. One day, you may roll an even number 14 times when
rolling a number cube 20 times. The next day, you may roll an even number 11 times when
rolling the number cube 20 times.
Example
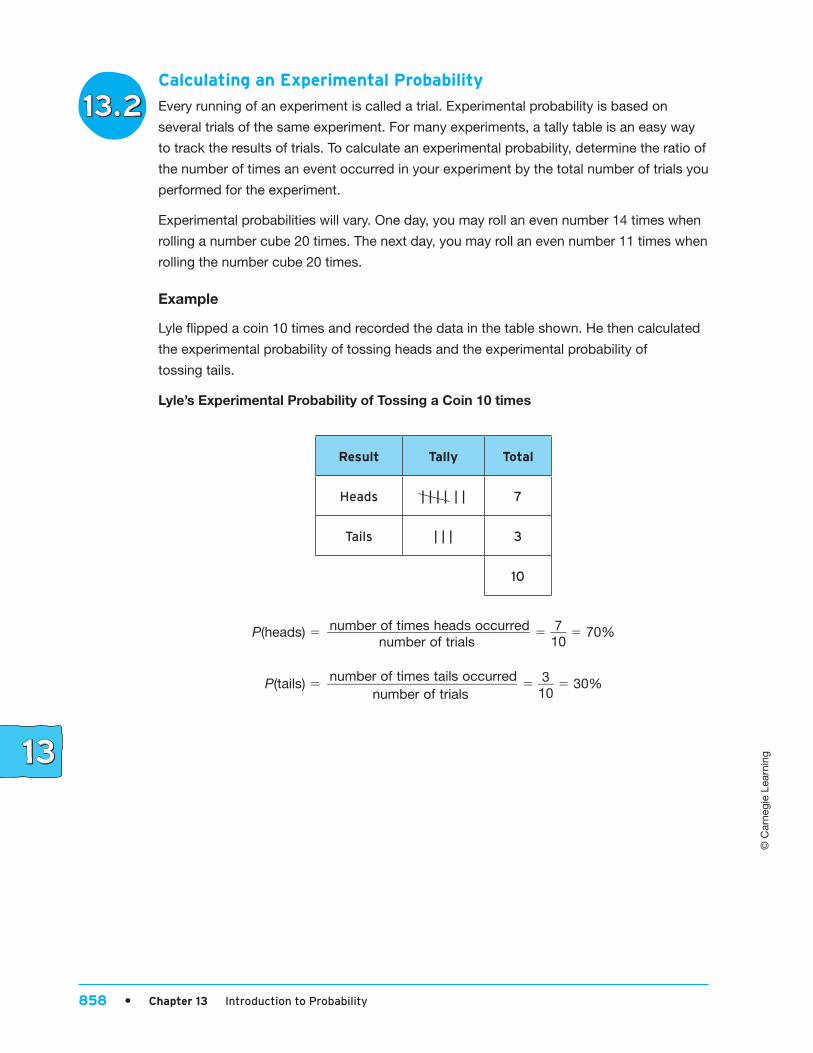
Lyle flipped a coin 10 times and recorded the data in the table shown. He then calculated
the experimental probability of tossing heads and the experimental probability of
tossing tails.
Lyle’sExperimentalProbabilityofTossingaCoin10times
Result Tally Total
Heads | | | | | | 7
Tails | | | 3
10
P(heads) 5 number of times heads occurred ______________________________ number of trials
5 7 ___ 10
5 70%
P(tails) 5 number of times tails occurred ____________________________ number of trials
5 3 ___ 10
5 30%
462345_C2_CH13_pp781-864.indd 858 28/08/13 12:47 PM
© C
arne
gie
Lear
ning
Chapter 13 Summary • 859
Using Proportional Reasoning to Predict the Probability of Random Events
When the probability of an outcome is known, you can set up a proportion to predict the
number of times you can expect a certain outcome for a certain number of trials.
Example
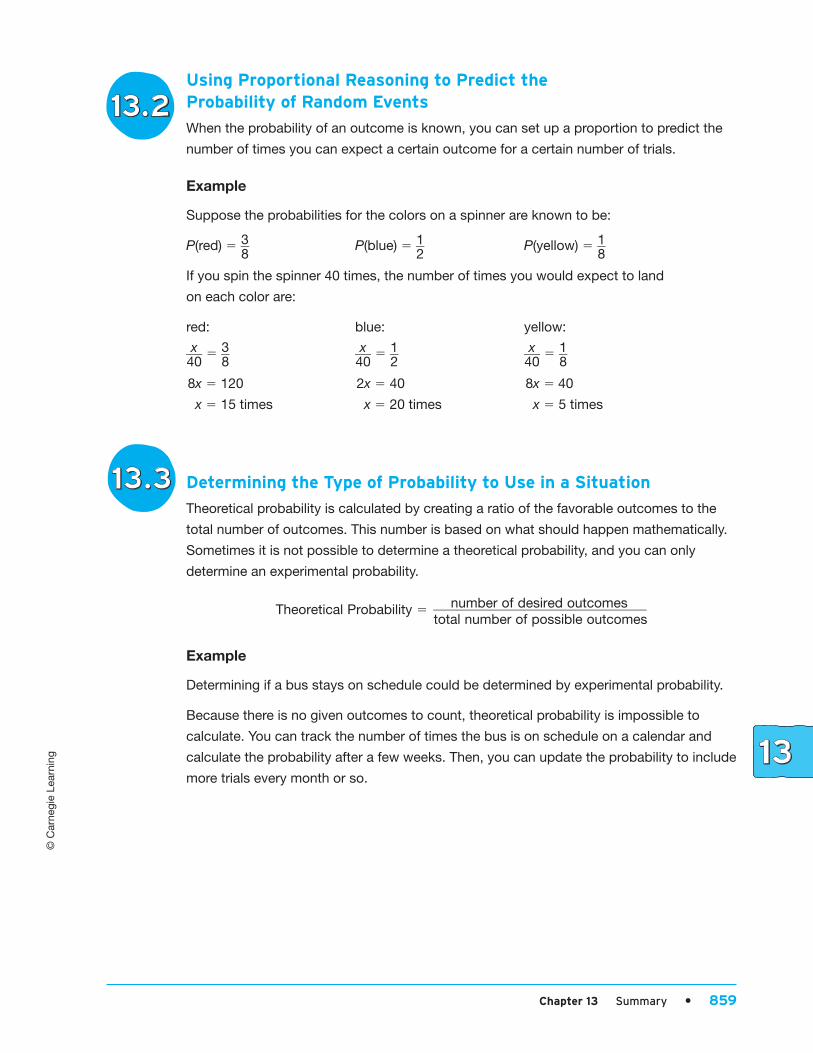
Suppose the probabilities for the colors on a spinner are known to be:
P(red) 5 3 __ 8
P(blue) 5 1 __ 2
P(yellow) 5 1 __ 8
If you spin the spinner 40 times, the number of times you would expect to land
on each color are:
red: blue: yellow:
x ___ 40
5 3 __ 8
x ___ 40
5 1 __ 2
x ___ 40
5 1 __ 8
8x 5 120 2x 5 40 8x 5 40
x 5 15 times x 5 20 times x 5 5 times
Determining the Type of Probability to Use in a Situation
Theoretical probability is calculated by creating a ratio of the favorable outcomes to the
total number of outcomes. This number is based on what should happen mathematically.
Sometimes it is not possible to determine a theoretical probability, and you can only
determine an experimental probability.
Theoretical Probability 5 number of desired outcomes ________________________________ total number of possible outcomes
Example
Determining if a bus stays on schedule could be determined by experimental probability.
Because there is no given outcomes to count, theoretical probability is impossible to
calculate. You can track the number of times the bus is on schedule on a calendar and
calculate the probability after a few weeks. Then, you can update the probability to include
more trials every month or so.
462345_C2_CH13_pp781-864.indd 859 28/08/13 12:47 PM
860 • Chapter 13 Introduction to Probability
© C
arne
gie
Lear
ning
Using a Number Array to Calculate a Theoretical Probability
It can become difficult to keep track of certain types of outcomes, particularly when
combining results from two trials of an experiment. To organize the outcomes in a number
array, list the outcomes for one trial along one side and the outcomes for the other trial
along the other side of a number array. Combine the results in the intersections of each
row and column.
Example
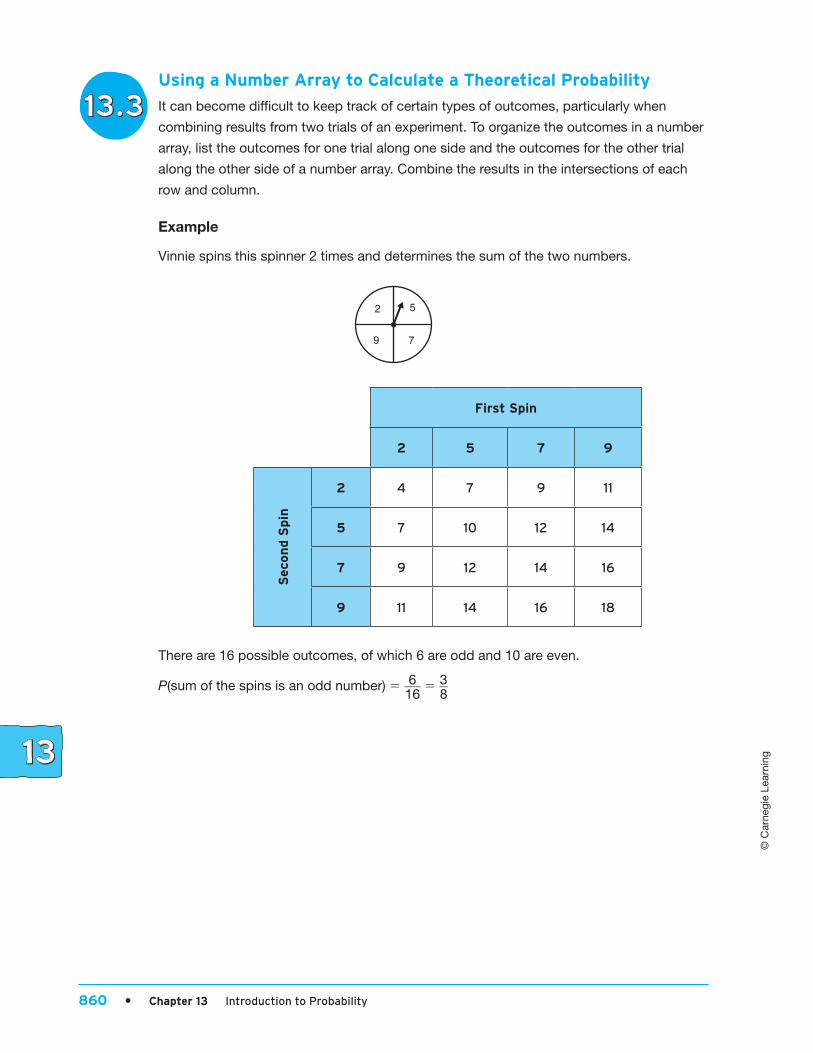
Vinnie spins this spinner 2 times and determines the sum of the two numbers.
2 5
9 7
First Spin
2 5 7 9
Sec
on
d S
pin
2 4 7 9 11
5 7 10 12 14
7 9 12 14 16
9 11 14 16 18
There are 16 possible outcomes, of which 6 are odd and 10 are even.
P(sum of the spins is an odd number) 5 6 ___ 16
5 3 __ 8
462345_C2_CH13_pp781-864.indd 860 28/08/13 12:47 PM
© C
arne
gie
Lear
ning
Chapter 13 Summary • 861
Determining an Appropriate Model to Simulate an Experiment
A simulation is an experiment that models a real-life situation. When simulating an event, it is
important to choose a model that has the same probability of the event you are simulating.
Coins, spinners, or number cubes are models that can be used. The choice of which model
should be used depends on the known probabilities of the events of a given situation.
Each performance of an experiment is a trial. The greater the number of trials, the closer
the experimental probability will be to the theoretical probability.
Example
A test has 8 multiple-choice questions. Each question has 3 possible answers. You want
to know the probability of getting at least four correct answers just by guessing.
For each question, there is one correct answer and two incorrect answers, so the
probability of a correct answer is 1 __ 3
. You can roll a number cube and let the numbers 1 and
2 represent correct answers and the numbers 3, 4, 5, and 6 represent incorrect answers.
One trial is rolling the number cube 8 times (once for each question) and determining
whether or not there are 4 or more correct answers.
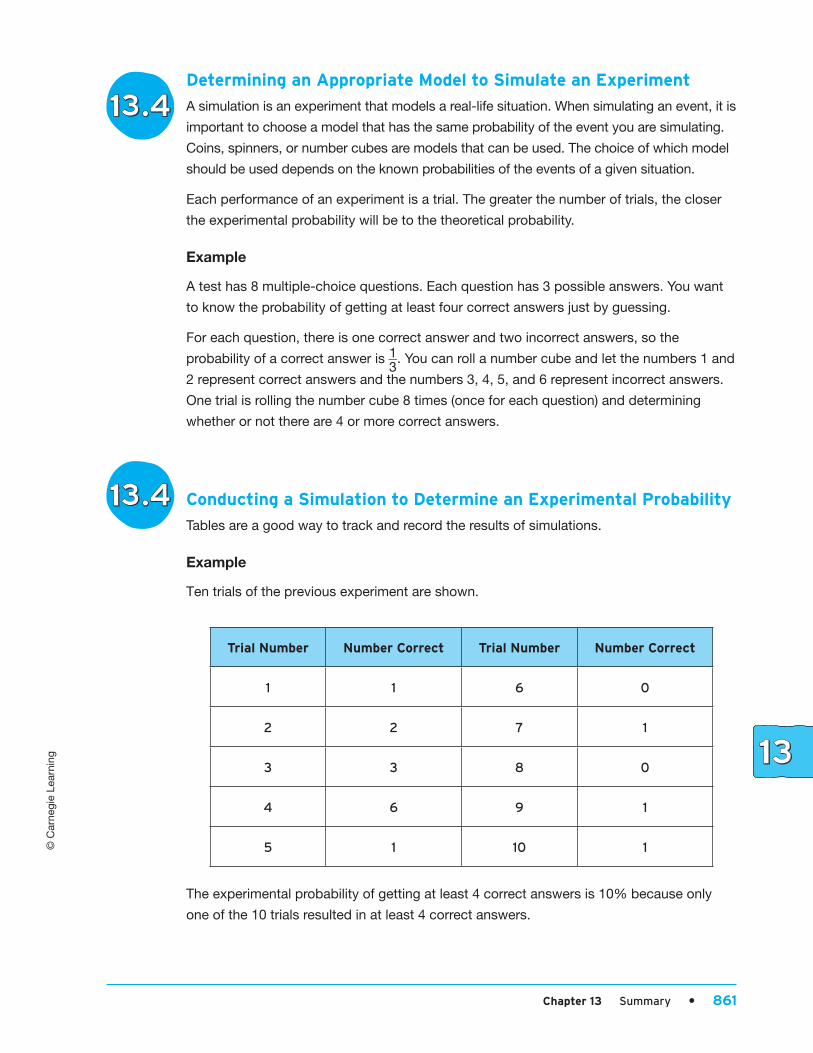
Conducting a Simulation to Determine an Experimental Probability
Tables are a good way to track and record the results of simulations.
Example
Ten trials of the previous experiment are shown.
Trial Number Number Correct Trial Number Number Correct
1 1 6 0
2 2 7 1
3 3 8 0
4 6 9 1
5 1 10 1
The experimental probability of getting at least 4 correct answers is 10% because only
one of the 10 trials resulted in at least 4 correct answers.
462345_C2_CH13_pp781-864.indd 861 28/08/13 12:47 PM
862 • Chapter 13 Introduction to Probability
© C
arne
gie
Lear
ning
Using a Spreadsheet to Perform a Simulation
A spreadsheet is a computer document that allows you to organize information in rows
and columns. Many types of functions can be entered into a spreadsheet. For simulations,
an important function is RANDBETWEEN. It randomly chooses a number in the given
range of numbers that you choose. Remember to put an equals sign before the command
to indicate that you are writing a function.
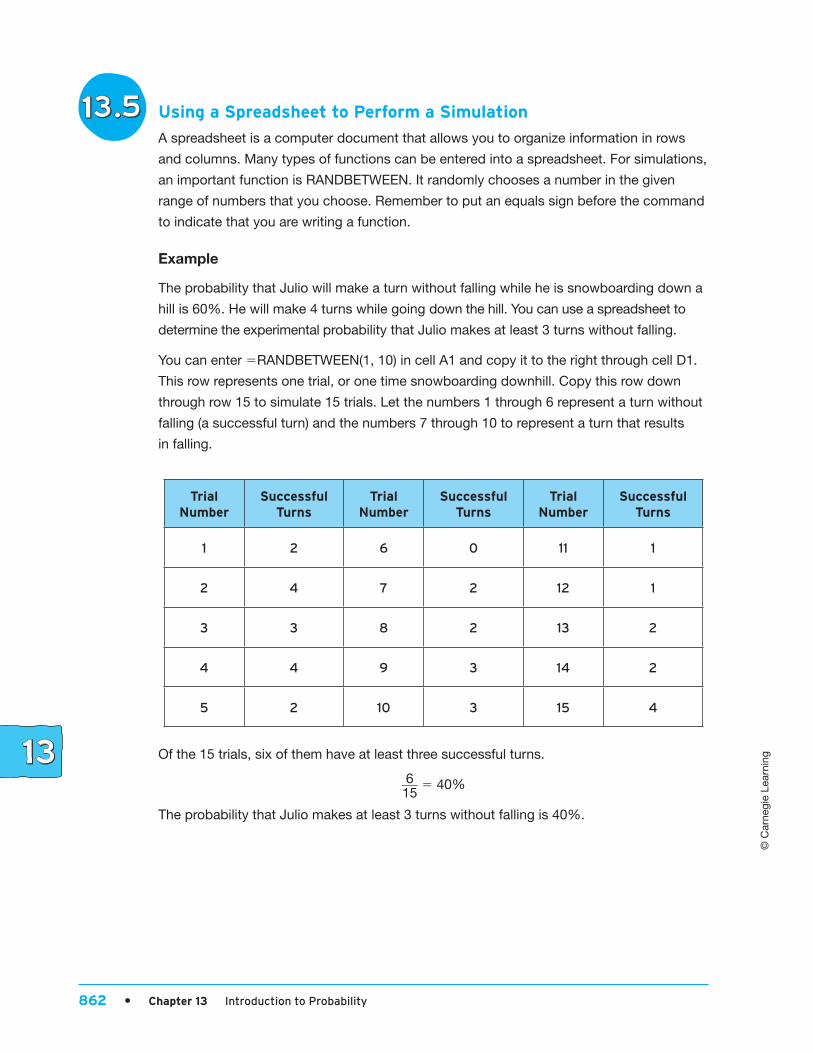
Example
The probability that Julio will make a turn without falling while he is snowboarding down a
hill is 60%. He will make 4 turns while going down the hill. You can use a spreadsheet to
determine the experimental probability that Julio makes at least 3 turns without falling.
You can enter 5RANDBETWEEN(1, 10) in cell A1 and copy it to the right through cell D1.
This row represents one trial, or one time snowboarding downhill. Copy this row down
through row 15 to simulate 15 trials. Let the numbers 1 through 6 represent a turn without
falling (a successful turn) and the numbers 7 through 10 to represent a turn that results
in falling.
Trial Number
Successful Turns
Trial Number
Successful Turns
Trial Number
Successful Turns
1 2 6 0 11 1
2 4 7 2 12 1
3 3 8 2 13 2
4 4 9 3 14 2
5 2 10 3 15 4
Of the 15 trials, six of them have at least three successful turns.
6 ___ 15
5 40%
The probability that Julio makes at least 3 turns without falling is 40%.
462345_C2_CH13_pp781-864.indd 862 28/08/13 12:47 PM
© C
arne
gie
Lear
ning
Chapter 13 Summary • 863
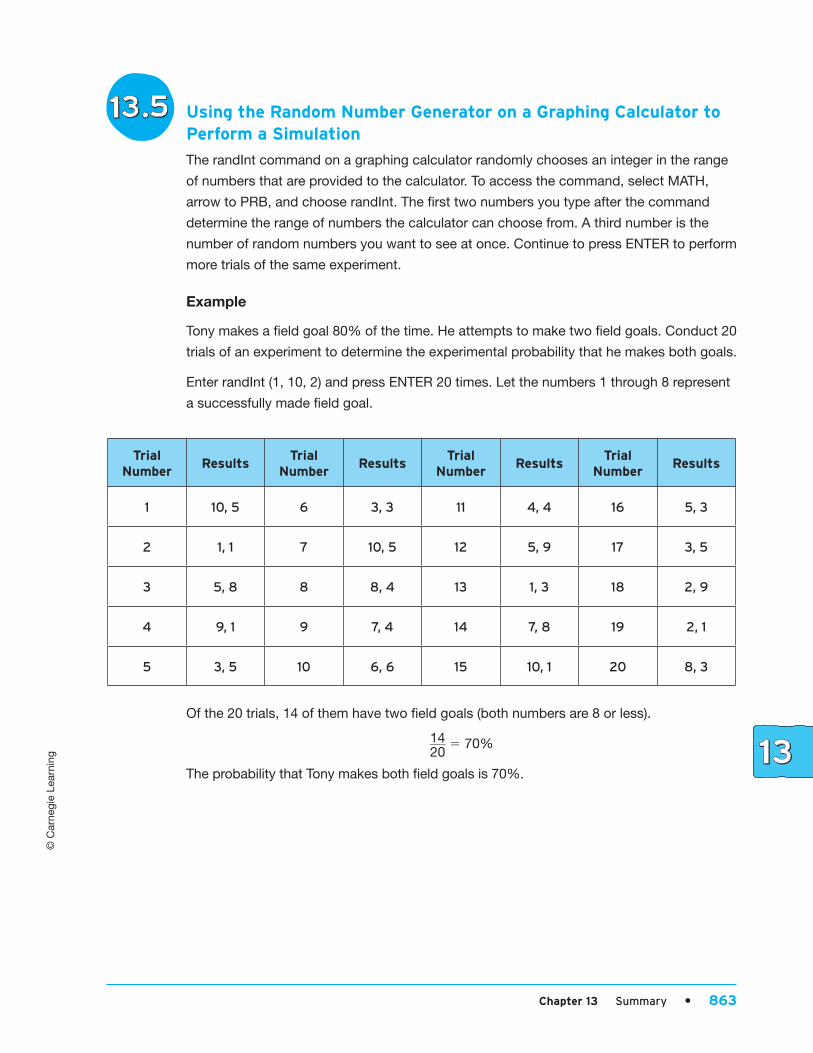
Using the Random Number Generator on a Graphing Calculator to Perform a Simulation
The randInt command on a graphing calculator randomly chooses an integer in the range
of numbers that are provided to the calculator. To access the command, select MATH,
arrow to PRB, and choose randInt. The first two numbers you type after the command
determine the range of numbers the calculator can choose from. A third number is the
number of random numbers you want to see at once. Continue to press ENTER to perform
more trials of the same experiment.
Example
Tony makes a field goal 80% of the time. He attempts to make two field goals. Conduct 20
trials of an experiment to determine the experimental probability that he makes both goals.
Enter randInt (1, 10, 2) and press ENTER 20 times. Let the numbers 1 through 8 represent
a successfully made field goal.
Trial Number
ResultsTrial
NumberResults
Trial Number
ResultsTrial
NumberResults
1 10, 5 6 3, 3 11 4, 4 16 5, 3
2 1, 1 7 10, 5 12 5, 9 17 3, 5
3 5, 8 8 8, 4 13 1, 3 18 2, 9
4 9, 1 9 7, 4 14 7, 8 19 2, 1
5 3, 5 10 6, 6 15 10, 1 20 8, 3
Of the 20 trials, 14 of them have two field goals (both numbers are 8 or less).
14 ___ 20
5 70%
The probability that Tony makes both field goals is 70%.
462345_C2_CH13_pp781-864.indd 863 28/08/13 12:47 PM
864 • Chapter 13 Introduction to Probability
© C
arne
gie
Lear
ning
Using the Probability Simulation App on a Graphing Calculator
To access the Probability Simulation App, press the APPS key on a graphing calculator
and scroll down to Prob Sim. There are 6 types of simulations. All work in a similar fashion
by allowing you to set up the simulation as needed. You can show your results in a graph
or table.
Example
The probability that Henrik performs a gymnastics routine without error is 1 __ 3
.
The steps below describe how to use Pick Marbles and Spin Spinner to simulate
his routine.
Pick Marbles: Choose two types of marbles. Let Type A represent a routine without error
and Type B represent a routine with error. Set the number of Type A marbles to 1 and the
number of Type B marbles to 2 to match the given probability.
Spin Spinner: Set the spinner so that there are three congruent sections. Let section 1
represent a routine without error and sections 2 and 3 represent a routine with error.
462345_C2_CH13_pp781-864.indd 864 28/08/13 12:47 PM