introduction to power consumption in digital integrated...
TRANSCRIPT

Introduction to Power Consumptionin Digital Integrated Circuits
Arnaud Tisserand
CNRS, IRISA laboratory, CAIRN research team
ECOFAC 2010Plestin les Greves
March 29th – April 2nd, 2010
Summary
• Introduction
• Power/energy consumption sources
• Power/energy reduction methods
• Examples on arithmetic operators
• Conclusion & References
A. Tisserand, CNRS–IRISA–CAIRN. Introduction to Power Consumption in Digital Integrated Circuits 2/90
Power: Orders of Magnitude
10−12 pW
10−9 nW
10−6 µW
10−3 mW
1 W
103 kW
106 MW
109 GW
1012 TW
1015 PW
total power received by the earth from the sun (170 PW)
total electric production capacity worldwide in 2007 (4.4 TW)France peak consumption in 2009 (92 GW)Three Gorges dam in China (18 GW)nuclear power plant “slice” (900 MW)
Google data center (20 MW)ENIAC computer in 1946 (150 kW)
electric heater (2 kW)high-performance microprocessor Xeon X3470 2.4 GHz (95 W)low-power microprocessor VIA C7 1.2 GHz (5 W)
16-bit MCU TI MSP430-2xx active 3V 16 MIPS (250 µA/MIPS)
65 nm NAND2-D2 HP @ 100 MHz dynamic power (1.2 µW/MHz)65 nm NAND2-D2 HP static power (15 µW)quartz wristwatch (1 µW)
8-bit MCU sleep mode (10 nW)
human cell (1 pW)
A. Tisserand, CNRS–IRISA–CAIRN. Introduction to Power Consumption in Digital Integrated Circuits 3/90
Electric Energy Cost for Households
US$/kWh
0
0.05
0.10
0.15
0.20
0.25
0.30
year19
9920
0020
0120
0220
0320
0420
0520
0620
07
France
Canada
Denmark
Germany
United States
United Kingdom
Switzerland
Source: US Energy Information Administration. Aug. 2008
Electricity cost (EDF) in France, February/March 2010:
• 0.0839 e/kWh day rate
• 0.0519 e/kWh “night” rate
• 6.54 e/month for a small house
A. Tisserand, CNRS–IRISA–CAIRN. Introduction to Power Consumption in Digital Integrated Circuits 4/90

Electricity Consumption Worldwide 1980–2006PWh
2
4
6
8
10
12
14
16
0year
1980
1985
1990
1995
2000
2005
total
North America
Europe
Eurasia
Asia & Oceania
Central&South AmericaMiddle EastAfrica
Source: US Energy Information Administration, Forecasts & Analysis.
http://www.eia.doe.gov
year 1980 1985 1990 1995 2000 2005world population [Gp] 4.435 4.831 5.263 5.674 6.070 6.454
A. Tisserand, CNRS–IRISA–CAIRN. Introduction to Power Consumption in Digital Integrated Circuits 5/90
Electric Consumption Forecasts
PWh
4
8
12
16
20
24
28
32
0year
2006
2010
2015
2020
2025
2030
total, world
renewables, world
total, OECD
renewables, OECD
total, non-OECD
renewables, non-OECD
World population: 6.5 Gp in 2005 −→ 8.2 Gp in 2030 (expected value)
Source: US International Energy Outlook 2009. Energy Information Administration Office of
Integrated Analysis and Forecasting U.S. Department of Energy. May 2009,
http://www.eia.doe.gov/oiaf/ieo/index.html
A. Tisserand, CNRS–IRISA–CAIRN. Introduction to Power Consumption in Digital Integrated Circuits 6/90
Energy Production and Consumption in France
TWh
50
100
150
200
250
300
350
400
450
500
550
0year
1970
1975
1980
1985
1990
1995
2000
200520
0620
07
Mp
50
52
54
56
58
60
62
popul.
production
consumption
leakageimport
export
Source: Production-distribution de l’energie electrique en France et dans les regions en 2005
et 2006. Rapport du Commissariat general au developpement durable
A. Tisserand, CNRS–IRISA–CAIRN. Introduction to Power Consumption in Digital Integrated Circuits 7/90
Energy Production and Consumption in French Regions
TWh
0
20
40
60
80
100
120
Alsace
Aquitain
e
Auverg
ne
Basse
-Nor
man
die
Bourg
ogne
Breta
gne
Centr
e
Champag
ne-Ard
enne
Corse
Franch
e-Com
te
Hau
te-N
orm
andie
Ile-d
e-Fra
nce
Langu
edoc-
Rouss
illon
Limou
sin
Lorra
ine
Mid
i-Pyr
enee
s
Nor
d-Pas
-de-
Calai
s
Pays-
de-la
-Loi
re
Picar
die
Poito
u-Char
ente
s
Prove
nce-A
lpes
-Cot
e-Azu
r
Rhone-
Alpes
production consumption
Source: Production-distribution de l’energie electrique en France et dans les regions en 2005
et 2006. Rapport du Commissariat general au developpement durable
A. Tisserand, CNRS–IRISA–CAIRN. Introduction to Power Consumption in Digital Integrated Circuits 8/90

Power Production, Distribution and Consumption in France
2007 data:
• total energy production: 544 433 GWh
• nuclear energy production: 418 609 GWh
• coal + fuel oil energy production: 58 359 GWh
• hydroelectric + wind energy production: 67 465 GWh
• nuclear power capacity: 63 260 MW
• nuclear production time: 418 609×100063 260 ≈ 6617 h
• number of hours per year: 365.25 j× 24 h/j = 8766 h
2006 data:
• length of power lines: 705 517 km (LV) + 734 527 km (H&MV)
• Earth to Moon average distance: 384 403 km
Source: Production-distribution de l’energie electrique en France et dans les regions en 2005
et 2006. Rapport du Commissariat general au developpement durable
A. Tisserand, CNRS–IRISA–CAIRN. Introduction to Power Consumption in Digital Integrated Circuits 9/90
Power Production and Consumption in France
2009 data:
• energy consumptionI total: 486.4 TWh (−1.6 % 2009 / 2008)I leakage: 33.6 TWh
• energy productionI total: 518.8 TWhI nuclear: 390.0 TWhI coal + fuel oil: 54.8 TWhI hydroelectric: 61.8 TWhI wind: 7.8 TWhI other renewable energies: 4.4 TWh
• January 7th (very cold day, −7.8 oC / avg. temp.)I max. energy consumption: 2 037 GWhI max. power consumption: 92.4 GW
Source: L’energie electrique en France. Plaquette 2009 RTE (Reseau de transport
d’electricite). Valeurs provisoires
A. Tisserand, CNRS–IRISA–CAIRN. Introduction to Power Consumption in Digital Integrated Circuits 10/90
Power Consumption and Production in France (GW)
h0 2 4 6 8 10 12 14 16 18 20 22 24
GW
0
10
20
30
40
50
60
70
80
90
Jan. 5th, consumptionJan. 5th, total production
Jan. 5th, nuclear prod.
Jan. 5th, coal prod.Jan. 5th, fuel oil prod.
Jan. 5th, hydroelectric prod.
Jan. 7th, consumption
Sep. 22th, consumptionSep. 20th, consumption
date nuclear coal fuel oil hydroelectric totalTue. 2009-01-05 20h 57.5 6.8 2.2 14.2 80.9Sun. 2009-09-20 20h 39.1 2.0 0.0 3.9 45.1Tue. 2009-09-22 20h 42.5 4.8 0.0 4.3 51.7
Source: RTE (Reseau de transport d’electricite) http://www.rte-france.com/
A. Tisserand, CNRS–IRISA–CAIRN. Introduction to Power Consumption in Digital Integrated Circuits 11/90
Standby Power
product avg. standby power [W]
mobile phone charger 0.26
LCD computer display 1.38
desktop computer 21.13
notebook computer 15.77
laser printer 1.58
CD player 5.04
DVD player 1.55
microwave oven (door closed) 3.08
US values:
• 5—11 % of total electricity consumption
• 10 G$ electricity cost
• 40 products/household
Source: Lawrence Berkeley National Laboratory
http://standby.lbl.gov/summary-table.html
A. Tisserand, CNRS–IRISA–CAIRN. Introduction to Power Consumption in Digital Integrated Circuits 12/90
Power Consumption of US Servers and Data Centers
2006 data:
• all servers and data centers: 61 TWh (≈ 1.5 % US electricity)I cost 4.5 G$I requires 7 GW production (≈ 15 base-load power plants)I > consumption by nation’s color televisionsI consumption of ≈ 5.8 million average US householdsI 2× energy consumption in 2000 for this purpose
• federal servers and data centers: ≈ 6 TWh
• power and cooling infrastructure ≈ 50 % total consumption
• forecasts for 2011:I 2× energy (cost 7.4 G$)I would require 12 GW production and an additional 10 power plants
Source: Report to Congress on Server and Data Center Energy Efficiency. US Environmental
Protection Agency (EPA). Aug. 2007
A. Tisserand, CNRS–IRISA–CAIRN. Introduction to Power Consumption in Digital Integrated Circuits 13/90
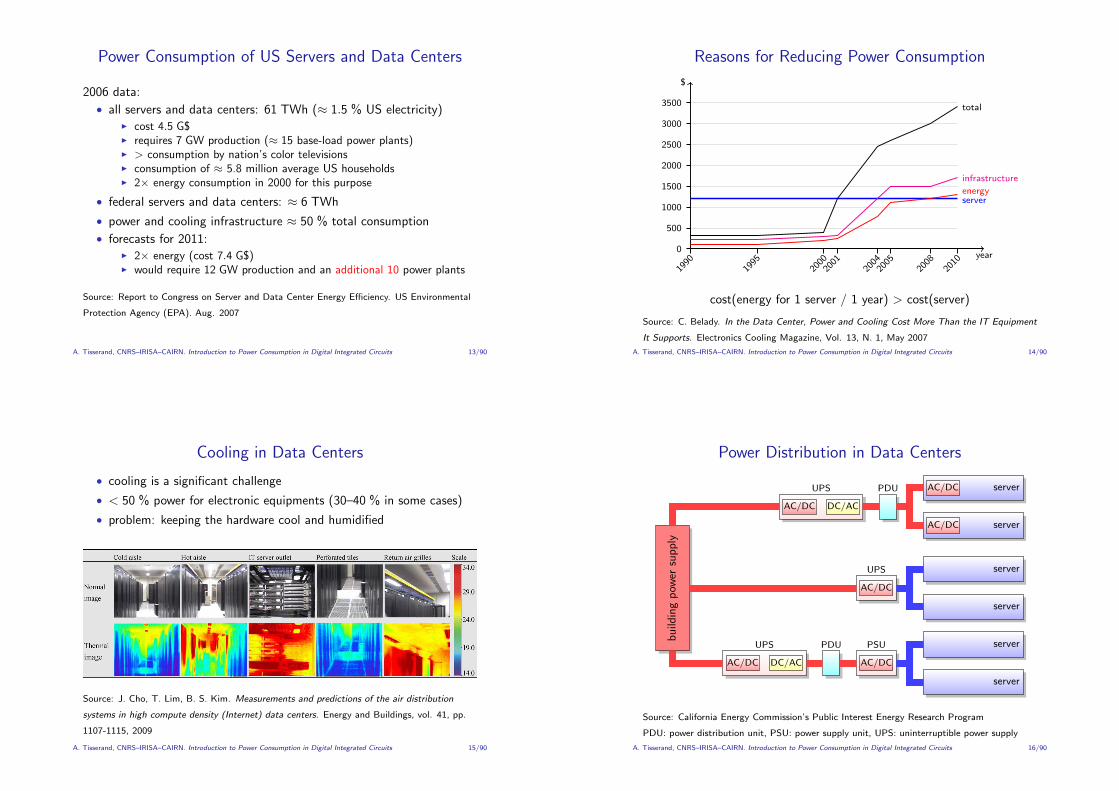
Reasons for Reducing Power Consumption
year
1990
1995
2000
2001
2004
2005
2008
2010
$
0
500
1000
1500
2000
2500
3000
3500
server
total
infrastructure
energy
cost(energy for 1 server / 1 year) > cost(server)
Source: C. Belady. In the Data Center, Power and Cooling Cost More Than the IT Equipment
It Supports. Electronics Cooling Magazine, Vol. 13, N. 1, May 2007
A. Tisserand, CNRS–IRISA–CAIRN. Introduction to Power Consumption in Digital Integrated Circuits 14/90
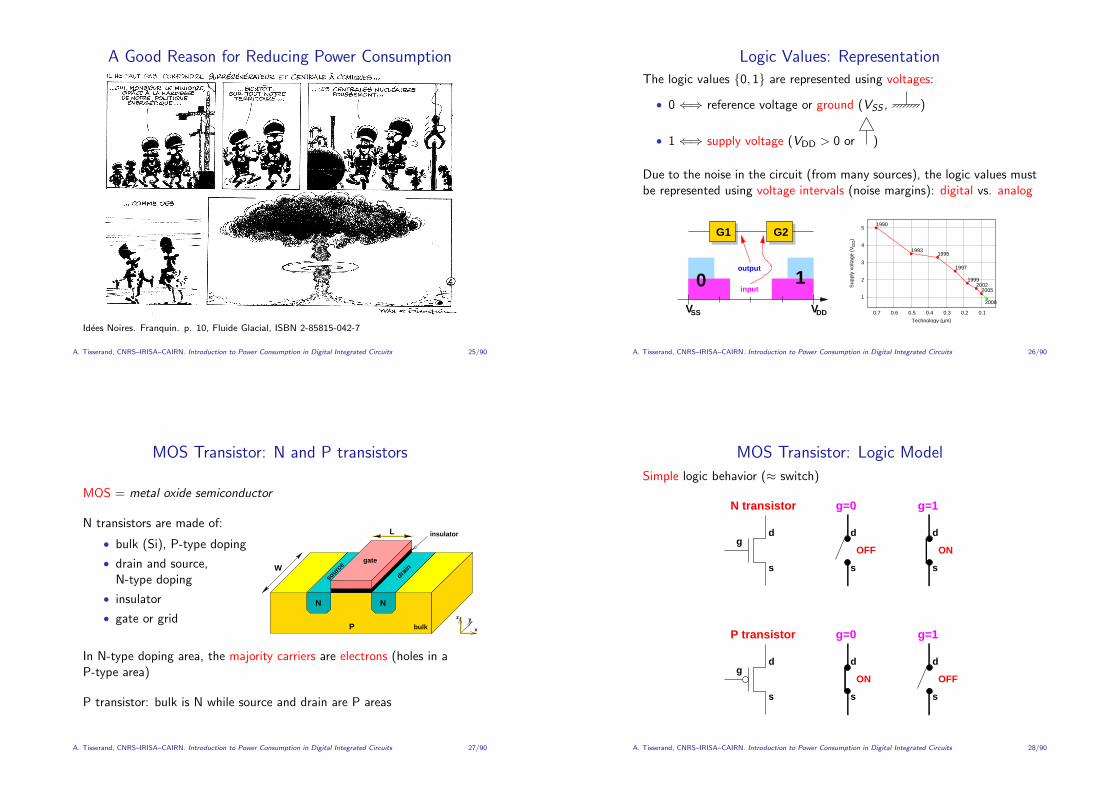
Cooling in Data Centers
• cooling is a significant challenge
• < 50 % power for electronic equipments (30–40 % in some cases)
• problem: keeping the hardware cool and humidified
Source: J. Cho, T. Lim, B. S. Kim. Measurements and predictions of the air distribution
systems in high compute density (Internet) data centers. Energy and Buildings, vol. 41, pp.
1107-1115, 2009
A. Tisserand, CNRS–IRISA–CAIRN. Introduction to Power Consumption in Digital Integrated Circuits 15/90
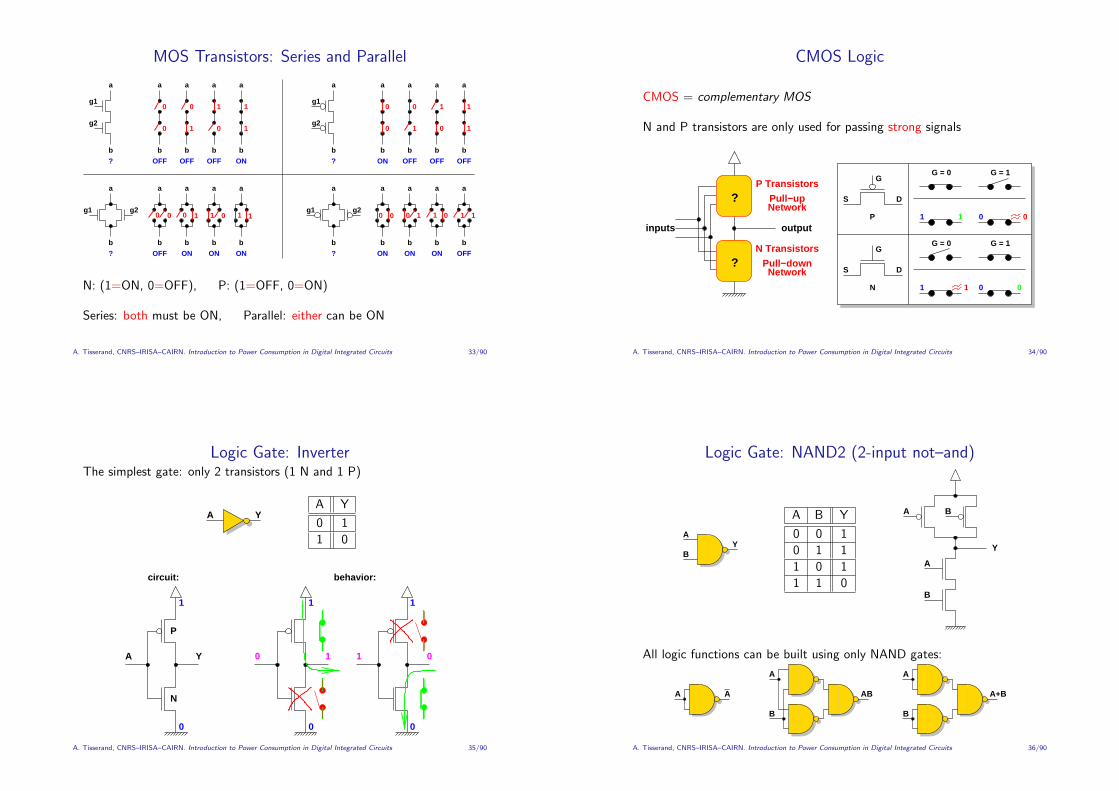
Power Distribution in Data Centers
bu
ildin
gp
ower
sup
ply
serverAC/DC
serverAC/DC
server
server
server
server
UPS
AC/DC DC/AC
PDU
UPS
AC/DC
UPS
AC/DC DC/AC
PDU PSU
AC/DC
Source: California Energy Commission’s Public Interest Energy Research Program
PDU: power distribution unit, PSU: power supply unit, UPS: uninterruptible power supply
A. Tisserand, CNRS–IRISA–CAIRN. Introduction to Power Consumption in Digital Integrated Circuits 16/90

Supercomputing Sites
rank site country # cores perf. power Wcore
MFlopsW
TFlops kW
1 ORNL USA 224 162 1 759 6 950 31 2532 LANL USA 122 400 1 042 2 345 19 4443 NICS USA 98 928 8314 FZJ Germany 294 912 825 2 268 8 3645 NSCCT China 71 680 5636 NASA USA 56 320 544 2 348 42 2327 LLNL USA 212 992 478 2 329 11 2058 ANL USA 163 840 458 1 260 8 3649 TACC USA 62 976 433 2 000 32 217
28 CINES France 12 288 128 608 49 21129 LANL USA 14 400 126 276 19 45830 NICS USA 17 956 125 888 49 141
32 IDRIS France 40 960 119 315 8 37933 ECMWF UK 8 320 115 1 329 160 8735 DKRZ Germany 8 064 115 1 288 160 90
Source: Nov. 2009 values from http://www.top500.org
A. Tisserand, CNRS–IRISA–CAIRN. Introduction to Power Consumption in Digital Integrated Circuits 17/90
Supercomputing Sites: Green500 View
rank1 50 100 150 200 250 300 350 400 450 500
MFlops/W
0
100
200
300
400
500
600
700
800top500 rank
2
54,8
16 9 7
10
Source: Nov. 2009 values from http://www.green500.org/
A. Tisserand, CNRS–IRISA–CAIRN. Introduction to Power Consumption in Digital Integrated Circuits 18/90
Power Consumption of Typical Server in a Data Center
component power [W]
CPU 80memory 36
disks 12peripheral 50
motherboard 25fan 10
leakage 38
total 251
251× 24× 365.25 = 2200 kWh/year
2200× 0.0839 = 184 e/year
A. Tisserand, CNRS–IRISA–CAIRN. Introduction to Power Consumption in Digital Integrated Circuits 19/90
Google Examples
Data centers:
• 450 000 servers
• 20–100 PFLOPS
• 20 MW
• 2 M$ electricity charges per month
One query:
• 4.5 Wh average energy
• 2–8 Wh typical energy range
Source: www.google.com query: google power consumption
A. Tisserand, CNRS–IRISA–CAIRN. Introduction to Power Consumption in Digital Integrated Circuits 20/90

Typical PC Power Consumption
Energy Calculator PC Equipment:http://www.eu-energystar.org/en/en_008b.shtml
Assumptions: active energy saving modes, 0.0839 e/kWh
computer type use standby avg. power costh/day kWh/year e/year
small PC + 17” LCD 8 16 68 5.7
multimedia PC + 24” LCD 8 16 172 14.4
HPC workstation + 24” LCD 8 16 346 29.0
small server 24 0 274 23.0
ultra-portable 13” 8 16 18 1.5
notebook 17” 8 16 46 3.9
P. Huber. Dig more coal – the PCs are coming. Forbes, May 1999
A. Tisserand, CNRS–IRISA–CAIRN. Introduction to Power Consumption in Digital Integrated Circuits 21/90
Electromigration• high current density movement of atoms in a conductor• mean time to failure (MTTF) of a wire, Black’s equation:
MTTF = A× J−n × eEakT
A section, J current density, n ≈ 2 scale factor (cst), Ea activation energy (cst for a
material), k Boltzmann’s constant, T temperature
• decreases IC reliability (permanent and intermittent failures)
e
A. Tisserand, CNRS–IRISA–CAIRN. Introduction to Power Consumption in Digital Integrated Circuits 22/90
Electromagnetic Interferences (EMI)Electromagnetic emissions from a device or system (the culprit orattacker) that interfere with the normal operation of another device orsystem (the victim)
time
current
thermography 80C51 MCU by Philips
synchronous (left), asynchronous (right)
Electromagnetic compatibility (EMC):
• ability to avoid introducing intolerable electromagnetic disturbance
• circuit specific design rules
A. Tisserand, CNRS–IRISA–CAIRN. Introduction to Power Consumption in Digital Integrated Circuits 23/90
CoolingProblems due to temperature:
• performance decreases with temperature
25 oC → 105 oC 30 % performance reduction• reliability decreases with temperature
IC temperature > 125 oC faults and characteristics damage
Solutions:
• reduce power consumption
• cool circuits (air, water,...)
A. Tisserand, CNRS–IRISA–CAIRN. Introduction to Power Consumption in Digital Integrated Circuits 24/90
A Good Reason for Reducing Power Consumption
Idees Noires. Franquin. p. 10, Fluide Glacial, ISBN 2-85815-042-7
A. Tisserand, CNRS–IRISA–CAIRN. Introduction to Power Consumption in Digital Integrated Circuits 25/90
Logic Values: Representation
The logic values {0, 1} are represented using voltages:
• 0 ⇐⇒ reference voltage or ground (VSS , )
• 1 ⇐⇒ supply voltage (VDD > 0 or )
Due to the noise in the circuit (from many sources), the logic values mustbe represented using voltage intervals (noise margins): digital vs. analog
VSS VDD
output
input0 1
G2G1
1
2
3
4
5
0.1 0.2 0.3 0.4 0.5 0.6 0.7
Sup
ply
volta
ge (
VD
D)
Technology (µm)
1990
19931995
1997
19992002
2005
2008
A. Tisserand, CNRS–IRISA–CAIRN. Introduction to Power Consumption in Digital Integrated Circuits 26/90
MOS Transistor: N and P transistors
MOS = metal oxide semiconductor
N transistors are made of:
• bulk (Si), P-type doping
• drain and source,N-type doping
• insulator
• gate or grid z y
x
L
W
P
N N
drain
sourc
egate
bulk
insulator
In N-type doping area, the majority carriers are electrons (holes in aP-type area)
P transistor: bulk is N while source and drain are P areas
A. Tisserand, CNRS–IRISA–CAIRN. Introduction to Power Consumption in Digital Integrated Circuits 27/90
MOS Transistor: Logic Model
Simple logic behavior (≈ switch)
d
s s s
d dg
d d d
sss
g
P transistor
N transistor g=0 g=1
g=0 g=1
OFF ON
ON OFF
A. Tisserand, CNRS–IRISA–CAIRN. Introduction to Power Consumption in Digital Integrated Circuits 28/90

MOS Transistor: Simple Model
Current/Voltage (I/V) characteristic:
I =
8><>:0 VG < VT
β“
(VG − VT )VD − VD2
2
”0 < VD < VG − VT
β2
(VG − VT )2 0 < VG − VT < VD
where
β = Ctechno ×W
L
I
V
V = 1.3V
V = 1.0VG
G
V = 0.8VG
D
Threshold voltage: VT
3 modes of operation: cutoff, linear and saturation
A. Tisserand, CNRS–IRISA–CAIRN. Introduction to Power Consumption in Digital Integrated Circuits 29/90
MOS Transistor: Electrical Simulation Model
Spice model for an N transistor in technology 0.18µm from TSMC (106parameters, source: www.mosis.org) :
.MODEL CMOSN NMOS ( LEVEL = 49
+VERSION = 3.1 TNOM = 27 TOX = 4E-9
+XJ = 1E-7 NCH = 2.3549E17 VTH0 = 0.3618568
+K1 = 0.5821674 K2 = 2.962352E-3 K3 = 1E-3
+K3B = 3.1746246 W0 = 1E-7 NLX = 1.784411E-7
+DVT0W = 0 DVT1W = 0 DVT2W = 0
+DVT0 = 1.0776375 DVT1 = 0.3574214 DVT2 = 0.0606977
+U0 = 257.825805 UA = -1.445098E-9 UB = 2.280431E-18
+UC = 5.132975E-11 VSAT = 1.002296E5 A0 = 1.9572227
+AGS = 0.4279783 B0 = 1.291312E-8 B1 = 6.025607E-7
+KETA = -0.0112723 A1 = 3.225587E-4 A2 = 0.8886833
+RDSW = 105 PRWG = 0.5 PRWB = -0.2
+WR = 1 WINT = 0 LINT = 1.345391E-8
+XL = 0 XW = -1E-8 DWG = -1.012269E-8
+DWB = 8.38965E-9 VOFF = -0.090305 NFACTOR = 2.2452365
+CIT = 0 CDSC = 2.4E-4 CDSCD = 0
+CDSCB = 0 ETA0 = 3.37666E-3 ETAB = 1.141951E-5
+DSUB = 0.017061 PCLM = 0.7636672 PDIBLC1 = 0.1793189...
A. Tisserand, CNRS–IRISA–CAIRN. Introduction to Power Consumption in Digital Integrated Circuits 30/90
MOS Transistor: Imperfect Switch
N Transistor:
output
0
0
0
1
STRONG 0input output
input
P Transistor:
output
output
1
0
1input
input1
STRONG 1
DEGRADED 1
DEGRADED 0
0 1
STRONG close to VSS close to VDD
DEGRADED greater than VSS less than VDD
N transistor pull no higher than VDD − VTN
P transistor pull no lower than |VTP|
A. Tisserand, CNRS–IRISA–CAIRN. Introduction to Power Consumption in Digital Integrated Circuits 31/90
MOS Transistor: Imperfect Switch Simulation
Vin Vout
1
0
0.5
1
1.5
2
2.5
0 25 50 75 100
Vol
tage
[V]
Time[µs]
Vin Vout
Techno.: 0.25µm, VDD = 2.5 V , W = 0.72µm, L = 0.24µm,VTN
≈ 0.37 V
A. Tisserand, CNRS–IRISA–CAIRN. Introduction to Power Consumption in Digital Integrated Circuits 32/90
MOS Transistors: Series and Parallel
0
0
0
0
1 1
11g2
g1
a a
b
a aa
b b b b
?
0
0
0
0
1 1
11g2
g1
a a
b
a aa
b b b b
OFF ONOFF OFF? ON OFF OFF OFF
g1 g2
b
a
? OFF
a a a a
b b b b
ONONON
g1 g2
b
a
?
a a a a
b b b b
ONON
0 0 0 1 1 0 1 1 0 0 0 1 1 0 1 1
OFFON
N: (1=ON, 0=OFF), P: (1=OFF, 0=ON)
Series: both must be ON, Parallel: either can be ON
A. Tisserand, CNRS–IRISA–CAIRN. Introduction to Power Consumption in Digital Integrated Circuits 33/90
CMOS Logic
CMOS = complementary MOS
N and P transistors are only used for passing strong signals
0
1
G = 1G = 0
1 01
G = 0 G = 1
01 0
outputinputs
?
?
S D
G
P
S D
G
N
NetworkPull−up
P Transistors
N Transistors
Pull−downNetwork
A. Tisserand, CNRS–IRISA–CAIRN. Introduction to Power Consumption in Digital Integrated Circuits 34/90
Logic Gate: InverterThe simplest gate: only 2 transistors (1 N and 1 P)
A YA Y
0 1
1 0
P
N
1 1 1
0 0 0
0 1 1 0
circuit: behavior:
A Y
A. Tisserand, CNRS–IRISA–CAIRN. Introduction to Power Consumption in Digital Integrated Circuits 35/90
Logic Gate: NAND2 (2-input not–and)
A
BY
A B Y
0 0 1
0 1 1
1 0 1
1 1 0
BA
A
B
Y
All logic functions can be built using only NAND gates:
A
B
AB
A
B
A+BA A
A. Tisserand, CNRS–IRISA–CAIRN. Introduction to Power Consumption in Digital Integrated Circuits 36/90

Logic Gate: NOR2 (2-input not–or)
A
BY
A B Y
0 0 1
0 1 0
1 0 0
1 1 0
A
B
BA
Y
A. Tisserand, CNRS–IRISA–CAIRN. Introduction to Power Consumption in Digital Integrated Circuits 37/90
Logic Gate: AND2There is a very bad solution and a good one. . .
BA
D G
ATE
A
B
BA
Y
A
B
A
BY Y
• the bad one (left side): some output levels are degraded
• the good one (right side): AB = AB (6-transistor gate)
A. Tisserand, CNRS–IRISA–CAIRN. Introduction to Power Consumption in Digital Integrated Circuits 38/90
Logic Gate: NAND3 (3-input NAND)
A
B
C
Y
A B C Y
0 0 0 1
0 0 1 1
0 1 0 1
0 1 1 1
1 0 0 1
1 0 1 1
1 1 0 1
1 1 1 0
A
B
A B C
C
Y
The number of transistors in series is limited (3 to 5)
A. Tisserand, CNRS–IRISA–CAIRN. Introduction to Power Consumption in Digital Integrated Circuits 39/90
Fanout
The gate delay (change output state) de-pends on the output load. Fanout measuresthis load as the number of inputs of gateconnected to the output (normalized w.r.t.an inverter)
FO = 4
0
0.1
0.2
0.3
0.4
0.5
0.6
0.7
0.8
1 2 3 4 5 6 7 8 9 10
Del
ay [n
s]
FO
INV X1 (R)INV X1 (F)INV X4 (R)INV X4 (F)
0
0.2
0.4
0.6
0.8
1
1 2 3 4 5 6 7 8 9 10
Del
ay [n
s]
FO
NAND2 (R)NAND2 (F)NAND3 (R)NAND3 (F)NAND4 (R)NAND4 (F)
A. Tisserand, CNRS–IRISA–CAIRN. Introduction to Power Consumption in Digital Integrated Circuits 40/90

Signal regeneration
Buffers are used to regenerated the signal levels (f (x) = x)
BUF X1 WL
4.751
2.751
4.751
2.751
A
BUF X4
4.751
2.751 1
119
A
11OUT OUT
BUF X1 BUF X4
size (h×l) [λ] 53 × 25 53 × 50capacitance [fF] 5.89 5.89
T0→1 11 + 439 × Cout 17 + 132 × Cout
T1→0 12 + 318 × Cout 21 + 137 × Cout
A. Tisserand, CNRS–IRISA–CAIRN. Introduction to Power Consumption in Digital Integrated Circuits 41/90
Fast Circuit Design: Basic Ideas
• VDD ↗ =⇒ speed↗ but limited by the technology
• Transistor size :I W ↗ =⇒ speed↗ GOOD
I L↗ =⇒ speed↘ BAD
I but W ↗ =⇒ C ↗ =⇒ speed↘
Transistor Sizing
• Topology
• Logic optimizations
• Place and route optimizations
• Algorithms, data coding. . .
A. Tisserand, CNRS–IRISA–CAIRN. Introduction to Power Consumption in Digital Integrated Circuits 42/90
Transistor Sizing: N and P Mobility DifferenceThe mobility of holes in silicon is typically lower than that of electronsµ = µN/µP ∈ [2, 3]
a
a
b
b
a
aa b
b
a
NAND2
INV
NOR2
y
y
out
2
1
2 2
2
2
4
4
1 1
1
1
1
1
1 1 1
1
1 1WL
1
1
1
1
1
1
12
1
2
2
2
4
4
1
1
Symmetric behavior: same current for both N and P transistor networks( same rising and falling times): W
L = µ = µNµP
A. Tisserand, CNRS–IRISA–CAIRN. Introduction to Power Consumption in Digital Integrated Circuits 43/90
Transistor SizingCurrent behavior (higher I =⇒ faster gate): I = β × f (VG ,VD ,VT )where the transistor gain is: β = Ctechno × W
L
C
C
C
C
W=1w
W=2w
W=4w
W=8w
Vin
0
0.5
1
1.5
2
2.5
0 0.5 1 1.5 20
30
60
90
120
150
Vol
tage
[V]
Cur
rent
[nA
]
Time [µs]
Vin=VT
VT
VinI(1w)
I(2w)I(4w)
I(8w)
A. Tisserand, CNRS–IRISA–CAIRN. Introduction to Power Consumption in Digital Integrated Circuits 44/90
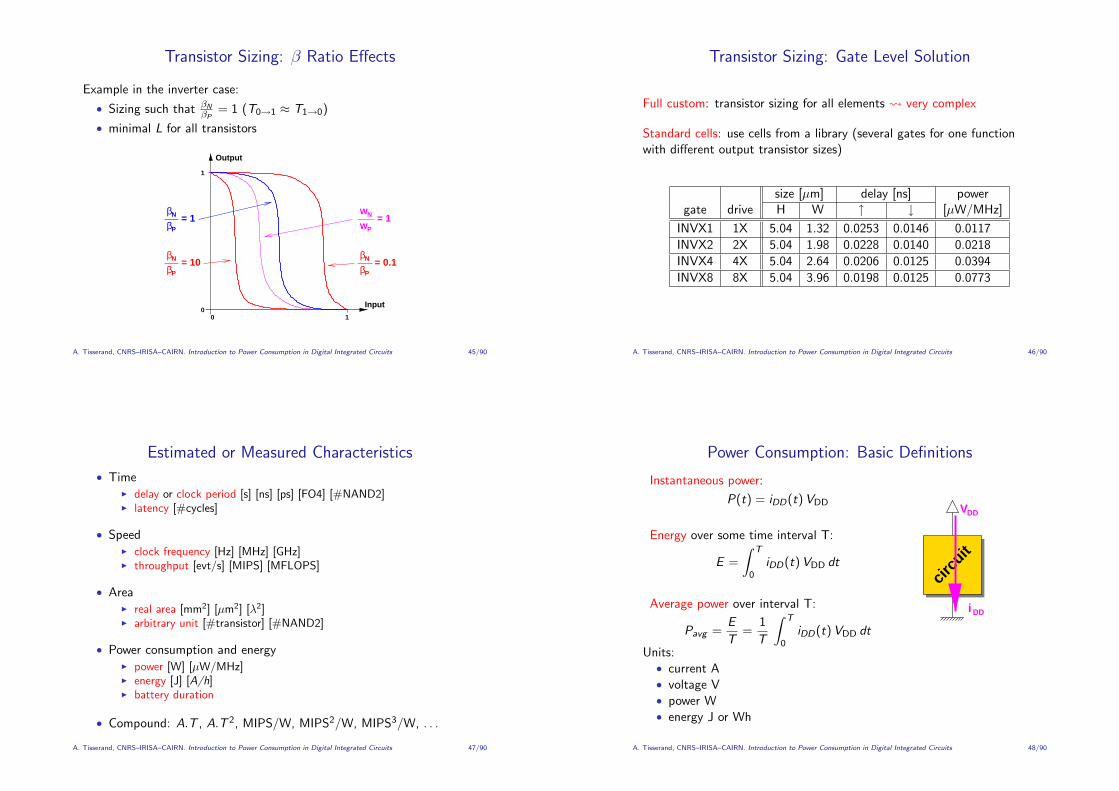
Transistor Sizing: β Ratio Effects
Example in the inverter case:
• Sizing such that βNβP
= 1 (T0→1 ≈ T1→0)
• minimal L for all transistors
βN
βP
ββ
N
P
ββ
N
P
00
1
1
= 10
= 1WN
WP
= 1
= 0.1
Output
Input
A. Tisserand, CNRS–IRISA–CAIRN. Introduction to Power Consumption in Digital Integrated Circuits 45/90
Transistor Sizing: Gate Level Solution
Full custom: transistor sizing for all elements very complex
Standard cells: use cells from a library (several gates for one functionwith different output transistor sizes)
size [µm] delay [ns] powergate drive H W ↑ ↓ [µW/MHz]
INVX1 1X 5.04 1.32 0.0253 0.0146 0.0117
INVX2 2X 5.04 1.98 0.0228 0.0140 0.0218
INVX4 4X 5.04 2.64 0.0206 0.0125 0.0394
INVX8 8X 5.04 3.96 0.0198 0.0125 0.0773
A. Tisserand, CNRS–IRISA–CAIRN. Introduction to Power Consumption in Digital Integrated Circuits 46/90
Estimated or Measured Characteristics
• TimeI delay or clock period [s] [ns] [ps] [FO4] [#NAND2]I latency [#cycles]
• SpeedI clock frequency [Hz] [MHz] [GHz]I throughput [evt/s] [MIPS] [MFLOPS]
• AreaI real area [mm2] [µm2] [λ2]I arbitrary unit [#transistor] [#NAND2]
• Power consumption and energyI power [W] [µW/MHz]I energy [J] [A/h]I battery duration
• Compound: A.T , A.T 2, MIPS/W, MIPS2/W, MIPS3/W, . . .
A. Tisserand, CNRS–IRISA–CAIRN. Introduction to Power Consumption in Digital Integrated Circuits 47/90
Power Consumption: Basic Definitions
Instantaneous power:
P(t) = iDD(t) VDD
Energy over some time interval T:
E =
∫ T
0iDD(t) VDD dt
Average power over interval T:
Pavg =E
T=
1
T
∫ T
0iDD(t) VDD dt
VDD
i DD
circu
it
Units:• current A• voltage V• power W• energy J or Wh
A. Tisserand, CNRS–IRISA–CAIRN. Introduction to Power Consumption in Digital Integrated Circuits 48/90

Power Consumption: Components
Power dissipation in CMOS circuits comes from 2 main components:
• static dissipation:I sub-threshold conduction through OFF transistorsI leakage current through P-N junctionsI tunneling current through gate oxideI . . .
• dynamic dissipation:I charging and discharging of load capacitances (useful + parasitic)I short-circuit current
Ptotal = Pstatic + Pdynamic
A. Tisserand, CNRS–IRISA–CAIRN. Introduction to Power Consumption in Digital Integrated Circuits 49/90
Leakage Current(s)
• leakage current in P-N junctions: I = Is(eqV /kT − 1)E
S
transistor Ptransistor N
p
nppnn
• sub-threshold leakage
type of transistor sub-threshold leakage current
HP high performance 100 nA/µmLOP low-operation power 5 nA/µmLSTP low-standby power 50 pA/µm
• gate leakage by tunneling
Solution: use “better” technologies
A. Tisserand, CNRS–IRISA–CAIRN. Introduction to Power Consumption in Digital Integrated Circuits 50/90
Short-Circuit Current in CMOS Gates
Occurs when both N and P transistors are ON while the input switches
P
N
In Out
t
t
V
II
In
SCsc
Solution : short transition (crisp edges)
A. Tisserand, CNRS–IRISA–CAIRN. Introduction to Power Consumption in Digital Integrated Circuits 51/90
Reducing Short-Circuit Current
low slope (gradient) huge short-circuit current
material copper aluminum tungsten
width (µm) 1 0.59 1 0.36 0.25
raising time (ps) 20 7 13 2 0.4
t
V
R
C
R
C
R
C
R
C
t
V
input output
A. Tisserand, CNRS–IRISA–CAIRN. Introduction to Power Consumption in Digital Integrated Circuits 52/90

Charging and Discharging Load Capacitances
There are capacitances everywhere in the circuit: transistor gate, routing,parasitics. . .
CMOSgate gates
routing
parasitic
Solutions:
• design small circuits (small transistor, short wires, technologyshrinking)
• reduce the activity (algorithms, data coding, sleep mode)
• reduce VDD(without lowering speed)
A. Tisserand, CNRS–IRISA–CAIRN. Introduction to Power Consumption in Digital Integrated Circuits 53/90
Capacitances are Everywhere (1/2)
• Capacitance due to transistors structure:
n n silicon
oxide
metal
• Capacitance due to routing:
x
yz
DA
B
C
M1
M2
VIA
A. Tisserand, CNRS–IRISA–CAIRN. Introduction to Power Consumption in Digital Integrated Circuits 54/90
Capacitances are Everywhere (2/2)
• Parasitic capacitance:
M1
M2
M3
M2
• I/O pad huge capacitance:
to package
output pad
buffer
driving gate
A. Tisserand, CNRS–IRISA–CAIRN. Introduction to Power Consumption in Digital Integrated Circuits 55/90
Transitions
There are 2 kinds of transitions:
• useful transitions (data switching)
• redundant or parasitic transitions (imperfections)
a=1
b=1
c
a
b
c
s
a
b
s
y y
A. Tisserand, CNRS–IRISA–CAIRN. Introduction to Power Consumption in Digital Integrated Circuits 56/90

Simple Power Consumption Model
Average dynamic power dissipation (no leakage, no short circuit):
P = α× C × f × V 2DD
where
• α is the activity factor
• C is the average switched capacitance (at each cycle)
• f is the circuit frequency
• VDDis the supply voltage
Remark: the gate delay is d = γ × C×VDD(VDD−VT )2 ≈ 1
VDD
A. Tisserand, CNRS–IRISA–CAIRN. Introduction to Power Consumption in Digital Integrated Circuits 57/90
Power/Energy Reduction
Typical methods:
• use better algorithms and data structures
• use better technology
• use smaller gates
• use better placement and routing
• reduce power supply VDD
• reduce frequency
• reduce activity
• . . .
Use combinations at all levels
A. Tisserand, CNRS–IRISA–CAIRN. Introduction to Power Consumption in Digital Integrated Circuits 58/90
Power Reduction at Technology Level
• reduce the wire dimensions reduce capacitances
• use better insulators
example: SiO2 −→ high k insulators: Al2O3,HfO2,TiO2,ZrO2. . .
• use technologies with less leakage, e.g. SOI (silicon on insulator)
+ + +−−− + −
oxide insulator
n n p p
S
E
p np p
p
nn
A. Tisserand, CNRS–IRISA–CAIRN. Introduction to Power Consumption in Digital Integrated Circuits 59/90
Power Reduction at Transistor Level
Higher threshold voltage VT :
• leads to lower leakage current
• leads to slower transistor
Idea: use multiple VT (2 or 3 in current technologies)
• lower VT for high-speed gates
• higher VT for gates off the critical path
critical path
low VT high VT
in1
in2
out1
out2
a b c d e
f
g
Example: 70 nm, VDD = 0.8 V, VTL= 0.2 V, VTH
= 0.3 VA. Tisserand, CNRS–IRISA–CAIRN. Introduction to Power Consumption in Digital Integrated Circuits 60/90

Power Reduction at Gate Level
• gate and/or input reordering (reduce glitching power):Solution 1
Solution 21
s1
i
2
s2
s2
s1
i 2
i 1
i
c
b
a
t
b
c
b
a
a
c
• use complex gates (reduce internal capacitances and area):
AND3OR2
AND2
AND2
AND2
OR2
AND2
A. Tisserand, CNRS–IRISA–CAIRN. Introduction to Power Consumption in Digital Integrated Circuits 61/90
Power Supply Reduction
• Multiple VDD: adapt supply voltage to block speed
circuit
low VDD high VDD
• Power gating: cut the supply of unused blocks
block
VDD
s
GND
• Dynamic Voltage/Frequency Scaling (DVFS)
A. Tisserand, CNRS–IRISA–CAIRN. Introduction to Power Consumption in Digital Integrated Circuits 62/90
Power Reduction: Clock GatingFacts:
• latching uses 25–50 % of total power
• but only 10–30 % are useful at one moment (avg.)
Idea: gate off unused latches and associated logic
Example:
gated clockclk
enable
A. Tisserand, CNRS–IRISA–CAIRN. Introduction to Power Consumption in Digital Integrated Circuits 63/90
Power Reduction: Activity Reduction
• Data encoding (number representations for arithmetic operators)
• Bus encodingbus (large capacitances)circuit (low capacitances)
A. Tisserand, CNRS–IRISA–CAIRN. Introduction to Power Consumption in Digital Integrated Circuits 64/90

Low-Power Design: Parallelism
Idea: reduce supply voltage VDDwithout speed degradation
B CA
total supply circuit
solution capa. voltage freq. power consumption
standard (A) C V f PA = CV 2f
parallel (B) 2.2 C 0.6 V 0.5 f PB = 2.2C(0.6V )20.5f = 0.396 PA
pipeline (C) 1.2 C 0.6 V f PC = 1.2C(0.6V )2f = 0.432 PA
Problem: area ↗ =⇒ static current ↗
A. Tisserand, CNRS–IRISA–CAIRN. Introduction to Power Consumption in Digital Integrated Circuits 65/90
Processors Power Efficiency
Source:J. G. KoomeyOutperforming Moore’s LawIEEE Spectrum magazineVol. 47, n. 3, March 2010
Thanks to Daniel Chillet for the link
A. Tisserand, CNRS–IRISA–CAIRN. Introduction to Power Consumption in Digital Integrated Circuits 66/90
Predicting the Future: RoadmapInternational Technology Roadmap for Semiconductors (ITRS)http://public.itrs.net/
Semiconductor Industry Association (SIA)
Source: CMOS VLSI Design: A Circuits and Systems Perspective. N. Weste and D. Harris,
3rd ed., 2004, Addison Wesley. (extract from ITRS 2002 edition)
year 2001 2004 2007 2010 2013 2016
size [nm] 130 90 65 45 32 22
VDD[V] 1.1–1.2 1–1.2 0.7–1.1 0.6–1.0 0.5–0.9 0.4–0.9
MT/die 193 385 773 1564 3092 6184
Wire levels 8–10 9–13 10–14 10–14 11–15 11–15
I/O signals 1024 1024 1024 1280 1408 1472
Frequency [MHz] 1684 3990 6739 11511 19348 28751
FO4 delays/cycle 13.7 8.4 6.8 5.8 4.8 4.7
Max. power [W] 130 160 190 218 251 288
DRAM size [Gb] 0.5 1 4 8 32 64
A. Tisserand, CNRS–IRISA–CAIRN. Introduction to Power Consumption in Digital Integrated Circuits 67/90
ITRS 2009 Edition
High-performance processor and ASIC expected features:year 2009 2010 2011 2012 2013 2014 2015 2020
size [nm] 29 27 24 22 20 18 17 10.7
HP VDD[V] 1.0 0.97 0.93 0.9 0.87 0.84 0.81 0.68
LP VDD[V] 0.95 0.95 0.85 0.85 0.80 0.80 0.75 0.65
MT/chip 2 212 2 212 4 424 4 424 8 848 8 848 8 848 35 391
ML 12 12 12 12 13 13 13 14
# pckg pins 4 620 4 851 5 094 5 348 5 616 5 896 6 191 7 902
Freq. [MHz] 5 454 5 875 6 329 6 817 7 344 7 911 8 522 12 361
MaxPw [W] 143 146 161 158 149 152 143 130
DRAM [Gb] 2.15 2.15 4.29 4.29 4.29 8.59 8.59 34.36
size: physical gate length, HP: high performance, LP: low power, ML:metal layers, Freq.: local clock, MaxPw: maximum power with heatsink
Source: http://public.itrs.net/Links/2009ITRS/Home2009.htm
A. Tisserand, CNRS–IRISA–CAIRN. Introduction to Power Consumption in Digital Integrated Circuits 68/90

ITRS 2009: Wafer Production Technology Capacity
Source: http://public.itrs.net/Links/2009ITRS/Home2009.htm
A. Tisserand, CNRS–IRISA–CAIRN. Introduction to Power Consumption in Digital Integrated Circuits 69/90
ITRS 2009: Low-Power Efforts Evolution
Source: http://public.itrs.net/Links/2009ITRS/Home2009.htm
A. Tisserand, CNRS–IRISA–CAIRN. Introduction to Power Consumption in Digital Integrated Circuits 70/90
ITRS 2009: Failure Rate Evolution
Source: http://public.itrs.net/Links/2009ITRS/Home2009.htm
A. Tisserand, CNRS–IRISA–CAIRN. Introduction to Power Consumption in Digital Integrated Circuits 71/90
Representation(s) of Numbers and Power Consumption
Impact of the representation of numbers:
• operator speed
• circuit area
• useful and useless activity
cycle value 2’s complement tc2 sign/magnitude tsm
0 0 0000000000000000 0 0000000000000000 01 1 0000000000000001 1 0000000000000001 12 -1 1111111111111111 15 1000000000000001 13 8 0000000000001000 15 0000000000001000 34 -27 1111111111100101 15 1000000000011011 45 27 0000000000011011 15 0000000000011011 1
total 61 10
• sign/magnitude (absolute value):
A = (saan−2 . . . a1a0) = (−1)sa ×n−2Xi=0
ai 2i
• 2’s complement:A = (an−1an−2 . . . a1a0) = −an−12n−1 +
n−2Xi=0
ai 2i
A. Tisserand, CNRS–IRISA–CAIRN. Introduction to Power Consumption in Digital Integrated Circuits 72/90

Useless Activity in a Carry Ripple Adder
s s s s s s
rrrrrr
5 5 4 4 3 3 2 2 1 1 0 0
05 4 3 2 1
012345s6
ba
FA
ba
FA
ba
FA
ba
FA
ba
FA
ba
FAVery simple architecture:
n FA cells connected in series
stable
activity
FA FA FA FA FA FA
V
V
CLK
t
t
cycle i
cycle i+1
1 1 0 0 1 1 0 0 1 1 0 0
110101010101
0 1 0 1 00
0
101010 0
01010 1
01000 0
00010 1
00000 0
00000
cycle i
cycle i+1CLK
Theoretical models (equiprobable and uniform distribution of inputs):
• worst case n2/2 transitions
• average 3n/2 transitions and only n/2 useful
A. Tisserand, CNRS–IRISA–CAIRN. Introduction to Power Consumption in Digital Integrated Circuits 73/90
Fast Multipliers
1. partial products generation ai bj
(with or without recoding)↪→ delay in O(1) (fanout ai ,bj
O(log n))
2. sum of the partial productsusing a carry-save reductiontree↪→ delay in O(log n)
3. assimilation of the carries usinga fast adder↪→ delay in O(log n)
2n bits
B
A
a bi j
P
P (carry−save)
n bits
4n bits
2n bits
n bits
reduction
PP generation
Multiplication delay O(log n), area O(n2)
A. Tisserand, CNRS–IRISA–CAIRN. Introduction to Power Consumption in Digital Integrated Circuits 74/90
Power Consumption in Fast Multipliers
0
10
20
30
40
50
60
70
PP gen. reduc. assim. PP gen. reduc assim. 0
10
20
30
40
50
60
70
Rel
ativ
e po
wer
con
sum
ptio
n [%
]
Rel
ativ
e de
lay
[%]
16%
67%
17% 15%
54%
31%
power delay
• 30% to 70% of redundant transitions (useless)
• place and route steps based on the internal arrival time
• add a pipeline stage
A. Tisserand, CNRS–IRISA–CAIRN. Introduction to Power Consumption in Digital Integrated Circuits 75/90
Squarer
1 ADD(9 bits)
3 FA + 2 HA
a0 a0
a5 a5
a5
a5 a4
a4
a3
a3 a2
a2 a1
a1
a0
a0
a0
a5
a4
a2
a3
a4a3
a2 a5
a5
a4
a3
a4
a3 a5
a5
a4
a3
a2
a1
a2
a3
a4
a1 a5
a4
a3
a2
a1
a1
a2
a3
a4
a5a0
a5 a0
a3
a2
a1
a0
a1
a2
a3
a4
a4 a0
a2
a1
a0
a1
a2
a3
a3 a0
a1
a0
a1
a2
a2 a0
a0 a1
a1 a0
a5
a4 a5
a4
a1 a0a2 a0a3 a0
a2 a1
a4 a0
a3 a1
a5 a0
a4 a1
a3 a2
a5 a1
a4 a2
a5 a2
a4 a3
a5 a3a5 a4
a5
a4
a3
a2
a1
a4 a0
a3 a1
a5 a0
a4 a1
a3 a2
a5 a1
a4 a2
a5 a2
a4 a3
a5 a3
a2 a1a3 a2
a4 a3
a5 a4a5 a4
a5 a4a5 a4
a0a2 a0a3 a0
a2 a1
a1 a0
a1 a0
a0a2 a0a3 a0
a2 a1
a1 a0
a1 a0
aiai ai=
aiaj ajai aiaj+ = 2
ai
aiaj ai aiaj
aiaj aj
aiaj aiaj
aiaj ai
15 AND + 5 IAND12
1
=
=
=
2 + −
2 + ( − )
2 +
+
A. Tisserand, CNRS–IRISA–CAIRN. Introduction to Power Consumption in Digital Integrated Circuits 76/90
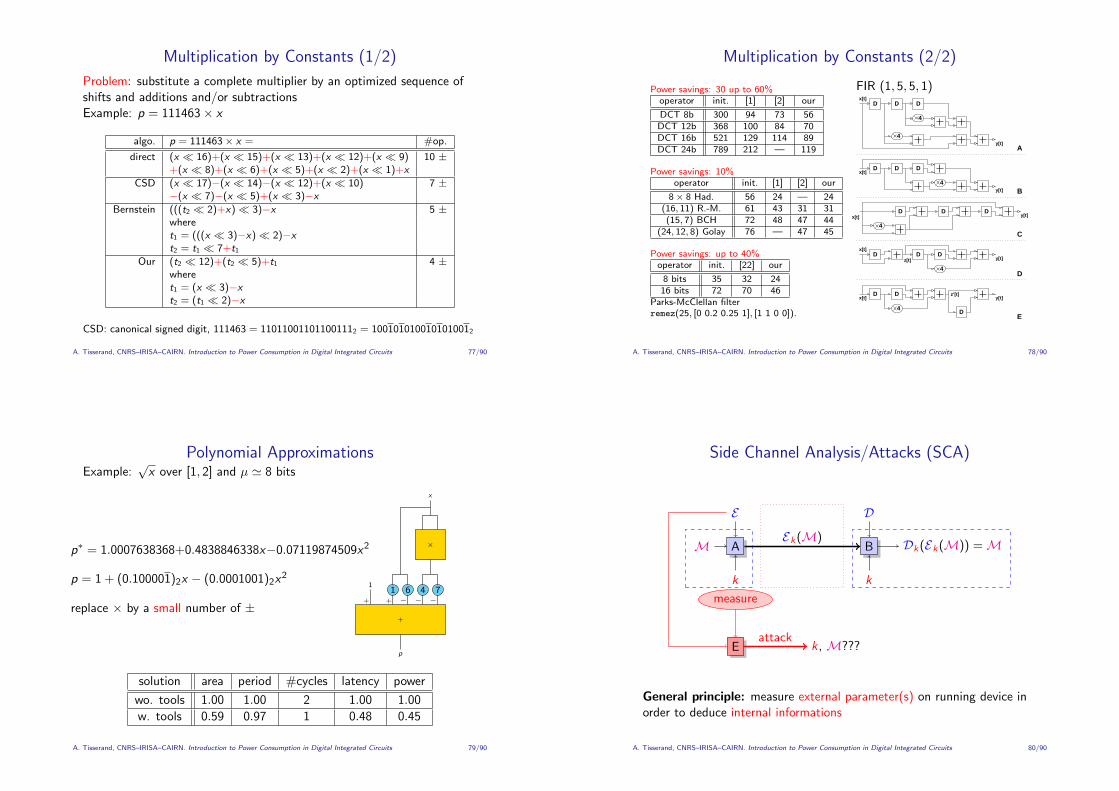
Multiplication by Constants (1/2)
Problem: substitute a complete multiplier by an optimized sequence ofshifts and additions and/or subtractionsExample: p = 111463× x
algo. p = 111463× x = #op.
direct (x � 16)+(x � 15)+(x � 13)+(x � 12)+(x � 9) 10 ±+(x � 8)+(x � 6)+(x � 5)+(x � 2)+(x � 1)+x
CSD (x � 17)−(x � 14)−(x � 12)+(x � 10) 7 ±−(x � 7)−(x � 5)+(x � 3)−x
Bernstein (((t2 � 2)+x) � 3)−x 5 ±wheret1 = (((x � 3)−x) � 2)−xt2 = t1 � 7+t1
Our (t2 � 12)+(t2 � 5)+t1 4 ±wheret1 = (x � 3)−xt2 = (t1 � 2)−x
CSD: canonical signed digit, 111463 = 110110011011001112 = 1001010100101010012
A. Tisserand, CNRS–IRISA–CAIRN. Introduction to Power Consumption in Digital Integrated Circuits 77/90
Multiplication by Constants (2/2)
Power savings: 30 up to 60%operator init. [1] [2] our
DCT 8b 300 94 73 56DCT 12b 368 100 84 70DCT 16b 521 129 114 89DCT 24b 789 212 — 119
Power savings: 10%operator init. [1] [2] our
8× 8 Had. 56 24 — 24(16, 11) R.-M. 61 43 31 31(15, 7) BCH 72 48 47 44
(24, 12, 8) Golay 76 — 47 45
Power savings: up to 40%operator init. [22] our
8 bits 35 32 2416 bits 72 70 46
Parks-McClellan filterremez(25, [0 0.2 0.25 1], [1 1 0 0]).
FIR (1, 5, 5, 1)DD D
4
4
D D D
4
D D D
4
D
D D D
4
D D
4
E
D
C
B
A
x[t]
x[t]
x[t]
x[t]
x[t]
y[t]
y[t]
y[t]
y[t]
y[t]
z[t]
z’[t]
A. Tisserand, CNRS–IRISA–CAIRN. Introduction to Power Consumption in Digital Integrated Circuits 78/90
Polynomial ApproximationsExample:
√x over [1, 2] and µ ' 8 bits
p∗ = 1.0007638368+0.4838846338x−0.07119874509x2
p = 1 + (0.100001)2x − (0.0001001)2x2
replace × by a small number of ±
×
x
1 6 4 71
+
+ + − − −
p
solution area period #cycles latency power
wo. tools 1.00 1.00 2 1.00 1.00
w. tools 0.59 0.97 1 0.48 0.45
A. Tisserand, CNRS–IRISA–CAIRN. Introduction to Power Consumption in Digital Integrated Circuits 79/90
Side Channel Analysis/Attacks (SCA)
A B
E D
M
k
Ek (M)
k
Dk (Ek (M)) =M
E
measure
k, M???attack
General principle: measure external parameter(s) on running device inorder to deduce internal informations
A. Tisserand, CNRS–IRISA–CAIRN. Introduction to Power Consumption in Digital Integrated Circuits 80/90

What Should be Measured?
Answer: everything that can “enter” and/or “get out” in/from thedevice
• power consumption
• electromagnetic radiation
• temperature
• sound
• computation time
• number of cache misses
• number and type of error messages
• ...
The measured parameters may provide informations on:
• global behavior (temperature, power, sound...)
• local behavior (EMR, # cache misses...)
A. Tisserand, CNRS–IRISA–CAIRN. Introduction to Power Consumption in Digital Integrated Circuits 81/90
Power Consumption Analysis
General principle: measure the current I in the circuit
circuit
VDD
GND
I
traces
Notations: VDD power supply (5, 3, 2.5, 1.2 V), GND ground
A. Tisserand, CNRS–IRISA–CAIRN. Introduction to Power Consumption in Digital Integrated Circuits 82/90
“Read” the Traces
1 2 3 4 5 6 7 8 9 10 11 12 13 14 15 16
• algorithm =⇒ decomposition into steps
• detect loopsI constant time for the loop iterationsI non-constant time for the loop iterations
A. Tisserand, CNRS–IRISA–CAIRN. Introduction to Power Consumption in Digital Integrated Circuits 83/90
Differences & External SignatureAn algorithm has a current signature and a time signature:
r = c0
f o r i from 1 to n doi f ai = 0 then
r = r + c1
e l s er = r × c2
I+ I×t
I
iai
1
0
2
1
3
1
4
0
5
1
6
0
7
0
8
1
T+T×t
T
A. Tisserand, CNRS–IRISA–CAIRN. Introduction to Power Consumption in Digital Integrated Circuits 84/90

Simple Power Analysis (SPA)
A. Tisserand, CNRS–IRISA–CAIRN. Introduction to Power Consumption in Digital Integrated Circuits 85/90
ConclusionABCDEFG
A
Photo source: Intel
Needs:• better technologies, transistors, gates, architectures, CAD tools• accurate power models at all levels• tools and languages to support power information
Power reduction is an interdisciplinary work:• micro-electronics• computer science• applied mathematics• applications
A. Tisserand, CNRS–IRISA–CAIRN. Introduction to Power Consumption in Digital Integrated Circuits 86/90
References (1/2)
Low-power Electronics Design
Edited by C. Piguet
2005, CRC PressISBN: 0–8493–1941–2
Micro et nanoelectroniqueBases, Composants, Circuits
H. Fanet
2006, DunodISBN: 2–10–049141–5
A. Tisserand, CNRS–IRISA–CAIRN. Introduction to Power Consumption in Digital Integrated Circuits 87/90
References (2/2)
CMOS VLSI DesignA Circuits and Systems Perspective
N. Weste and D. Harris
3rd Edition, 2004, Addison WesleyISBN: 0–321–14901–7
Logical EffortDesigning Fast CMOS Circuits
I. Sutherland, B. Sproul and D. Harris
1999, Morgan Kaufmann PublishersISBN: 1–55860–557–6
A. Tisserand, CNRS–IRISA–CAIRN. Introduction to Power Consumption in Digital Integrated Circuits 88/90

The end, some questions ?
Contact:
• mailto:[email protected]
• http://www.irisa.fr/prive/Arnaud.Tisserand/
• CAIRN Group http://www.irisa.fr/cairn/
• IRISA Laboratory, CNRS–INRIA–Univ. Rennes 16 rue Kerampont, BP 80518, F-22305 Lannion cedex, France
Thank you
A. Tisserand, CNRS–IRISA–CAIRN. Introduction to Power Consumption in Digital Integrated Circuits 89/90
We Should Work on Power Consumption Reduction...
Source:Idees NoiresFranquinp. 10, Fluide Glacial
ISBN 2-85815-042-7
A. Tisserand, CNRS–IRISA–CAIRN. Introduction to Power Consumption in Digital Integrated Circuits 90/90