introduction to performing a z/os dasd i/o subsystem ......introduction to performing a z/os dasd...
TRANSCRIPT
Intro DASD I/O Performance Check -http://www.epstrategies.com
Intro DASD I/O Performance Check - 1© Enterprise Performance Strategies, Inc.Peter Enrico : www.epstrategies.com
Introduction to Performing a z/OS DASD I/O Subsystem Performance Health Check
Instructor: Peter EnricoEmail: [email protected]: Tom BeretvasEmail: [email protected]
Enterprise Performance Strategies, Inc. 3457-53rd Avenue North, #145 Bradenton, FL 34210http://www.epstrategies.comhttp://www.pivotor.com
Voice: 813-435-2297Mobile: 941-685-6789
z/OS Performance Education, Software, and
Managed Service Providers
Intro DASD I/O Performance Check - 2© Enterprise Performance Strategies, Inc.Peter Enrico : www.epstrategies.com
Contact, Copyright, and Trademark NoticesQuestions?Send email to Peter at [email protected], or visit our website at
http://www.epstrategies.com or http://www.pivotor.com.
Copyright Notice:© Enterprise Performance Strategies, Inc. All rights reserved. No part of this material may be
reproduced, distributed, stored in a retrieval system, transmitted, displayed, published or broadcast in any form or by any means, electronic, mechanical, photocopy, recording, or otherwise, without the prior written permission of Enterprise Performance Strategies. To obtain written permission please contact Enterprise Performance Strategies, Inc. Contact information can be obtained by visiting http://www.epstrategies.com.
Trademarks:Enterprise Performance Strategies, Inc. presentation materials contain trademarks and registered trademarks of several companies.
The following are trademarks of Enterprise Performance Strategies, Inc.: Health Check®, Reductions®, Pivotor®
The following are trademarks of the International Business Machines Corporation in the United States and/or other countries: IBM®, z/OS®, zSeries® WebSphere®, CICS®, DB2®, S390®, WebSphere Application Server®, and many others.
Other trademarks and registered trademarks may exist in this presentation
Intro DASD I/O Performance Check -http://www.epstrategies.com
Intro DASD I/O Performance Check - 3© Enterprise Performance Strategies, Inc.Peter Enrico : www.epstrategies.com
Abstract and Reports Offer
Abstract
Yes- I/O does still matters.
During this session Peter Enrico will present the approach he uses when performing a DASD I/O subsystem performance analysis. During this session Peter will discuss how to look at DASD I/O performance from at DASDplex level, physical control unit level, LCU level, and logical volume level.
Peter will also discuss how to identify the problem logical volumes that are impacting the DASD I/O subsystem the most.
Intro DASD I/O Performance Check - 4© Enterprise Performance Strategies, Inc.Peter Enrico : www.epstrategies.com
Current 2012 Class Schedule
WLM Performance and Re-evaluating of Goals Instructor: Peter Enrico June 11 - 15, 2012 Saint Louis, Missouri, USA September 17 – 21, 2012 Stamford, Connecticut, USA
Essential z/OS Performance Tuning Instructor: Peter Enrico and Tom Beretvas September 10 –14, 2012 Minneapolis, Minnesota, USA
Parallel Sysplex and z/OS Performance Tuning Instructor: Peter Enrico July 17 - 19, 2012 Online August 21 – 23, 2011 Online
z/OS Capacity Planning and Performance Analysis Instructor: Ray Wicks No scheduled at this time
Intro DASD I/O Performance Check -http://www.epstrategies.com
Intro DASD I/O Performance Check - 5© Enterprise Performance Strategies, Inc.Peter Enrico : www.epstrategies.com
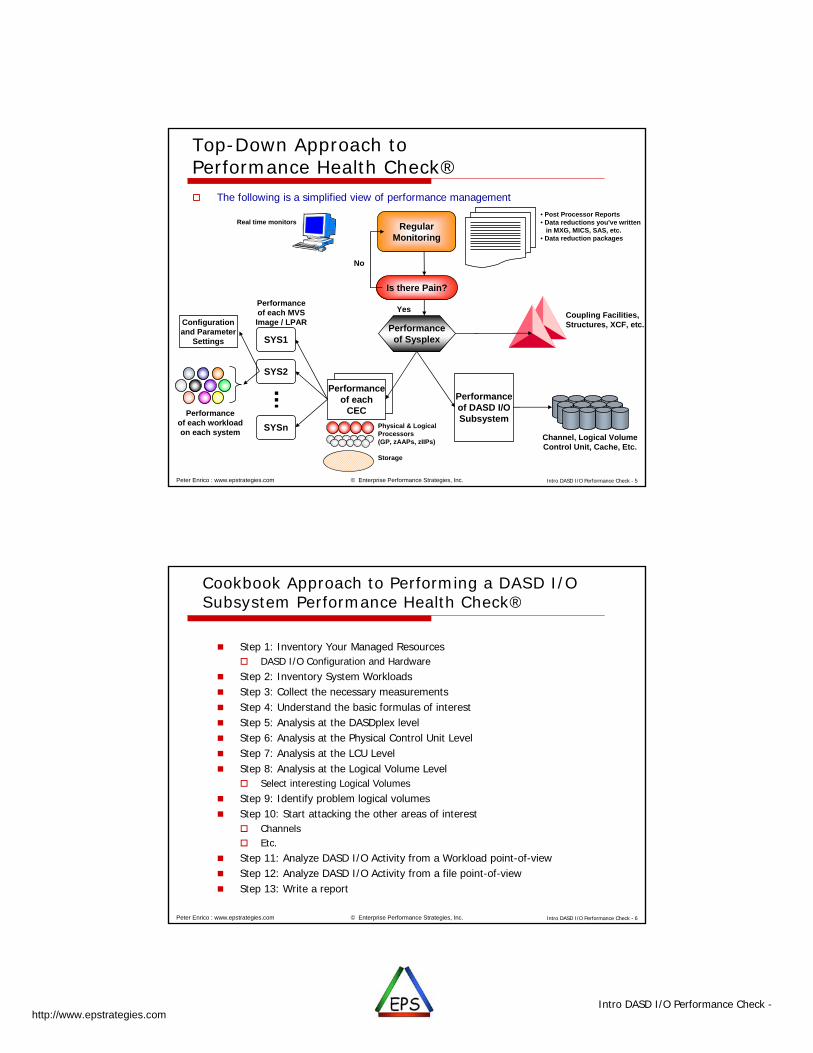
Top-Down Approach to Performance Health Check® The following is a simplified view of performance management
RegularMonitoring
Real time monitors• Post Processor Reports• Data reductions you've written
in MXG, MICS, SAS, etc.• Data reduction packages
Is there Pain?
Performanceof SysplexSYS1
SYS2
SYSn
Performanceof each
CEC
Performanceof each MVSImage / LPAR
Performanceof each workloadon each system
Performanceof DASD I/OSubsystem
Channel, Logical VolumeControl Unit, Cache, Etc.
Coupling Facilities,Structures, XCF, etc.Configuration
and ParameterSettings
Physical & LogicalProcessors(GP, zAAPs, zIIPs)
Storage
No
Yes
Intro DASD I/O Performance Check - 6© Enterprise Performance Strategies, Inc.Peter Enrico : www.epstrategies.com
Cookbook Approach to Performing a DASD I/O Subsystem Performance Health Check®
Step 1: Inventory Your Managed Resources DASD I/O Configuration and Hardware
Step 2: Inventory System Workloads Step 3: Collect the necessary measurements Step 4: Understand the basic formulas of interest Step 5: Analysis at the DASDplex level Step 6: Analysis at the Physical Control Unit Level Step 7: Analysis at the LCU Level Step 8: Analysis at the Logical Volume Level
Select interesting Logical Volumes Step 9: Identify problem logical volumes Step 10: Start attacking the other areas of interest
Channels Etc.
Step 11: Analyze DASD I/O Activity from a Workload point-of-view Step 12: Analyze DASD I/O Activity from a file point-of-view Step 13: Write a report
Intro DASD I/O Performance Check -http://www.epstrategies.com
Intro DASD I/O Performance Check - 7© Enterprise Performance Strategies, Inc.Peter Enrico : www.epstrategies.com
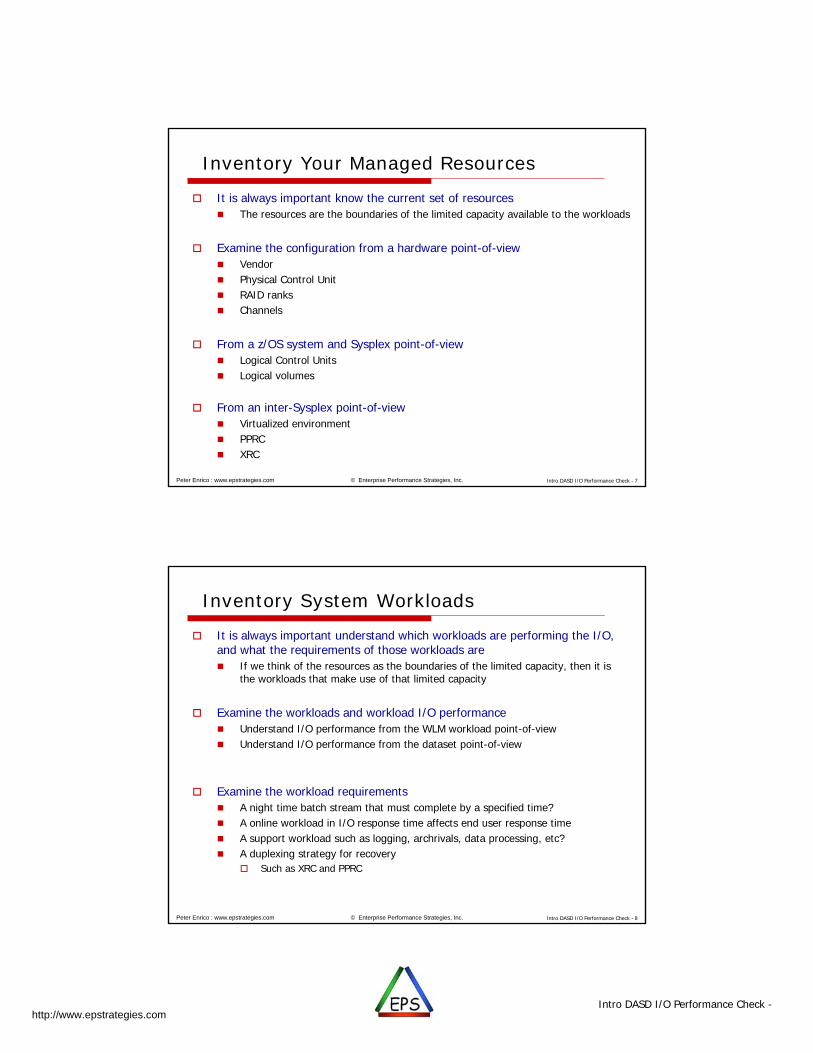
Inventory Your Managed Resources
It is always important know the current set of resources The resources are the boundaries of the limited capacity available to the workloads
Examine the configuration from a hardware point-of-view Vendor Physical Control Unit RAID ranks Channels
From a z/OS system and Sysplex point-of-view Logical Control Units Logical volumes
From an inter-Sysplex point-of-view Virtualized environment PPRC XRC
Intro DASD I/O Performance Check - 8© Enterprise Performance Strategies, Inc.Peter Enrico : www.epstrategies.com
Inventory System Workloads
It is always important understand which workloads are performing the I/O, and what the requirements of those workloads are If we think of the resources as the boundaries of the limited capacity, then it is
the workloads that make use of that limited capacity
Examine the workloads and workload I/O performance Understand I/O performance from the WLM workload point-of-view Understand I/O performance from the dataset point-of-view
Examine the workload requirements A night time batch stream that must complete by a specified time? A online workload in I/O response time affects end user response time A support workload such as logging, archrivals, data processing, etc? A duplexing strategy for recovery
Such as XRC and PPRC
Intro DASD I/O Performance Check -http://www.epstrategies.com
Intro DASD I/O Performance Check - 9© Enterprise Performance Strategies, Inc.Peter Enrico : www.epstrategies.com
Collect the Necessary Measurements
Many I/O measurements are available in standard SMF records Understanding all the measurements is beyond the scope of this presentation Some base measurements will be discussed
For a basic DASD I/O analysis from the I/O subsystem point-of-view the following SMF records are of most interest: SMF 74.1 – Device Activity measurements SMF 74.5 – Cache Control Unit measurements
Additional peripheral measurements include: SMF 73 – Channel Path Activity SMF 74.7 – FICON Director statistics
FCD switch, Port, and Connector data SMF 74.8 - Enterprise disk system statistics
Link statistics, Extent pool statistics, Rank statistics SMF 78.3 - I/O queuing activity and HyperPAV activity
Intro DASD I/O Performance Check - 10© Enterprise Performance Strategies, Inc.Peter Enrico : www.epstrategies.com
Collect the Necessary Measurements
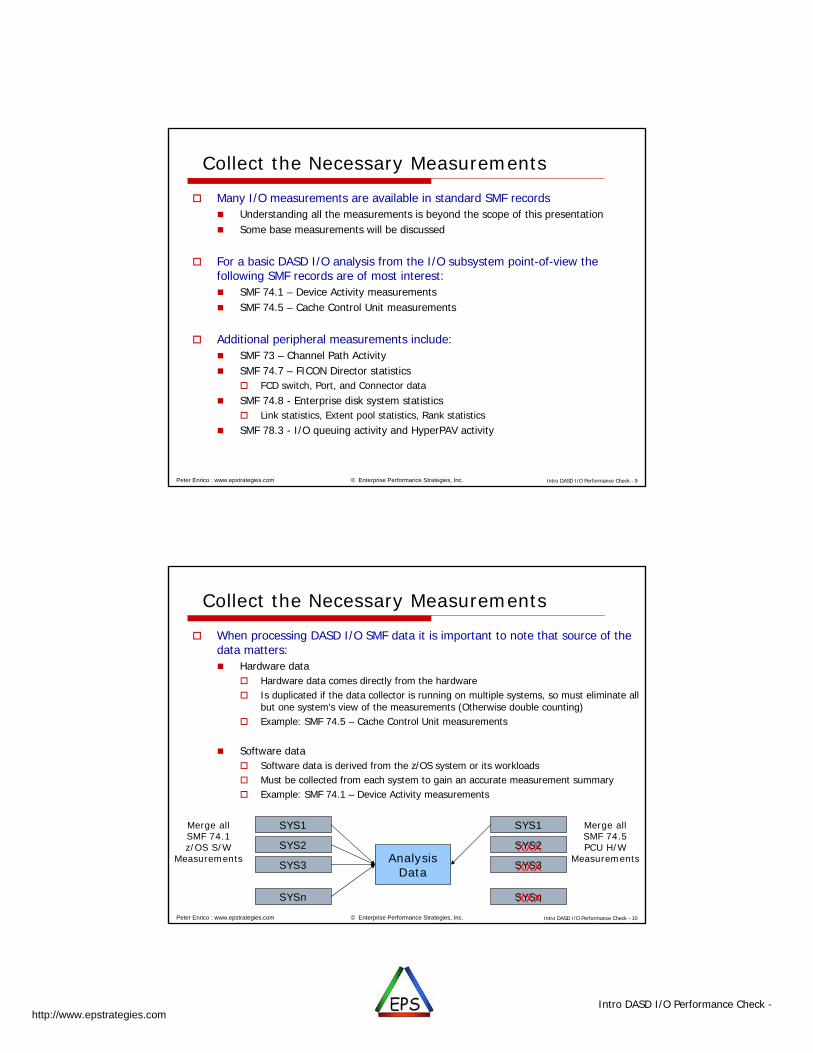
When processing DASD I/O SMF data it is important to note that source of the data matters: Hardware data
Hardware data comes directly from the hardware Is duplicated if the data collector is running on multiple systems, so must eliminate all
but one system’s view of the measurements (Otherwise double counting) Example: SMF 74.5 – Cache Control Unit measurements
Software data Software data is derived from the z/OS system or its workloads Must be collected from each system to gain an accurate measurement summary Example: SMF 74.1 – Device Activity measurements
SYS1
SYS2
SYS3
SYSn
Merge allSMF 74.1z/OS S/W
Measurements
SYS1
SYS2
SYS3
SYSn
XXXXXX
XXX
Merge allSMF 74.5PCU H/W
MeasurementsAnalysisData
Intro DASD I/O Performance Check -http://www.epstrategies.com
Intro DASD I/O Performance Check - 11© Enterprise Performance Strategies, Inc.Peter Enrico : www.epstrategies.com
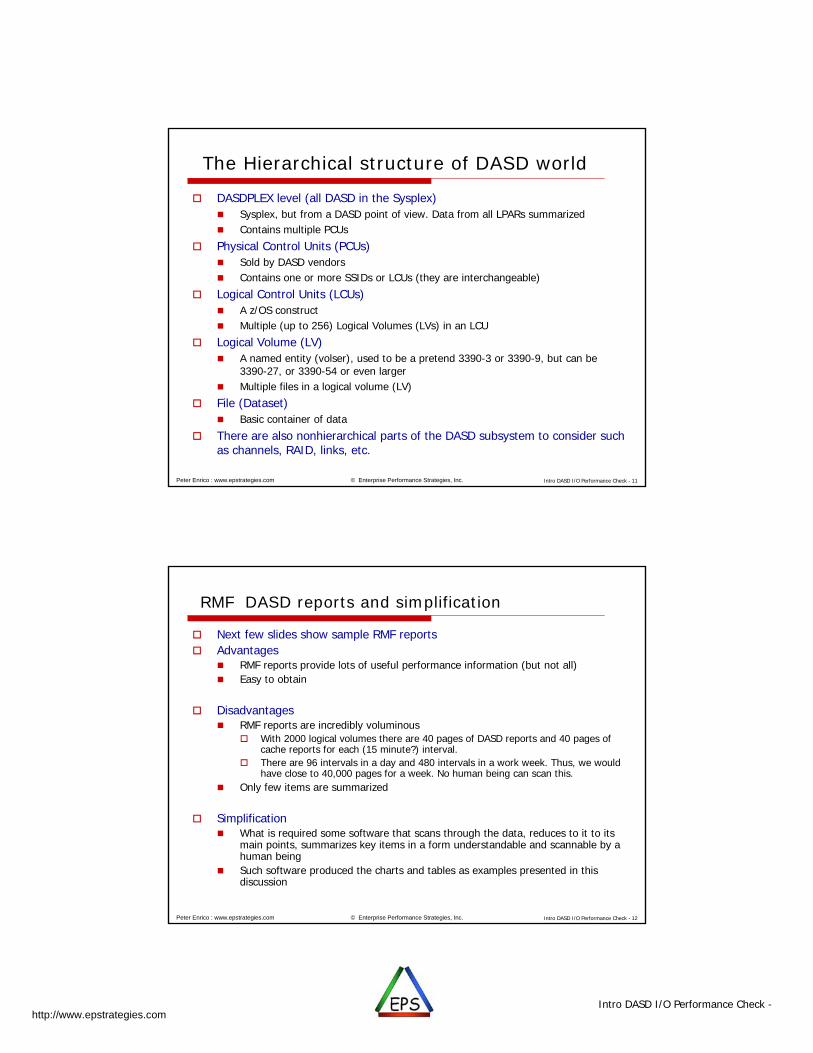
The Hierarchical structure of DASD world
DASDPLEX level (all DASD in the Sysplex) Sysplex, but from a DASD point of view. Data from all LPARs summarized Contains multiple PCUs
Physical Control Units (PCUs) Sold by DASD vendors Contains one or more SSIDs or LCUs (they are interchangeable)
Logical Control Units (LCUs) A z/OS construct Multiple (up to 256) Logical Volumes (LVs) in an LCU
Logical Volume (LV) A named entity (volser), used to be a pretend 3390-3 or 3390-9, but can be
3390-27, or 3390-54 or even larger Multiple files in a logical volume (LV)
File (Dataset) Basic container of data
There are also nonhierarchical parts of the DASD subsystem to consider such as channels, RAID, links, etc.
Intro DASD I/O Performance Check - 12© Enterprise Performance Strategies, Inc.Peter Enrico : www.epstrategies.com
RMF DASD reports and simplification
Next few slides show sample RMF reports Advantages
RMF reports provide lots of useful performance information (but not all) Easy to obtain
Disadvantages RMF reports are incredibly voluminous
With 2000 logical volumes there are 40 pages of DASD reports and 40 pages of cache reports for each (15 minute?) interval.
There are 96 intervals in a day and 480 intervals in a work week. Thus, we would have close to 40,000 pages for a week. No human being can scan this.
Only few items are summarized
Simplification What is required some software that scans through the data, reduces to it to its
main points, summarizes key items in a form understandable and scannable by a human being
Such software produced the charts and tables as examples presented in this discussion
Intro DASD I/O Performance Check -http://www.epstrategies.com
Intro DASD I/O Performance Check - 13© Enterprise Performance Strategies, Inc.Peter Enrico : www.epstrategies.com
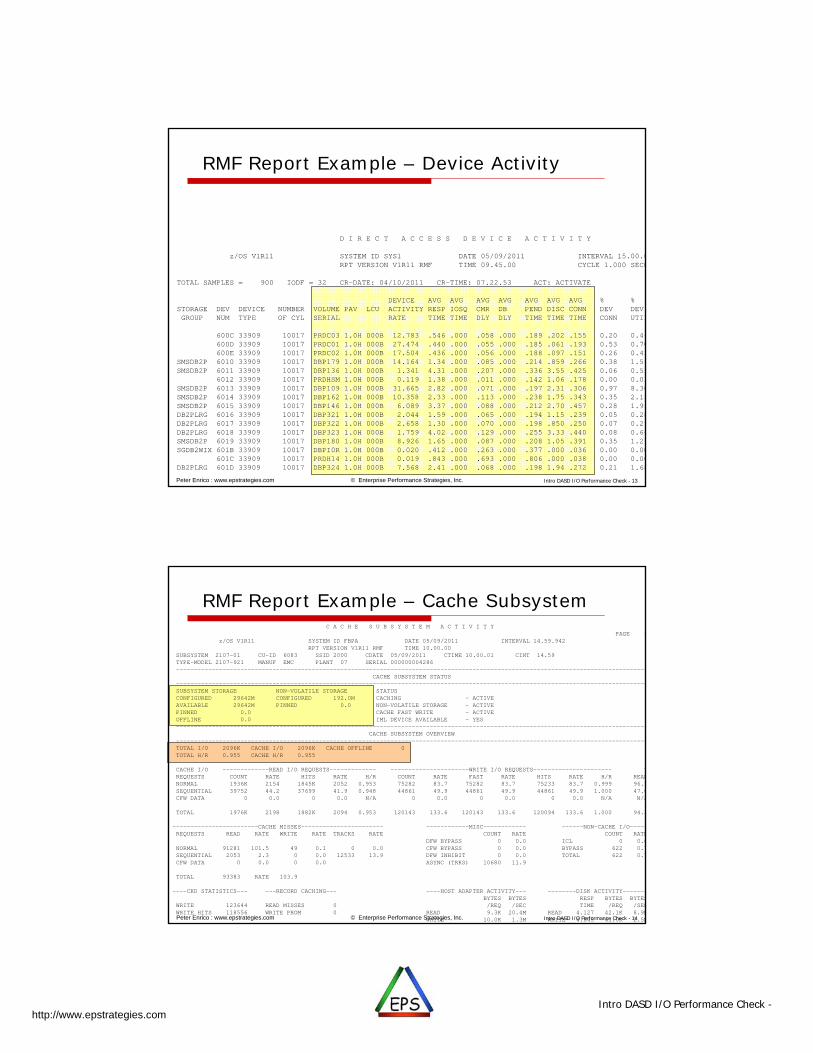
RMF Report Example – Device Activity
D I R E C T A C C E S S D E V I C E A C T I V I T Y
z/OS V1R11 SYSTEM ID SYS1 DATE 05/09/2011 INTERVAL 15.00.0RPT VERSION V1R11 RMF TIME 09.45.00 CYCLE 1.000 SECO
TOTAL SAMPLES = 900 IODF = 32 CR-DATE: 04/10/2011 CR-TIME: 07.22.53 ACT: ACTIVATE
DEVICE AVG AVG AVG AVG AVG AVG AVG % % STORAGE DEV DEVICE NUMBER VOLUME PAV LCU ACTIVITY RESP IOSQ CMR DB PEND DISC CONN DEV DEVGROUP NUM TYPE OF CYL SERIAL RATE TIME TIME DLY DLY TIME TIME TIME CONN UTIL
600C 33909 10017 PRDC03 1.0H 000B 12.783 .546 .000 .058 .000 .189 .202 .155 0.20 0.46600D 33909 10017 PRDC01 1.0H 000B 27.474 .440 .000 .055 .000 .185 .061 .193 0.53 0.70600E 33909 10017 PRDC02 1.0H 000B 17.504 .436 .000 .056 .000 .188 .097 .151 0.26 0.43
SMSDB2P 6010 33909 10017 DBP179 1.0H 000B 14.164 1.34 .000 .085 .000 .214 .859 .266 0.38 1.59SMSDB2P 6011 33909 10017 DBP136 1.0H 000B 1.341 4.31 .000 .207 .000 .336 3.55 .425 0.06 0.53
6012 33909 10017 PRDHSM 1.0H 000B 0.119 1.38 .000 .011 .000 .142 1.06 .178 0.00 0.01SMSDB2P 6013 33909 10017 DBP109 1.0H 000B 31.665 2.82 .000 .071 .000 .197 2.31 .306 0.97 8.30SMSDB2P 6014 33909 10017 DBP162 1.0H 000B 10.358 2.33 .000 .113 .000 .238 1.75 .343 0.35 2.15SMSDB2P 6015 33909 10017 DBP146 1.0H 000B 6.089 3.37 .000 .088 .000 .212 2.70 .457 0.28 1.91DB2PLRG 6016 33909 10017 DBP321 1.0H 000B 2.044 1.59 .000 .065 .000 .194 1.15 .239 0.05 0.28DB2PLRG 6017 33909 10017 DBP322 1.0H 000B 2.658 1.30 .000 .070 .000 .198 .850 .250 0.07 0.29DB2PLRG 6018 33909 10017 DBP323 1.0H 000B 1.759 4.02 .000 .129 .000 .255 3.33 .440 0.08 0.66SMSDB2P 6019 33909 10017 DBP180 1.0H 000B 8.926 1.65 .000 .087 .000 .208 1.05 .391 0.35 1.29SGDB2WIX 601B 33909 10017 DBPI0R 1.0H 000B 0.020 .412 .000 .263 .000 .377 .000 .036 0.00 0.00
601C 33909 10017 PRDH14 1.0H 000B 0.019 .843 .000 .693 .000 .806 .000 .038 0.00 0.00DB2PLRG 601D 33909 10017 DBP324 1.0H 000B 7.568 2.41 .000 .068 .000 .198 1.94 .272 0.21 1.68
Intro DASD I/O Performance Check - 14© Enterprise Performance Strategies, Inc.Peter Enrico : www.epstrategies.com
RMF Report Example – Cache SubsystemC A C H E S U B S Y S T E M A C T I V I T Y
PAGE 1z/OS V1R11 SYSTEM ID FBPA DATE 05/09/2011 INTERVAL 14.59.942
RPT VERSION V1R11 RMF TIME 10.00.00SUBSYSTEM 2107-01 CU-ID 6083 SSID 2000 CDATE 05/09/2011 CTIME 10.00.01 CINT 14.59TYPE-MODEL 2107-921 MANUF EMC PLANT 07 SERIAL 000000004286------------------------------------------------------------------------------------------------------------------------------------
CACHE SUBSYSTEM STATUS------------------------------------------------------------------------------------------------------------------------------------SUBSYSTEM STORAGE NON-VOLATILE STORAGE STATUSCONFIGURED 29642M CONFIGURED 192.0M CACHING - ACTIVEAVAILABLE 29642M PINNED 0.0 NON-VOLATILE STORAGE - ACTIVEPINNED 0.0 CACHE FAST WRITE - ACTIVEOFFLINE 0.0 IML DEVICE AVAILABLE - YES------------------------------------------------------------------------------------------------------------------------------------
CACHE SUBSYSTEM OVERVIEW------------------------------------------------------------------------------------------------------------------------------------TOTAL I/O 2096K CACHE I/O 2096K CACHE OFFLINE 0TOTAL H/R 0.955 CACHE H/R 0.955
CACHE I/O -------------READ I/O REQUESTS------------- ----------------------WRITE I/O REQUESTS---------------------- %REQUESTS COUNT RATE HITS RATE H/R COUNT RATE FAST RATE HITS RATE H/R READNORMAL 1936K 2154 1845K 2052 0.953 75282 83.7 75282 83.7 75233 83.7 0.999 96.3SEQUENTIAL 39752 44.2 37699 41.9 0.948 44861 49.9 44861 49.9 44861 49.9 1.000 47.0CFW DATA 0 0.0 0 0.0 N/A 0 0.0 0 0.0 0 0.0 N/A N/A
TOTAL 1976K 2198 1882K 2094 0.953 120143 133.6 120143 133.6 120094 133.6 1.000 94.3
------------------------CACHE MISSES----------------------- ------------MISC------------ ------NON-CACHE I/O-----REQUESTS READ RATE WRITE RATE TRACKS RATE COUNT RATE COUNT RATE
DFW BYPASS 0 0.0 ICL 0 0.0NORMAL 91281 101.5 49 0.1 0 0.0 CFW BYPASS 0 0.0 BYPASS 622 0.7SEQUENTIAL 2053 2.3 0 0.0 12533 13.9 DFW INHIBIT 0 0.0 TOTAL 622 0.7CFW DATA 0 0.0 0 0.0 ASYNC (TRKS) 10680 11.9
TOTAL 93383 RATE 103.9
----CKD STATISTICS--- ---RECORD CACHING--- ----HOST ADAPTER ACTIVITY--- --------DISK ACTIVITY-------BYTES BYTES RESP BYTES BYTES
WRITE 123644 READ MISSES 0 /REQ /SEC TIME /REQ /SECWRITE HITS 118556 WRITE PROM 0 READ 9.3K 20.4M READ 4.127 42.1K 8.9M
WRITE 10.0K 1.3M WRITE 4.845 41.0K 2.5M
Intro DASD I/O Performance Check -http://www.epstrategies.com
Intro DASD I/O Performance Check - 15© Enterprise Performance Strategies, Inc.Peter Enrico : www.epstrategies.com
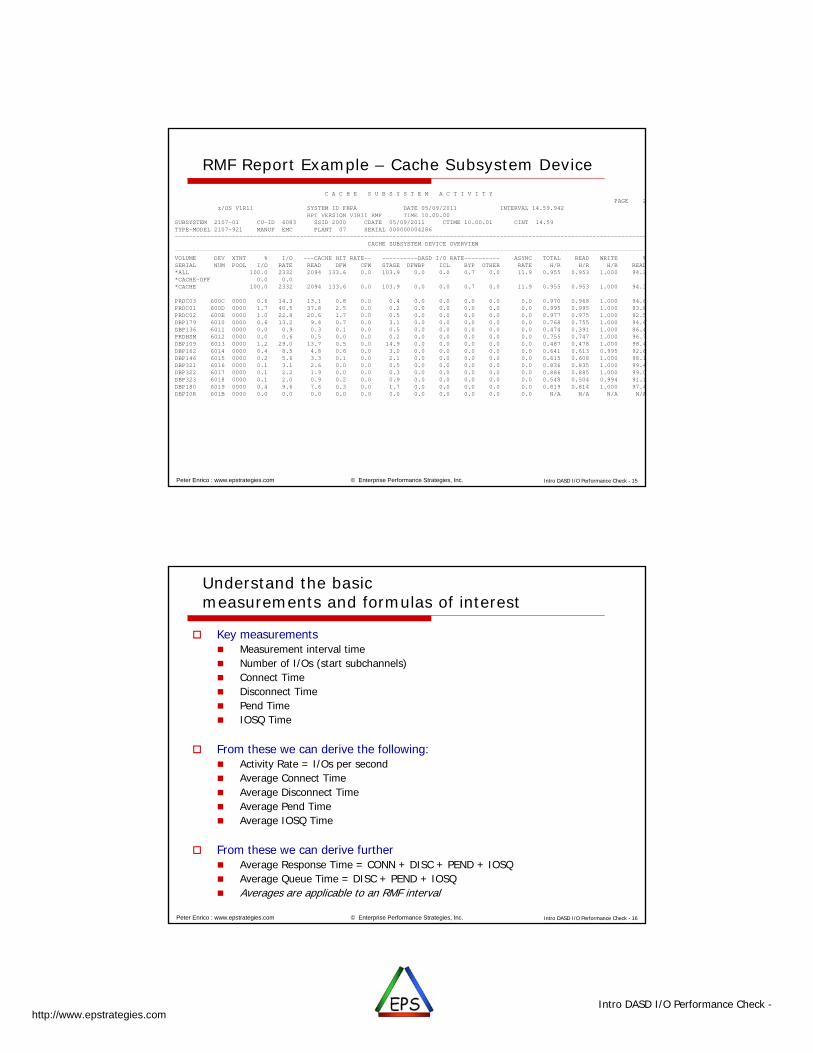
RMF Report Example – Cache Subsystem DeviceC A C H E S U B S Y S T E M A C T I V I T Y
PAGE 2z/OS V1R11 SYSTEM ID FBPA DATE 05/09/2011 INTERVAL 14.59.942
RPT VERSION V1R11 RMF TIME 10.00.00SUBSYSTEM 2107-01 CU-ID 6083 SSID 2000 CDATE 05/09/2011 CTIME 10.00.01 CINT 14.59TYPE-MODEL 2107-921 MANUF EMC PLANT 07 SERIAL 000000004286------------------------------------------------------------------------------------------------------------------------------------
CACHE SUBSYSTEM DEVICE OVERVIEW------------------------------------------------------------------------------------------------------------------------------------VOLUME DEV XTNT % I/O ---CACHE HIT RATE-- ----------DASD I/O RATE---------- ASYNC TOTAL READ WRITE %SERIAL NUM POOL I/O RATE READ DFW CFW STAGE DFWBP ICL BYP OTHER RATE H/R H/R H/R READ*ALL 100.0 2332 2094 133.6 0.0 103.9 0.0 0.0 0.7 0.0 11.9 0.955 0.953 1.000 94.3*CACHE-OFF 0.0 0.0*CACHE 100.0 2332 2094 133.6 0.0 103.9 0.0 0.0 0.7 0.0 11.9 0.955 0.953 1.000 94.3
PRDC03 600C 0000 0.6 14.3 13.1 0.8 0.0 0.4 0.0 0.0 0.0 0.0 0.0 0.970 0.968 1.000 94.6PRDC01 600D 0000 1.7 40.5 37.8 2.5 0.0 0.2 0.0 0.0 0.0 0.0 0.0 0.995 0.995 1.000 93.8PRDC02 600E 0000 1.0 22.8 20.6 1.7 0.0 0.5 0.0 0.0 0.0 0.0 0.0 0.977 0.975 1.000 92.5DBP179 6010 0000 0.6 13.2 9.4 0.7 0.0 3.1 0.0 0.0 0.0 0.0 0.0 0.768 0.755 1.000 94.6DBP136 6011 0000 0.0 0.9 0.3 0.1 0.0 0.5 0.0 0.0 0.0 0.0 0.0 0.474 0.391 1.000 86.4PRDHSM 6012 0000 0.0 0.6 0.5 0.0 0.0 0.2 0.0 0.0 0.0 0.0 0.0 0.755 0.747 1.000 96.7DBP109 6013 0000 1.2 29.0 13.7 0.5 0.0 14.9 0.0 0.0 0.0 0.0 0.0 0.487 0.478 1.000 98.4DBP162 6014 0000 0.4 8.5 4.8 0.6 0.0 3.0 0.0 0.0 0.0 0.0 0.0 0.641 0.613 0.995 92.6DBP146 6015 0000 0.2 5.6 3.3 0.1 0.0 2.1 0.0 0.0 0.0 0.0 0.0 0.615 0.608 1.000 98.1DBP321 6016 0000 0.1 3.1 2.6 0.0 0.0 0.5 0.0 0.0 0.0 0.0 0.0 0.836 0.835 1.000 99.4DBP322 6017 0000 0.1 2.2 1.9 0.0 0.0 0.3 0.0 0.0 0.0 0.0 0.0 0.886 0.885 1.000 99.0DBP323 6018 0000 0.1 2.0 0.9 0.2 0.0 0.9 0.0 0.0 0.0 0.0 0.0 0.548 0.504 0.994 91.1DBP180 6019 0000 0.4 9.6 7.6 0.3 0.0 1.7 0.0 0.0 0.0 0.0 0.0 0.819 0.814 1.000 97.4DBPI0R 601B 0000 0.0 0.0 0.0 0.0 0.0 0.0 0.0 0.0 0.0 0.0 0.0 N/A N/A N/A N/A
Intro DASD I/O Performance Check - 16© Enterprise Performance Strategies, Inc.Peter Enrico : www.epstrategies.com
Understand the basic measurements and formulas of interest
Key measurements Measurement interval time Number of I/Os (start subchannels) Connect Time Disconnect Time Pend Time IOSQ Time
From these we can derive the following: Activity Rate = I/Os per second Average Connect Time Average Disconnect Time Average Pend Time Average IOSQ Time
From these we can derive further Average Response Time = CONN + DISC + PEND + IOSQ Average Queue Time = DISC + PEND + IOSQ Averages are applicable to an RMF interval
Intro DASD I/O Performance Check -http://www.epstrategies.com
Intro DASD I/O Performance Check - 17© Enterprise Performance Strategies, Inc.Peter Enrico : www.epstrategies.com
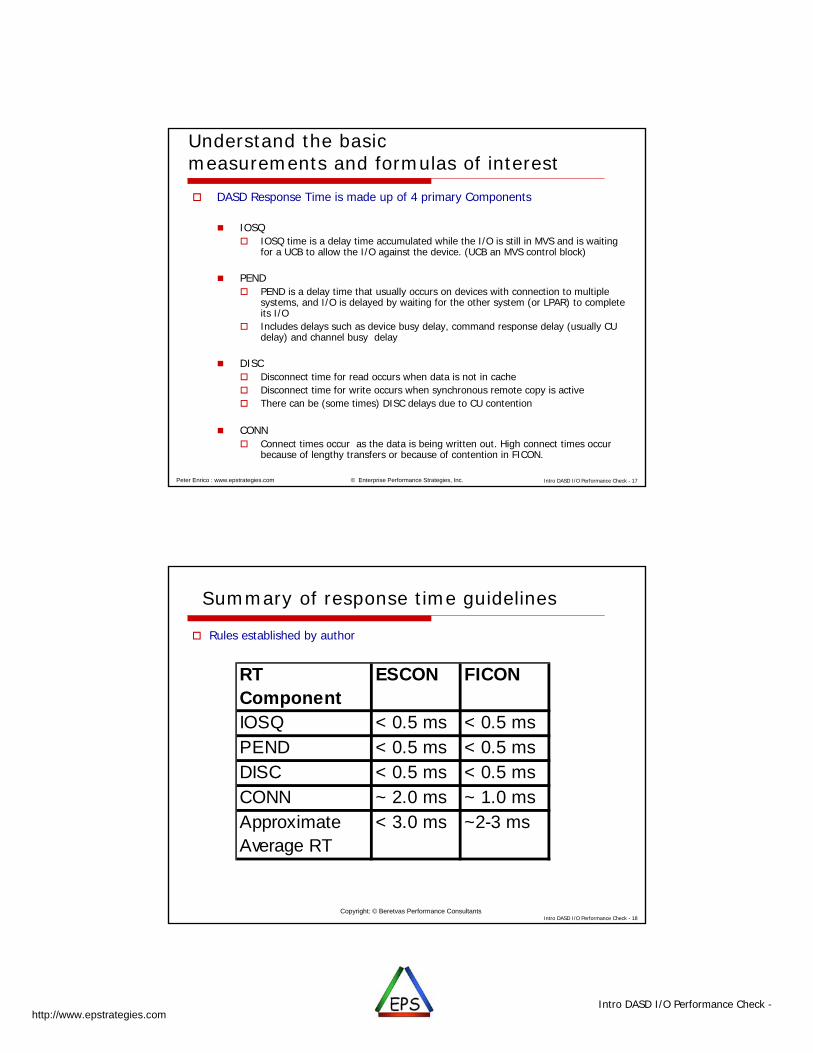
Understand the basic measurements and formulas of interest DASD Response Time is made up of 4 primary Components
IOSQ IOSQ time is a delay time accumulated while the I/O is still in MVS and is waiting
for a UCB to allow the I/O against the device. (UCB an MVS control block)
PEND PEND is a delay time that usually occurs on devices with connection to multiple
systems, and I/O is delayed by waiting for the other system (or LPAR) to complete its I/O
Includes delays such as device busy delay, command response delay (usually CU delay) and channel busy delay
DISC Disconnect time for read occurs when data is not in cache Disconnect time for write occurs when synchronous remote copy is active There can be (some times) DISC delays due to CU contention
CONN Connect times occur as the data is being written out. High connect times occur
because of lengthy transfers or because of contention in FICON.
Intro DASD I/O Performance Check - 18Copyright: © Beretvas Performance Consultants
Summary of response time guidelines
Rules established by author
RT Component
ESCON FICON
IOSQ < 0.5 ms < 0.5 msPEND < 0.5 ms < 0.5 msDISC < 0.5 ms < 0.5 msCONN ~ 2.0 ms ~ 1.0 msApproximate Average RT
< 3.0 ms ~2-3 ms
Intro DASD I/O Performance Check -http://www.epstrategies.com
Intro DASD I/O Performance Check - 19© Enterprise Performance Strategies, Inc.Peter Enrico : www.epstrategies.com
Understand the basic measurements and formulas of interest
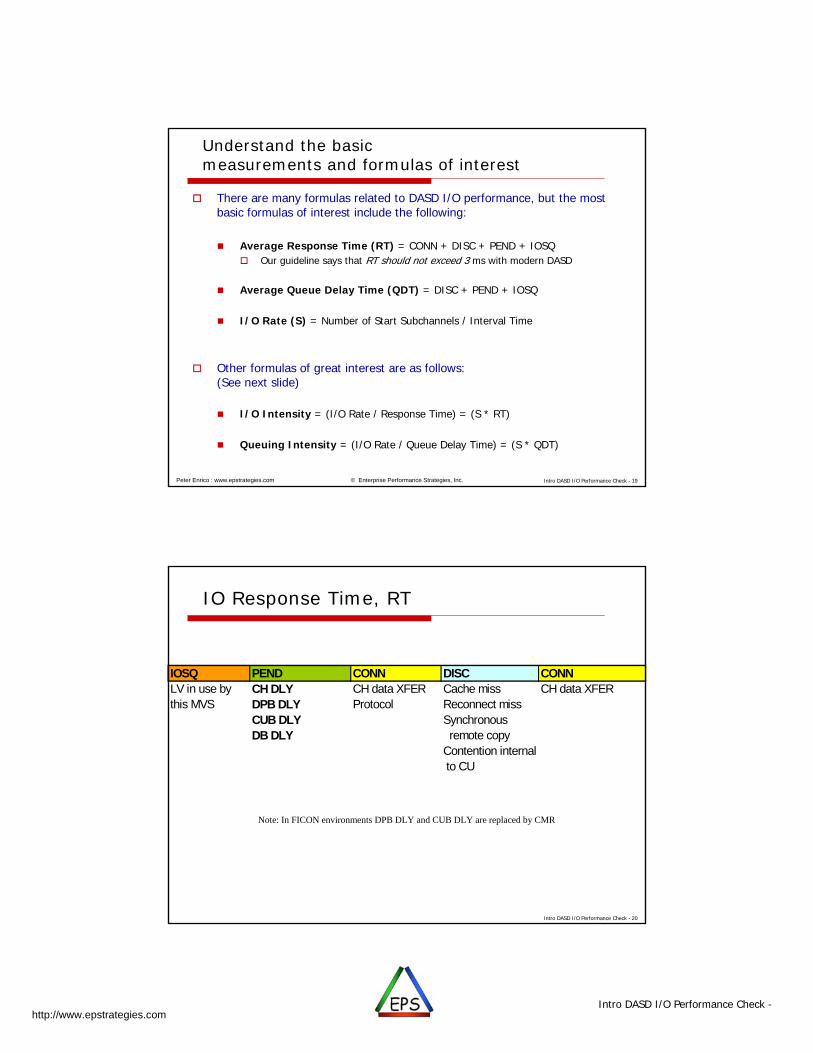
There are many formulas related to DASD I/O performance, but the most basic formulas of interest include the following:
Average Response Time (RT) = CONN + DISC + PEND + IOSQ Our guideline says that RT should not exceed 3 ms with modern DASD
Average Queue Delay Time (QDT) = DISC + PEND + IOSQ
I/O Rate (S) = Number of Start Subchannels / Interval Time
Other formulas of great interest are as follows:(See next slide)
I/O Intensity = (I/O Rate / Response Time) = (S * RT)
Queuing Intensity = (I/O Rate / Queue Delay Time) = (S * QDT)
Intro DASD I/O Performance Check - 20
IO Response Time, RT
IOSQ PEND CONN DISC CONNLV in use by CH DLY CH data XFER Cache miss CH data XFERthis MVS DPB DLY Protocol Reconnect miss
CUB DLY Synchronous DB DLY remote copy
Contention internal to CU
Note: In FICON environments DPB DLY and CUB DLY are replaced by CMR
Intro DASD I/O Performance Check -http://www.epstrategies.com
Intro DASD I/O Performance Check - 21© Enterprise Performance Strategies, Inc.Peter Enrico : www.epstrategies.com
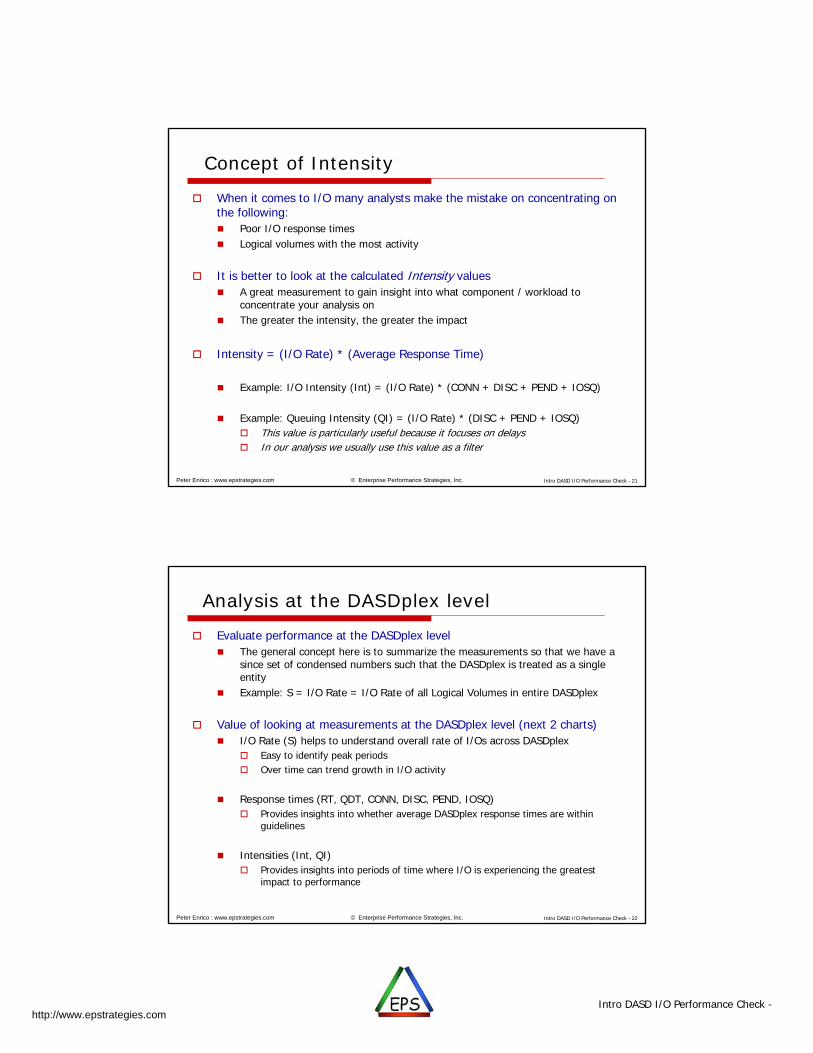
Concept of Intensity
When it comes to I/O many analysts make the mistake on concentrating on the following: Poor I/O response times Logical volumes with the most activity
It is better to look at the calculated Intensity values A great measurement to gain insight into what component / workload to
concentrate your analysis on The greater the intensity, the greater the impact
Intensity = (I/O Rate) * (Average Response Time)
Example: I/O Intensity (Int) = (I/O Rate) * (CONN + DISC + PEND + IOSQ)
Example: Queuing Intensity (QI) = (I/O Rate) * (DISC + PEND + IOSQ) This value is particularly useful because it focuses on delays In our analysis we usually use this value as a filter
Intro DASD I/O Performance Check - 22© Enterprise Performance Strategies, Inc.Peter Enrico : www.epstrategies.com
Analysis at the DASDplex level
Evaluate performance at the DASDplex level The general concept here is to summarize the measurements so that we have a
since set of condensed numbers such that the DASDplex is treated as a single entity
Example: S = I/O Rate = I/O Rate of all Logical Volumes in entire DASDplex
Value of looking at measurements at the DASDplex level (next 2 charts) I/O Rate (S) helps to understand overall rate of I/Os across DASDplex
Easy to identify peak periods Over time can trend growth in I/O activity
Response times (RT, QDT, CONN, DISC, PEND, IOSQ) Provides insights into whether average DASDplex response times are within
guidelines
Intensities (Int, QI) Provides insights into periods of time where I/O is experiencing the greatest
impact to performance
Intro DASD I/O Performance Check -http://www.epstrategies.com
Intro DASD I/O Performance Check - 23© Enterprise Performance Strategies, Inc.Peter Enrico : www.epstrategies.com
Intro DASD I/O Performance Check - 24© Enterprise Performance Strategies, Inc.Peter Enrico : www.epstrategies.com
Intro DASD I/O Performance Check -http://www.epstrategies.com
Intro DASD I/O Performance Check - 25© Enterprise Performance Strategies, Inc.Peter Enrico : www.epstrategies.com
Intro DASD I/O Performance Check - 26© Enterprise Performance Strategies, Inc.Peter Enrico : www.epstrategies.com
Analysis at the DASDplex level – continued
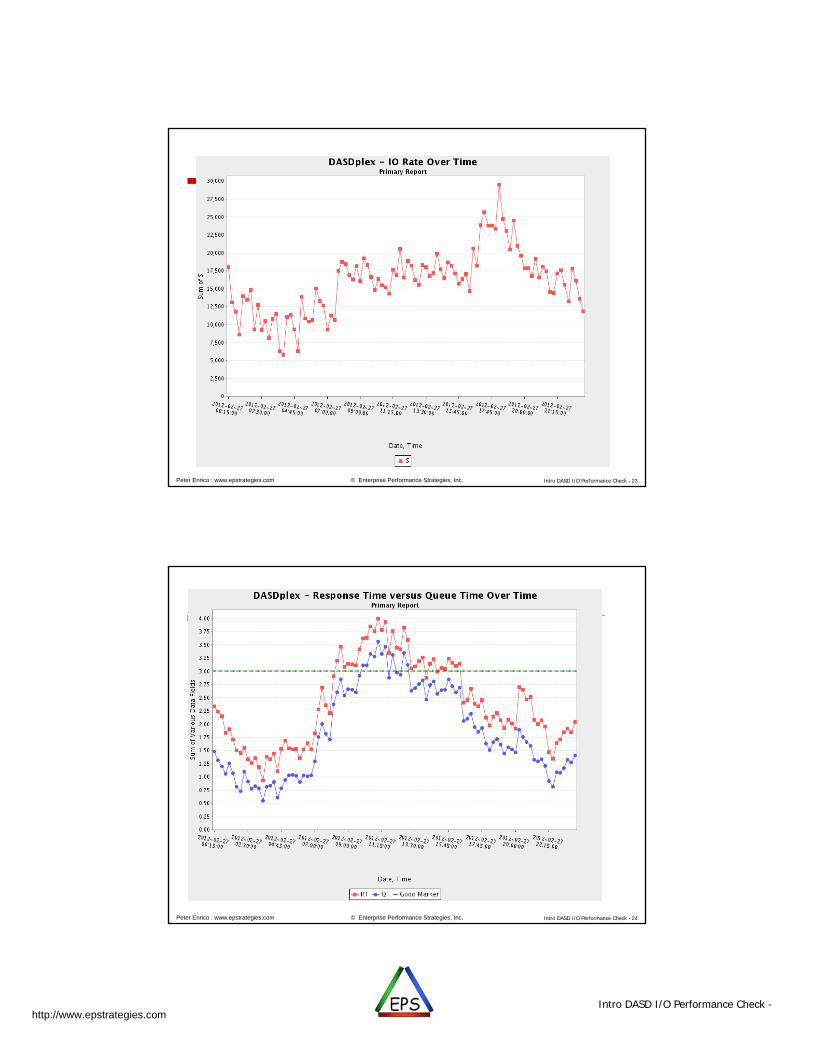
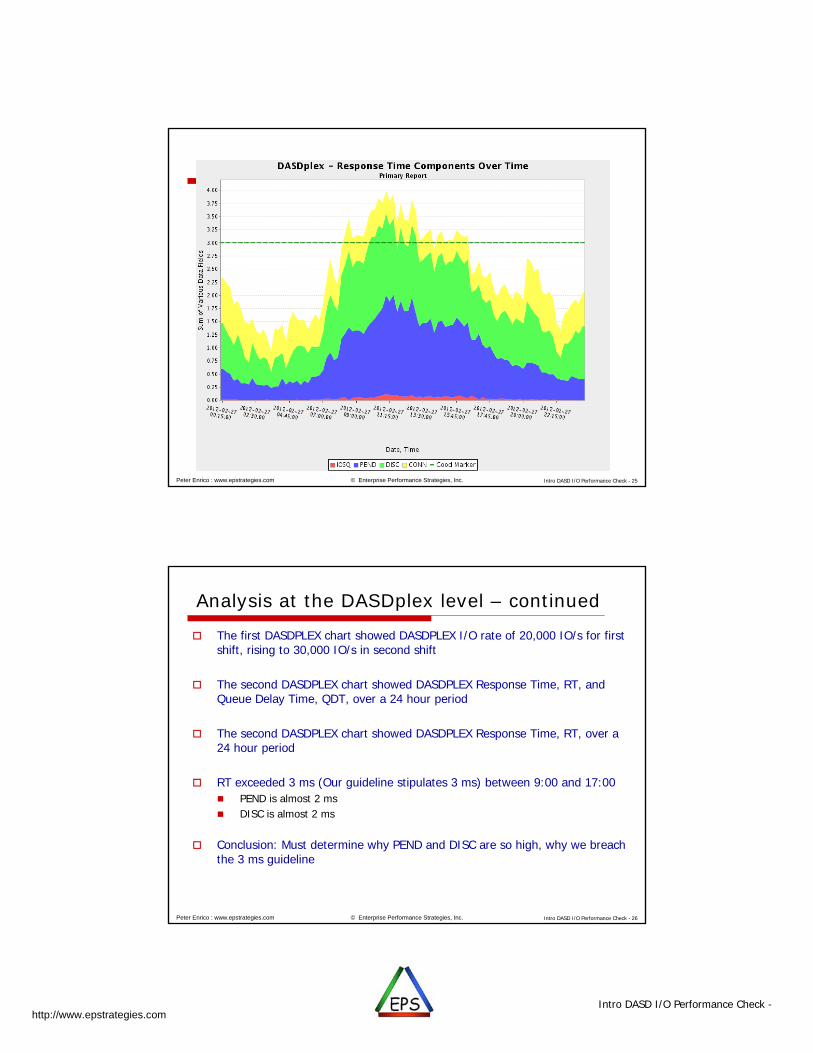
The first DASDPLEX chart showed DASDPLEX I/O rate of 20,000 IO/s for first shift, rising to 30,000 IO/s in second shift
The second DASDPLEX chart showed DASDPLEX Response Time, RT, andQueue Delay Time, QDT, over a 24 hour period
The second DASDPLEX chart showed DASDPLEX Response Time, RT, over a 24 hour period
RT exceeded 3 ms (Our guideline stipulates 3 ms) between 9:00 and 17:00 PEND is almost 2 ms DISC is almost 2 ms
Conclusion: Must determine why PEND and DISC are so high, why we breach the 3 ms guideline
Intro DASD I/O Performance Check -http://www.epstrategies.com
Intro DASD I/O Performance Check - 27© Enterprise Performance Strategies, Inc.Peter Enrico : www.epstrategies.com
Analysis at the PCU / LCU level
These are two stages: first PCU, then LCU levels, but the analysis is similar
Evaluate performance at the PCU/LCU level The general concept here is to summarize the measurements to the
physical/logical control unit level
Value of looking at measurements at the PCU/LCU level In an configuration made up of multiple PCUs/LCUs, examining the
measurements at the PCU/LCU level helps to identify overloaded or unbalanced conditions Often we find that given the multiple PCUs/LCUs load is not balanced
appropriately
Cache measurements are also available at the PCU/LCU level
Intro DASD I/O Performance Check - 28© Enterprise Performance Strategies, Inc.Peter Enrico : www.epstrategies.com
Analyzing Performance Data at the LV Level
Summarize performance at the Logical Volume level Summarize the measurements to obtain a single set of condensed numbers for
each logical volume (LV). Measurements exist separately for each LV in each LPAR in each interval Consolidation (across LPARS or independent CPUs) means one set of numbers for
each LV in each measurement interval
There are many (typically thousands) of logical volumes to examine Identify problem LVs List of LVs must be narrowed down based on performance criteria Our primary filter mechanism is Queuing Intensity, QI
LVs with the highest QI have bad impact because of the highest delays
Select the worst volumes (by QI) Examine cause for high QI (usually combination of high QDT and high S)
Analyze reasons: high DISC, high PEND, high IOSQ Possibly high CONN (usually CONN is productive)
Intro DASD I/O Performance Check -http://www.epstrategies.com
Intro DASD I/O Performance Check - 29
One installation’s LV performance as an example
© Enterprise Performance Strategies, Inc.Peter Enrico : www.epstrategies.com
Intro DASD I/O Performance Check - 30© Enterprise Performance Strategies, Inc.Peter Enrico : www.epstrategies.com
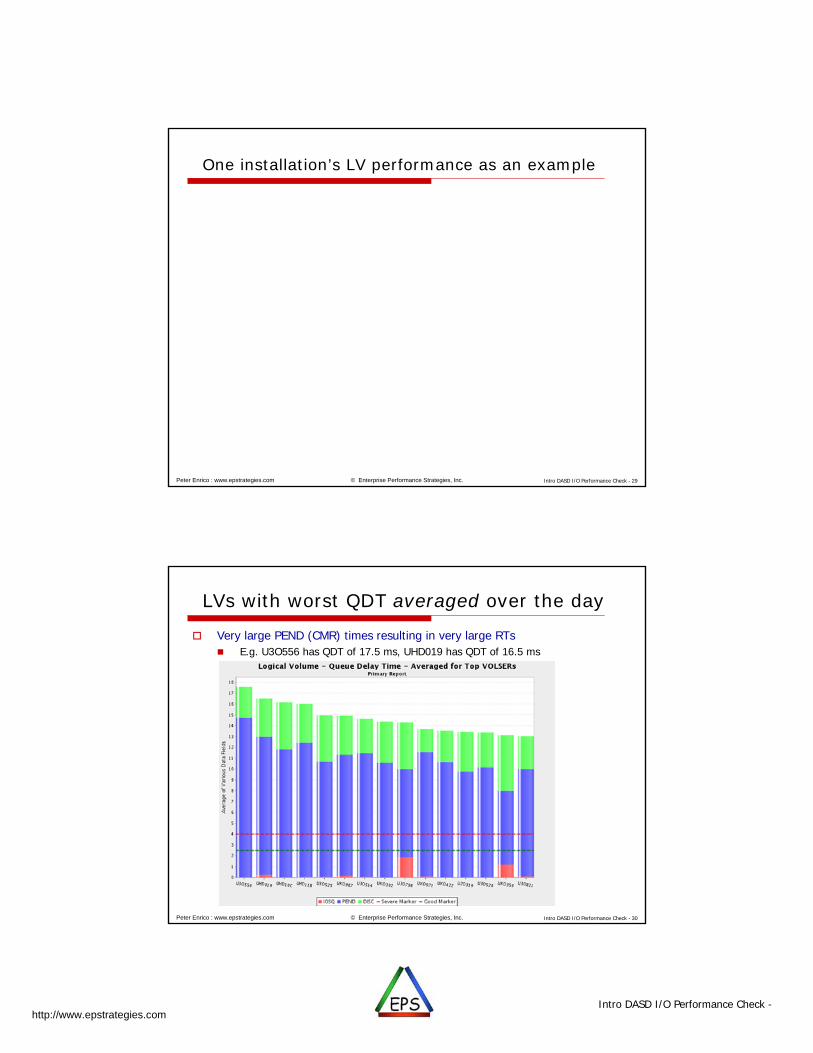
LVs with worst QDT averaged over the day
Very large PEND (CMR) times resulting in very large RTs E.g. U3O556 has QDT of 17.5 ms, UHD019 has QDT of 16.5 ms
Intro DASD I/O Performance Check -http://www.epstrategies.com
Intro DASD I/O Performance Check - 31© Enterprise Performance Strategies, Inc.Peter Enrico : www.epstrategies.com
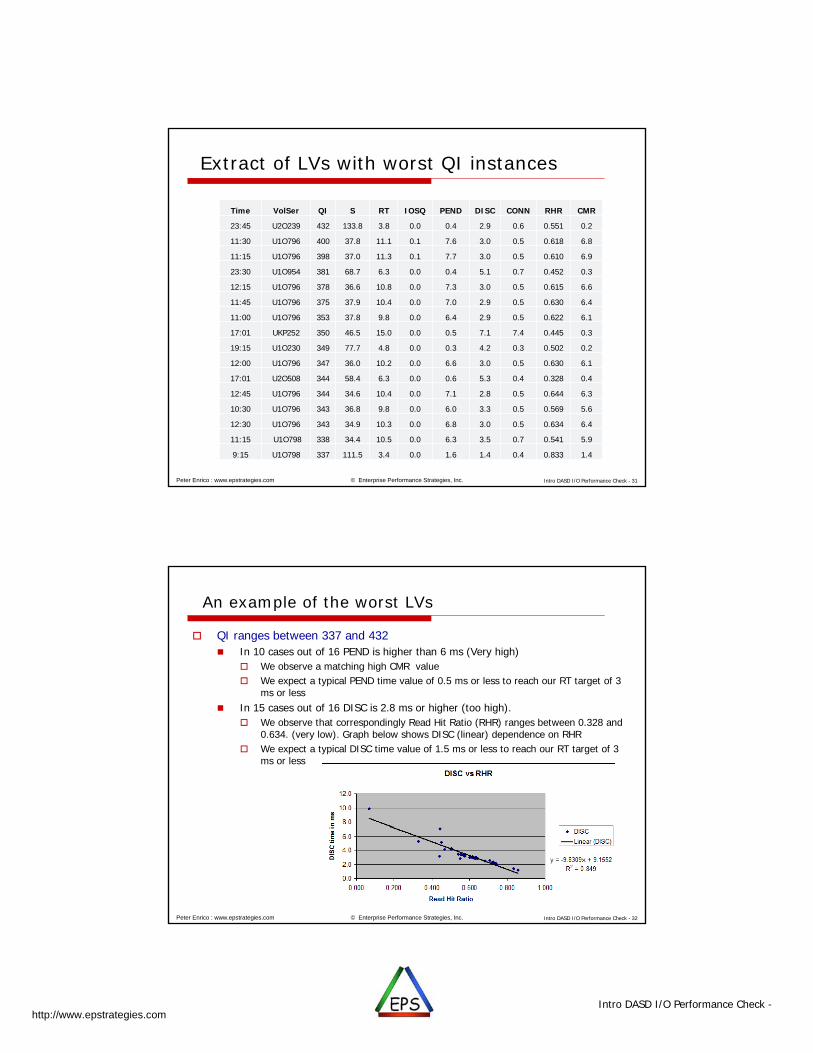
Extract of LVs with worst QI instances
Time VolSer QI S RT IOSQ PEND DISC CONN RHR CMR
23:45 U2O239 432 133.8 3.8 0.0 0.4 2.9 0.6 0.551 0.2
11:30 U1O796 400 37.8 11.1 0.1 7.6 3.0 0.5 0.618 6.8
11:15 U1O796 398 37.0 11.3 0.1 7.7 3.0 0.5 0.610 6.9
23:30 U1O954 381 68.7 6.3 0.0 0.4 5.1 0.7 0.452 0.3
12:15 U1O796 378 36.6 10.8 0.0 7.3 3.0 0.5 0.615 6.6
11:45 U1O796 375 37.9 10.4 0.0 7.0 2.9 0.5 0.630 6.4
11:00 U1O796 353 37.8 9.8 0.0 6.4 2.9 0.5 0.622 6.1
17:01 UKP252 350 46.5 15.0 0.0 0.5 7.1 7.4 0.445 0.3
19:15 U1O230 349 77.7 4.8 0.0 0.3 4.2 0.3 0.502 0.2
12:00 U1O796 347 36.0 10.2 0.0 6.6 3.0 0.5 0.630 6.1
17:01 U2O508 344 58.4 6.3 0.0 0.6 5.3 0.4 0.328 0.4
12:45 U1O796 344 34.6 10.4 0.0 7.1 2.8 0.5 0.644 6.3
10:30 U1O796 343 36.8 9.8 0.0 6.0 3.3 0.5 0.569 5.6
12:30 U1O796 343 34.9 10.3 0.0 6.8 3.0 0.5 0.634 6.4
11:15 U1O798 338 34.4 10.5 0.0 6.3 3.5 0.7 0.541 5.9
9:15 U1O798 337 111.5 3.4 0.0 1.6 1.4 0.4 0.833 1.4
Intro DASD I/O Performance Check - 32© Enterprise Performance Strategies, Inc.Peter Enrico : www.epstrategies.com
An example of the worst LVs
QI ranges between 337 and 432 In 10 cases out of 16 PEND is higher than 6 ms (Very high)
We observe a matching high CMR value We expect a typical PEND time value of 0.5 ms or less to reach our RT target of 3
ms or less In 15 cases out of 16 DISC is 2.8 ms or higher (too high).
We observe that correspondingly Read Hit Ratio (RHR) ranges between 0.328 and 0.634. (very low). Graph below shows DISC (linear) dependence on RHR
We expect a typical DISC time value of 1.5 ms or less to reach our RT target of 3 ms or less
Intro DASD I/O Performance Check -http://www.epstrategies.com
Intro DASD I/O Performance Check - 33© Enterprise Performance Strategies, Inc.Peter Enrico : www.epstrategies.com
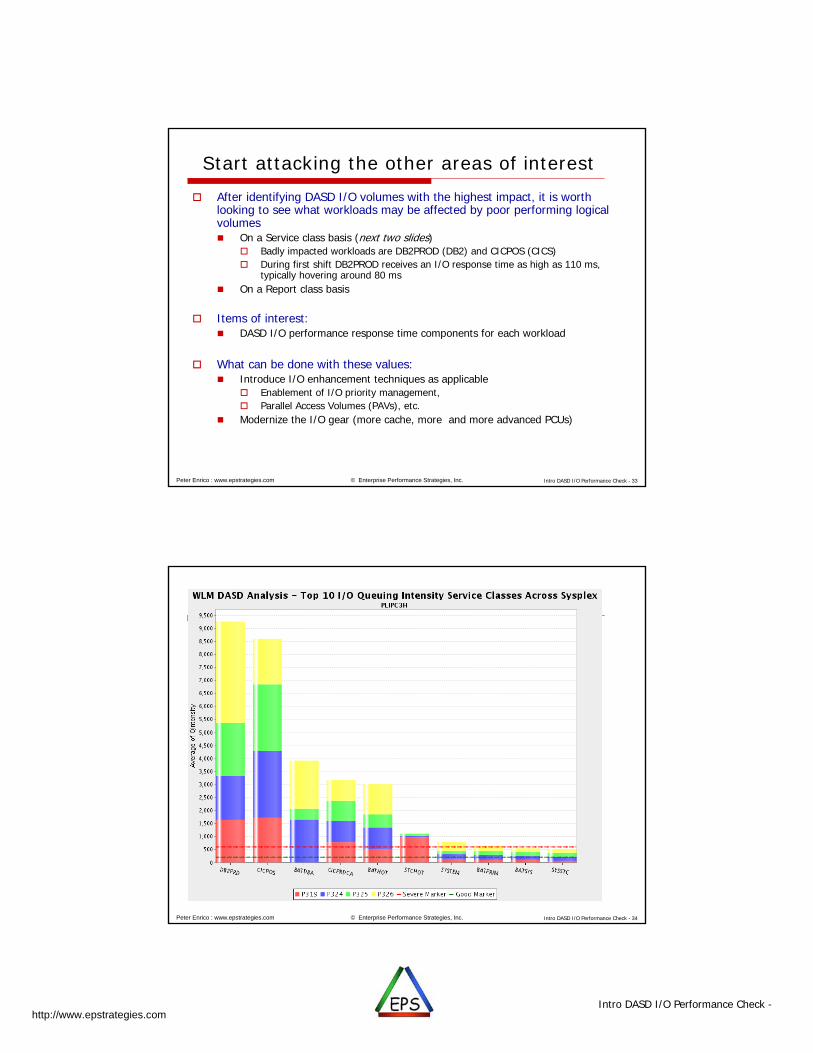
Start attacking the other areas of interest After identifying DASD I/O volumes with the highest impact, it is worth
looking to see what workloads may be affected by poor performing logical volumes On a Service class basis (next two slides)
Badly impacted workloads are DB2PROD (DB2) and CICPOS (CICS) During first shift DB2PROD receives an I/O response time as high as 110 ms,
typically hovering around 80 ms On a Report class basis
Items of interest: DASD I/O performance response time components for each workload
What can be done with these values: Introduce I/O enhancement techniques as applicable
Enablement of I/O priority management, Parallel Access Volumes (PAVs), etc.
Modernize the I/O gear (more cache, more and more advanced PCUs)
Intro DASD I/O Performance Check - 34© Enterprise Performance Strategies, Inc.Peter Enrico : www.epstrategies.com
Intro DASD I/O Performance Check -http://www.epstrategies.com
Intro DASD I/O Performance Check - 35© Enterprise Performance Strategies, Inc.Peter Enrico : www.epstrategies.com
Intro DASD I/O Performance Check - 36© Enterprise Performance Strategies, Inc.Peter Enrico : www.epstrategies.com
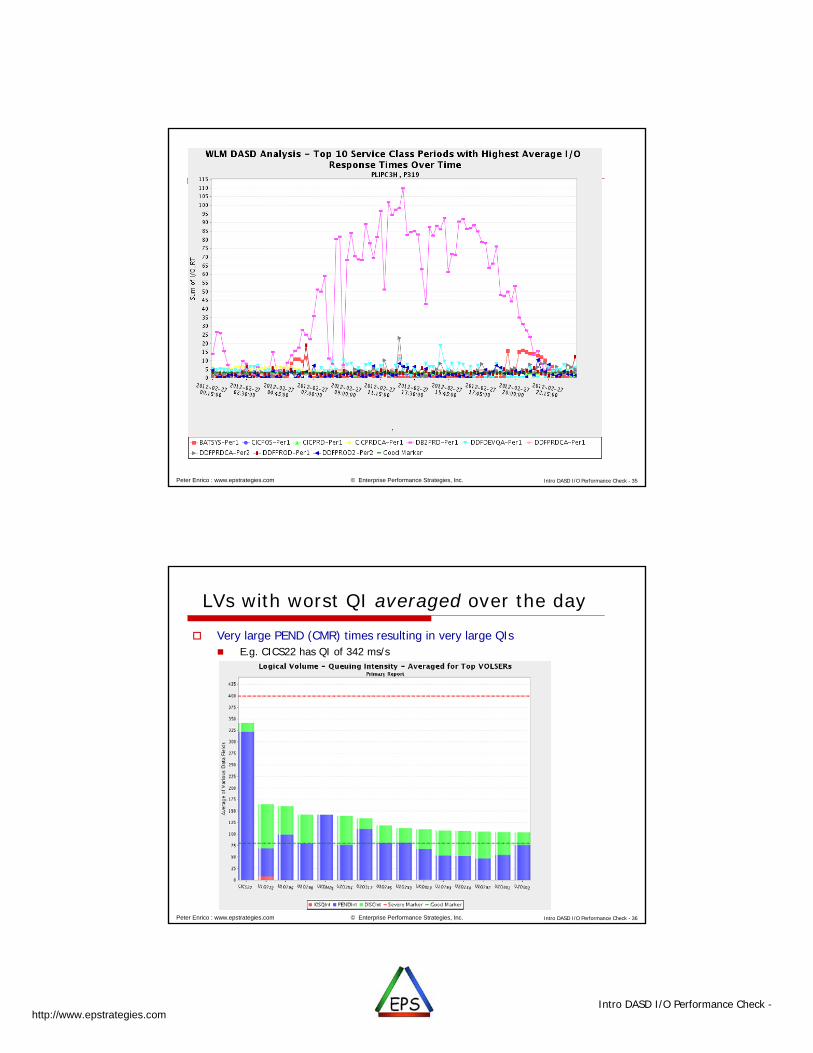
LVs with worst QI averaged over the day
Very large PEND (CMR) times resulting in very large QIs E.g. CICS22 has QI of 342 ms/s
Intro DASD I/O Performance Check -http://www.epstrategies.com
Intro DASD I/O Performance Check - 37© Enterprise Performance Strategies, Inc.Peter Enrico : www.epstrategies.com
Solving the specific Performance Problems
Since we know that DISC and PEND time are worse culprits in this case, the possible solutions are not too difficult to identify.
High PEND (CMR) time indicates control unit contention. There are 4 LPARs (P319, P324, P325, P326) in 2 CPUs generating I/O requests
to the single Physical Control Unit This results in contention on the paths to the Physical Control Unit, i.e., requests
are being delayed because other requests are already being processed.
High DISC time indicates inadequate cache sizes.
Solve both the PEND and DISC time problems Needs more cache in control unit and more (or faster) paths to the control unit
Replace existing control unit with a more modern version Add another control unit and distribute the volumes and load
Intro DASD I/O Performance Check - 38© Enterprise Performance Strategies, Inc.Peter Enrico : www.epstrategies.com
Write a Report for Your Manager! One of the biggest failures of performance analyst is to communicate their
accomplishments
Performance recommendations Let others know what you are doing! Let others know what you are finding! Let others know what can be saved! Let others know what you achieved!
Document The problem or area of concern A proposed solution An estimate in savings
Try to put this value in real monetary terms
Let others know you accomplishments!

Intro DASD I/O Performance Check -http://www.epstrategies.com
Intro DASD I/O Performance Check - 39© Enterprise Performance Strategies, Inc.Peter Enrico : www.epstrategies.com
Current 2012 Class Schedule
WLM Performance and Re-evaluating of Goals Instructor: Peter Enrico June 11 - 15, 2012 Saint Louis, Missouri, USA September 17 – 21, 2012 Stamford, Connecticut, USA
Essential z/OS Performance Tuning Instructor: Peter Enrico and Tom Beretvas September 10 –14, 2012 Minneapolis, Minnesota, USA
Parallel Sysplex and z/OS Performance Tuning Instructor: Peter Enrico July 17 - 19, 2012 Online August 21 – 23, 2011 Online
z/OS Capacity Planning and Performance Analysis Instructor: Ray Wicks No scheduled at this time
Intro DASD I/O Performance Check - 40© Enterprise Performance Strategies, Inc.Peter Enrico : www.epstrategies.com
Reference charts
Intro DASD I/O Performance Check -http://www.epstrategies.com
Intro DASD I/O Performance Check - 41© Enterprise Performance Strategies, Inc.Peter Enrico : www.epstrategies.com
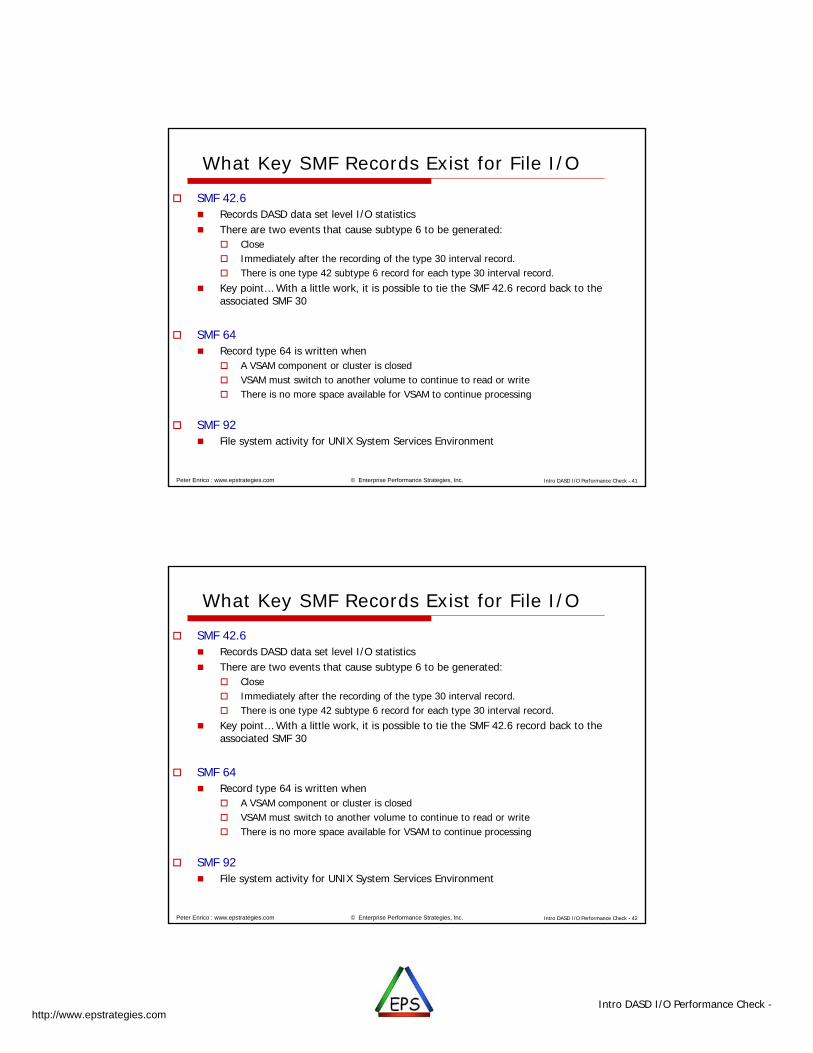
What Key SMF Records Exist for File I/O
SMF 42.6 Records DASD data set level I/O statistics There are two events that cause subtype 6 to be generated:
Close Immediately after the recording of the type 30 interval record. There is one type 42 subtype 6 record for each type 30 interval record.
Key point… With a little work, it is possible to tie the SMF 42.6 record back to the associated SMF 30
SMF 64 Record type 64 is written when
A VSAM component or cluster is closed VSAM must switch to another volume to continue to read or write There is no more space available for VSAM to continue processing
SMF 92 File system activity for UNIX System Services Environment
Intro DASD I/O Performance Check - 42© Enterprise Performance Strategies, Inc.Peter Enrico : www.epstrategies.com
What Key SMF Records Exist for File I/O
SMF 42.6 Records DASD data set level I/O statistics There are two events that cause subtype 6 to be generated:
Close Immediately after the recording of the type 30 interval record. There is one type 42 subtype 6 record for each type 30 interval record.
Key point… With a little work, it is possible to tie the SMF 42.6 record back to the associated SMF 30
SMF 64 Record type 64 is written when
A VSAM component or cluster is closed VSAM must switch to another volume to continue to read or write There is no more space available for VSAM to continue processing
SMF 92 File system activity for UNIX System Services Environment
Intro DASD I/O Performance Check -http://www.epstrategies.com
Intro DASD I/O Performance Check - 43© Enterprise Performance Strategies, Inc.Peter Enrico : www.epstrategies.com
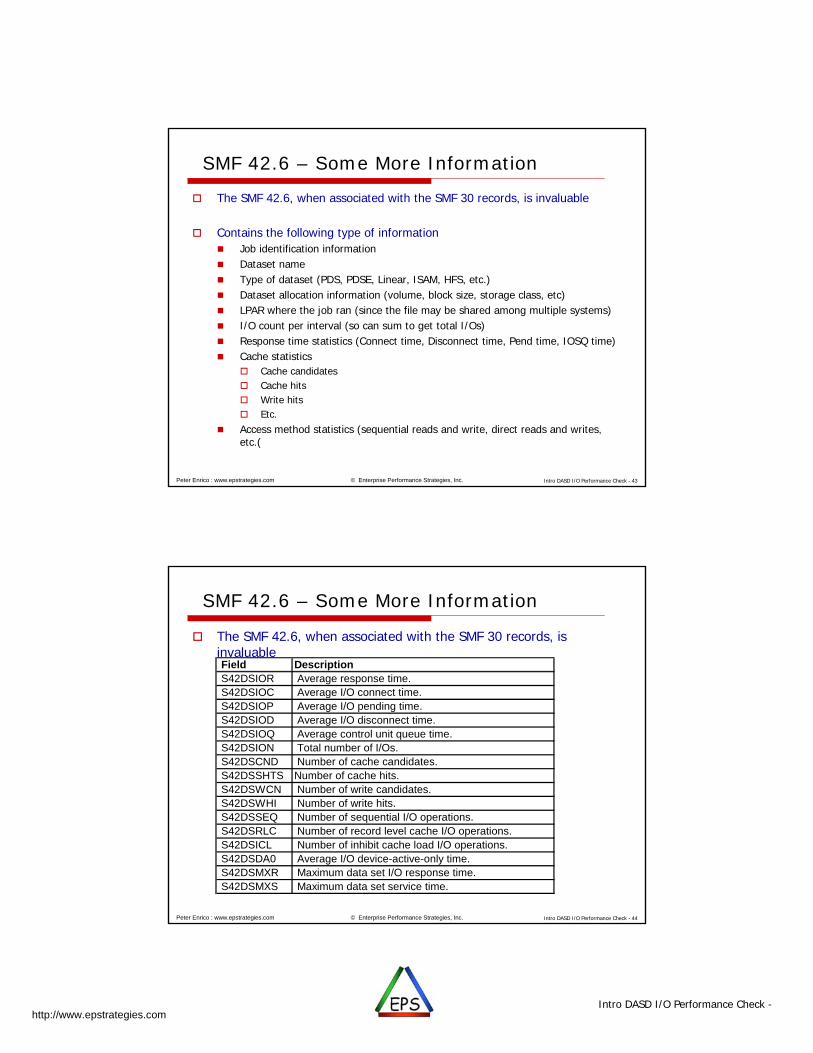
SMF 42.6 – Some More Information
The SMF 42.6, when associated with the SMF 30 records, is invaluable
Contains the following type of information Job identification information Dataset name Type of dataset (PDS, PDSE, Linear, ISAM, HFS, etc.) Dataset allocation information (volume, block size, storage class, etc) LPAR where the job ran (since the file may be shared among multiple systems) I/O count per interval (so can sum to get total I/Os) Response time statistics (Connect time, Disconnect time, Pend time, IOSQ time) Cache statistics
Cache candidates Cache hits Write hits Etc.
Access method statistics (sequential reads and write, direct reads and writes, etc.(
Intro DASD I/O Performance Check - 44© Enterprise Performance Strategies, Inc.Peter Enrico : www.epstrategies.com
SMF 42.6 – Some More Information
The SMF 42.6, when associated with the SMF 30 records, is invaluable Field Description S42DSIOR Average response time. S42DSIOC Average I/O connect time. S42DSIOP Average I/O pending time. S42DSIOD Average I/O disconnect time. S42DSIOQ Average control unit queue time. S42DSION Total number of I/Os. S42DSCND Number of cache candidates. S42DSSHTS Number of cache hits. S42DSWCN Number of write candidates. S42DSWHI Number of write hits. S42DSSEQ Number of sequential I/O operations. S42DSRLC Number of record level cache I/O operations. S42DSICL Number of inhibit cache load I/O operations. S42DSDA0 Average I/O device-active-only time. S42DSMXR Maximum data set I/O response time. S42DSMXS Maximum data set service time.
Intro DASD I/O Performance Check -http://www.epstrategies.com
Intro DASD I/O Performance Check - 45© Enterprise Performance Strategies, Inc.Peter Enrico : www.epstrategies.com
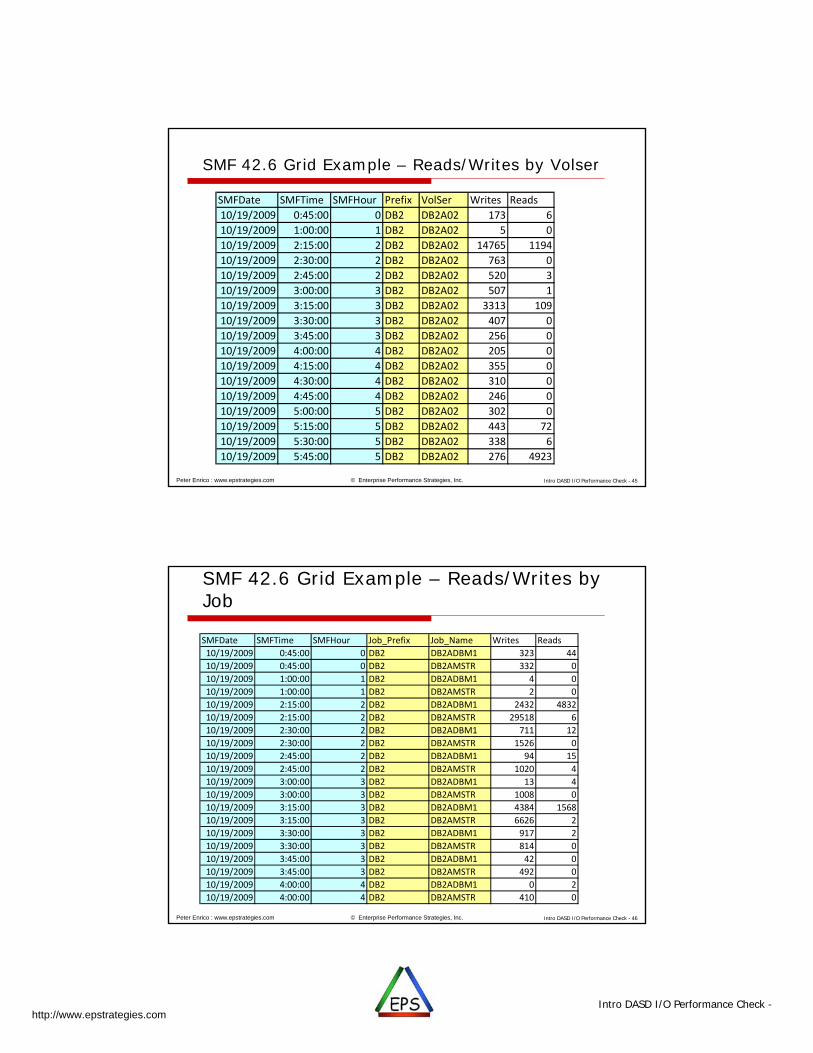
SMF 42.6 Grid Example – Reads/Writes by Volser
SMFDate SMFTime SMFHour Prefix VolSer Writes Reads
10/19/2009 0:45:00 0 DB2 DB2A02 173 6
10/19/2009 1:00:00 1 DB2 DB2A02 5 0
10/19/2009 2:15:00 2 DB2 DB2A02 14765 1194
10/19/2009 2:30:00 2 DB2 DB2A02 763 0
10/19/2009 2:45:00 2 DB2 DB2A02 520 3
10/19/2009 3:00:00 3 DB2 DB2A02 507 1
10/19/2009 3:15:00 3 DB2 DB2A02 3313 109
10/19/2009 3:30:00 3 DB2 DB2A02 407 0
10/19/2009 3:45:00 3 DB2 DB2A02 256 0
10/19/2009 4:00:00 4 DB2 DB2A02 205 0
10/19/2009 4:15:00 4 DB2 DB2A02 355 0
10/19/2009 4:30:00 4 DB2 DB2A02 310 0
10/19/2009 4:45:00 4 DB2 DB2A02 246 0
10/19/2009 5:00:00 5 DB2 DB2A02 302 0
10/19/2009 5:15:00 5 DB2 DB2A02 443 72
10/19/2009 5:30:00 5 DB2 DB2A02 338 6
10/19/2009 5:45:00 5 DB2 DB2A02 276 4923
Intro DASD I/O Performance Check - 46© Enterprise Performance Strategies, Inc.Peter Enrico : www.epstrategies.com
SMF 42.6 Grid Example – Reads/Writes by Job
SMFDate SMFTime SMFHour Job_Prefix Job_Name Writes Reads
10/19/2009 0:45:00 0 DB2 DB2ADBM1 323 44
10/19/2009 0:45:00 0 DB2 DB2AMSTR 332 0
10/19/2009 1:00:00 1 DB2 DB2ADBM1 4 0
10/19/2009 1:00:00 1 DB2 DB2AMSTR 2 0
10/19/2009 2:15:00 2 DB2 DB2ADBM1 2432 4832
10/19/2009 2:15:00 2 DB2 DB2AMSTR 29518 6
10/19/2009 2:30:00 2 DB2 DB2ADBM1 711 12
10/19/2009 2:30:00 2 DB2 DB2AMSTR 1526 0
10/19/2009 2:45:00 2 DB2 DB2ADBM1 94 15
10/19/2009 2:45:00 2 DB2 DB2AMSTR 1020 4
10/19/2009 3:00:00 3 DB2 DB2ADBM1 13 4
10/19/2009 3:00:00 3 DB2 DB2AMSTR 1008 0
10/19/2009 3:15:00 3 DB2 DB2ADBM1 4384 1568
10/19/2009 3:15:00 3 DB2 DB2AMSTR 6626 2
10/19/2009 3:30:00 3 DB2 DB2ADBM1 917 2
10/19/2009 3:30:00 3 DB2 DB2AMSTR 814 0
10/19/2009 3:45:00 3 DB2 DB2ADBM1 42 0
10/19/2009 3:45:00 3 DB2 DB2AMSTR 492 0
10/19/2009 4:00:00 4 DB2 DB2ADBM1 0 2
10/19/2009 4:00:00 4 DB2 DB2AMSTR 410 0
Intro DASD I/O Performance Check -http://www.epstrategies.com
Intro DASD I/O Performance Check - 47© Enterprise Performance Strategies, Inc.Peter Enrico : www.epstrategies.com
Possible Reports
Data summary in many different ways By Job, by File By File by Job
Example: For each file, broken down by job
Number of I/Os to file per job Number of reads and writes Number of sequential access and direct accesses
I/O response times breakdown
etc