introduction to matlab - mdo lab · introduction to matlab amitay isaacs april 20, 2012 ... scienti...
TRANSCRIPT

Introduction DataTypes Plots IO Programs Tools
Introduction to Matlab
Amitay Isaacs
April 20, 2012
Amitay Isaacs Introduction to Matlab
Introduction DataTypes Plots IO Programs Tools Resources Command Line
What is MATLAB
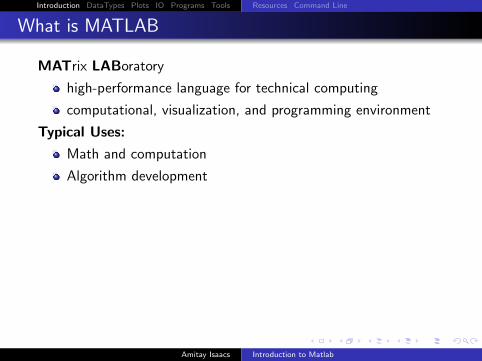
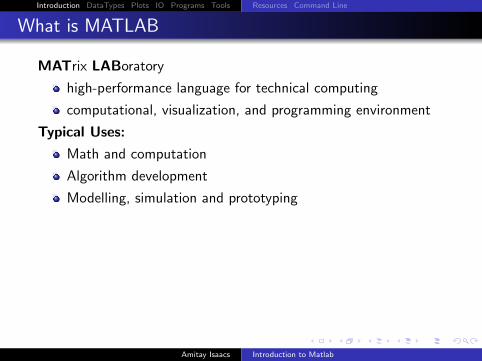
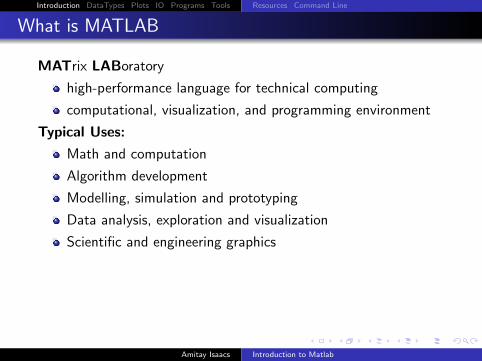
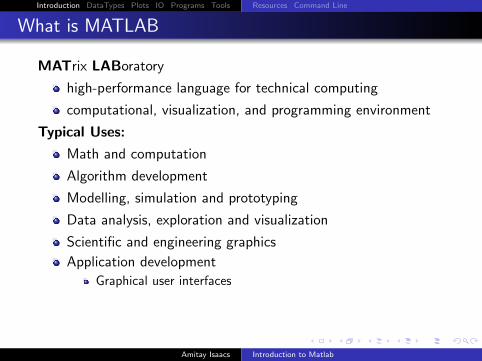
MATrix LABoratory
high-performance language for technical computing
computational, visualization, and programming environment
Typical Uses:
Math and computation
Algorithm development
Modelling, simulation and prototyping
Data analysis, exploration and visualization
Scientific and engineering graphics
Application development
Graphical user interfaces
Amitay Isaacs Introduction to Matlab
Introduction DataTypes Plots IO Programs Tools Resources Command Line
What is MATLAB
MATrix LABoratory
high-performance language for technical computing
computational, visualization, and programming environment
Typical Uses:
Math and computation
Algorithm development
Modelling, simulation and prototyping
Data analysis, exploration and visualization
Scientific and engineering graphics
Application development
Graphical user interfaces
Amitay Isaacs Introduction to Matlab
Introduction DataTypes Plots IO Programs Tools Resources Command Line
MATLAB Components
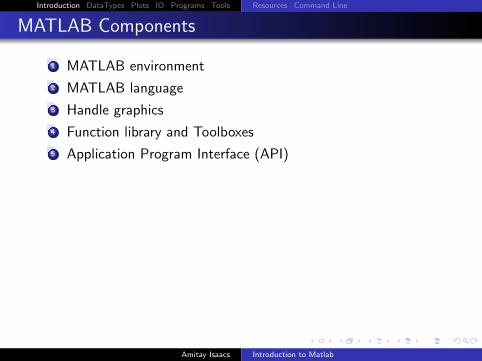
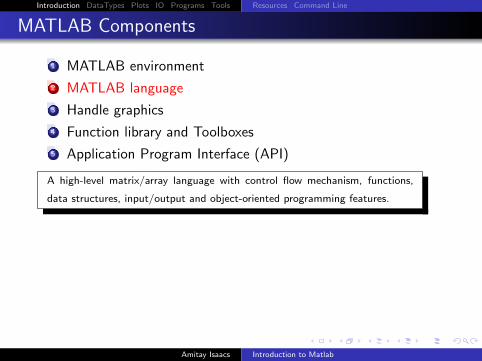
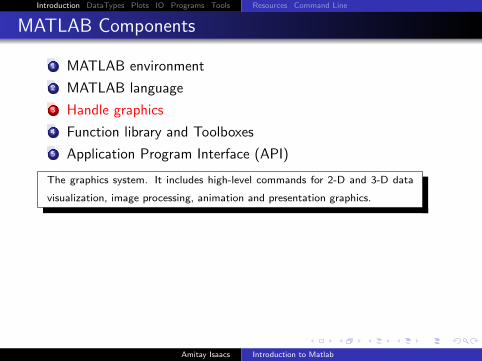
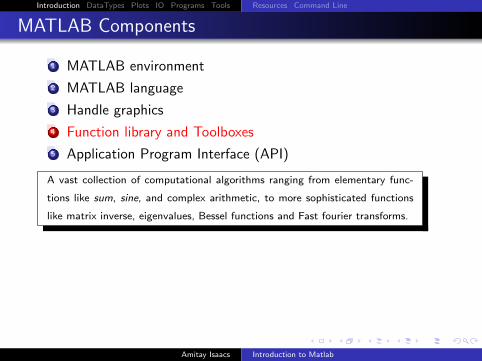
1 MATLAB environment
2 MATLAB language
3 Handle graphics
4 Function library and Toolboxes
5 Application Program Interface (API)
Amitay Isaacs Introduction to Matlab

Introduction DataTypes Plots IO Programs Tools Resources Command Line
MATLAB Components
1 MATLAB environment
2 MATLAB language
3 Handle graphics
4 Function library and Toolboxes
5 Application Program Interface (API)
The set of tools and facilities that you work as the MATLAB user or program-
mer, including tools for development, management, debugging and profiling.
Amitay Isaacs Introduction to Matlab
Introduction DataTypes Plots IO Programs Tools Resources Command Line
MATLAB Components
1 MATLAB environment
2 MATLAB language
3 Handle graphics
4 Function library and Toolboxes
5 Application Program Interface (API)
A high-level matrix/array language with control flow mechanism, functions,
data structures, input/output and object-oriented programming features.
Amitay Isaacs Introduction to Matlab
Introduction DataTypes Plots IO Programs Tools Resources Command Line
MATLAB Components
1 MATLAB environment
2 MATLAB language
3 Handle graphics
4 Function library and Toolboxes
5 Application Program Interface (API)
The graphics system. It includes high-level commands for 2-D and 3-D data
visualization, image processing, animation and presentation graphics.
Amitay Isaacs Introduction to Matlab
Introduction DataTypes Plots IO Programs Tools Resources Command Line
MATLAB Components
1 MATLAB environment
2 MATLAB language
3 Handle graphics
4 Function library and Toolboxes
5 Application Program Interface (API)
A vast collection of computational algorithms ranging from elementary func-
tions like sum, sine, and complex arithmetic, to more sophisticated functions
like matrix inverse, eigenvalues, Bessel functions and Fast fourier transforms.
Amitay Isaacs Introduction to Matlab

Introduction DataTypes Plots IO Programs Tools Resources Command Line
MATLAB Components
1 MATLAB environment
2 MATLAB language
3 Handle graphics
4 Function library and Toolboxes
5 Application Program Interface (API)
A library that allows you to write C and Fortran programs that interact with
MATLAB. It includes facilities for calling routines from MATLAB, calling MAT-
LAB as a computational engine, and for reading/writing MAT-files.
Amitay Isaacs Introduction to Matlab
Introduction DataTypes Plots IO Programs Tools Resources Command Line
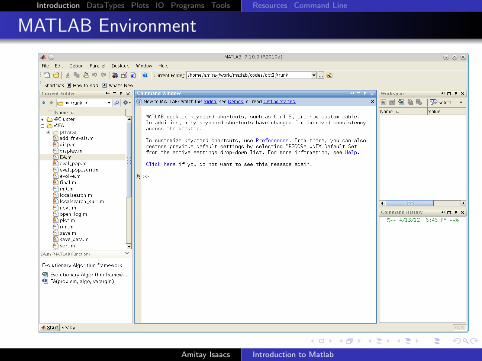
MATLAB Environment
Amitay Isaacs Introduction to Matlab

Introduction DataTypes Plots IO Programs Tools Resources Command Line
Resources
On the Web
Matlab Website
Matlab Tutorials and Learning Resources
Online Help
The help command >> help
The help window >> doc
Example>> help clc
CLC Clear command window.
CLC clears the command window and homes the cursor.
See also home.
Reference page in Help browser
doc clc
Amitay Isaacs Introduction to Matlab
Introduction DataTypes Plots IO Programs Tools Resources Command Line
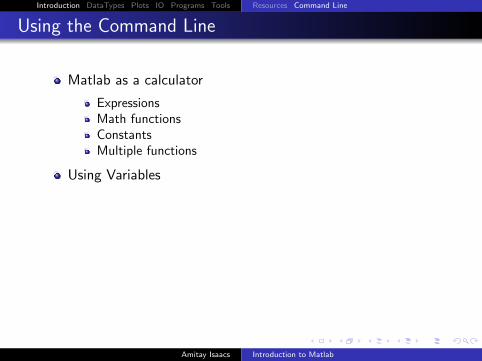
Using the Command Line
Matlab as a calculator
ExpressionsMath functionsConstantsMultiple functions
Using Variables
Assigning valuesSuppressing outputExpressionsAssiging with expressionInspecting variable
Amitay Isaacs Introduction to Matlab

Introduction DataTypes Plots IO Programs Tools Resources Command Line
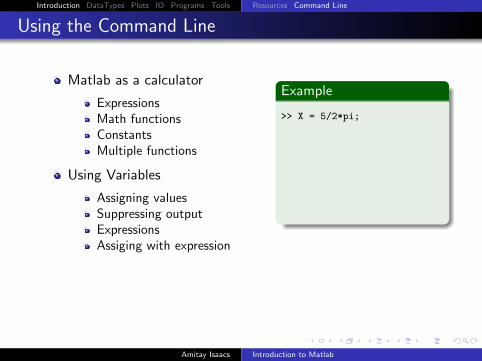
Using the Command Line
Matlab as a calculator
Expressions
Math functionsConstantsMultiple functions
Using Variables
Assigning valuesSuppressing outputExpressionsAssiging with expressionInspecting variable
Example
>> -5/(4.8+5.32)^2
ans =
-0.0488
Amitay Isaacs Introduction to Matlab
Introduction DataTypes Plots IO Programs Tools Resources Command Line
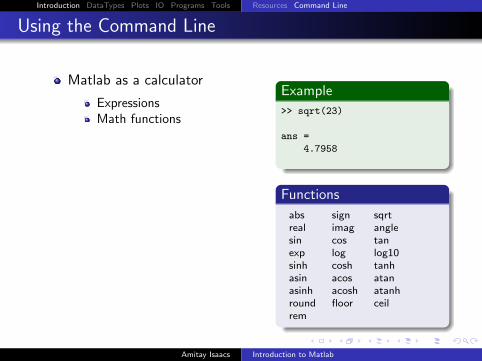
Using the Command Line
Matlab as a calculator
ExpressionsMath functions
ConstantsMultiple functions
Using Variables
Assigning valuesSuppressing outputExpressionsAssiging with expressionInspecting variable
Example
>> sqrt(23)
ans =
4.7958
Functions
abs sign sqrtreal imag anglesin cos tanexp log log10sinh cosh tanhasin acos atanasinh acosh atanhround floor ceilrem
Amitay Isaacs Introduction to Matlab
Introduction DataTypes Plots IO Programs Tools Resources Command Line
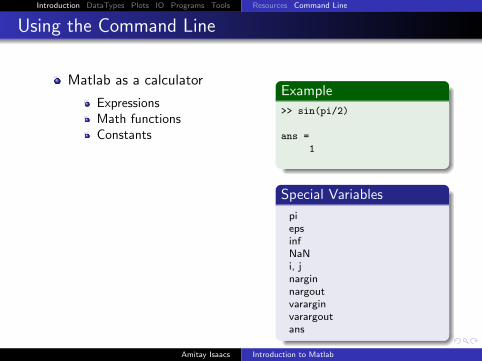
Using the Command Line
Matlab as a calculator
ExpressionsMath functionsConstants
Multiple functions
Using Variables
Assigning valuesSuppressing outputExpressionsAssiging with expressionInspecting variable
Example
>> sin(pi/2)
ans =
1
Special Variables
piepsinfNaNi, jnarginnargoutvararginvarargoutans
Amitay Isaacs Introduction to Matlab

Introduction DataTypes Plots IO Programs Tools Resources Command Line
Using the Command Line
Matlab as a calculator
ExpressionsMath functionsConstantsMultiple functions
Using Variables
Assigning valuesSuppressing outputExpressionsAssiging with expressionInspecting variable
Example
>> exp(acos(0.3))
ans =
3.5470
Amitay Isaacs Introduction to Matlab
Introduction DataTypes Plots IO Programs Tools Resources Command Line
Using the Command Line
Matlab as a calculator
ExpressionsMath functionsConstantsMultiple functions
Using Variables
Assigning valuesSuppressing outputExpressionsAssiging with expressionInspecting variable
Amitay Isaacs Introduction to Matlab
Introduction DataTypes Plots IO Programs Tools Resources Command Line
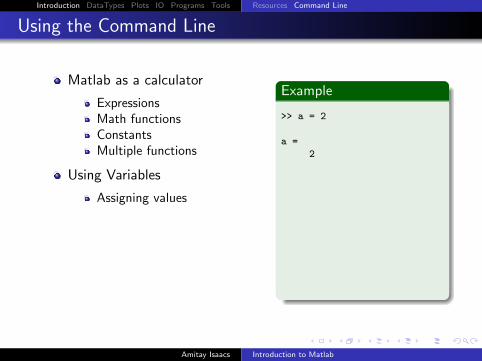
Using the Command Line
Matlab as a calculator
ExpressionsMath functionsConstantsMultiple functions
Using Variables
Assigning values
Suppressing outputExpressionsAssiging with expressionInspecting variable
Example
>> a = 2
a =
2
>> b = 5;
>> a^b
ans =
32
Amitay Isaacs Introduction to Matlab
Introduction DataTypes Plots IO Programs Tools Resources Command Line
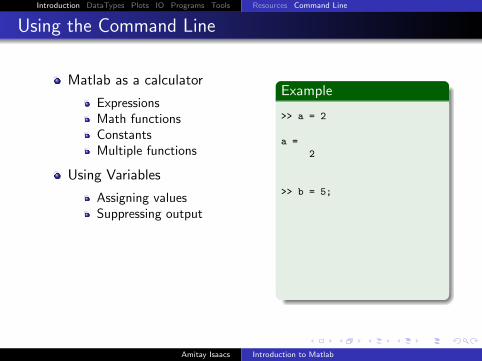
Using the Command Line
Matlab as a calculator
ExpressionsMath functionsConstantsMultiple functions
Using Variables
Assigning valuesSuppressing output
ExpressionsAssiging with expressionInspecting variable
Example
>> a = 2
a =
2
>> b = 5;
>> a^b
ans =
32
Amitay Isaacs Introduction to Matlab
Introduction DataTypes Plots IO Programs Tools Resources Command Line
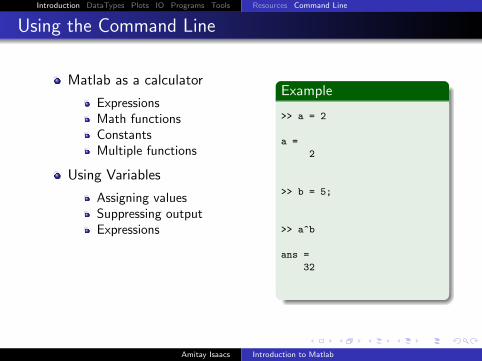
Using the Command Line
Matlab as a calculator
ExpressionsMath functionsConstantsMultiple functions
Using Variables
Assigning valuesSuppressing outputExpressions
Assiging with expressionInspecting variable
Example
>> a = 2
a =
2
>> b = 5;
>> a^b
ans =
32
Amitay Isaacs Introduction to Matlab
Introduction DataTypes Plots IO Programs Tools Resources Command Line
Using the Command Line
Matlab as a calculator
ExpressionsMath functionsConstantsMultiple functions
Using Variables
Assigning valuesSuppressing outputExpressionsAssiging with expression
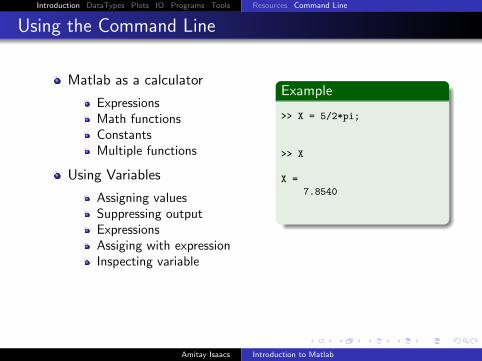
Inspecting variable
Example
>> X = 5/2*pi;
>> X
X =
7.8540
Amitay Isaacs Introduction to Matlab
Introduction DataTypes Plots IO Programs Tools Resources Command Line
Using the Command Line
Matlab as a calculator
ExpressionsMath functionsConstantsMultiple functions
Using Variables
Assigning valuesSuppressing outputExpressionsAssiging with expressionInspecting variable
Example
>> X = 5/2*pi;
>> X
X =
7.8540
Amitay Isaacs Introduction to Matlab

Introduction DataTypes Plots IO Programs Tools Resources Command Line
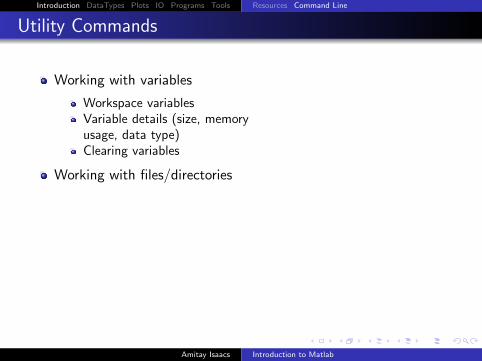
Utility Commands
Working with variables
Workspace variablesVariable details (size, memoryusage, data type)Clearing variables
Working with files/directories
Listing filesNavigating directoriesIdentify objects
Amitay Isaacs Introduction to Matlab
Introduction DataTypes Plots IO Programs Tools Resources Command Line
Utility Commands
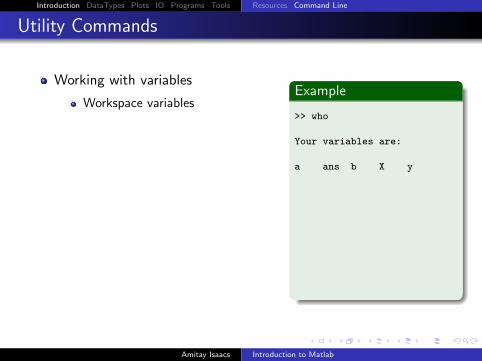
Working with variables
Workspace variables
Variable details (size, memoryusage, data type)Clearing variables
Working with files/directories
Listing filesNavigating directoriesIdentify objects
Example
>> who
Your variables are:
a ans b X y
>> whos
>> clear x
>> clear
>> clear all
Amitay Isaacs Introduction to Matlab
Introduction DataTypes Plots IO Programs Tools Resources Command Line
Utility Commands
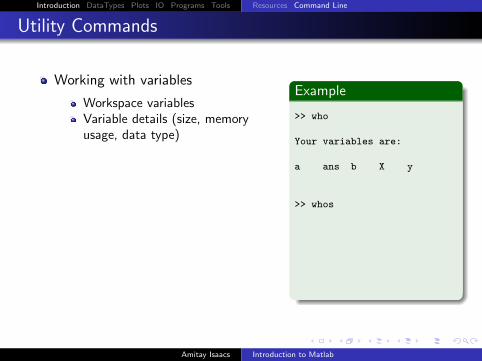
Working with variables
Workspace variablesVariable details (size, memoryusage, data type)
Clearing variables
Working with files/directories
Listing filesNavigating directoriesIdentify objects
Example
>> who
Your variables are:
a ans b X y
>> whos
>> clear x
>> clear
>> clear all
Amitay Isaacs Introduction to Matlab

Introduction DataTypes Plots IO Programs Tools Resources Command Line
Utility Commands
Working with variables
Workspace variablesVariable details (size, memoryusage, data type)Clearing variables
Working with files/directories
Listing filesNavigating directoriesIdentify objects
Example
>> who
Your variables are:
a ans b X y
>> whos
>> clear x
>> clear
>> clear all
Amitay Isaacs Introduction to Matlab
Introduction DataTypes Plots IO Programs Tools Resources Command Line
Utility Commands
Working with variables
Workspace variablesVariable details (size, memoryusage, data type)Clearing variables
Working with files/directories
Listing filesNavigating directoriesIdentify objects
Amitay Isaacs Introduction to Matlab
Introduction DataTypes Plots IO Programs Tools Resources Command Line
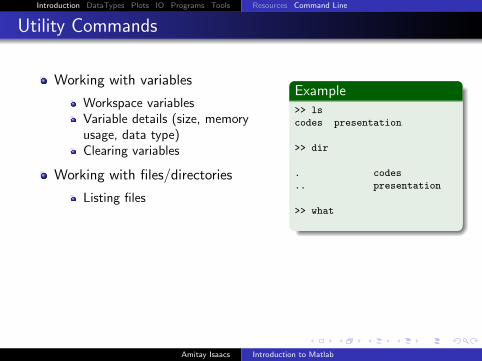
Utility Commands
Working with variables
Workspace variablesVariable details (size, memoryusage, data type)Clearing variables
Working with files/directories
Listing files
Navigating directoriesIdentify objects
Example>> ls
codes presentation
>> dir
. codes
.. presentation
>> what
Amitay Isaacs Introduction to Matlab

Introduction DataTypes Plots IO Programs Tools Resources Command Line
Utility Commands
Working with variables
Workspace variablesVariable details (size, memoryusage, data type)Clearing variables
Working with files/directories
Listing filesNavigating directories
Identify objects
Example>> pwd
ans =
/home/amitay/matlab
>> cd utils
>> pwd
ans =
/home/amitay/matlab/utils
Amitay Isaacs Introduction to Matlab

Introduction DataTypes Plots IO Programs Tools Resources Command Line
Utility Commands
Working with variables
Workspace variablesVariable details (size, memoryusage, data type)Clearing variables
Working with files/directories
Listing filesNavigating directoriesIdentify objects
Example>> a = 2;
>> which a
a is a variable.
>> which sin
built-in (.../@double/sin)
Amitay Isaacs Introduction to Matlab

Introduction DataTypes Plots IO Programs Tools Vectors Matrices Strings Cells Structures
Everything in MATLAB is a matrix!
Amitay Isaacs Introduction to Matlab
Introduction DataTypes Plots IO Programs Tools Vectors Matrices Strings Cells Structures
Vectors
Row Vector
Column Vector
Indexing
Operations
ArithmaticFunctions
Array Operations
Arithmatic
Amitay Isaacs Introduction to Matlab
Introduction DataTypes Plots IO Programs Tools Vectors Matrices Strings Cells Structures
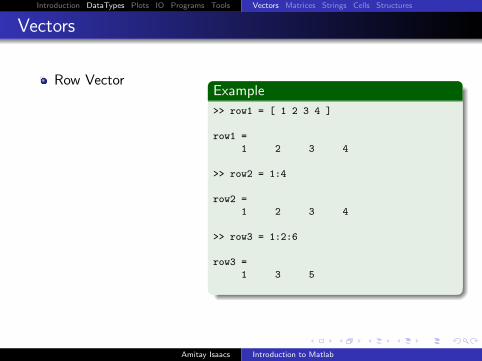
Vectors
Row Vector
Column Vector
Indexing
Operations
ArithmaticFunctions
Array Operations
Arithmatic
Example
>> row1 = [ 1 2 3 4 ]
row1 =
1 2 3 4
>> row2 = 1:4
row2 =
1 2 3 4
>> row3 = 1:2:6
row3 =
1 3 5
Amitay Isaacs Introduction to Matlab

Introduction DataTypes Plots IO Programs Tools Vectors Matrices Strings Cells Structures
Vectors
Row Vector
Column Vector
Indexing
Operations
ArithmaticFunctions
Array Operations
Arithmatic
Example
>> col1 = [ 1; 2; 3; 4; ]
col1 =
1
2
3
4
>> col2 = (3:6)’
col2 =
3
4
5
6
Amitay Isaacs Introduction to Matlab
Introduction DataTypes Plots IO Programs Tools Vectors Matrices Strings Cells Structures
Vectors
Row Vector
Column Vector
Indexing
Operations
ArithmaticFunctions
Array Operations
Arithmatic
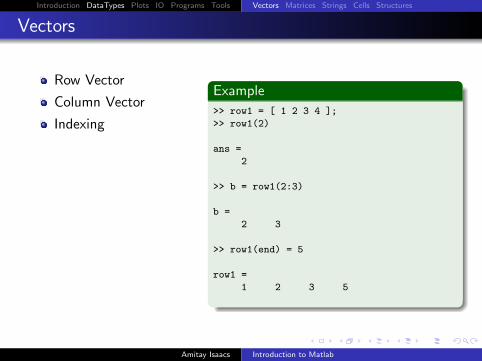
Example
>> row1 = [ 1 2 3 4 ];
>> row1(2)
ans =
2
>> b = row1(2:3)
b =
2 3
>> row1(end) = 5
row1 =
1 2 3 5
Amitay Isaacs Introduction to Matlab

Introduction DataTypes Plots IO Programs Tools Vectors Matrices Strings Cells Structures
Vectors
Row Vector
Column Vector
Indexing
Operations
ArithmaticFunctions
Array Operations
Arithmatic
Example
>> row1(end+1) = 6
row1 =
1 2 3 5 6
>> row1([3 1 4 2])
ans =
3 1 5 2
>> row1(1) = []
row1 =
2 3 5 6
Amitay Isaacs Introduction to Matlab

Introduction DataTypes Plots IO Programs Tools Vectors Matrices Strings Cells Structures
Vectors
Row Vector
Column Vector
Indexing
Operations
ArithmaticFunctions
Array Operations
Arithmatic
Example
>> row1 = [ 1 2 3 4 ]; row2 = 2:5;
>> row1 + row2
ans =
3 5 7 9
>> row1 + 10
ans =
11 12 13 14
>> row1 * row2’
ans =
40
Amitay Isaacs Introduction to Matlab

Introduction DataTypes Plots IO Programs Tools Vectors Matrices Strings Cells Structures
Vectors
Row Vector
Column Vector
Indexing
Operations
ArithmaticFunctions
Array Operations
Arithmatic
Example
>> row1 = [ 3 8 6 2 5 ];
>> sum(row1)
ans =
24
>> min(row1)
ans =
2
>> sort(row1)
ans =
2 3 5 6 8
}
Amitay Isaacs Introduction to Matlab

Introduction DataTypes Plots IO Programs Tools Vectors Matrices Strings Cells Structures
Vectors
Row Vector
Column Vector
Indexing
Operations
Arithmatic
Functions
Array Operations
Arithmatic
Operators
+ addition- subtraction* multiplication/ divisionˆ power’ transpose
Amitay Isaacs Introduction to Matlab

Introduction DataTypes Plots IO Programs Tools Vectors Matrices Strings Cells Structures
Vectors
Row Vector
Column Vector
Indexing
Operations
ArithmaticFunctions
Array Operations
Arithmatic
Functions
length Length of vectormin Smallest componentmax Largest componentmean Average or mean valuemedian Median valuenorm Vector normsum Sum of elementsprod Product of elementscumsum Cumulative sum of elementscumprod Cumulative product of elementsfind Find indices of non-zero elementsdot Dot product of two vectorscross Cross product of two vectors
Amitay Isaacs Introduction to Matlab

Introduction DataTypes Plots IO Programs Tools Vectors Matrices Strings Cells Structures
Vectors
Row Vector
Column Vector
Indexing
Operations
ArithmaticFunctions
Array Operations
Arithmatic
Example
>> r1 = [ 1 2 3 ]; r2 = [ 5 6 7 ];
>> r1 .^ 2
ans =
1 4 9
>> r1 .* r2
ans =
5 12 21
>> r2 ./ r1
ans =
5.0000 3.0000 2.3333
Amitay Isaacs Introduction to Matlab
Introduction DataTypes Plots IO Programs Tools Vectors Matrices Strings Cells Structures
Vectors
Row Vector
Column Vector
Indexing
Operations
ArithmaticFunctions
Array Operations
Arithmatic
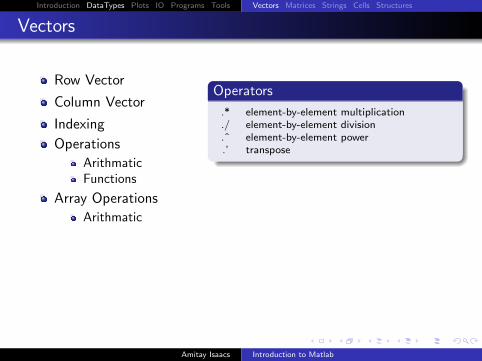
Operators
.* element-by-element multiplication
./ element-by-element division
.ˆ element-by-element power.’ transpose
Amitay Isaacs Introduction to Matlab
Introduction DataTypes Plots IO Programs Tools Vectors Matrices Strings Cells Structures
Matrices
Initialization
Assignment
Indexing
Operations
ArithmaticFunctions
Linear Algebra(Ax = B)
Amitay Isaacs Introduction to Matlab
Introduction DataTypes Plots IO Programs Tools Vectors Matrices Strings Cells Structures
Matrices
Initialization
Assignment
Indexing
Operations
ArithmaticFunctions
Linear Algebra(Ax = B)
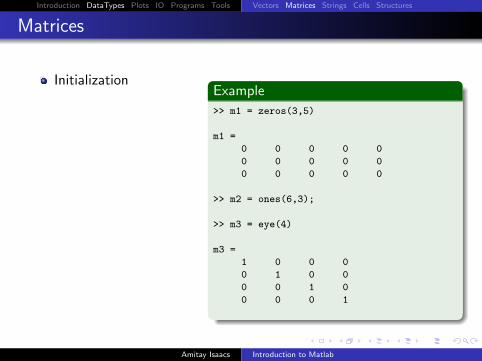
Example
>> m1 = zeros(3,5)
m1 =
0 0 0 0 0
0 0 0 0 0
0 0 0 0 0
>> m2 = ones(6,3);
>> m3 = eye(4)
m3 =
1 0 0 0
0 1 0 0
0 0 1 0
0 0 0 1
Amitay Isaacs Introduction to Matlab

Introduction DataTypes Plots IO Programs Tools Vectors Matrices Strings Cells Structures
Matrices
Initialization
Assignment
Indexing
Operations
ArithmaticFunctions
Linear Algebra(Ax = B)
Example
>> mat1 = [ 1 2 3 ; 4 5 6 ; 7 8 9 ]
mat1 =
1 2 3
4 5 6
7 8 9
>> mat2 = [ 2:4 ; ones(1,3); zeros(1,3) ]
mat2 =
2 3 4
1 1 1
0 0 0
>> mat3 = rand(4,4);
Amitay Isaacs Introduction to Matlab
Introduction DataTypes Plots IO Programs Tools Vectors Matrices Strings Cells Structures
Matrices
Initialization
Assignment
Indexing
Operations
ArithmaticFunctions
Linear Algebra(Ax = B)
Example
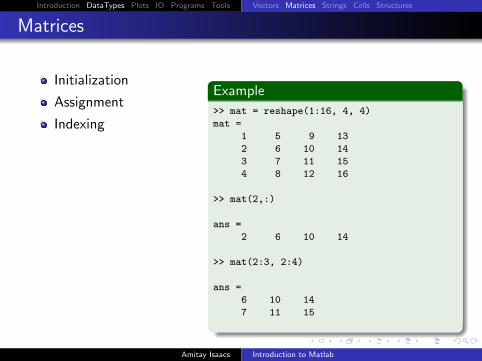
>> mat = reshape(1:16, 4, 4)
mat =
1 5 9 13
2 6 10 14
3 7 11 15
4 8 12 16
>> mat(2,:)
ans =
2 6 10 14
>> mat(2:3, 2:4)
ans =
6 10 14
7 11 15
Amitay Isaacs Introduction to Matlab
Introduction DataTypes Plots IO Programs Tools Vectors Matrices Strings Cells Structures
Matrices
Initialization
Assignment
Indexing
Operations
ArithmaticFunctions
Linear Algebra(Ax = B)
Example
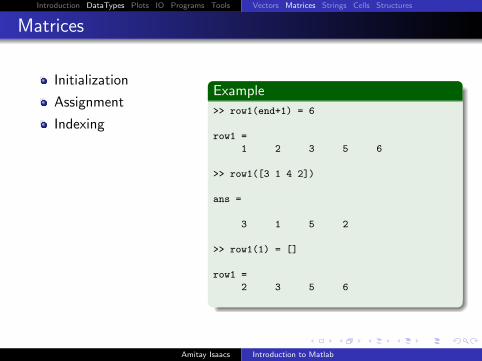
>> row1(end+1) = 6
row1 =
1 2 3 5 6
>> row1([3 1 4 2])
ans =
3 1 5 2
>> row1(1) = []
row1 =
2 3 5 6
Amitay Isaacs Introduction to Matlab

Introduction DataTypes Plots IO Programs Tools Vectors Matrices Strings Cells Structures
Matrices
Initialization
Assignment
Indexing
Operations
ArithmaticFunctions
Linear Algebra(Ax = B)
Example
mat1 = [ 1 2 3
4 5 6
7 8 9 ];
>> mat1 + mat1
ans =
2 4 6
8 10 12
14 16 18
>> mat1 * mat1
ans =
30 36 42
66 81 96
102 126 150
Amitay Isaacs Introduction to Matlab

Introduction DataTypes Plots IO Programs Tools Vectors Matrices Strings Cells Structures
Matrices
Initialization
Assignment
Indexing
Operations
ArithmaticFunctions
Linear Algebra(Ax = B)
Example
mat1 = [ 1 2 3
4 5 6
7 8 5 ];
>> inv(mat1)
ans =
-1.9167 1.1667 -0.2500
1.8333 -1.3333 0.5000
-0.2500 0.5000 -0.2500
>> eig(mat1)
ans =
14.0501
-0.3119
-2.7382
Amitay Isaacs Introduction to Matlab
Introduction DataTypes Plots IO Programs Tools Vectors Matrices Strings Cells Structures
Matrices
Initialization
Assignment
Indexing
Operations
Arithmatic
Functions
Linear Algebra(Ax = B)
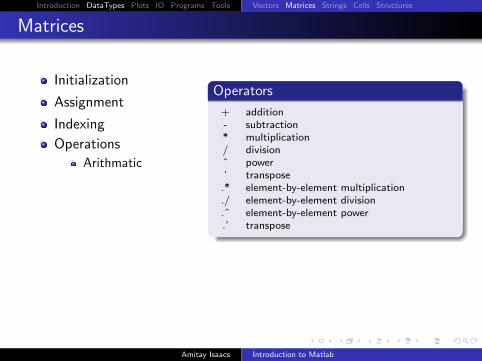
Operators
+ addition- subtraction* multiplication/ divisionˆ power’ transpose
.* element-by-element multiplication
./ element-by-element division
.ˆ element-by-element power.’ transpose
Amitay Isaacs Introduction to Matlab
Introduction DataTypes Plots IO Programs Tools Vectors Matrices Strings Cells Structures
Matrices
Initialization
Assignment
Indexing
Operations
ArithmaticFunctions
Linear Algebra(Ax = B)
Functions
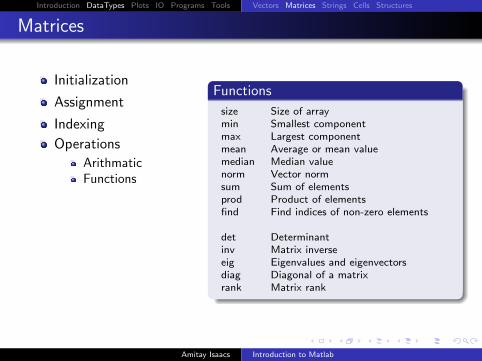
size Size of arraymin Smallest componentmax Largest componentmean Average or mean valuemedian Median valuenorm Vector normsum Sum of elementsprod Product of elementsfind Find indices of non-zero elements
det Determinantinv Matrix inverseeig Eigenvalues and eigenvectorsdiag Diagonal of a matrixrank Matrix rank
Amitay Isaacs Introduction to Matlab
Introduction DataTypes Plots IO Programs Tools Vectors Matrices Strings Cells Structures
Matrices
Initialization
Assignment
Indexing
Operations
ArithmaticFunctions
Linear Algebra(Ax = B)
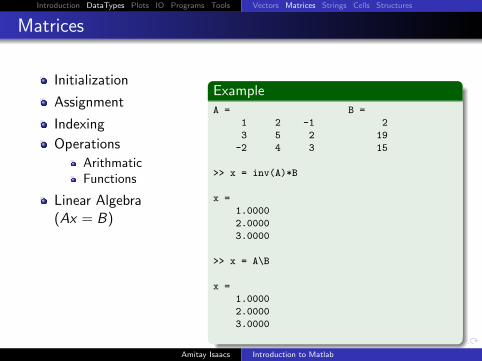
ExampleA = B =
1 2 -1 2
3 5 2 19
-2 4 3 15
>> x = inv(A)*B
x =
1.0000
2.0000
3.0000
>> x = A\B
x =
1.0000
2.0000
3.0000
Amitay Isaacs Introduction to Matlab

Introduction DataTypes Plots IO Programs Tools Vectors Matrices Strings Cells Structures
Strings
Assignment
Indexing
Operations
Amitay Isaacs Introduction to Matlab

Introduction DataTypes Plots IO Programs Tools Vectors Matrices Strings Cells Structures
Strings
Assignment
Indexing
Operations
Example>> var1 = ’hello’
var1 =
hello
>> var2 = [ var1 var1 ]
var2 =
hellohello
>> var3 = [ var1; var1 ]
var3 =
hello
hello
Amitay Isaacs Introduction to Matlab
Introduction DataTypes Plots IO Programs Tools Vectors Matrices Strings Cells Structures
Strings
Assignment
Indexing
Operations
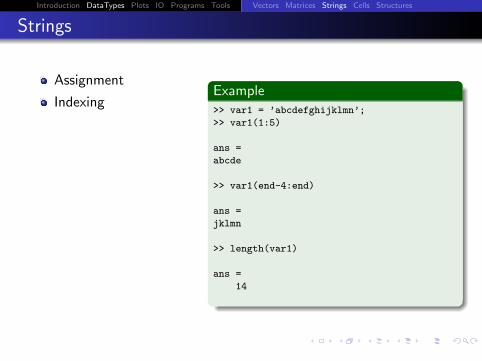
Example>> var1 = ’abcdefghijklmn’;
>> var1(1:5)
ans =
abcde
>> var1(end-4:end)
ans =
jklmn
>> length(var1)
ans =
14
Amitay Isaacs Introduction to Matlab

Introduction DataTypes Plots IO Programs Tools Vectors Matrices Strings Cells Structures
Strings
Assignment
Indexing
Operations
Example
>> var1 = [ ’h’, ’e’, ’l’, ’l’, ’o’ ];
>> strcmp(var1, ’hello’)
ans =
1
>> upper(var1)
var1 =
HELLO
>> char(var1 + 4)
ans =
lipps
Amitay Isaacs Introduction to Matlab
Introduction DataTypes Plots IO Programs Tools Vectors Matrices Strings Cells Structures
Strings
Assignment
Indexing
Operations
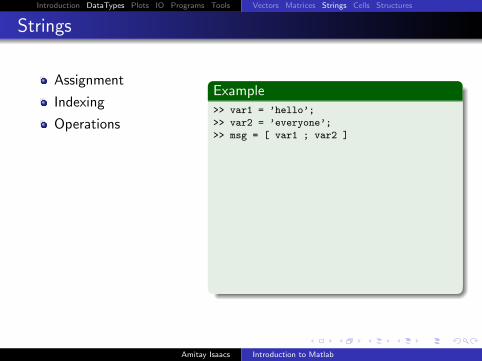
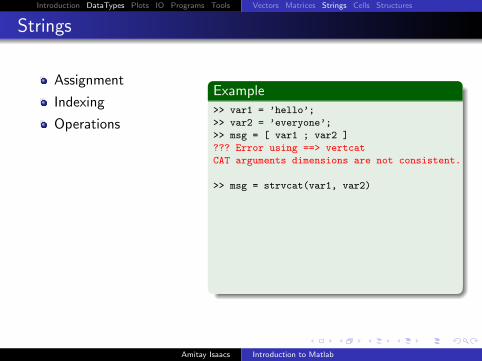
Example>> var1 = ’hello’;
>> var2 = ’everyone’;
>> msg = [ var1 ; var2 ]
??? Error using ==> vertcat
CAT arguments dimensions are not consistent.
>> msg = strvcat(var1, var2)
msg =
hello
everyone
>> size(msg)
ans =
2 8
Amitay Isaacs Introduction to Matlab

Introduction DataTypes Plots IO Programs Tools Vectors Matrices Strings Cells Structures
Strings
Assignment
Indexing
Operations
Example>> var1 = ’hello’;
>> var2 = ’everyone’;
>> msg = [ var1 ; var2 ]
??? Error using ==> vertcat
CAT arguments dimensions are not consistent.
>> msg = strvcat(var1, var2)
msg =
hello
everyone
>> size(msg)
ans =
2 8
Amitay Isaacs Introduction to Matlab

Introduction DataTypes Plots IO Programs Tools Vectors Matrices Strings Cells Structures
Cell Array
A cell array is a collection of contains called cells which can storedifferent types of data. Each cell of a cell array contains some typeof MATLAB array.
Amitay Isaacs Introduction to Matlab

Introduction DataTypes Plots IO Programs Tools Vectors Matrices Strings Cells Structures
Cell Array
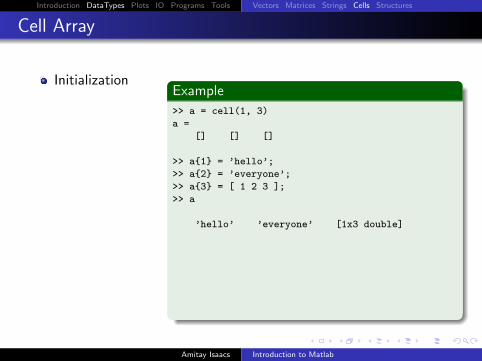
Initialization
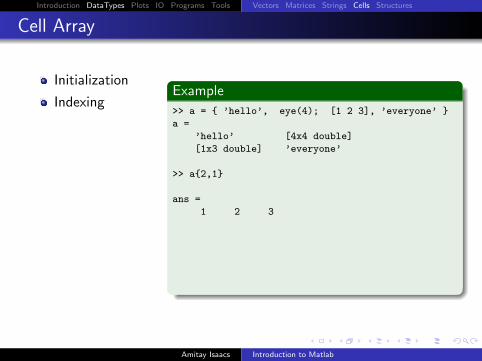
Indexing
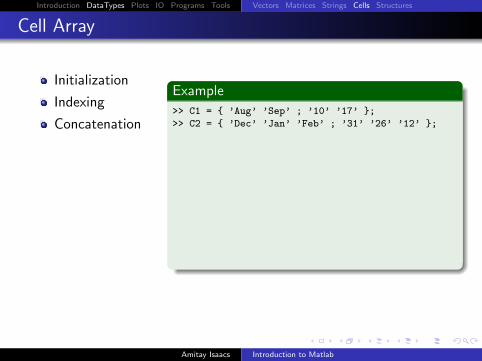
Concatenation
Example
>> a = cell(1, 3)
a =
[] [] []
>> a{1} = ’hello’;
>> a{2} = ’everyone’;
>> a{3} = [ 1 2 3 ];
>> a
’hello’ ’everyone’ [1x3 double]
>> b = { ’hello’ ; ’everyone’ }
b =
’hello’
’everyone’
Amitay Isaacs Introduction to Matlab

Introduction DataTypes Plots IO Programs Tools Vectors Matrices Strings Cells Structures
Cell Array
Initialization
Indexing
Concatenation
Example
>> a = cell(1, 3)
a =
[] [] []
>> a{1} = ’hello’;
>> a{2} = ’everyone’;
>> a{3} = [ 1 2 3 ];
>> a
’hello’ ’everyone’ [1x3 double]
>> b = { ’hello’ ; ’everyone’ }
b =
’hello’
’everyone’
Amitay Isaacs Introduction to Matlab

Introduction DataTypes Plots IO Programs Tools Vectors Matrices Strings Cells Structures
Cell Array
Initialization
Indexing
Concatenation
Example
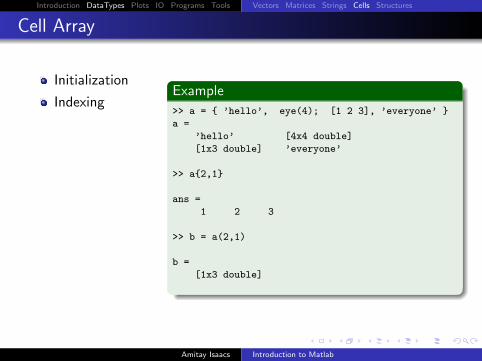
>> a = { ’hello’, eye(4); [1 2 3], ’everyone’ }
a =
’hello’ [4x4 double]
[1x3 double] ’everyone’
>> a{2,1}
ans =
1 2 3
>> b = a(2,1)
b =
[1x3 double]
Amitay Isaacs Introduction to Matlab
Introduction DataTypes Plots IO Programs Tools Vectors Matrices Strings Cells Structures
Cell Array
Initialization
Indexing
Concatenation
Example
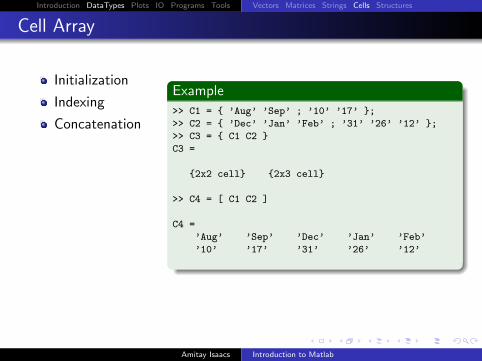
>> C1 = { ’Aug’ ’Sep’ ; ’10’ ’17’ };
>> C2 = { ’Dec’ ’Jan’ ’Feb’ ; ’31’ ’26’ ’12’ };
>> C3 = { C1 C2 }
C3 =
{2x2 cell} {2x3 cell}
>> C4 = [ C1 C2 ]
C4 =
’Aug’ ’Sep’ ’Dec’ ’Jan’ ’Feb’
’10’ ’17’ ’31’ ’26’ ’12’
Amitay Isaacs Introduction to Matlab

Introduction DataTypes Plots IO Programs Tools Vectors Matrices Strings Cells Structures
Cell Array
Initialization
Indexing
Concatenation
Example
>> C1 = { ’Aug’ ’Sep’ ; ’10’ ’17’ };
>> C2 = { ’Dec’ ’Jan’ ’Feb’ ; ’31’ ’26’ ’12’ };
>> C3 = { C1 C2 }
C3 =
{2x2 cell} {2x3 cell}
>> C4 = [ C1 C2 ]
C4 =
’Aug’ ’Sep’ ’Dec’ ’Jan’ ’Feb’
’10’ ’17’ ’31’ ’26’ ’12’
Amitay Isaacs Introduction to Matlab

Introduction DataTypes Plots IO Programs Tools Vectors Matrices Strings Cells Structures
Structures
A structre is a MATLAB data type to store hierarchical datatogether in a single entity. A structure consists mainly of datacontainers, called fields, and each of these fields stores an array ofsome MATLAB data type. Each field is assigned a name.
Amitay Isaacs Introduction to Matlab

Introduction DataTypes Plots IO Programs Tools Vectors Matrices Strings Cells Structures
Structures
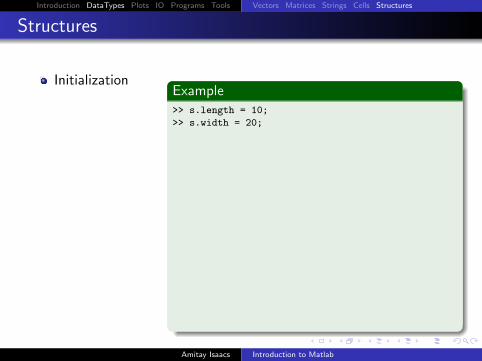
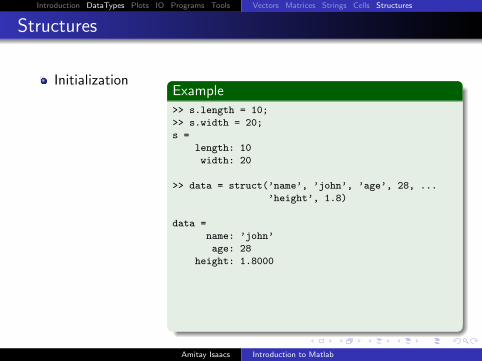
Initialization
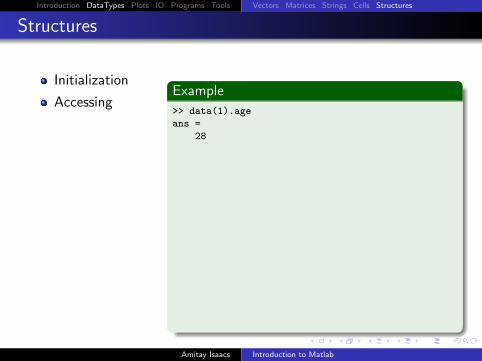
Accessing
Operations
Example
>> s.length = 10;
>> s.width = 20;
s =
length: 10
width: 20
>> data = struct(’name’, ’john’, ’age’, 28, ...
’height’, 1.8)
data =
name: ’john’
age: 28
height: 1.8000
>> data(2).name = ’mary’;
>> data(2).age = 20;
>> data(2).height = 1.5;
Amitay Isaacs Introduction to Matlab
Introduction DataTypes Plots IO Programs Tools Vectors Matrices Strings Cells Structures
Structures
Initialization
Accessing
Operations
Example>> s.length = 10;
>> s.width = 20;
s =
length: 10
width: 20
>> data = struct(’name’, ’john’, ’age’, 28, ...
’height’, 1.8)
data =
name: ’john’
age: 28
height: 1.8000
>> data(2).name = ’mary’;
>> data(2).age = 20;
>> data(2).height = 1.5;
Amitay Isaacs Introduction to Matlab

Introduction DataTypes Plots IO Programs Tools Vectors Matrices Strings Cells Structures
Structures
Initialization
Accessing
Operations
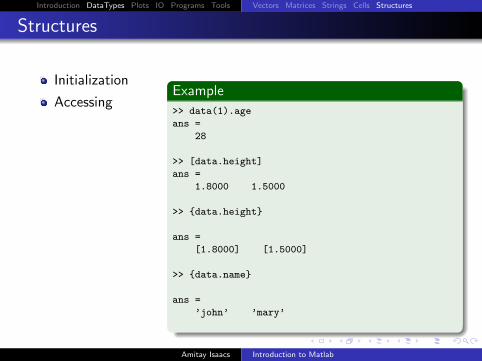
Example
>> data(1).age
ans =
28
>> [data.height]
ans =
1.8000 1.5000
>> {data.height}
ans =
[1.8000] [1.5000]
>> {data.name}
ans =
’john’ ’mary’
Amitay Isaacs Introduction to Matlab
Introduction DataTypes Plots IO Programs Tools Vectors Matrices Strings Cells Structures
Structures
Initialization
Accessing
Operations
Example
>> data(1).age
ans =
28
>> [data.height]
ans =
1.8000 1.5000
>> {data.height}
ans =
[1.8000] [1.5000]
>> {data.name}
ans =
’john’ ’mary’
Amitay Isaacs Introduction to Matlab

Introduction DataTypes Plots IO Programs Tools Vectors Matrices Strings Cells Structures
Structures
Initialization
Accessing
Operations
Example>> data
data =
1x2 struct array with fields:
name
age
height
>> fieldnames(data)
ans =
’name’
’age’
’height’
>> data(1) = [];
>> size(data)
ans =
1 1
Amitay Isaacs Introduction to Matlab
Introduction DataTypes Plots IO Programs Tools Vectors Matrices Strings Cells Structures
Things to Remember
Rows and columns are always numbered starting at 1
A single number is really a 1x1 matrix in MATLAB
Variable names are case-sensitive
[] represents an empty matrix
{} represents an empty cell array
struct([]) represents an empty structure
Amitay Isaacs Introduction to Matlab
Introduction DataTypes Plots IO Programs Tools Simple Plot Multiple Plots
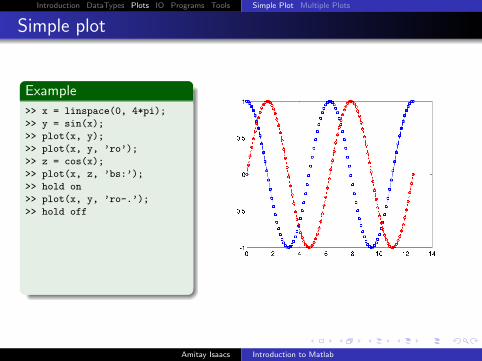
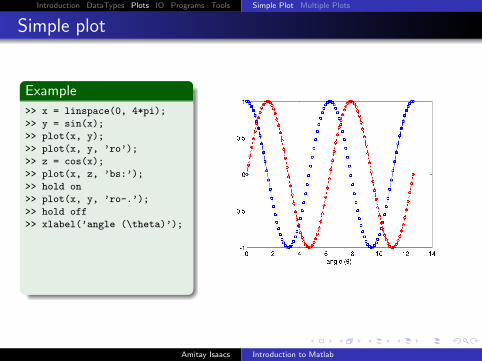
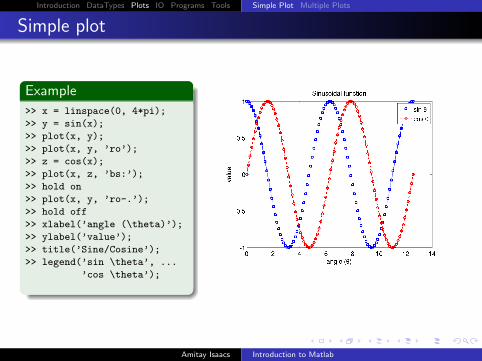
Simple plot
Example
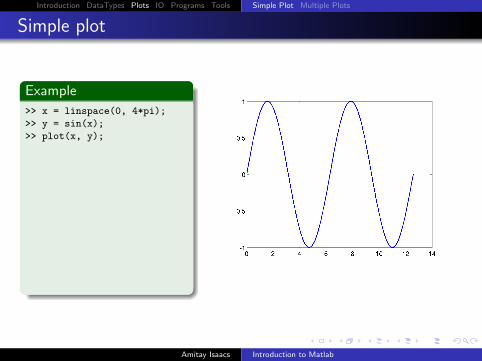
>> x = linspace(0, 4*pi);
>> y = sin(x);
>> plot(x, y);
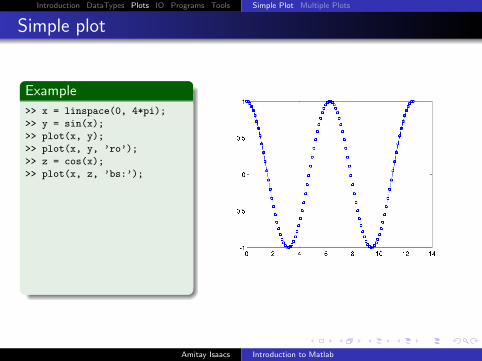
>> plot(x, y, ’ro’);
>> z = cos(x);
>> plot(x, z, ’bs:’);
>> hold on
>> plot(x, y, ’ro-.’);
>> hold off
>> xlabel(’angle (\theta)’);
>> ylabel(’value’);
>> title(’Sine/Cosine’);
>> legend(’sin \theta’, ...
’cos \theta’);
Amitay Isaacs Introduction to Matlab

Introduction DataTypes Plots IO Programs Tools Simple Plot Multiple Plots
Simple plot
Example
>> x = linspace(0, 4*pi);
>> y = sin(x);
>> plot(x, y);
>> plot(x, y, ’ro’);
>> z = cos(x);
>> plot(x, z, ’bs:’);
>> hold on
>> plot(x, y, ’ro-.’);
>> hold off
>> xlabel(’angle (\theta)’);
>> ylabel(’value’);
>> title(’Sine/Cosine’);
>> legend(’sin \theta’, ...
’cos \theta’);
Amitay Isaacs Introduction to Matlab

Introduction DataTypes Plots IO Programs Tools Simple Plot Multiple Plots
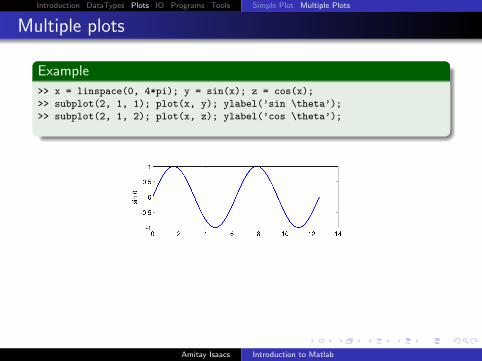
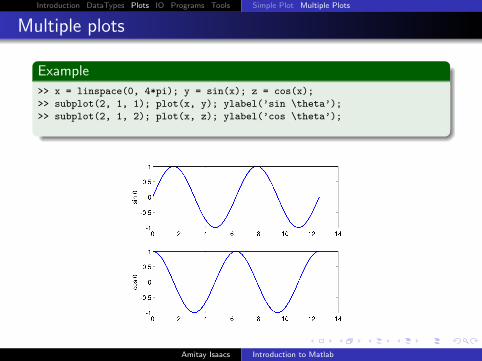
Multiple plots
Example
>> x = linspace(0, 4*pi); y = sin(x); z = cos(x);
Amitay Isaacs Introduction to Matlab

Introduction DataTypes Plots IO Programs Tools Simple Plot Multiple Plots
Multiple plots
Example
>> x = linspace(0, 4*pi); y = sin(x); z = cos(x);
>> subplot(2, 1, 1); plot(x, y); ylabel(’sin \theta’);
Amitay Isaacs Introduction to Matlab

Introduction DataTypes Plots IO Programs Tools Simple Plot Multiple Plots
Multiple plots
Example
>> x = linspace(0, 4*pi); y = sin(x); z = cos(x);
>> subplot(2, 1, 1); plot(x, y); ylabel(’sin \theta’);
Amitay Isaacs Introduction to Matlab
Introduction DataTypes Plots IO Programs Tools Simple Plot Multiple Plots
Multiple plots
Example
>> x = linspace(0, 4*pi); y = sin(x); z = cos(x);
>> subplot(2, 1, 1); plot(x, y); ylabel(’sin \theta’);
>> subplot(2, 1, 2); plot(x, z); ylabel(’cos \theta’);
Amitay Isaacs Introduction to Matlab
Introduction DataTypes Plots IO Programs Tools Simple Plot Multiple Plots
Multiple plots
Example
>> x = linspace(0, 4*pi); y = sin(x); z = cos(x);
>> subplot(2, 1, 1); plot(x, y); ylabel(’sin \theta’);
>> subplot(2, 1, 2); plot(x, z); ylabel(’cos \theta’);
Amitay Isaacs Introduction to Matlab
Introduction DataTypes Plots IO Programs Tools Simple Plot Multiple Plots
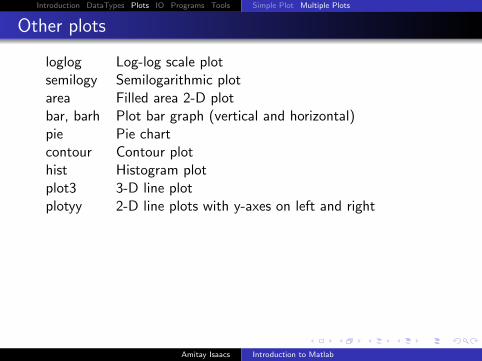
Other plots
loglog Log-log scale plotsemilogy Semilogarithmic plotarea Filled area 2-D plotbar, barh Plot bar graph (vertical and horizontal)pie Pie chartcontour Contour plothist Histogram plotplot3 3-D line plotplotyy 2-D line plots with y-axes on left and right
Amitay Isaacs Introduction to Matlab

Introduction DataTypes Plots IO Programs Tools Simple Plot Multiple Plots
Exercise: How to create this figure?
Amitay Isaacs Introduction to Matlab
Introduction DataTypes Plots IO Programs Tools Data I/O File I/O
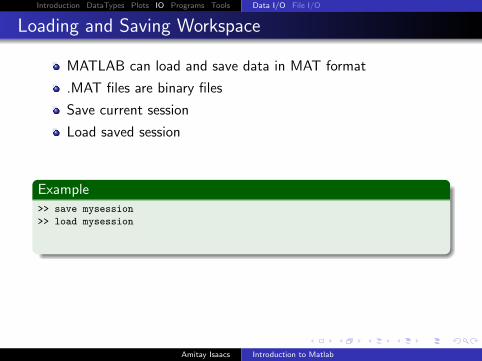
Loading and Saving Workspace
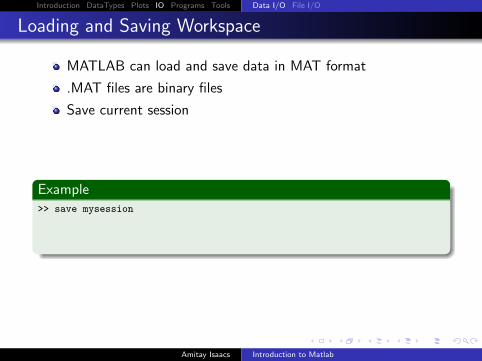
MATLAB can load and save data in MAT format
.MAT files are binary files
Save current session
Load saved session
Save only some variables
Amitay Isaacs Introduction to Matlab

Introduction DataTypes Plots IO Programs Tools Data I/O File I/O
Loading and Saving Workspace
MATLAB can load and save data in MAT format
.MAT files are binary files
Save current session
Load saved session
Save only some variables
Amitay Isaacs Introduction to Matlab

Introduction DataTypes Plots IO Programs Tools Data I/O File I/O
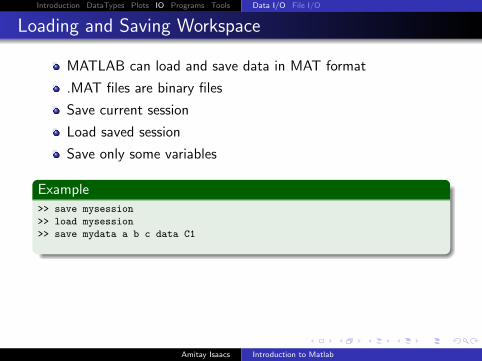
Loading and Saving Workspace
MATLAB can load and save data in MAT format
.MAT files are binary files
Save current session
Load saved session
Save only some variables
Amitay Isaacs Introduction to Matlab
Introduction DataTypes Plots IO Programs Tools Data I/O File I/O
Loading and Saving Workspace
MATLAB can load and save data in MAT format
.MAT files are binary files
Save current session
Load saved session
Save only some variables
Example>> save mysession
>> load mysession
>> save mydata a b c data C1
Amitay Isaacs Introduction to Matlab
Introduction DataTypes Plots IO Programs Tools Data I/O File I/O
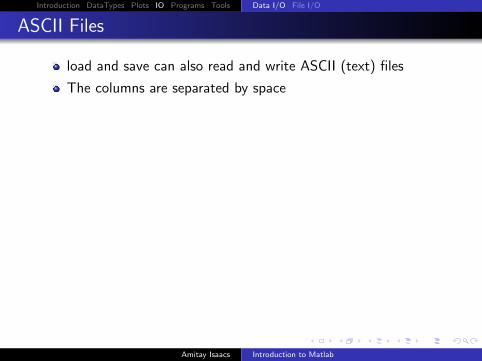
ASCII Files
load and save can also read and write ASCII (text) files
The columns are separated by space
Write ASCII file
Read ASCII file
Reading free format text (output of some program)
Amitay Isaacs Introduction to Matlab
Introduction DataTypes Plots IO Programs Tools Data I/O File I/O
ASCII Files
load and save can also read and write ASCII (text) files
The columns are separated by space
Write ASCII file
Read ASCII file
Reading free format text (output of some program)
Amitay Isaacs Introduction to Matlab
Introduction DataTypes Plots IO Programs Tools Data I/O File I/O
ASCII Files
load and save can also read and write ASCII (text) files
The columns are separated by space
Write ASCII file
Read ASCII file
Reading free format text (output of some program)
Amitay Isaacs Introduction to Matlab
Introduction DataTypes Plots IO Programs Tools Data I/O File I/O
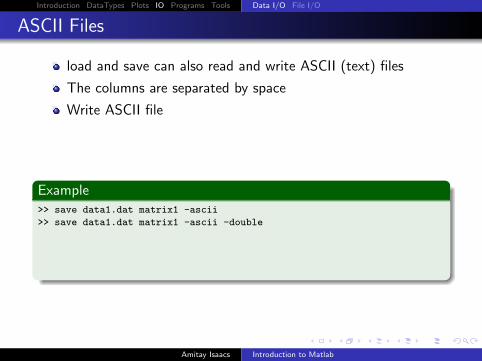
ASCII Files
load and save can also read and write ASCII (text) files
The columns are separated by space
Write ASCII file
Read ASCII file
Reading free format text (output of some program)
Example>> save data1.dat matrix1 -ascii
>> save data1.dat matrix1 -ascii -double
>> load data1.dat -ascii
>> t1 = load(’data1.dat’, ’-ascii’);
>> help textread
Amitay Isaacs Introduction to Matlab

Introduction DataTypes Plots IO Programs Tools Data I/O File I/O
ASCII Files
load and save can also read and write ASCII (text) files
The columns are separated by space
Write ASCII file
Read ASCII file
Reading free format text (output of some program)
Example>> save data1.dat matrix1 -ascii
>> save data1.dat matrix1 -ascii -double
>> load data1.dat -ascii
>> t1 = load(’data1.dat’, ’-ascii’);
>> help textread
Amitay Isaacs Introduction to Matlab
Introduction DataTypes Plots IO Programs Tools Data I/O File I/O
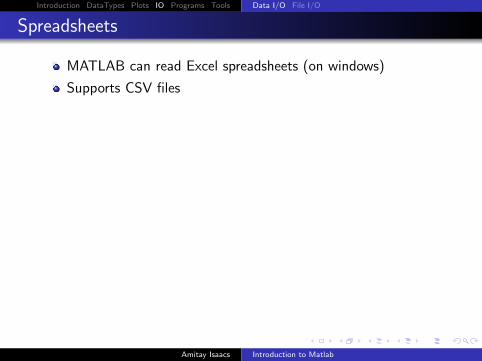
Spreadsheets
MATLAB can read Excel spreadsheets (on windows)
Supports CSV files
Read/write Excel spreadsheet
Read ASCII file
Import Wizard can be used to import data
Amitay Isaacs Introduction to Matlab
Introduction DataTypes Plots IO Programs Tools Data I/O File I/O
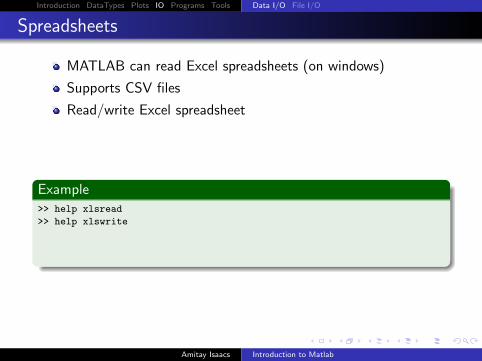
Spreadsheets
MATLAB can read Excel spreadsheets (on windows)
Supports CSV files
Read/write Excel spreadsheet
Read ASCII file
Import Wizard can be used to import data
Amitay Isaacs Introduction to Matlab
Introduction DataTypes Plots IO Programs Tools Data I/O File I/O
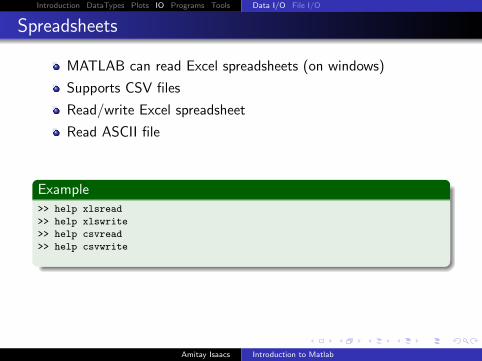
Spreadsheets
MATLAB can read Excel spreadsheets (on windows)
Supports CSV files
Read/write Excel spreadsheet
Read ASCII file
Import Wizard can be used to import data
Amitay Isaacs Introduction to Matlab
Introduction DataTypes Plots IO Programs Tools Data I/O File I/O
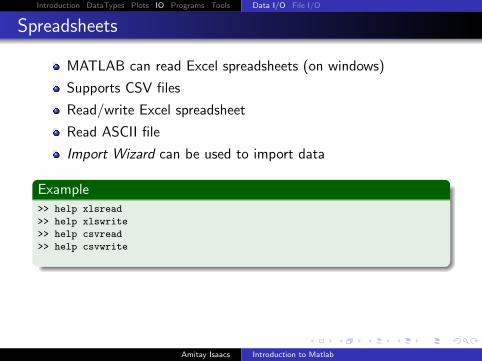
Spreadsheets
MATLAB can read Excel spreadsheets (on windows)
Supports CSV files
Read/write Excel spreadsheet
Read ASCII file
Import Wizard can be used to import data
Example>> help xlsread
>> help xlswrite
>> help csvread
>> help csvwrite
Amitay Isaacs Introduction to Matlab
Introduction DataTypes Plots IO Programs Tools Data I/O File I/O
Spreadsheets
MATLAB can read Excel spreadsheets (on windows)
Supports CSV files
Read/write Excel spreadsheet
Read ASCII file
Import Wizard can be used to import data
Example>> help xlsread
>> help xlswrite
>> help csvread
>> help csvwrite
Amitay Isaacs Introduction to Matlab

Introduction DataTypes Plots IO Programs Tools Data I/O File I/O
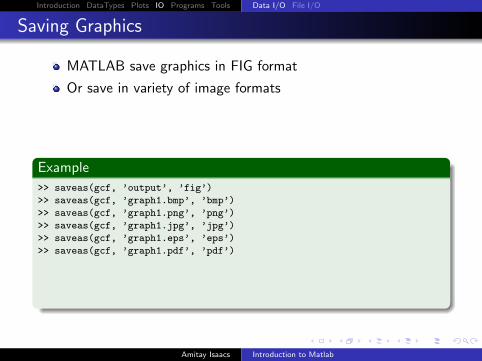
Saving Graphics
MATLAB save graphics in FIG format
Or save in variety of image formats
Read/write Images
MATAB support file formats
Amitay Isaacs Introduction to Matlab

Introduction DataTypes Plots IO Programs Tools Data I/O File I/O
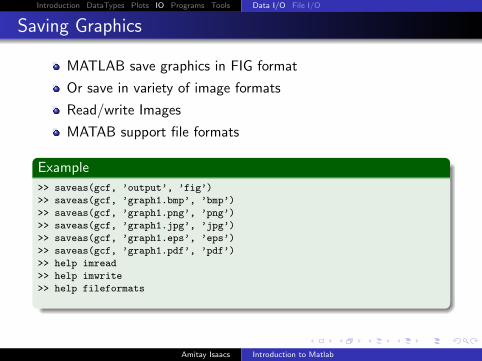
Saving Graphics
MATLAB save graphics in FIG format
Or save in variety of image formats
Read/write Images
MATAB support file formats
Example
>> saveas(gcf, ’output’, ’fig’)
>> saveas(gcf, ’graph1.bmp’, ’bmp’)
>> saveas(gcf, ’graph1.png’, ’png’)
>> saveas(gcf, ’graph1.jpg’, ’jpg’)
>> saveas(gcf, ’graph1.eps’, ’eps’)
>> saveas(gcf, ’graph1.pdf’, ’pdf’)
>> help imread
>> help imwrite
>> help fileformats
Amitay Isaacs Introduction to Matlab
Introduction DataTypes Plots IO Programs Tools Data I/O File I/O
Saving Graphics
MATLAB save graphics in FIG format
Or save in variety of image formats
Read/write Images
MATAB support file formats
Example
>> saveas(gcf, ’output’, ’fig’)
>> saveas(gcf, ’graph1.bmp’, ’bmp’)
>> saveas(gcf, ’graph1.png’, ’png’)
>> saveas(gcf, ’graph1.jpg’, ’jpg’)
>> saveas(gcf, ’graph1.eps’, ’eps’)
>> saveas(gcf, ’graph1.pdf’, ’pdf’)
>> help imread
>> help imwrite
>> help fileformats
Amitay Isaacs Introduction to Matlab
Introduction DataTypes Plots IO Programs Tools Data I/O File I/O
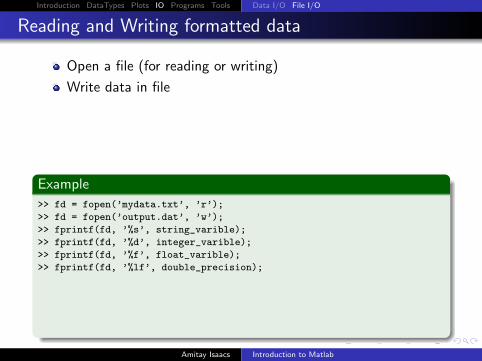
Reading and Writing formatted data
Open a file (for reading or writing)
Write data in file
Reading data from file
Closing a file
Formatted output on screen
Amitay Isaacs Introduction to Matlab
Introduction DataTypes Plots IO Programs Tools Data I/O File I/O
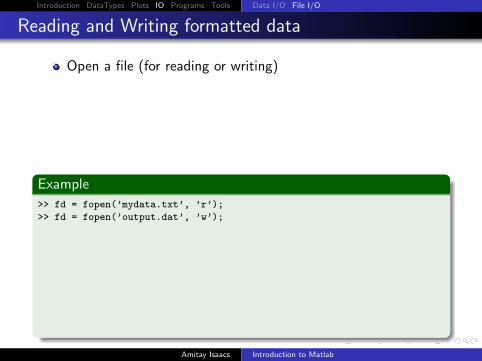
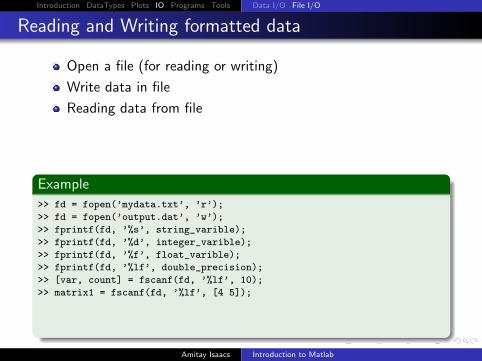
Reading and Writing formatted data
Open a file (for reading or writing)
Write data in file
Reading data from file
Closing a file
Formatted output on screen
Example
>> fd = fopen(’mydata.txt’, ’r’);
>> fd = fopen(’output.dat’, ’w’);
>> fprintf(fd, ’%s’, string_varible);
>> fprintf(fd, ’%d’, integer_varible);
>> fprintf(fd, ’%f’, float_varible);
>> fprintf(fd, ’%lf’, double_precision);
>> [var, count] = fscanf(fd, ’%lf’, 10);
>> matrix1 = fscanf(fd, ’%lf’, [4 5]);
>> fclose(fd);
>> fprintf(’hello everyone, my name is %s\n’, name);
Amitay Isaacs Introduction to Matlab
Introduction DataTypes Plots IO Programs Tools Data I/O File I/O
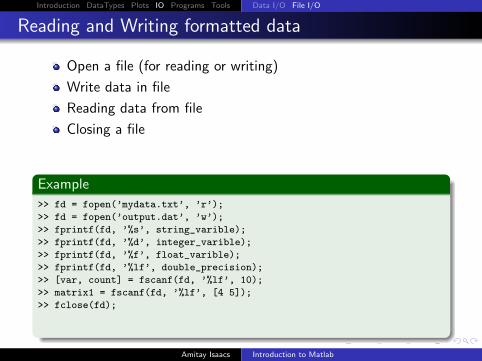
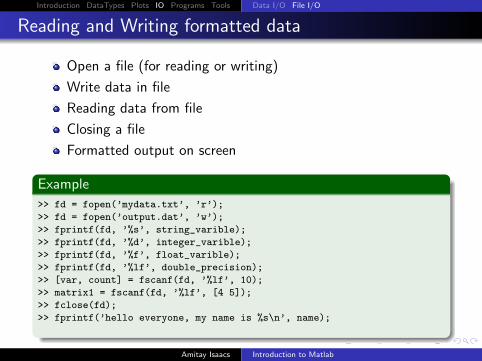
Reading and Writing formatted data
Open a file (for reading or writing)
Write data in file
Reading data from file
Closing a file
Formatted output on screen
Example
>> fd = fopen(’mydata.txt’, ’r’);
>> fd = fopen(’output.dat’, ’w’);
>> fprintf(fd, ’%s’, string_varible);
>> fprintf(fd, ’%d’, integer_varible);
>> fprintf(fd, ’%f’, float_varible);
>> fprintf(fd, ’%lf’, double_precision);
>> [var, count] = fscanf(fd, ’%lf’, 10);
>> matrix1 = fscanf(fd, ’%lf’, [4 5]);
>> fclose(fd);
>> fprintf(’hello everyone, my name is %s\n’, name);
Amitay Isaacs Introduction to Matlab
Introduction DataTypes Plots IO Programs Tools Namespaces Control Flow Operators
Writing Programs
Programs are written as m-files. They are interpreted bymatlab as programs. There are two kinds of programs -
1 Scripts do not accept input arguments, nor do they produceoutput arguments. Scripts are simple MATLAB commandswritten in a file. They operate on existing workspace.
2 Functions accept input argument and produce outputvariables. All internal variables are local to the function andcommands operate on the function workspace.
If duplicate functions (names) exist, the first in the searchpath (from path command) is executed.
Amitay Isaacs Introduction to Matlab
Introduction DataTypes Plots IO Programs Tools Namespaces Control Flow Operators
Script Example
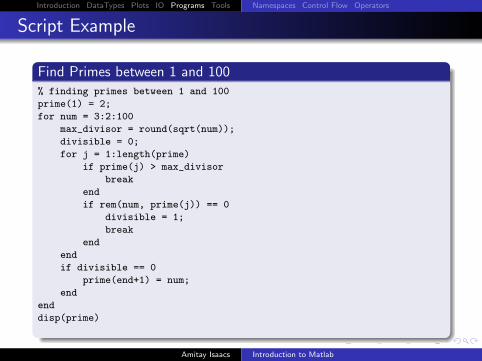
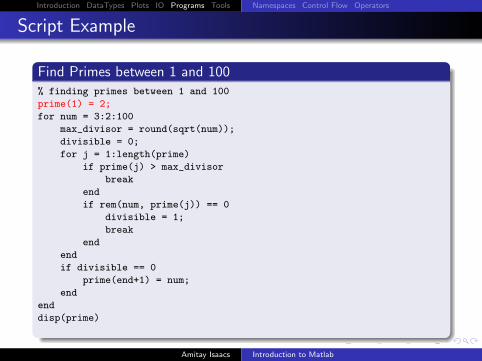
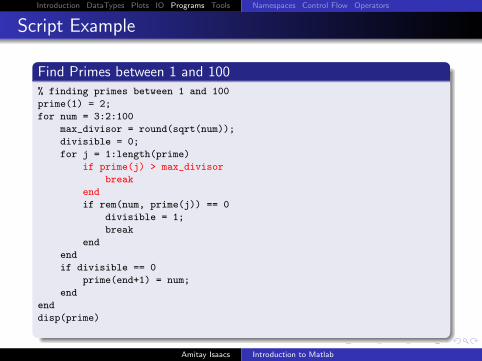
Find Primes between 1 and 100
% finding primes between 1 and 100
prime(1) = 2;
for num = 3:2:100
max_divisor = round(sqrt(num));
divisible = 0;
for j = 1:length(prime)
if prime(j) > max_divisor
break
end
if rem(num, prime(j)) == 0
divisible = 1;
break
end
end
if divisible == 0
prime(end+1) = num;
end
end
disp(prime)
Amitay Isaacs Introduction to Matlab
Introduction DataTypes Plots IO Programs Tools Namespaces Control Flow Operators
Script Example
Find Primes between 1 and 100% finding primes between 1 and 100
prime(1) = 2;
for num = 3:2:100
max_divisor = round(sqrt(num));
divisible = 0;
for j = 1:length(prime)
if prime(j) > max_divisor
break
end
if rem(num, prime(j)) == 0
divisible = 1;
break
end
end
if divisible == 0
prime(end+1) = num;
end
end
disp(prime)
Amitay Isaacs Introduction to Matlab
Introduction DataTypes Plots IO Programs Tools Namespaces Control Flow Operators
Function Example
Find Primes between 1 and n
function [prime] = find_primes(n)
prime(1) = 2;
for num = 3:2:n
if isprime(num, prime)
prime(end+1) = num;
end
end
end
function [flag] = isprime(n, prime)
flag = true;
max_divisor = round(sqrt(n));
for j = 1:length(prime)
if prime(j) < max_divisor && rem(n, prime(j) == 0
flag = false;
break
end
end
end
Amitay Isaacs Introduction to Matlab
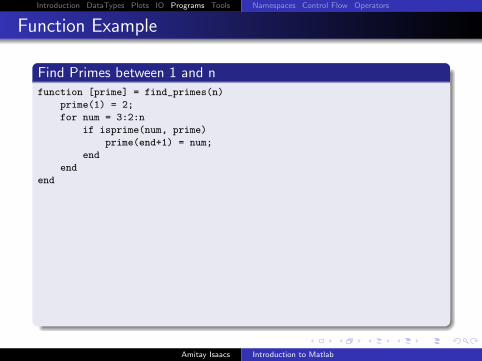
Introduction DataTypes Plots IO Programs Tools Namespaces Control Flow Operators
Function Example
Find Primes between 1 and nfunction [prime] = find_primes(n)
prime(1) = 2;
for num = 3:2:n
if isprime(num, prime)
prime(end+1) = num;
end
end
end
function [flag] = isprime(n, prime)
flag = true;
max_divisor = round(sqrt(n));
for j = 1:length(prime)
if prime(j) < max_divisor && rem(n, prime(j) == 0
flag = false;
break
end
end
end
Amitay Isaacs Introduction to Matlab
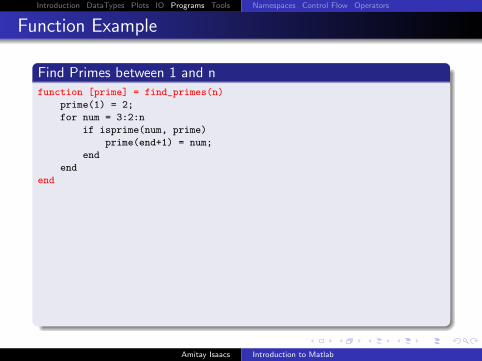
Introduction DataTypes Plots IO Programs Tools Namespaces Control Flow Operators
Function Example
Find Primes between 1 and nfunction [prime] = find_primes(n)
prime(1) = 2;
for num = 3:2:n
if isprime(num, prime)
prime(end+1) = num;
end
end
end
function [flag] = isprime(n, prime)
flag = true;
max_divisor = round(sqrt(n));
for j = 1:length(prime)
if prime(j) < max_divisor && rem(n, prime(j) == 0
flag = false;
break
end
end
end
Amitay Isaacs Introduction to Matlab
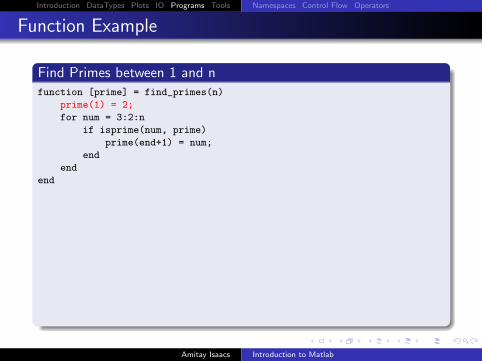
Introduction DataTypes Plots IO Programs Tools Namespaces Control Flow Operators
Function Example
Find Primes between 1 and nfunction [prime] = find_primes(n)
prime(1) = 2;
for num = 3:2:n
if isprime(num, prime)
prime(end+1) = num;
end
end
end
function [flag] = isprime(n, prime)
flag = true;
max_divisor = round(sqrt(n));
for j = 1:length(prime)
if prime(j) < max_divisor && rem(n, prime(j) == 0
flag = false;
break
end
end
end
Amitay Isaacs Introduction to Matlab
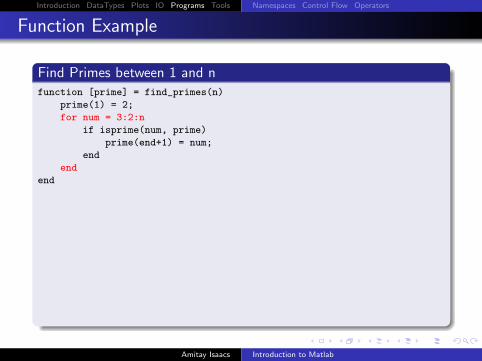
Introduction DataTypes Plots IO Programs Tools Namespaces Control Flow Operators
Function Example
Find Primes between 1 and nfunction [prime] = find_primes(n)
prime(1) = 2;
for num = 3:2:n
if isprime(num, prime)
prime(end+1) = num;
end
end
end
function [flag] = isprime(n, prime)
flag = true;
max_divisor = round(sqrt(n));
for j = 1:length(prime)
if prime(j) < max_divisor && rem(n, prime(j) == 0
flag = false;
break
end
end
end
Amitay Isaacs Introduction to Matlab
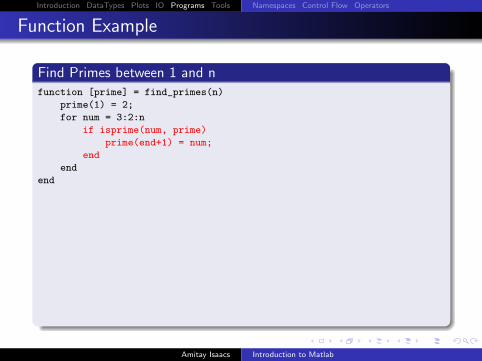
Introduction DataTypes Plots IO Programs Tools Namespaces Control Flow Operators
Function Example
Find Primes between 1 and nfunction [prime] = find_primes(n)
prime(1) = 2;
for num = 3:2:n
if isprime(num, prime)
prime(end+1) = num;
end
end
end
function [flag] = isprime(n, prime)
flag = true;
max_divisor = round(sqrt(n));
for j = 1:length(prime)
if prime(j) < max_divisor && rem(n, prime(j) == 0
flag = false;
break
end
end
end
Amitay Isaacs Introduction to Matlab
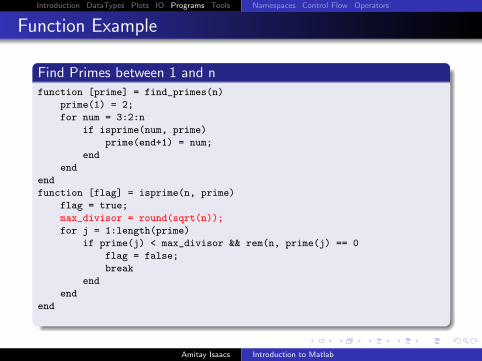
Introduction DataTypes Plots IO Programs Tools Namespaces Control Flow Operators
Function Example
Find Primes between 1 and nfunction [prime] = find_primes(n)
prime(1) = 2;
for num = 3:2:n
if isprime(num, prime)
prime(end+1) = num;
end
end
end
function [flag] = isprime(n, prime)
flag = true;
max_divisor = round(sqrt(n));
for j = 1:length(prime)
if prime(j) < max_divisor && rem(n, prime(j) == 0
flag = false;
break
end
end
end
Amitay Isaacs Introduction to Matlab
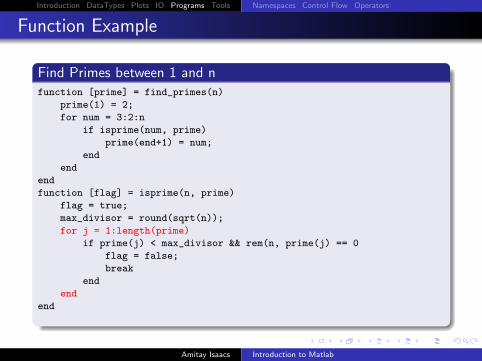
Introduction DataTypes Plots IO Programs Tools Namespaces Control Flow Operators
Function Example
Find Primes between 1 and nfunction [prime] = find_primes(n)
prime(1) = 2;
for num = 3:2:n
if isprime(num, prime)
prime(end+1) = num;
end
end
end
function [flag] = isprime(n, prime)
flag = true;
max_divisor = round(sqrt(n));
for j = 1:length(prime)
if prime(j) < max_divisor && rem(n, prime(j) == 0
flag = false;
break
end
end
end
Amitay Isaacs Introduction to Matlab
Introduction DataTypes Plots IO Programs Tools Namespaces Control Flow Operators
Namespaces
T
here are 3 namespaces.
1 Workspace - workspace variables
Variables defined on command-line and in scriptsCan be accessed from command-line and from scripts
2 Function - local variables
Variables defined in functionsCan be accessed only from functions that define them
3 Global - global variables
Variables defined on command-line, in scripts, and in functionsCan be access from command-line, scripts and functionsNeed to declare variable as global before using it
Amitay Isaacs Introduction to Matlab

Introduction DataTypes Plots IO Programs Tools Namespaces Control Flow Operators
Namespaces
There are 3 namespaces.
1 Workspace - workspace variables
Variables defined on command-line and in scriptsCan be accessed from command-line and from scripts
2 Function - local variables
Variables defined in functionsCan be accessed only from functions that define them
3 Global - global variables
Variables defined on command-line, in scripts, and in functionsCan be access from command-line, scripts and functionsNeed to declare variable as global before using it
Amitay Isaacs Introduction to Matlab
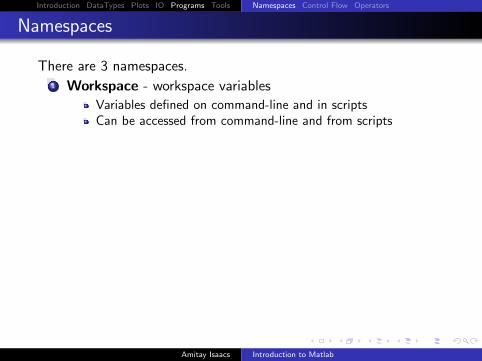
Introduction DataTypes Plots IO Programs Tools Namespaces Control Flow Operators
Namespaces
There are 3 namespaces.1 Workspace - workspace variables
Variables defined on command-line and in scriptsCan be accessed from command-line and from scripts
2 Function - local variables
Variables defined in functionsCan be accessed only from functions that define them
3 Global - global variables
Variables defined on command-line, in scripts, and in functionsCan be access from command-line, scripts and functionsNeed to declare variable as global before using it
Amitay Isaacs Introduction to Matlab
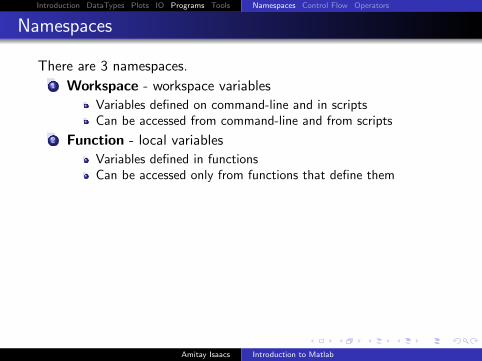
Introduction DataTypes Plots IO Programs Tools Namespaces Control Flow Operators
Namespaces
There are 3 namespaces.1 Workspace - workspace variables
Variables defined on command-line and in scriptsCan be accessed from command-line and from scripts
2 Function - local variables
Variables defined in functionsCan be accessed only from functions that define them
3 Global - global variables
Variables defined on command-line, in scripts, and in functionsCan be access from command-line, scripts and functionsNeed to declare variable as global before using it
Amitay Isaacs Introduction to Matlab

Introduction DataTypes Plots IO Programs Tools Namespaces Control Flow Operators
For Loop
Used to iterate for known fixed values specified as an array.
Examplefor x = -7.4:0.1:4.5
some matlab commands;
end
Example
for k = [0.1 0.4 3 7.3 -19.3 ]
some matlab commands;
end
Examplefor i = 1:4
for j = 1:4
a(i,j) = (i + j)^2
end
end
Amitay Isaacs Introduction to Matlab
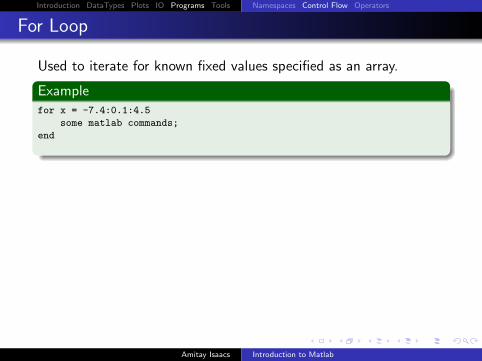
Introduction DataTypes Plots IO Programs Tools Namespaces Control Flow Operators
For Loop
Used to iterate for known fixed values specified as an array.
Examplefor x = -7.4:0.1:4.5
some matlab commands;
end
Example
for k = [0.1 0.4 3 7.3 -19.3 ]
some matlab commands;
end
Examplefor i = 1:4
for j = 1:4
a(i,j) = (i + j)^2
end
end
Amitay Isaacs Introduction to Matlab

Introduction DataTypes Plots IO Programs Tools Namespaces Control Flow Operators
While Loop
Used to iterate till some condition is satisfied
Examplewhile value < 10
some matlab commands;
end
Example
while (a < 3) & (b ~= 4)
some matlab commands;
end
Amitay Isaacs Introduction to Matlab
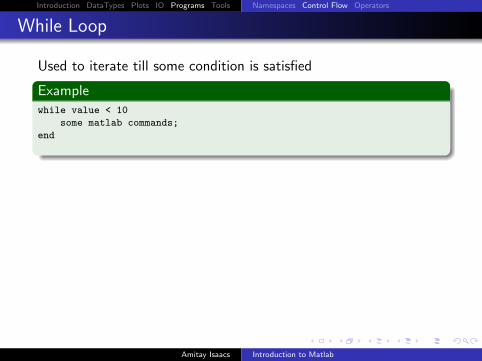
Introduction DataTypes Plots IO Programs Tools Namespaces Control Flow Operators
While Loop
Used to iterate till some condition is satisfied
Examplewhile value < 10
some matlab commands;
end
Example
while (a < 3) & (b ~= 4)
some matlab commands;
end
Amitay Isaacs Introduction to Matlab
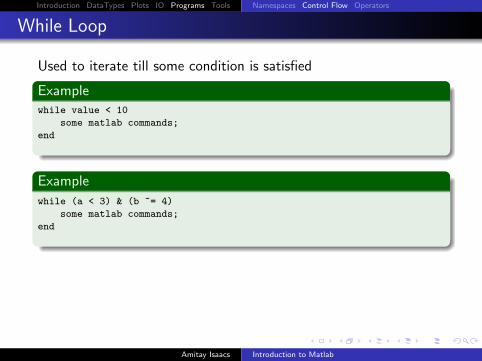
Introduction DataTypes Plots IO Programs Tools Namespaces Control Flow Operators
While Loop
Used to iterate till some condition is satisfied
Examplewhile value < 10
some matlab commands;
end
Example
while (a < 3) & (b ~= 4)
some matlab commands;
end
Amitay Isaacs Introduction to Matlab
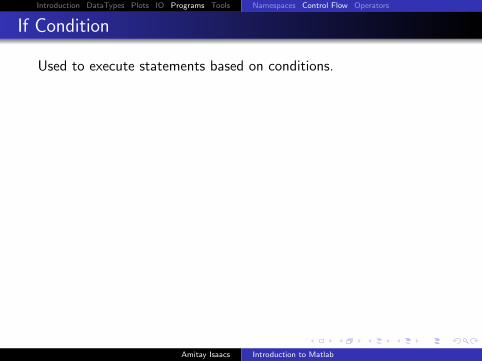
Introduction DataTypes Plots IO Programs Tools Namespaces Control Flow Operators
If Condition
Used to execute statements based on conditions.
Exampleif i > 10
some matlab commands;
end
Exampleif x < 10
disp(’value less than 10’)
elseif x <= 20
disp(’value between 10 and 20’)
elseif x <= 40
disp(’value between 20 and 40’)
else
disp(’value greater than 40’)
end
Amitay Isaacs Introduction to Matlab

Introduction DataTypes Plots IO Programs Tools Namespaces Control Flow Operators
Switch Condition
Used to execute statements based on values of a variable
Example
switch lower(method)
case {’linear’, ’bilinear’}
disp(’Method is linear’)
case ’cubic’
disp(’Method is cubic’)
otherwise
disp(’Unknown method’)
end
Amitay Isaacs Introduction to Matlab
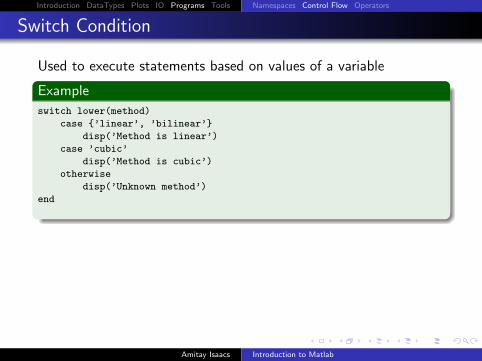
Introduction DataTypes Plots IO Programs Tools Namespaces Control Flow Operators
Switch Condition
Used to execute statements based on values of a variable
Example
switch lower(method)
case {’linear’, ’bilinear’}
disp(’Method is linear’)
case ’cubic’
disp(’Method is cubic’)
otherwise
disp(’Unknown method’)
end
Amitay Isaacs Introduction to Matlab
Introduction DataTypes Plots IO Programs Tools Namespaces Control Flow Operators
break / continue
Used to control the iterations
If a number is even, skip it
When sum reaches 78, stop processing
Amitay Isaacs Introduction to Matlab
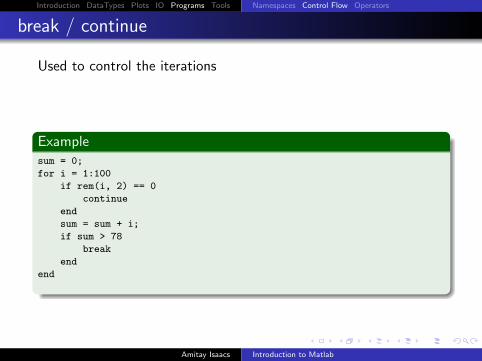
Introduction DataTypes Plots IO Programs Tools Namespaces Control Flow Operators
break / continue
Used to control the iterations
If a number is even, skip it
When sum reaches 78, stop processing
Examplesum = 0;
for i = 1:100
if rem(i, 2) == 0
continue
end
sum = sum + i;
if sum > 78
break
end
end
Amitay Isaacs Introduction to Matlab
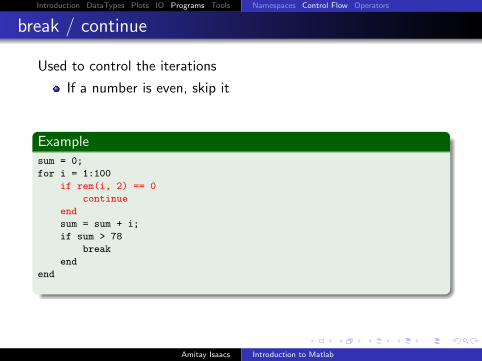
Introduction DataTypes Plots IO Programs Tools Namespaces Control Flow Operators
break / continue
Used to control the iterations
If a number is even, skip it
When sum reaches 78, stop processing
Examplesum = 0;
for i = 1:100
if rem(i, 2) == 0
continue
end
sum = sum + i;
if sum > 78
break
end
end
Amitay Isaacs Introduction to Matlab

Introduction DataTypes Plots IO Programs Tools Namespaces Control Flow Operators
Functions
Handling variable number of input/output arguments.
Amitay Isaacs Introduction to Matlab

Introduction DataTypes Plots IO Programs Tools Namespaces Control Flow Operators
Functions
Handling variable number of input/output arguments.
Example
function [sum, varargout] = calculate(varargin)
% CALCULATE Calculate sum and product of arguments
%
sum = 0;
prod = 1;
for i = 1:nargin
sum = sum + varargin{i};
prod = prod * varargin{i};
end
if nargout == 2
varargout{1} = prod;
end
end
Amitay Isaacs Introduction to Matlab
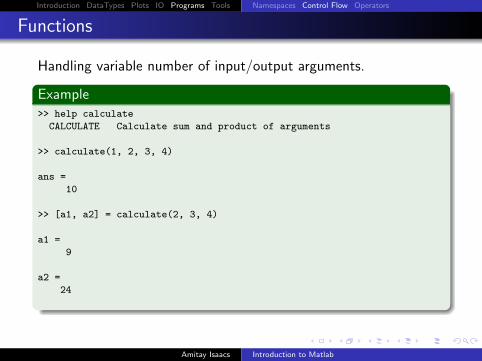
Introduction DataTypes Plots IO Programs Tools Namespaces Control Flow Operators
Functions
Handling variable number of input/output arguments.
Example>> help calculate
CALCULATE Calculate sum and product of arguments
>> calculate(1, 2, 3, 4)
ans =
10
>> [a1, a2] = calculate(2, 3, 4)
a1 =
9
a2 =
24
Amitay Isaacs Introduction to Matlab
Introduction DataTypes Plots IO Programs Tools Namespaces Control Flow Operators
Operators
Relational operators - Compare between two values< Less than
<= Less than or equal to> Greater than
>= Greater than or equal to== Equal to˜= Not equal to
Logical operators - Operate on conditions& Element-wise logical AND
&& Short-circuit logical AND| Element-wise logical OR|| Short-circuit logical OR˜ Logical complement (NOT)
xor Exclusion OR
Amitay Isaacs Introduction to Matlab
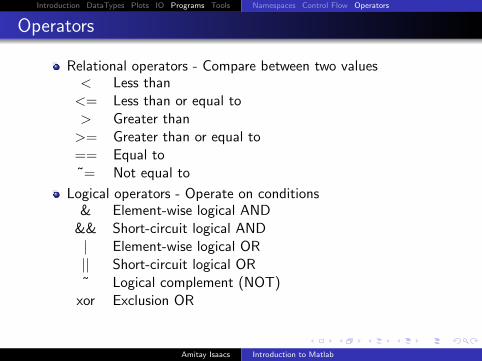

Introduction DataTypes Plots IO Programs Tools Namespaces Control Flow Operators
Logical Functions
any(x) returns 1 if any element of x is non-zeroall(x) returns 1 if all elements of x are non-zeroisnan(x) returns 1 at each NaN in xisinf(x) returns 1 at each infinity in xfinite(x) returns 1 at each finite value in xfind(x) returns indices of each non-zero value in x
Amitay Isaacs Introduction to Matlab
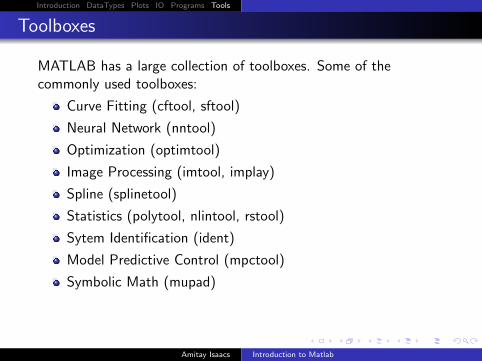
Introduction DataTypes Plots IO Programs Tools
Toolboxes
MATLAB has a large collection of toolboxes. Some of thecommonly used toolboxes:
Curve Fitting (cftool, sftool)
Neural Network (nntool)
Optimization (optimtool)
Image Processing (imtool, implay)
Spline (splinetool)
Statistics (polytool, nlintool, rstool)
Sytem Identification (ident)
Model Predictive Control (mpctool)
Symbolic Math (mupad)
Amitay Isaacs Introduction to Matlab
Introduction DataTypes Plots IO Programs Tools
Finding roots of a polynomial
Find roots of the polynomial
p(x) = x3 + 4x2 − 7x − 10
Example
>> p = [ 1 4 -7 -10 ];
>> x = linspace(-6, 4);
>> y = polyval(p, x);
>> plot(x, y);
>> r = roots(p)
r =
-5.0000
2.0000
-1.0000
Amitay Isaacs Introduction to Matlab
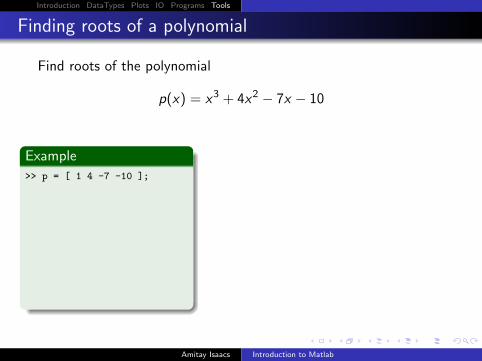
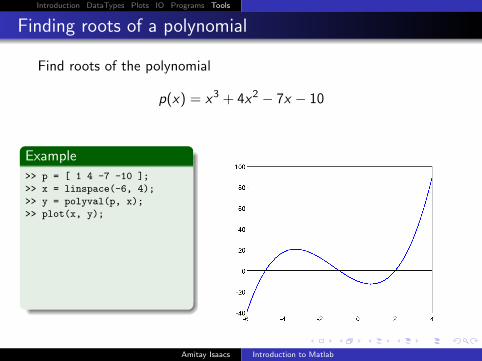

Introduction DataTypes Plots IO Programs Tools
Finding zeros of a function
Example
>> x = linspace(0,1);
>> y = humps(x);
>> plot(x, y);
>> fzero(@humps, 1)
ans =
-0.1316
>> fzero(@humps, 1)
ans =
1.2995
Amitay Isaacs Introduction to Matlab

Introduction DataTypes Plots IO Programs Tools
Finding zeros of a function
Example
>> x = linspace(0,1);
>> y = humps(x);
>> plot(x, y);
>> fzero(@humps, 1)
ans =
-0.1316
>> fzero(@humps, 1)
ans =
1.2995
Amitay Isaacs Introduction to Matlab

Introduction DataTypes Plots IO Programs Tools
Finding zeros of a function
Example
>> x = linspace(0,1);
>> y = humps(x);
>> plot(x, y);
>> fzero(@humps, 1)
ans =
-0.1316
>> fzero(@humps, 1)
ans =
1.2995
Amitay Isaacs Introduction to Matlab
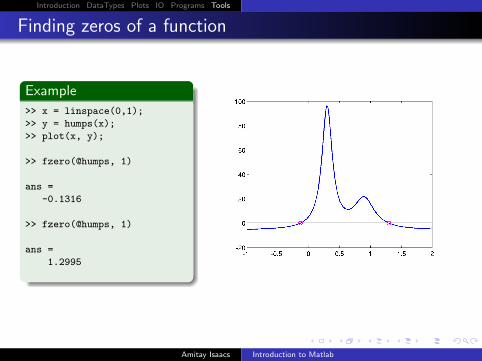
Introduction DataTypes Plots IO Programs Tools
Finding zeros of a function
Example
>> x = linspace(0,1);
>> y = humps(x);
>> plot(x, y);
>> fzero(@humps, 1)
ans =
-0.1316
>> fzero(@humps, 1)
ans =
1.2995
Amitay Isaacs Introduction to Matlab
Introduction DataTypes Plots IO Programs Tools
Questions?
Example>> why
How should I know?
Amitay Isaacs Introduction to Matlab
Introduction DataTypes Plots IO Programs Tools
Questions?
Example>> why
How should I know?
Amitay Isaacs Introduction to Matlab