introduction to kibana 3
DESCRIPTION
Simple introduction to Kibana 3. It is used to collect logs in HP Helion (Open Stack env)TRANSCRIPT

Introduction to Kibana 3Log dashboard in Helion
Samuel Chen2014/11/3

Agenda
• What is Kibana
• Query & Filter
• Configuration• Row & Panel
• Save & Load
• Others
• Tips
• Q & A

What is Kibana
• Kibana is a Dashboard of Elasticsearch
• Pure HTML & Javascript, NO server side
• It's not a statics tool
• Official site: http://www.elasticsearch.com/products/kibana/
• Open sourced at https://github.com/elasticsearch/kibana

Query & Filter

Simple Query
• Input your keyword(s) in the query section

Simple Query
• Keywords number >= 2 means “OR” match
• P.S. “channel” not match “channel_id”
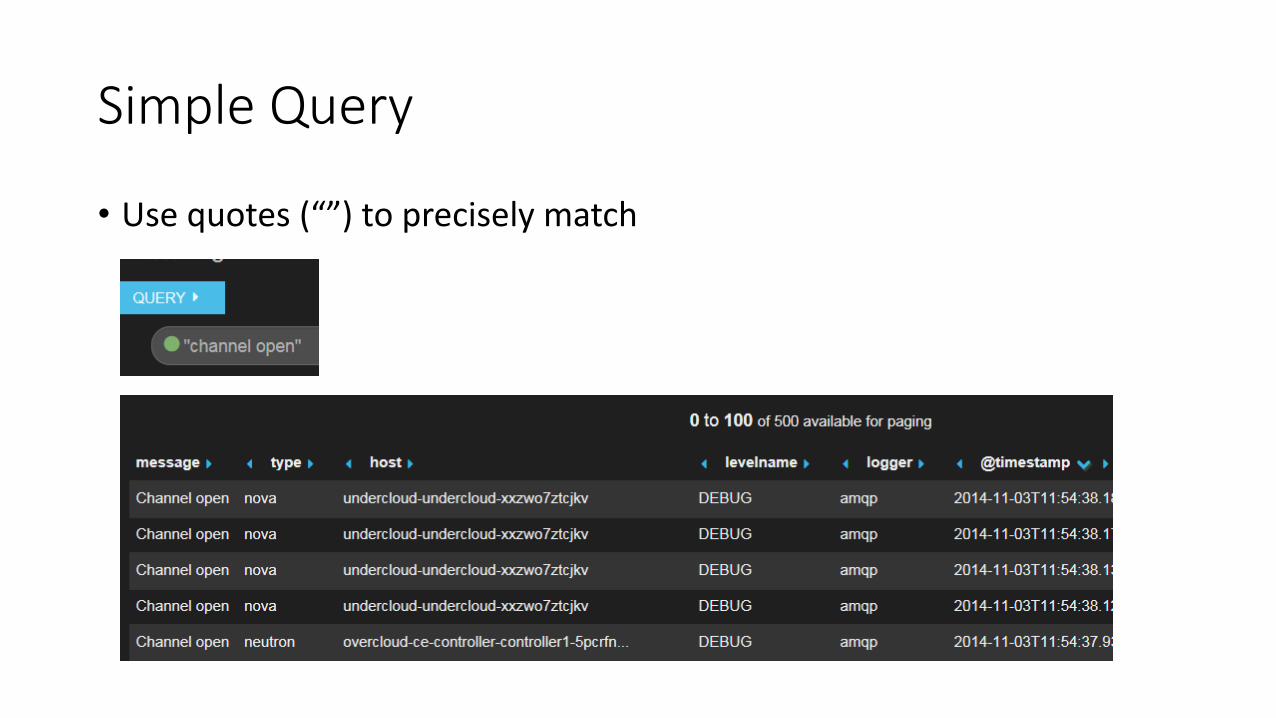
Simple Query
• Use quotes (“”) to precisely match

Complex Query
• AND/OR (must in uppercase)
• Field ( fieldname:keyword )
• Range for number ( field:[#min to #max]
• parentheses
• ? / *
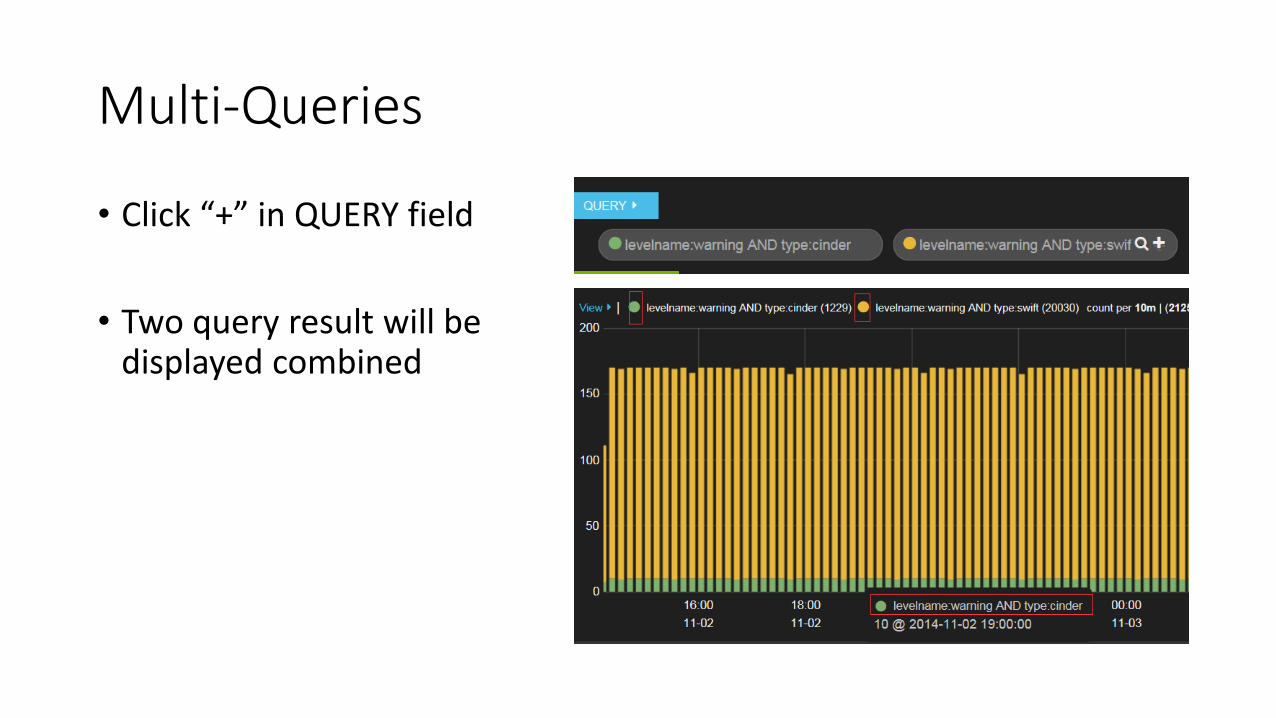
Multi-Queries
• Click “+” in QUERY field
• Two query result will be displayed combined

Query
• Click the color point in QUERY field to change the query syntax, display color

Filter
• To filter out the message you don’t want
• Conditions: must, must not, either
• Enable / Disable
• Use the query syntax

Configuration

Row & PanelLayout and features

Add a row
• Click the button “ADD A ROW” bottom right.
• Click the configuration button of the dashboard top right
• Create a new Row

Panel
• Row toolbar. Auto-hide at left under the “graph” row.
• Click the “plus” icon to Add Panel.
• Add a “terms” chart to display the most hits keywords in a field.
• A row contains multiple panels

Config the panel
• Input the title “Warning for components”
• Change the field to be display
• Change style to “pie”
• Select queries
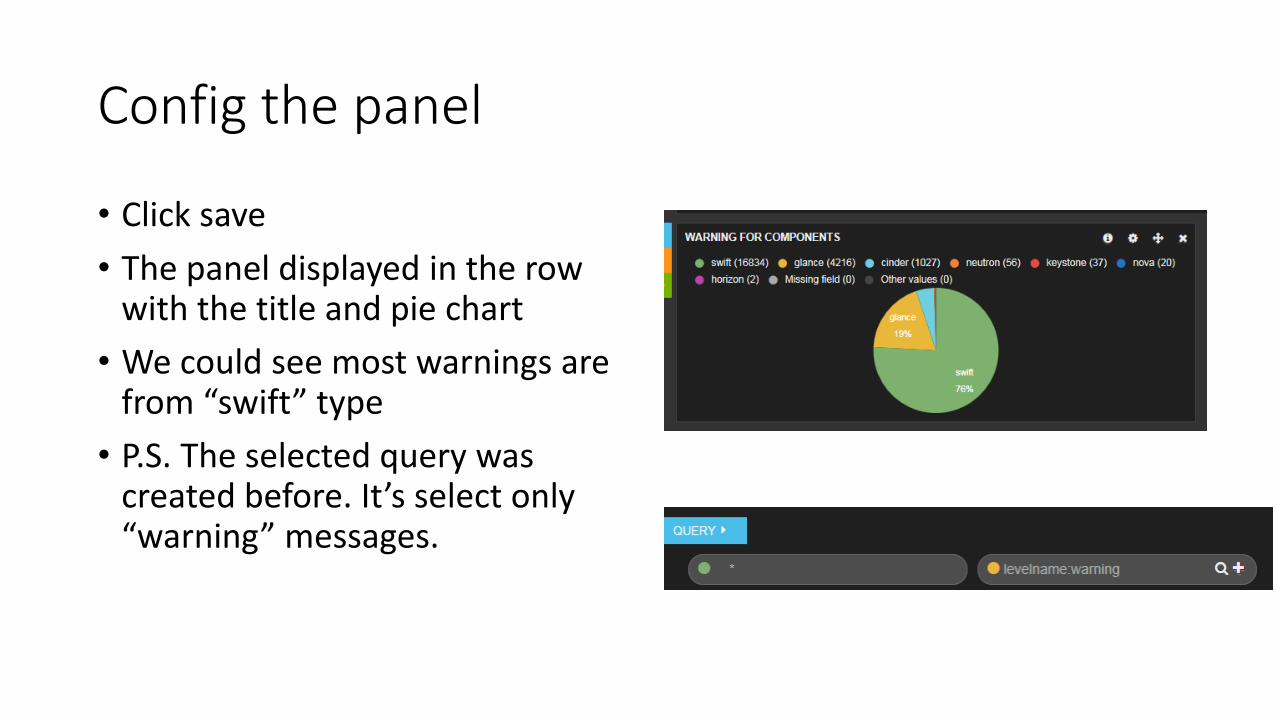
Config the panel
• Click save
• The panel displayed in the row with the title and pie chart
• We could see most warnings are from “swift” type
• P.S. The selected query was created before. It’s select only “warning” messages.
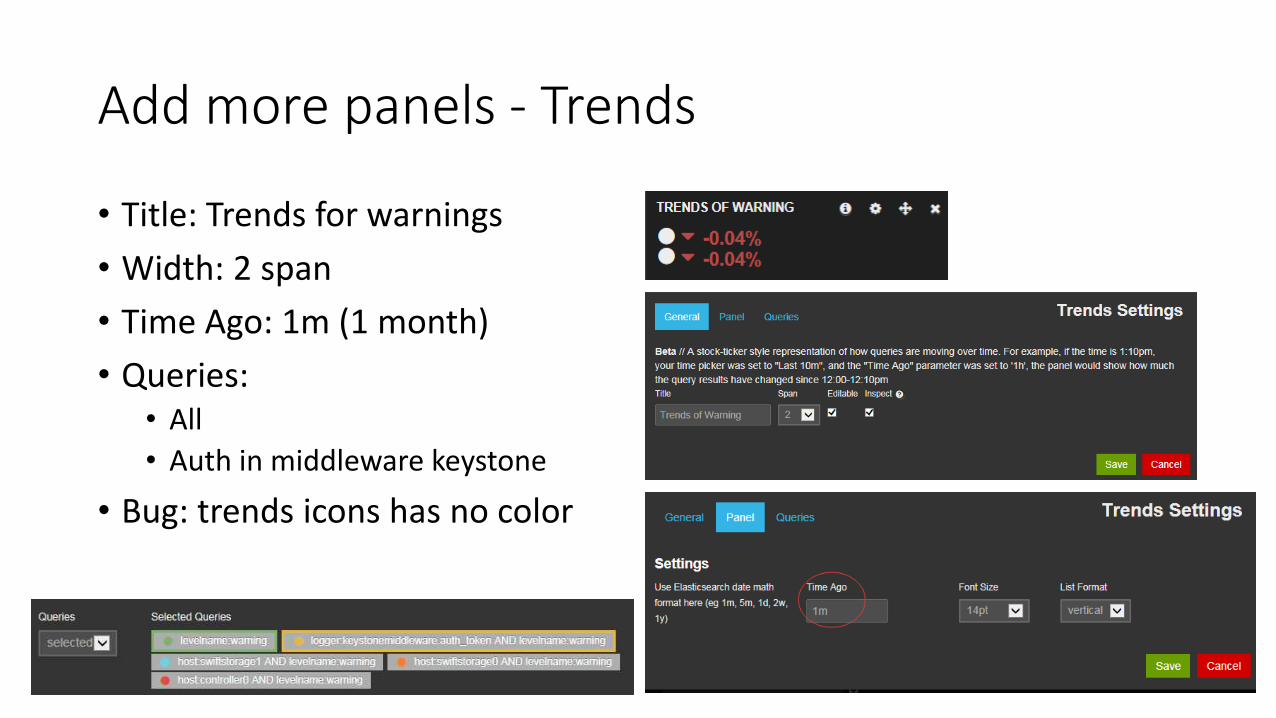
Add more panels - Trends
• Title: Trends for warnings
• Width: 2 span
• Time Ago: 1m (1 month)
• Queries:• All
• Auth in middleware keystone
• Bug: trends icons has no color

Add more panel - Hits
• Title: Host warnings
• Width: 2
• Style: bar chart
• Queries: 3 pre-defined queries for the warning of swiftstorage0, swiftstorage1, controller1
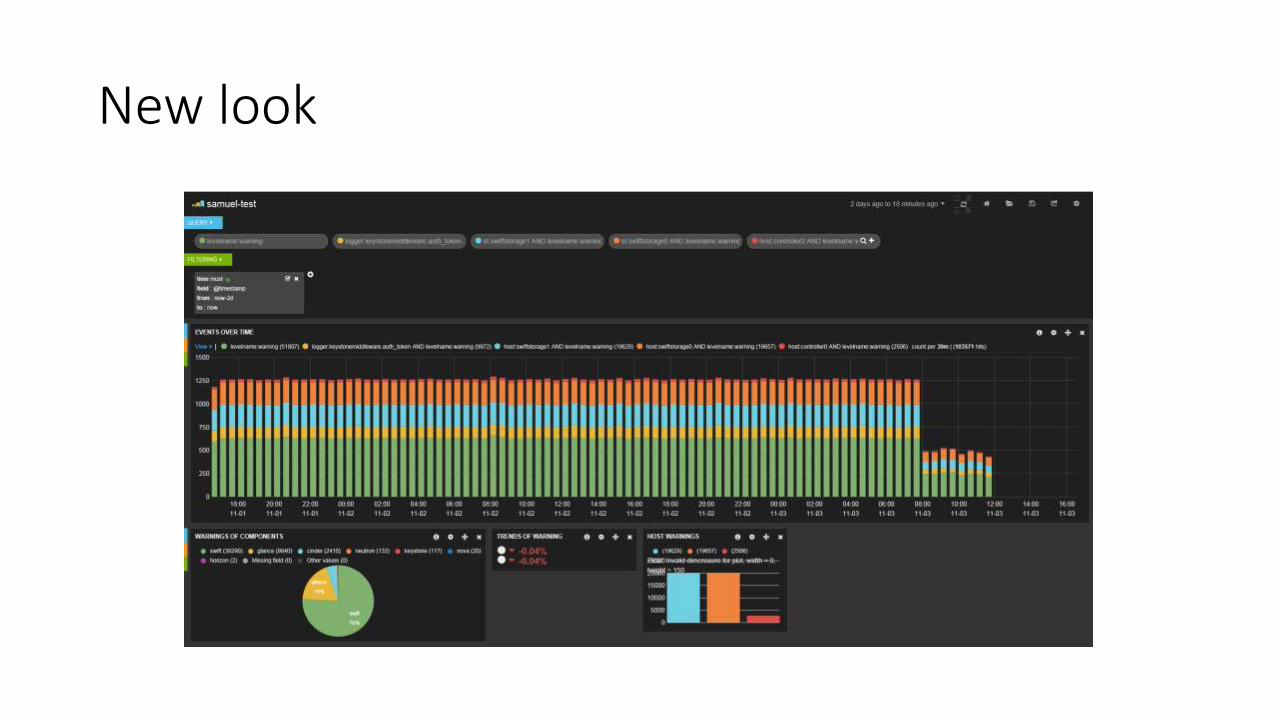
New look

Save & Load

Save
• Save to server:• Enter the name
• Click the disk icon to save schema (Error or no Access)
• Save as Home : make current config the home
• Reset Home : make home the default setting
• Save to local:• Enter the name
• Advance -> Export schema
• Download it

Load
• Load from server• Select one from saved schemas
• Enter keywords to filter out
• Load from local• Browse your saved schema
• Load from web location• Enter the url of you schema gist
• E.g. https://gist.github.com/xxx/xxx

Other configurations

Dashboard global
• Select log rang
• Refresh
• Go home
• Share the schema as a url• Example dashboard

Option
• Index ( to pick out indexed data to query)
• Rows (refer to this slides )
• Controls• Save/Load methods
• Timepicker ( time related interval, field )

Tips

Tips
• Collapse the ROW if you don’t check it. It will not be refreshed.
• Use filters for same queries
• Do NOT refresh if your configuration not saved. It will lost.
• Change appropriated time span to display data
• Fields express your business

ThanksQ & A