introduction to information visualization - tools...
TRANSCRIPT

INTRODUCTION TO INFORMATIONVISUALIZATION - TOOLS AND TECHNIQUES
JOUNI HUOTARIWITH THE HELP OF KAROLY GERE AND WITH THE KIND
PERMISSION OF CHRIS NORTH TO USE SOME OF HIS SLIDES
ŽILINA 13.5.2009

• Introduction
• Basic terms
• External aids
• Internal vs. external cognition
• Role of computers
• Visualization Tools and Techniques
CONTENTS
Introduction to Inf. Visualization -Tools and Techniques
© Jouni Huotari 2005 - 2009
2

• What is to visualize?
• What is visualization?
• What is information visualization?
• What is scientific visualization?
WHAT’S YOUR OPINION?
Introduction to Inf. Visualization -Tools and Techniques
© Jouni Huotari 2005 - 2009
3

Visualize:
– “to make visible”
– “to see or form a mental image of”
BASIC TERMS: VISUALIZE
Introduction to Inf. Visualization -Tools and Techniques
© Jouni Huotari 2005 - 2009
4
www.visualthesaurus.com/
http://www.merriam-webster.com/dictionary/

983130793213873213879786543213218797646836773562346507192165574186467514313435878398134775984415343658547945789712121981719812459910457903451432591846091846566913465987144357756931734290253877924138846988418766234957853313226979853124978625791756789327872378972627620489726758974546247897675927545465477684799752341223701876459832547891328988338995214896523842169388773346597856
TASK: COUNT THE ZEROS
Introduction to Inf. Visualization -Tools and Techniques
© Jouni Huotari 2005 - 2009
5

983130793213873213879786543213218797646836773562346507192165574186467514313435878398134775984415343658547945789712121981719812459910457903451432591846091846566913465987144357756931734290253877924138846988418766234957853313226979853124978625791756789327872378972627620489726758974546247897675927545465477684799752341223701876459832547891328988338995214896523842169388773346597856
COUNT THE RED NUMBERS
Introduction to Inf. Visualization -Tools and Techniques
© Jouni Huotari 2005 - 2009
6
More about preattentive processing and perception in visualization:
http://www.csc.ncsu.edu/faculty/healey/PP/index.html

• Which state has highest income?
• Is there a relationship between income and education?
Introduction to Inf. Visualization -Tools and Techniques
© Jouni Huotari 2005 - 2009
7
HOW QUICKLY YOU FIND ANSWERS TO FOLLOWING QUESTIONS?

VISUALIZATION HELPS
Introduction to Inf. Visualization -Tools and Techniques
© Jouni Huotari 2005 - 2009
8Per Capita Income
Coll
ege
Deg
ree
%

• Visualization: use of computer-based, interactive visual representations of data to amplify cognition
– computer-based - new medium
– interactive - direct manipulation & animation
– visual representations - use human perception
– data - task specific
– amplify cognition - helping people to think
• See http://en.wikipedia.org/wiki/Visualization
• http://en.wikipedia.org/wiki/Visualization_(graphic)
• http://en.wikipedia.org/wiki/Interactive_visualization
BASIC TERMS: VISUALIZATION
Introduction to Inf. Visualization -Tools and Techniques
© Jouni Huotari 2005 - 2009
9
Source: Card-Mackinlay-Shneiderman – Readings in
Information Visualization

video: http://hcil.cs.umd.edu/video/1994/1994_DynamicQueries.mp4
EXAMPLE OF INTERACTIVE GRAPHICS: HOMEFINDER
Introduction to Inf. Visualization -Tools and Techniques
© Jouni Huotari 2005 - 2009
10

• Information visualization: the use of computer-supported, interactive, visual representations of abstract data to amplify cognition.
– rendering non-physical data (as well)
– Does it have any obvious spatial mapping?
– How to map nonspatial abstractions into effective visual form?
– How to render visible properties of the object?
• Watch two minutes intro: http://www.youtube.com/watch?v=vbzozDCW_Bg
BASIC TERMS: INFORMATION VISUALIZATION (IV)
Introduction to Inf. Visualization -Tools and Techniques
© Jouni Huotari 2005 - 2009
11

WWW.GAPMINDER.ORG
Introduction to Inf. Visualization -Tools and Techniques
© Jouni Huotari 2005 - 2009
12
http://www.gapminder.org/world/
Example: http://www.gapminder.org/videos/what-stops-population-growth/

EXAMPLE OF IV: TREE MAP
© Jouni Huotari 2005 - 2009Introduction to Inf. Visualization - Tools and
Techniques13
http://www.smartmoney.com/map-of-the-market/

EXAMPLE OF IV: CONE TREE
Introduction to Inf. Visualization -Tools and Techniques
© Jouni Huotari 2005 - 2009
14

EXAMPLE OF IV: THEMESCAPE MAP
Introduction to Inf. Visualization -Tools and Techniques
© Jouni Huotari 2005 - 2009
15
http://www.researchinformation.info/rijanfeb04patents.html

EXAMPLE OF IV: BIOINFORMATICS
Introduction to Inf. Visualization -Tools and Techniques
© Jouni Huotari 2005 - 2009
16
http://www.biomedcentral.com/1752-0509/2/104

• Interactive Software Visualization: http://www.youtube.com/watch?v=bccqxpGouK0
• Google I/O 2008 - Visualize your Data: Visualization API:
http://www.youtube.com/watch?v=FoJ8CwFvCk8
• Data Visualization => FlowingData:http://projects.flowingdata.com/state-of-the-world/environment.html
• Visual search: http://www.searchme.com/ and http://www.kartoo.com/
MORE DEMOS & EXAMPLES
Introduction to Inf. Visualization -Tools and Techniques
© Jouni Huotari 2005 - 2009
17

• Helps understanding large and/or complex data sets
• Helps seeing trends (=> insight)
• Helps seeing details and context (simultaneously)=> there is a set of visualization techniques for this
BENEFITS OF IV
Introduction to Inf. Visualization -Tools and Techniques
© Jouni Huotari 2005 - 2009
18

• Financial/business
• Statistics
• Education
• Information systems (IS)
• Software engineering (SE)
• Text (documents)
• WWW
• …
DOMAINS OF IV
Introduction to Inf. Visualization -Tools and Techniques
© Jouni Huotari 2005 - 2009
19

BASIC TERMS: FROM EXTERNAL COGNITION TO VISUALIZATION
Introduction to Inf. Visualization -Tools and Techniques
© Jouni Huotari 2005 - 2009
20
External Cognition
use external world to accomplish cognition
Information Design
Visualization
design external representations to amplify cognition
computer-based, interactive
Scientific Visualization Information Visualization
typically physical data abstract, nonphysical data(divergence)

• Scientific visualization: enables handling large sets of scientific data and help scientists see the phenomena in the data.
– Usually based on physical data
– Computer is used to render visible some properties
– The information is inherently geometrical
• These are abstractions, but based on physical space
BASIC TERMS: SCIENTIFIC VISUALIZATION (SV)
Introduction to Inf. Visualization -Tools and Techniques
© Jouni Huotari 2005 - 2009
21

Ozone layer surrounding Earth (Card-Mackinlay-Shneiderman)
EXAMPLE 1 OF SV
Introduction to Inf. Visualization -Tools and Techniques
© Jouni Huotari 2005 - 2009
22

EXAMPLE 2 OF SV
Introduction to Inf. Visualization -Tools and Techniques
© Jouni Huotari 2005 - 2009
23
=> Combination of IV and SV? Google Maps, for example, seehttp://www.programmableweb.com/api/google-chart/mashups
Cotidal Chart (Card-Mackinlay-Shneiderman)

• The purpose of visualization is insight, not the picture
• Main goals of insight:
– Discovery
– Decision making
– Explanation
• The emphasis is on visualization, but the main goal is perceptualization
PURPOSE OF VISUALIZATION
Introduction to Inf. Visualization -Tools and Techniques
© Jouni Huotari 2005 - 2009
24

PERCEPTION
Introduction to Inf. Visualization -Tools and Techniques
© Jouni Huotari 2005 - 2009
25
Link

CHOLERA IN SOHO, V1
• Use of visualization from 1845
• Soho district, London (John Snow)
© Jouni Huotari 2005 - 2009
Introduction to Inf. Visualization - Tools and Techniques
26

Slightly modified version of Snow’s map
• What are the changes?
• Is this version easier to “understand”?
• Why? Why not?
CHOLERA IN SOHO, V2
Introduction to Inf. Visualization -Tools and Techniques
© Jouni Huotari 2005 - 2009
27

• Understanding something = ”seeing” it
• Make ideas “clear”
• Bring ideas into “focus”
• “Arrange” thoughts
=> Visual metaphors in describing cognitive processes
• Relationship between what we see and what we think
USING VISION TO THINK
Introduction to Inf. Visualization -Tools and Techniques
© Jouni Huotari 2005 - 2009
28
Source: Card-Mackinlay-Shneiderman – Readings in Information Visualization

• Introduction
• Basic terms
• External aids
• Internal vs. external cognition
• Role of computers
• Visualization Tools and Techniques
CONTENTS
Introduction to Inf. Visualization -Tools and Techniques
© Jouni Huotari 2005 - 2009
29

• Different external aids
• An important class: graphical inventions (diagrams, charts, tables, figures, etc.)
– Communicating an existing idea
– Discovering the idea itself using special properties of visual perception to resolve logical problems
– “A picture is worth ten thousand words” (example: London underground map)
EXTERNAL AIDS
Introduction to Inf. Visualization -Tools and Techniques
© Jouni Huotari 2005 - 2009
30
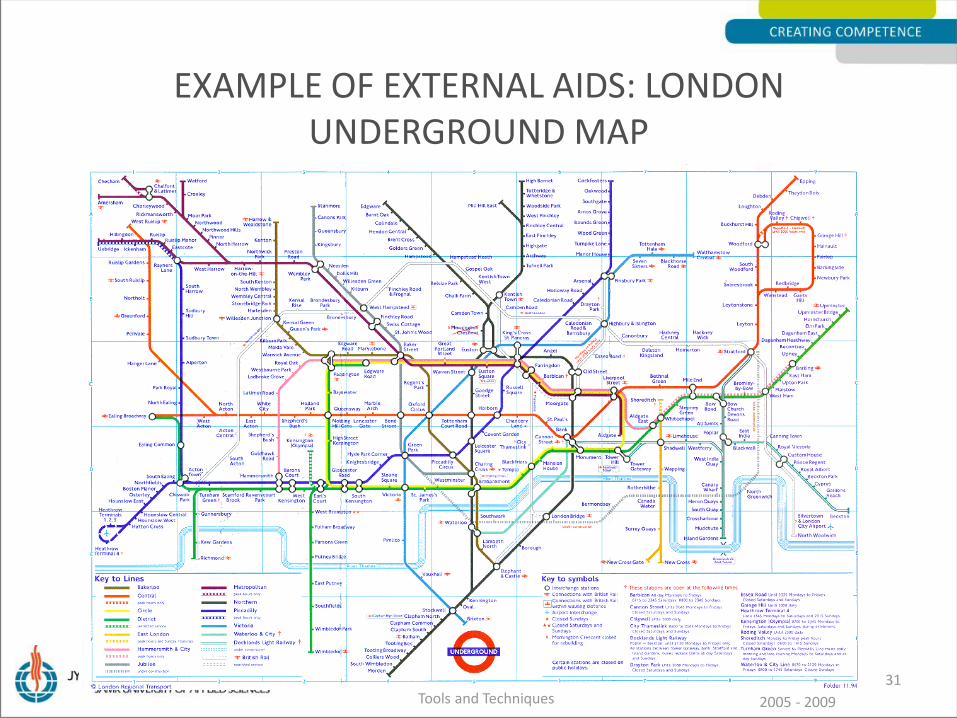
EXAMPLE OF EXTERNAL AIDS: LONDON UNDERGROUND MAP
Introduction to Inf. Visualization -Tools and Techniques
© Jouni Huotari 2005 - 2009
31

• Important role of external world in thought and reasoning external cognition
• Internal and external representation and processing belong together in thought
• Use of the external world to enhance cognition is all around us
INTERNAL VS. EXTERNAL COGNITION
Introduction to Inf. Visualization -Tools and Techniques
© Jouni Huotari 2005 - 2009
32

• Sight of the map: the viewer forms some understanding in his/her mind (not completely memorized)
• Attention focuses on the planned journey (departure and destination stations, route)
• The route can be memorized in different ways
• This internal model is called a cognitive map
• The task facilitated by the visualization is the planning of a journey
INTERNAL VS. EXTERNAL COGNITION; (SEE THE EXAMPLE 1: LONDON UNDERGROUND MAP)
Introduction to Inf. Visualization -Tools and Techniques
© Jouni Huotari 2005 - 2009
33

INTERNAL VS. EXTERNAL COGNITION; EXAMPLE 2: WILLIAM PLAYFAIR’S 200 YEARS OLD DRAWING
Introduction to Inf. Visualization -Tools and Techniques
© Jouni Huotari 2005 - 2009
34
circle size: empire size
left line: gross national product
right line: tax gatheredsource: Robert Spence – Information Visualization

• Purpose: provide insight, get a response from the viewer
• The author wanted to show that the British were far heavily taxed
• The “odd one out” slope is supposed to draw the viewer’s attention
• Supposed to reveal new information, a “sudden” understanding of the situation
INTERNAL VS. EXTERNAL COGNITION
Introduction to Inf. Visualization -Tools and Techniques
© Jouni Huotari 2005 - 2009
35

• Multiplication
– half of the group: in head
– other half: on paper
• The numbers are:
68 * 36• The result is:
2448
EXAMPLE
Introduction to Inf. Visualization -Tools and Techniques
© Jouni Huotari 2005 - 2009
36
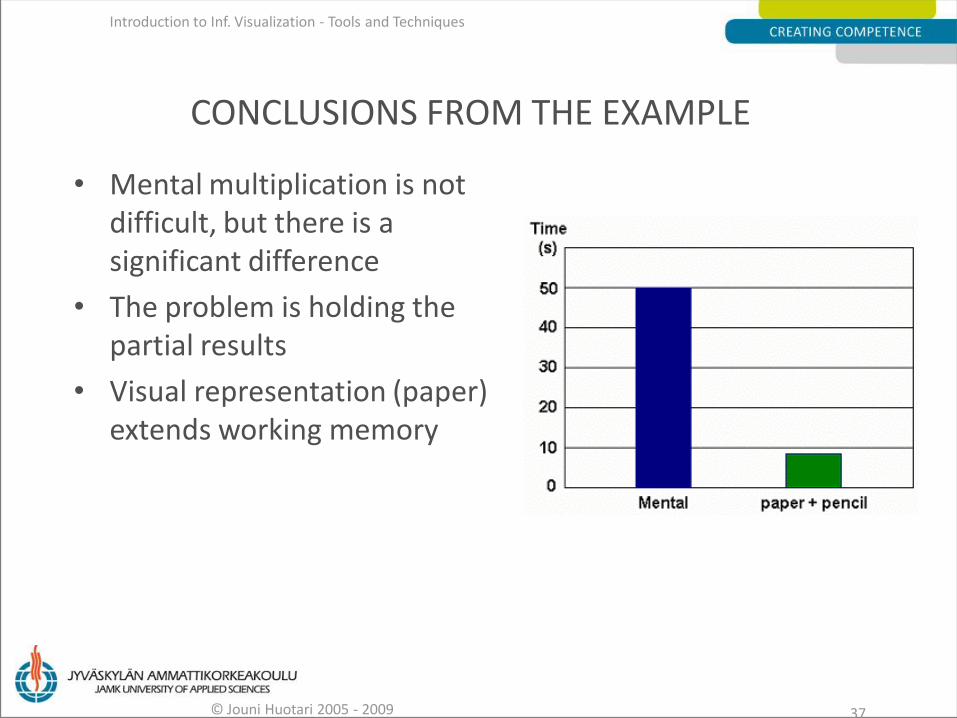
CONCLUSIONS FROM THE EXAMPLE
• Mental multiplication is not difficult, but there is a significant difference
• The problem is holding the partial results
• Visual representation (paper) extends working memory
© Jouni Huotari 2005 - 2009
Introduction to Inf. Visualization - Tools and Techniques
37

• Graphic aids have long history
• Evolution of computers makes possible a new medium:– dramatic rendering performance
– real-time interactivity
– much lower costs
– a computer assembles thousands of data objects into pictures reveals hidden patterns
– diagrams: move, react
– new methods for amplifying cognition
ROLE OF COMPUTERS
Introduction to Inf. Visualization -Tools and Techniques
© Jouni Huotari 2005 - 2009
38
• A few years ago this new medium was applied in sciences only (scientific visualization)
• Applied more generally today:
– businesses
– education
– administration
– etc.
• It goes under the name information visualization
ROLE OF COMPUTERS
Introduction to Inf. Visualization -Tools and Techniques
© Jouni Huotari 2005 - 2009
39

“The power of unaided mind is highly overrated. Without external aids, memory, thought, and reasoning are all constrained.
But human intelligence is highly flexible and adaptive, superb at inventing procedures and objects that overcome its own limits. The real powers come from devising external aids that enhance cognitive abilities.
How have we increased memory, thought, and reasoning? By the invention of external aids: It is things that make us smart.”
D. NORMAN, 1993
Introduction to Inf. Visualization -Tools and Techniques
© Jouni Huotari 2005 - 2009
40
• What are the benefits of IV?
• What is the purpose of external aids?
• What role computers have in visualizing data?
• What is the difference between information and scientific visualization?
QUIZ
Introduction to Inf. Visualization -Tools and Techniques
© Jouni Huotari 2005 - 2009
41

• Introduction
• Basic terms
• External aids
• Internal vs. external cognition
• Role of computers
• Visualization Tools and Techniques
CONTENTS
Introduction to Inf. Visualization -Tools and Techniques
© Jouni Huotari 2005 - 2009
42
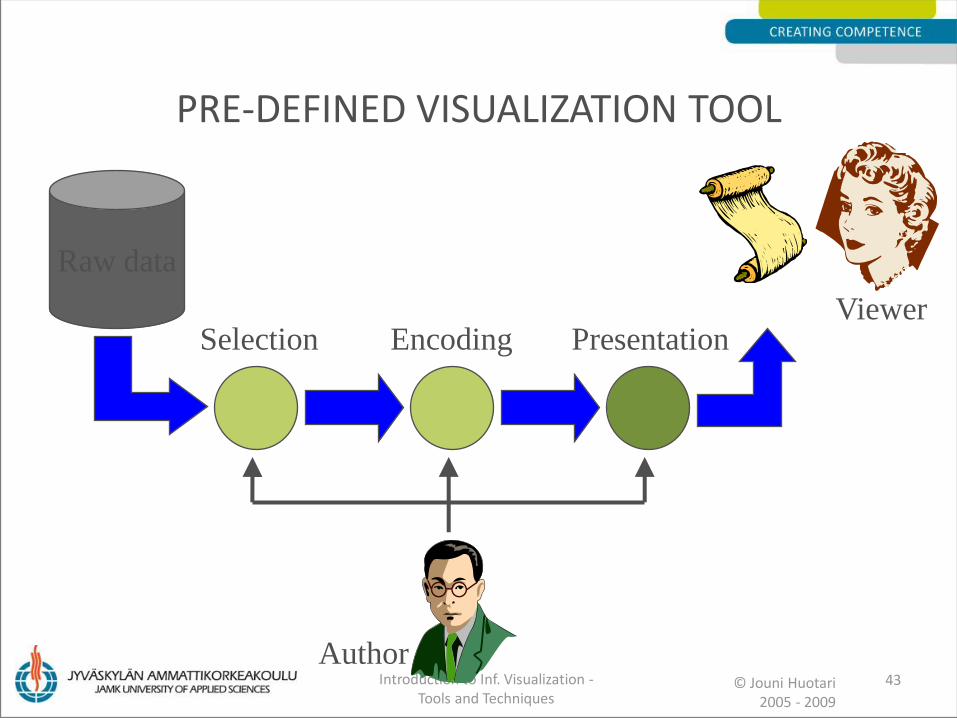
PRE-DEFINED VISUALIZATION TOOL
Introduction to Inf. Visualization -Tools and Techniques
© Jouni Huotari 2005 - 2009
43
ViewerSelection Encoding Presentation
Author
Raw data

INTERACTIVE VISUALIZATION TOOL
Introduction to Inf. Visualization -Tools and Techniques
© Jouni Huotari 2005 - 2009
44
Raw data
ViewerSelection Encoding Presentation
Visualization
tool designer
Interaction

• ISVIS tool integrates diagrams with visual cues
AN EXAMPLE OF INTERACTIVE VISUALIZATION TOOL
Introduction to Inf. Visualization -Tools and Techniques
© Jouni Huotari 2005 - 2009
45

PHASES OF THE VISUALIZATION PROCESS
© Jouni Huotari 2005 - 2009Introduction to Inf. Visualization - Tools and
Techniques 46
Search: query / browsing
Domain spaceHeterogeneous
sources
Previous knowledge
Task / information need
Mapping
• Content
• Structure
(linear, tree,
network, …)
• Metadata
• Data type
• Semantics
• Dimensions
Application
domain(e.g. ISD)
Semantic
domain (e.g. WWW,
file structure)
View / visual layout
Data
storage
format (PS, WMF,
GIF, HTML,
VRML, …)
Representation
format (list/table/diagram,
tree/network, color,
shape, size, …)
Visualization
method (overview,
elision, zoom,
pan, clip, filter,
distort, …)
Visualization
technique/style(cone-tree, fisheye
view, perspective
wall, ...)
Output dimensions (2, 3, 3 w/stereo, …)
+ used method -> notation, ...
Information
space (UoD)
Information
characteristics
Interaction

TO BE CONSIDERED
Information Types:
• Data type (e.g. numerical, textual, temporal)
• Dimensions: 1D, 2D, 3D (spatial), Multi-D
• Structure:– Hierarchies/Trees
– Networks/Graphs
• Content; document collections
Strategies:
• Design Principles
• Interaction strategies
• Navigation strategies
• Visual Overviews
• Multiple Views
• High-Resolution Large Displays
• …
© Jouni Huotari 2005 - 2009Introduction to Inf. Visualization - Tools and
Techniques47

EXAMPLES (1D, 2D, 3D)
Introduction to Inf. Visualization -Tools and Techniques
© Jouni Huotari 2005 - 2009
48
• Lifelines: Uses individual timelines to display medical conditions or legal cases
• Fisheye Menus: An Example of Focus + Context display
• Piccolo (formerly known as Jazz (Pad++ descendent): Infinitely zoomable 2-D surface. The site contains three tools:- Fisheye Calendar- Graph Editor- Presentation Tool
• Bifocal image browser: Uses the concept of focus+context
• Visible Human Explorer : Assists in browsing and retrieving images from the visible human
• Visible Human Project: Visualizing images of human body in 3-D space

EXAMPLES (MULTI-D)
Introduction to Inf. Visualization -Tools and Techniques
© Jouni Huotari 2005 - 2009
49
• XmdvTool: For the interactive visual exploration of multivariate data sets
• Star Coordinates Projecting Star Co-ordinates as points in a projection plane with radial axes.
• Table Lens (Eureka) Supports visualizing an entire data table as well as zooming in on specific items.
• Excentric Labels A dynamic technique to label a neighborhood of objects located around the cursor.
Demo

TREES AND GRAPHS
Introduction to Inf. Visualization -Tools and Techniques
© Jouni Huotari 2005 - 2009
50
• Hyperbolic Tree (Star Tree) Distorts a large tree layout with a hyperbolic transformation.
• WebTOC Visualizes Web sites by occupying the frame to the left of the home page it represents.
• Treemap (Non-commercial demo) Visualizes hierarchical data using slice-n-dice.
• Map of the Market Visualizes Consumer Market using treemaphierarchical structure.
• Spring Graph Layout Automated graph layout
• ISVIS Visualizes connections between use case, class, and sequence diagrams
• Visual Thesaurus An exploration of term relationships within six languages.
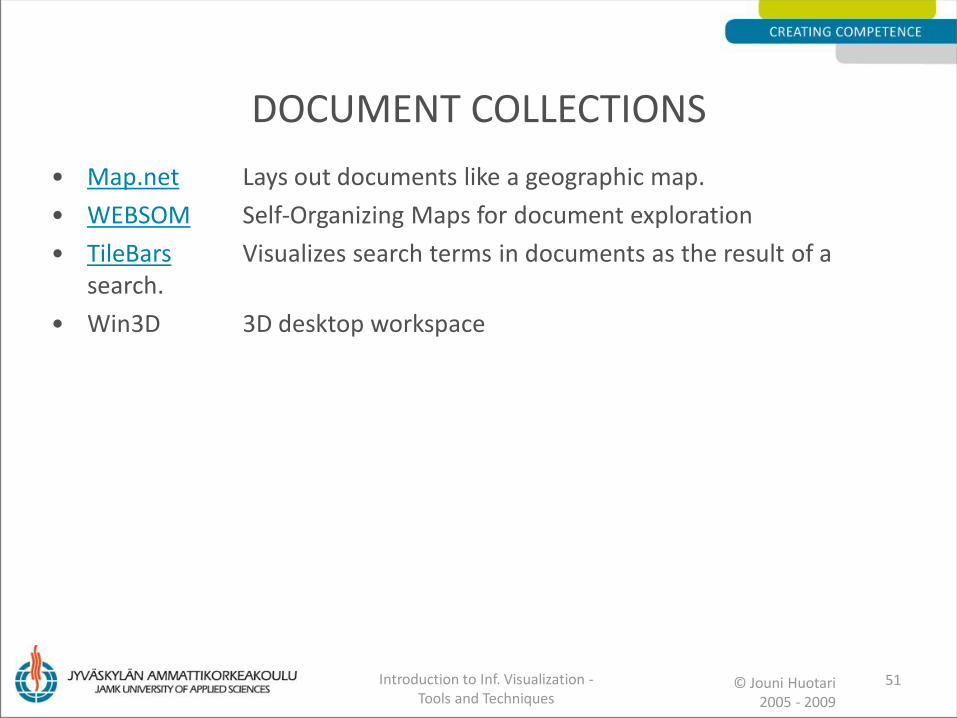
DOCUMENT COLLECTIONS
Introduction to Inf. Visualization -Tools and Techniques
© Jouni Huotari 2005 - 2009
51
• Map.net Lays out documents like a geographic map.
• WEBSOM Self-Organizing Maps for document exploration
• TileBars Visualizes search terms in documents as the result of a search.
• Win3D 3D desktop workspace

• Spence, Robert - Information Visualization, Addison-Wesley, 2001.
• Card, Stuart K., Jock D. Mackinlay and Ben Shneiderman (eds.) 1999. Readings in Information Visualization. Using Vision to Think. San Francisco: Morgan Kaufmann.
• http://www.cs.umd.edu/hcil/research/visualization.shtml
• http://www.infovis.org/ , http://infovis.cs.vt.edu/cs5764/
• http://www.cs.ubc.ca/~tmm/courses/infovis/resources.html
• http://graphics.stanford.edu/papers/munzner_thesis/
• http://visualization.ning.com/
• http://homes.jamk.fi/~huojo/teaching/IV/tools/
REFERENCES
Introduction to Inf. Visualization -Tools and Techniques
© Jouni Huotari 2005 - 2009
52

THIS IS…
… the endof introduction
– questions please?
Contact information: jouni.huotari
[at]jamk.fi© Jouni Huotari
2005 - 2009
Introduction to Inf. Visualization - Tools and Techniques
53