introduction to engineering seismology lecture 13 module 10: seismic...
TRANSCRIPT
Introduction to Engineering Seismology Lecture 13
Dr. P. Anbazhagan 1 of 61
Module 10: Seismic site classification
Topics
Introduction to seismic Site Characterization,
Site characterization data
Need for Site Characterization
Grids for Site characterization
Interpolation of non-filled grids and hypothetical boreholes
Site Classification and 30m Concept
Site Class Definitions – International Building Co
Site Class Definitions – European Standard
Comparison of seismic site classification
Keywords: Seismic Site Characterization, site classes, Methods, 30m concept
10.1 Introduction to seismic site characterization
Estimation of geotechnical site characterization and assessment of site response
during earthquakes is one of the crucial phases of seismic microzonation, which
includes ground shaking intensity and amplification.
Site characterization provides the basic soil index property and engineering
properties, which are determined based on in-depth exploration to identify and
evaluate a potential hazard.
Site characterization involves investigation (laboratory and field), data collection,
interpretation of data and finally represented in terms of maps. Geotechnical site
characterization is usually done using experimental investigations of standard
penetration test, cone penetration test, Multichannel analysis of surface wave
testing (shear wave velocity survey) and numerical methods.
Standard penetration test and Multichannel analysis of surface methods are widely
used methods for site characterization. Site characterization is carried out with the
following objective:
1. Measuring and the interpretation of soil properties
2. Complementing and extending the land cover mapping;
3. Developing soil maps of a region; and
4. Providing information or input for computer modelling of site
response.
10.2 Site characterization data
Introduction to Engineering Seismology Lecture 13
Dr. P. Anbazhagan 2 of 61
A general site characterization should:
1. Describe the site
2. Provide Geotechnical, Geological and hydro-geological/ground water data
3. Characterize the aquifer or permeable characteristics
4. Describe the condition and strength of the soil
5. Give a risk assessment and reveal the presence and distribution of any
contaminants.
6. It must give detailed information about the mechanical and geometrical
parameters of the subsurface
7. The effects of the proposed project on its environment and an investigation
of existing structures or lifelines below the subsurface.
8. Site description and location
9. Climatic conditions
This data can thus be used to select a site, design the foundation and earthworks,
and study the effects of the earthquake i.e. how a soil deposit responds during an
earthquake depending on the frequency of the base motion, the geometry and
material properties of the soil above the bedrock.
The geometries and material properties of soil are directly or indirectly quantified
and represented by many researchers as a part of seismic microzonation. Seismic
site classifications are widely used to quantify site effects and spectral
acceleration.
A geographic distribution of site class based on 30
SVis useful for future seismic
zonation studies because the amplification factors are defined as a function of30
SV,
such that the conditions of the ground on the site shaking can be taken into account
(Kockar et al., 2010).
10.3 Need for Site Characterization
There are hazards and uncertainties in the ground, as a result of natural and man-
made processes, that may jeopardize a project and its environment if they are not
adequately understood and mitigated.
An appropriate site characterization will maximize the economy by reducing to an
acceptable level, the uncertainties and risks that site conditions poses to a project.
Site characterization also plays an important role in safety assessments and
identification of potential environmental effects.
Site characterization involves the determination of the nature and behaviour of all
aspects of a site and its environment that could significantly influence or be
influenced by a project.
Introduction to Engineering Seismology Lecture 13
Dr. P. Anbazhagan 3 of 61
The basic purpose of site characterization is to provide sufficient, reliable
information of the site conditions to permit good decisions to be made during
assessment, design and construction phases of a project.
Site Characterization should include an evaluation of subsurface features, sub
surface material types, subsurface material properties and buried/hollow structures
to determine whether the site is safe against earthquake effects.
Site characterization involves determining information on previous and current
land use, topography and surface features, hydrogeology, hydrology, meteorology,
geology, seismology, geotechnical aspects, environmental aspects and other
factors.
10.4 How to do seismic site characterization There are mainly three methods used for site characterization (Table 10.1)
1. Geological and Geomorphologic methods
2. Geotechnical Methods
3. Geophysical methods
A site characterization for seismic microzonation using geological, geo-technical,
and geophysical data can be conducted. Commonly used geotechnical tests include
standard penetration tests (SPT), dilatometer tests (DMT), pressure meter tests,
and seismic cone penetration tests (SCPT), of which SPT is the most widely used
in many countries because of the availability of existing data.
Many geo-physical methods for seismic site characterization have been attempted
but the methods commonly used are Spectral Analysis of Surface Waves (SASW)
and Multi-channel Analysis of Surface Waves (MASW).
One of the important parameters to be considered in geotechnical studies is the
scale of geotechnical data collection. The proposed scale of Geotechnical data
collection for different levels of seismic microzonation studies are listed below.
For Level I
1. Homogeneous sub-surface – 2 km x 2km to 5 km x 5km
2. Heterogeneous subsurface – 0.5 km x 0.5 km to 2 km x 2km
For Level II
1. Homogeneous sub-surface – 1 km x 1km to 3 km x 3km
2. Heterogeneous subsurface – 0.5 km x 0.5 km to 1 km x 1km
For Level III
1. Homogeneous sub-surface – 0.5 km x 0.5km to 2 km x 2km
2. Heterogeneous subsurface – 0.1 km x 0.1 km to 0.5 km x 0.5k

Introduction to Engineering Seismology Lecture 13
Dr. P. Anbazhagan 4 of 61
Steps involved in site characterization - The important steps involved in Site
characterization are
1. Base map Preparation
2. Available data collection
3. Experimental study
4. Data Analysis
5. Estimation of Equivalent shear wave velocity
6. Site classification
7. Mapping
Table 10.1: Comparison, advantages and limitations of methods of Site
Characterization
Base map preparation – a base map is one of the important ingredients of the
seismic microzonation studies; a preparation of which requires a special
consideration. Over the last four decades Geographical Information Systems
Description
Geology
and
Geomorp
hology
Geotechnical Methods Geophysical
methods
SPT SCPT SASW MASW
Strain - Large Large Small Small
Drilling - Essential Essential No No
Cost Low High High Low Medium
Time Long Long Medium Short Short
Quality of data Poor Good Very Good Fair Very
Good
Detection of variability
of soil deposits Poor Good Very Good Good
Very
Good
Suitable soil type All Non Gravel
Non Gravel
All All
Depth of information
suitable for
Microzonation
Poor Good
Fair – Vs is
available up to
20m
Good Very
Good
Measurement of
dynamic properties Poor Fair Good Good
Very
Good
Success full cases used Small Large Medium Medium
–Large
Very
Large
Introduction to Engineering Seismology Lecture 13
Dr. P. Anbazhagan 5 of 61
(GIS) have emerged as the predominant medium for graphic representation of
geospatial data, including geotechnical, geologic and hydrologic information.
The base map includes several layers of information such as outer and
administrative boundaries, Contours, Highways, Major roads, Minor roads,
Streets, Rail roads, Water bodies, Drains, Landmarks and Borehole locations.
Preparation of base map data requires familiarity with GIS data formats and
spatial references (i.e. datums and coordinate systems/projections) so that all
base map layers properly co-register and have adequate resolution.
For base map data obtained from different sources, preparation may, for
example, involve projecting datasets to a common spatial reference, defining a
spatial reference for data that lack such as, clipping to an area of interest and/or
preparing derivative base map layers, such as those that portray slope or
topography in shaded relief.
Steps involved
1. Define the region of interest for the current project
2. Decide which data sets are valuable to your project
3. Identify sources of data sets and download to local computer
a. Topographic
b. Thematic
c. Imagery
4. Identify and geo reference any additional non-digital sources of spatial
data
a. Compile tabular data with x,y location information into a
spreadsheet and add to GIS application
b. Scan paper map products
i. Clip scanned image to area of interest and save as
compatible file format (tiff, jpeg)
ii. Geo reference scanned image
5. Confirm that all datasets are in the same coordinate system, projection
and datum.
a. If the coordinate system is undefined, find original coordinate
system and establish a spatial reference
b. If not all the same, project to a common coordinate system and
datum
6. Prepare topographic derivatives such as slope or hill shade layers
7. Clip all spatial data to a common project area extent
Available data collection - The major contributions for the microzonation
studies are the probabilistic assessment of the regional earthquake hazard,
interpretation of the micro tremor records, and interpretation of the available
geological and geotechnical data based on a grid approach.
Introduction to Engineering Seismology Lecture 13
Dr. P. Anbazhagan 6 of 61
The compilation of the available Geological and Geotechnical data and
additional subsurface explorations are carried out to supplement the available
data.
Evaluation and analysis of the available geotechnical data are done to
determine the necessary parameters for conducting the microzonation with
respect to different parameters.
For the identification of the local soil conditions, an approach was chosen by
taking available existing data into account.
Data are available from different sources, with varying degree of information
on the site investigations being conducted, reliability and quality of the derived
data.
Plausibility check of the available data is essential prior to carrying out the
microzonation procedure; direct use of this kind of data from such a variety of
different sources might lead to an unrealistic scenario and might not be
comparable or even withstand a subsequent confirmation of this approach in
terms of the hypothetical boreholes.
Nonetheless, data from different sources should be taken into account if the
quality appears to be acceptable so that it is possible to benefit from an
independent view of the soil conditions in overall terms and the reliability of a
single site investigation in particular.
10.5 3-D Subsurface Modeling of Geotechnical Data Using GIS
Geographical information system (GIS) based subsurface model is developed
which helps in data management, develop geo-statistical functions, 3-
dimensional (3-D) visualization of subsurface with geo-processing capability
and future scope for web based subsurface mapping tool. The three major
outcomes are:
1. Development of digitized map of the area with layers of
information
2. Development of GIS database for collating and synthesizing
geotechnical data available with different sources
3. Development of 3-dimensional view of subsoil strata presenting
various geotechnical properties such as location details, physical
properties, grain size distribution, Atterberg limits, SPT „N‟ values
and strength properties for soil and rock along with depth in an
appropriate format.
Introduction to Engineering Seismology Lecture 13
Dr. P. Anbazhagan 7 of 61
The 3-D subsurface model with geotechnical data has been generated with base
map. The boreholes are represented as 3-dimensional objects projecting below
the base map layer up to the available borehole depth, geotechnical properties
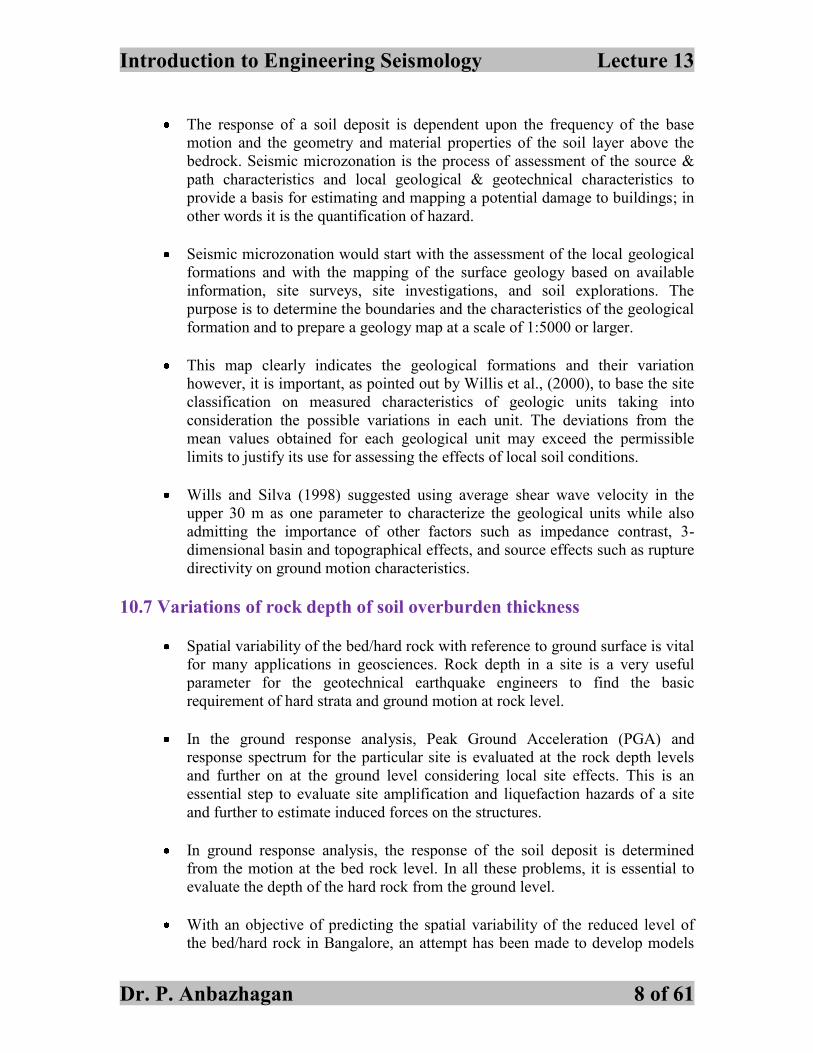
are represented as layers at 0.5m intervals with SPT „N‟ values (Fig 10.1).
Each borehole is attached with geotechnical data versus depth. Also scanned
image files of borelogs and properties tables are attached to the location in the
plan. The data consist of visual soil classification, standard penetration test
results, ground water level, time during which test has been carried out, and,
other physical and engineering properties of soil.
From this 3-D, geotechnical model, geotechnical information on any borehole
at any depth can be obtained at every 0.5m interval by clicking on that level
(donut). The model provides two options to view the data at each borehole
1. Visualize the soil character as colored layer with depth information
along with properties in excel format and
2. Bore logs and properties as an image file.
A
Fig 10.1: Typical Borehole in Three Dimensional View
10.6 Site characterization using Geological data
Earthquake damage is commonly controlled by three interacting factors-
source and path characteristics, local geological and geotechnical conditions
and type of the structures. Obviously, all of this would require analysis and
presentation of a large amount of geological, seismological and geotechnical
data.
The initial geological site characterization must focus on locating and
quantifying the most fractured zones, for it is these highly fractured areas that
will most significantly affect the evaluation of the site.
Introduction to Engineering Seismology Lecture 13
Dr. P. Anbazhagan 8 of 61
The response of a soil deposit is dependent upon the frequency of the base
motion and the geometry and material properties of the soil layer above the
bedrock. Seismic microzonation is the process of assessment of the source &
path characteristics and local geological & geotechnical characteristics to
provide a basis for estimating and mapping a potential damage to buildings; in
other words it is the quantification of hazard.
Seismic microzonation would start with the assessment of the local geological
formations and with the mapping of the surface geology based on available
information, site surveys, site investigations, and soil explorations. The
purpose is to determine the boundaries and the characteristics of the geological
formation and to prepare a geology map at a scale of 1:5000 or larger.
This map clearly indicates the geological formations and their variation
however, it is important, as pointed out by Willis et al., (2000), to base the site
classification on measured characteristics of geologic units taking into
consideration the possible variations in each unit. The deviations from the
mean values obtained for each geological unit may exceed the permissible
limits to justify its use for assessing the effects of local soil conditions.
Wills and Silva (1998) suggested using average shear wave velocity in the
upper 30 m as one parameter to characterize the geological units while also
admitting the importance of other factors such as impedance contrast, 3-
dimensional basin and topographical effects, and source effects such as rupture
directivity on ground motion characteristics.
10.7 Variations of rock depth of soil overburden thickness
Spatial variability of the bed/hard rock with reference to ground surface is vital
for many applications in geosciences. Rock depth in a site is a very useful
parameter for the geotechnical earthquake engineers to find the basic
requirement of hard strata and ground motion at rock level.
In the ground response analysis, Peak Ground Acceleration (PGA) and
response spectrum for the particular site is evaluated at the rock depth levels
and further on at the ground level considering local site effects. This is an
essential step to evaluate site amplification and liquefaction hazards of a site
and further to estimate induced forces on the structures.
In ground response analysis, the response of the soil deposit is determined
from the motion at the bed rock level. In all these problems, it is essential to
evaluate the depth of the hard rock from the ground level.
With an objective of predicting the spatial variability of the reduced level of
the bed/hard rock in Bangalore, an attempt has been made to develop models
Introduction to Engineering Seismology Lecture 13
Dr. P. Anbazhagan 9 of 61
based on Ordinary Kriging technique, Artificial Neural Network (ANN) and
Support Vector Machine (SVM). It is also aimed at comparing the
performance of these developed models for the available data in Bangalore.
The kriging method was developed during the 1960s and 1970s and has been
acknowledged as a good spatial interpolator (Matheron 1963; Isaaks and
Srivastava 1989; Davis 2002). The most important features of this method are
1. The unbiased estimate of results,
2. The minimum estimation error, and
3. Uncertainty evaluation of interpolation data points.
The main goal of kriging is to predict the unknown properties from the
knowledge of semi-variogram. Semi-variogram is the analytical tool used to
evaluate and quantify the degree of spatial autocorrelation. The semi-
variogram is an appreciation of the dispersion of the parameters, which equates
to the variance and also gives an autocorrelation distance that represents the
radius of influence of a measurement made at a given point.
Further, it provides the type of variability that indicates how values fluctuate in
space. A new method for cross-validation analysis of developed models has
been also proposed and validated. The cross-validation of the model has been
done based on the examination of residuals.
10.7 Grids for Site characterization
Site characterization done to the areas are divided into cells by a grid system for
estimating the effects of site conditions by assigning representative soil profiles at
the centre of each grid.
Site response analyses were conducted for each grid using the acceleration spectra
compatible simulated earthquake time histories obtained for each grid separately
based on the seismic hazard study.
Pilot areas were divided into grids to evaluate the representative parameters for
each grid by defining hypothetical boreholes located at the centre of the grids. A
hypothetical borehole should be an idealized borehole, which will be the most
representative for the soil conditions in the specific grid. In an ideal project, new
site investigations might be conducted, almost in the centre of each of the grids.
There are basically two reasons behind the grid approach adopted for evaluating
and interpreting the effects of site conditions on the ground motion at the free
field.
1. To utilize all the available data in each grid in order to have more
comprehensive and reliable information about the soil profile;
2. To eliminate the effects of different distances among boreholes or site
investigation points during the GIS mapping.
Introduction to Engineering Seismology Lecture 13
Dr. P. Anbazhagan 10 of 61
The results obtained were mapped using GIS techniques by applying linear
interpolation between the grid points, thus enabling a smooth transition of the
selected parameters. Soft transition boundaries are preferred to show the variation
of the mapped parameters.
10.8 Interpolation of non-filled grids and hypothetical boreholes
The pilot areas were divided into cells by a grid system if there are no boreholes
or in-situ tests conducted in the outer grids, and then the boundaries of the both
regions are modified as shown in the following maps for microzonation study to
avoid the need for additional extrapolation that may not be very reliable.
Interpolation of data to fill empty grid points has been carried out very carefully
and was omitted for doubtful cases as well as for cases where extrapolation of
borehole data would have been needed.
A hypothetical borehole should be an idealized borehole, which will be the most
representative for the soil conditions in the specific grid. In an ideal project, new
site investigations might be conducted, almost in the centre of each of the grids.
The hypothetical borehole was introduced for each grid as the soil profile,
including the extension up to competent layer. In case of mixed layers, the softer
layer has been chosen as the representative one.
10.9 Site Classification and 30m Concept
Seismic hazard analysis gives seismic hazard parameters at rock level. But
damages due to seismic activities depend upon the site specific properties
subsurface materials within a km from the surface. Site characterization is the
process of classifying a region / site considering average subsurface material
properties. Classification of individual sites based on the properties is a more
direct indicator of local site effects.
Seismic site classification systems are inevitably reflected in modern seismic codal
provisions to account for site effects. Recent modern seismic codes in America,
Europe, Japan and worldwide [International building code (IBC 2009), Unified
Building code (UBC 97), National Earthquake Hazards Reduction Program
(NEHRP, BSSC, 2001) and Euro code 8, 2007] have produced numerous valuable
information based on experimental and theoretical results.
In engineering site investigation, 30 m is a typical depth of borings and detailed
site characterizations. Therefore, most of the site-effect studies in earthquake
ground motions are based on the properties in the upper 30 m.

Introduction to Engineering Seismology Lecture 13
Dr. P. Anbazhagan 11 of 61
For instance, Boore et al. (1993, 1994) based their regressions for ground motions
on average shear velocity in the upper 30 m. Borcherdt (1992, 1994) and Martin
and Dobry (1994) recommended that design of structures be based on these
properties. The 30m average concept is widely used for the seismic
Microzonation by considering experimental data from geotechnical and
geophysical testing.
The site classes are defined in terms of shear velocity to a depth of 30 m, denoted
by Vs30
, if no measurements of Vs to 30 m are feasible corresponding limits in
terms of standard penetration resistance (N) and undrained shear strength ( Su )
(Borcherdt, 1994).
Site classification is followed in modern seismic codes to arrive design spectrum
and some extent to represents site and induced effects of the site during
earthquakes. This will also help to delineate sites for detailed analysis.
The geotechnical parameters used to define the site class are based on the upper
100 ft (30 480 mm) of the site profile. Profiles containing distinctly different soil
and rock layers shall be subdivided into those layers designated by a numbers that
ranges from 1 to n at the bottom where there are a total of n distinct layers in the
upper 100 ft (30 480 mm). The symbol/then refers to any one of the layers
between 1 and n
Where n
i
id1
is equal to 100 ft (30 480 mm)
Shear wave velocity
Where vsi = the shear wave velocity in ft/sec or m/s
di = the thickness of any layer (between o and 100 ft [30 480 mm])
Standard Penetration Resistance
Where Ni and di in above equation are for cohesionless soil, cohesive soil, and
rock layers.
For cohesionless soil layers
n
i si
i
n
i
i
s
v
d
d
v
1
1
n
i i
i
n
i
i
N
d
d
N
1
1
m
i i
i
sch
N
d
dN
1
(13.9)
(13.10)
(13.11)
Introduction to Engineering Seismology Lecture 13
Dr. P. Anbazhagan 12 of 61
Where Ni and di in above equation are for cohesionless soil layers only
and s
m
i
i dd1
ds = the total thickness of cohesionless soil layers in the top 100 ft (30 480
mm)
m = The number of cohesionless soil layers in the top 100 feet (30 480
mm).
Ni = The Standard Penetration Resistance determined in accordance with ASTM D
1586, as directly measured in the field without corrections, and shall not be taken
greater than 100 blows/ft. where refusal is met for rock layer, Ni shall be taken as
100 blows/ft
Undrained Shear Strength
Where c
k
i
i dd1
dc = the total thickness of cohesive soil layers in the top 100 ft (30 480 mm)
sui = The undrained shear strength in psf (kPa), not to exceed 5,000 psf (240 kPa),
ASTM D 2166 or D 2850.
chN for cohesionless soil layers (PI<20) in the top 100 ft (30 m) and average us
for cohesive soil layers (PI>20) in the top 100 ft (30 m)
PI = the plasticity index, ASTM D 4318.
10.10 Site Class Definitions – International Building Code
Based on the site soil properties, the site shall be classified as Site Class A, B, C,
D, E or F in accordance with Table 10.2. When the soil properties are not known
in sufficient detail to determine the site class, Site Class D shall be used unless the
building official or geotechnical data determines that Site Class E or F soil is
likely to be present at the site.
k
i ui
i
cu
S
d
ds
1
(13.12)
Introduction to Engineering Seismology Lecture 13
Dr. P. Anbazhagan 13 of 61
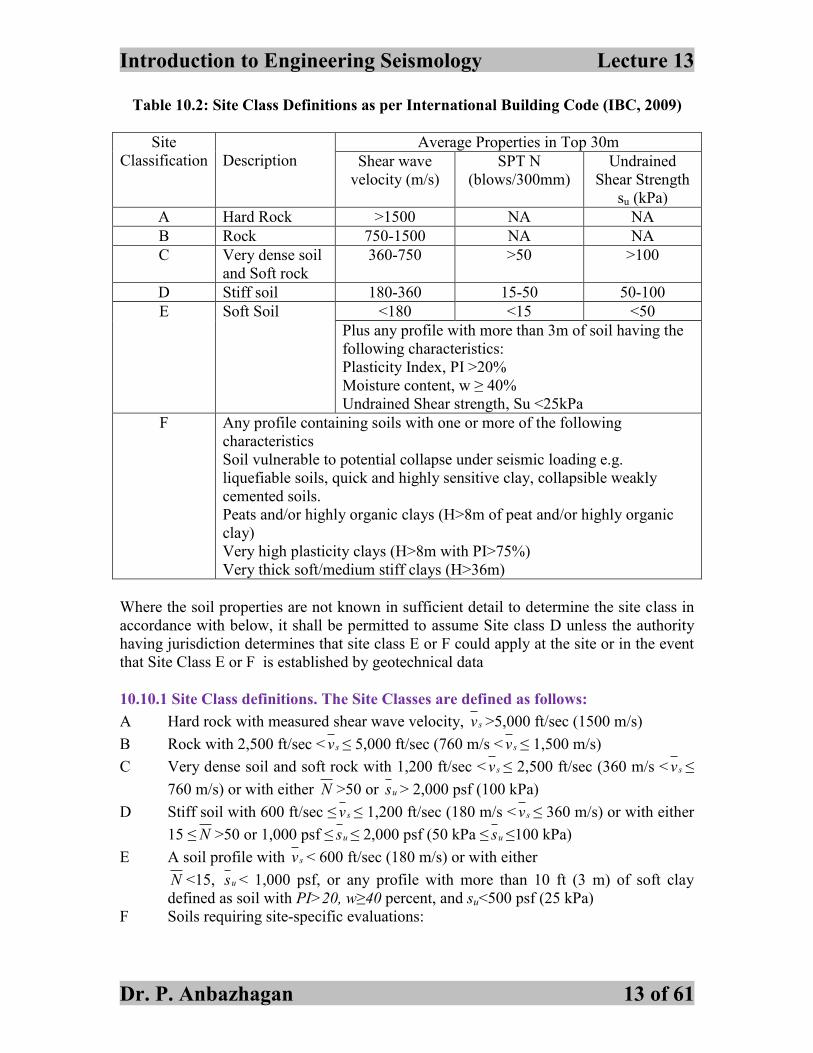
Table 10.2: Site Class Definitions as per International Building Code (IBC, 2009)
Site
Classification
Description
Average Properties in Top 30m
Shear wave
velocity (m/s)
SPT N
(blows/300mm)
Undrained
Shear Strength
su (kPa)
A Hard Rock >1500 NA NA
B Rock 750-1500 NA NA
C Very dense soil
and Soft rock
360-750 >50 >100
D Stiff soil 180-360 15-50 50-100
E
Soft Soil <180 <15 <50
Plus any profile with more than 3m of soil having the
following characteristics:
Plasticity Index, PI >20%
Moisture content, w ≥ 40%
Undrained Shear strength, Su <25kPa
F Any profile containing soils with one or more of the following
characteristics
Soil vulnerable to potential collapse under seismic loading e.g.
liquefiable soils, quick and highly sensitive clay, collapsible weakly
cemented soils.
Peats and/or highly organic clays (H>8m of peat and/or highly organic
clay)
Very high plasticity clays (H>8m with PI>75%)
Very thick soft/medium stiff clays (H>36m)
Where the soil properties are not known in sufficient detail to determine the site class in
accordance with below, it shall be permitted to assume Site class D unless the authority
having jurisdiction determines that site class E or F could apply at the site or in the event
that Site Class E or F is established by geotechnical data
10.10.1 Site Class definitions. The Site Classes are defined as follows:
A Hard rock with measured shear wave velocity, sv >5,000 ft/sec (1500 m/s)
B Rock with 2,500 ft/sec < sv ≤ 5,000 ft/sec (760 m/s < sv ≤ 1,500 m/s)
C Very dense soil and soft rock with 1,200 ft/sec < sv ≤ 2,500 ft/sec (360 m/s < sv ≤
760 m/s) or with either N >50 or us > 2,000 psf (100 kPa)
D Stiff soil with 600 ft/sec ≤ sv ≤ 1,200 ft/sec (180 m/s < sv ≤ 360 m/s) or with either
15 ≤ N >50 or 1,000 psf ≤ us ≤ 2,000 psf (50 kPa ≤ us ≤100 kPa)
E A soil profile with sv < 600 ft/sec (180 m/s) or with either
N <15, us < 1,000 psf, or any profile with more than 10 ft (3 m) of soft clay
defined as soil with PI>20, w≥40 percent, and su<500 psf (25 kPa)
F Soils requiring site-specific evaluations:
Introduction to Engineering Seismology Lecture 13
Dr. P. Anbazhagan 14 of 61
1. Soils vulnerable to potential failure or collapse under seismic loading such as
liquefiable soils quick and highly sensitive clay, collapsible weekly cemented
soils.
Exception: For structures having fundamental periods of vibration less than or
equal to 0.5 second, site- specific evaluations are not required to determine
spectral accelerations for liquefiable soils. Rather, the Site class May be
determined in accordance with below section, assuming liquefaction does not
occur.
2. Peat and /or highly organic clays (H> 10ft [3ft] of peat and/or highly organic
clay, where H = thickness of soil)
3. Very high plasticity clays (H> 25ft [8m] with PI>75)
4. Very thick, soft/medium stiff clays (H> 120 ft [36 m]) with su<1,000 psf (50
kPa)
10.10.2 Steps for Classifying a Site
Step 1: Check for the four categories of Site Class F requiring site-specific evaluation. If
the site corresponds to any of these categories, classify the site as site class F and
Conduct a site specific evaluation
Step 2: Check for the existence of a total thickness of soft clay> 10ft (3 m) where a soft
clay layer is defined by: su < 500 psf (25 kPa), w ≥ 40 percent, and PI > 20. If
these criteria are satisfied classify the site as Site Class E.
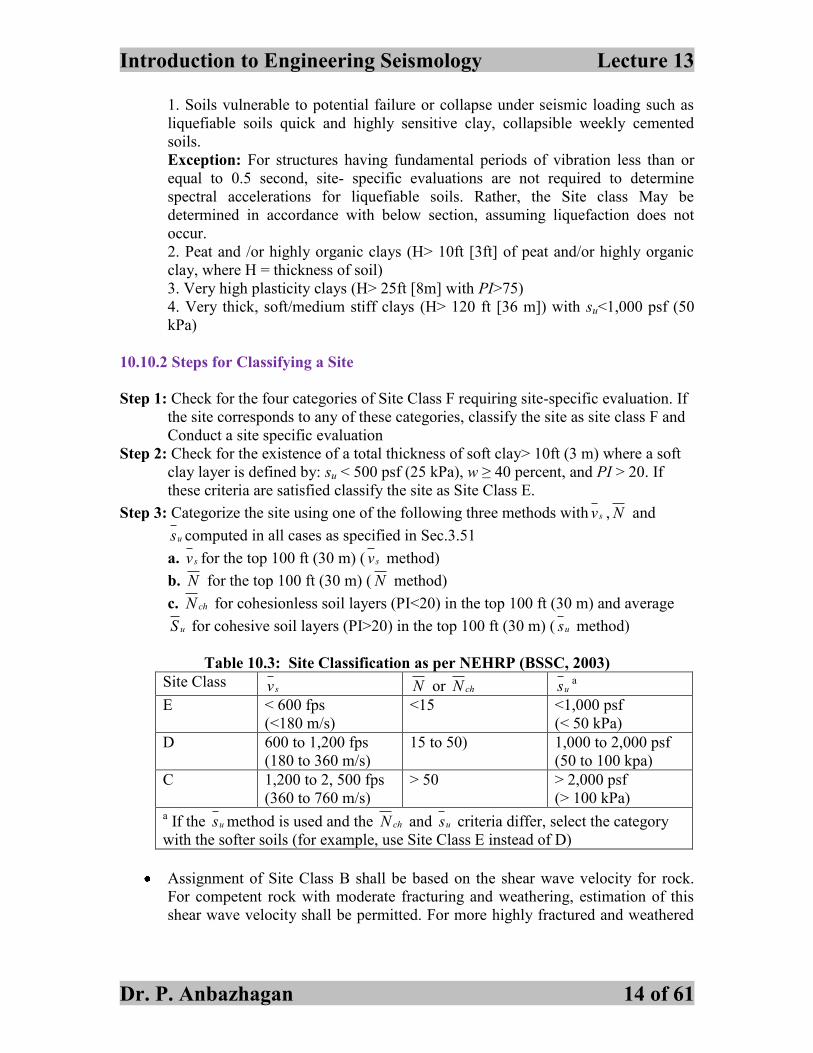
Step 3: Categorize the site using one of the following three methods with sv , N and
us computed in all cases as specified in Sec.3.51
a. sv for the top 100 ft (30 m) ( sv method)
b. N for the top 100 ft (30 m) ( N method)
c. chN for cohesionless soil layers (PI<20) in the top 100 ft (30 m) and average
uS for cohesive soil layers (PI>20) in the top 100 ft (30 m) ( us method)
Table 10.3: Site Classification as per NEHRP (BSSC, 2003)
Site Class sv N or chN us
a
E < 600 fps
(<180 m/s)
<15 <1,000 psf
(< 50 kPa)
D 600 to 1,200 fps
(180 to 360 m/s)
15 to 50) 1,000 to 2,000 psf
(50 to 100 kpa)
C 1,200 to 2, 500 fps
(360 to 760 m/s)
> 50 > 2,000 psf
(> 100 kPa) a If the us method is used and the chN and us criteria differ, select the category
with the softer soils (for example, use Site Class E instead of D)
Assignment of Site Class B shall be based on the shear wave velocity for rock.
For competent rock with moderate fracturing and weathering, estimation of this
shear wave velocity shall be permitted. For more highly fractured and weathered

Introduction to Engineering Seismology Lecture 13
Dr. P. Anbazhagan 15 of 61
rock, the shear wave velocity shall be directly measured or the site shall be
assigned to Site Class C.
Assignment of Site Class A shall be supported by either shear wave velocity
measurements on site or shear wave velocity measurements on profiles of the
same rock type in the same formation with an equal or greater degree of
weathering and Fracturing. Where hard rock conditions are known to be
continuous to a depth of 100 ft (30 m), surficial shear wave velocity
measurements may be extrapolated to assess sv .
Site Classes A and B shall not be used where there is more than 10 ft (3 m) of soil
between the rock surface and the bottom of the spread footing or mat foundation.
10.11 Site Class Definitions – European Standard
Further guidance concerning ground investigation and classification is given in
EN 1998-5:2004, 4.2.
The construction site and the nature of the supporting ground should normally be
free from risks of ground rupture, slope instability and permanent settlements
caused by liquefaction or densification in the event of an earthquake. The
possibility of occurrence of such phenomena shall be investigated in accordance
with EN 1998- 5:2004, Section 4.
Depending on the importance class of the structure and the particular conditions
of the project, ground investigations and/or geological studies should be
performed to determine the seismic action.
10.11.1 Identification of ground types
Ground types A, B, C, D, and E, described by the stratigraphic profiles and
parameters given in Table 3.1 and described hereafter, may be used to account for
the influence of local ground conditions on the seismic action. This may also be
done by additionally taking into account the influence of deep geology on the
seismic action.
The site should be classified according to the value of the average shear wave
velocity, vs,30, if this is available. Otherwise the value of NSPT should be used.
The average shear wave velocity vs,30 should be computed in accordance with the
following expression:
Ni i
i
s
v
hv
,1
30,
30
(13.13)
Introduction to Engineering Seismology Lecture 13
Dr. P. Anbazhagan 16 of 61
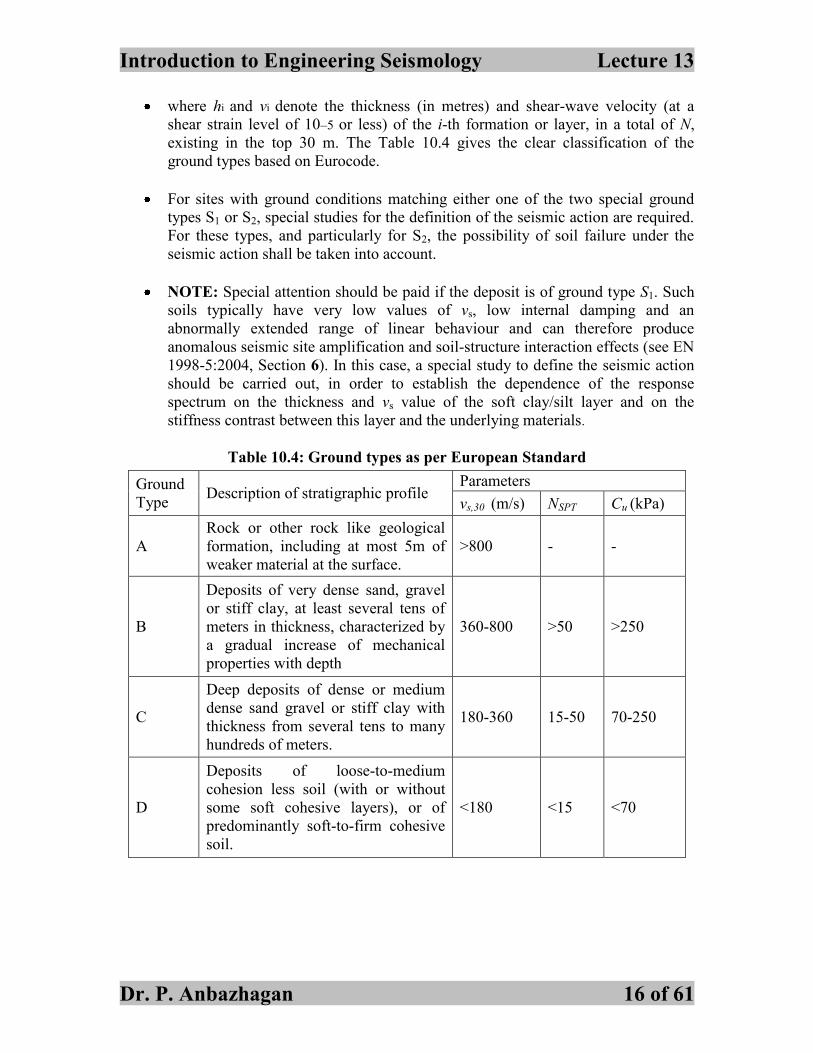
where hi and vi denote the thickness (in metres) and shear-wave velocity (at a
shear strain level of 10–5 or less) of the i-th formation or layer, in a total of N,
existing in the top 30 m. The Table 10.4 gives the clear classification of the
ground types based on Eurocode.
For sites with ground conditions matching either one of the two special ground
types S1 or S2, special studies for the definition of the seismic action are required.
For these types, and particularly for S2, the possibility of soil failure under the
seismic action shall be taken into account.
NOTE: Special attention should be paid if the deposit is of ground type S1. Such
soils typically have very low values of vs, low internal damping and an
abnormally extended range of linear behaviour and can therefore produce
anomalous seismic site amplification and soil-structure interaction effects (see EN
1998-5:2004, Section 6). In this case, a special study to define the seismic action
should be carried out, in order to establish the dependence of the response
spectrum on the thickness and vs value of the soft clay/silt layer and on the
stiffness contrast between this layer and the underlying materials.
Table 10.4: Ground types as per European Standard
Ground
Type Description of stratigraphic profile
Parameters
vs,30 (m/s) NSPT Cu (kPa)
A
Rock or other rock like geological
formation, including at most 5m of
weaker material at the surface.
>800 - -
B
Deposits of very dense sand, gravel
or stiff clay, at least several tens of
meters in thickness, characterized by
a gradual increase of mechanical
properties with depth
360-800 >50 >250
C
Deep deposits of dense or medium
dense sand gravel or stiff clay with
thickness from several tens to many
hundreds of meters.
180-360 15-50 70-250
D
Deposits of loose-to-medium
cohesion less soil (with or without
some soft cohesive layers), or of
predominantly soft-to-firm cohesive
soil.
<180 <15 <70
Introduction to Engineering Seismology Lecture 13
Dr. P. Anbazhagan 17 of 61
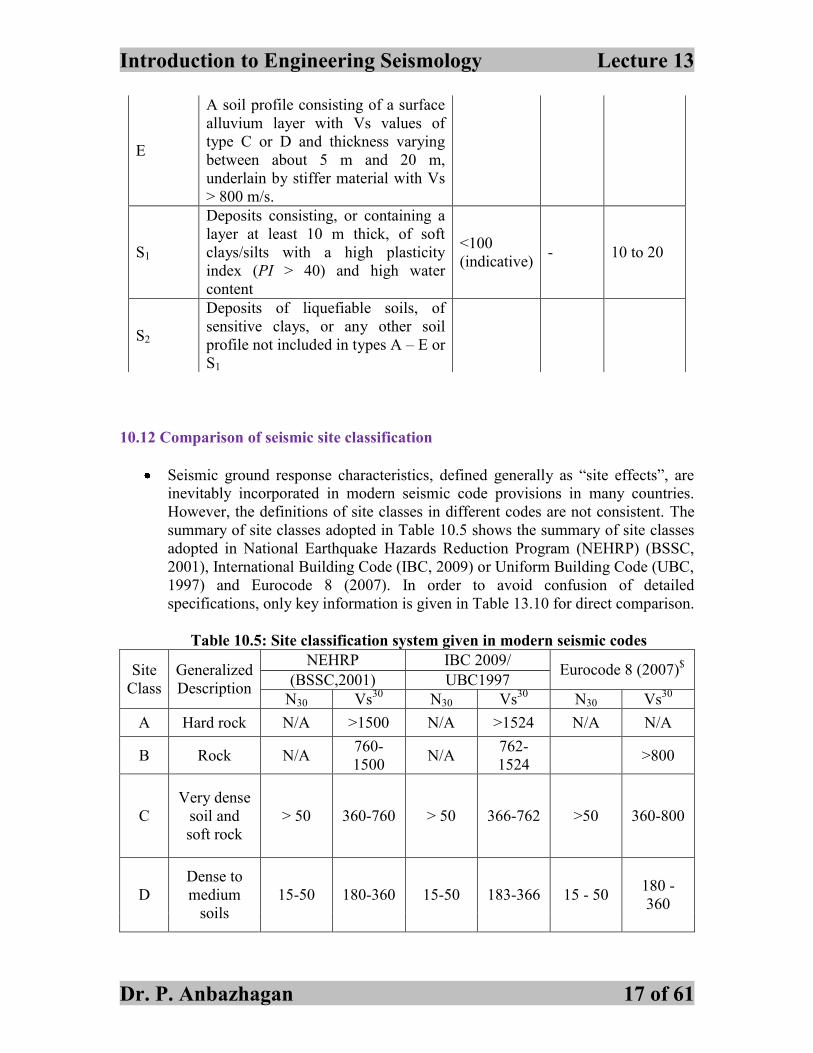
10.12 Comparison of seismic site classification
Seismic ground response characteristics, defined generally as “site effects”, are
inevitably incorporated in modern seismic code provisions in many countries.
However, the definitions of site classes in different codes are not consistent. The
summary of site classes adopted in Table 10.5 shows the summary of site classes
adopted in National Earthquake Hazards Reduction Program (NEHRP) (BSSC,
2001), International Building Code (IBC, 2009) or Uniform Building Code (UBC,
1997) and Eurocode 8 (2007). In order to avoid confusion of detailed
specifications, only key information is given in Table 13.10 for direct comparison.
Table 10.5: Site classification system given in modern seismic codes
Site
Class
Generalized
Description
NEHRP IBC 2009/ Eurocode 8 (2007)
$
(BSSC,2001) UBC1997
N30 Vs30
N30 Vs30
N30 Vs30
A Hard rock N/A >1500 N/A >1524 N/A N/A
B Rock N/A 760-
1500 N/A
762-
1524 >800
C
Very dense
soil and
soft rock
> 50 360-760 > 50 366-762 >50 360-800
D
Dense to
medium
soils
15-50 180-360 15-50 183-366 15 - 50 180 -
360
E
A soil profile consisting of a surface
alluvium layer with Vs values of
type C or D and thickness varying
between about 5 m and 20 m,
underlain by stiffer material with Vs
> 800 m/s.
S1
Deposits consisting, or containing a
layer at least 10 m thick, of soft
clays/silts with a high plasticity
index (PI > 40) and high water
content
<100
(indicative) - 10 to 20
S2
Deposits of liquefiable soils, of
sensitive clays, or any other soil
profile not included in types A – E or
S1
Introduction to Engineering Seismology Lecture 13
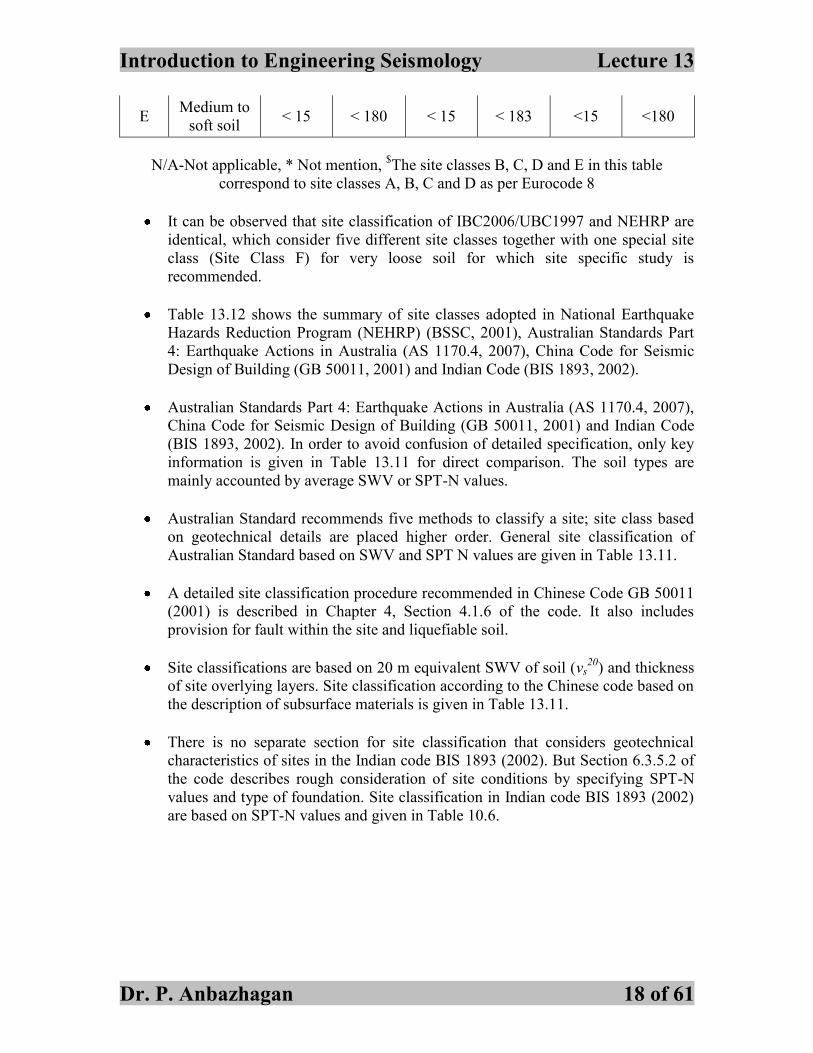
Dr. P. Anbazhagan 18 of 61
E Medium to
soft soil < 15 < 180 < 15 < 183 <15 <180
N/A-Not applicable, * Not mention, $The site classes B, C, D and E in this table
correspond to site classes A, B, C and D as per Eurocode 8
It can be observed that site classification of IBC2006/UBC1997 and NEHRP are
identical, which consider five different site classes together with one special site
class (Site Class F) for very loose soil for which site specific study is
recommended.
Table 13.12 shows the summary of site classes adopted in National Earthquake
Hazards Reduction Program (NEHRP) (BSSC, 2001), Australian Standards Part
4: Earthquake Actions in Australia (AS 1170.4, 2007), China Code for Seismic
Design of Building (GB 50011, 2001) and Indian Code (BIS 1893, 2002).
Australian Standards Part 4: Earthquake Actions in Australia (AS 1170.4, 2007),
China Code for Seismic Design of Building (GB 50011, 2001) and Indian Code
(BIS 1893, 2002). In order to avoid confusion of detailed specification, only key
information is given in Table 13.11 for direct comparison. The soil types are
mainly accounted by average SWV or SPT-N values.
Australian Standard recommends five methods to classify a site; site class based
on geotechnical details are placed higher order. General site classification of
Australian Standard based on SWV and SPT N values are given in Table 13.11.
A detailed site classification procedure recommended in Chinese Code GB 50011
(2001) is described in Chapter 4, Section 4.1.6 of the code. It also includes
provision for fault within the site and liquefiable soil.
Site classifications are based on 20 m equivalent SWV of soil (vs20
) and thickness
of site overlying layers. Site classification according to the Chinese code based on
the description of subsurface materials is given in Table 13.11.
There is no separate section for site classification that considers geotechnical
characteristics of sites in the Indian code BIS 1893 (2002). But Section 6.3.5.2 of
the code describes rough consideration of site conditions by specifying SPT-N
values and type of foundation. Site classification in Indian code BIS 1893 (2002)
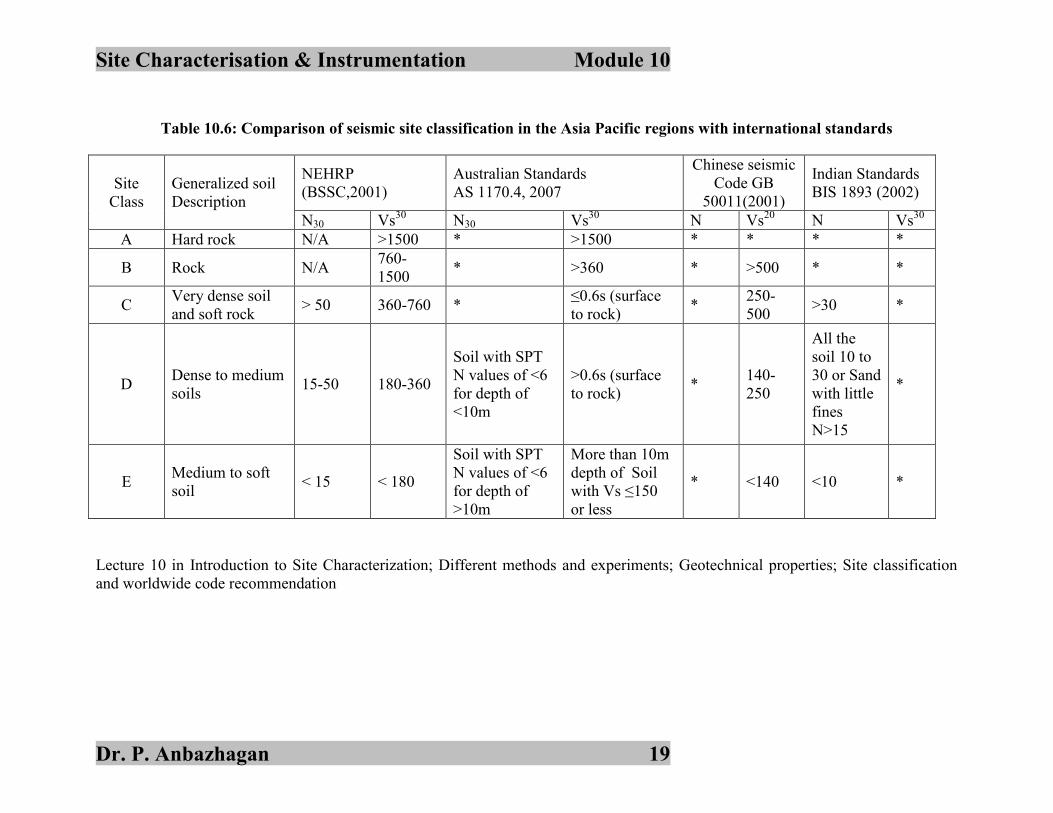
are based on SPT-N values and given in Table 10.6.
Site Characterisation & Instrumentation Module 10
Dr. P. Anbazhagan 19
Table 10.6: Comparison of seismic site classification in the Asia Pacific regions with international standards
Lecture 10 in Introduction to Site Characterization; Different methods and experiments; Geotechnical properties; Site classification
and worldwide code recommendation
Site
Class
Generalized soil
Description
NEHRP
(BSSC,2001)
Australian Standards
AS 1170.4, 2007
Chinese seismic
Code GB
50011(2001)
Indian Standards
BIS 1893 (2002)
N30 Vs30
N30 Vs30
N Vs20
N Vs30
A Hard rock N/A >1500 * >1500 * * * *
B Rock N/A 760-
1500 * >360 * >500 * *
C Very dense soil
and soft rock > 50 360-760 *
≤0.6s (surface
to rock) *
250-
500 >30 *
D Dense to medium
soils 15-50 180-360
Soil with SPT
N values of <6
for depth of
<10m
>0.6s (surface
to rock) *
140-
250
All the
soil 10 to
30 or Sand
with little
fines
N>15
*
E Medium to soft
soil < 15 < 180
Soil with SPT
N values of <6
for depth of
>10m
More than 10m
depth of Soil
with Vs ≤150
or less
* <140 <10 *

Site Characterisation & Instrumentation Module 10
Dr. P. Anbazhagan 20
10.13 Case study of seismic site classification
Seismic site classifications are used to represent site effects for estimating hazard
parameters (response spectral ordinates) at soil surface. Seismic site classifications
have generally been carried out using average shear wave velocity (SWV) and/or
Standard Penetration Test (SPT)-N values of top 30 m soil layers, according to the
recommendations of National Earthquake Hazards Reduction Program (NEHRP) or
International Building Code (IBC).
The site classification system in IBC/NEHRP is based on the studies carried out in
the United States where soil layers extend up to several hundred meters before
reaching any distinct soil-bedrock interface and may not be directly applicable to
other regions, especially in regions having shallow geological deposits.
This section presents site calssifcation of shallow soi sites amd investigates the
influence of rock depth on site classes based on the recommendations of
IBC/NEHRP. Soil sites having a wide range of average SWV (or SPT-N values)
used in this study have been collected from different parts of Australia, China, and
India.
Shear wave velocities of rock layers underneath soil layers have also been collected
at depths from few meters to 180 m. It is shown that site classification system based
on top 30 m soil layers often represents stiffer site classes for soil sites having
shallow rock depths (rock depths less than 25 m from soil surface).
This case study is part of Anbazhagan et al., (2012) publication - Anbazhagan P,
Neaz Sheikh M. and Aditya P (2013), Influence of Rock Depth on Site
Classifications in Asia Pacific Region , Natural Hazard Review ASCE, (14(2), 108-121
10.13.1 Summary of seismic site calssifcation
Soil condition modifies ground motion and in many cases results in greater
amplitude of motion together with a change in frequency content and duration of
ground motion.
Site-specific ground response analysis aims at determining the effect of local soil
conditions on site response (e.g., amplification of seismic shear waves, effect on
frequency content and duration of ground motion).
Estimation of the earthquake response spectra with due consideration to the local
soil site effects is very important for the design of new structures and performance
assessment of existing structures (Tsang et al. 2006; Chandler et al. 2002).
The response at the surface of soil deposits is dependent mainly on the frequency
content and amplitude of ground motion at bedrock, and the geometry and material
properties of the soil layers above the bedrock. Site specific response parameters
(response spectral acceleration, velocity and displacement) are directly or indirectly
quantified and represented by a number of researchers as part of the seismic
microzonation study.
In such microzonation studies and also in the design codes worldwide, site effects
are accounted in the form of seismic site classes. Although several methods for
seismic site classifications have been recommended in design codes, most popular
Site Characterisation & Instrumentation Module 10
Dr. P. Anbazhagan 21
methods are those that consider borelogs with SPT-N values and SWV from
Spectral Analysis of Surface Waves (SASW) and Multichannel Analysis of Surface
Waves (MASW) (Anbazhagan and Sitharam 2008a).
Most of the seismic site classification methods consider average SWV or SPT-N
values of top 30 m soil layers, because of direct correlation with the method
proposed by National Earthquake Hazards Reduction Program (NEHRP) (BSSC
2001) and International Building Code (IBC 2006). This has also been widely
adopted in seismic microzonation studies (Anbazhagan and Sitharam 2008b;
Anbazhagan et al. 2010). These site classification schemes are then combined with
a probabilistic approach to estimate the surface level hazard response parameters
(RaghuKanth and Iyengar 2007).
In spite of their wide use, the seismic site classification schemes considering top 30
m soil layers are under significant research scrutiny (Lee et al. 1995; Marek et al.
2001; Kokusho and Sato 2008; Anbazhagan et al. 2011a).
The applicability of such methods especially in shallow bedrock regions needs
further investigation. Shallow bedrocks are more common in the most of
seismically vulnerable regions, where a distinct soil-bedrock interface can be
observed within several meter depth of soil layers. However, in the high seismicity
regions of Western United States where site classification scheme were originated,
distinct soil-bedrock interface may not be evident even under several hundred meter
depth of soil layers. Considering the important differences between shallow bedrock
regions and regions without distinct soil-bedrock interface (in high seismic zones),
Tsang et al. (2006) recommend for not adopting average SWV of top 30 m soil
layers (Vs,30) in proposing site amplification parameters for regions where depth of
bedrock is shallow.
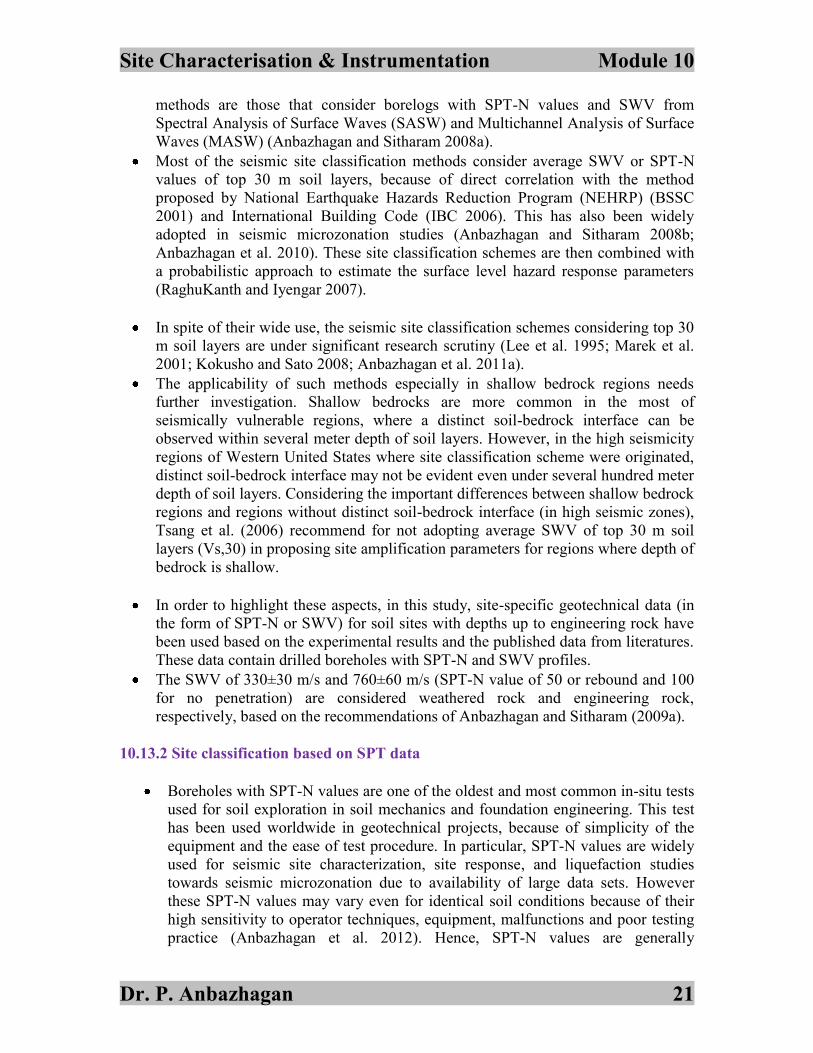
In order to highlight these aspects, in this study, site-specific geotechnical data (in
the form of SPT-N or SWV) for soil sites with depths up to engineering rock have
been used based on the experimental results and the published data from literatures.
These data contain drilled boreholes with SPT-N and SWV profiles.
The SWV of 330±30 m/s and 760±60 m/s (SPT-N value of 50 or rebound and 100
for no penetration) are considered weathered rock and engineering rock,
respectively, based on the recommendations of Anbazhagan and Sitharam (2009a).
10.13.2 Site classification based on SPT data
Boreholes with SPT-N values are one of the oldest and most common in-situ tests
used for soil exploration in soil mechanics and foundation engineering. This test
has been used worldwide in geotechnical projects, because of simplicity of the
equipment and the ease of test procedure. In particular, SPT-N values are widely
used for seismic site characterization, site response, and liquefaction studies
towards seismic microzonation due to availability of large data sets. However
these SPT-N values may vary even for identical soil conditions because of their
high sensitivity to operator techniques, equipment, malfunctions and poor testing
practice (Anbazhagan et al. 2012). Hence, SPT-N values are generally

Site Characterisation & Instrumentation Module 10
Dr. P. Anbazhagan 22
recommended only for projects at preliminary stage or under financial constraint
(Anbazhagan and Sitharam 2010).
In the present study, SPT-N values of the selected soil profiles have been
collected from Australia, China and India (IEA 1990; Pappin et al. 2008;
Anbazhagan and Sitharam 2009a; Anbazhagan et al. 2011b). In total, nineteen
boreholes with SPT-N values have been selected for this study. A summary of
these data is given in Table 10.7.
Table 10.7: Summary of the selected soil profiles with SPT N values
Borehole
No Country
Depth (m) of
profile
Weathered and
Engineering
Rock depth
(m)
General Soil
Layers
Description
1 Australia 8.2 8.2 Sand, silty sand,
silty clay up to
rock 2 Australia 17 17
3 Australia 6.2 6.2
4 China 46.5 46.5
Sand, clay, silty
clay and debris
flow
5 India 6 2.5 and 6
Red soil, sand,
clay and rock
6 India 10.5 6 and 9
7 India 26 9 and 12.5
8 India 24.5 3.5 and 8
9 India 26 6 and 8
10 India 30 3 and 6
11 India 16.5 17.5 and 22.5
12 India 9 16 and 20.5
13 India 12.5 12
14 India 8 9.5 and 10.5
15 India 8 14.5 and 26
16 India 6 24.5
17 India 22.5 24.5 and 26
18 India 20.5 27 and 30
19 India 12 16.5
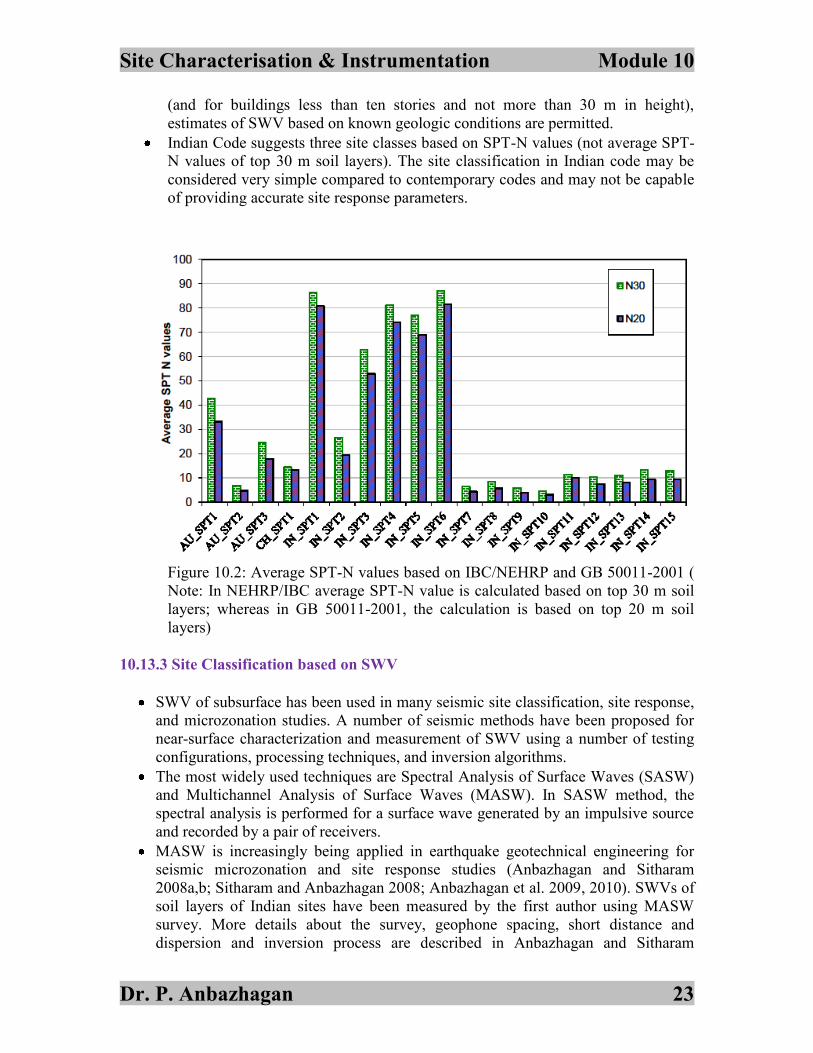
Equivalent SPT-N values for 30 m and 20 m depths have been estimated using
equation disscussed above and presented in Figure 10.2.
SPT-N values have been used to classify the sites according to IBC/NEHRP.
According to IBC/NEHRP, all N30 values above 50 are grouped in site class C.
No N30 based criterion are given for site classes A and B, which may mean N30 of
55, 70 and 85 belong to site class C.
Chinese Code recommends measuring SWV for site classification; no site class
based on SPT-N value is recommended. However for building categories C or D
Site Characterisation & Instrumentation Module 10
Dr. P. Anbazhagan 23
(and for buildings less than ten stories and not more than 30 m in height),
estimates of SWV based on known geologic conditions are permitted.
Indian Code suggests three site classes based on SPT-N values (not average SPT-
N values of top 30 m soil layers). The site classification in Indian code may be
considered very simple compared to contemporary codes and may not be capable
of providing accurate site response parameters.
Figure 10.2: Average SPT-N values based on IBC/NEHRP and GB 50011-2001 (
Note: In NEHRP/IBC average SPT-N value is calculated based on top 30 m soil
layers; whereas in GB 50011-2001, the calculation is based on top 20 m soil
layers)
10.13.3 Site Classification based on SWV
SWV of subsurface has been used in many seismic site classification, site response,
and microzonation studies. A number of seismic methods have been proposed for
near-surface characterization and measurement of SWV using a number of testing
configurations, processing techniques, and inversion algorithms.
The most widely used techniques are Spectral Analysis of Surface Waves (SASW)
and Multichannel Analysis of Surface Waves (MASW). In SASW method, the
spectral analysis is performed for a surface wave generated by an impulsive source
and recorded by a pair of receivers.
MASW is increasingly being applied in earthquake geotechnical engineering for
seismic microzonation and site response studies (Anbazhagan and Sitharam
2008a,b; Sitharam and Anbazhagan 2008; Anbazhagan et al. 2009, 2010). SWVs of
soil layers of Indian sites have been measured by the first author using MASW
survey. More details about the survey, geophone spacing, short distance and
dispersion and inversion process are described in Anbazhagan and Sitharam

Site Characterisation & Instrumentation Module 10
Dr. P. Anbazhagan 24
(2008a,b, 2009a,b). Few shear wave velocity profiles have also been collected from
Boominathan (2004), Boominathan et al (2008), and Uma Maheswari (2008). SWV
profiles of Australia sites have been compiled from Collins et al. (2006). Similarly
SWV profiles of China have been collected from Song et al. (2007) and Hwang et
al. (2004). Selected soil sites with shear wave velocity profiles have been
summarised in Table 10.8.
Table 10.8: Summary of the selected shear wave velocity profiles
Shear
Wave
Velocity
Profile
No
Country Depth of
profile(m)
Weathered Rock
depth (m)
(360±m/s)
Engineering Rock
depth (m)
(700±70m/s)
1 Australia 100 2.97 3.5
2 Australia 150.62 2.6 4
3 Australia 180 4 37
4 Australia 98 16 42.4
5 Australia 110 7 22.41
6 China 16.5 3.5 16.5
7 China 24 10.5 18.5
8 China 30 2 19.5
9 China 55 2 25
10 China 44.5 32.5 40
11 China 60 18 60
12 China 96 19.5 59
13 China 60 44.5 55.5
14 China 60 29 43.98
15 India 140 1 122
16 India 10 4.67 10
17 India 72 13.6 57
18 India 69 17.54 68.96
19 India 27 16.88 NA
20 India 41 19.25 NA
21 India 28 27.93 NA
22 India 64 6.2 16.4
23 India 69 6.5 12.3
24 India 63 6.7 15.9
25 India 22 NA NA
26 India 28 5.04 17.29
27 India 26 16.15 NA
28 India 60 11.5 13.5
29 India 16.5 15 NA
30 India 27.5 4.9 12.85
31 India 44.4 5.25 20.76
Note: NA- Not available

Site Characterisation & Instrumentation Module 10
Dr. P. Anbazhagan 25
Average SWVs up to depths of 30 m and 20 m have been calculated using equation
1 and presented in Figure 10.3. For sites having SWV less than 30 m depth,
extrapolations have been carried out according to Boore (2004).
Figure 10.3 shows that 76% of sites are classified as site class D, 5% are site class
E. Australian sites 1 and 2 are classified as site classes A and B, respectively,
according to IBC/NEHRP. Site classification definition in Australian Standard (AS
1170.4) is similar to IBC/NEHRP recommendation for site class A. However, for
site class B, AS 1170.4 recommends SWV of greater than 360 m/s, which
corresponds to site class C in IBC/NEHRP. AS 1170.4 recommends low-amplitude
natural site period as criteria for site classes C and D which is different from the
recommendation of IBC/NEHRP. AS1170.4 recommends SWV less than 150 m/s
for site class E, which is lower than IBC/NEHRP recommendation.
Chinese code (GB 50011 2001) classifies sites into four classes based on average
SWV of top 20 m soil layers. The range of values specified in Table 4.1.6 of GB
50011 is much lower than those in IBC/NEHRP. Indian Code (BIS 1893 2002)
classifies sites into three site classes based on measured N values.
No SWV values have been recommended in BIS. It is apparent that site classes
according to Indian code are not well defined and hence may not provide similar
site response parameters compared to other codes.
Figure 10.3: Average Shear Wave Velocities (SWVs) based on IBC/NEHRP and
GB 50011-2001 ( Note: IBC/NEHRP average SWV is calculated based on top 30
m soil layers; whereas in GB 50011-2001, the calculation is based on top 20 m
soil layers)

Site Characterisation & Instrumentation Module 10
Dr. P. Anbazhagan 26
10.13.4 Proposal for Alternative Site Classification Scheme
Site amplification ratios for different site classes (based on average SWV of top
30 m soil layers) recommended in IBC/NEHRP is based on regression analysis of
strong motion records at different soil sites.
It is noted that IBC/NEHRP allows for site specific ground response studies when
the generalized site classification and site amplification ratios are judged to be
inadequate for any specific site (for example, shallow soil sites over hard bedrock
giving rise to high impedance contrast).
Site amplification ratios developed in IBC/NEHRP, therefore, cannot be applied
for shallow bedrock regions. Hence, development of a site classification scheme
for shallow bedrock region is important.
Site classification considering weathered rock layer
Average SPT-N and shear wave velocity up to weathered rock layers (soil depths
may be different from 30 m) have been calculated to classify the sites using
equation for sand following the recommendation of IBC/NEHRP to classify the
soil.
Weathered rock depth can be identified from borelog data rather than SPT-N
values.
In most cases SPT-N values more than 50 represent dense layers or weathered
rock layers. After studying borelog data carefully, weathered rock depths have
been identified for the selected soil sites.
Average SPT-N values up to weathered rock depth (NWR) have been calculated
and shown in Figure 10.4. It can be observed from Figure 10.4 that N30 and N20
(average SPT-N values upto 30 m and 20 m soil layers, respectively) are higher
than NWR implying that N30 and N20 provides stiffer site classes compared to NWR.
When weathered rock depth is within 10 m, the site class variation is
considerable.
SWV of weathered rock has been estimated as 330±30 m/s. Average shear wave
velocity up to weathered rock (Vs,WR) has been estimated and shown in Figure
10.5. Figure 10.5 clearly shows that if weathered rock depth is within 15 m, Vs,WR
is much less than Vs,30 or Vs,20 (average shear wave velocity up to 30 m and 20 m
soil layers, respectively). Site classification based on Vs,30 and Vs,20 may represent
stiffer site classes and in turn may underestimate response spectral ordinates.
Such underestimation may have significant consequences in designing civil
infrastructure. This issue has been further investigated in the section “site
response parameters for soil sites having shallow depth of engineering bedrock”.

Site Characterisation & Instrumentation Module 10
Dr. P. Anbazhagan 27
Figure 10.4: Comparison of average SPT-N values calculated based on the depth of
weathered rock layers with average SPT-N values calculated based on NEHRP/IBC
(based on top 30 m soil layers) and GB 50011-2001 recommendations (based on top
20 m soil layers)
Figure 10.5: Comparison of average SWVs calculated based on the depth of
weathered rock layers with average SWVs calculated based on NEHRP/IBC (based
on top 30 m soil layers) and GB 50011-2001 recommendations (based on top 20 m
soil layers)
Site Characterisation & Instrumentation Module 10
Dr. P. Anbazhagan 28
Site classification considering engineering rock layer
Although weathered rock is stiffer than overlaying soil layers, in many cases it is
not straightforward to differentiate between dense soil and weathered rock layers based
only on SPT-N and SWV values, unless detailed borelog study is available. Hence, site
classification considering soil layers upto weathered rock may be subjected to significant
criticism.
In this study, site classification considering average SPT-N and SWV up to
engineering bedrock has been attempted. Substructures of most important
engineering structures are extended up to the rock where SPT-N values of 100 for
no penetrations or SWV of 760 m/s (Anbazhagan and Sitharam 2009a). This rock
layer can be called engineering bedrock (Anbazhagan and Sitahram 2009a).
Engineering bedrock layer has been identified from borelogs SPT-N data,
considering layer corresponding to SWV of 760 ± 60 m/s.
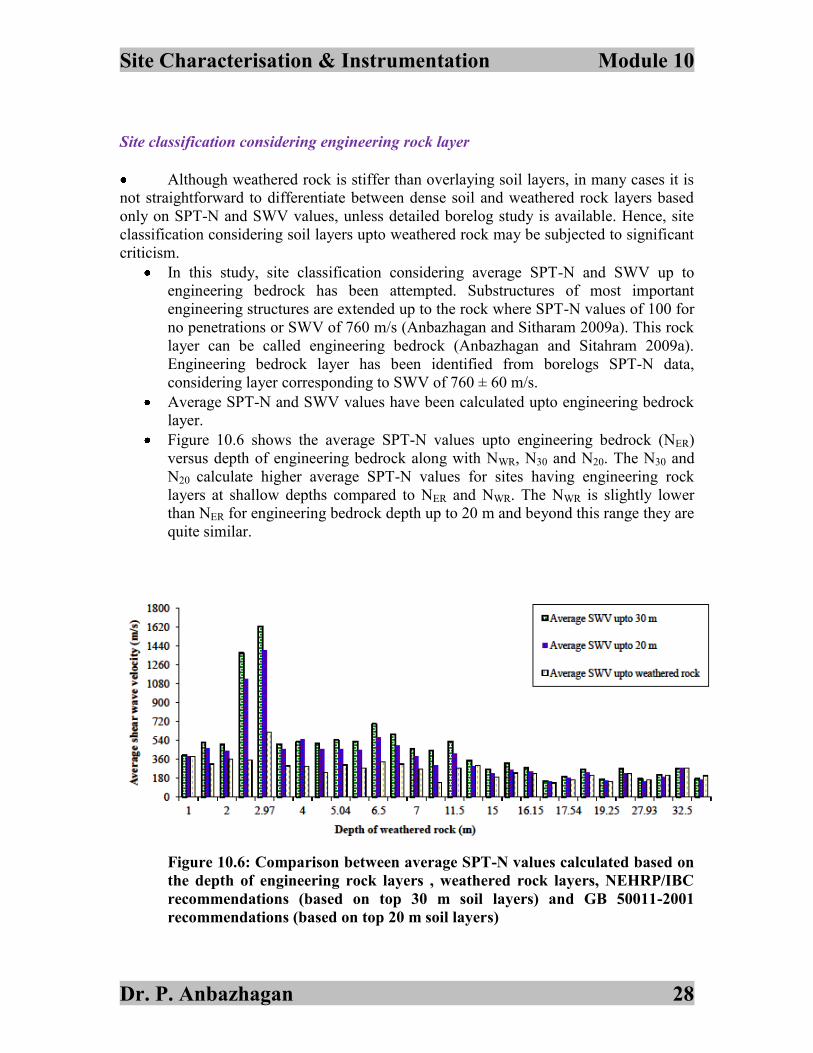
Average SPT-N and SWV values have been calculated upto engineering bedrock
layer.
Figure 10.6 shows the average SPT-N values upto engineering bedrock (NER)
versus depth of engineering bedrock along with NWR, N30 and N20. The N30 and
N20 calculate higher average SPT-N values for sites having engineering rock
layers at shallow depths compared to NER and NWR. The NWR is slightly lower
than NER for engineering bedrock depth up to 20 m and beyond this range they are
quite similar.
Figure 10.6: Comparison between average SPT-N values calculated based on
the depth of engineering rock layers , weathered rock layers, NEHRP/IBC
recommendations (based on top 30 m soil layers) and GB 50011-2001
recommendations (based on top 20 m soil layers)

Site Characterisation & Instrumentation Module 10
Dr. P. Anbazhagan 29
Figure 10.7 shows Vs,ER versus depth of engineering bedrock for selected soil
profiles along with VS,WR, Vs,30and Vs,20. Average SWV up to engineering
bedrock (VS,ER) is less than Vs,30 if engineering rock depth is less than 25 m, and
more than Vs,30 if engineering rock depth is more than 35 m. It is noted that Vs,ER
are equal to Vs,30 and Vs,20 when the engineering rock depth is 30 m and 20 m,
respectively.
Average shear wave velocity up to engineering bedrock can be considered more
representatives for site effect calculations especially for soil sites in regions of
low to moderate seismicity. This study shows that rock depth plays an important
role in the site classifications.
Site classification based average values upto 30 m gives stiffer site class if
engineering bedrock is less than 25 m.
Figure 10.7: Comparison between average SWVs calculated based on the depth of
engineering rock layers , weathered rock layers, NEHRP/IBC recommendations
(based on top 30 m soil layers) and GB 50011-2001 recommendations (based on top
20 m soil layers)