introduction to dory · unlevered after-tax free cash flow, levered after-tax free cash flow, and...
TRANSCRIPT
January 2019
Investor Presentation
DISCLAIMER
This investor presentation (“Investor Presentation”) is for informational purposes only and does not constitute an offer to sell, a solicitation of an offer to buy, or a recommendation to purchase any equity, debt or other financial instruments of Haymaker Acquisition Corp. (“Haymaker”) or OneSpaWorld (“OSW”) or any of OSW or Haymaker’s affiliates’ securities (as such term is defined under the U.S. federal securities laws). This Investor Presentation has been prepared to assist interested parties in making their own evaluation with respect to the proposed business combination of OSW and Haymaker (the “Business Combination”), as contemplated in that certain Business Combination Agreement, dated as of November 1, 2018, as amended from time to time (the “Transaction Agreement”), and for no other purpose. A copy of the Transaction Agreement was attached as Exhibit 2.1 to Haymaker’s Current Report on Form 8-K filed with the Securities and Exchange Commission (“SEC”) on November 1, 2018, and a copy of Amendment No. 1 to Business Combination Agreement, dated as of January 7, 2019, was attached as Exhibit 2.1 to Haymaker’s Current Report on Form 8-K filed with the SEC on January 8, 2019. The information contained herein does not purport to be all-inclusive. The data contained herein is derived from various internal and external sources. No representation is made as to the reasonableness of the assumptions made within or the accuracy or completeness of any projections, modeling or any other information contained herein. All levels, prices and spreads are historical and do not represent current market levels, prices or spreads, some or all of which may have changed since the issuance of this document. Any data on past performance, modeling contained herein is not an indication as to future performance. OSW and Haymaker assume no obligation to update the information in this Investor Presentation. Neither OSW nor Haymaker accepts any liability whatsoever for any losses arising from the use of this Investor Presentation or reliance on the information contained herein. Nothing herein shall be deemed to constitute investment, legal, tax, financial, accounting or other advice. This Investor Presentation is being provided for use only by the intended recipient. The information contained herein may not be reproduced or distributed in any format, in whole or in part, without the prior written consent of OSW and Haymaker.
The distribution of this Investor Presentation may also be restricted by law and persons into whose possession this Investor Presentation comes should inform themselves about and observe any such restrictions. The recipient acknowledges that it is familiar with the Securities Exchange Act of 1934, as amended, and the rules and regulations promulgated thereunder (collectively, the “Exchange Act”), and that recipient will neither use, nor cause any third party to use, this Investor Presentation or any information contained herein in contravention of the Exchange Act, including, without limitation, Rule 10b-5 thereunder.
No representation or warranty (whether expressed or implied) has been made by Haymaker, OSW or any of their respective affiliates with respect to the matters set forth in this Investor Presentation, and the recipient disclaims any such representation or warranty.
Use of Projections
This Investor Presentation contains financial forecasts, including with respect to estimated revenues, net income, Adjusted Net Income, EBITDA, Adjusted EBITDA, Adjusted EBITDA Margin, Unlevered After-Tax Free Cash Flow, Levered After-Tax Free Cash Flow, and Unlevered After-Tax Free Cash Flow Conversion, for OSW fiscal years 2018 to 2020. Neither OSW’s independent auditors, nor the independent registered public accounting firm of Haymaker, audited, reviewed, compiled, or performed any procedures with respect to the projections for the purpose of their inclusion in this Investor Presentation, and accordingly, neither of them expressed an opinion or provided any other form of assurance with respect thereto for the purpose of this Investor Presentation. These projections should not be relied upon as being necessarily indicative of future results.
In this Investor Presentation, certain of the above-mentioned estimated information has been repeated (subject to the qualifications presented herein), for purposes of providing comparisons with historical data. The assumptions and estimates underlying the prospective financial information are inherently uncertain and are subject to a wide variety of significant business, economic and competitive risks and uncertainties that could cause actual results to differ materially from those contained in the prospective financial information. Accordingly, there can be no assurance that the prospective results are indicative of the future performance of OSW, Haymaker or the combined company or that actual results will not differ materially from those presented in the prospective financial information. Inclusion of the prospective financial information in this Investor Presentation should not be regarded as a representation by any person that the results contained in the prospective financial information will be achieved.
1
DISCLAIMER (CONT’D)
Forward-Looking Statements
This Investor Presentation includes “forward-looking statements” within the meaning of the “safe harbor” provisions of the Private Securities Litigation Reform Act of 1995. The expectations, estimates, and projections of the businesses of Haymaker, OSW and OneSpaWorld Holdings Limited (“OSW Holdings”) may differ from their actual results and consequently, you should not rely on these forward looking statements as predictions of future events. Words such as “expect,” “estimate,” “project,” “budget,” “forecast,” “anticipate,” “intend,” “plan,” “may,” “will,” “could,” “should,” “believes,” “predicts,” “potential,” “continue,” and similar expressions are intended to identify such forward-looking statements. These forward-looking statements include, without limitation, expectations with respect to future performance including projected financial information (which is not audited or reviewed by auditors) and anticipated financial impacts of the proposed transaction, the satisfaction of the closing conditions to the proposed transaction, and the timing of the completion of the proposed transaction. These forward-looking statements involve significant risks and uncertainties that could cause the actual results to differ materially from the expected results. Most of these factors are outside of the control of Haymaker, OSW and OSW Holdings, and are difficult to predict. Factors that may cause such differences include, but are not limited to: (1) the occurrence of any event, change or other circumstances that could give rise to the termination of the Transaction Agreement, (2) the outcome of any legal proceedings that may be instituted against the parties following the announcement of the Transaction Agreement and the transactions contemplated therein; (3) the inability to complete the proposed transaction, including due to failure to obtain approval of the stockholders of Haymaker or other conditions to closing in the Transaction Agreement; (4) the occurrence of any event, change, or other circumstance that could give rise to the termination of the Transaction Agreement or could otherwise cause the transaction to fail to close; (5) the receipt of an unsolicited offer from another party for an alternative business transaction that could interfere with the proposed transaction; (6) the inability to obtain or maintain the listing of the post-acquisition company’s common shares on Nasdaq following the proposed transaction; (7) the risk that the proposed transaction disrupts current plans and operations as a result of the announcement and consummation of the proposed transaction; (8) the ability to recognize the anticipated benefits of the proposed transaction, which may be affected by, among other things, competition, the ability of the combined company to grow and manage growth profitably and retain its key employees; (9) costs related to the proposed transaction; (10) changes in applicable laws or regulations; (11) the demand for OSW’s and the combined company’s services together with the possibility that OSW or the combined company may be adversely affected by other economic, business, and/or competitive factors; and (12) other risks and uncertainties included in (x) the “Risk Factors” sections of the most recent Annual Report on Form 10-K filed with the SEC by Haymaker and the Registration Statement on Form S-4 filed with the SEC by OSW Holdings and (y) other documents filed or to be filed with the SEC by Haymaker and OSW Holdings. The foregoing list of factors is not exclusive. You should not place undue reliance upon any forward-looking statements, which speak only as of the date made. Haymaker, OSW, and OSW Holdings do not undertake or accept any obligation or undertaking to release publicly any updates or revisions to any forward-looking statements to reflect any change in their expectations or any change in events, conditions, or circumstances on which any such statement is based.
Industry and Market Data
In this Investor Presentation, OSW relies on and refers to information and statistics regarding market shares in the sectors in which it competes and other industry data. OSW obtained this information and statistics from third-party sources believed to be reliable, including reports by market research firms. OSW has supplemented this information where necessary with information from discussions with its customers and its own internal estimates, taking into account publicly available information about other industry participants and its management’s best view as to information that is not publicly available. Neither OSW nor Haymaker has independently verified the accuracy or completeness of any such third-party information.
2
DISCLAIMER (CONT’D)
Use of Non-GAAP Financial Measures
This Investor Presentation includes non-GAAP financial measures for OSW which do not conform to SEC Regulation S-X in that it includes financial information (such as EBITDA, Adjusted EBITDA, Adjusted Net Income, Unlevered After-Tax Free Cash Flow, Levered After-Tax Free Cash Flow, and Unlevered After-Tax Free Cash Flow Conversion) not derived in accordance with U.S. GAAP. Accordingly, such information and data is adjusted and presented differently in the preliminary proxy statement/prospectus on Form S-4 initially filed by OSW Holdings on November 13, 2018, as amended from time to time (the “Registration Statement”). OSW believes that the presentation of non-GAAP measures provides information that is useful to investors as it indicates more clearly the ability of OSW to meet capital expenditure and working capital requirements and provides an additional tool for investors to use in evaluating ongoing operating results and trends. You should review OSW’s audited and interim financial statements, which are included in the Registration Statement, and not rely on any single financial measure to evaluate their respective businesses. Other companies may calculate EBITDA, Adjusted EBITDA, Adjusted Net Income, Unlevered After-Tax Free Cash Flow, Levered After-Tax Free Cash Flow, Unlevered After-Tax Free Cash Flow Conversion and other non-GAAP measures differently, and therefore OSW’s respective EBITDA, Adjusted EBITDA, Adjusted Net Income, Unlevered After-Tax Free Cash Flow, Levered After-Tax Free Cash Flow, Unlevered After-Tax Free Cash Flow Conversion and other non-GAAP measures may not be directly comparable to similarly titled measures of other companies.
Additional Information
On November 13, 2018, OSW Holdings initially filed the Registration Statement with the SEC, and has subsequently filed amendments thereto. The Registration Statement includes a preliminary prospectus with respect to the securities OSW Holdings will issue in connection with the Business Combination and a preliminary proxy statement of Haymaker in connection with the Business Combination. Haymaker will mail a definitive proxy statement/prospectus and other relevant documents to its stockholders. Investors and security holders of Haymaker are advised to read the proxy statement/prospectus in connection with Haymaker’s solicitation of proxies for its special meeting of stockholders to be held to approve the Business Combination (and related matters) because the proxy statement/prospectus will contain important information about the Business Combination and the parties to the Business Combination. The Registration Statement has not yet been declared effective by the SEC. The definitive proxy statement/prospectus will be mailed to stockholders of Haymaker as of a record date to be established for voting on the Business Combination. Stockholders will also be able to obtain copies of the proxy statement/prospectus, without charge, once available, at the SEC’s website at www.sec.gov or by directing a request to: Haymaker Acquisition Corp., 650 Fifth Avenue, Floor 10, New York, New York 10019.
This Investor Presentation shall not constitute a solicitation of a proxy, consent or authorization with respect to any securities or in respect of the Business Combination.
Participants in the Solicitation
Haymaker, the Seller Representative (as defined in the Transaction Agreement), OSW Holdings, and their respective directors, executive officers, other members of management, and employees, under SEC rules, may be deemed to be participants in the solicitation of proxies of Haymaker’s stockholders in connection with the Business Combination. Investors and security holders may obtain more detailed information regarding the names and interests in the Business Combination of Haymaker’s directors and officers in Haymaker’s filings with the SEC, including Haymaker’s Annual Report on Form 10-K for the fiscal year ended December 31, 2017, which was filed with the SEC on March 30, 2018, and the Registration Statement filed by OSW Holdings, which includes the proxy statement of Haymaker for the Business Combination.
3
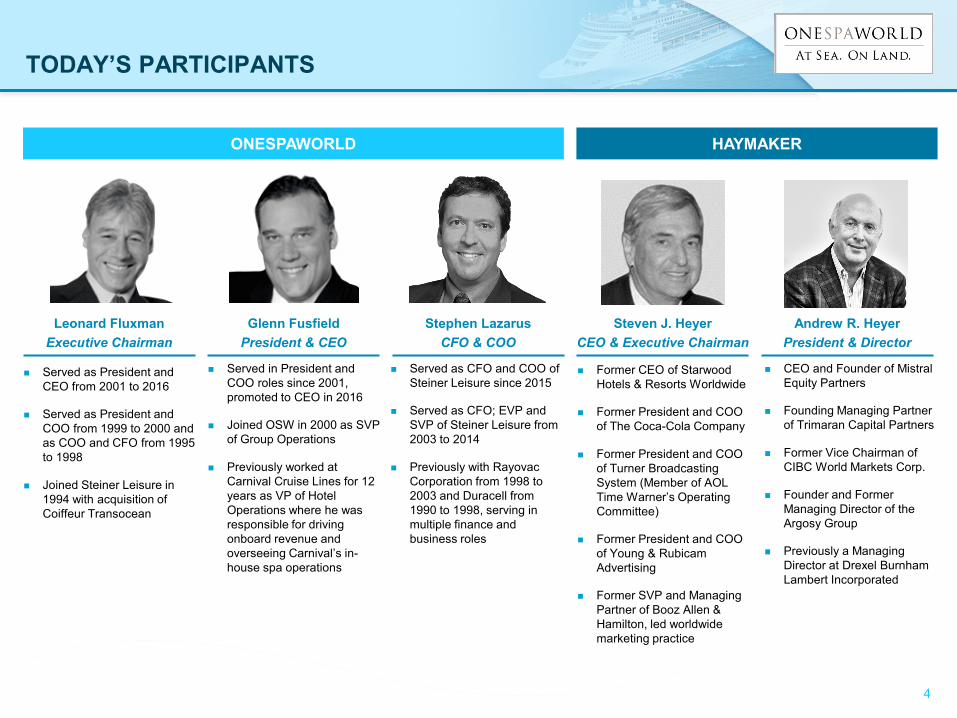
TODAY’S PARTICIPANTS
HAYMAKER ONESPAWORLD
Leonard Fluxman Executive Chairman
Glenn Fusfield President & CEO
Steven J. Heyer CEO & Executive Chairman
Andrew R. Heyer President & Director
Former CEO of Starwood Hotels & Resorts Worldwide
Former President and COO of The Coca-Cola Company
Former President and COO of Turner Broadcasting System (Member of AOL Time Warner’s Operating Committee)
Former President and COO of Young & Rubicam Advertising
Former SVP and Managing Partner of Booz Allen & Hamilton, led worldwide marketing practice
CEO and Founder of Mistral Equity Partners
Founding Managing Partner of Trimaran Capital Partners
Former Vice Chairman of CIBC World Markets Corp.
Founder and Former Managing Director of the Argosy Group
Previously a Managing Director at Drexel Burnham Lambert Incorporated
Served as President and CEO from 2001 to 2016
Served as President and COO from 1999 to 2000 and as COO and CFO from 1995 to 1998
Joined Steiner Leisure in 1994 with acquisition of Coiffeur Transocean
Served in President and COO roles since 2001, promoted to CEO in 2016
Joined OSW in 2000 as SVP of Group Operations
Previously worked at Carnival Cruise Lines for 12 years as VP of Hotel Operations where he was responsible for driving onboard revenue and overseeing Carnival’s in-house spa operations
Stephen Lazarus CFO & COO
Served as CFO and COO of Steiner Leisure since 2015
Served as CFO; EVP and SVP of Steiner Leisure from 2003 to 2014
Previously with Rayovac Corporation from 1998 to 2003 and Duracell from 1990 to 1998, serving in multiple finance and business roles
4
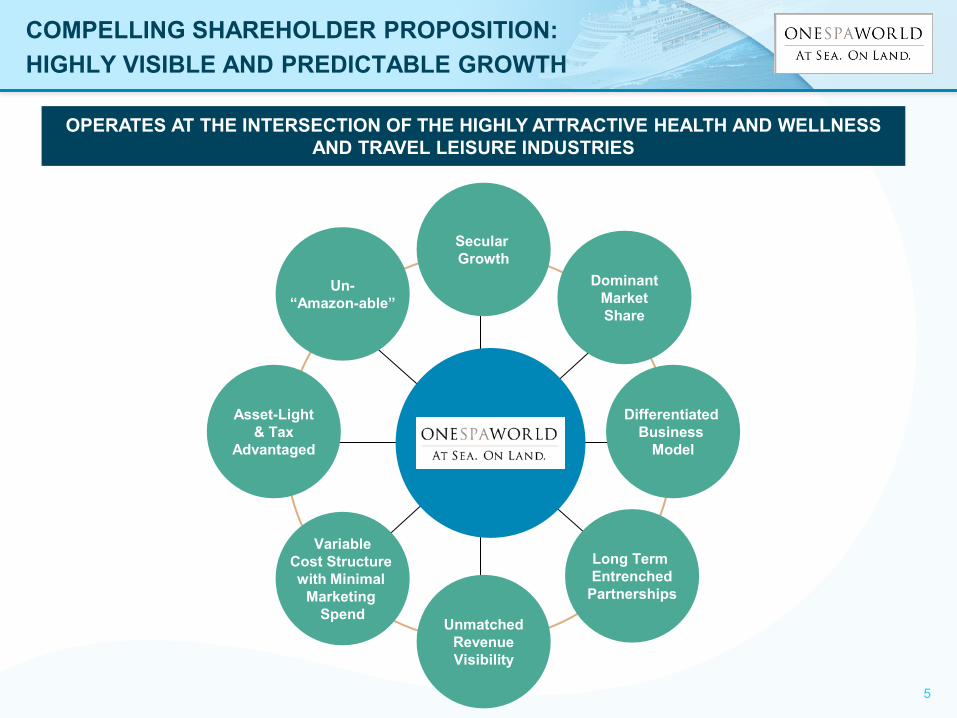
COMPELLING SHAREHOLDER PROPOSITION: HIGHLY VISIBLE AND PREDICTABLE GROWTH
Dominant Market Share
Long Term Entrenched
Partnerships
Secular Growth
Unmatched Revenue Visibility
Variable Cost Structure with Minimal
Marketing Spend
Un- “Amazon-able”
Differentiated Business
Model
Asset-Light
& Tax Advantaged
OPERATES AT THE INTERSECTION OF THE HIGHLY ATTRACTIVE HEALTH AND WELLNESS AND TRAVEL LEISURE INDUSTRIES
5
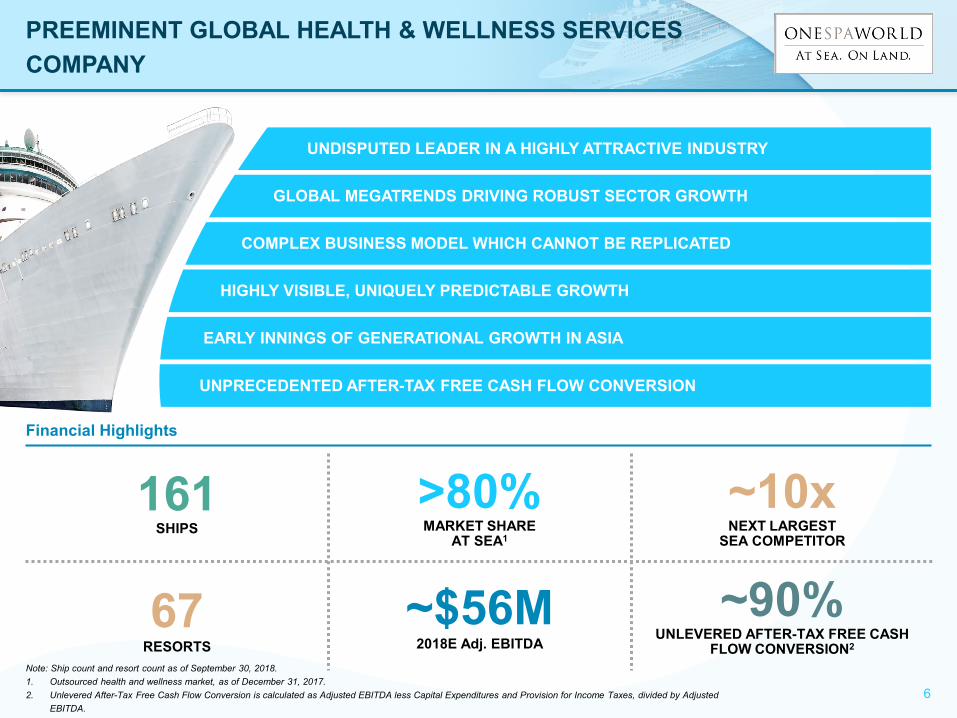
PREEMINENT GLOBAL HEALTH & WELLNESS SERVICES COMPANY
161 SHIPS
>80% MARKET SHARE
AT SEA1
~10x NEXT LARGEST
SEA COMPETITOR
67 RESORTS
~$56M 2018E Adj. EBITDA
~90% UNLEVERED AFTER-TAX FREE CASH
FLOW CONVERSION2
Financial Highlights
Note: Ship count and resort count as of September 30, 2018. 1. Outsourced health and wellness market, as of December 31, 2017. 2. Unlevered After-Tax Free Cash Flow Conversion is calculated as Adjusted EBITDA less Capital Expenditures and Provision for Income Taxes, divided by Adjusted
EBITDA.
COMPLEX BUSINESS MODEL WHICH CANNOT BE REPLICATED
HIGHLY VISIBLE, UNIQUELY PREDICTABLE GROWTH
UNPRECEDENTED AFTER-TAX FREE CASH FLOW CONVERSION
UNDISPUTED LEADER IN A HIGHLY ATTRACTIVE INDUSTRY
GLOBAL MEGATRENDS DRIVING ROBUST SECTOR GROWTH
EARLY INNINGS OF GENERATIONAL GROWTH IN ASIA
6
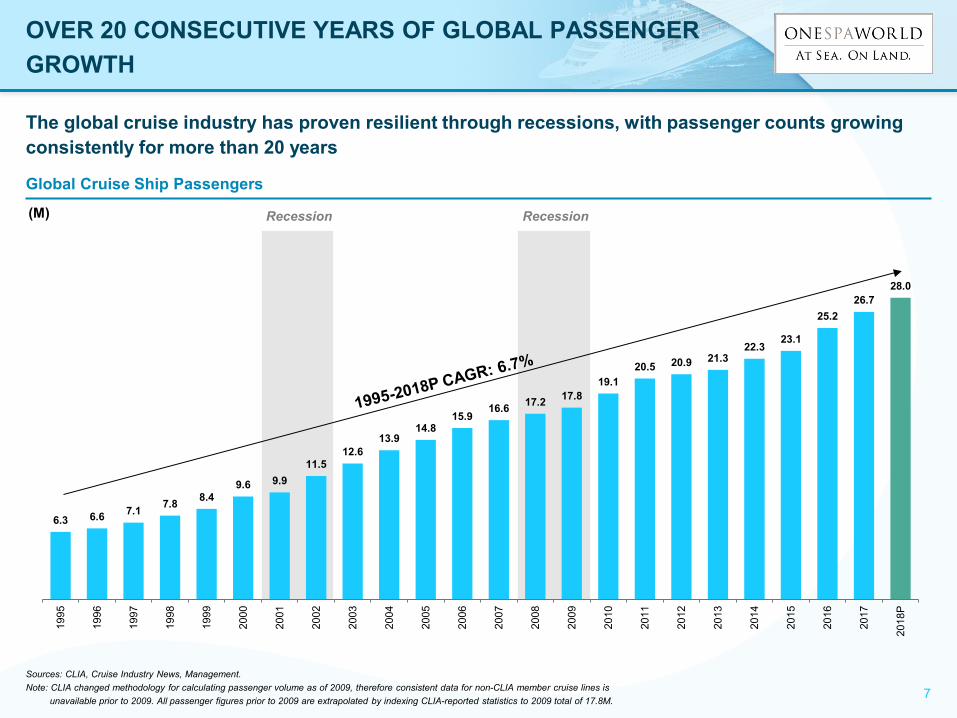
Global Cruise Ship Passengers
The global cruise industry has proven resilient through recessions, with passenger counts growing consistently for more than 20 years
Recession Recession
Sources: CLIA, Cruise Industry News, Management. Note: CLIA changed methodology for calculating passenger volume as of 2009, therefore consistent data for non-CLIA member cruise lines is
unavailable prior to 2009. All passenger figures prior to 2009 are extrapolated by indexing CLIA-reported statistics to 2009 total of 17.8M.
(M)
6.3 6.6 7.1 7.8 8.4 9.6 9.9
11.5 12.6
13.9 14.8
15.9 16.6 17.2 17.8
19.1 20.5 20.9 21.3
22.3 23.1
25.2 26.7
28.0
1995
1996
1997
1998
1999
2000
2001
2002
2003
2004
2005
2006
2007
2008
2009
2010
2011
2012
2013
2014
2015
2016
2017
2018
P
OVER 20 CONSECUTIVE YEARS OF GLOBAL PASSENGER GROWTH
7
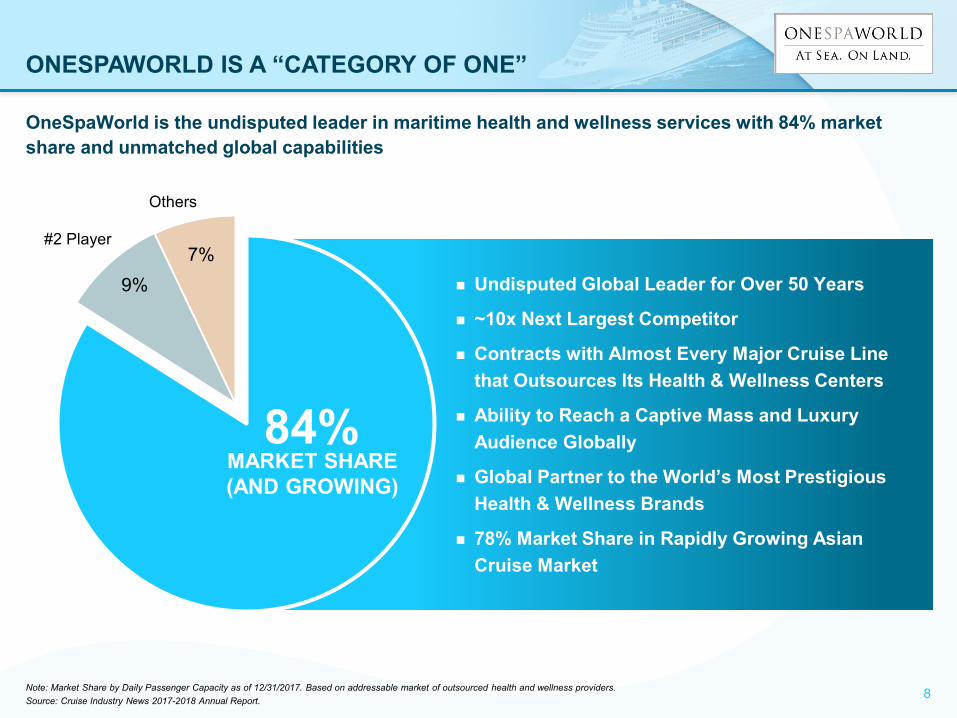
ONESPAWORLD IS A “CATEGORY OF ONE”
Undisputed Global Leader for Over 50 Years
~10x Next Largest Competitor
Contracts with Almost Every Major Cruise Line that Outsources Its Health & Wellness Centers
Ability to Reach a Captive Mass and Luxury Audience Globally
Global Partner to the World’s Most Prestigious Health & Wellness Brands
78% Market Share in Rapidly Growing Asian Cruise Market
OneSpaWorld is the undisputed leader in maritime health and wellness services with 84% market share and unmatched global capabilities
#2 Player
Others
84%
9% 7%
MARKET SHARE
(AND GROWING)
Note: Market Share by Daily Passenger Capacity as of 12/31/2017. Based on addressable market of outsourced health and wellness providers. Source: Cruise Industry News 2017-2018 Annual Report. 8
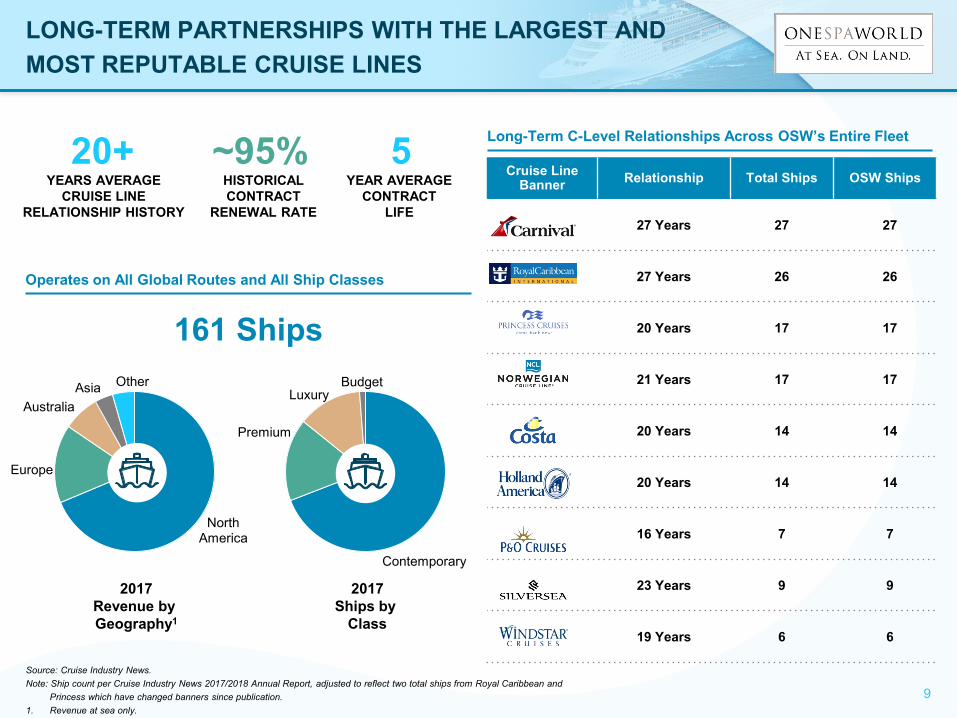
Operates on All Global Routes and All Ship Classes
161 Ships
5 YEAR AVERAGE
CONTRACT LIFE
~95% HISTORICAL CONTRACT
RENEWAL RATE
20+ YEARS AVERAGE
CRUISE LINE RELATIONSHIP HISTORY
2017 Revenue by Geography1
2017 Ships by
Class
Long-Term C-Level Relationships Across OSW’s Entire Fleet
Cruise Line Banner Relationship Total Ships OSW Ships
27 Years 27 27
27 Years 26 26
20 Years 17 17
21 Years 17 17
20 Years 14 14
20 Years 14 14
16 Years 7 7
23 Years 9 9
19 Years 6 6
Source: Cruise Industry News. Note: Ship count per Cruise Industry News 2017/2018 Annual Report, adjusted to reflect two total ships from Royal Caribbean and
Princess which have changed banners since publication. 1. Revenue at sea only.
North America
Europe
Australia Asia Other
Luxury Budget
Contemporary
Premium
LONG-TERM PARTNERSHIPS WITH THE LARGEST AND MOST REPUTABLE CRUISE LINES
9
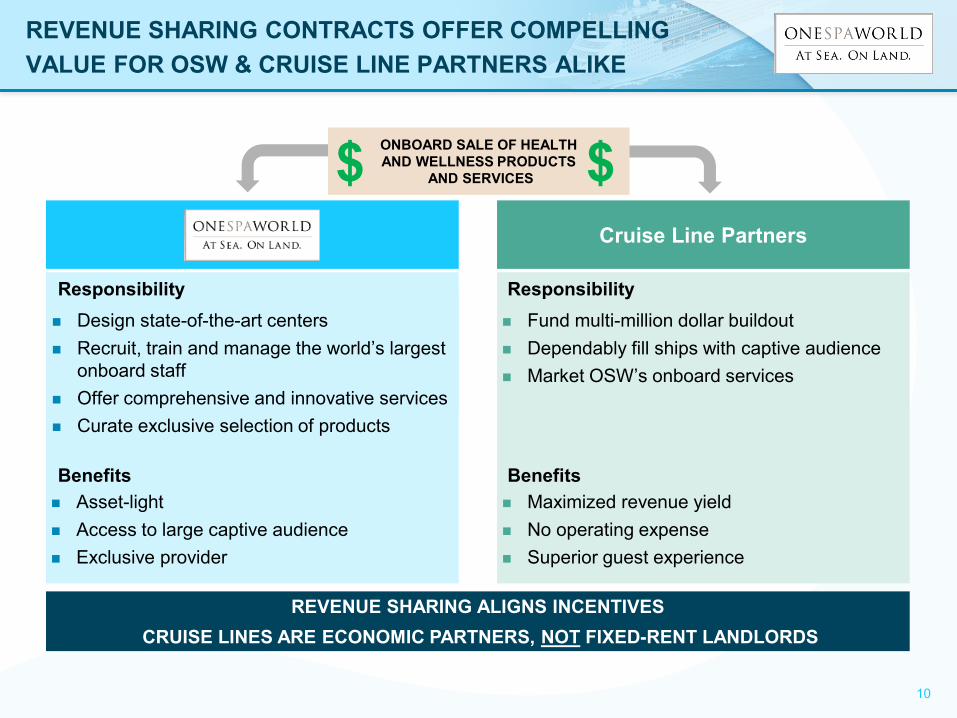
Cruise Line Partners
REVENUE SHARING ALIGNS INCENTIVES CRUISE LINES ARE ECONOMIC PARTNERS, NOT FIXED-RENT LANDLORDS
ONBOARD SALE OF HEALTH AND WELLNESS PRODUCTS
AND SERVICES $ $
Responsibility Responsibility
Benefits Benefits
Design state-of-the-art centers Recruit, train and manage the world’s largest
onboard staff Offer comprehensive and innovative services Curate exclusive selection of products
Asset-light Access to large captive audience Exclusive provider
Fund multi-million dollar buildout Dependably fill ships with captive audience Market OSW’s onboard services
Maximized revenue yield No operating expense Superior guest experience
REVENUE SHARING CONTRACTS OFFER COMPELLING VALUE FOR OSW & CRUISE LINE PARTNERS ALIKE
10
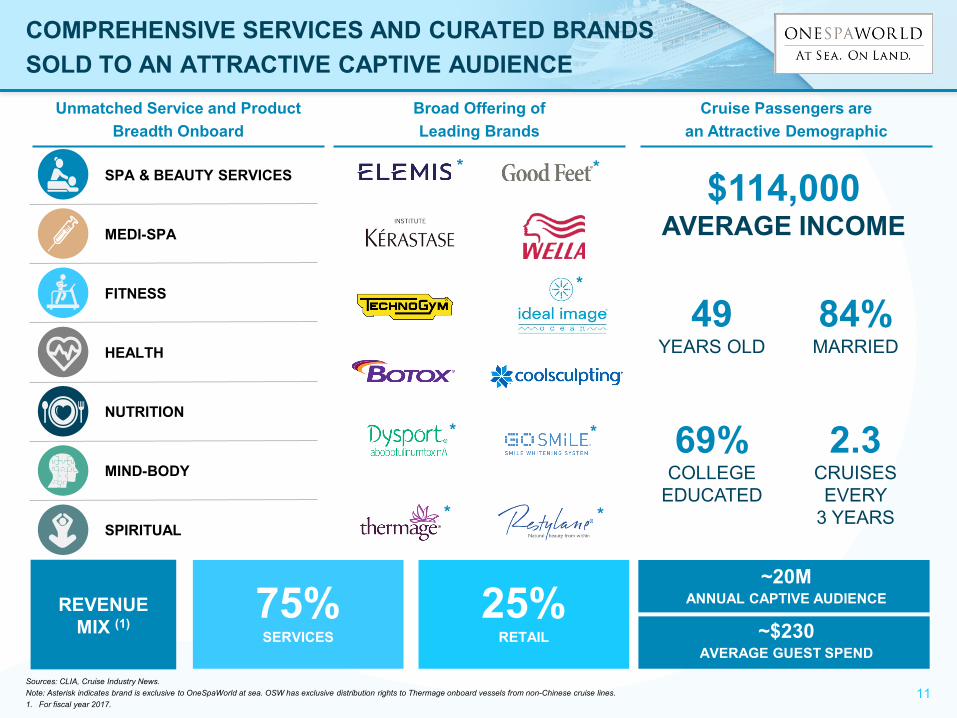
Broad Offering of Leading Brands
Unmatched Service and Product Breadth Onboard
Cruise Passengers are an Attractive Demographic
Sources: CLIA, Cruise Industry News. Note: Asterisk indicates brand is exclusive to OneSpaWorld at sea. OSW has exclusive distribution rights to Thermage onboard vessels from non-Chinese cruise lines. 1. For fiscal year 2017.
$114,000 AVERAGE INCOME
49 YEARS OLD
84% MARRIED
69% COLLEGE
EDUCATED
2.3 CRUISES EVERY
3 YEARS
~20M ANNUAL CAPTIVE AUDIENCE
*
* *
*
* *
75% SERVICES
SPA & BEAUTY SERVICES
MEDI-SPA
FITNESS
HEALTH
NUTRITION
MIND-BODY
SPIRITUAL
RETAIL 25%
*
COMPREHENSIVE SERVICES AND CURATED BRANDS SOLD TO AN ATTRACTIVE CAPTIVE AUDIENCE
~$230 AVERAGE GUEST SPEND
REVENUE MIX (1)
11

Global Passenger Cruise Routes
Source: MarineTraffic.com.
GLOBAL PORTS OF CALL
1,175 VISITED EMBARKED ON
7,875 VOYAGES
WELCOMED 20M PASSENGERS AT OVER
161 PORTS OF
EMBARKATION
MADE
MANAGEMENT VISITS TO SHIPS IN PORT
2,165 PLACED
16,408 PURCHASE ORDERS
TO VENDORS
SENT STAFF ON OVER
7,800 FLIGHTS
GLOBALLY
In 2017, OneSpaWorld:
GLOBAL CRUISE OPERATIONS ARE HIGHLY COMPLEX
12
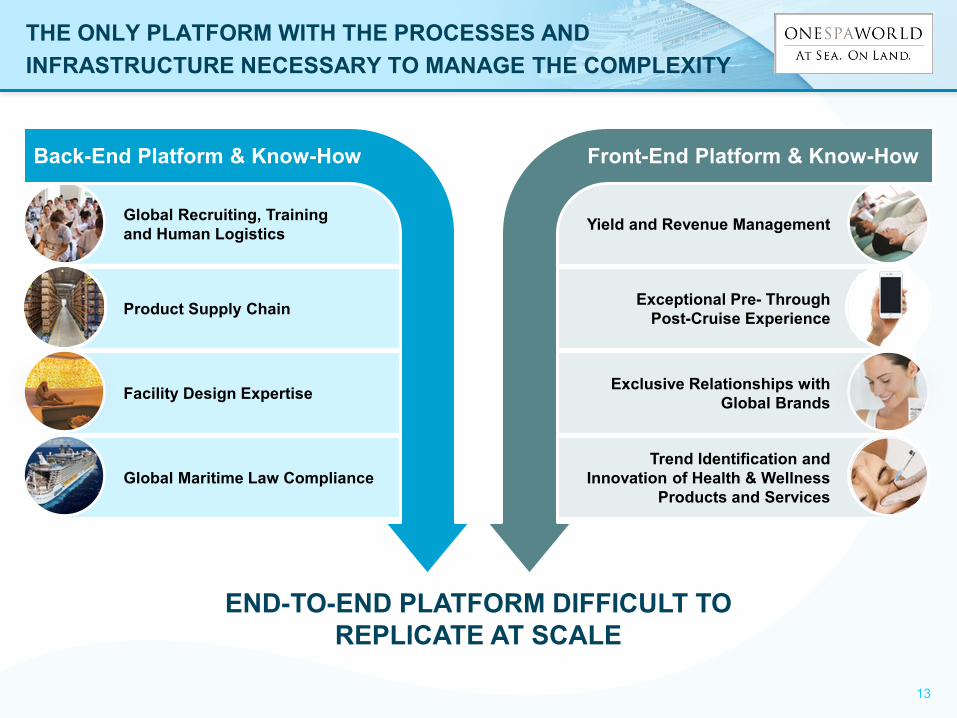
Global Recruiting, Training and Human Logistics
Exceptional Pre- Through Post-Cruise Experience
Yield and Revenue Management
Exclusive Relationships with Global Brands
Trend Identification and Innovation of Health & Wellness
Products and Services
Facility Design Expertise
Product Supply Chain
Global Maritime Law Compliance
THE ONLY PLATFORM WITH THE PROCESSES AND INFRASTRUCTURE NECESSARY TO MANAGE THE COMPLEXITY
Back-End Platform & Know-How Front-End Platform & Know-How
END-TO-END PLATFORM DIFFICULT TO REPLICATE AT SCALE
13
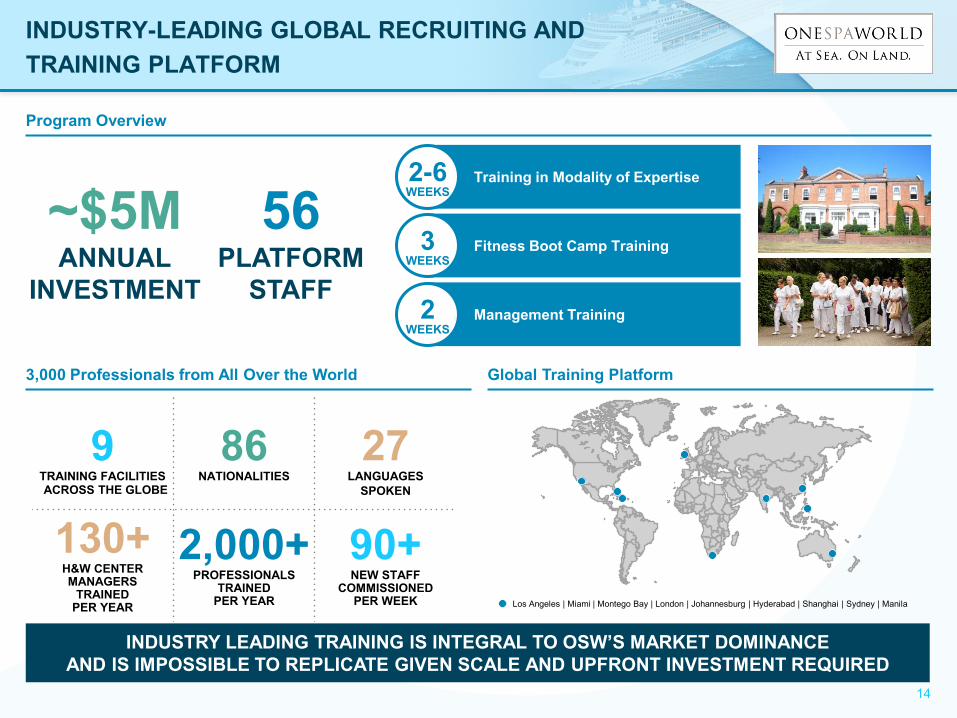
INDUSTRY-LEADING GLOBAL RECRUITING AND TRAINING PLATFORM
Program Overview
Training in Modality of Expertise 2-6 WEEKS
Fitness Boot Camp Training 3 WEEKS
Management Training 2 WEEKS
3,000 Professionals from All Over the World
INDUSTRY LEADING TRAINING IS INTEGRAL TO OSW’S MARKET DOMINANCE AND IS IMPOSSIBLE TO REPLICATE GIVEN SCALE AND UPFRONT INVESTMENT REQUIRED
~$5M ANNUAL
INVESTMENT
56 PLATFORM
STAFF
9 TRAINING FACILITIES
86 NATIONALITIES
27 LANGUAGES
130+ H&W CENTER MANAGERS
TRAINED PER YEAR
2,000+PROFESSIONALS
TRAINED PER YEAR
90+ NEW STAFF
COMMISSIONED PER WEEK
ACROSS THE GLOBE SPOKEN
Global Training Platform
Los Angeles | Miami | Montego Bay | London | Johannesburg | Hyderabad | Shanghai | Sydney | Manila
14
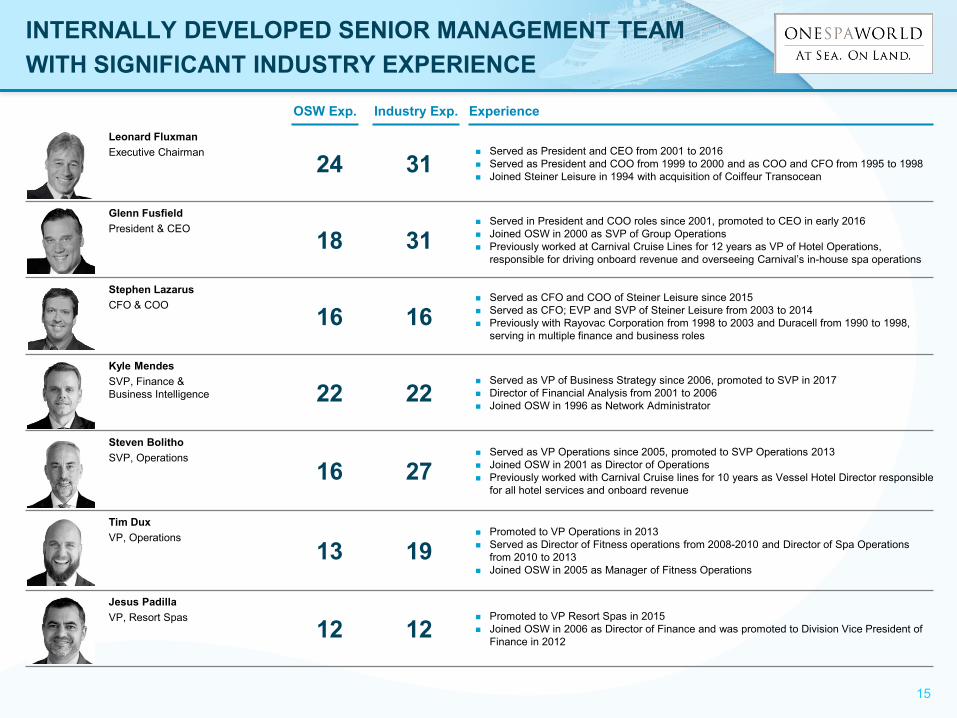
Leonard Fluxman Executive Chairman 24 31
Served as President and CEO from 2001 to 2016 Served as President and COO from 1999 to 2000 and as COO and CFO from 1995 to 1998 Joined Steiner Leisure in 1994 with acquisition of Coiffeur Transocean
Glenn Fusfield President & CEO 18 31
Served in President and COO roles since 2001, promoted to CEO in early 2016 Joined OSW in 2000 as SVP of Group Operations Previously worked at Carnival Cruise Lines for 12 years as VP of Hotel Operations,
responsible for driving onboard revenue and overseeing Carnival’s in-house spa operations
Stephen Lazarus CFO & COO 16 16
Served as CFO and COO of Steiner Leisure since 2015 Served as CFO; EVP and SVP of Steiner Leisure from 2003 to 2014 Previously with Rayovac Corporation from 1998 to 2003 and Duracell from 1990 to 1998,
serving in multiple finance and business roles
Kyle Mendes SVP, Finance & Business Intelligence 22 22
Served as VP of Business Strategy since 2006, promoted to SVP in 2017 Director of Financial Analysis from 2001 to 2006 Joined OSW in 1996 as Network Administrator
Steven Bolitho SVP, Operations
16 27 Served as VP Operations since 2005, promoted to SVP Operations 2013 Joined OSW in 2001 as Director of Operations Previously worked with Carnival Cruise lines for 10 years as Vessel Hotel Director responsible
for all hotel services and onboard revenue
Tim Dux VP, Operations
13 19 Promoted to VP Operations in 2013 Served as Director of Fitness operations from 2008-2010 and Director of Spa Operations
from 2010 to 2013 Joined OSW in 2005 as Manager of Fitness Operations
Jesus Padilla VP, Resort Spas 12 12
Promoted to VP Resort Spas in 2015 Joined OSW in 2006 as Director of Finance and was promoted to Division Vice President of
Finance in 2012
OSW Exp. Experience Industry Exp.
INTERNALLY DEVELOPED SENIOR MANAGEMENT TEAM WITH SIGNIFICANT INDUSTRY EXPERIENCE
15

INDUSTRY OVERVIEW
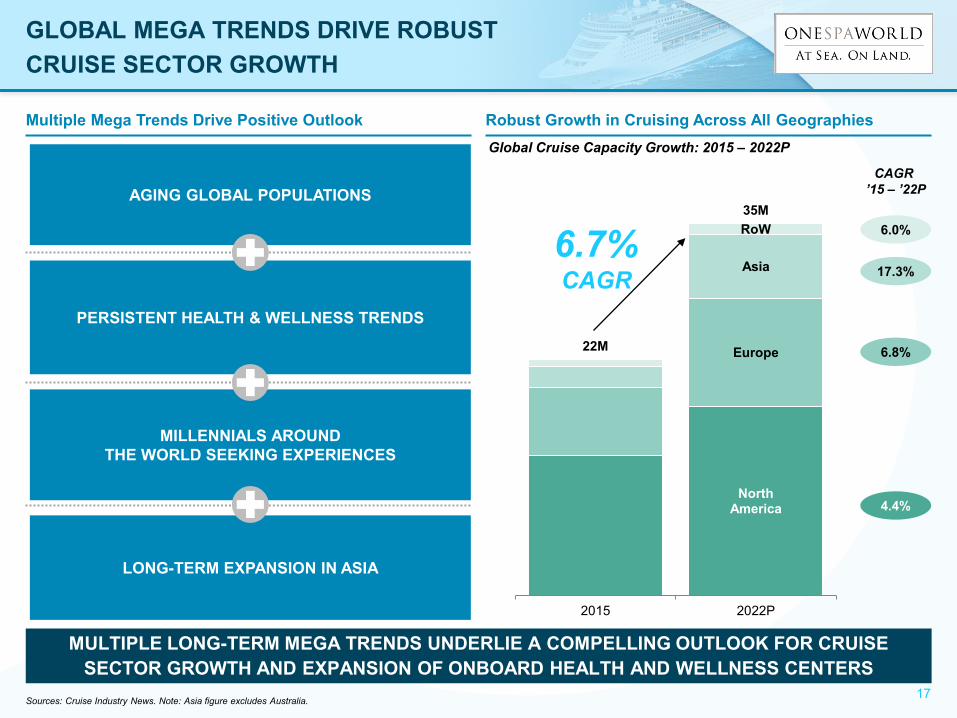
PERSISTENT HEALTH & WELLNESS TRENDS
North America
Europe
Asia
RoW
22M
35M
2015 2022P
Multiple Mega Trends Drive Positive Outlook Robust Growth in Cruising Across All Geographies
MULTIPLE LONG-TERM MEGA TRENDS UNDERLIE A COMPELLING OUTLOOK FOR CRUISE SECTOR GROWTH AND EXPANSION OF ONBOARD HEALTH AND WELLNESS CENTERS
Sources: Cruise Industry News. Note: Asia figure excludes Australia.
Global Cruise Capacity Growth: 2015 – 2022P
AGING GLOBAL POPULATIONS
MILLENNIALS AROUND THE WORLD SEEKING EXPERIENCES
LONG-TERM EXPANSION IN ASIA
9
9
9
6.0%
17.3%
6.8%
4.4%
CAGR ’15 – ’22P
6.7% CAGR
GLOBAL MEGA TRENDS DRIVE ROBUST CRUISE SECTOR GROWTH
17
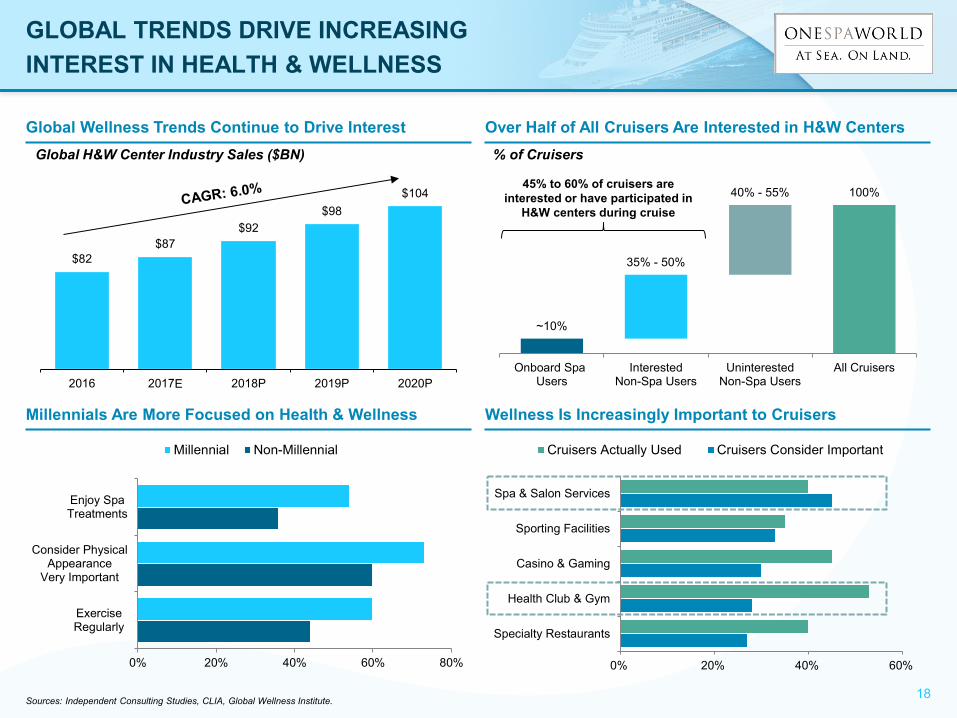
Global Wellness Trends Continue to Drive Interest Over Half of All Cruisers Are Interested in H&W Centers
Millennials Are More Focused on Health & Wellness Wellness Is Increasingly Important to Cruisers
GLOBAL TRENDS DRIVE INCREASING INTEREST IN HEALTH & WELLNESS
Sources: Independent Consulting Studies, CLIA, Global Wellness Institute.
$82 $87
$92 $98
$104
2016 2017P 2018P 2019P 2020P
Global H&W Center Industry Sales ($BN)
~10%
35% - 50%
40% - 55% 100%
Onboard Spa-Users
InterestedNon-Spa Users
UninterestedNon-Spa Users
All Cruisers
45% to 60% of cruisers are interested or have participated in
H&W centers during cruise
% of Cruisers
0% 20% 40% 60% 80%
ExerciseRegularly
Consider PhysicalAppearance
Very Important
Enjoy SpaTreatments
Millennial Non-Millennial
0% 20% 40% 60%
Specialty Restaurants
Health Club & Gym
Casino & Gaming
Sporting Facilities
Spa & Salon Services
Cruisers Actually Used Cruisers Consider Important
E
18

GROWTH PLAN
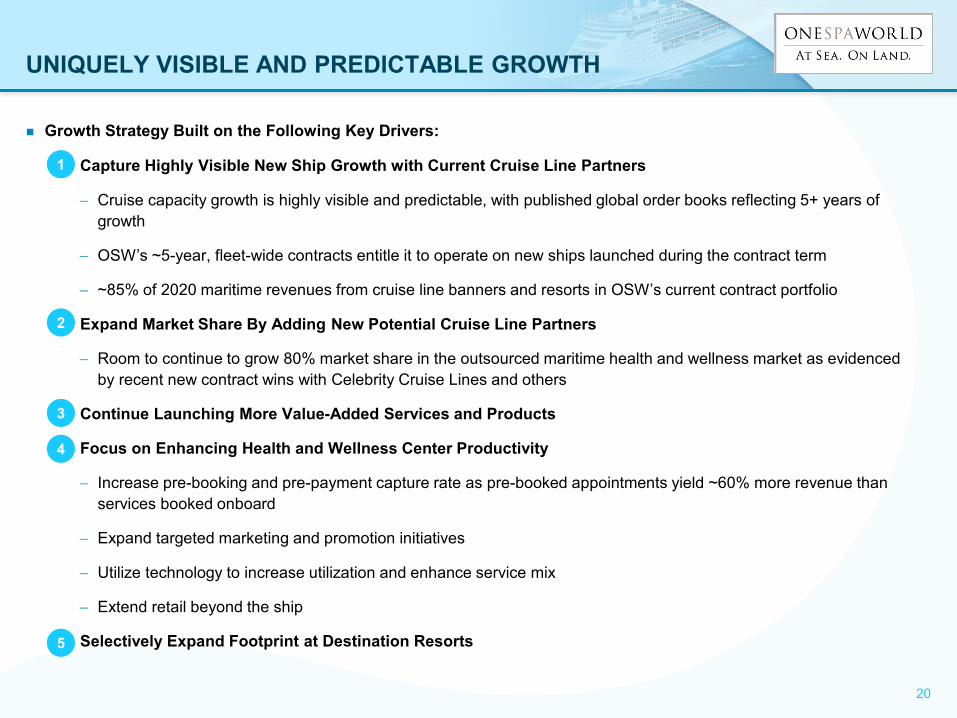
Growth Strategy Built on the Following Key Drivers:
1. Capture Highly Visible New Ship Growth with Current Cruise Line Partners
− Cruise capacity growth is highly visible and predictable, with published global order books reflecting 5+ years of growth
− OSW’s ~5-year, fleet-wide contracts entitle it to operate on new ships launched during the contract term
− ~85% of 2020 maritime revenues from cruise line banners and resorts in OSW’s current contract portfolio
2. Expand Market Share By Adding New Potential Cruise Line Partners
− Room to continue to grow 80% market share in the outsourced maritime health and wellness market as evidenced by recent new contract wins with Celebrity Cruise Lines and others
3. Continue Launching More Value-Added Services and Products
4. Focus on Enhancing Health and Wellness Center Productivity
− Increase pre-booking and pre-payment capture rate as pre-booked appointments yield ~60% more revenue than services booked onboard
− Expand targeted marketing and promotion initiatives
− Utilize technology to increase utilization and enhance service mix
− Extend retail beyond the ship
5. Selectively Expand Footprint at Destination Resorts
UNIQUELY VISIBLE AND PREDICTABLE GROWTH
1
2
5
3
4
20
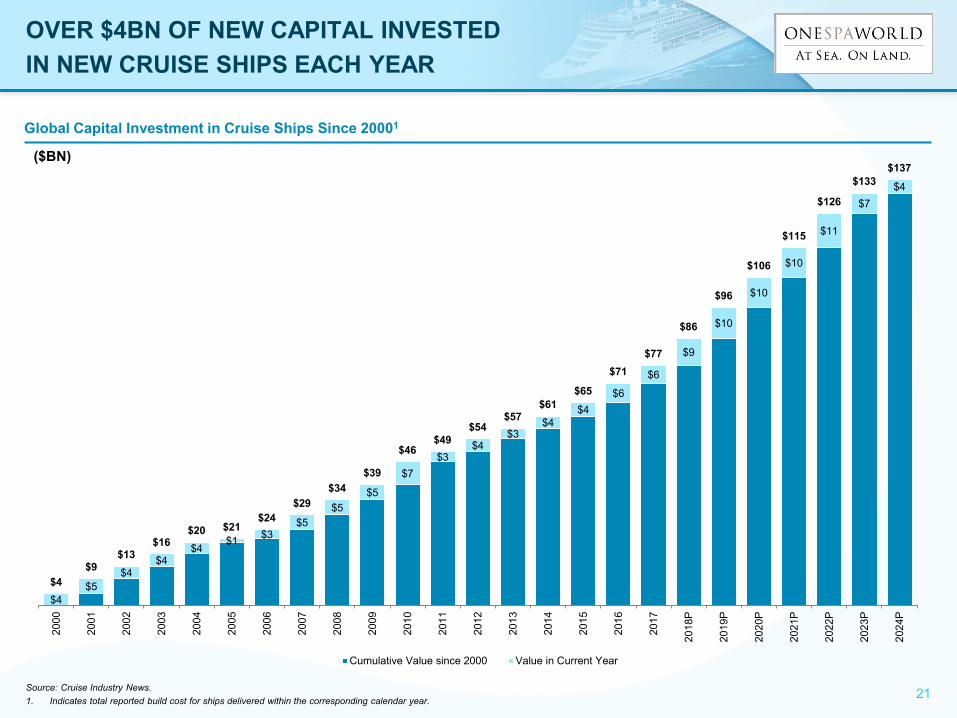
Global Capital Investment in Cruise Ships Since 20001
OVER $4BN OF NEW CAPITAL INVESTED IN NEW CRUISE SHIPS EACH YEAR
Source: Cruise Industry News. 1. Indicates total reported build cost for ships delivered within the corresponding calendar year.
($BN)
$4 $5
$4 $4
$4 $1 $3
$5 $5
$5
$7 $3
$4 $3
$4 $4
$6
$6
$9
$10
$10
$10
$11
$7 $4
$4 $9
$13 $16
$20 $21 $24
$29 $34
$39
$46 $49
$54 $57
$61 $65
$71 $77
$86
$96
$106
$115
$126
$133 $137
2000
2001
2002
2003
2004
2005
2006
2007
2008
2009
2010
2011
2012
2013
2014
2015
2016
2017
2018
P
2019
P
2020
P
2021
P
2022
P
2023
P
2024
P
Cumulative Value since 2000 Value in Current Year
21
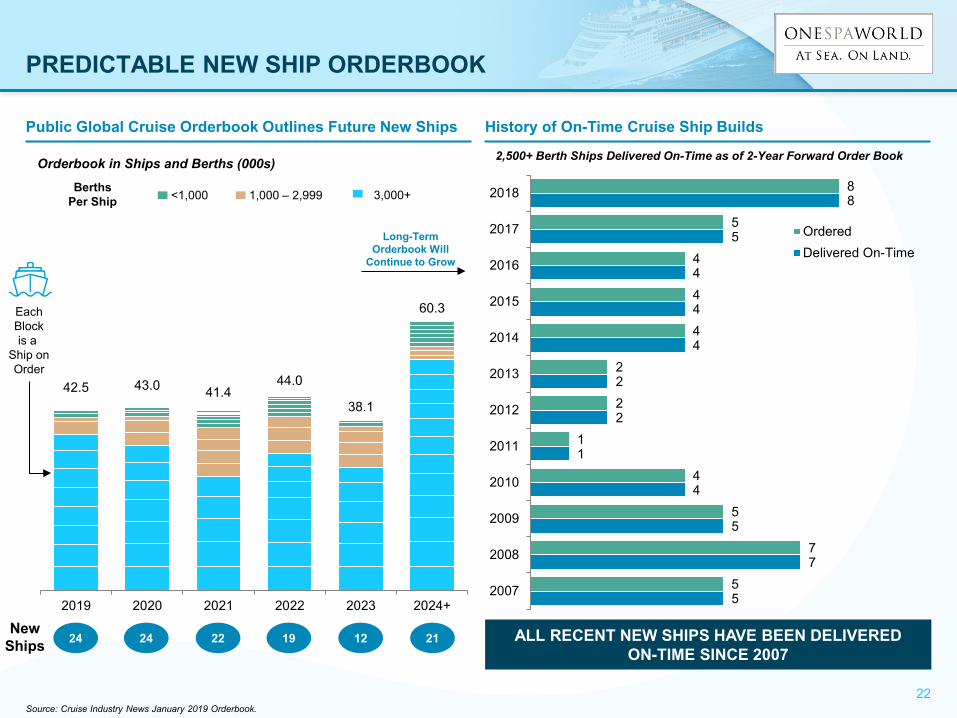
Long-Term Orderbook Will
Continue to Grow
Public Global Cruise Orderbook Outlines Future New Ships History of On-Time Cruise Ship Builds
PREDICTABLE NEW SHIP ORDERBOOK
Source: Cruise Industry News January 2019 Orderbook.
Each Block is a
Ship on Order
New Ships
5
7
5
4
1
2
2
4
4
4
5
8
5
7
5
4
1
2
2
4
4
4
5
8
2007
2008
2009
2010
2011
2012
2013
2014
2015
2016
2017
2018
OrderedDelivered On-Time
3,000+ 1,000 – 2,999 <1,000 Berths Per Ship
Orderbook in Ships and Berths (000s)
ALL RECENT NEW SHIPS HAVE BEEN DELIVERED ON-TIME SINCE 2007
2,500+ Berth Ships Delivered On-Time as of 2-Year Forward Order Book
24 24 22 19 12 21
42.5 43.0 41.4 44.0
38.1
60.3
2019 2020 2021 2022 2023 2024+
22
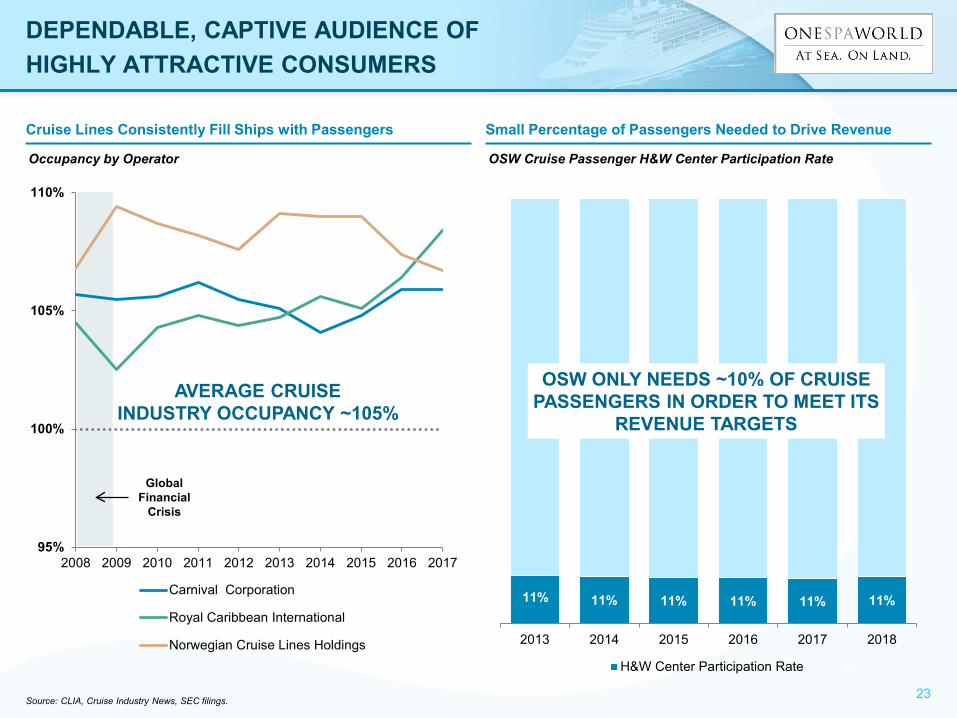
95%
100%
105%
110%
2008 2009 2010 2011 2012 2013 2014 2015 2016 2017
Carnival Corporation
Royal Caribbean International
Norwegian Cruise Lines Holdings
11% 11% 11% 11% 11% 11%
2013 2014 2015 2016 2017 2018
H&W Center Participation Rate
Cruise Lines Consistently Fill Ships with Passengers Small Percentage of Passengers Needed to Drive Revenue
DEPENDABLE, CAPTIVE AUDIENCE OF HIGHLY ATTRACTIVE CONSUMERS
Source: CLIA, Cruise Industry News, SEC filings.
Global Financial
Crisis
Occupancy by Operator
AVERAGE CRUISE INDUSTRY OCCUPANCY ~105%
OSW Cruise Passenger H&W Center Participation Rate
OSW ONLY NEEDS ~10% OF CRUISE PASSENGERS IN ORDER TO MEET ITS
REVENUE TARGETS
23
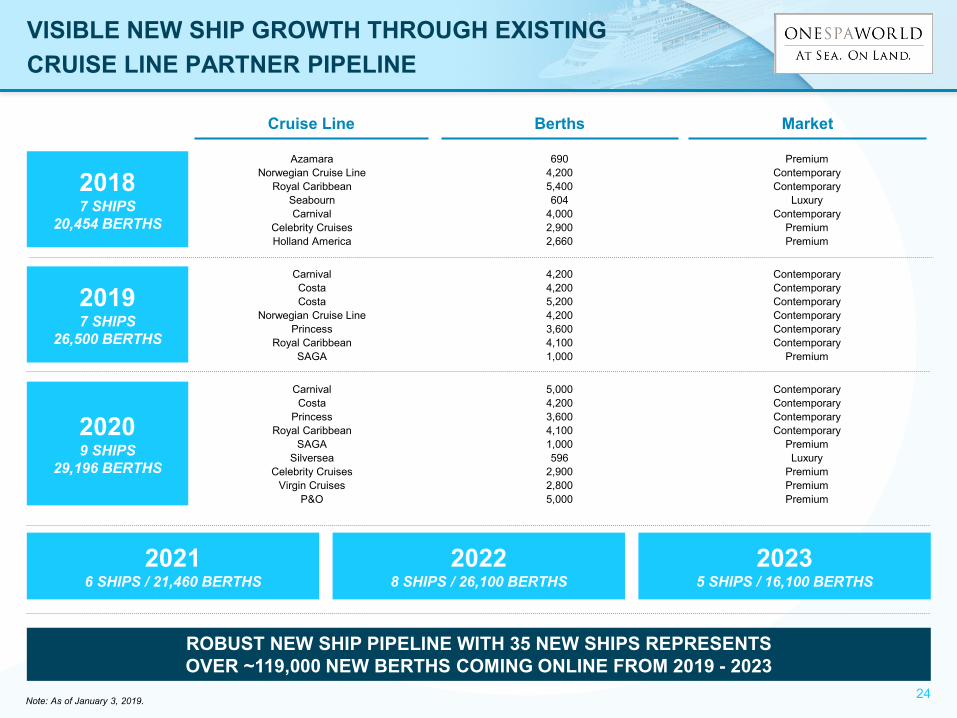
2018 7 SHIPS
20,454 BERTHS
Azamara 690 Premium Norwegian Cruise Line 4,200 Contemporary
Royal Caribbean 5,400 Contemporary Seabourn 604 Luxury Carnival 4,000 Contemporary
Celebrity Cruises 2,900 Premium Holland America 2,660 Premium
2019 7 SHIPS
26,500 BERTHS
Carnival 4,200 Contemporary Costa 4,200 Contemporary Costa 5,200 Contemporary
Norwegian Cruise Line 4,200 Contemporary Princess 3,600 Contemporary
Royal Caribbean 4,100 Contemporary SAGA 1,000 Premium
2020 9 SHIPS
29,196 BERTHS
Carnival 5,000 Contemporary Costa 4,200 Contemporary
Princess 3,600 Contemporary Royal Caribbean 4,100 Contemporary
SAGA 1,000 Premium Silversea 596 Luxury
Celebrity Cruises 2,900 Premium Virgin Cruises 2,800 Premium
P&O 5,000 Premium
Cruise Line Berths Market
VISIBLE NEW SHIP GROWTH THROUGH EXISTING CRUISE LINE PARTNER PIPELINE
Note: As of January 3, 2019.
ROBUST NEW SHIP PIPELINE WITH 35 NEW SHIPS REPRESENTS OVER ~119,000 NEW BERTHS COMING ONLINE FROM 2019 - 2023
2021 6 SHIPS / 21,460 BERTHS
2022 8 SHIPS / 26,100 BERTHS
2023 5 SHIPS / 16,100 BERTHS
24
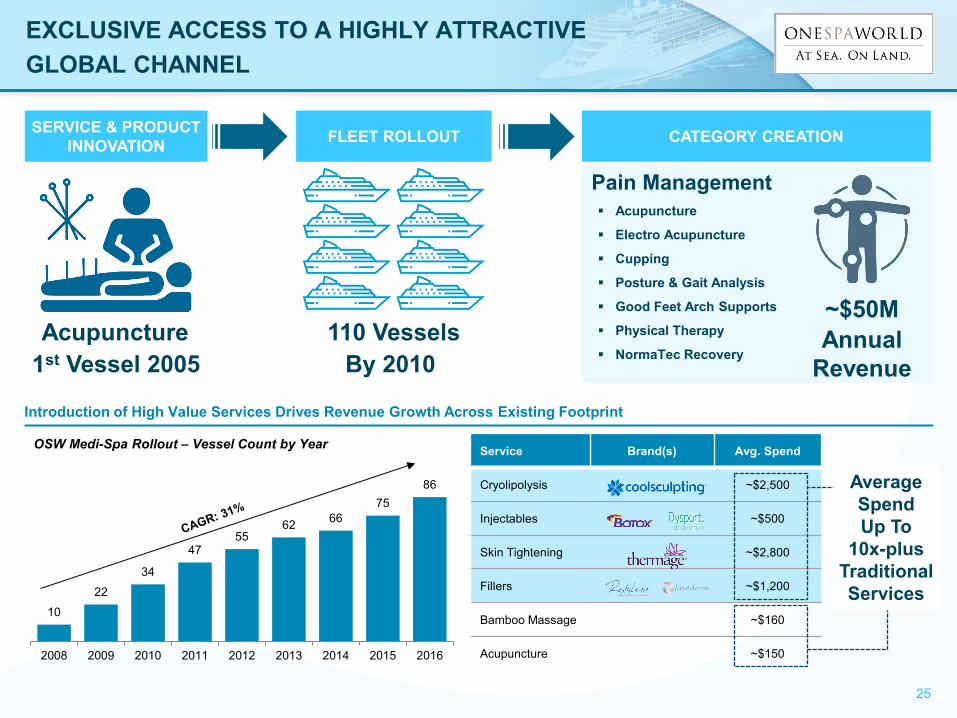
Pain Management Acupuncture
Electro Acupuncture
Cupping
Posture & Gait Analysis
Good Feet Arch Supports
Physical Therapy
NormaTec Recovery
EXCLUSIVE ACCESS TO A HIGHLY ATTRACTIVE GLOBAL CHANNEL
Acupuncture
SERVICE & PRODUCT INNOVATION FLEET ROLLOUT CATEGORY CREATION
1st Vessel 2005 By 2010 110 Vessels
~$50M Annual
Revenue
Service Brand(s) Avg. Spend
Cryolipolysis ~$2,500
Injectables ~$500
Skin Tightening ~$2,800
Fillers ~$1,200
Bamboo Massage ~$160
Acupuncture ~$150
Introduction of High Value Services Drives Revenue Growth Across Existing Footprint
10
22
34
47 55
62 66 75
86
2008 2009 2010 2011 2012 2013 2014 2015 2016
OSW Medi-Spa Rollout – Vessel Count by Year
Average Spend Up To
10x-plus Traditional Services
25
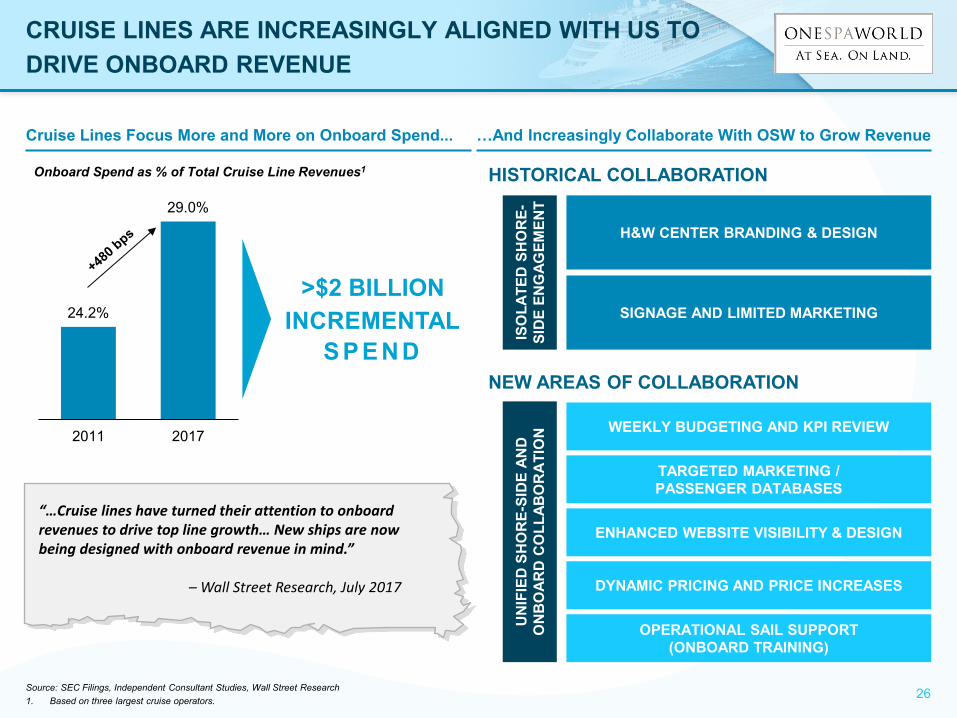
Cruise Lines Focus More and More on Onboard Spend... …And Increasingly Collaborate With OSW to Grow Revenue
CRUISE LINES ARE INCREASINGLY ALIGNED WITH US TO DRIVE ONBOARD REVENUE
Source: SEC Filings, Independent Consultant Studies, Wall Street Research 1. Based on three largest cruise operators.
24.2%
29.0%
2011 2017
Onboard Spend as % of Total Cruise Line Revenues1
“…Cruise lines have turned their attention to onboard revenues to drive top line growth… New ships are now being designed with onboard revenue in mind.” – Wall Street Research, July 2017
>$2 BILLION INCREMENTAL
S P E ND
H&W CENTER BRANDING & DESIGN
WEEKLY BUDGETING AND KPI REVIEW
NEW AREAS OF COLLABORATION
SIGNAGE AND LIMITED MARKETING
TARGETED MARKETING / PASSENGER DATABASES
ENHANCED WEBSITE VISIBILITY & DESIGN
DYNAMIC PRICING AND PRICE INCREASES
OPERATIONAL SAIL SUPPORT (ONBOARD TRAINING)
ISO
LATE
D S
HO
RE-
SID
E EN
GAG
EMEN
T
HISTORICAL COLLABORATION
UN
IFIE
D S
HO
RE-
SID
E AN
D
ON
BO
ARD
CO
LLAB
OR
ATI
ON
26

Relationships to Leverage
Global Training Platform Can Fuel Significant Growth
Resort Partner # of OSW H&W
Destination Resorts*
Total Resorts in Portfolio (1)
5 646 (2)
3 716 (3)
3 214
3 62
2 47
2 16
1 38
1 351
1 5
1 115
1 16
TOTAL OSW PARTNER H&W DESTINATION RESORTS 23 2,226
H&W DESTINATION RESORTS GLOBALLY 33,000+
SIGNIFICANT GLOBAL WHITESPACE EXISTS WITH OSW’S CURRENT RESORT PARTNER BRANDS
* Denotes sort order. OSW resort count as of 11/01/2018. 1. Includes resorts / hotels with H&W centers. As of 12/31/2017.
2. Excludes Starwood Hotels. 3. Excludes Sheraton banner.
1,310
UK
120
China
483
South Africa
82
Jamaica
India
172
16
Australia
MARITIME
73
Indonesia
45
Malaysia
RESORTS
# Staff Trained at Facility in
2017
+3,000 H&W CENTER PROFESSIONALS RECRUITED, TRAINED, AND MANAGED ANNUALLY
Attractive New Unit Economics
Revenue ~$2 million
4-Wall Margin ~25%
4-Wall EBITDA ~$500K
Net Investment ~$2 million
Traditional Investment Model
Target Cash-on-Cash Return (Year 3): 25%+
UNDER-EXPLOITED H&W DESTINATION RESORT PLATFORM SUPPORTS SIGNIFICANT GLOBAL GROWTH
27

FINANCIAL OVERVIEW
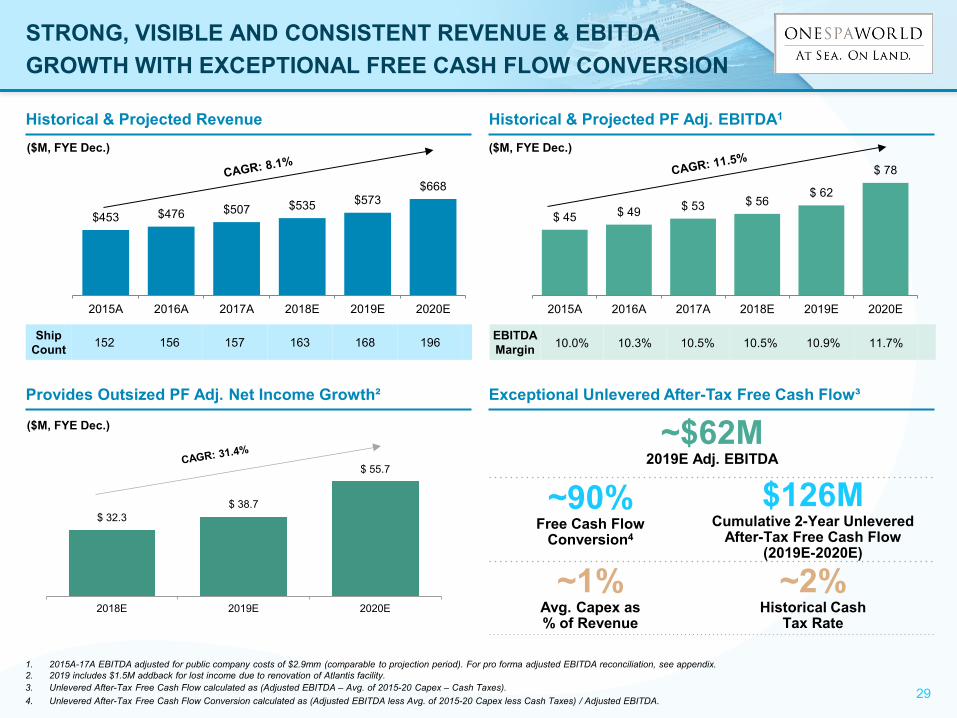
$ 45 $ 49 $ 53 $ 56 $ 62
$ 78
2015A 2016A 2017A 2018E 2019E 2020E
$453 $476 $507 $535 $573 $668
2015A 2016A 2017A 2018E 2019E 2020E
Historical & Projected Revenue Historical & Projected PF Adj. EBITDA1
Ship Count 152 156 157 163 168 196
($M, FYE Dec.)
EBITDA Margin 10.0% 10.3% 10.5% 10.5% 10.9% 11.7%
($M, FYE Dec.)
1. 2015A-17A EBITDA adjusted for public company costs of $2.9mm (comparable to projection period). For pro forma adjusted EBITDA reconciliation, see appendix. 2. 2019 includes $1.5M addback for lost income due to renovation of Atlantis facility. 3. Unlevered After-Tax Free Cash Flow calculated as (Adjusted EBITDA – Avg. of 2015-20 Capex – Cash Taxes). 4. Unlevered After-Tax Free Cash Flow Conversion calculated as (Adjusted EBITDA less Avg. of 2015-20 Capex less Cash Taxes) / Adjusted EBITDA.
Provides Outsized PF Adj. Net Income Growth² Exceptional Unlevered After-Tax Free Cash Flow³
($M, FYE Dec.) ~$62M 2019E Adj. EBITDA
~90% Free Cash Flow
Conversion4
$126M Cumulative 2-Year Unlevered
After-Tax Free Cash Flow (2019E-2020E)
~1% Avg. Capex as % of Revenue
~2% Historical Cash
Tax Rate
STRONG, VISIBLE AND CONSISTENT REVENUE & EBITDA GROWTH WITH EXCEPTIONAL FREE CASH FLOW CONVERSION
29
$ 32.3 $ 38.7
$ 55.7
2018E 2019E 2020E
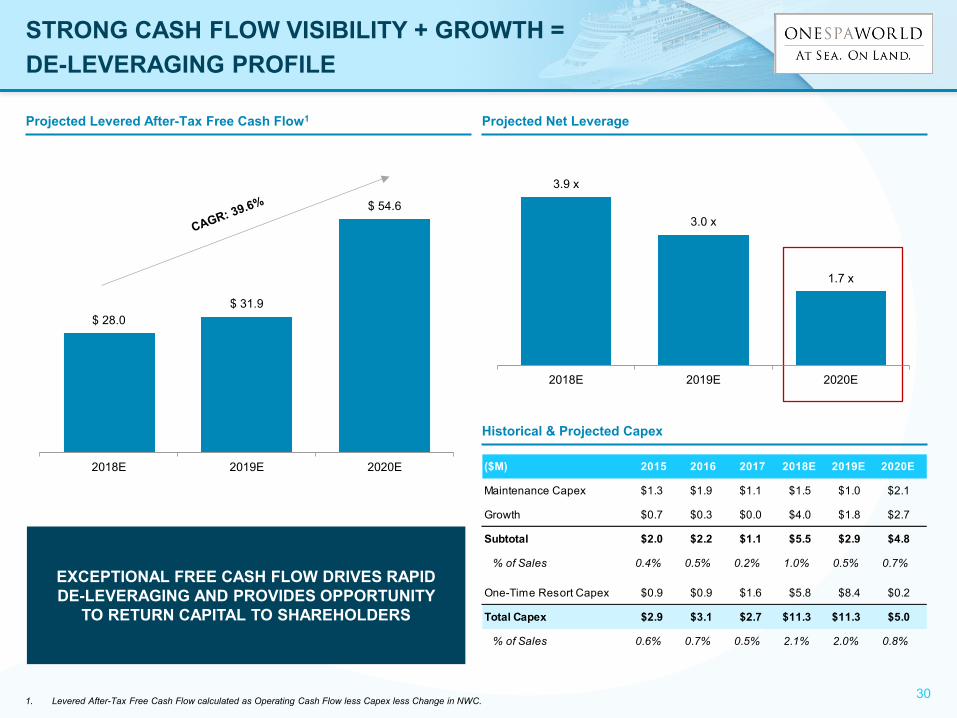
Projected Levered After-Tax Free Cash Flow1 Projected Net Leverage
Historical & Projected Capex
1. Levered After-Tax Free Cash Flow calculated as Operating Cash Flow less Capex less Change in NWC.
EXCEPTIONAL FREE CASH FLOW DRIVES RAPID DE-LEVERAGING AND PROVIDES OPPORTUNITY
TO RETURN CAPITAL TO SHAREHOLDERS
($M) 2015 2016 2017 2018E 2019E 2020E
Maintenance Capex $1.3 $1.9 $1.1 $1.5 $1.0 $2.1
Growth $0.7 $0.3 $0.0 $4.0 $1.8 $2.7
Subtotal $2.0 $2.2 $1.1 $5.5 $2.9 $4.8
% of Sales 0.4% 0.5% 0.2% 1.0% 0.5% 0.7%
One-Time Resort Capex $0.9 $0.9 $1.6 $5.8 $8.4 $0.2
Total Capex $2.9 $3.1 $2.7 $11.3 $11.3 $5.0
% of Sales 0.6% 0.7% 0.5% 2.1% 2.0% 0.8%
STRONG CASH FLOW VISIBILITY + GROWTH = DE-LEVERAGING PROFILE
3.9 x
3.0 x
1.7 x
2018E 2019E 2020E
30
$ 28.0 $ 31.9
$ 54.6
2018E 2019E 2020E
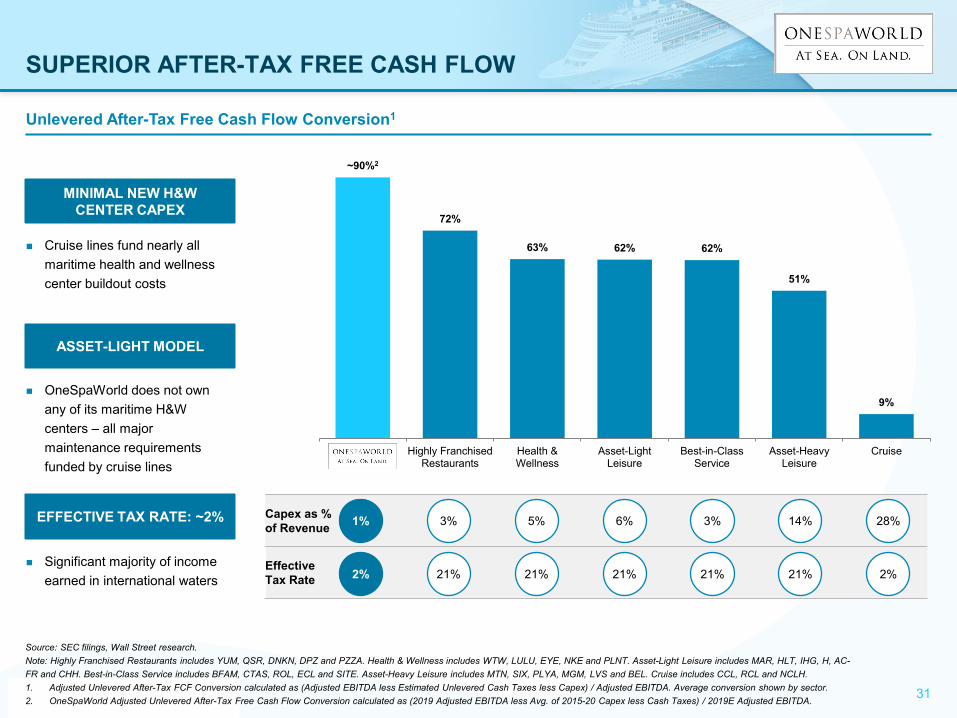
~90%2
72%
63% 62% 62%
51%
9%
OSW Highly FranchisedRestaurants
Health &Wellness
Asset-LightLeisure
Best-in-ClassService
Asset-HeavyLeisure
Cruise
Unlevered After-Tax Free Cash Flow Conversion1
SUPERIOR AFTER-TAX FREE CASH FLOW
Capex as % of Revenue
Effective Tax Rate
1%
2%
5%
21%
3%
21%
6%
21%
3%
21%
14%
21%
28%
2%
Source: SEC filings, Wall Street research. Note: Highly Franchised Restaurants includes YUM, QSR, DNKN, DPZ and PZZA. Health & Wellness includes WTW, LULU, EYE, NKE and PLNT. Asset-Light Leisure includes MAR, HLT, IHG, H, AC-FR and CHH. Best-in-Class Service includes BFAM, CTAS, ROL, ECL and SITE. Asset-Heavy Leisure includes MTN, SIX, PLYA, MGM, LVS and BEL. Cruise includes CCL, RCL and NCLH. 1. Adjusted Unlevered After-Tax FCF Conversion calculated as (Adjusted EBITDA less Estimated Unlevered Cash Taxes less Capex) / Adjusted EBITDA. Average conversion shown by sector. 2. OneSpaWorld Adjusted Unlevered After-Tax Free Cash Flow Conversion calculated as (2019 Adjusted EBITDA less Avg. of 2015-20 Capex less Cash Taxes) / 2019E Adjusted EBITDA.
OneSpaWorld does not own any of its maritime H&W centers – all major maintenance requirements funded by cruise lines
ASSET-LIGHT MODEL
MINIMAL NEW H&W CENTER CAPEX
Cruise lines fund nearly all maritime health and wellness center buildout costs
EFFECTIVE TAX RATE: ~2%
Significant majority of income earned in international waters
31
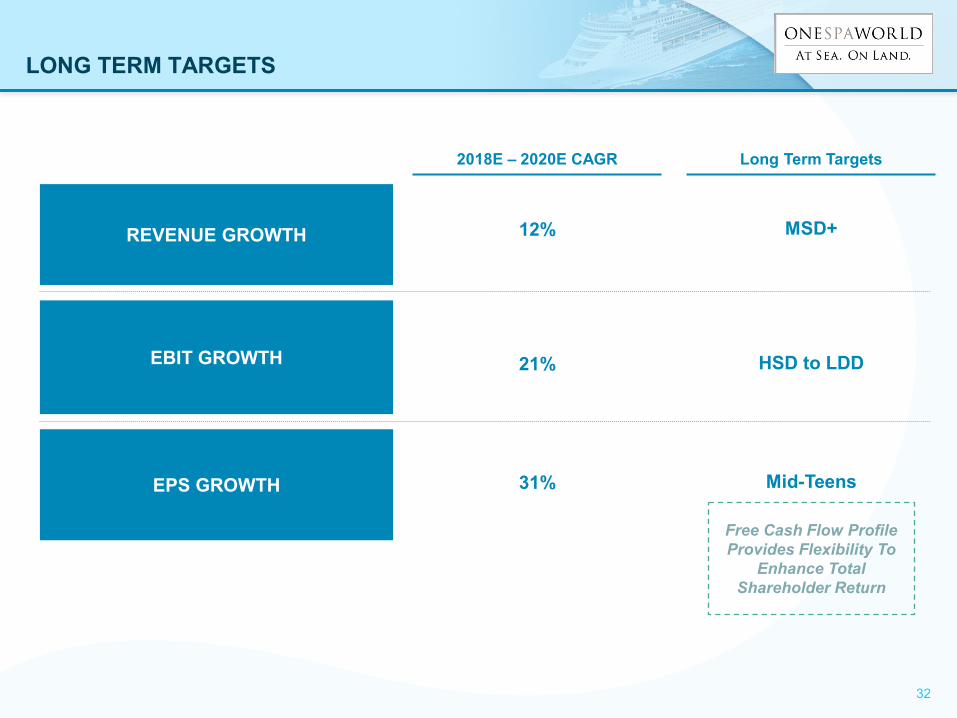
LONG TERM TARGETS
EBIT GROWTH
REVENUE GROWTH
EPS GROWTH
2018E – 2020E CAGR Long Term Targets
12%
21%
31%
MSD+
HSD to LDD
Mid-Teens
Free Cash Flow Profile Provides Flexibility To
Enhance Total Shareholder Return
32

TRANSACTION DETAILS
TRANSACTION OVERVIEW
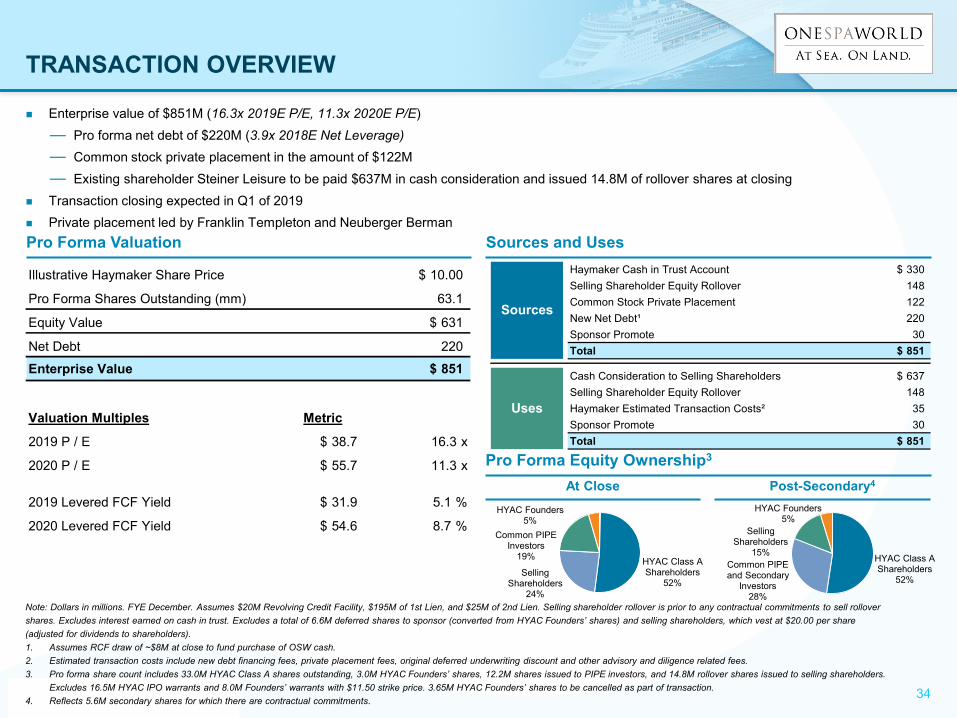
Note: Dollars in millions. FYE December. Assumes $20M Revolving Credit Facility, $195M of 1st Lien, and $25M of 2nd Lien. Selling shareholder rollover is prior to any contractual commitments to sell rollover shares. Excludes interest earned on cash in trust. Excludes a total of 6.6M deferred shares to sponsor (converted from HYAC Founders’ shares) and selling shareholders, which vest at $20.00 per share (adjusted for dividends to shareholders). 1. Assumes RCF draw of ~$8M at close to fund purchase of OSW cash. 2. Estimated transaction costs include new debt financing fees, private placement fees, original deferred underwriting discount and other advisory and diligence related fees. 3. Pro forma share count includes 33.0M HYAC Class A shares outstanding, 3.0M HYAC Founders’ shares, 12.2M shares issued to PIPE investors, and 14.8M rollover shares issued to selling shareholders.
Excludes 16.5M HYAC IPO warrants and 8.0M Founders’ warrants with $11.50 strike price. 3.65M HYAC Founders’ shares to be cancelled as part of transaction. 4. Reflects 5.6M secondary shares for which there are contractual commitments.
Pro Forma Valuation Sources and Uses
Enterprise value of $851M (16.3x 2019E P/E, 11.3x 2020E P/E) — Pro forma net debt of $220M (3.9x 2018E Net Leverage) — Common stock private placement in the amount of $122M — Existing shareholder Steiner Leisure to be paid $637M in cash consideration and issued 14.8M of rollover shares at closing
Transaction closing expected in Q1 of 2019 Private placement led by Franklin Templeton and Neuberger Berman
Pro Forma Equity Ownership3
Haymaker Cash in Trust Account $ 330Selling Shareholder Equity Rollover 148Common Stock Private Placement 122New Net Debt¹ 220Sponsor Promote 30Total $ 851
Cash Consideration to Selling Shareholders $ 637Selling Shareholder Equity Rollover 148Haymaker Estimated Transaction Costs² 35Sponsor Promote 30Total $ 851
Sources
Uses
34
At Close Post-Secondary4
HYAC Class A Shareholders
52%
Selling Shareholders
15%Common PIPE and Secondary
Investors28%
HYAC Founders5%
Illustrative Haymaker Share Price $ 10.00
Pro Forma Shares Outstanding (mm) 63.1
Equity Value $ 631
Net Debt 220
Enterprise Value $ 851
Valuation Multiples Metric
2019 P / E $ 38.7 16.3 x
2020 P / E $ 55.7 11.3 x
2019 Levered FCF Yield $ 31.9 5.1 %
2020 Levered FCF Yield $ 54.6 8.7 %
HYAC Class A Shareholders
52%Selling
Shareholders24%
Common PIPE Investors
19%
HYAC Founders5%
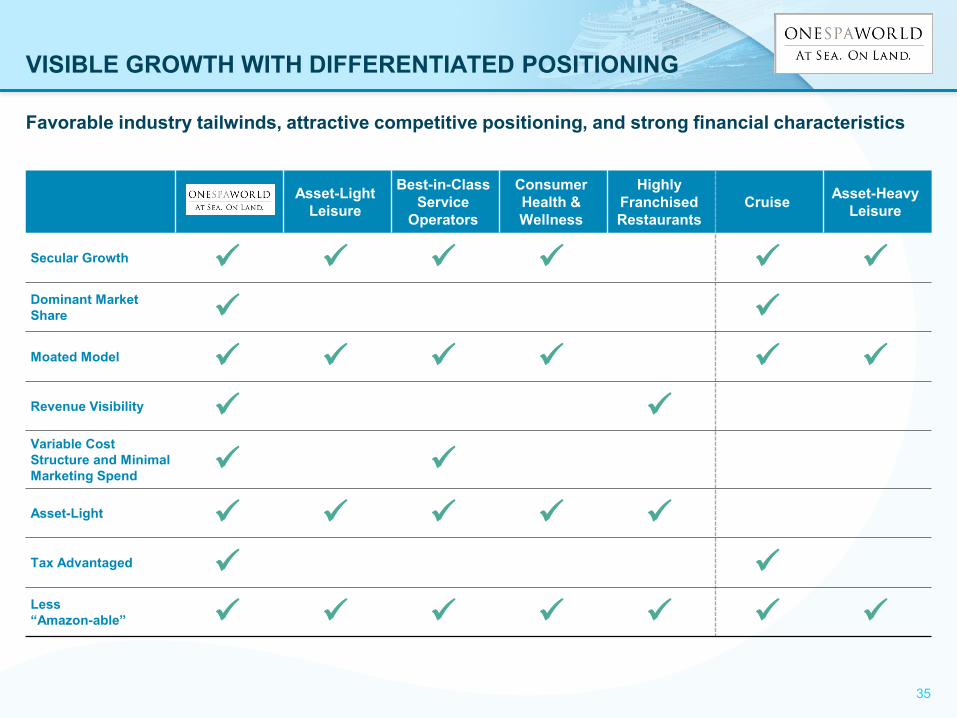
VISIBLE GROWTH WITH DIFFERENTIATED POSITIONING
Favorable industry tailwinds, attractive competitive positioning, and strong financial characteristics
Asset-Light Leisure
Best-in-Class Service
Operators
Consumer Health & Wellness
Highly Franchised Restaurants
Cruise Asset-Heavy Leisure
Secular Growth Dominant Market Share Moated Model Revenue Visibility Variable Cost Structure and Minimal Marketing Spend Asset-Light Tax Advantaged Less “Amazon-able”
35
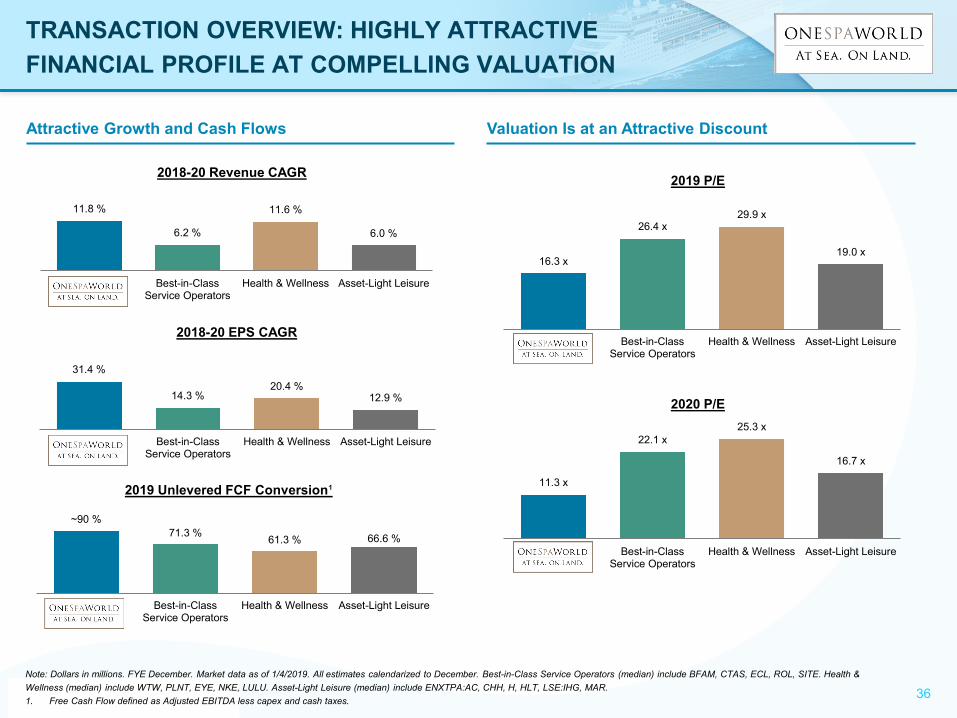
Note: Dollars in millions. FYE December. Market data as of 1/4/2019. All estimates calendarized to December. Best-in-Class Service Operators (median) include BFAM, CTAS, ECL, ROL, SITE. Health & Wellness (median) include WTW, PLNT, EYE, NKE, LULU. Asset-Light Leisure (median) include ENXTPA:AC, CHH, H, HLT, LSE:IHG, MAR. 1. Free Cash Flow defined as Adjusted EBITDA less capex and cash taxes.
TRANSACTION OVERVIEW: HIGHLY ATTRACTIVE FINANCIAL PROFILE AT COMPELLING VALUATION
2018-20 Revenue CAGR
2018-20 EPS CAGR
2019 Unlevered FCF Conversion¹
2019 P/E
2020 P/E
Attractive Growth and Cash Flows Valuation Is at an Attractive Discount
11.8 %
6.2 %
11.6 %
6.0 %
Best-in-ClassService Operators
Health & Wellness Asset-Light Leisure
~90 %71.3 % 61.3 % 66.6 %
Best-in-ClassService Operators
Health & Wellness Asset-Light Leisure
16.3 x
26.4 x29.9 x
19.0 x
Best-in-ClassService Operators
Health & Wellness Asset-Light Leisure
11.3 x
22.1 x25.3 x
16.7 x
Best-in-ClassService Operators
Health & Wellness Asset-Light Leisure
36
31.4 %
14.3 %20.4 %
12.9 %
Best-in-ClassService Operators
Health & Wellness Asset-Light Leisure
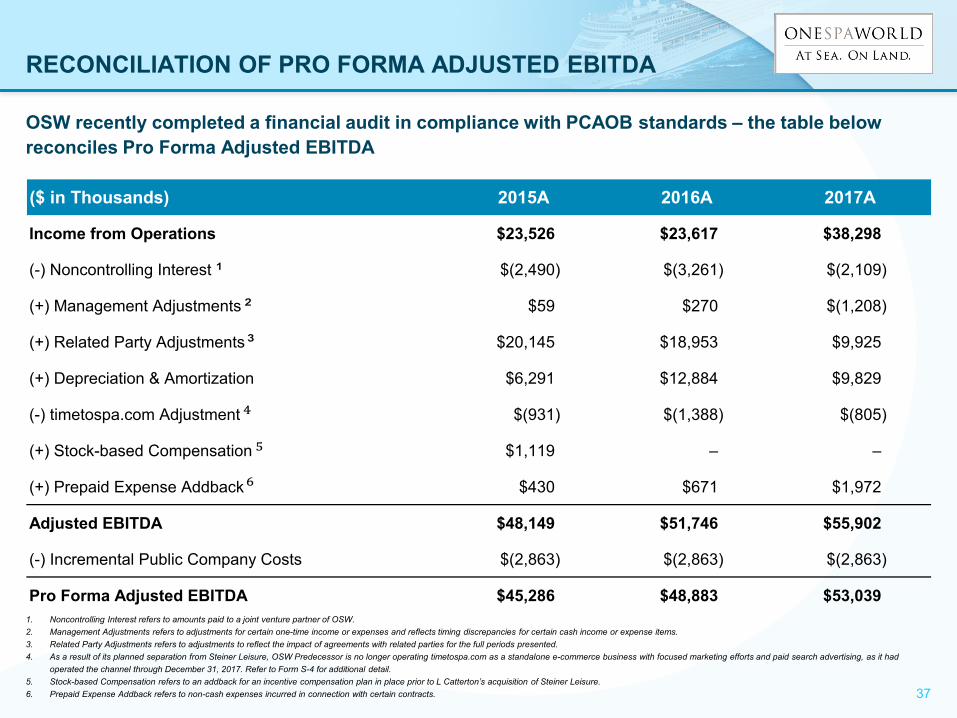
RECONCILIATION OF PRO FORMA ADJUSTED EBITDA
OSW recently completed a financial audit in compliance with PCAOB standards – the table below reconciles Pro Forma Adjusted EBITDA
1. Noncontrolling Interest refers to amounts paid to a joint venture partner of OSW. 2. Management Adjustments refers to adjustments for certain one-time income or expenses and reflects timing discrepancies for certain cash income or expense items. 3. Related Party Adjustments refers to adjustments to reflect the impact of agreements with related parties for the full periods presented. 4. As a result of its planned separation from Steiner Leisure, OSW Predecessor is no longer operating timetospa.com as a standalone e-commerce business with focused marketing efforts and paid search advertising, as it had
operated the channel through December 31, 2017. Refer to Form S-4 for additional detail. 5. Stock-based Compensation refers to an addback for an incentive compensation plan in place prior to L Catterton’s acquisition of Steiner Leisure. 6. Prepaid Expense Addback refers to non-cash expenses incurred in connection with certain contracts. 37
¹
²
³
⁴
⁵
⁶
($ in Thousands) 2015A 2016A 2017A
Income from Operations $23,526 $23,617 $38,298
(-) Noncontrolling Interest $(2,490) $(3,261) $(2,109)
(+) Management Adjustments $59 $270 $(1,208)
(+) Related Party Adjustments $20,145 $18,953 $9,925
(+) Depreciation & Amortization $6,291 $12,884 $9,829
(-) timetospa.com Adjustment $(931) $(1,388) $(805)
(+) Stock-based Compensation $1,119 – –
(+) Prepaid Expense Addback $430 $671 $1,972
Adjusted EBITDA $48,149 $51,746 $55,902
(-) Incremental Public Company Costs $(2,863) $(2,863) $(2,863)
Pro Forma Adjusted EBITDA $45,286 $48,883 $53,039