introduction to data visualization - purdue...
TRANSCRIPT
9/29/2016
1
Introduction to Data Visualization
Vetria L. Byrd, PhDAssistant Professor
CGT101 Data Visualization Talk
Purdue University
September 29, 2016
Introductions
9/29/2016
2
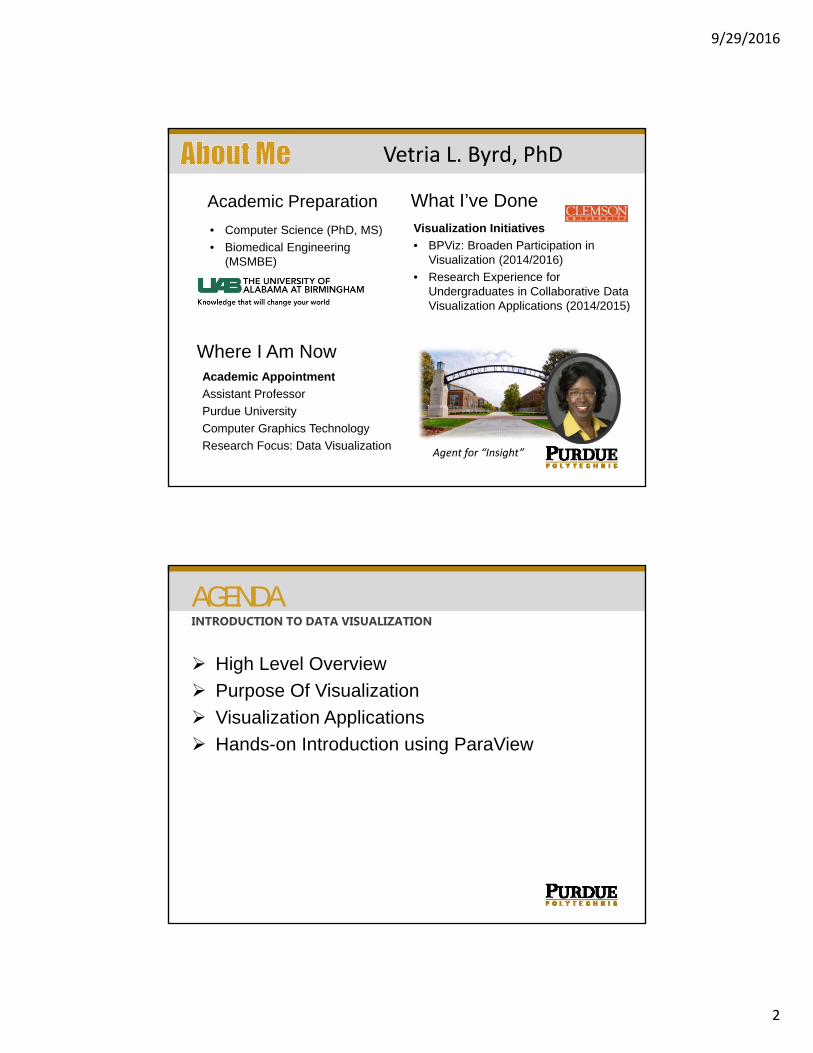
Academic Preparation
• Computer Science (PhD, MS)
• Biomedical Engineering (MSMBE)
Where I Am NowAcademic Appointment
Assistant Professor
Purdue University
Computer Graphics Technology
Research Focus: Data Visualization
Vetria L. Byrd, PhD
What I’ve DoneVisualization Initiatives
• BPViz: Broaden Participation in Visualization (2014/2016)
• Research Experience for Undergraduates in Collaborative Data Visualization Applications (2014/2015)
Agent for “Insight”
High Level Overview
Purpose Of Visualization
Visualization Applications
Hands-on Introduction using ParaView
AGENDAINTRODUCTION TO DATA VISUALIZATION
9/29/2016
3
7 Billion: How Did we Get so Big so Fast?
Baby names
The Origin of Species
Gender and Teacher Reviews
Wind Map
Prime Number Patterns (pretty cool)
What is Visualization?
• Representing large amounts of disparate information in a visual form often allows you to see patterns that would otherwise be buried in vast, unconnected data sets. …
• Visualizations allow you to understand and process enormous amounts of information quickly because it is all represented in a single image or animation.
What is Visualizationhttp://mindymcadams.com/tojou/2011/10-useful-resources-about-data-visualization/
9/29/2016
4
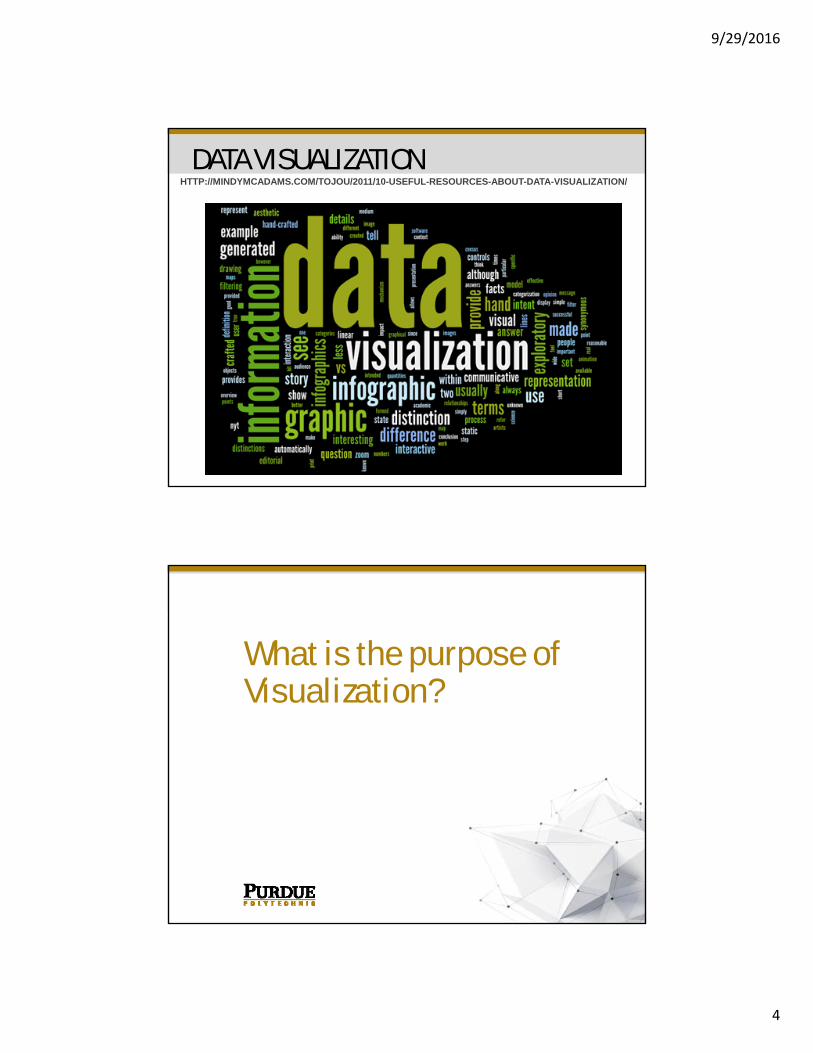
DATA VISUALIZATIONHTTP://MINDYMCADAMS.COM/TOJOU/2011/10-USEFUL-RESOURCES-ABOUT-DATA-VISUALIZATION/
What is the purpose of Visualization?
9/29/2016
5
“The purpose of visualization
is “insight”,
not pictures.”~Ben Shneiderman
What does Insight lead to?
9/29/2016
6
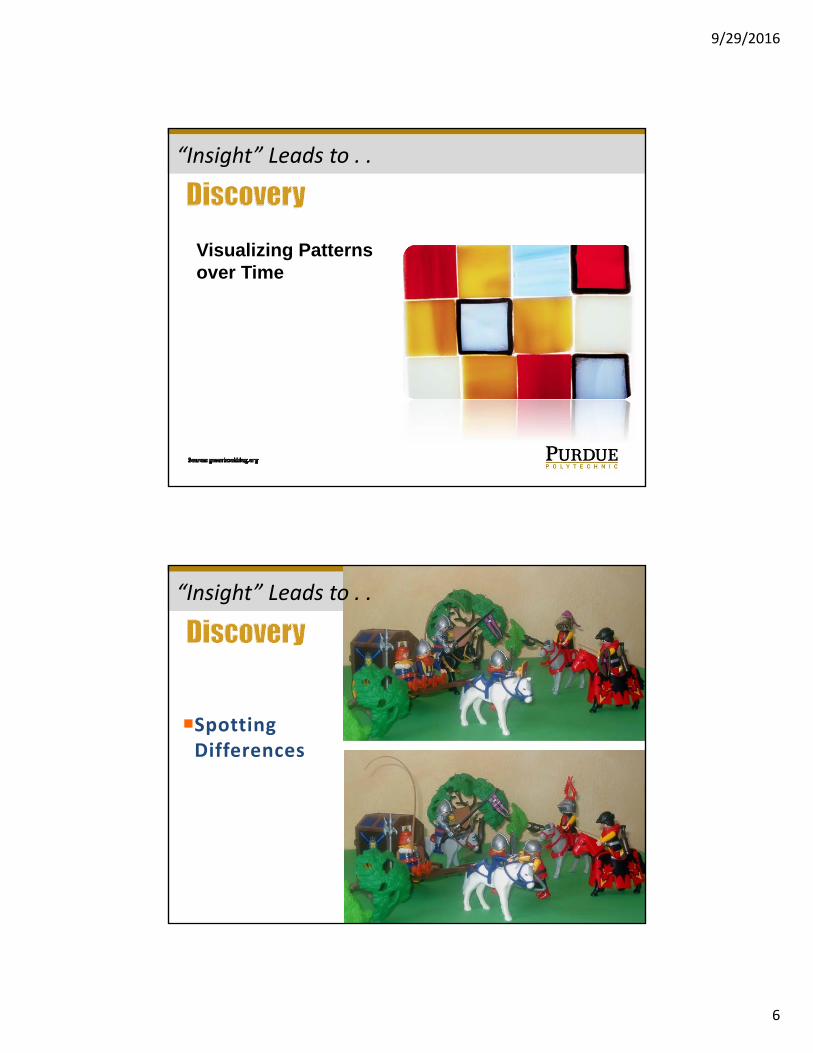
Visualizing Patterns over Time
“Insight” Leads to . .
Spotting Differences
“Insight” Leads to . .
9/29/2016
7
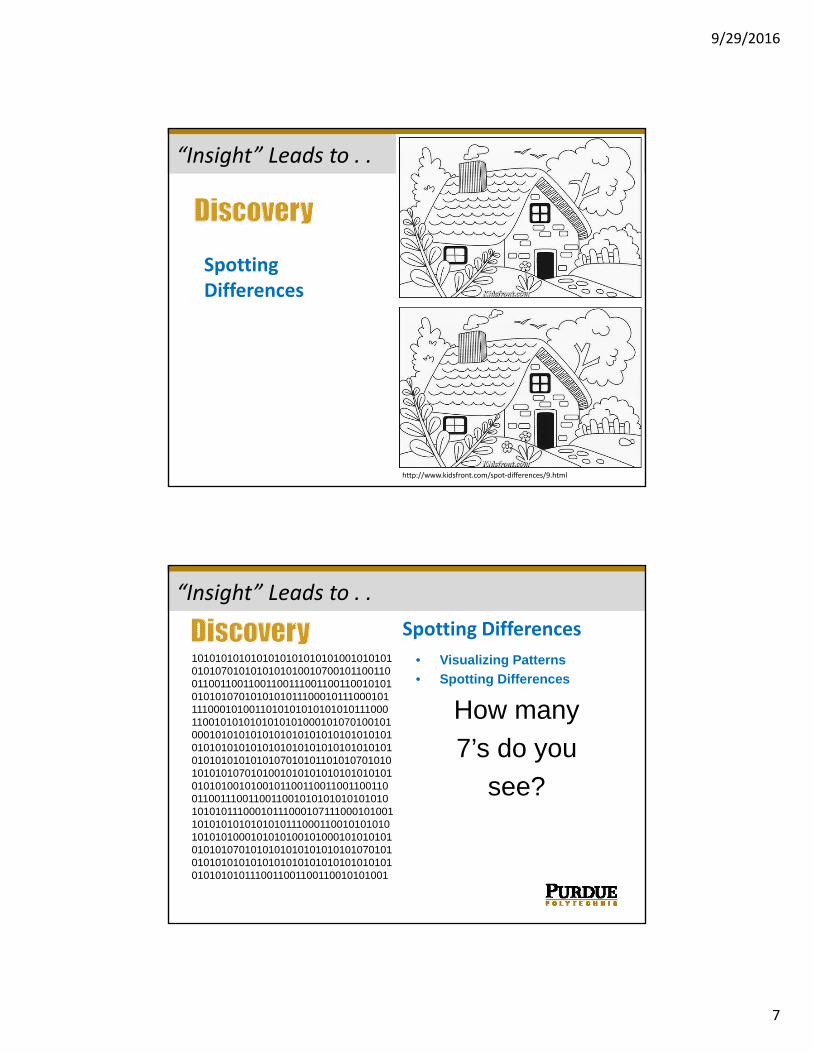
Spotting Differences
“Insight” Leads to . .
http://www.kidsfront.com/spot‐differences/9.html
10101010101010101010101010010101010101070101010101010010700101100110011001100110011001110011001100101010101010701010101011100010111000101111000101001101010101010101011100011001010101010101010001010701001010001010101010101010101010101010101010101010101010101010101010101010101010101010101070101011010107010101010101070101001010101010101010101010101001010010110011001100110011001100111001100110010101010101010101010101110001011100010711100010100110101010101010101110001100101010101010101000101010100101000101010101010101070101010101010101010107010101010101010101010101010101010101010101010101110011001100110010101001
• Visualizing Patterns
• Spotting Differences
How many
7’s do you
see?
Spotting Differences
“Insight” Leads to . .
9/29/2016
8
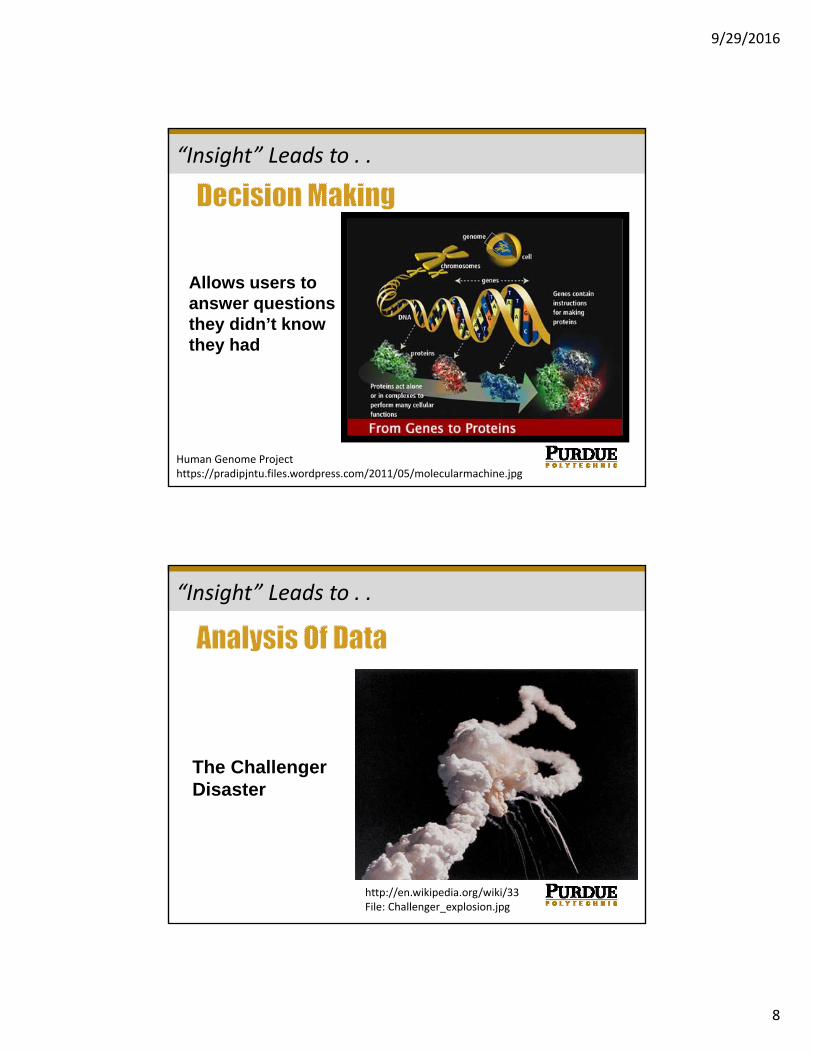
Allows users to answer questions they didn’t know they had
“Insight” Leads to . .
Human Genome Projecthttps://pradipjntu.files.wordpress.com/2011/05/molecularmachine.jpg
The Challenger Disaster
http://en.wikipedia.org/wiki/33 File: Challenger_explosion.jpg
“Insight” Leads to . .
9/29/2016
9
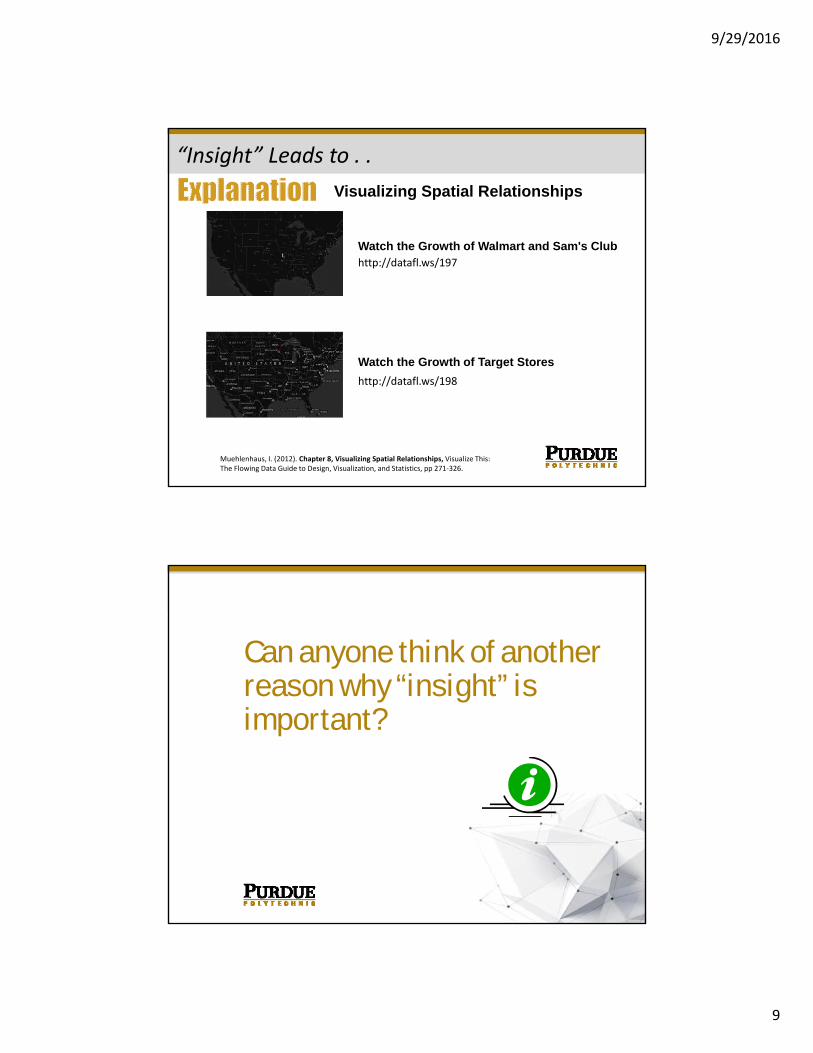
Visualizing Spatial Relationships
“Insight” Leads to . .
Muehlenhaus, I. (2012). Chapter 8, Visualizing Spatial Relationships, Visualize This: The Flowing Data Guide to Design, Visualization, and Statistics, pp 271‐326.
http://datafl.ws/197
http://datafl.ws/198
Watch the Growth of Walmart and Sam's Club
Watch the Growth of Target Stores
Can anyone think of another reason why “insight” is important?

9/29/2016
10
“Insight” Tells a Story.
Temperature
Army Size: 422,000
Army Size: 10,000
Army Size: 100,000
Moscow
‐11
‐30‐26
‐21
‐9
Path of retreat
Best Statistical Graphic, Ever!
“Insight” Tells a Story
9/29/2016
11
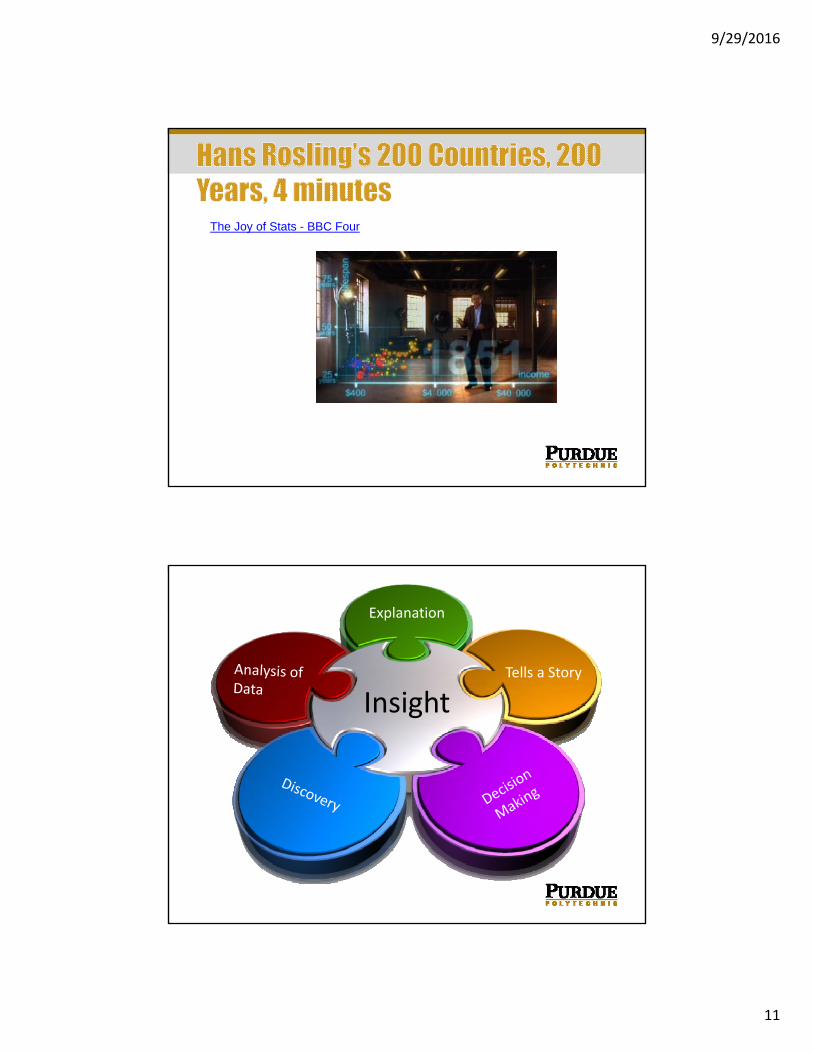
The Joy of Stats - BBC Four
Insight
Explanation
Tells a Story
9/29/2016
12
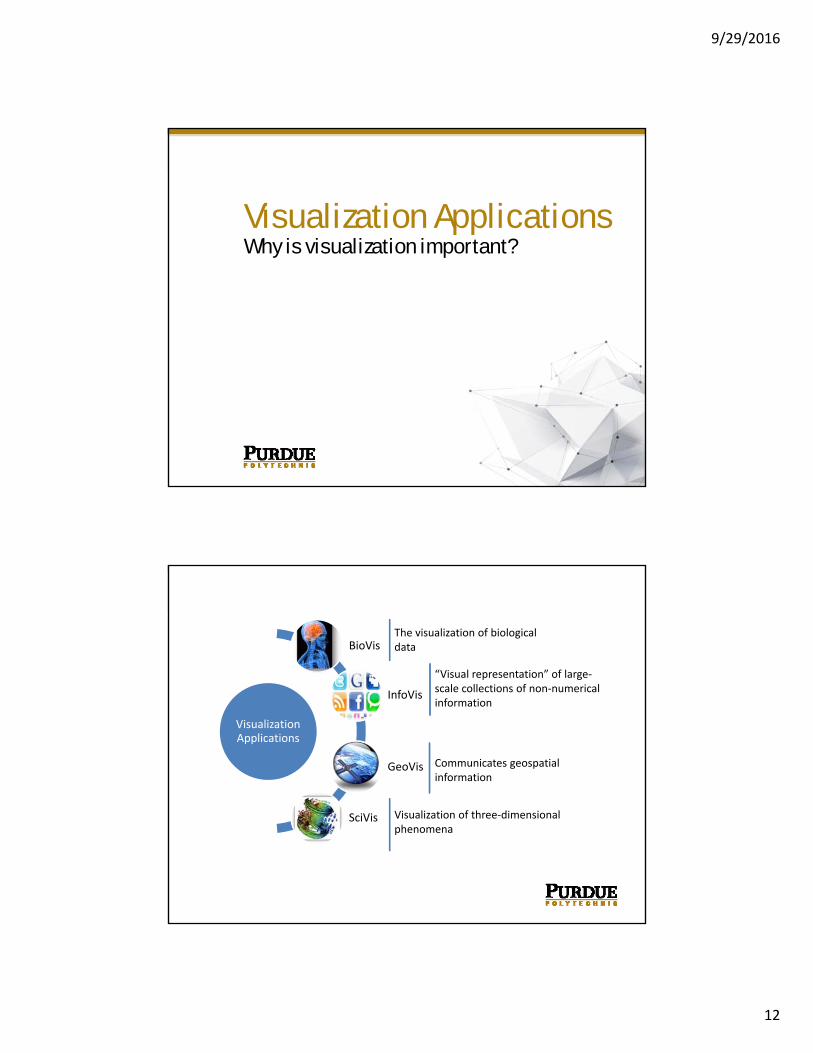
Why is visualization important?Visualization Applications
Visualization Applications
BioVis
InfoVis
GeoVis
SciVis
The visualization of biological data
“Visual representation” of large‐scale collections of non‐numerical information
Communicates geospatial information
Visualization of three‐dimensional phenomena
9/29/2016
13
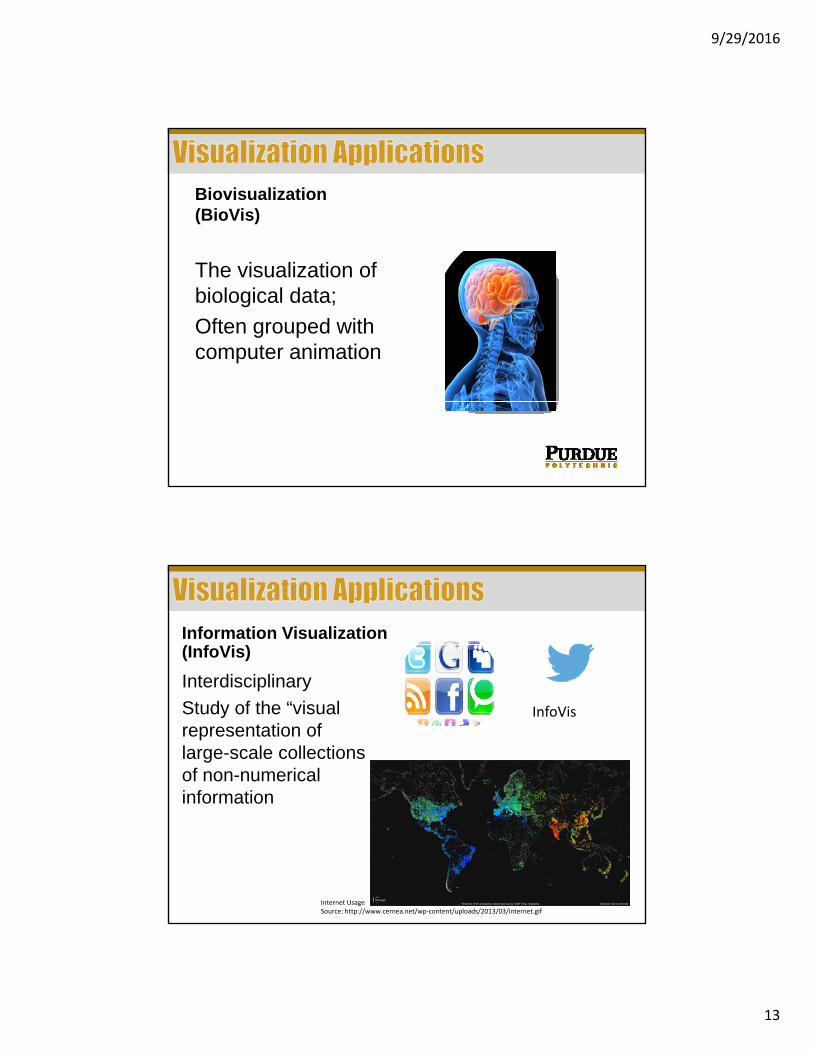
Biovisualization(BioVis)
The visualization of biological data;
Often grouped with computer animation
Information Visualization (InfoVis)
Interdisciplinary
Study of the “visual representation of large-scale collections of non-numerical information
InfoVis
Internet UsageSource: http://www.cernea.net/wp‐content/uploads/2013/03/internet.gif
9/29/2016
14
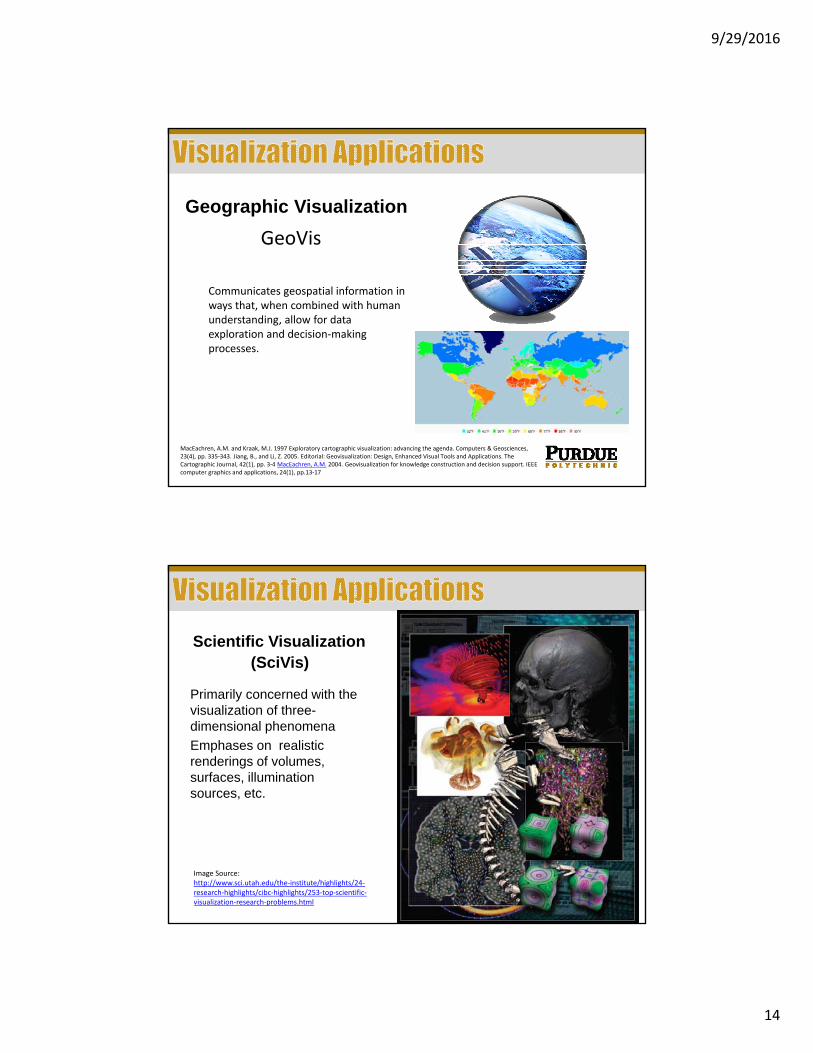
Geographic Visualization
GeoVis
Communicates geospatial information in ways that, when combined with human understanding, allow for data exploration and decision‐making processes.
MacEachren, A.M. and Kraak, M.J. 1997 Exploratory cartographic visualization: advancing the agenda. Computers & Geosciences, 23(4), pp. 335‐343. Jiang, B., and Li, Z. 2005. Editorial: Geovisualization: Design, Enhanced Visual Tools and Applications. The Cartographic Journal, 42(1), pp. 3‐4 MacEachren, A.M. 2004. Geovisualization for knowledge construction and decision support. IEEE computer graphics and applications, 24(1), pp.13‐17
Scientific Visualization(SciVis)
Primarily concerned with the visualization of three-dimensional phenomena
Emphases on realistic renderings of volumes, surfaces, illumination sources, etc.
http://www.tinkering.net/sciviz/
Image Source: http://www.sci.utah.edu/the‐institute/highlights/24‐research‐highlights/cibc‐highlights/253‐top‐scientific‐visualization‐research‐problems.html
9/29/2016
15
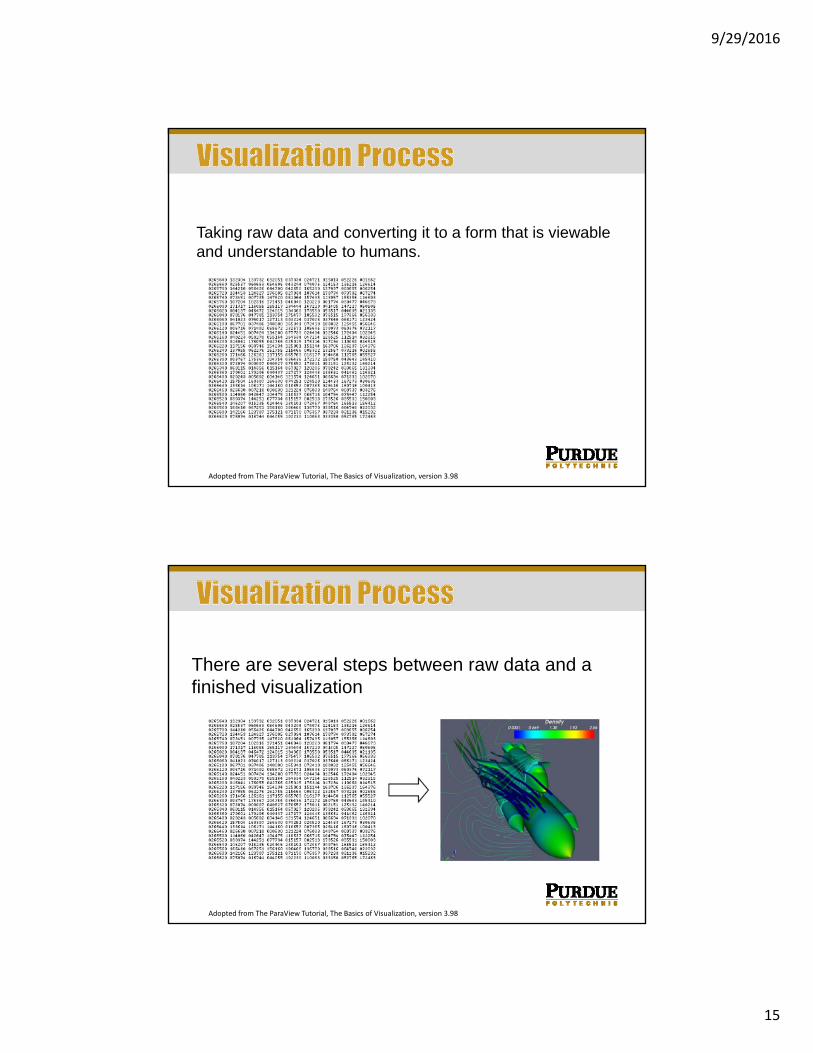
Taking raw data and converting it to a form that is viewable and understandable to humans.
Adopted from The ParaView Tutorial, The Basics of Visualization, version 3.98
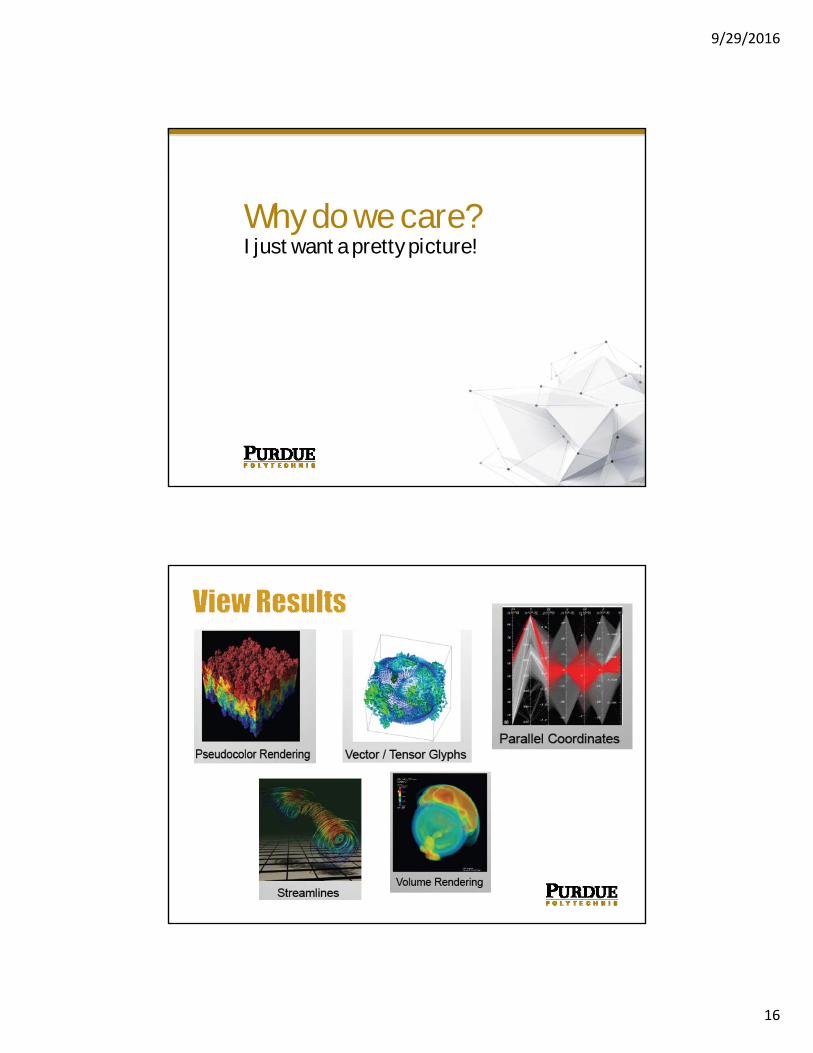
There are several steps between raw data and a finished visualization
Adopted from The ParaView Tutorial, The Basics of Visualization, version 3.98
9/29/2016
16
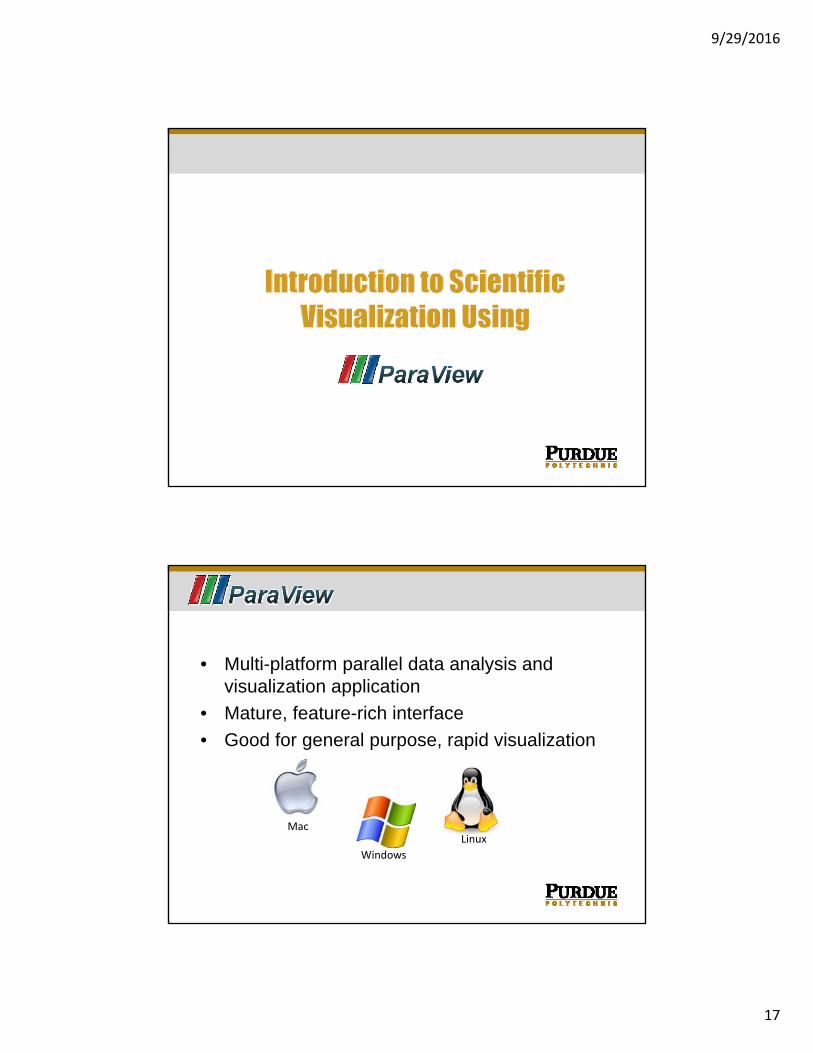
Why do we care?I just want a pretty picture!
9/29/2016
17
• Multi-platform parallel data analysis and visualization application
• Mature, feature-rich interface
• Good for general purpose, rapid visualization
Mac
Windows
Linux
9/29/2016
18
• Open Source . . . It’s Free!
• http://www.paraview.org/
• Built upon the Visualization Toolkit (VTK) library
• Primary contributors:
Kitware, Inc.
Sandia National Laboratory
Los Alamos National Laboratory
Army Research Laboratory
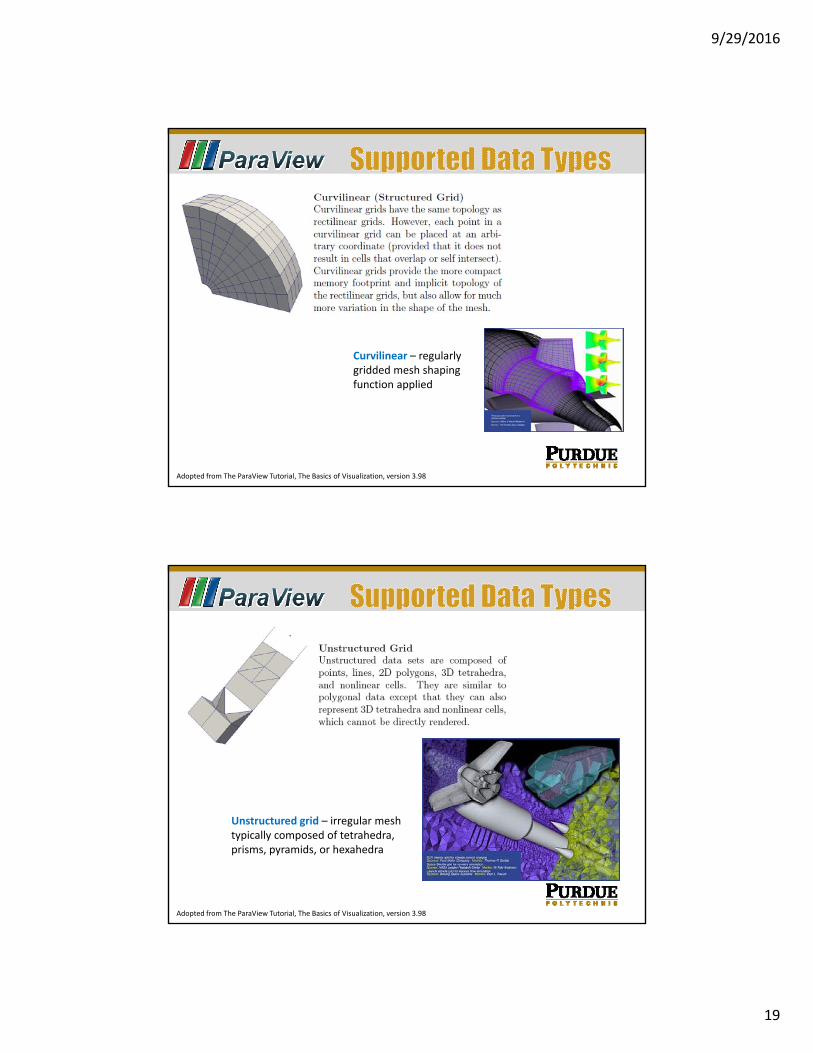
Grid – regular structure, all voxels (cells) are the same size and shape
Adopted from The ParaView Tutorial, The Basics of Visualization, version 3.98
9/29/2016
19
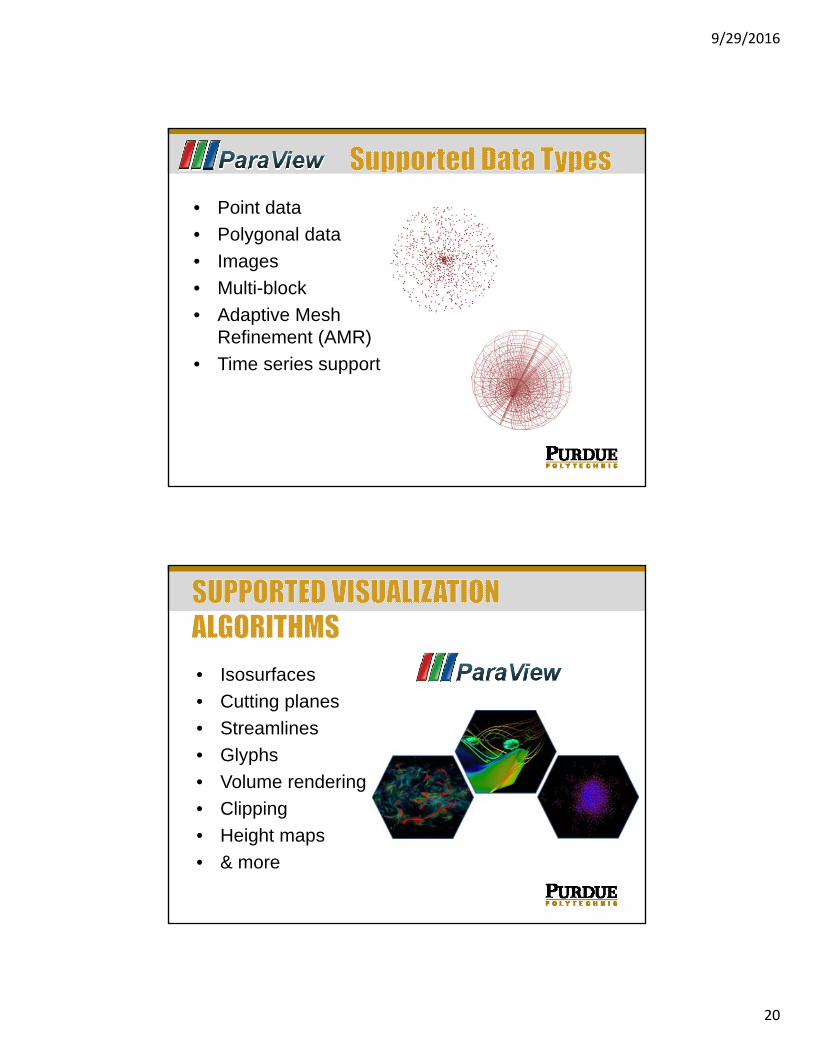
Curvilinear – regularly gridded mesh shaping function applied
Adopted from The ParaView Tutorial, The Basics of Visualization, version 3.98
Unstructured grid – irregular mesh typically composed of tetrahedra, prisms, pyramids, or hexahedra
Adopted from The ParaView Tutorial, The Basics of Visualization, version 3.98
9/29/2016
20
• Point data
• Polygonal data
• Images
• Multi-block
• Adaptive Mesh Refinement (AMR)
• Time series support
• Isosurfaces
• Cutting planes
• Streamlines
• Glyphs
• Volume rendering
• Clipping
• Height maps
• & more
9/29/2016
21
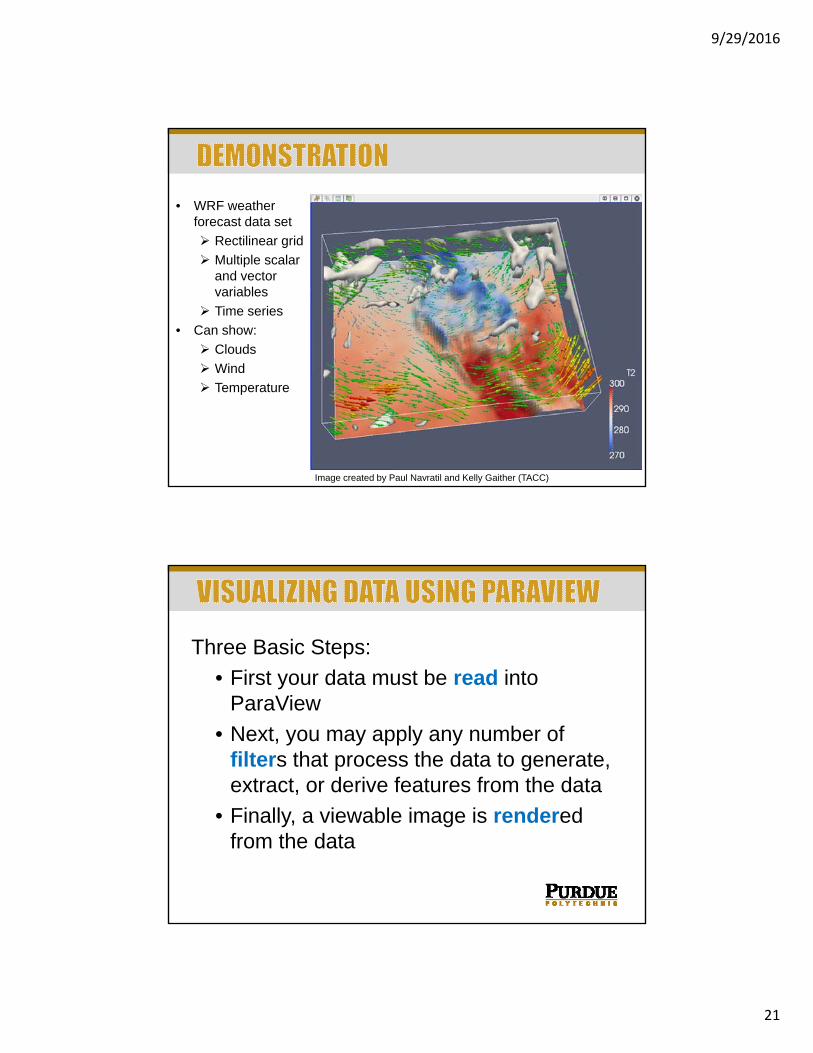
• WRF weather forecast data set
Rectilinear grid
Multiple scalar and vector variables
Time series
• Can show:
Clouds
Wind
Temperature
Image created by Paul Navratil and Kelly Gaither (TACC)
Three Basic Steps:
• First your data must be read into ParaView
• Next, you may apply any number of filters that process the data to generate, extract, or derive features from the data
• Finally, a viewable image is rendered from the data
9/29/2016
22
ParaView 5.0.0Let’s get started . . . .
Sanity Check
Software Installed? Data Sets downloaded? Can you locate the datasets?
Data set: headsq.vti
9/29/2016
23
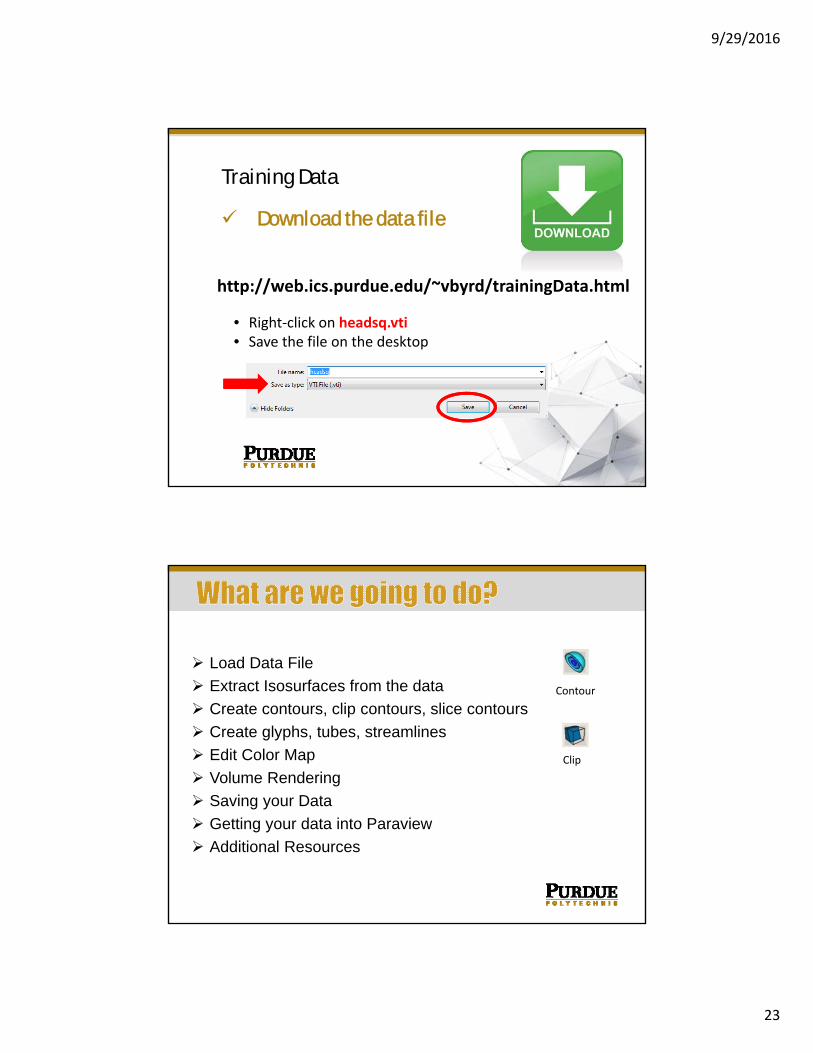
Training Data
Download the data file
http://web.ics.purdue.edu/~vbyrd/trainingData.html
• Right‐click on headsq.vti• Save the file on the desktop
Load Data File
Extract Isosurfaces from the data
Create contours, clip contours, slice contours
Create glyphs, tubes, streamlines
Edit Color Map
Volume Rendering
Saving your Data
Getting your data into Paraview
Additional Resources
Contour
Clip
9/29/2016
24
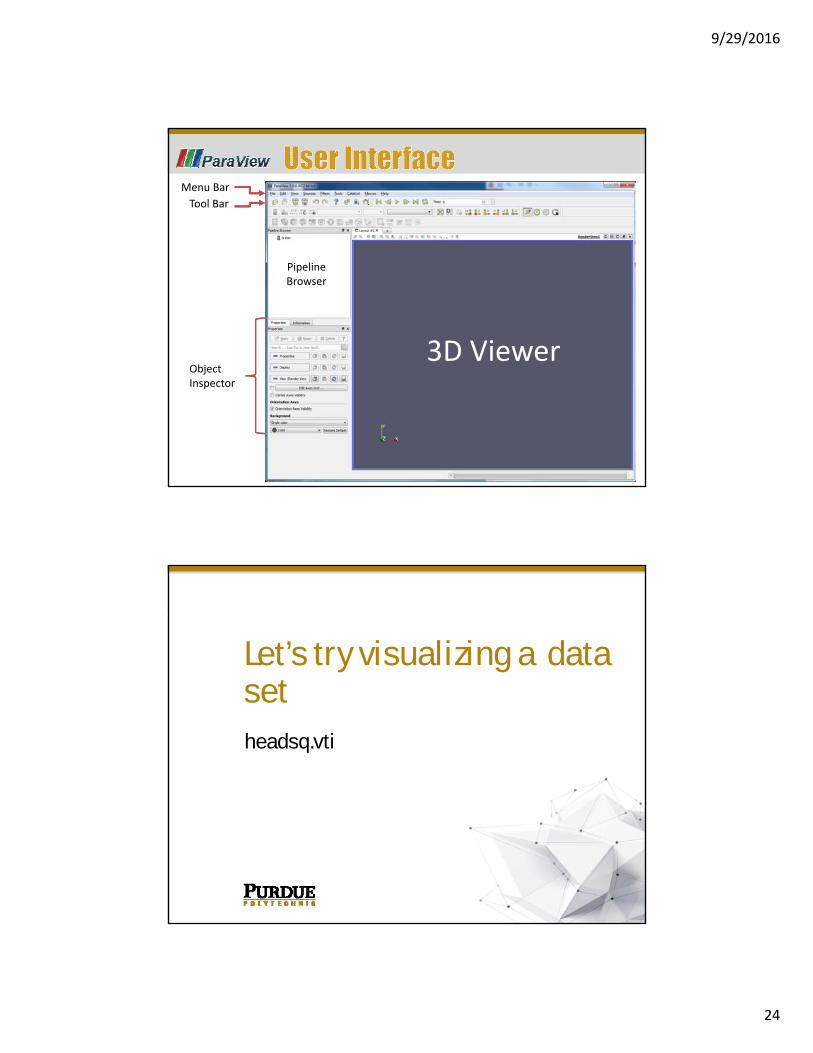
Menu Bar
Tool Bar
Pipeline Browser
Object Inspector
3D Viewer
Let’s try visualizing a data setheadsq.vti

9/29/2016
25
FileOpen
headsq.vti
New Object in Pipeline Browser
Click Apply
9/29/2016
26
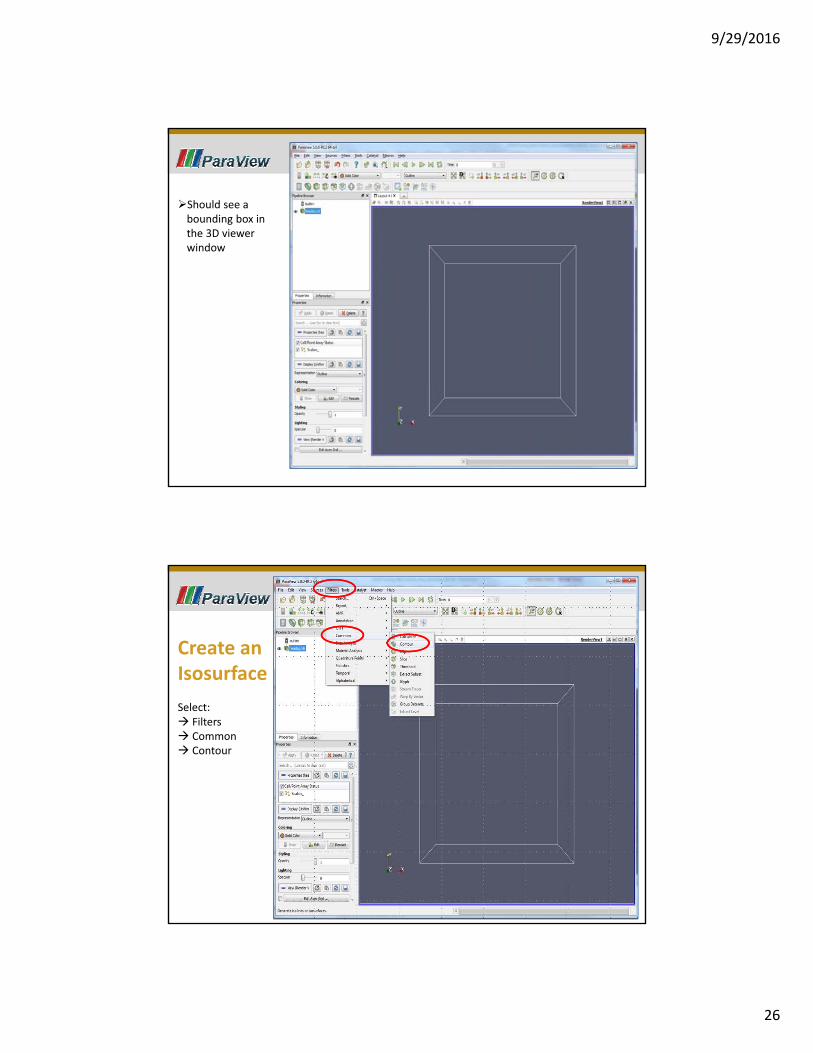
Should see a bounding box in the 3D viewer window
Create an Isosurface
Select: Filters Common Contour
9/29/2016
27
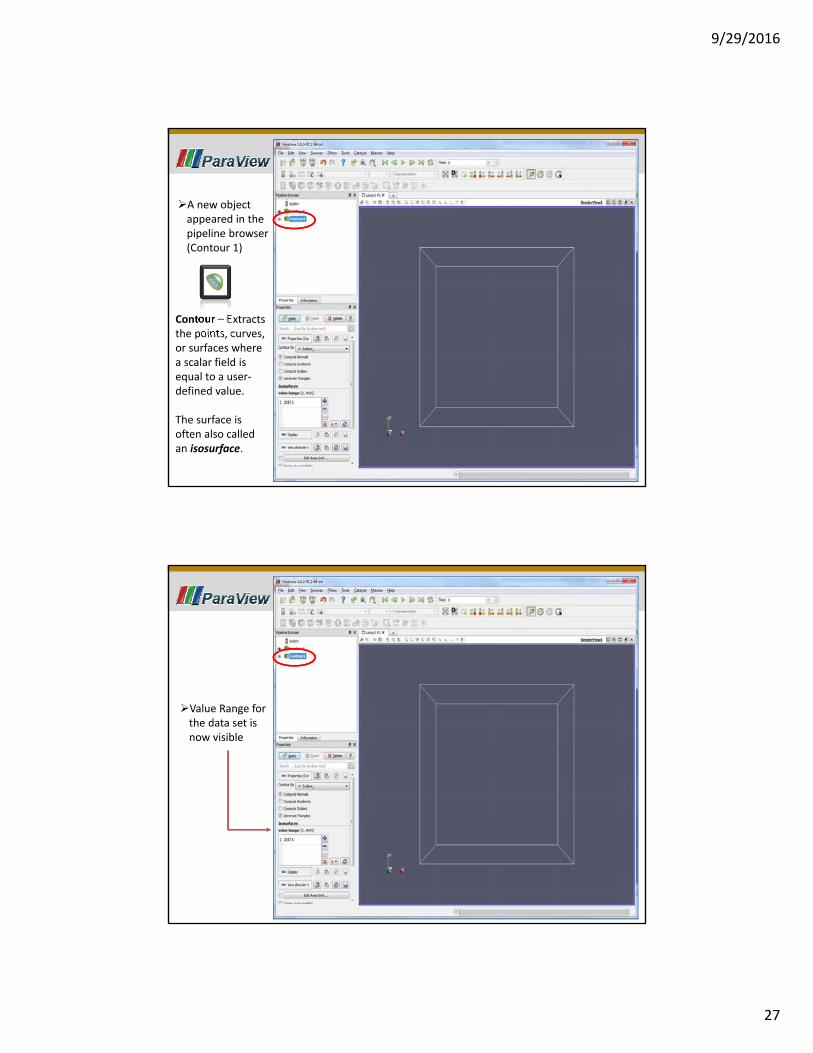
A new object appeared in the pipeline browser(Contour 1)
Contour – Extracts the points, curves, or surfaces where a scalar field is equal to a user‐defined value.
The surface is often also called an isosurface.
Value Range for the data set is now visible
9/29/2016
28
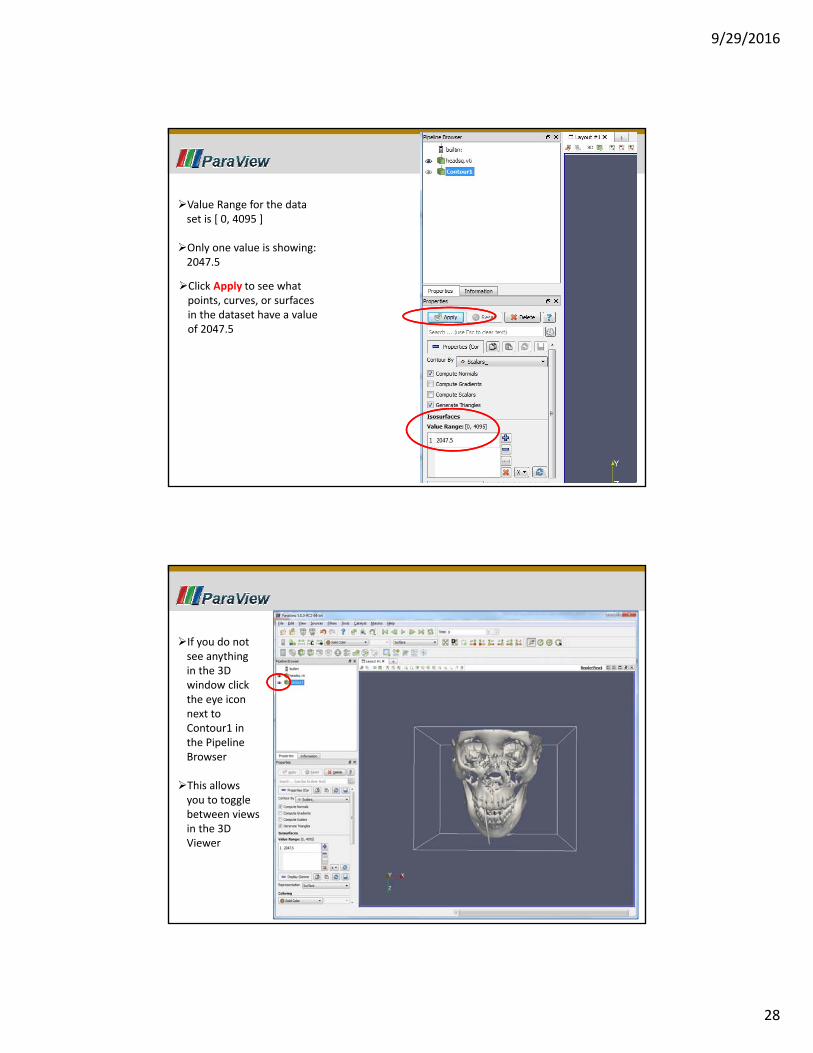
Value Range for the data set is [ 0, 4095 ]
Only one value is showing: 2047.5
Click Apply to see what points, curves, or surfaces in the dataset have a value of 2047.5
If you do not see anything in the 3D window click the eye icon next to Contour1 in the Pipeline Browser
This allows you to toggle between views in the 3D Viewer
9/29/2016
29
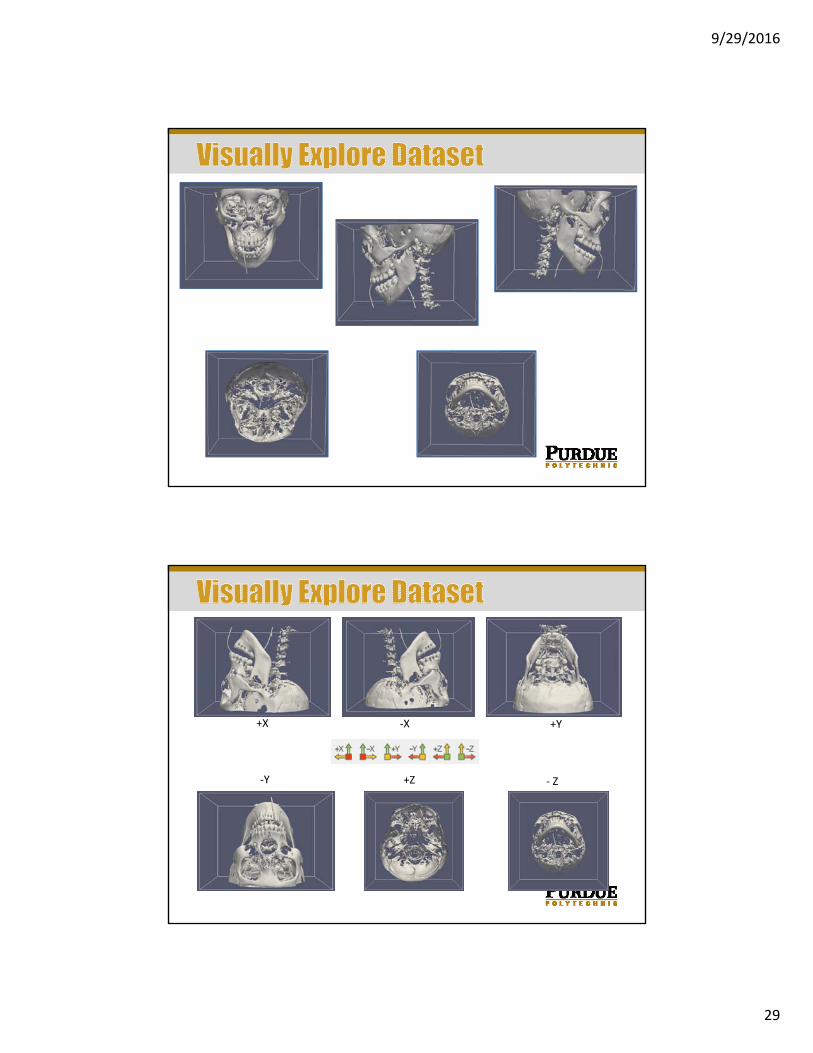
+X ‐X +Y
‐Y +Z ‐ Z
9/29/2016
30
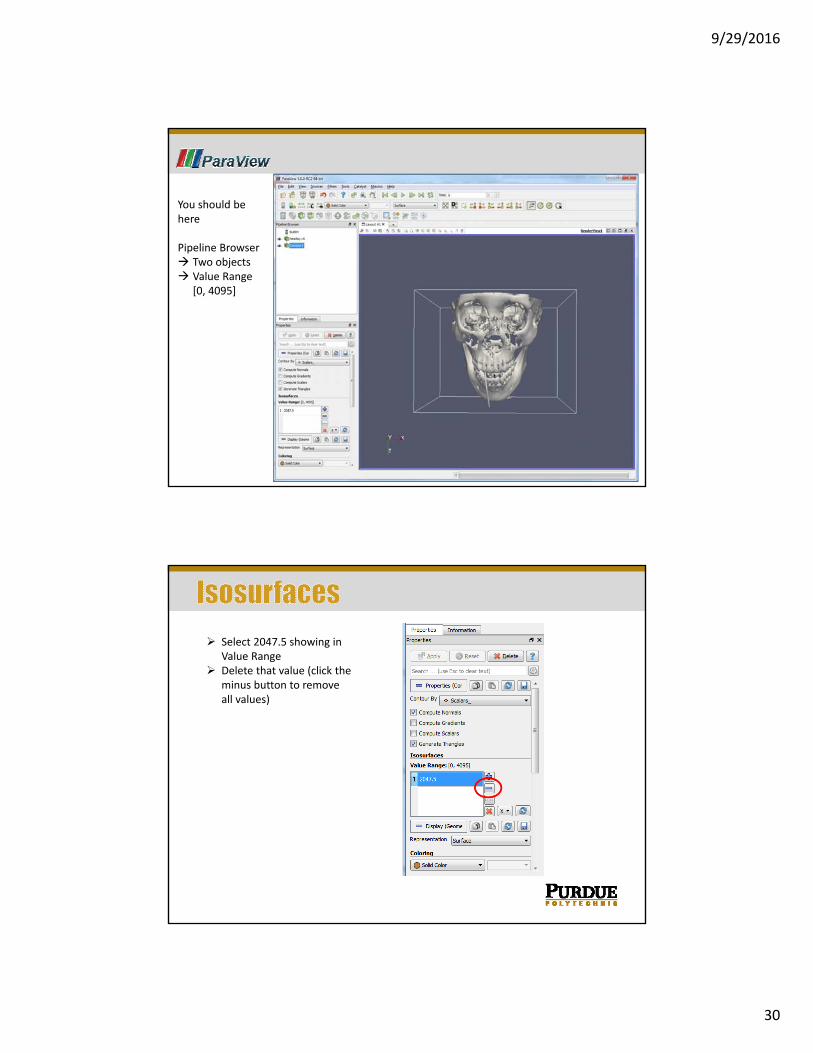
You should be here
Pipeline Browser Two objects Value Range
[0, 4095]
Select 2047.5 showing in Value Range
Delete that value (click the minus button to remove all values)
9/29/2016
31
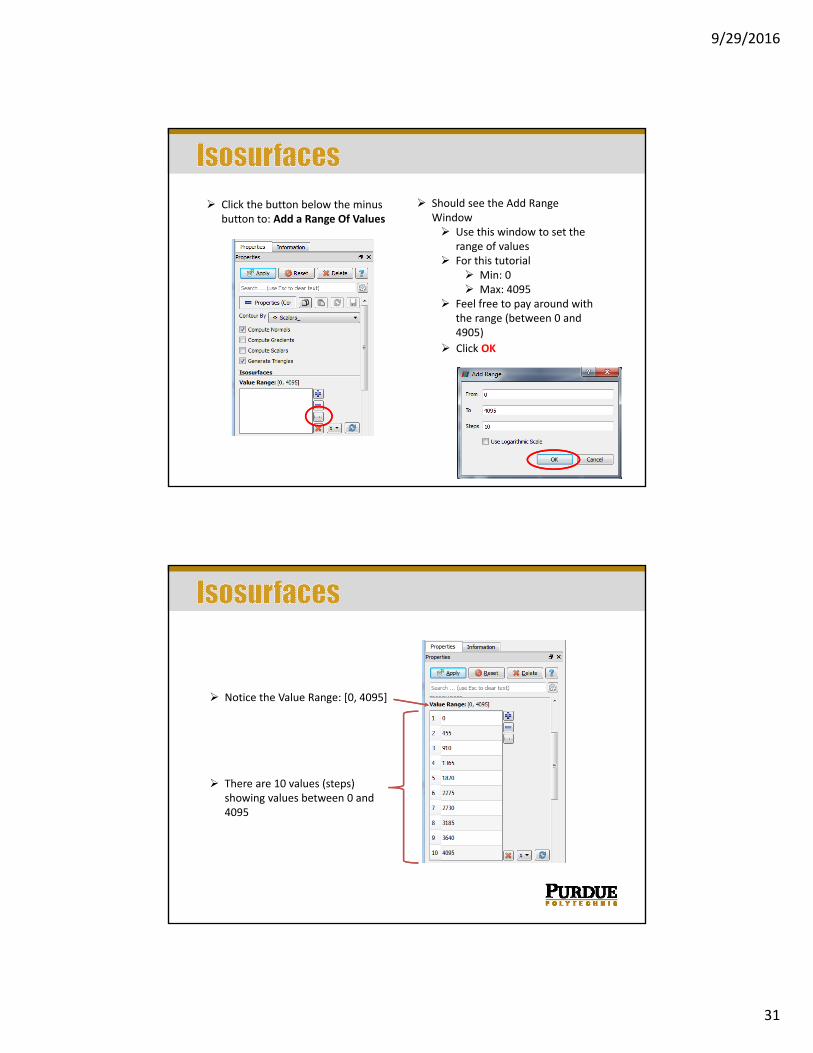
Click the button below the minus button to: Add a Range Of Values
Should see the Add Range Window Use this window to set the
range of values For this tutorial
Min: 0 Max: 4095
Feel free to pay around with the range (between 0 and 4905)
Click OK
Notice the Value Range: [0, 4095]
There are 10 values (steps) showing values between 0 and 4095
9/29/2016
32
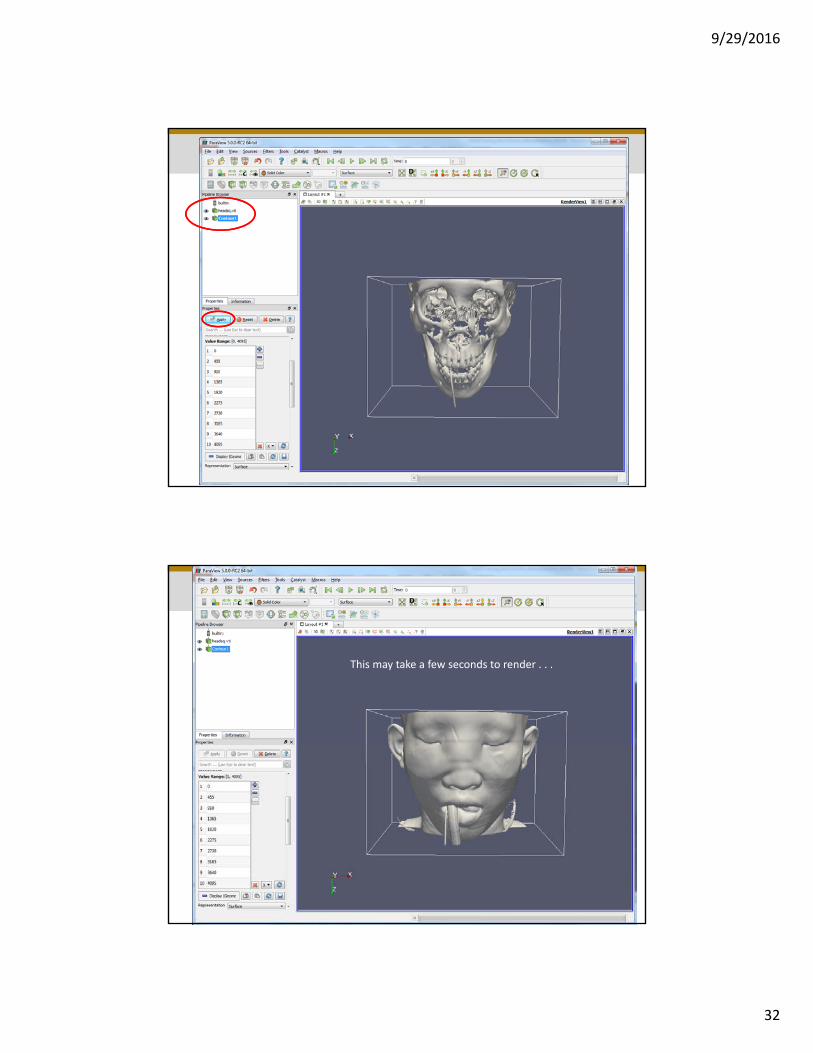
This may take a few seconds to render . . .
9/29/2016
33
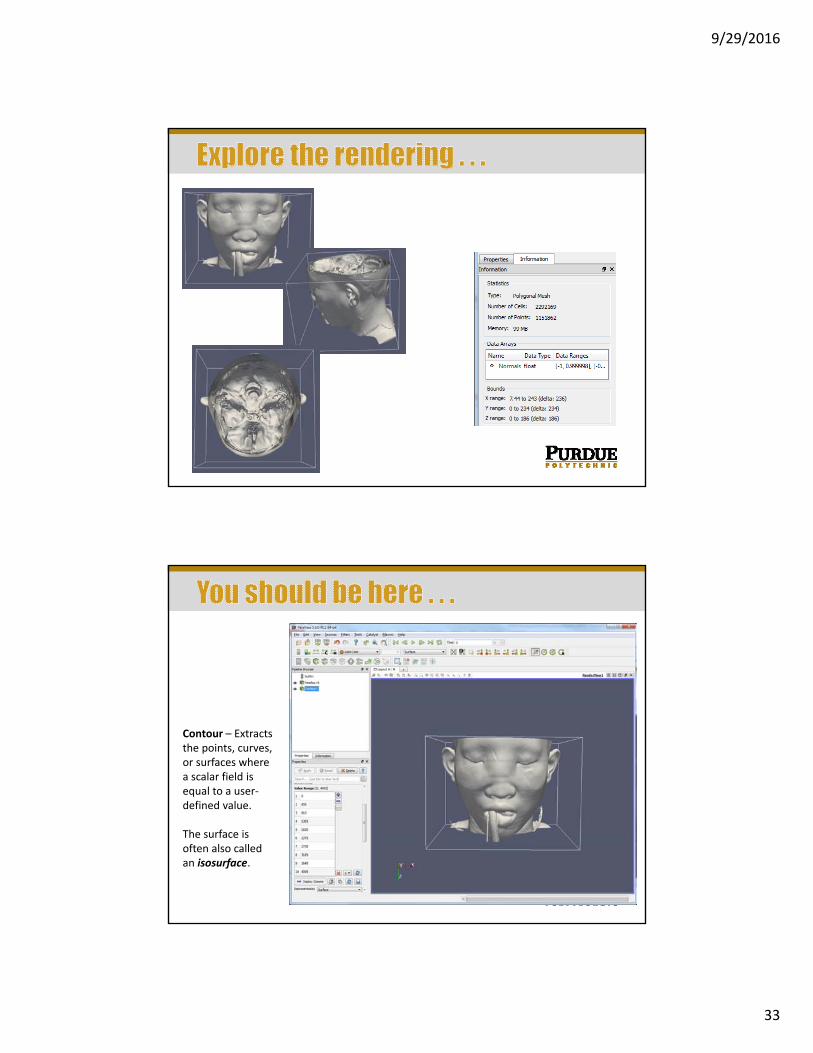
Contour – Extracts the points, curves, or surfaces where a scalar field is equal to a user‐defined value.
The surface is often also called an isosurface.
9/29/2016
34
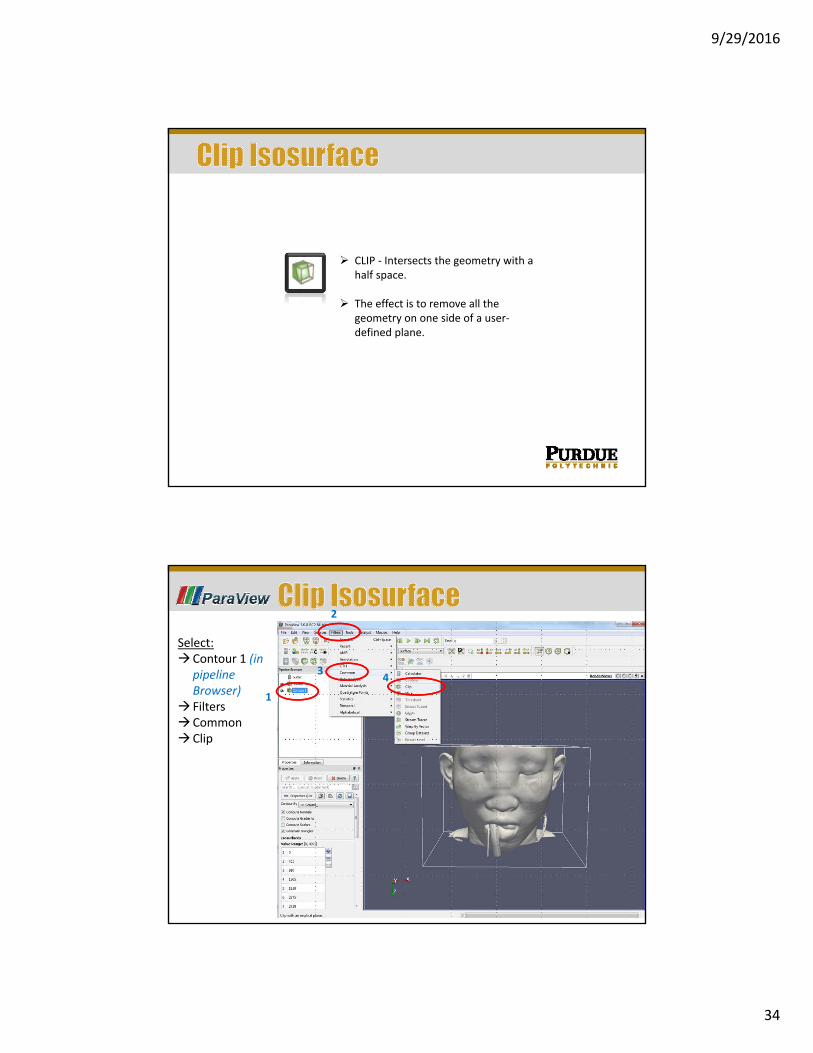
CLIP ‐ Intersects the geometry with a half space.
The effect is to remove all the geometry on one side of a user‐defined plane.
Select:Contour 1 (in
pipeline Browser)
FiltersCommonClip
1
2
34
9/29/2016
35
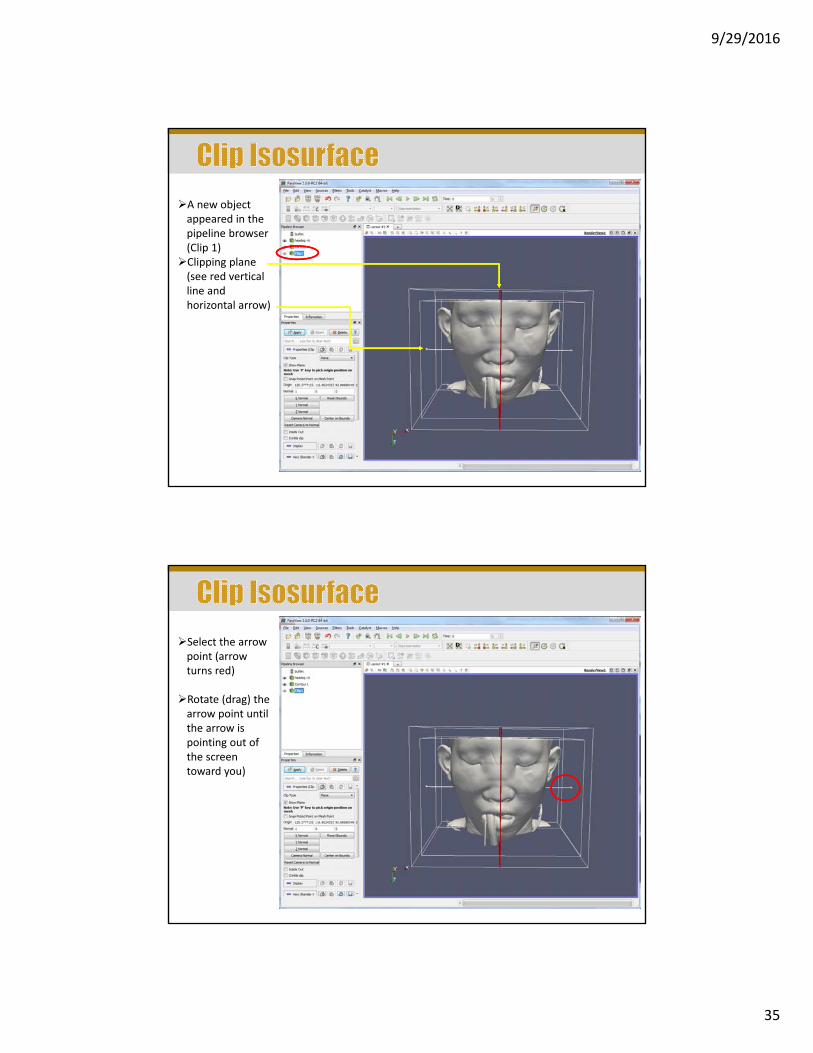
A new object appeared in the pipeline browser(Clip 1)Clipping plane (see red vertical line and horizontal arrow)
Select the arrow point (arrow turns red)
Rotate (drag) the arrow point until the arrow is pointing out of the screen toward you)
9/29/2016
36
9/29/2016
37
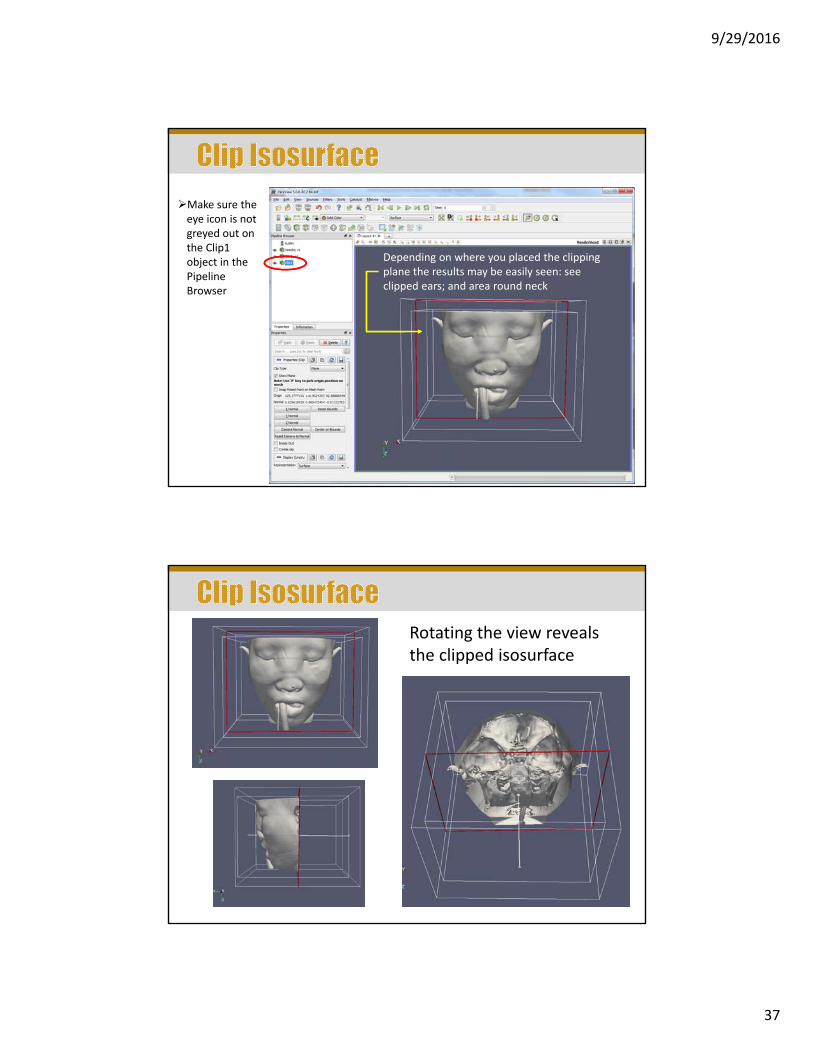
Depending on where you placed the clipping plane the results may be easily seen: see clipped ears; and area round neck
Make sure the eye icon is not greyed out on the Clip1 object in the Pipeline Browser
Rotating the view reveals the clipped isosurface
9/29/2016
38
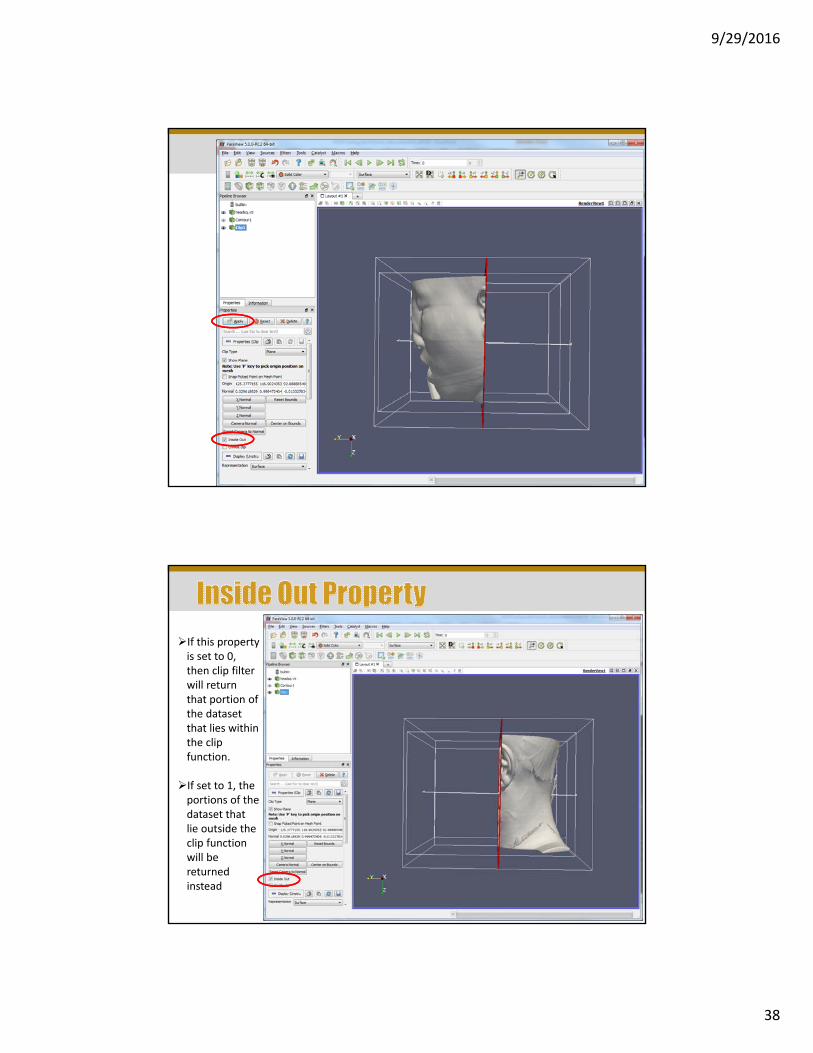
If this property is set to 0, then clip filter will return that portion of the dataset that lies within the clip function.
If set to 1, the portions of the dataset that lie outside the clip function will be returned instead
9/29/2016
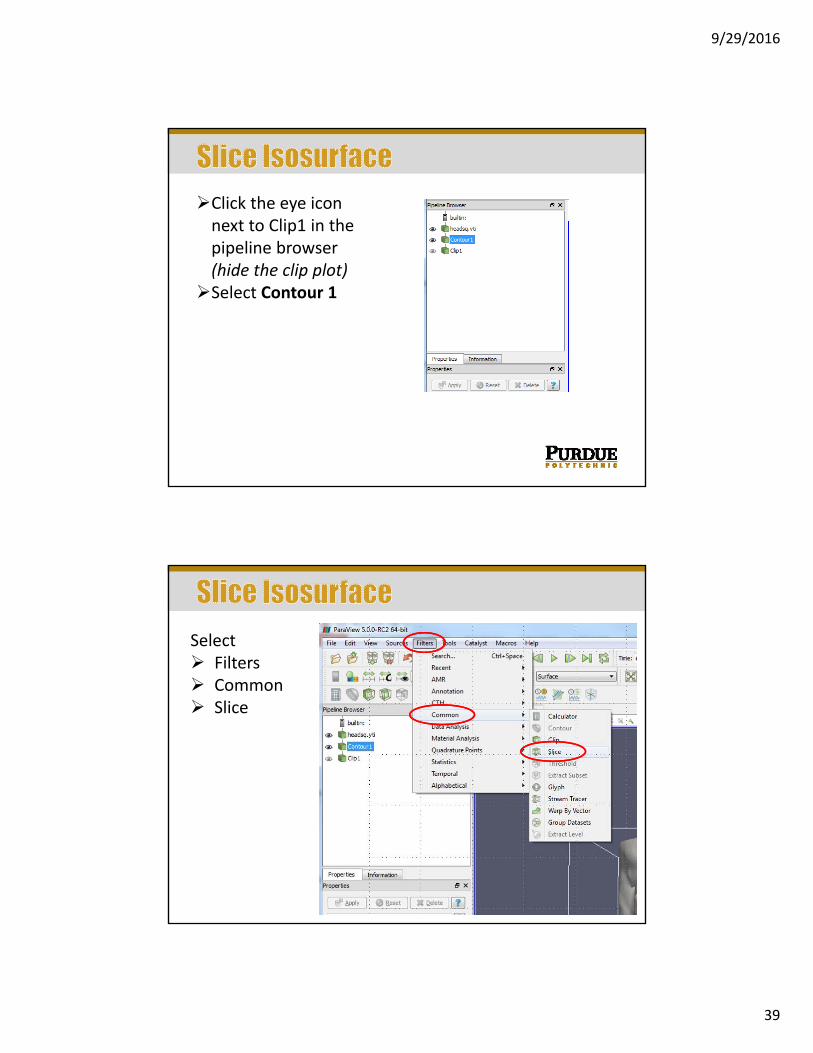
39
Click the eye icon next to Clip1 in the pipeline browser (hide the clip plot)Select Contour 1
Select Filters Common Slice
9/29/2016
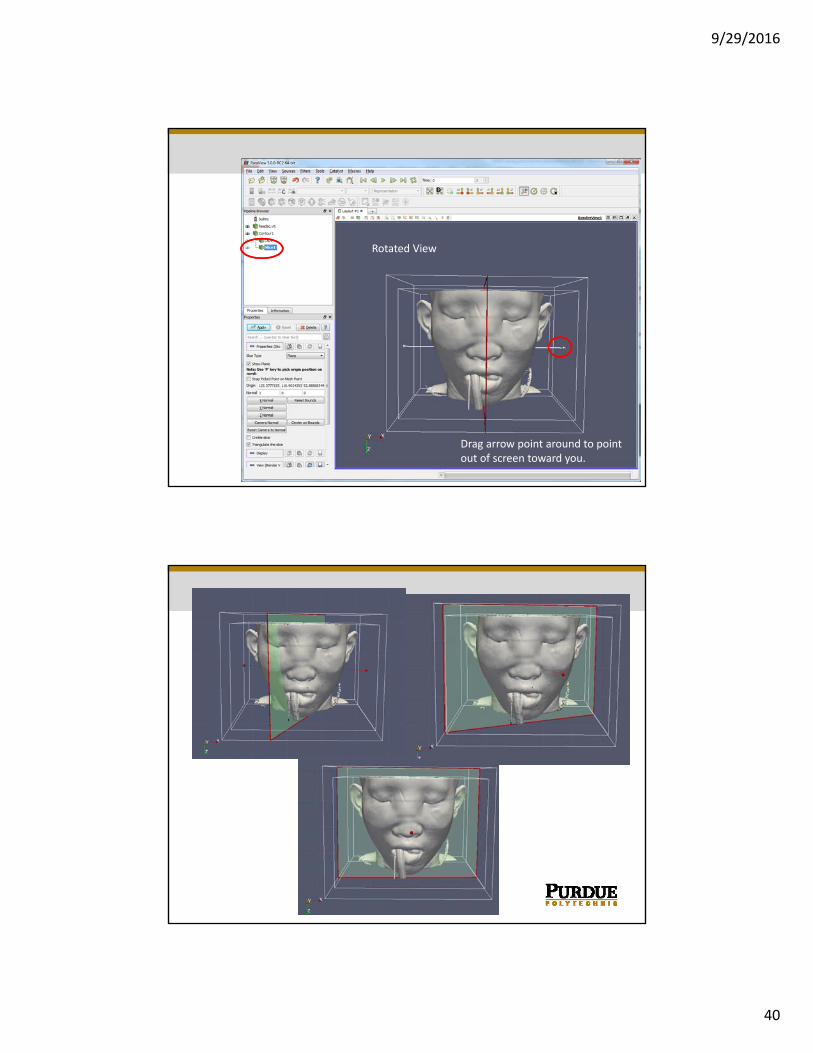
40
Rotated View
Drag arrow point around to point out of screen toward you.
9/29/2016
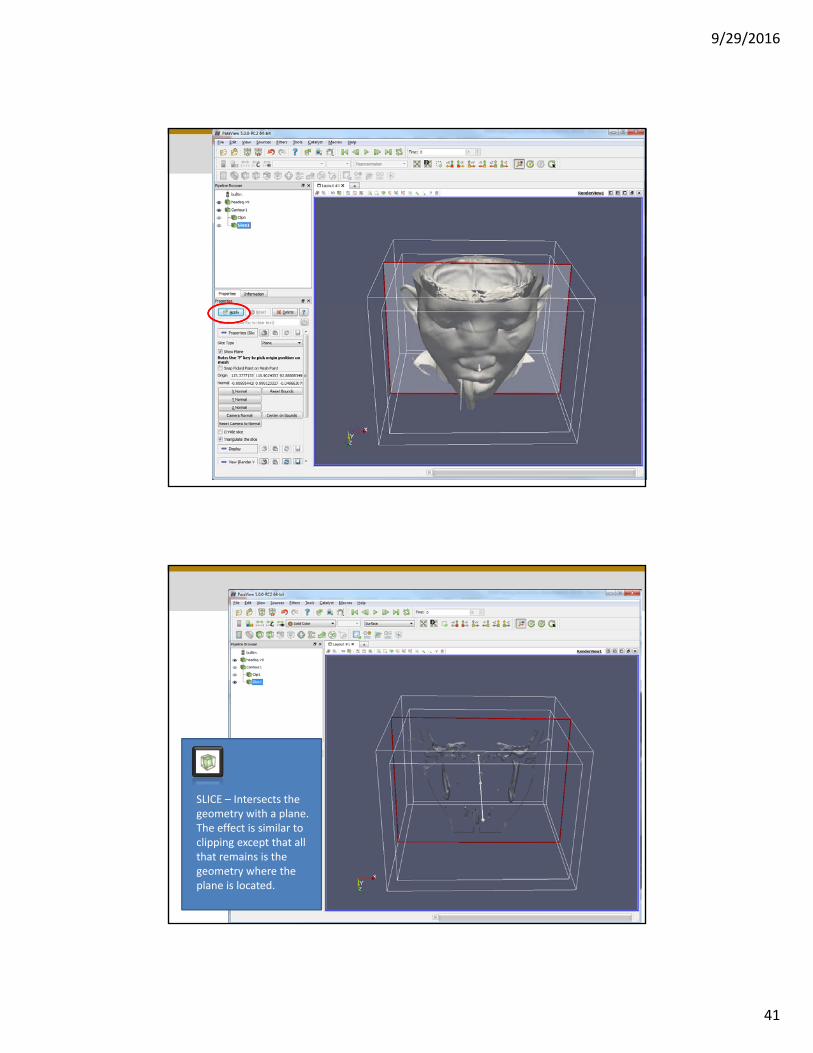
41
SLICE – Intersects the geometry with a plane. The effect is similar to clipping except that all that remains is the geometry where the plane is located.

9/29/2016
42
headsq.vtiheadsq.vti
Contour1
Clip1 Slice1
headsq.vtiheadsq.vti
Q: How do we combine
(show) the Clip and Slice views at the same time?
+
9/29/2016
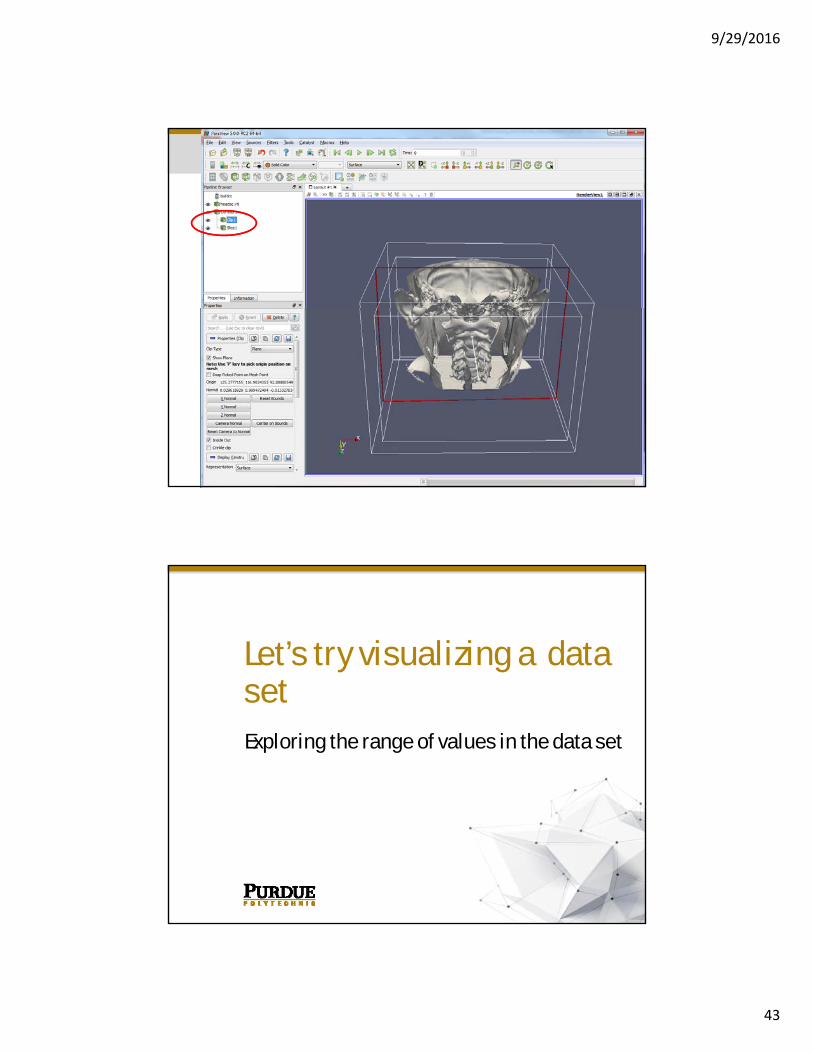
43
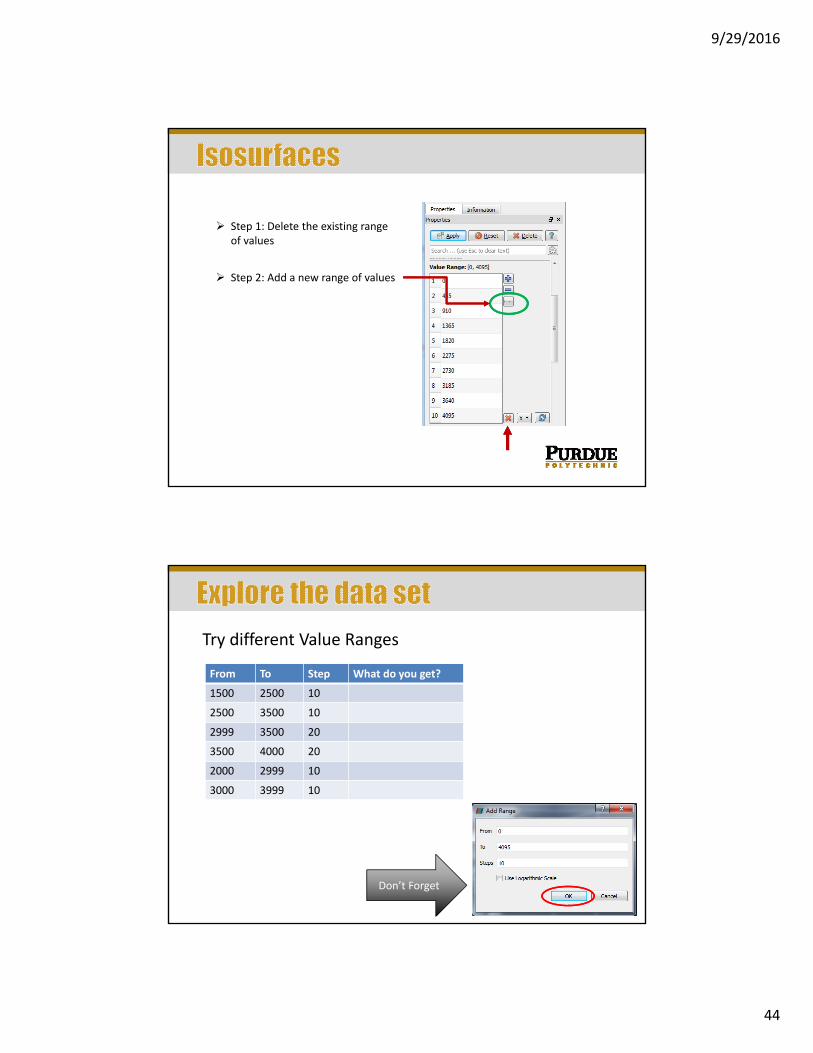
Let’s try visualizing a data setExploring the range of values in the data set
9/29/2016
44
Step 1: Delete the existing range of values
Step 2: Add a new range of values
From To Step What do you get?
1500 2500 10
2500 3500 10
2999 3500 20
3500 4000 20
2000 2999 10
3000 3999 10
Try different Value Ranges
Don’t ForgetDon’t Forget
9/29/2016
45
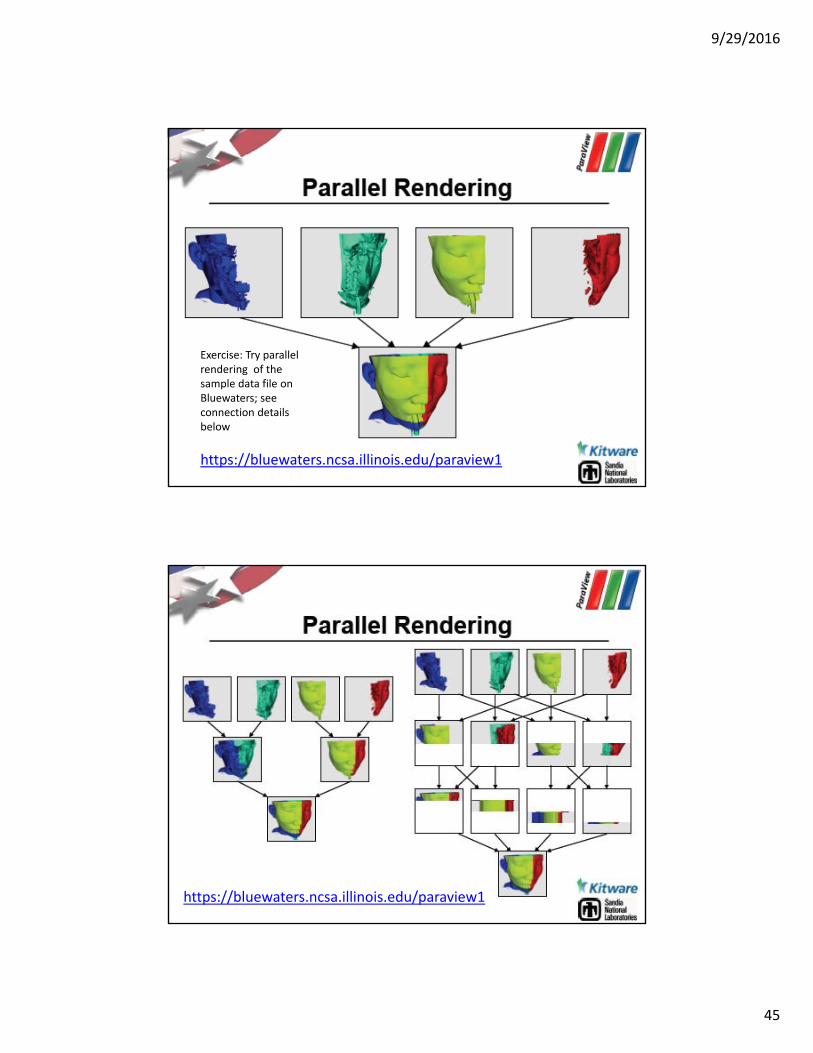
Exercise: Try parallel rendering of the sample data file on Bluewaters; see connection details below
https://bluewaters.ncsa.illinois.edu/paraview1
https://bluewaters.ncsa.illinois.edu/paraview1
9/29/2016
46
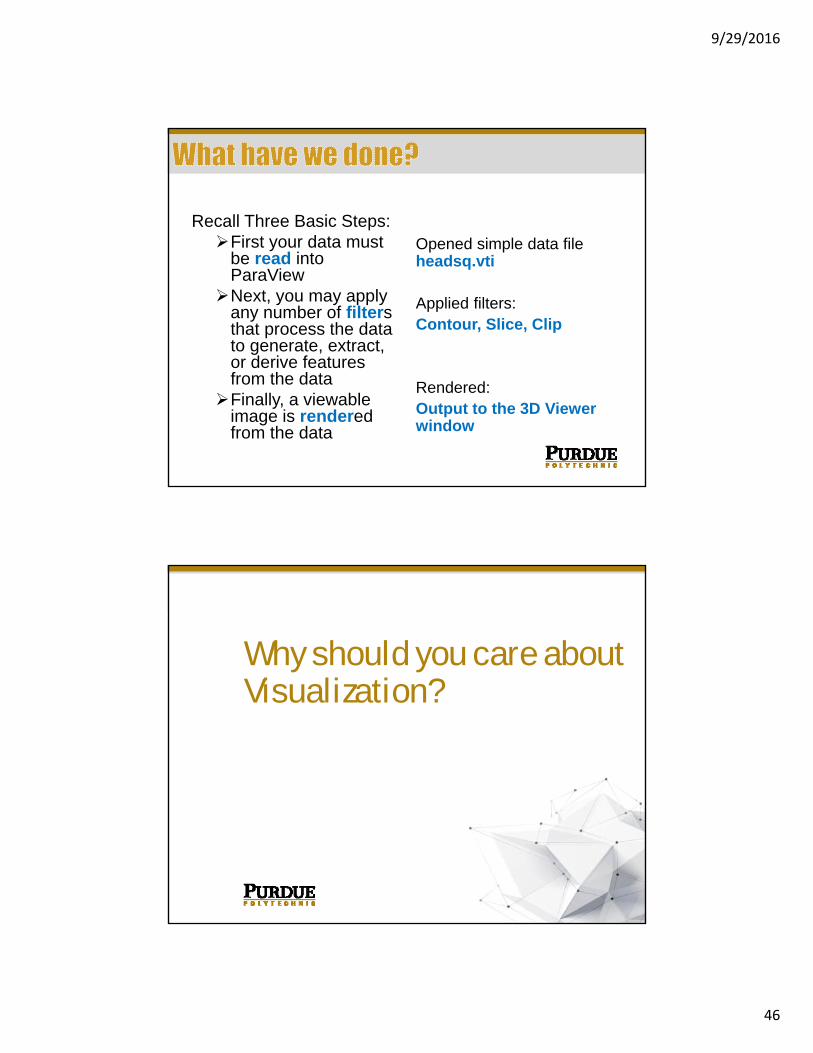
Recall Three Basic Steps:First your data must
be read into ParaViewNext, you may apply
any number of filters that process the data to generate, extract, or derive features from the dataFinally, a viewable
image is rendered from the data
Opened simple data file headsq.vti
Applied filters: Contour, Slice, Clip
Rendered: Output to the 3D Viewer window
Why should you care about Visualization?
9/29/2016
47
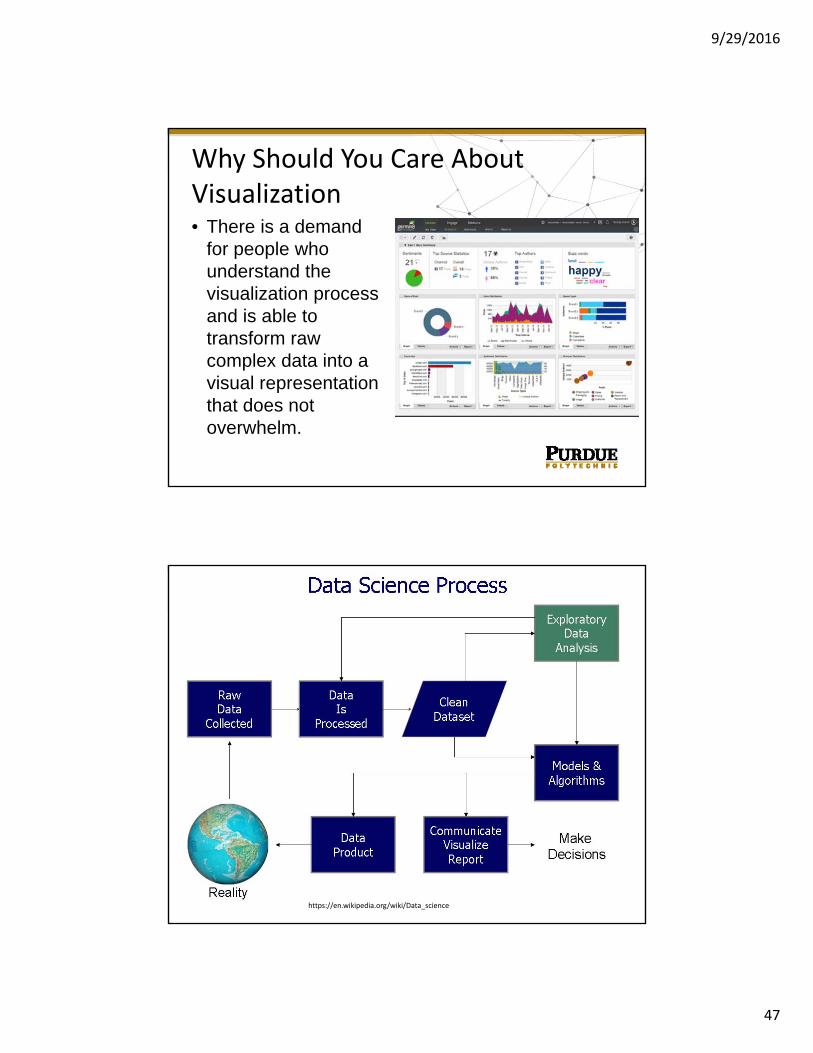
• There is a demand for people who understand the visualization process and is able to transform raw complex data into a visual representation that does not overwhelm.
Why Should You Care About Visualization
https://en.wikipedia.org/wiki/Data_science
9/29/2016
48
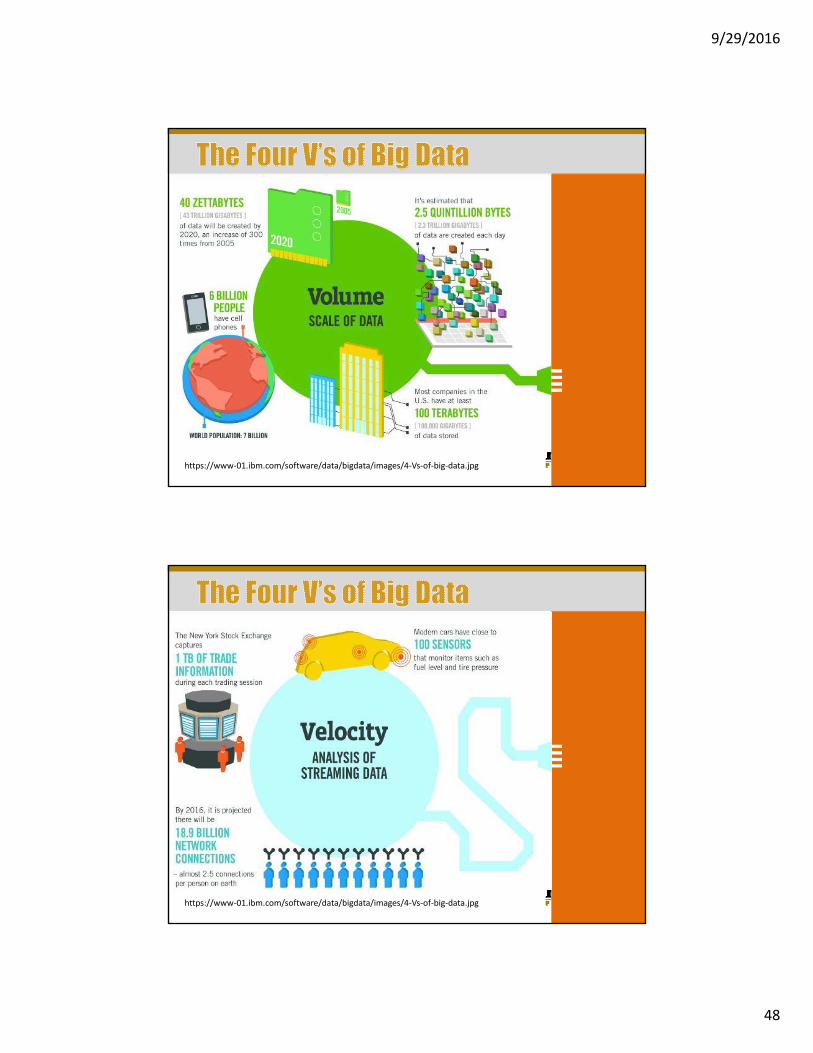
https://www‐01.ibm.com/software/data/bigdata/images/4‐Vs‐of‐big‐data.jpg
https://www‐01.ibm.com/software/data/bigdata/images/4‐Vs‐of‐big‐data.jpg
9/29/2016
49
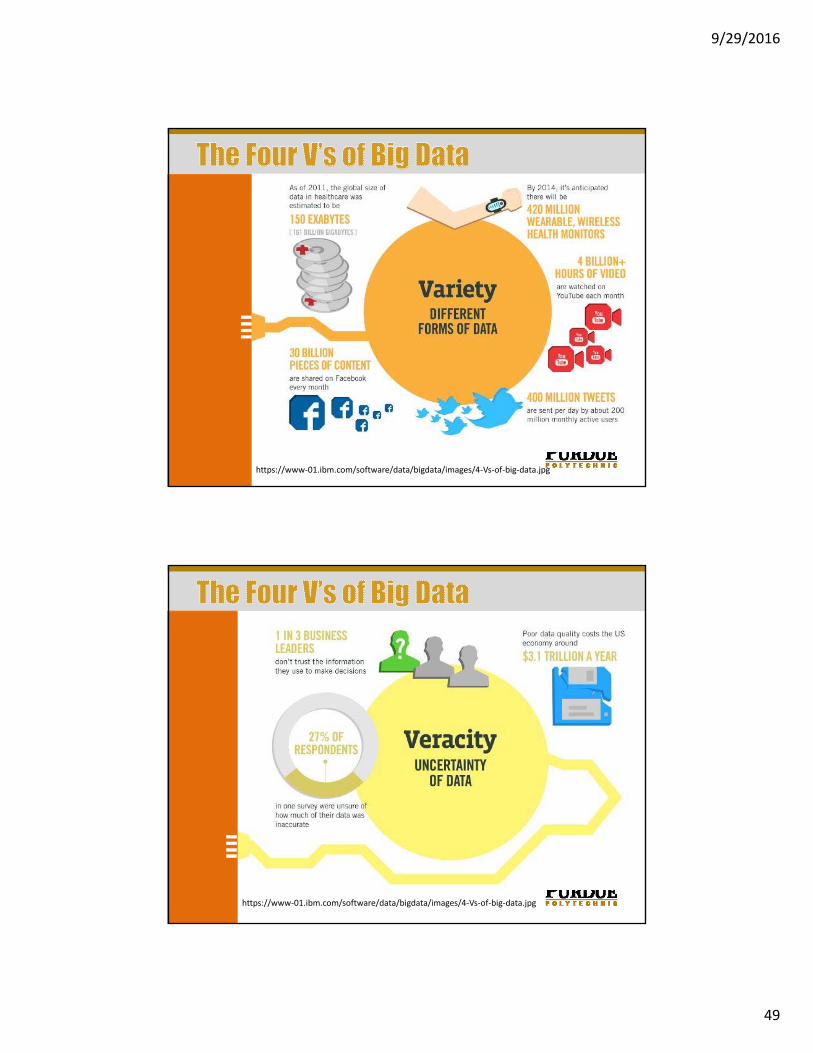
https://www‐01.ibm.com/software/data/bigdata/images/4‐Vs‐of‐big‐data.jpg
https://www‐01.ibm.com/software/data/bigdata/images/4‐Vs‐of‐big‐data.jpg
9/29/2016
50
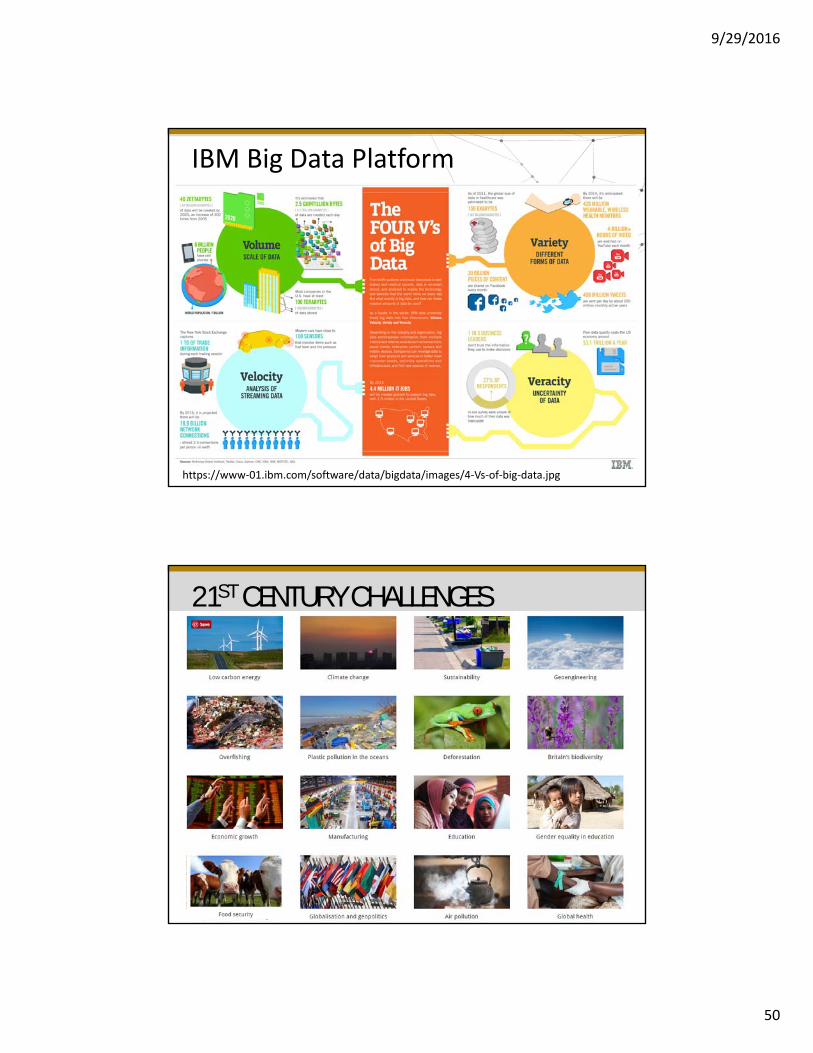
IBM Big Data Platform
https://www‐01.ibm.com/software/data/bigdata/images/4‐Vs‐of‐big‐data.jpg
21ST CENTURY CHALLENGES
9/29/2016
51
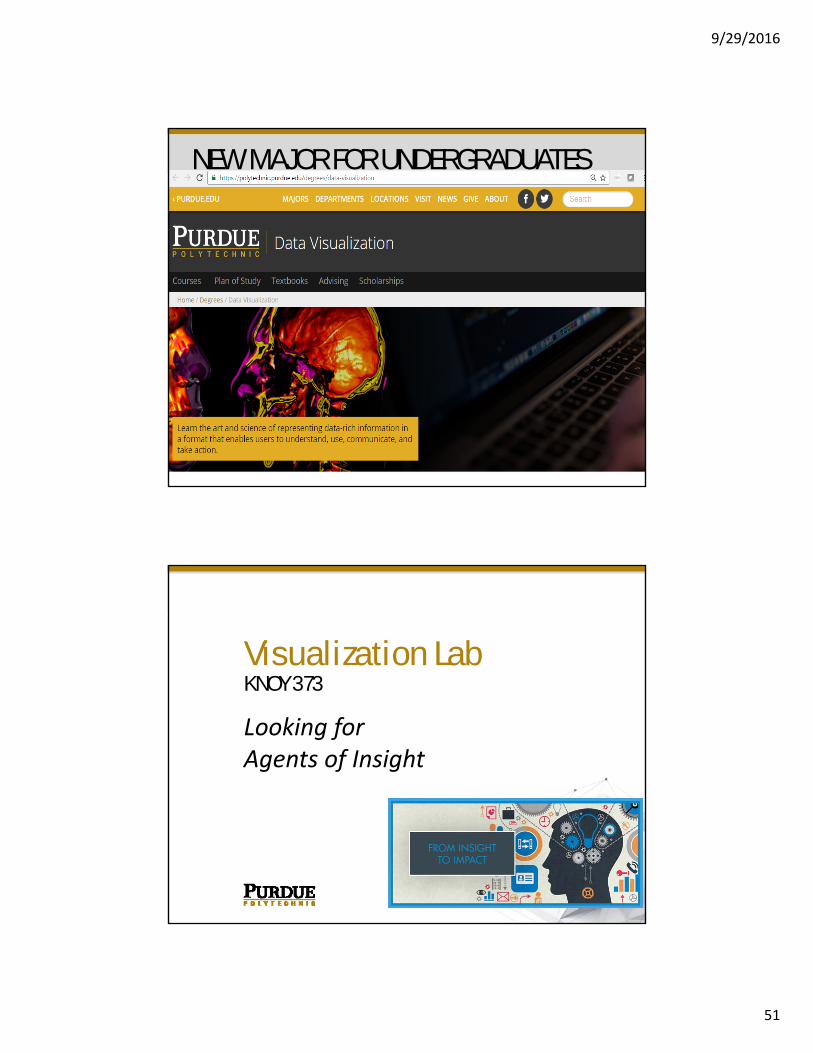
NEW MAJOR FOR UNDERGRADUATES
Visualization LabKNOY 373
Looking for Agents of Insight
9/29/2016
52
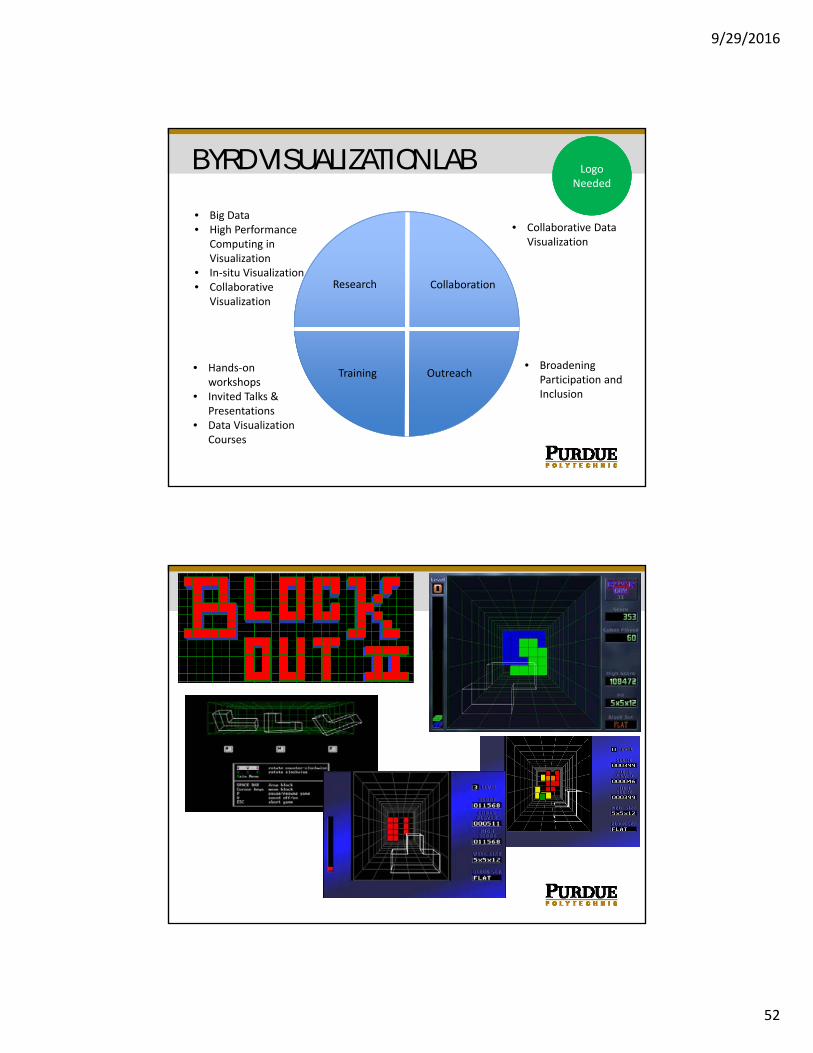
BYRD VISUALIZATION LAB Logo Needed Logo
Needed
Research Collaboration
Training Outreach
• Big Data• High Performance
Computing in Visualization
• In‐situ Visualization• Collaborative
Visualization
• Hands‐on workshops
• Invited Talks & Presentations
• Data Visualization Courses
• Broadening Participation and Inclusion
• Collaborative Data Visualization
9/29/2016
53
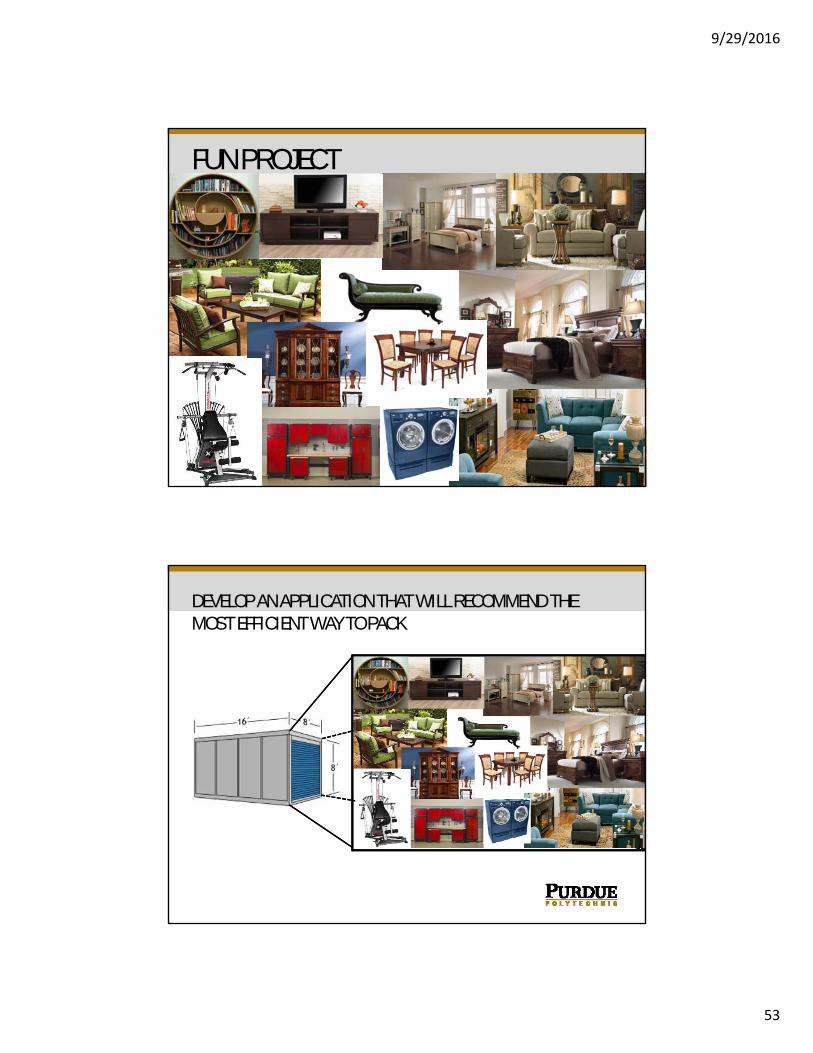
FUN PROJECT
DEVELOP AN APPLICATION THAT WILL RECOMMEND THE MOST EFFICIENT WAY TO PACK
9/29/2016
54
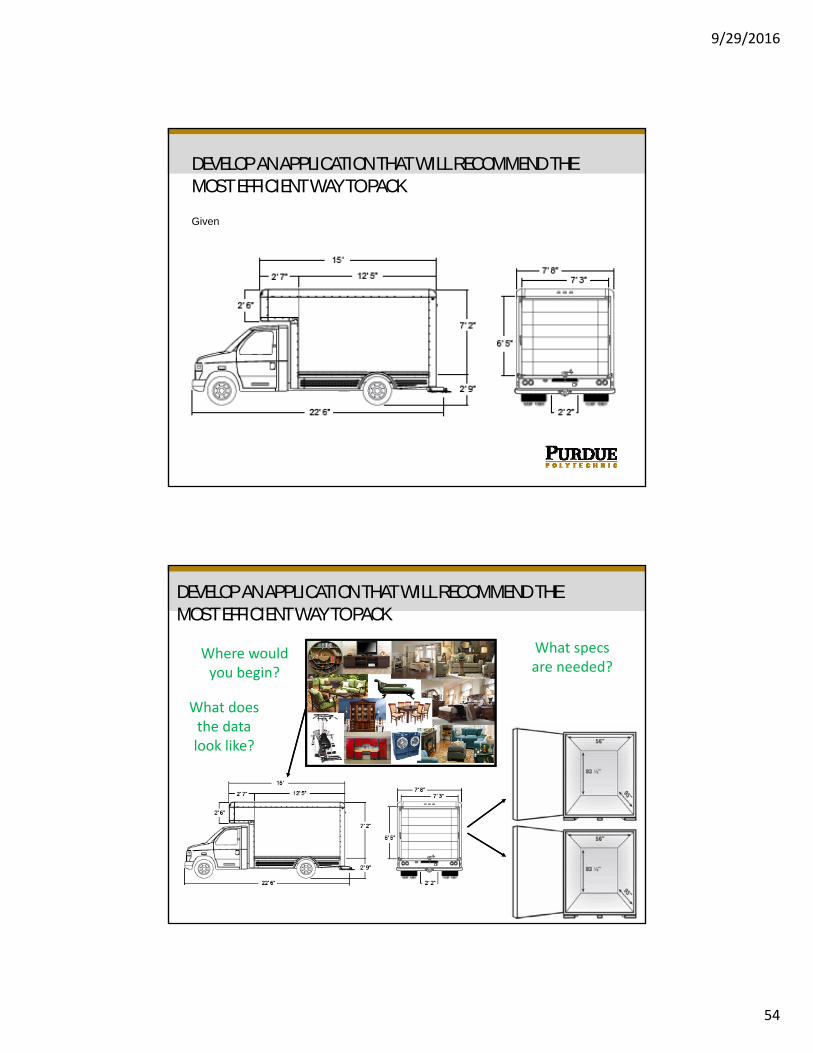
Given
DEVELOP AN APPLICATION THAT WILL RECOMMEND THE MOST EFFICIENT WAY TO PACK
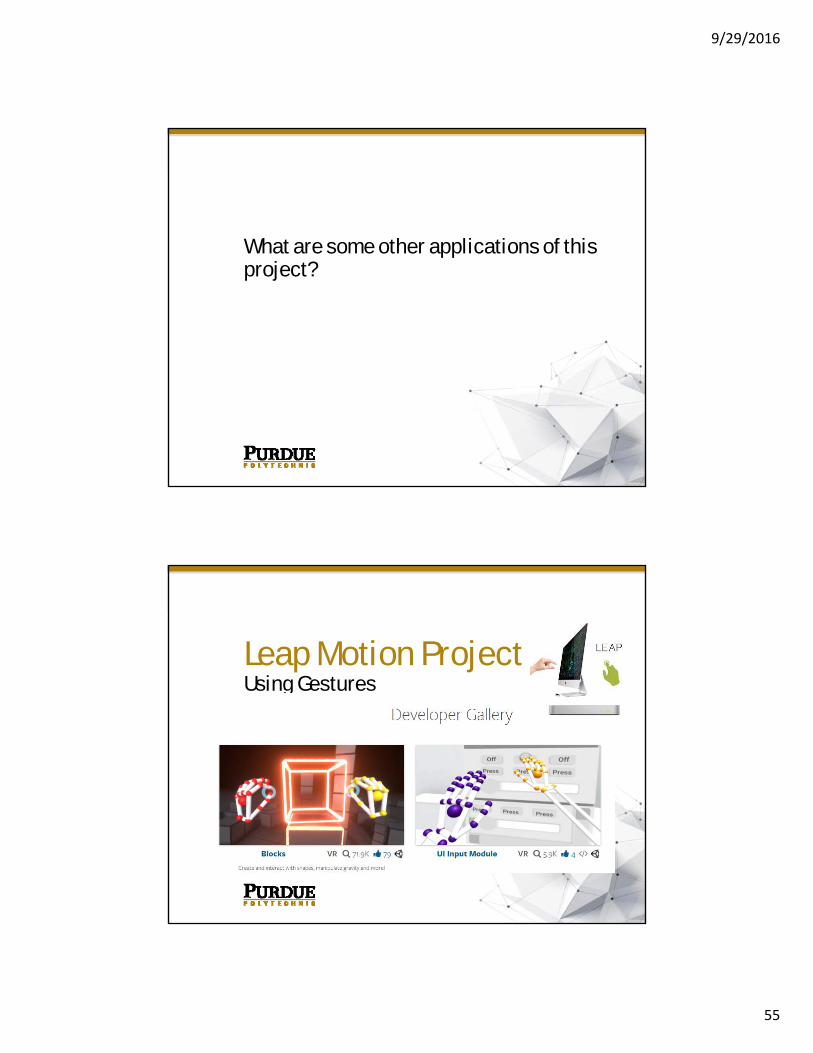
DEVELOP AN APPLICATION THAT WILL RECOMMEND THE MOST EFFICIENT WAY TO PACK
What does the data look like?
What specs are needed?
Where would you begin?
9/29/2016
55
What are some other applications of this project?
Leap Motion ProjectUsing Gestures
9/29/2016
56
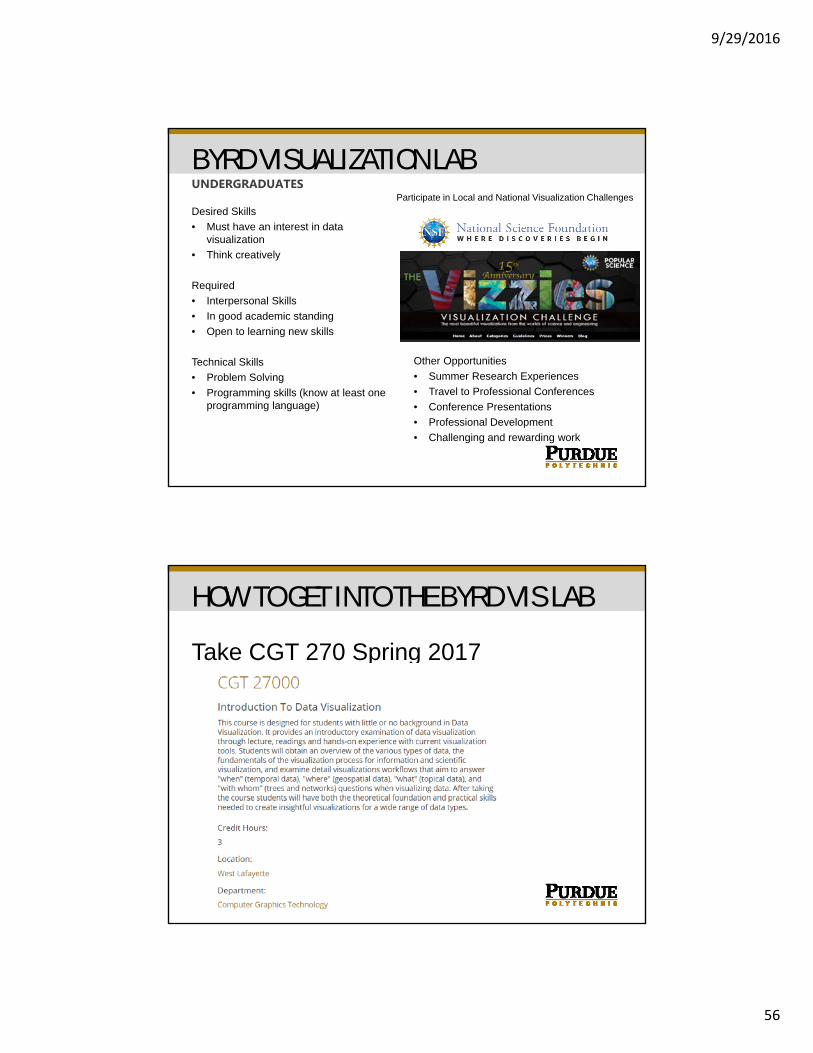
Desired Skills
• Must have an interest in data visualization
• Think creatively
Required
• Interpersonal Skills
• In good academic standing
• Open to learning new skills
Technical Skills
• Problem Solving
• Programming skills (know at least one programming language)
BYRD VISUALIZATION LABUNDERGRADUATES
Participate in Local and National Visualization Challenges
Other Opportunities
• Summer Research Experiences
• Travel to Professional Conferences
• Conference Presentations
• Professional Development
• Challenging and rewarding work
Take CGT 270 Spring 2017
HOW TO GET INTO THE BYRD VIS LAB
9/29/2016
57
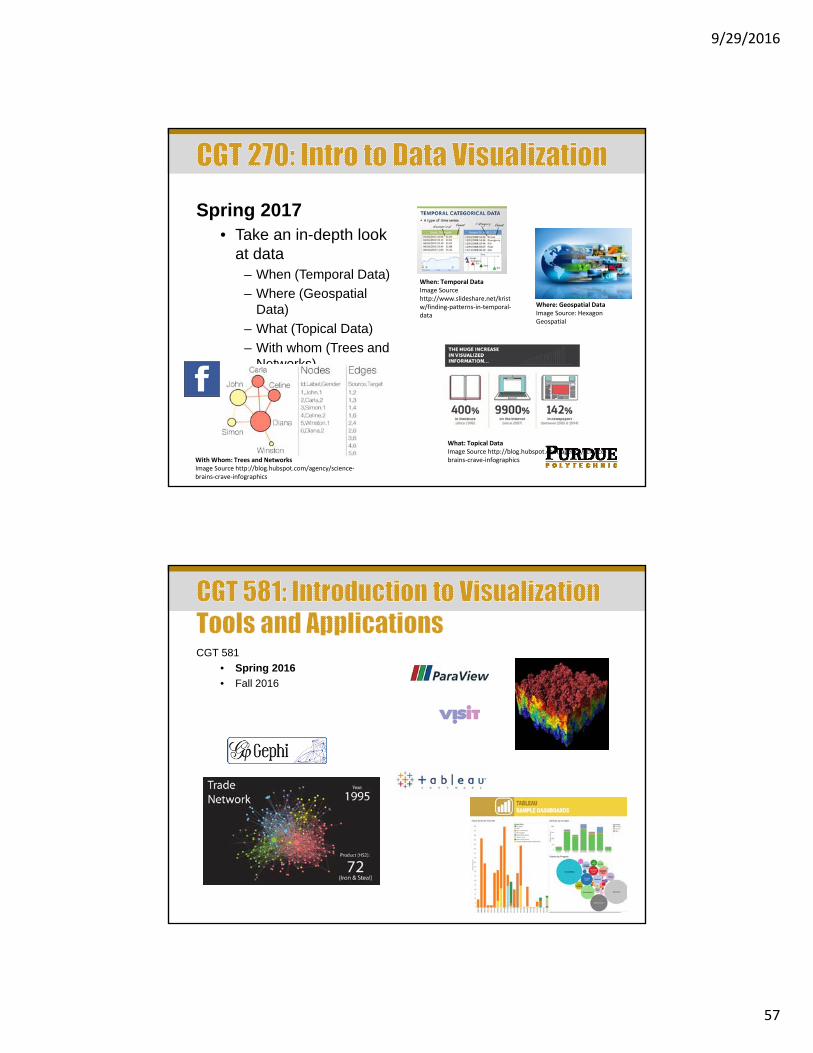
Spring 2017• Take an in-depth look
at data– When (Temporal Data)
– Where (Geospatial Data)
– What (Topical Data)
– With whom (Trees and Networks)
Where: Geospatial DataImage Source: Hexagon Geospatial
When: Temporal DataImage Source http://www.slideshare.net/kristw/finding‐patterns‐in‐temporal‐data
What: Topical DataImage Source http://blog.hubspot.com/agency/science‐brains‐crave‐infographicsWith Whom: Trees and Networks
Image Source http://blog.hubspot.com/agency/science‐brains‐crave‐infographics
CGT 581
• Spring 2016
• Fall 2016
9/29/2016
58
Stop by and see me!
KNOY 371Office Hours: Monday’s 10 AM – 11 AMORBy Appointment
Vetria L. Byrd
Assistant Professor
Computer Graphics Technology
Purdue Polytechnic Institute
https://polytechnic.purdue.edu/profile/vbyrdhttp://web.ics.purdue.edu/~vbyrd/@VByrdPhD, @BPViz, @VisREU
Thank You Image Source:http://careerconfidential.com/category/thank‐you‐notes/http://careerconfidential.com/wp‐content/uploads/2015/02/ThankYou2.jpg