introduction to cdm and project development dr. b.m.s. batagoda presented at the workshop organized...
TRANSCRIPT
Introduction to CDM and project development
Dr. B.M.S. Batagoda
Presented at the workshop organized by the Ministry of Environment and Natural resources and
the World Bank on 16th February 2007 in Colombo, Sri Lanka

Climate Change CO2 concentration of the atmosphere in the
year 1750 was 280 ppm and at present 360 ppm
By year 2100, projected CO2 concentration is about 540 to 970 ppm
Global average temperature is projected to increase by 1.4 to 5.80 C over the period 1990 to 2100
Fossil fuel burning will be the dominant influence on the atmospheric concentration of CO2
Source: IPCC

What is global warming ?
The effect of heat trapping due to the increasing presence of green house gases (i.e. Carbon dioxide, methane, nitrous oxides, chlorofluorocarbons, hydro-chlorofluorocarbons) in the earth atmosphere is known as greenhouse effect or global warming

. . .

Per capita emissions in South Asian countries in comparison to USA
Country Per Capita emissions (carbon tons )
1990 1996
USA 5.18 5.37
Bangladesh 0.04 0.05
Bhutan 0.02 0.04
India 0.22 0.29
Maldives 0.19 0.31
Nepal 0.01 0.02
Pakistan 0.16 0.18
Sri Lanka 0.06 0.11

UN Climate Change Convention adopted at Rio Summit,1992
Objectives of the UNFCCC
Stabilize the atmospheric greenhouse gases at a level that would prevent dangerous anthropogenic interference with the climatic system.
Sri Lanka became a member in 1994. Ratified 186 countries.
Kyoto Protocol
Major objective“Industrialized countries should
reduce their combined GHG emission by at least 5% compared to their emission levels in 1990 , during the period 2008-2012”.
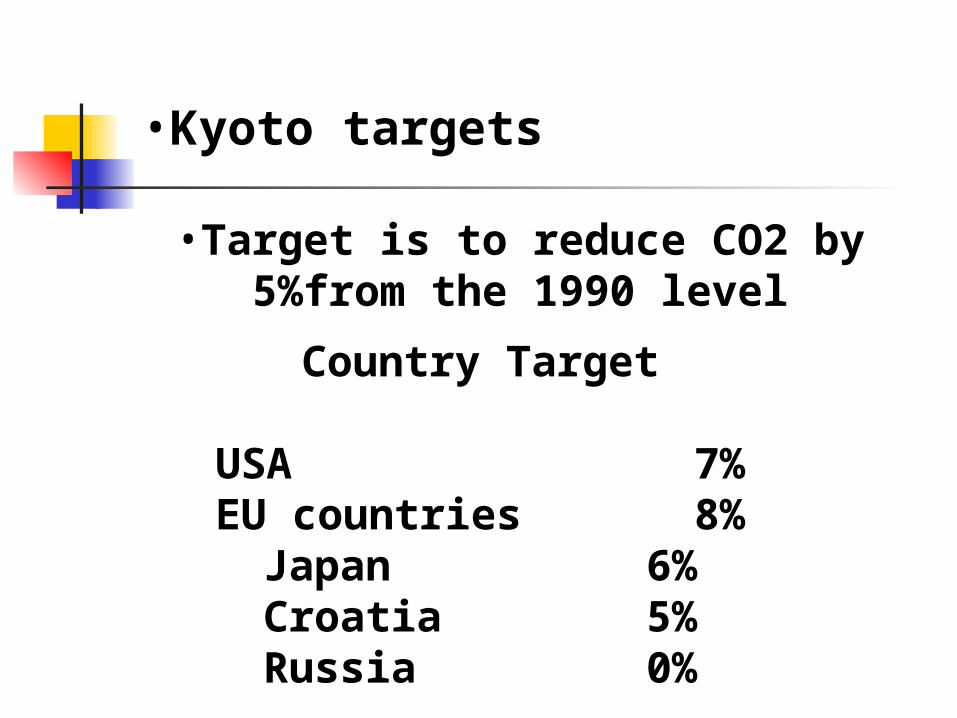
•Kyoto targets
•Target is to reduce CO2 by 5%from the 1990 level
Country Target
USA 7%EU countries 8%
Japan 6%Croatia 5%Russia 0%

C lean D evelopm ent M echanismP ro je c ts in d e ve lo p ing co u n tries
- S u s ta in ab le D e ve lo p m e n t O b je c tive
Joint Im plem entationP ro je c ts be tw e e n co u n trie s w ith ta rg e ts
(A n n e x 1 co u n trie s)
In ternational Em issions TradingB e tw e en co u n trie s w ith ta rg e ts
(A n n e x 1 )
K yoto M echan ism s

Clean Development Mechanism
Implementing projects in developing countries, that reduce emissions of GHG or absorb GHG from the atmosphere and sell the amount avoided or absorbed to developed countries

Potential sectors
Two types of projects: Emission avoidance projects GHG Removal or sink projectsSectors Energy Industrial Agriculture Waste sector Forestry

Example - Power sector CDM project
- Coal power plant generate 1140 g CO2/kWh - Natural Gas Plant generates 360 g CO2 /KWh
Difference is 780 g if power generated using Natural Gas instead of Coal
This 780 g can be sold as CDM credits

Transport sector CDM project
- Diesel Vehicle emits 3.14 kg CO2/kg Fuel
- NG Vehicle emit 2.75 kgCO2/kg Fuel
Difference is 0.39 kgCO2/kg Fuel
This 0.39 kgCO2 can be sold as CDM

Landfill gas recovery CDM project
Baseline emissions = 1 tCH4 /year
(without CDM) = 1 x 21(GWP) tCO2/ year
= 21 tCO2/ year
Project scenario = 1 tCH4 – After flared 2.75 CO2
(with CDM) = 2.75 tCO2 /year
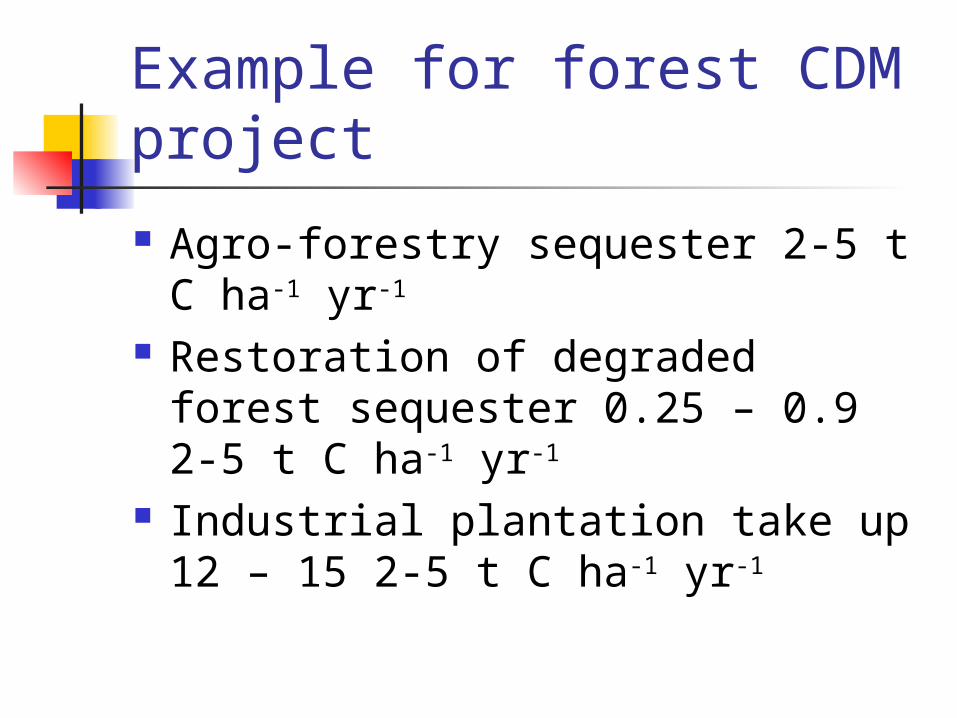
Example for forest CDM project
Agro-forestry sequester 2-5 t C ha-1 yr-1
Restoration of degraded forest sequester 0.25 – 0.9 2-5 t C ha-1 yr-
1
Industrial plantation take up 12 – 15 2-5 t C ha-1 yr-1

International
Market

Annual Volumes (tCO2) of Project-Based Emission Reductions Traded (Up to 2012 vintages)
Year Total Project -Based
Transactions
Compliance Voluntary Retail
1998 17,976,538 0 17,907,448 69,090
1999 35,423,491 0 35,265,724 157,767
2000 17,094,425 387,933 16,507,407 199,085
2001 13,004,103 4,724,591 8,161,652 117,860
2002 28,776,967 14,676,748 13,893,209 207,010
2003 77,641,815 70,429,780 6,773,367 438,669
2004 107,010,089 104,600,758 2,299,050 110,281
2005 (Jan-April) 42,863,095 39,823,182 2,995,000 44,913
Total 339,790,524234,642,9
92103,802,8
56 1,344,675

Annual Volume (Million tCO2) of Project Based Emission Reductions Traded (Up to 2012 vintages)
020
4060
80100
120
1998 1999 2000 2001 2002 2003 2004 2005 (Jan-April)
Mill
ions

Market Byers - Jan.2003-Dec.2004
Japan, 29%
Gov.Netherlands, 22%
UK, 6%
Other EU, 30%
New Zealand, 3%
Canada, 6%
Australia, 1%
USA, 3%
Market Buyers-Jan.2004-April 2005
Japan, 21%
Gov.Netherlands, 16%
UK, 12%Other EU, 32%
New Zealand, 7%
Canada, 5%
Australia, 3%
USA, 4%
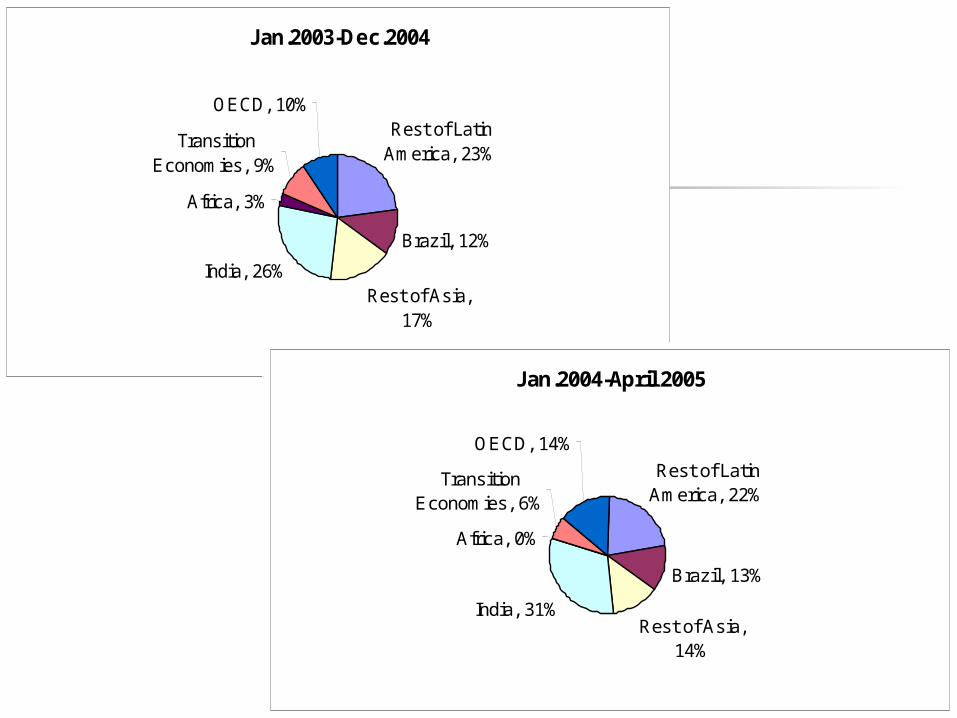
Jan.2003-Dec.2004
Rest of Latin America, 23%
Brazil, 12%
Rest of Asia, 17%
India, 26%
Africa, 3%
Transition Economies, 9%
OECD, 10%
Jan.2004-April 2005
Rest of Latin America, 22%
Brazil, 13%
Rest of Asia, 14%
India, 31%
Africa, 0%
Transition Economies, 6%
OECD, 14%

Technolgy Share of Emission Reduction Projects - Jan.2003-Dec.2004
Landfill Gas Capture, 16%
Hydro, 9%
Wind, 8%
Biomass, 14%Forestry, 4%
HFC, 23%
N2O, 3%
Other, 8%
Energy Efficiency, 3%
Animal Waste, 12%
Technology Share of Emission Reduction Projects - Jan.2004-April 2005
Landfill Gas Capture, 10%
Hydro, 12%
Wind, 7%
Biomass, 11%
Animal Waste, 18%
Energy Efficiency, 2%
Forestry, 4%
HFC, 25%
N2O, 4%
Other, 7%

Sri Lanka
Market

Table 1: Annual tCO2 abetment (sector wise)
Hydro, 265625
Wind, 1290000
Bio Mass, 695212
Organicwaste treatment,
244000
Forestry, 803166
other, 1686000
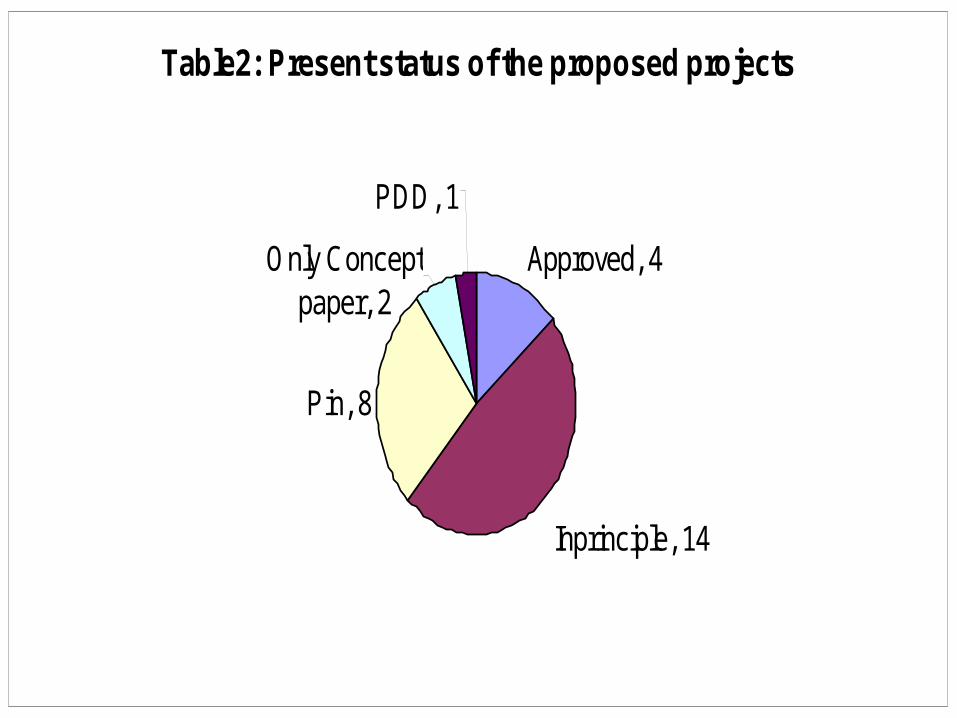
Table2: Present status of the proposed projects
Approved, 4
Inprinciple, 14
Pin, 8
Only Concept paper, 2
PDD, 1
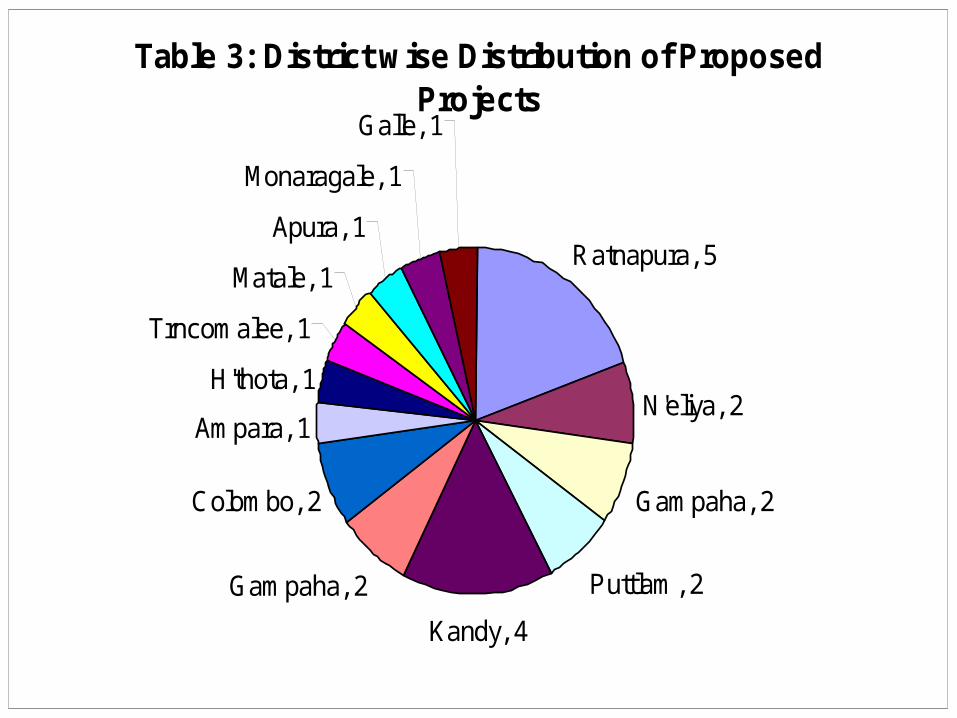
Table 3: District wise Distribution of Proposed Projects
Ratnapura, 5
N'eliya, 2
Gampaha, 2
Puttlam, 2
Kandy, 4
Gampaha, 2
Colombo, 2
Ampara, 1
H'thota, 1
Trncomalee, 1
Matale, 1
Apura, 1
Monaragale, 1
Galle, 1

Current CDM Buyers Bio-carbon Fund –World bank $100 m European Bank for Reconstruction and Development $ 100 m Denmark JI/CDM Fund E 100 M Development Bank of Japan $ 100 m Japan Bank for International Corporation $ 100 m
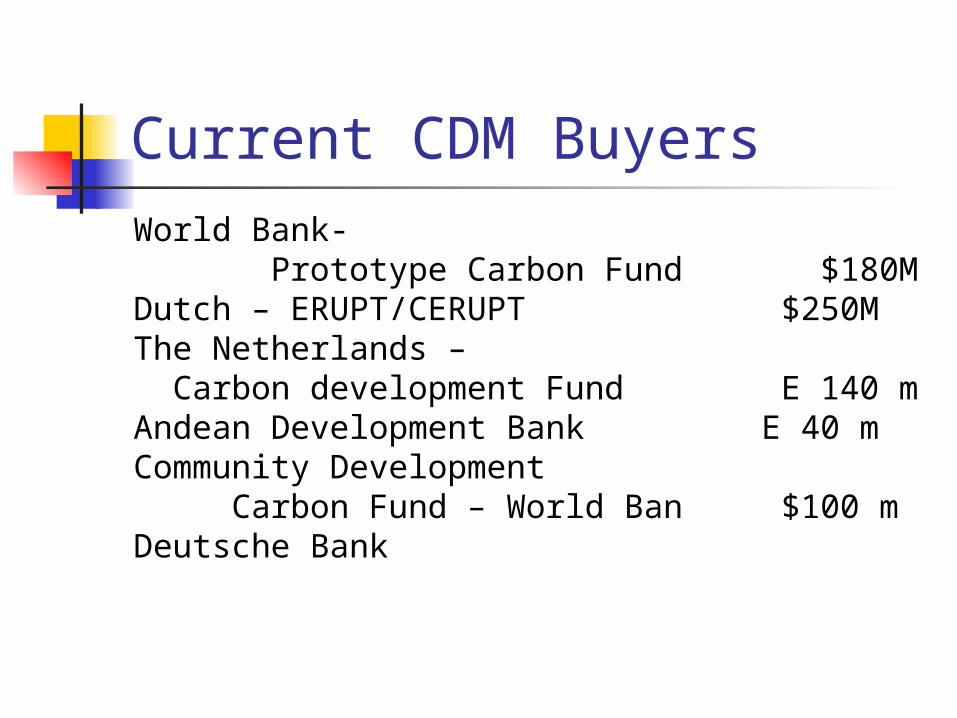
Current CDM Buyers
World Bank- Prototype Carbon Fund $180M Dutch – ERUPT/CERUPT $250MThe Netherlands – Carbon development Fund E 140 mAndean Development Bank E 40 mCommunity Development Carbon Fund – World Ban $100 mDeutsche Bank
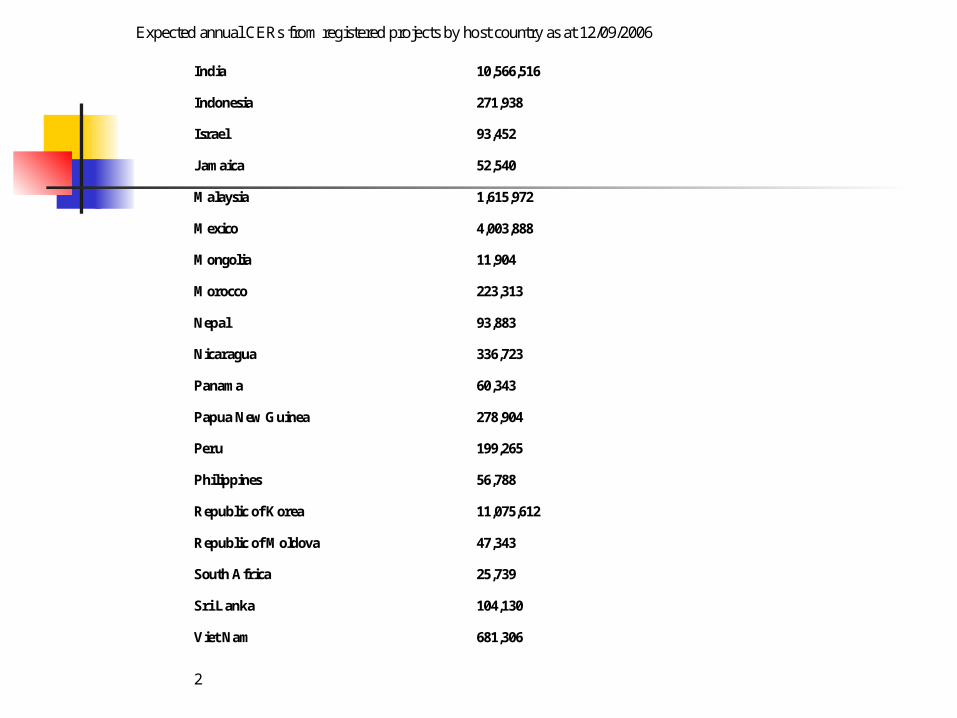
India 10,566,516
Indonesia 271,938
Israel 93,452
Jamaica 52,540
Malaysia 1,615,972
Mexico 4,003,888
Mongolia 11,904
Morocco 223,313
Nepal 93,883
Nicaragua 336,723
Panama 60,343
Papua New Guinea 278,904
Peru 199,265
Philippines 56,788
Republic of Korea 11,075,612
Republic of Moldova 47,343
South Africa 25,739
Sri Lanka 104,130
Viet Nam 681,306
2
Expected annual CERs from registered projects by host country as at 12/09/2006
Lead time
The lead time for new CDM projects is four to five years
The ability to shorten project lead times appears to be very limited
Project developers have an economic incentive to get their project into operation as quickly as possible.

Economic viability
To be economically viable a CDM project should reduce emissions by at least 100
000 tC02e per year (IETA/World Bank 2005)
The average size of existing and identified projects is over 150000 tCOze per year

CER demand
Foreign direct investment (FDI) in developing countries averaged $140 billion per year during 1997-2002 and often varied by more than $10 billion from one year to the next.
The annual demand for CERs during 2008-2012 is estimated to be 250 MtC02e (range 50 to 500 MtC02e) and a market price for Kyoto units of about $11.40/tCOze in 2010 (range $1.00 to $33.00/tCOze).
Due to five year lead time the CDM would be limited to existing project ideas, which would yield an annual supply of 50 to 90 MtC02e.
A significant acceleration in the flow of new projects in 2008 could strain the capacity of the designated operational entities and the Executive Board.
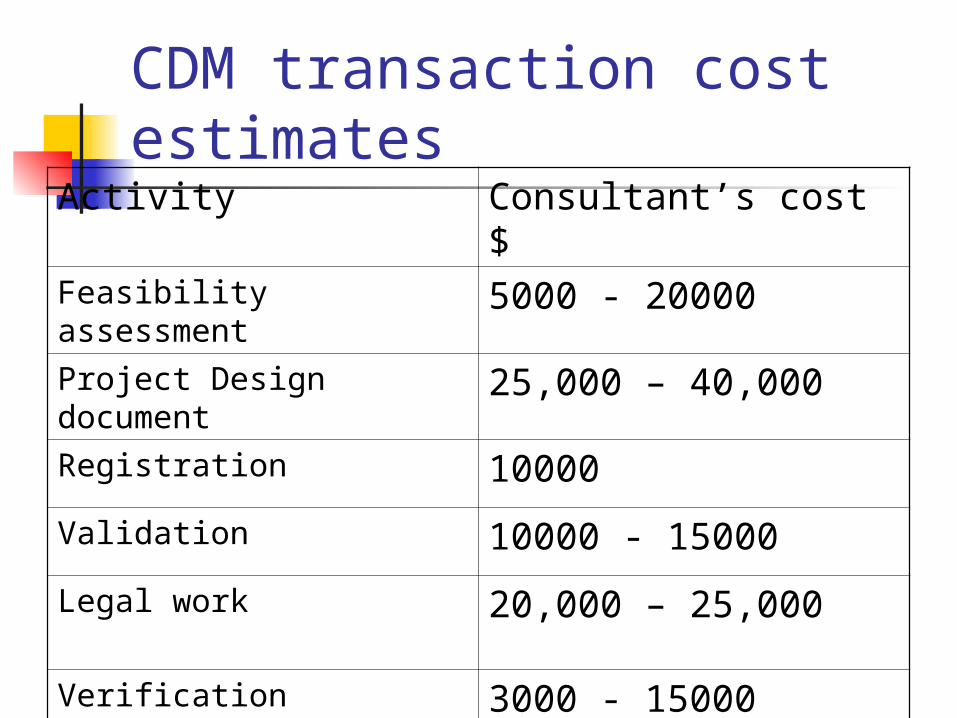
CDM transaction cost estimates
Activity Consultant’s cost $
Feasibility assessment 5000 - 20000
Project Design document 25,000 – 40,000
Registration 10000
Validation 10000 - 15000
Legal work 20,000 – 25,000
Verification 3000 - 15000
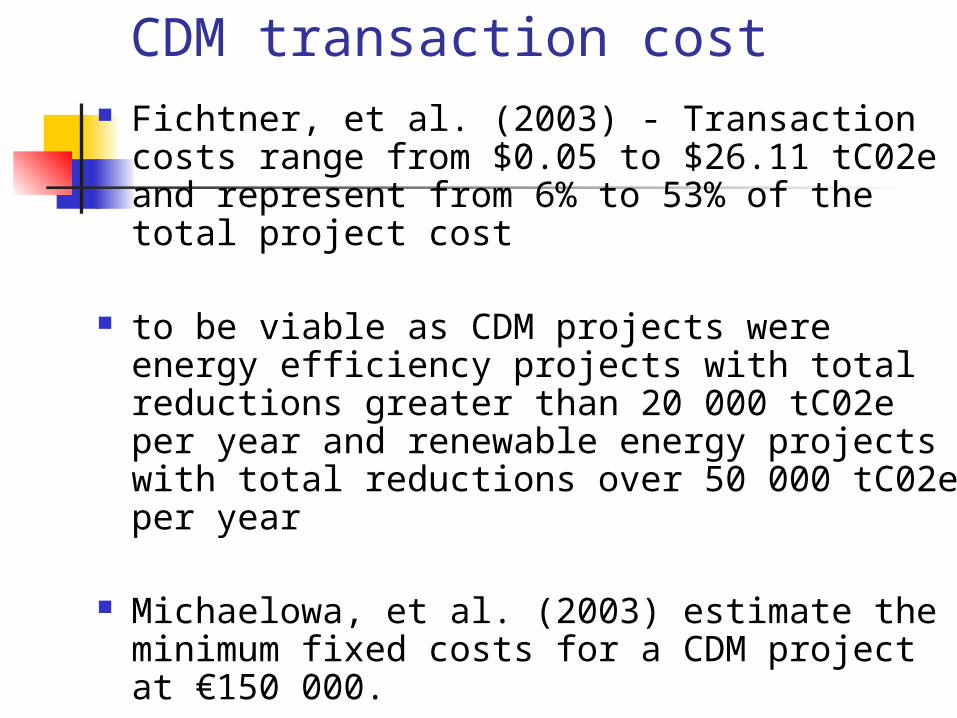
CDM transaction cost Fichtner, et al. (2003) - Transaction costs
range from $0.05 to $26.11 tC02e and represent from 6% to 53% of the total project cost
to be viable as CDM projects were energy efficiency projects with total reductions greater than 20 000 tC02e per year and renewable energy projects with total reductions over 50 000 tC02e per year
Michaelowa, et al. (2003) estimate the minimum fixed costs for a CDM project at €150 000.

Transaction cost The Prototype Carbon Fund estimates the
transaction costs at approximately $250 000.
Shell believes transaction costs should not exceed 25% of the price
Fichtner, et al. finds that transaction costs represent 13% of the total cost for energy efficiency projects and 20% for renewable energy projects
Michaelowa, et al. finds that transaction costs average 20.5% for energy efficiency projects and 14.4% for renewable projects with some decline over time
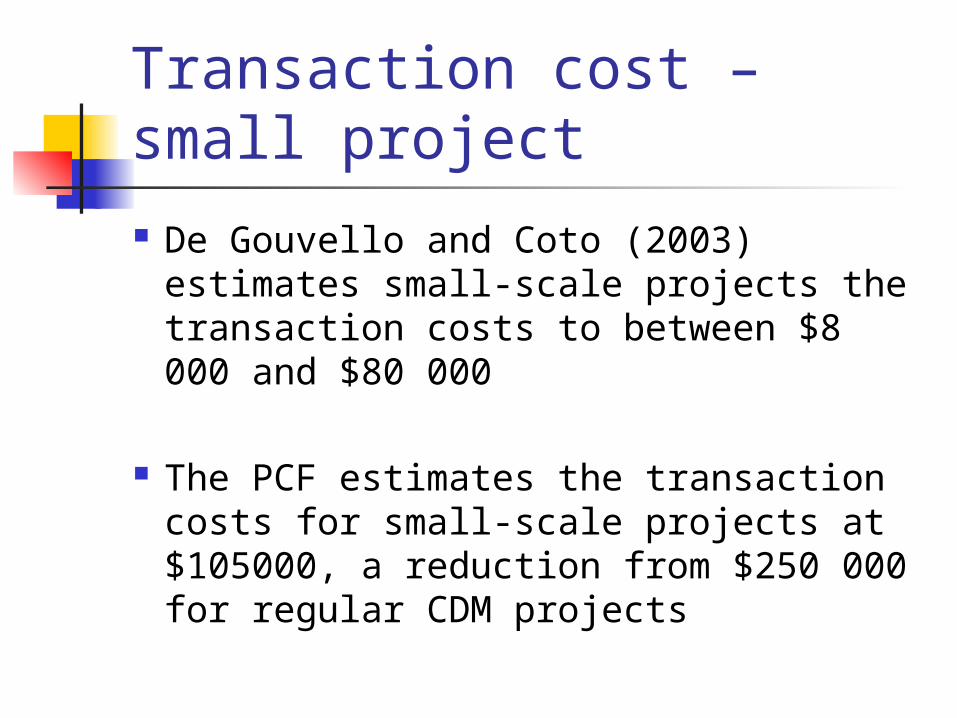
Transaction cost –small project
De Gouvello and Coto (2003) estimates small-scale projects the transaction costs to between $8 000 and $80 000
The PCF estimates the transaction costs for small-scale projects at $105000, a reduction from $250 000 for regular CDM projects

Figure 2 - CDM Project Activity Cycle
Validation/registration
Monitoring
Verification/certification
Issuance
EB
DOE
Project Participants
Executive Board of the CDM (EB)
Design Operational Entity (DOE)
Designated National Authority for the CDM
Project ParticipantsDesign
DOE
EB& COP/MOP
An Applicant
Entity
Certified Emission Reductions
Accreditation/designation
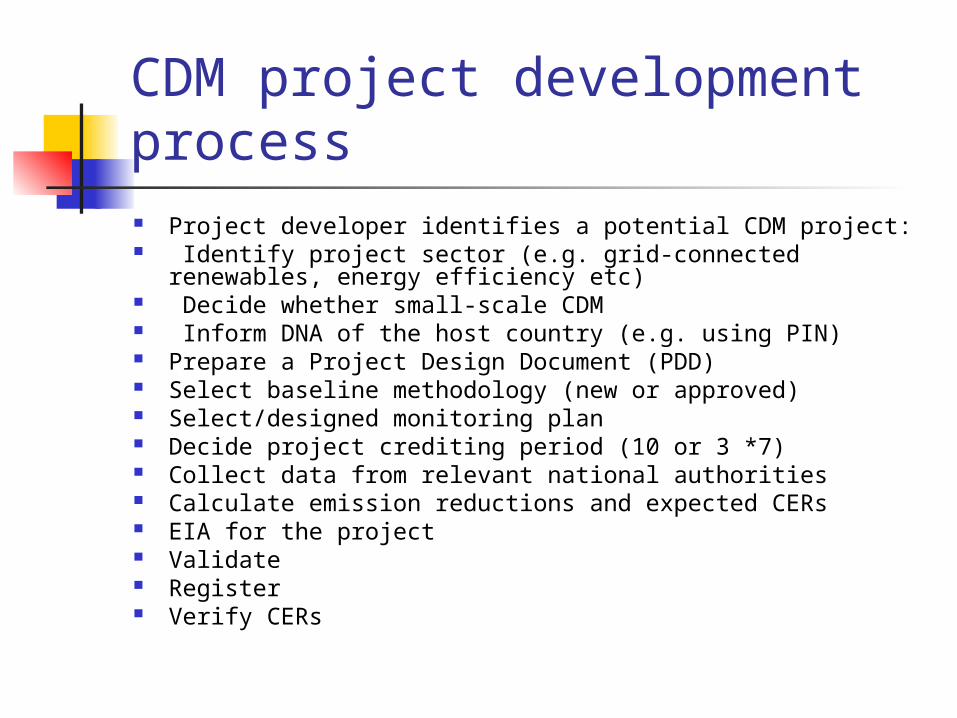
CDM project development process Project developer identifies a potential CDM project: Identify project sector (e.g. grid-connected renewables,
energy efficiency etc) Decide whether small-scale CDM Inform DNA of the host country (e.g. using PIN) Prepare a Project Design Document (PDD) Select baseline methodology (new or approved) Select/designed monitoring plan Decide project crediting period (10 or 3 *7) Collect data from relevant national authorities Calculate emission reductions and expected CERs EIA for the project Validate Register Verify CERs

Key participants of a CDM Project Process
CDM project investor/Developer Designated National Authority (DNA) Designated Operational Entity (DOE) CDM Executive Board (EB) Conference of parties (COP) Meeting of Parties (MOP)39
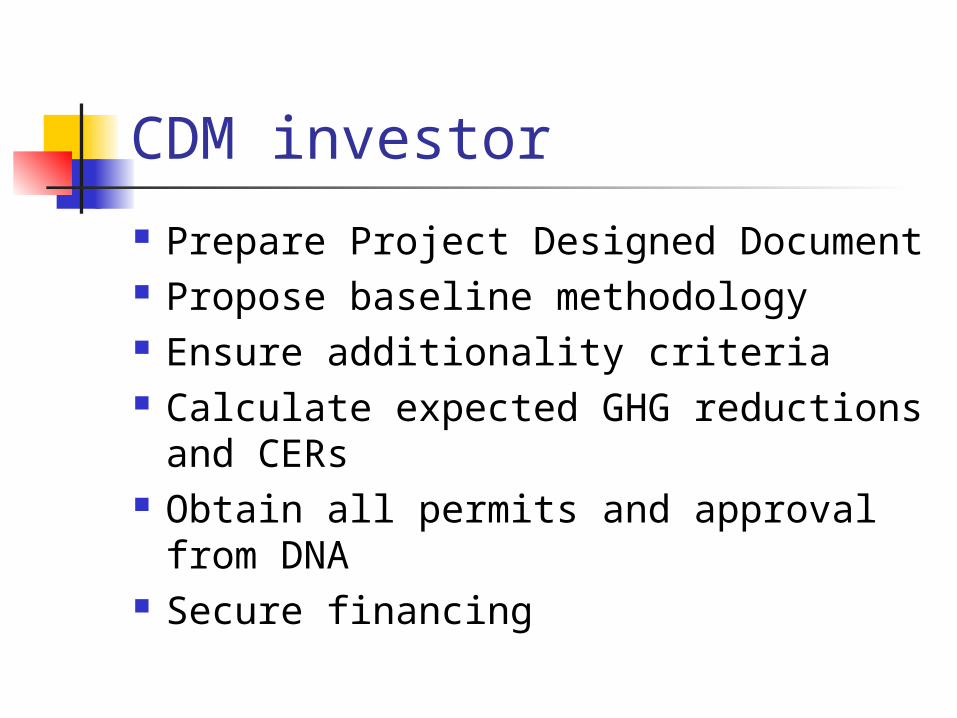
CDM investor
Prepare Project Designed Document Propose baseline methodology Ensure additionality criteria Calculate expected GHG reductions
and CERs Obtain all permits and approval from
DNA Secure financing

Designated National Authority A country level focal point for CDM, based in
Ministry of Environment etc. Issue the letter of approval confirming CDM
projects contributes to sustainable development in the host country
Link between international CDM investors and potential projects in the country
May involve in marketing of CDM project pipeline Establish national CDM regulations, strategy, and
criteria for sustainability and approval Monitor CDM sector in the country

Designated Operational Entity (DOE)
Independent third party assigned by EB. Project developers choose the DOE they wish to deal with.
Responsibilities: Validate proposed CDM project Verify and certify GHG reductions from CDM
projects Maintain publicly available list of all approved
and on-going CDM projects and amount of CERs approved for each project
Post the PDD for 30 days for comments before final approval
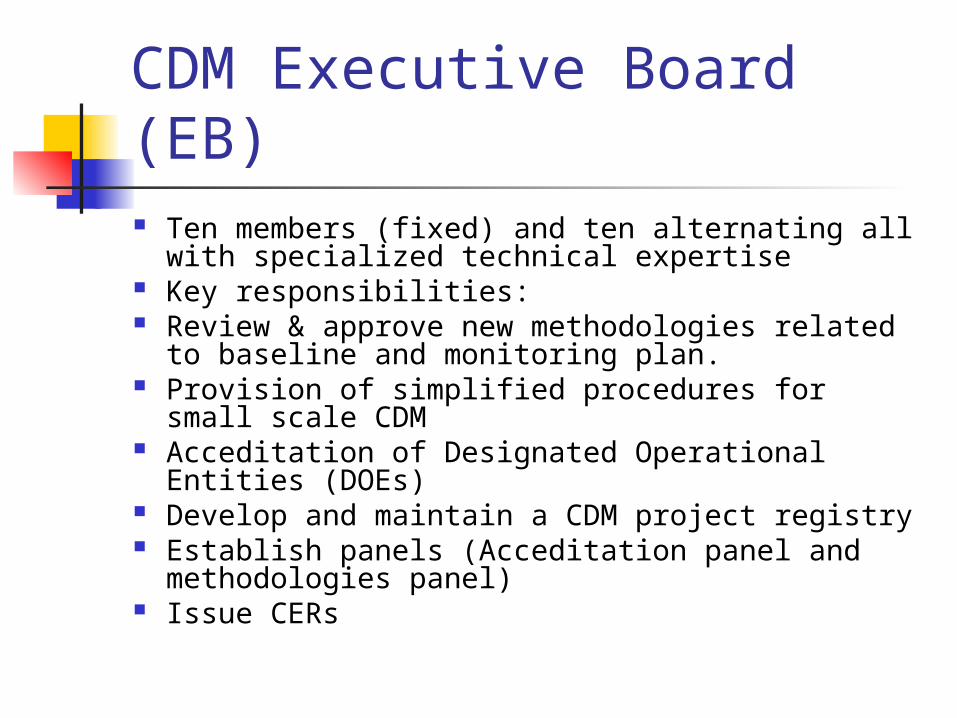
CDM Executive Board (EB) Ten members (fixed) and ten alternating all with
specialized technical expertise Key responsibilities: Review & approve new methodologies related to
baseline and monitoring plan. Provision of simplified procedures for small scale
CDM Acceditation of Designated Operational Entities
(DOEs) Develop and maintain a CDM project registry Establish panels (Acceditation panel and
methodologies panel) Issue CERs
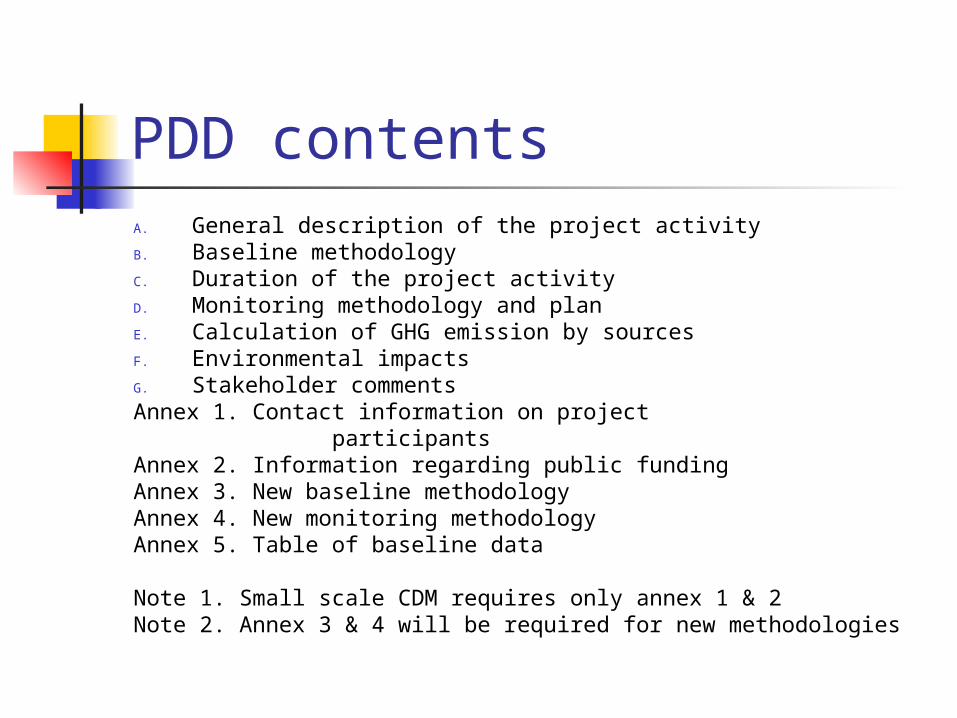
PDD contentsA. General description of the project activityB. Baseline methodologyC. Duration of the project activityD. Monitoring methodology and planE. Calculation of GHG emission by sourcesF. Environmental impactsG. Stakeholder commentsAnnex 1. Contact information on project participantsAnnex 2. Information regarding public fundingAnnex 3. New baseline methodologyAnnex 4. New monitoring methodologyAnnex 5. Table of baseline data
Note 1. Small scale CDM requires only annex 1 & 2Note 2. Annex 3 & 4 will be required for new methodologies

A. General Description of Project Activity
A.1. Title of the project activity A.2. Description of the project activity Purpose of the project
A.3. Project participants
A.4. Technical description of the project
A.4.1 Location of the project activity A.4.1.1. Host country party(ies) A.4.1.2. Region/state/province etc. A.4.1.3. City/Town/community etc. A.4.1.4. Detail of the physical location
A.4.2. Category of project UNFCCC CDM project categories

A. General Description of Project Activity
A.4.3. Technology to be employed by the project
A.4.4. Brief explanation on how anthropogenic GHG emissions by source to be reduced by the proposed CDM project.
A.4.5. Public funding of the project activity
A.4.6. Problems and barriers being addressed by the project

B. Baseline methodologyB.1. Title and reference of the methodology applied to the project Give reference to approved methodology or fill annex 3 for new
methodologies. Baseline data to be prepared in table in annex 5.
B.2. Justification of the choice of the methodology
B.3. Description of how the methodology is applied in the context of the project
B.4. Description of how the anthropogenic emissions of GHG by sources are reduced
below baseline - Why this project is additional and therefore not the baseline
scenario
B.5. Description of how the definition of the project boundary related to the baseline
methodology is applied to the project
B.6. Details of baseline development B.6.1. Date of completing the final draft of this baseline section (DD/MM/YYYY) B.6.2. Name of person/entity determining the baseline

C. Duration of the Project/ Crediting period
C.1. Duration of the project activity
C.1.1. Starting date of the project activity C.1.2. Expected operational lifetime of the project
C.2 Choice of the crediting period and related information C.2.1. Renewable crediting period C.2.1.1. Starting date of the first crediting period (DD/MM/YYYY) C.2.1.2. Length of the first crediting period (in years and
months) C.2.2. Fixed crediting period C.2.2.1. Starting date of the first crediting period (DD/MM/YYYY) C.2.2.2. Length of the first crediting period (in years and
months)

D. Monitoring methodology and plan
D.1 Name and reference of approved methodology applied to the project
D.2. Justification of the choice of methodology and why it is applicable to the project
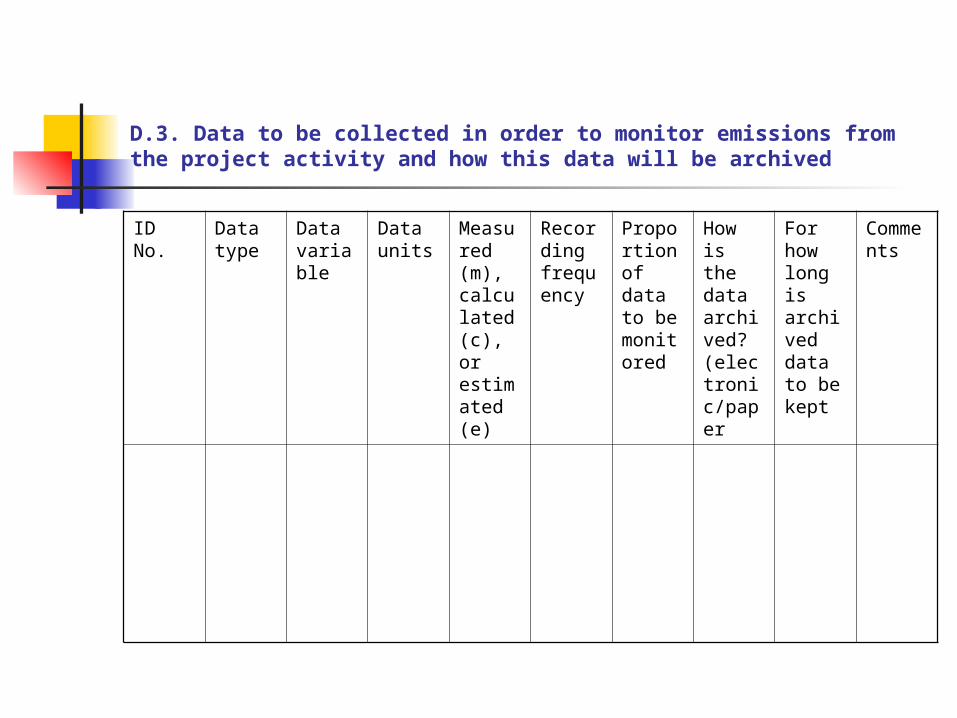
D.3. Data to be collected in order to monitor emissions from the project activity and how this data will be archived
ID No. Data type
Data variable
Data units
Measured (m), calculated (c), or estimated (e)
Recording frequency
Proportion of data to be monitored
How is the data archived? (electronic/paper
For how long is archived data to be kept
Comments

D.4. Potential sources of emissions which are significant and reasonably attributable to the project activity, but which are not included in the project boundary, and identification if and how data will be collected and archived on these emission sources.
ID No. Data type
Data variable
Data units
Measured (m), calculated (c), or estimated (e)
Recording frequency
Proportion of data to be monitored
How is the data archived? (electronic/paper
For how long is archived data to be kept
Comments
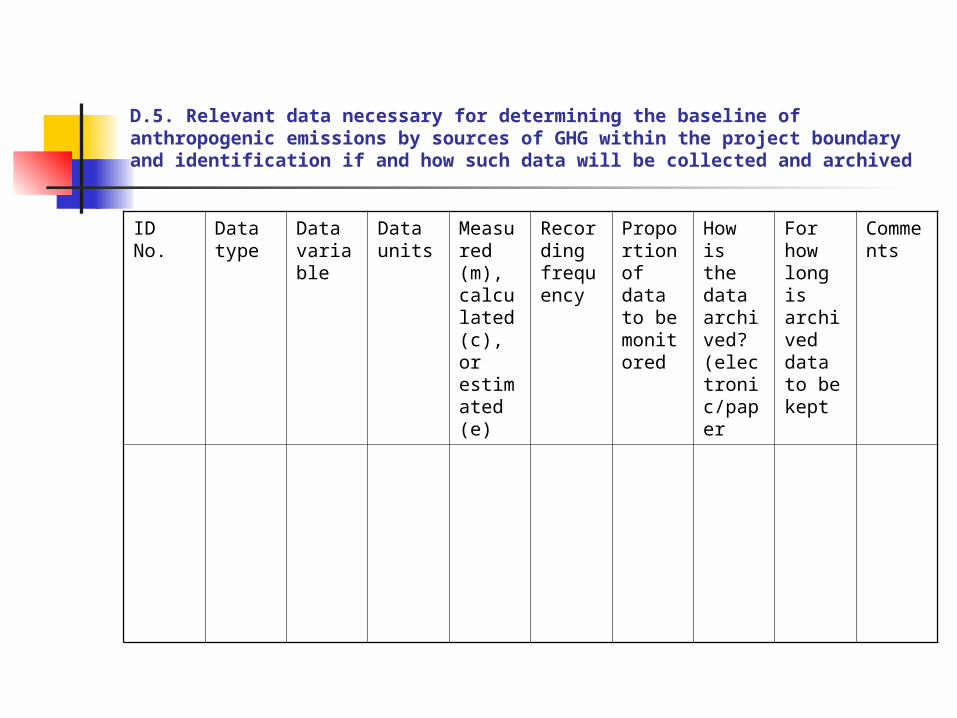
D.5. Relevant data necessary for determining the baseline of anthropogenic emissions by sources of GHG within the project boundary and identification if and how such data will be collected and archived
ID No. Data type
Data variable
Data units
Measured (m), calculated (c), or estimated (e)
Recording frequency
Proportion of data to be monitored
How is the data archived? (electronic/paper
For how long is archived data to be kept
Comments
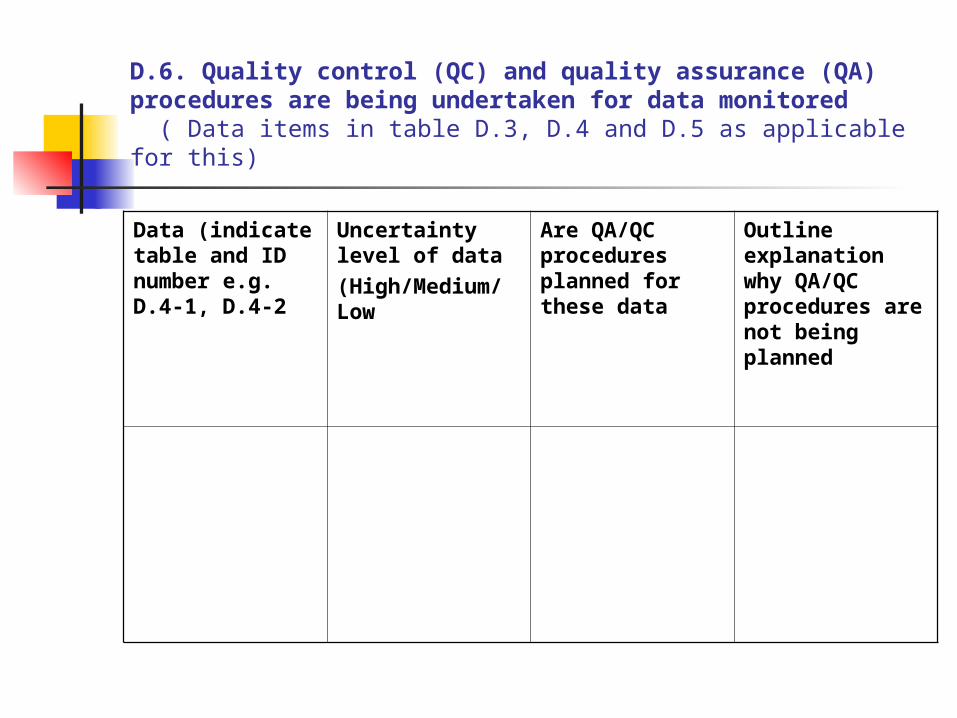
D.6. Quality control (QC) and quality assurance (QA) procedures are being undertaken for data monitored ( Data items in table D.3, D.4 and D.5 as applicable for this)
Data (indicate table and ID number e.g. D.4-1, D.4-2
Uncertainty level of data (High/Medium/Low
Are QA/QC procedures planned for these data
Outline explanation why QA/QC procedures are not being planned

E. Calculation of GHG emissions by sources
E.1 Calculation of total project GHG emissions
Total project emissions = Level of project activity (unit
of input or output * CO2 emissions factor of the project’s technology,
fuel or gas

E 1. Project emission calculation
Emissions from biomass power plantU = (V * Y1) + (W * Y2 ) + (X * Y3 ) where: U = Total emissions from the project emissions V = Amount of fuel wood used as input to the power plant in tons, which is 11200 tons/yearW = Annual energy use for transporting fuel wood, which is 2 MJ per ton km1. (Assumed that the project transport average distance of 5 km since maximum distance is only 10 km. Therefore to transport each ton of fuel wood requires 10 MJ of energy. Hence the total transport energy is 11200 * 10 = 112000 MJ = 0.112 TJ)X = Amount of foliage used for fertilizer production, which is 1800 tons/year (dry weight)Y1 = CO2 emission factor (CEF) of fuel wood (1.65 tCO2 per ton of Wood)Y2 = CO2 emission factor for transport fuel 74.1 tCO2/TJ2Y3 = CO2 emission factor for dry weight of foliage ( 0.26)3
Total project emissions = (11200 * 1.65) + (0.112 * 74.1) + (1800 * 0.26) =
18956.3 tCO2/year
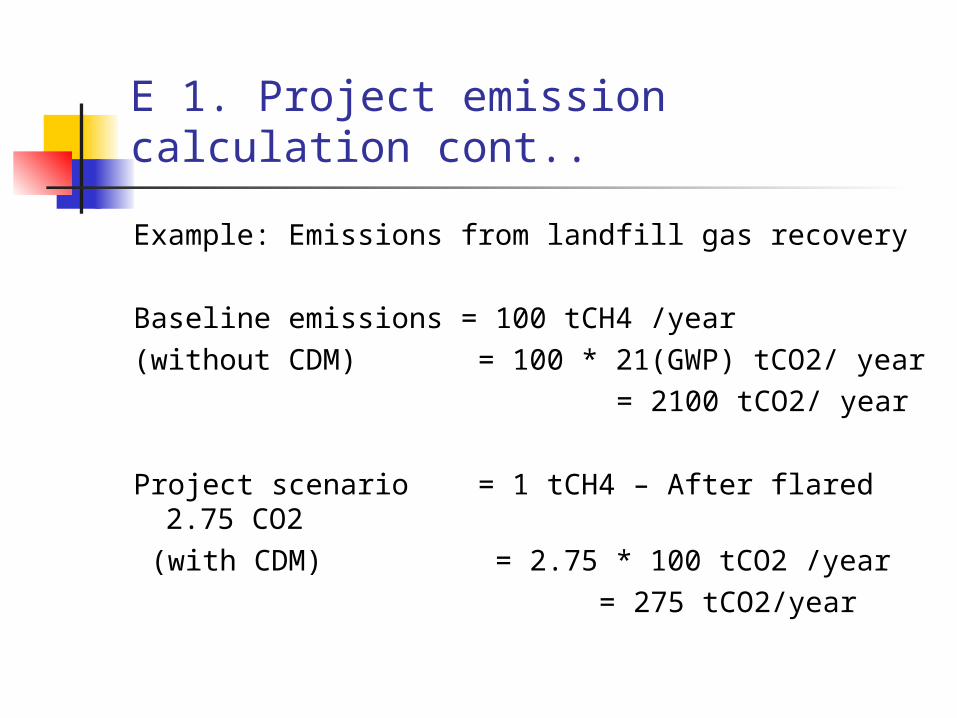
E 1. Project emission calculation cont..
Example: Emissions from landfill gas recovery
Baseline emissions = 100 tCH4 /year(without CDM) = 100 * 21(GWP) tCO2/ year = 2100 tCO2/ year
Project scenario = 1 tCH4 – After flared 2.75 CO2 (with CDM) = 2.75 * 100 tCO2 /year = 275 tCO2/year

E.2 Calculation of Leakage
Total leakage emissions = Level of project activity outside
the project (unit of input or output
* CO2 emissions factor of the project’s technology, fuel or gas
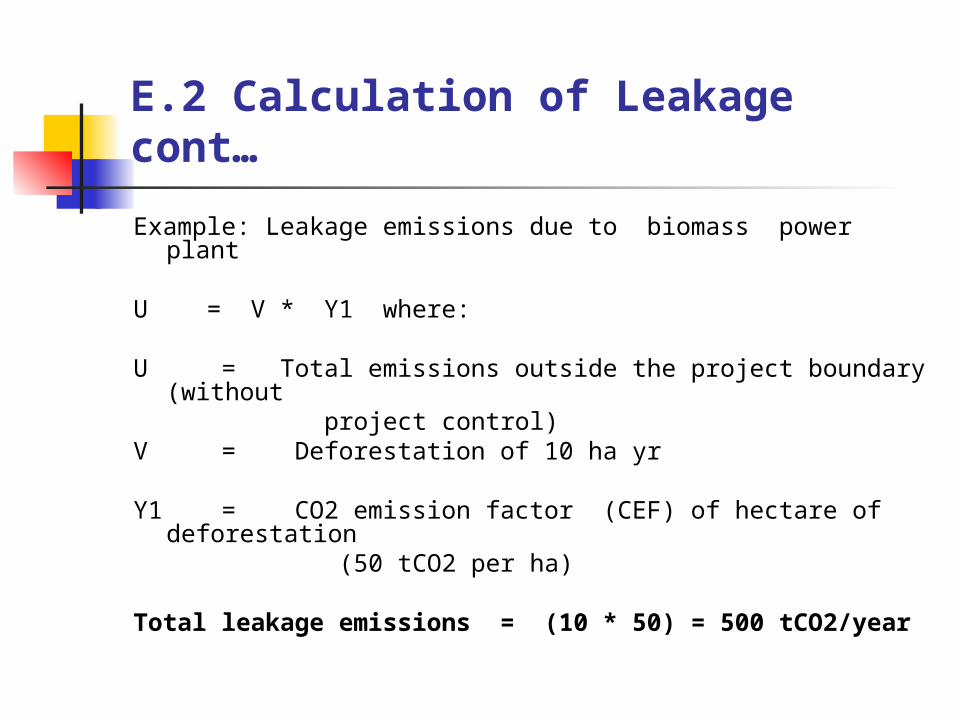
E.2 Calculation of Leakage cont…
Example: Leakage emissions due to biomass power plant
U = V * Y1 where: U = Total emissions outside the project boundary
(without project control) V = Deforestation of 10 ha yr
Y1 = CO2 emission factor (CEF) of hectare of deforestation
(50 tCO2 per ha)
Total leakage emissions = (10 * 50) = 500 tCO2/year
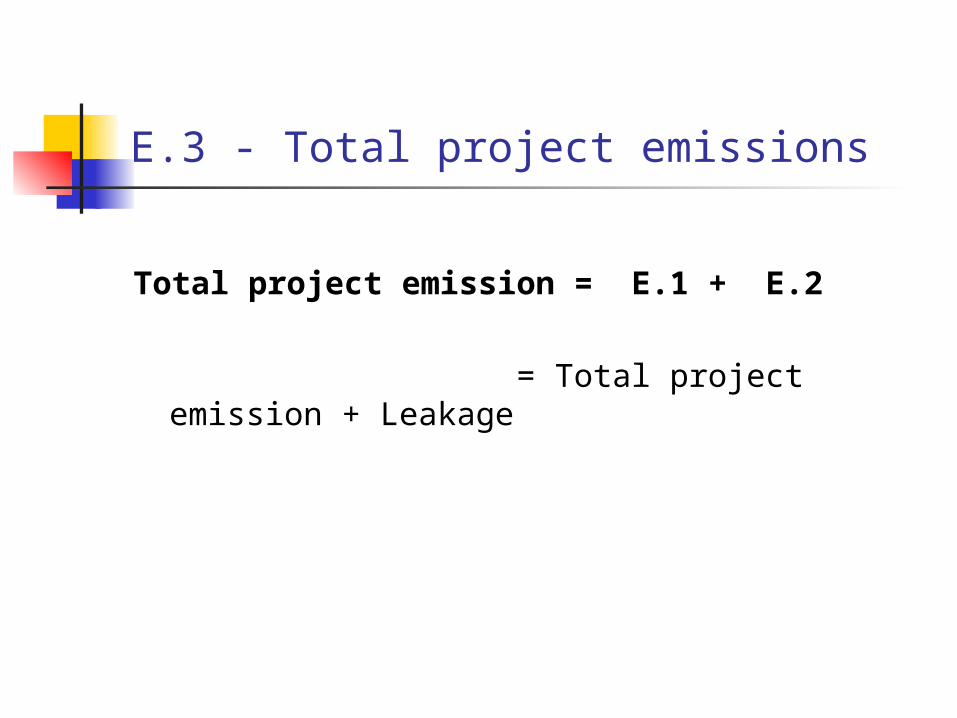
E.3 - Total project emissions
Total project emission = E.1 + E.2
= Total project emission + Leakage

E.4 Baseline emission
Total baseline emissions =
Level of project activity (unit of input or output * CO2 emissions factor of the alternative to the project (baseline scenario)

F. Environmental impactsG. Stakeholder consultation
List all environmental impacts Include comments of stakeholder
consultation of the project
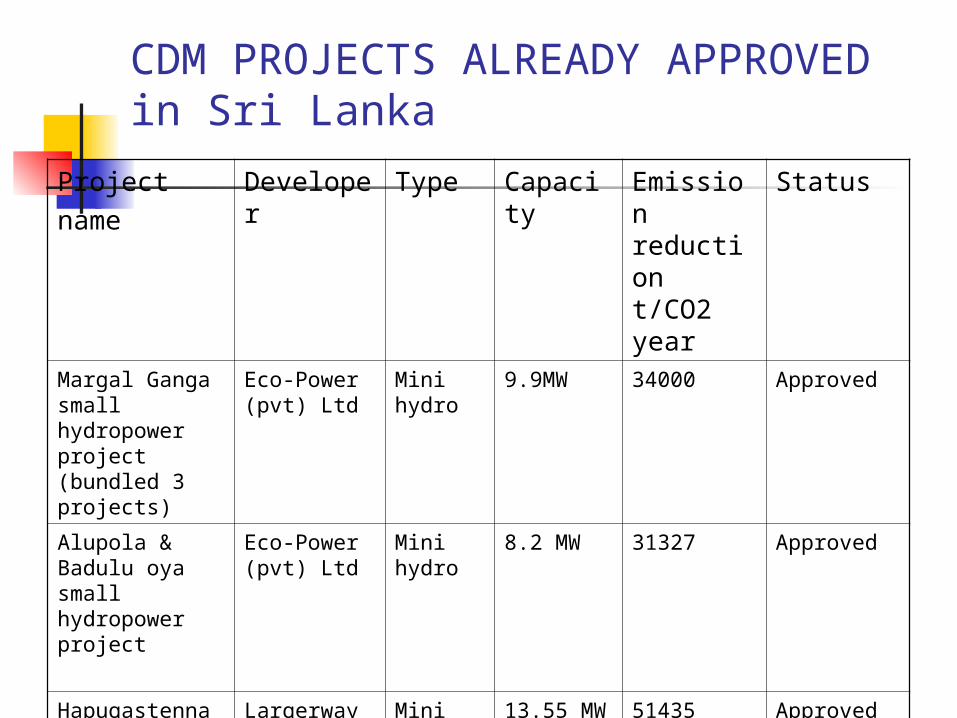
CDM PROJECTS ALREADY APPROVED in Sri Lanka
Projectname
Developer
Type Capacity
Emission reduction t/CO2 year
Status
Margal Ganga small hydropower project (bundled 3 projects)
Eco-Power (pvt) Ltd
Mini hydro
9.9MW 34000 Approved
Alupola & Badulu oya small hydropower project
Eco-Power (pvt) Ltd
Mini hydro
8.2 MW 31327 Approved
Hapugastenna & Huluganaga small Hydro power Project
Largerway Wind Turbaine Ltd
Mini hydro
13.55 MW 51435 Approved

CDM PROJECTS SUBMITTED FOR APPROVAL
Projectname
Developer Type Capacity Emission reduction t/CO2 year
Status
Bambarabotuwa mini hydropower project
Vidul lanka (pvt)
Mini hydro
3.2 MW 3917 Approved In principle
Colombo organic waste treatment plant
Bioland (pvt0 Ltd
Biogas 56784 MWh 244000 Approved In principle
Wind power plant Senok Trade Combined Ltd
Wind 20 WM 65,000 Approved In principle
Mini Hydropower project
Free Lnak (pvt) Ltd
Mini hydro
30300 MWh 30000 Approved In principle
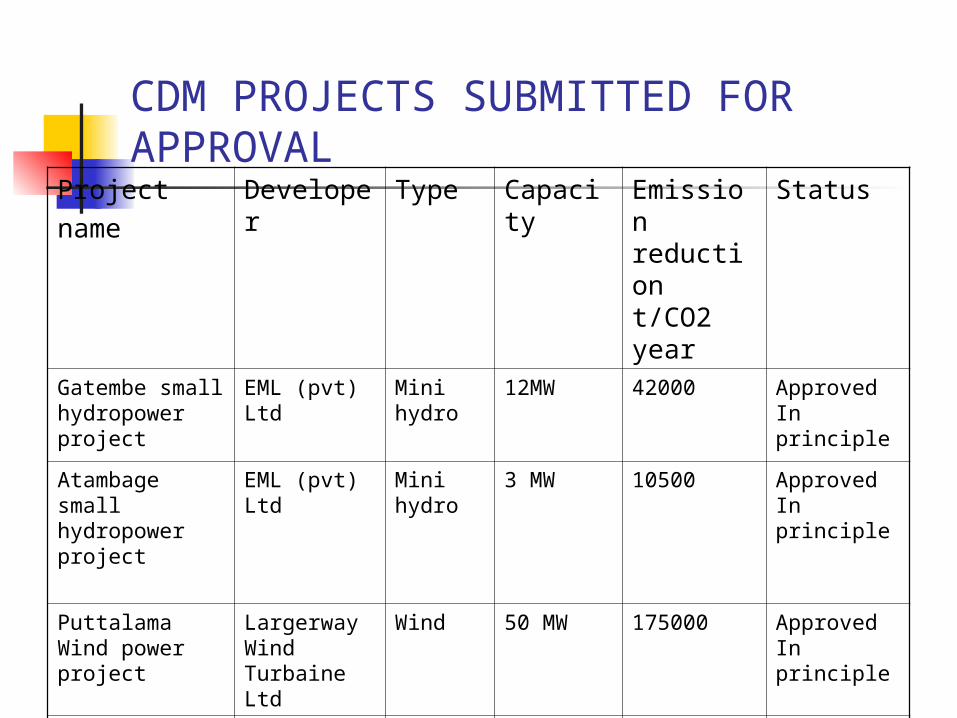
CDM PROJECTS SUBMITTED FOR APPROVAL
Projectname
Developer
Type Capacity
Emission reduction t/CO2 year
Status
Gatembe small hydropower project
EML (pvt) Ltd
Mini hydro
12MW 42000 Approved In principle
Atambage small hydropower project
EML (pvt) Ltd
Mini hydro
3 MW 10500 Approved In principle
Puttalama Wind power project
Largerway Wind Turbaine Ltd
Wind 50 MW 175000 Approved In principle
Power generation & manufacture of coconut shell charcoal
Haycarb Ltd Heat recovery and power
8MW 28000 Approved In principle
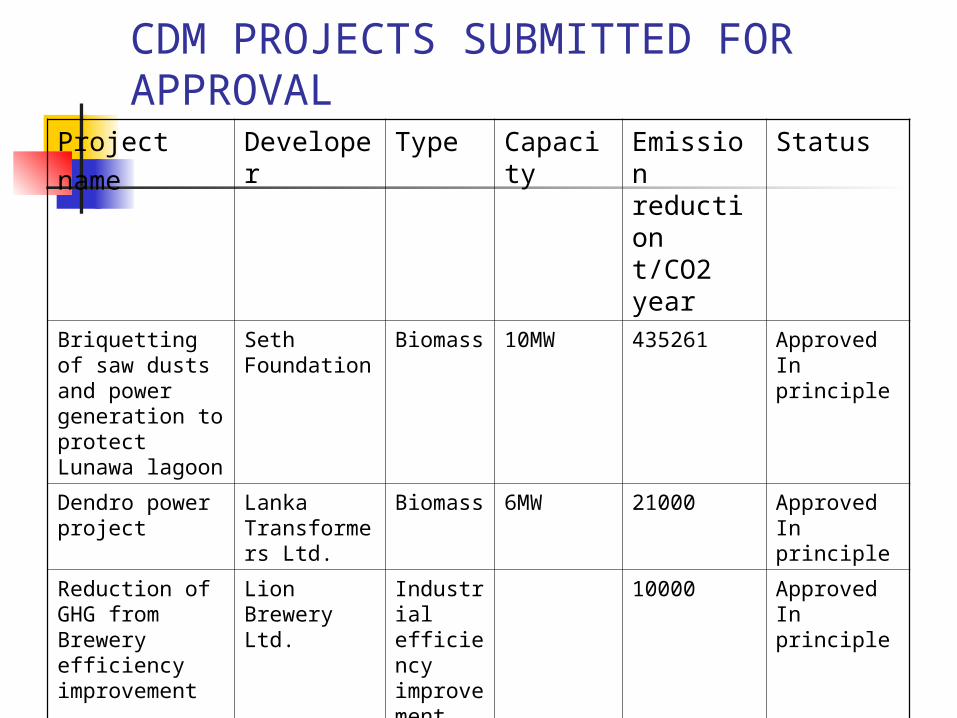
CDM PROJECTS SUBMITTED FOR APPROVAL
Projectname
Developer
Type Capacity
Emission reduction t/CO2 year
Status
Briquetting of saw dusts and power generation to protect Lunawa lagoon
Seth Foundation
Biomass 10MW 435261 Approved In principle
Dendro power project
Lanka Transformers Ltd.
Biomass 6MW 21000 Approved In principle
Reduction of GHG from Brewery efficiency improvement
Lion Brewery Ltd.
Industrial efficiency improvement
10000 Approved In principle
Wind Power Project
David & M Engineering (pvt) Ltd.
Wind power
300MW 1050000 Approved In principle

Sri Lankan CDM potential Projected electricity demand in 2010 -
18800 GWh
Additional energy requirement in 2010 - 13200 GWh (Some of these energy may be produced as CDM projects
Existing scrub and open lands – 1.7 million ha (Part of this can be used for CDM

Sri Lankan CDM potential
Estimated wind power potential of 24000MW
Estimated Biomass (Dendro) potential of 5000 MW
Industrial efficiency improvement 40% of households have not been
provided with electricity – Solar home system potential
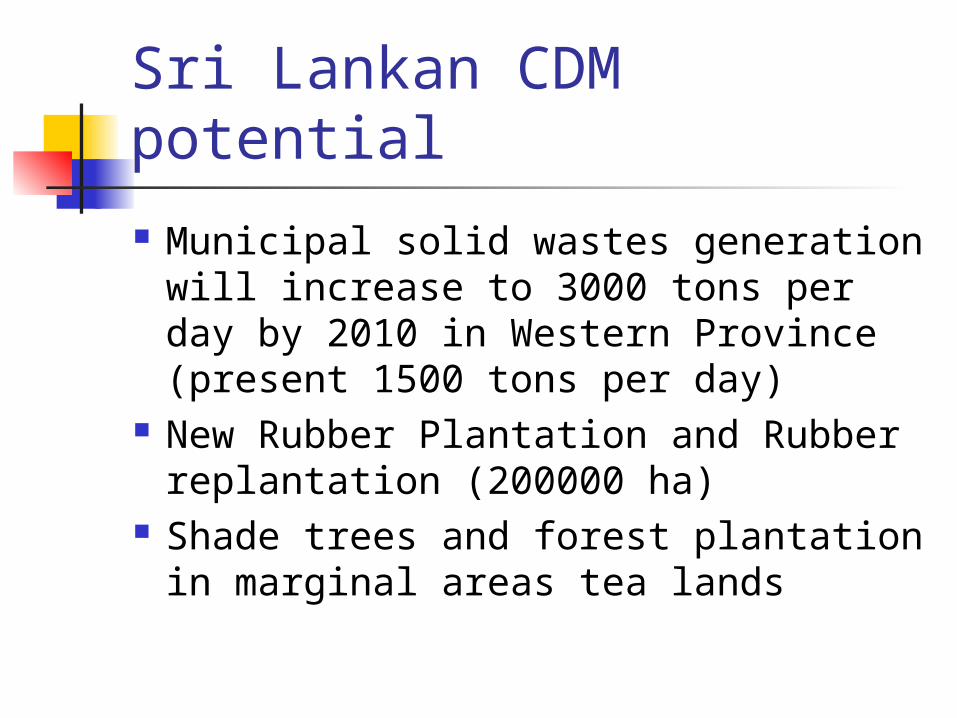
Sri Lankan CDM potential
Municipal solid wastes generation will increase to 3000 tons per day by 2010 in Western Province (present 1500 tons per day)
New Rubber Plantation and Rubber replantation (200000 ha)
Shade trees and forest plantation in marginal areas tea lands
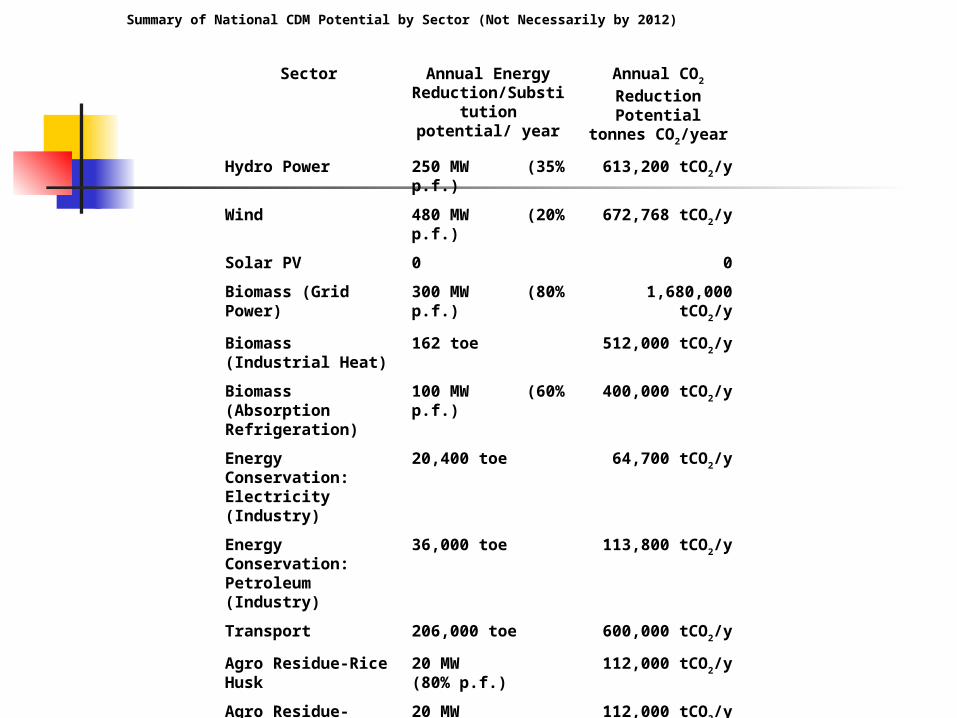
Summary of National CDM Potential by Sector (Not Necessarily by 2012)
Sector Annual Energy Reduction/Substitution potential/ year
Annual CO2
Reduction Potential tonnes
CO2/year
Hydro Power 250 MW (35% p.f.)
613,200 tCO2/y
Wind 480 MW (20% p.f.)
672,768 tCO2/y
Solar PV 0 0
Biomass (Grid Power) 300 MW (80% p.f.)
1,680,000 tCO2/y
Biomass (Industrial Heat)
162 toe 512,000 tCO2/y
Biomass (Absorption Refrigeration)
100 MW (60% p.f.)
400,000 tCO2/y
Energy Conservation: Electricity (Industry)
20,400 toe 64,700 tCO2/y
Energy Conservation: Petroleum (Industry)
36,000 toe 113,800 tCO2/y
Transport 206,000 toe 600,000 tCO2/y
Agro Residue-Rice Husk
20 MW (80% p.f.)
112,000 tCO2/y
Agro Residue-Sawdust
20 MW (80% p.f.)
112,000 tCO2/y
Municipal Solid Waste
Forestry 52,000 ha 1,352,000 tCO2/y

Risks Regulatory risk Market risk Country risk Non-permanence risk Replacement risk Construction risk Performance risk resource risk technology risk Financial, business and regulatory risk Contract risk Counterparty risk Generic country risk