introduction to capitalization tablesintroduction to capitalization tables marianne hudson and kevin...
TRANSCRIPT
The Rising Tide Program
The Rising Tide Program
Support by:
Education Partners:
Founding Members:
Introduction to Capitalization Tables
Marianne Hudson and Kevin LearnedAugust , 2016
The Rising Tide Program
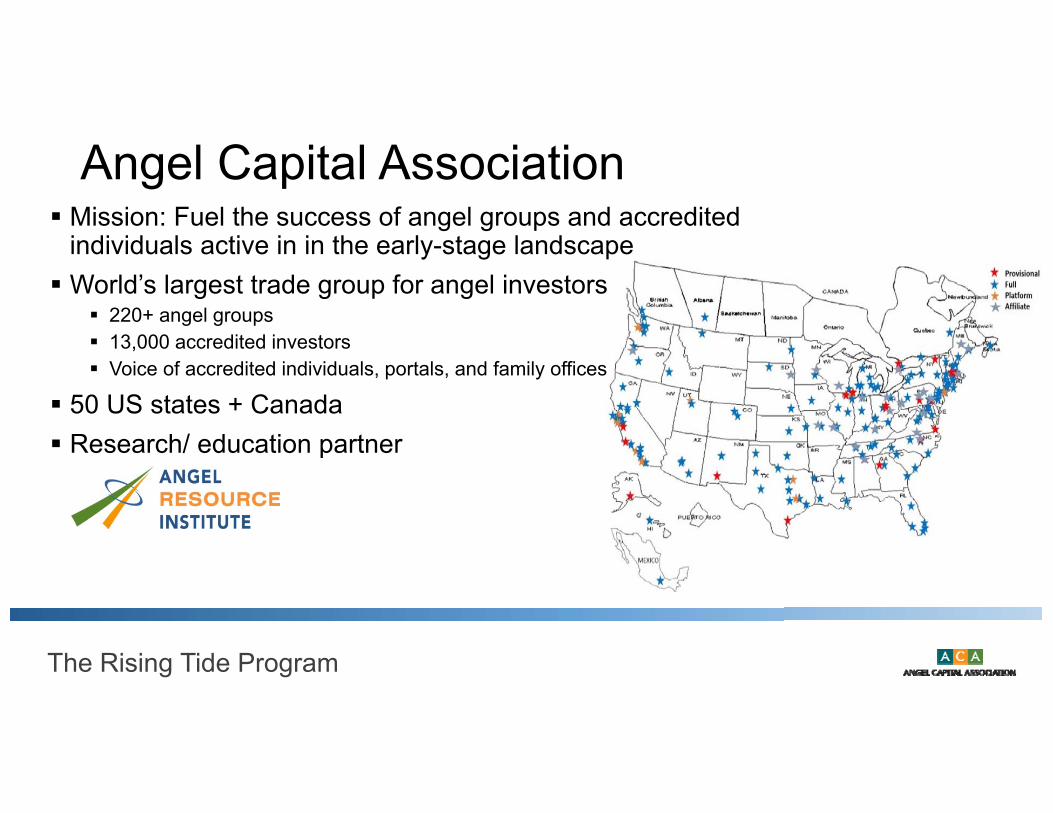
Mission: Fuel the success of angel groups and accredited individuals active in in the early-stage landscape World’s largest trade group for angel investors
220+ angel groups 13,000 accredited investors Voice of accredited individuals, portals, and family offices
50 US states + Canada Research/ education partner
Angel Capital Association
The Rising Tide Program
Rising Tide Education Program
Support by:
Education Partners:
Founding Members:
The Rising Tide Program
Library of Education for Angels Programs via www.angelcapitalassociation.org/new-angels 20 minute videos, 1-hour webinars, and related Forbes articles Stepping stones of angel investing: Portfolio strategy Term sheets Valuation Due diligence Reading financial statements And now understanding cap tables
The Rising Tide Program
OUR SPEAKER
KEVIN LEARNED
• Angel investor• Co-founder of four angel funds and Boise Angel Alliance• Board of Angel Capital Association• Founding Director, Venture College at Boise State
University• Former CPA• Entrepreneur and CEO• Professor of Entrepreneurship• Loon Creek Capital Group

The Rising Tide Program
Topics We’ll Explore in This Video
What is a capitalization table (cap table)?Simple cap table model illustration Understand impact of valuation and future rounds on angels’ investment Project expected multiples upon exit
The Excel file I’m using will be available to you to download along with instructions

The Rising Tide Program
What is a Cap Table? Lists the capital structure of a company Current Pro forma for the current round Pro forma for future rounds Pro forma exit
It enables the investor to see the impact of Valuation Future rounds
Allows the investor to project multiples upon exit.
The Rising Tide Program

The Rising Tide Program
When and Who? Entrepreneur’s attorney will keep “official” cap table. I always prepare my own proforma table at the beginning of due
diligence. Allows me to see and negotiate: Impact of stock options Impact of valuations Impact of future raises Project possible exit multiples on my investment
If the table isn’t satisfactory, no need to go further with due diligence
The Rising Tide Program

The Rising Tide Program
Step 1: List Common (Founders’ Stock)
Common Shares %
FoundersFounder 1 300,000 75.0%Founder 2 100,000 25.0%
Total Founders 400,000 100.0%
Stock Options
Total Common 400,000 100.0%
Founders' Shares
The Rising Tide Program
The Rising Tide Program
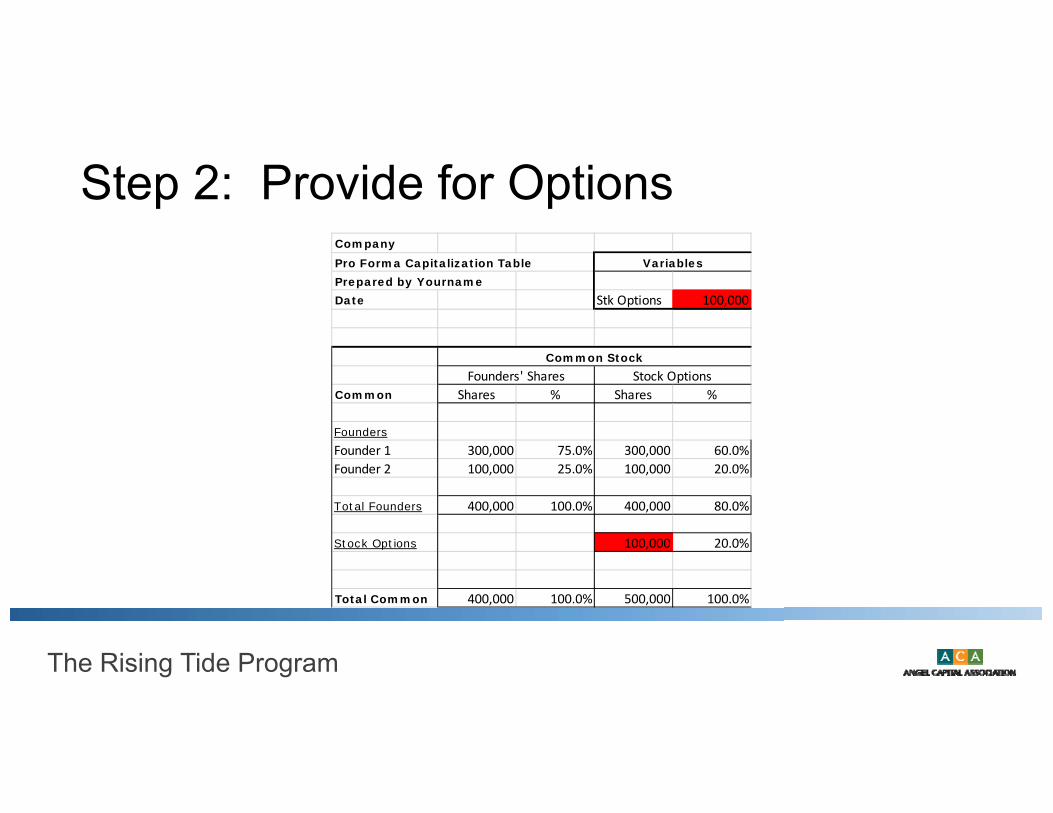
Step 2: Provide for OptionsCompanyPro Forma Capitalization TablePrepared by YournameDate Stk Options 100,000
Common Shares % Shares %
FoundersFounder 1 300,000 75.0% 300,000 60.0%Founder 2 100,000 25.0% 100,000 20.0%
Total Founders 400,000 100.0% 400,000 80.0%
Stock Options 100,000 20.0%
Total Common 400,000 100.0% 500,000 100.0%
Variables
Common StockFounders' Shares Stock Options

The Rising Tide Program
The Rising Tide Program
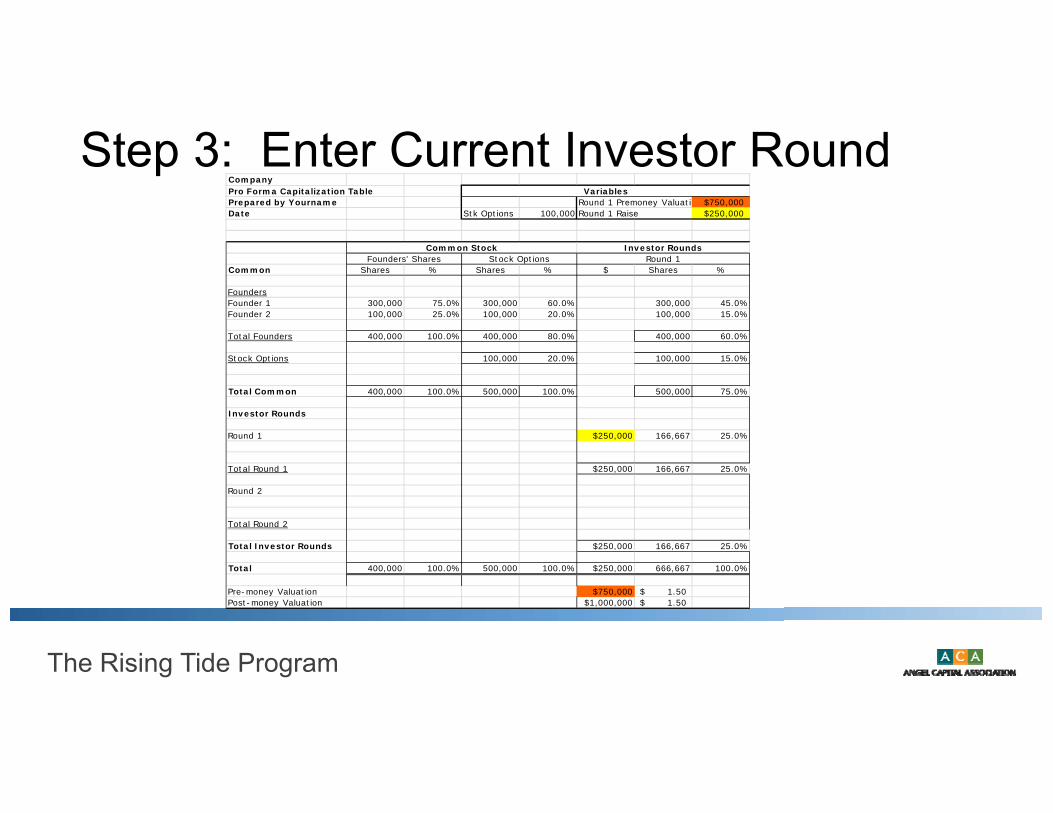
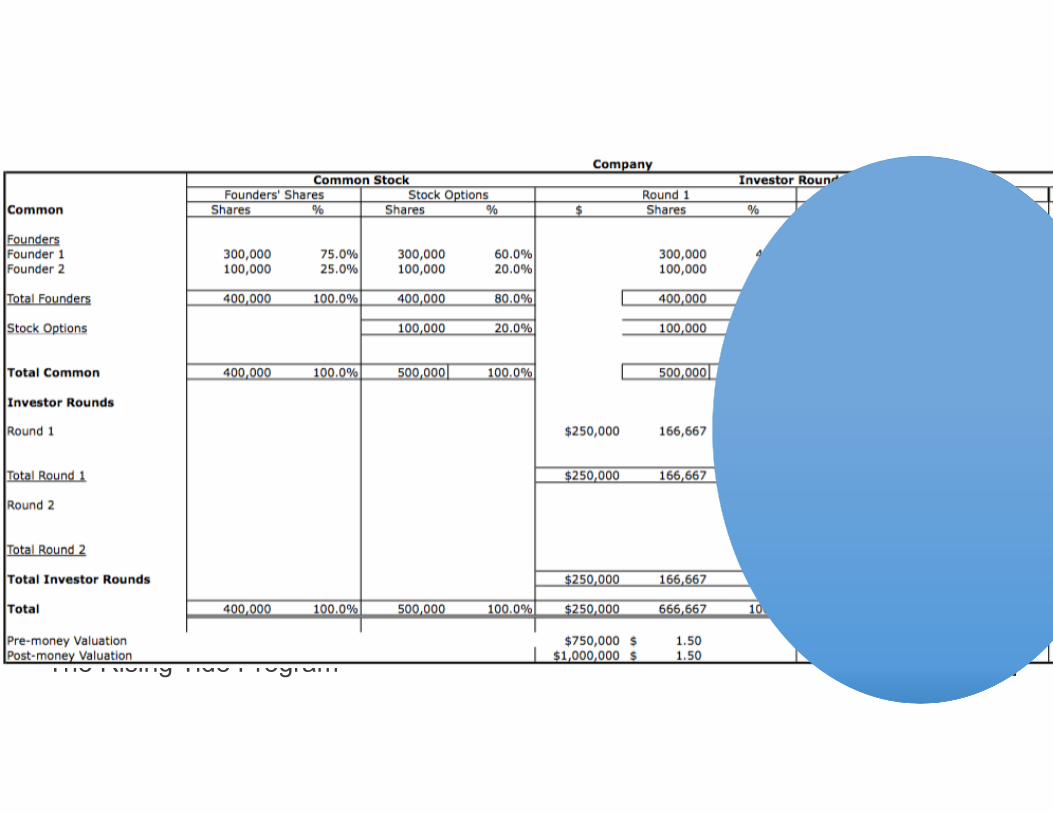
Step 3: Enter Current Investor RoundCompanyPro Forma Capitalization TablePrepared by Yourname Round 1 Premoney Valuatio $750,000Date Stk Options 100,000 Round 1 Raise $250,000
Common Shares % Shares % $ Shares %
FoundersFounder 1 300,000 75.0% 300,000 60.0% 300,000 45.0%Founder 2 100,000 25.0% 100,000 20.0% 100,000 15.0%
Total Founders 400,000 100.0% 400,000 80.0% 400,000 60.0%
Stock Options 100,000 20.0% 100,000 15.0%
Total Common 400,000 100.0% 500,000 100.0% 500,000 75.0%
Investor Rounds
Round 1 $250,000 166,667 25.0%
Total Round 1 $250,000 166,667 25.0%
Round 2
Total Round 2
Total Investor Rounds $250,000 166,667 25.0%
Total 400,000 100.0% 500,000 100.0% $250,000 666,667 100.0%
Pre-money Valuation $750,000 1.50$ Post-money Valuation $1,000,000 1.50$
Variables
Founders' Shares Stock OptionsCommon Stock
Round 1Investor Rounds
The Rising Tide Program
The Rising Tide Program
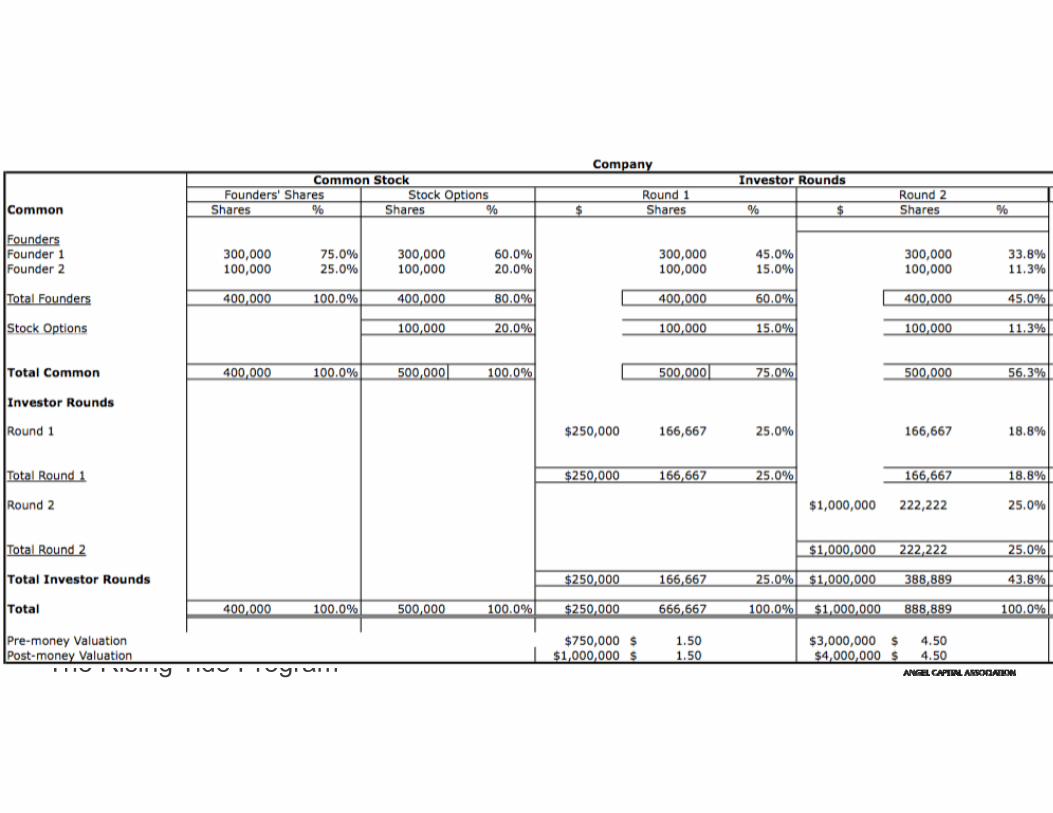
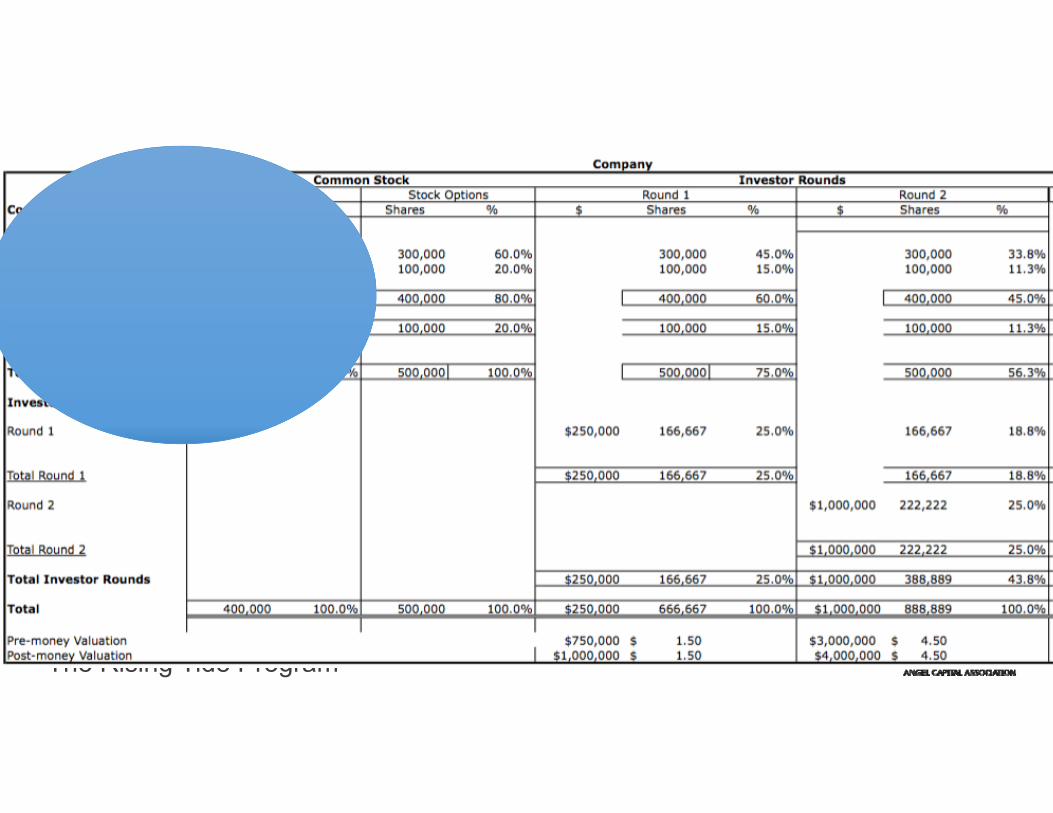
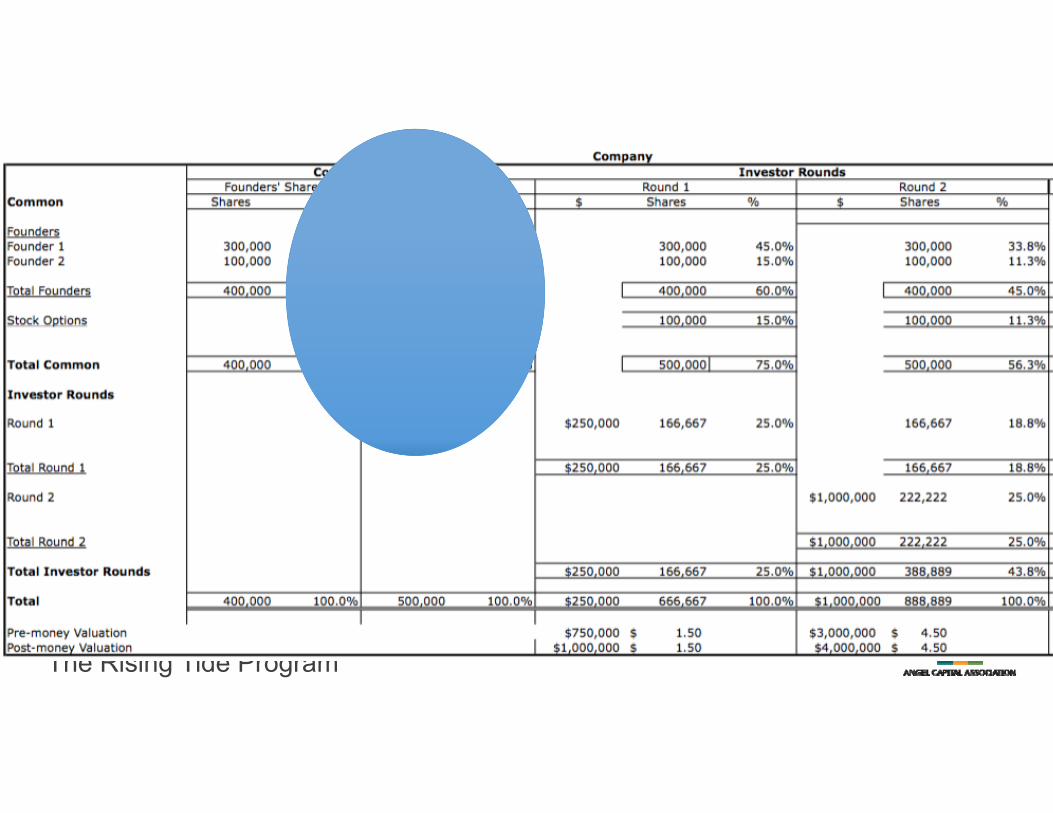
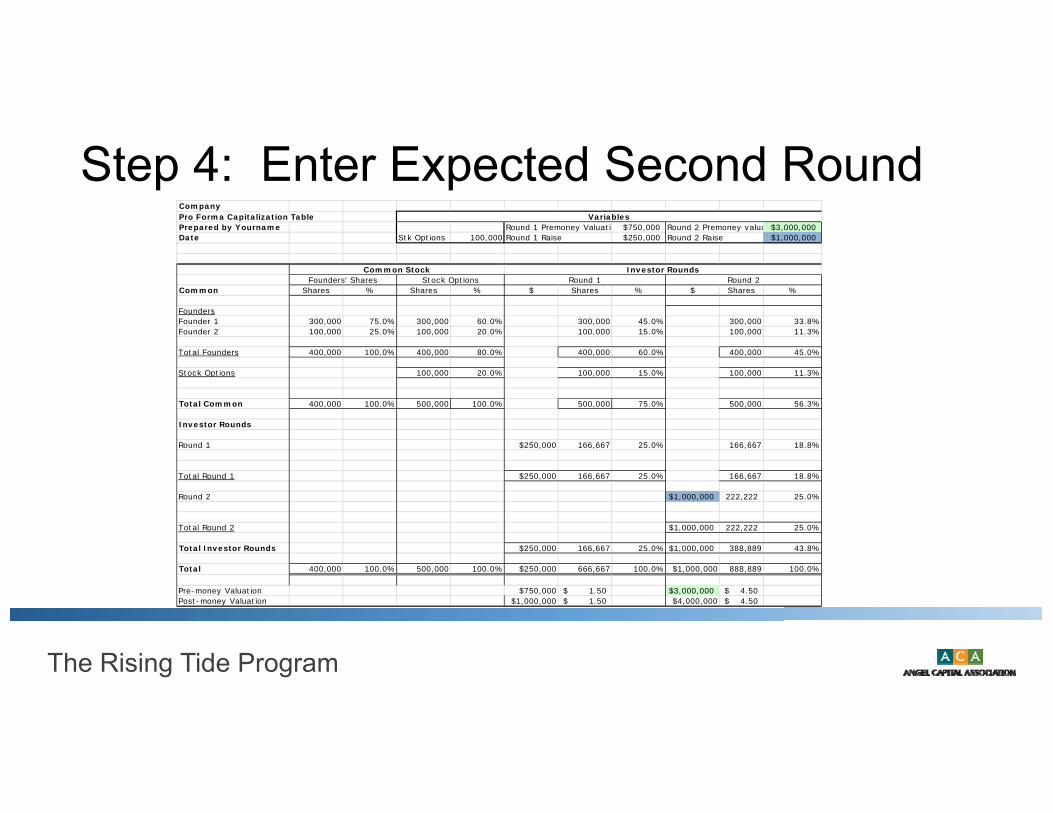
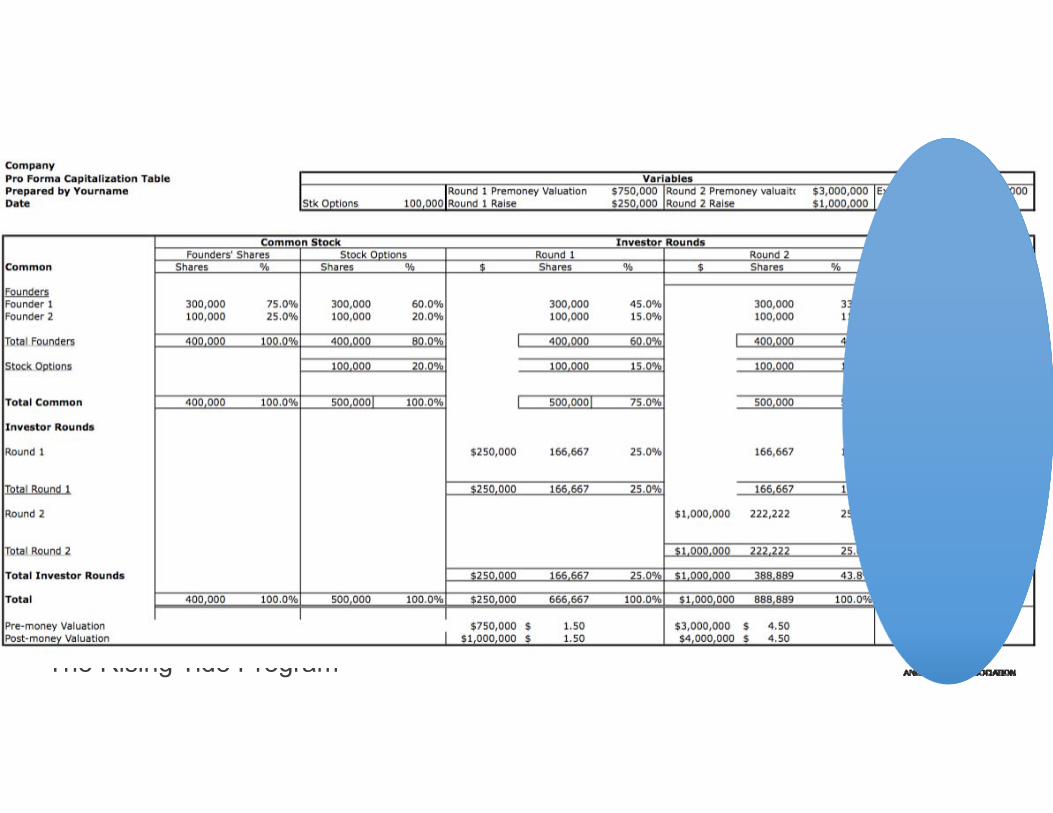
Step 4: Enter Expected Second RoundCompanyPro Forma Capitalization TablePrepared by Yourname Round 1 Premoney Valuatio $750,000 Round 2 Premoney valua $3,000,000Date Stk Options 100,000 Round 1 Raise $250,000 Round 2 Raise $1,000,000
Common Shares % Shares % $ Shares % $ Shares %
FoundersFounder 1 300,000 75.0% 300,000 60.0% 300,000 45.0% 300,000 33.8%Founder 2 100,000 25.0% 100,000 20.0% 100,000 15.0% 100,000 11.3%
Total Founders 400,000 100.0% 400,000 80.0% 400,000 60.0% 400,000 45.0%
Stock Options 100,000 20.0% 100,000 15.0% 100,000 11.3%
Total Common 400,000 100.0% 500,000 100.0% 500,000 75.0% 500,000 56.3%
Investor Rounds
Round 1 $250,000 166,667 25.0% 166,667 18.8%
Total Round 1 $250,000 166,667 25.0% 166,667 18.8%
Round 2 $1,000,000 222,222 25.0%
Total Round 2 $1,000,000 222,222 25.0%
Total Investor Rounds $250,000 166,667 25.0% $1,000,000 388,889 43.8%
Total 400,000 100.0% 500,000 100.0% $250,000 666,667 100.0% $1,000,000 888,889 100.0%
Pre-money Valuation $750,000 1.50$ $3,000,000 4.50$ Post-money Valuation $1,000,000 1.50$ $4,000,000 4.50$
Variables
Founders' Shares Stock OptionsCommon Stock
Round 1 Round 2Investor Rounds
The Rising Tide Program
The Rising Tide Program
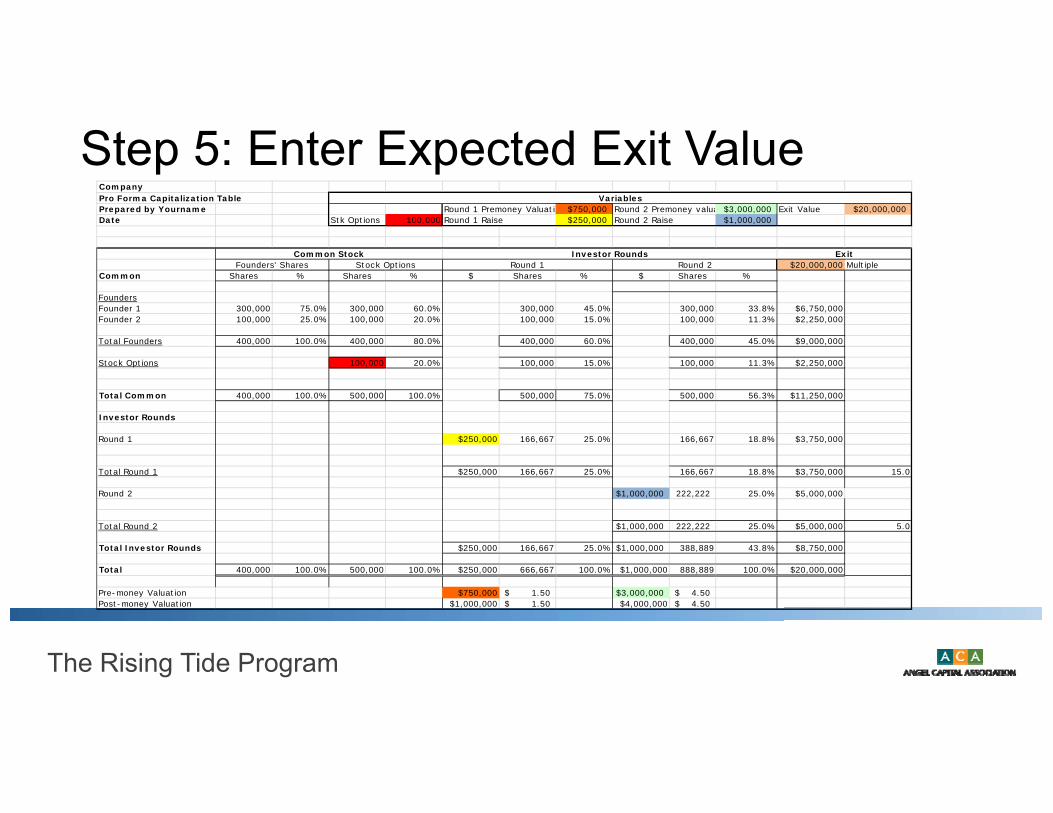
Step 5: Enter Expected Exit ValueCompanyPro Forma Capitalization TablePrepared by Yourname Round 1 Premoney Valuatio $750,000 Round 2 Premoney valua $3,000,000 Exit Value $20,000,000Date Stk Options 100,000 Round 1 Raise $250,000 Round 2 Raise $1,000,000
$20,000,000 MultipleCommon Shares % Shares % $ Shares % $ Shares %
FoundersFounder 1 300,000 75.0% 300,000 60.0% 300,000 45.0% 300,000 33.8% $6,750,000Founder 2 100,000 25.0% 100,000 20.0% 100,000 15.0% 100,000 11.3% $2,250,000
Total Founders 400,000 100.0% 400,000 80.0% 400,000 60.0% 400,000 45.0% $9,000,000
Stock Options 100,000 20.0% 100,000 15.0% 100,000 11.3% $2,250,000
Total Common 400,000 100.0% 500,000 100.0% 500,000 75.0% 500,000 56.3% $11,250,000
Investor Rounds
Round 1 $250,000 166,667 25.0% 166,667 18.8% $3,750,000
Total Round 1 $250,000 166,667 25.0% 166,667 18.8% $3,750,000 15.0
Round 2 $1,000,000 222,222 25.0% $5,000,000
Total Round 2 $1,000,000 222,222 25.0% $5,000,000 5.0
Total Investor Rounds $250,000 166,667 25.0% $1,000,000 388,889 43.8% $8,750,000
Total 400,000 100.0% 500,000 100.0% $250,000 666,667 100.0% $1,000,000 888,889 100.0% $20,000,000
Pre-money Valuation $750,000 1.50$ $3,000,000 4.50$ Post-money Valuation $1,000,000 1.50$ $4,000,000 4.50$
Variables
ExitFounders' Shares Stock Options
Common StockRound 1 Round 2
Investor Rounds
The Rising Tide Program
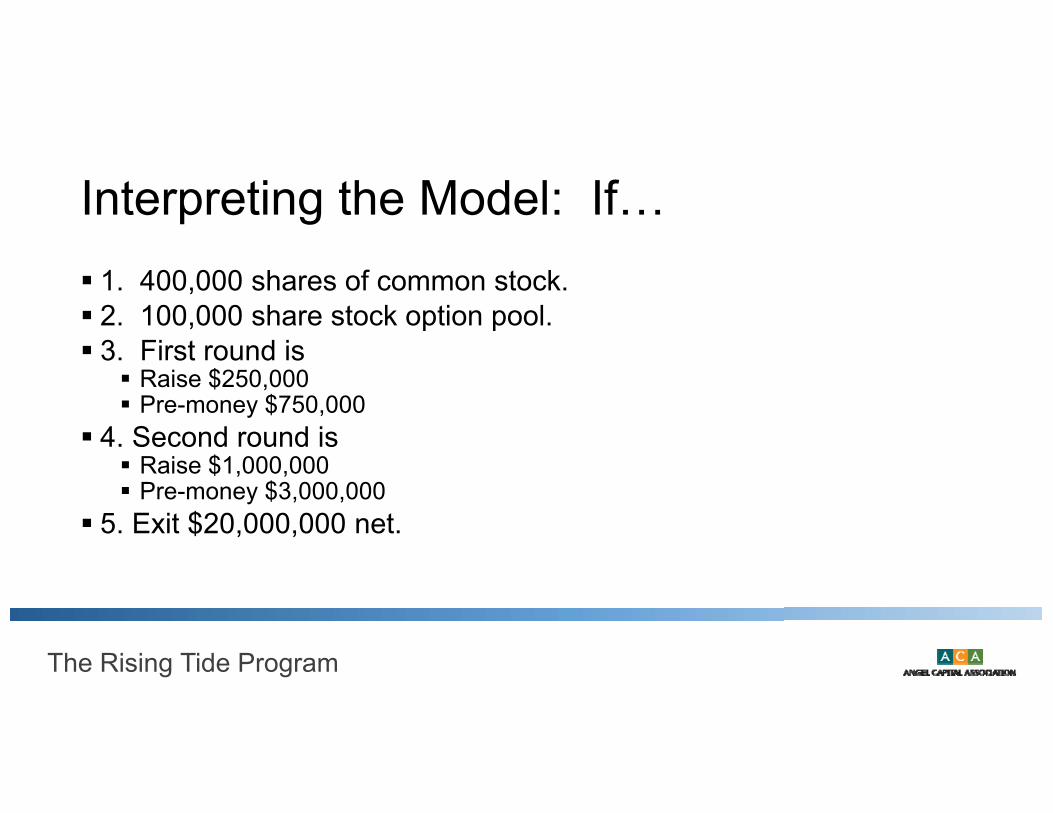
Interpreting the Model: If… 1. 400,000 shares of common stock. 2. 100,000 share stock option pool. 3. First round is Raise $250,000 Pre-money $750,000
4. Second round is Raise $1,000,000 Pre-money $3,000,000
5. Exit $20,000,000 net.
The Rising Tide Program
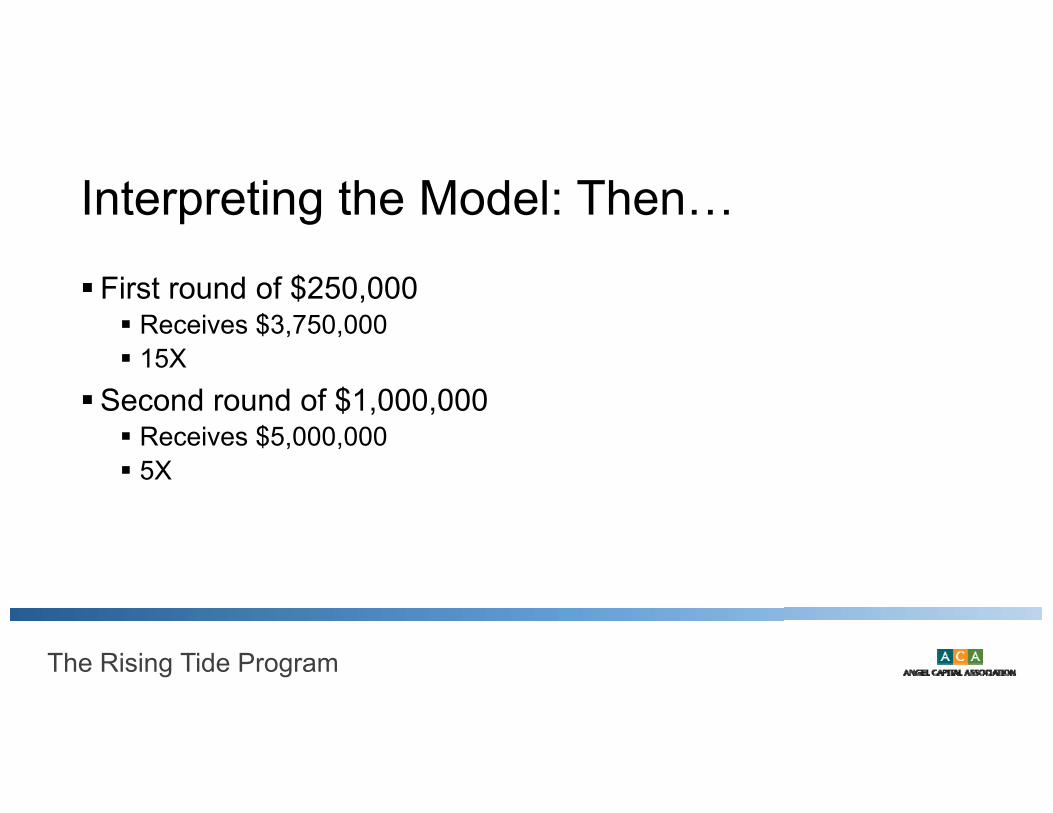
Interpreting the Model: Then…
First round of $250,000 Receives $3,750,000 15X
Second round of $1,000,000 Receives $5,000,000 5X

The Rising Tide Program
If you would like a copy of the Excel spreadsheetEmail [email protected]
I’ll be happy to send you a copy of the Excel file and a short memo on how to use the file

The Rising Tide Program
Learn More About Cap Tables• ACA Webinar on September 14, 2016 – Noon to 1:00 pm Eastern• The Basics of Cap Tables• Instructor: Trevor Chaplick, Greenberg Traurig• Free registration via www.angelcapitalassociation.org/webinars• On live program, you can ask questions• Also archived for future viewing