introduction to bridge engineering...07-march-2016 lecture # 08 engr. gul-e-hina, ieer, uet lahore 1...
TRANSCRIPT

Engr.Gul-E-HinaLecturer ,
Institute of Environmental Engineering & Research(IEER)University of Engineering and Technology, Lahore
Lecture 8 – Introduction to Water
Supply System

Lecture # 0807-March-2016 1Engr. Gul-E-Hina, IEER, UET Lahore
Water Supply
• In the 17th–18th century, distribution systems utilizingcast-iron pipes, aqueducts, and pumps began to beinstalled.
• The link between polluted water and disease came to beunderstood in the 19th century, and treatment methodssuch as slow sand filtration and disinfection withchlorine were introduced.
• Reservoirs are formed usually by constructing damsnear the collection point of mountain-water runoff oracross rivers.
Introduction

Lecture # 0807-March-2016 1Engr. Gul-E-Hina, IEER, UET Lahore
Water Wholesome
• It should be free from bacteria
• It should be colorless and sparkling
• It should be tasty, odor free and cool
• It should be free from objectionable matter
• It should not corrode pipes
• It should have dissolved oxygen and free from carbonic acid
so that it may remain fresh.
Introduction

Design of Water Supply System

Lecture # 0807-March-2016 1Engr. Gul-E-Hina, IEER, UET Lahore
Introduction

Lecture # 0807-March-2016 1Engr. Gul-E-Hina, IEER, UET Lahore
Requirements:
1. Selection of per capita water consumption(WC)
2. Future population forecast
3. Design period
Introduction

Lecture # 0807-March-2016 1Engr. Gul-E-Hina, IEER, UET Lahore
Water Consumption
• It is amount of water consumed by a community in one day.
• Water consumption expressed as litre per capita per day i.e.
Lpcd.
• According to studies the per capita values varies from 150 to 600 lpcd
and depends from area to area
• For Punjab this values is typically around 270 liters per capita per
day.
Introduction

Lecture # 0807-March-2016 1Engr. Gul-E-Hina, IEER, UET Lahore
Water Consumption
• There are multiple factors that are influencing the
per capita water consumption values i.e. Climate ,
Living standards and culture .
• Water for domestic purpose is needed mainly for:
1. Drinking
2. Washing
3. Cooking
4. House Cleaning
Introduction

Lecture # 0807-March-2016 1Engr. Gul-E-Hina, IEER, UET Lahore
Water Consumption
• Per capita water consumption data is useful for making
estimates of a community’s water demand.
• There are different level of service that are being provided
to consume water.
1. Stand Posts
2. Yard Connection
3. Full Connection
• Public stand posts are preferred when we need to reduce the
cost of supply system and also to minimize the wastewater
generation.
Introduction

Lecture # 0807-March-2016 1Engr. Gul-E-Hina, IEER, UET Lahore
• 12 mm diameter tap when fully open with residual
head of 1.5m at tap can deliver water at rate of
15liters per minute.
• According WHO one such tap can serve 9 people
in one hour at the rate of 100 lpcd. However the
consumption pattern vary based on demands.
• For public stand post a minimum two taps should
be provided each for at least 150 persons.
Studied Facts about Water Consumption

Lecture # 0807-March-2016 1Engr. Gul-E-Hina, IEER, UET Lahore
Classification of Water Consumed according to its Ultimate Use
Water Consumption-Introduction
Sr.
#
Use Source Amount
1. Domestic Houses ,hotels (sanitary,
drinking, washing. bathing,
cooking, gardening, desert
coolers etc.
30-40% of total water
supplied
2. Commercial Markets, office buildings,
dental clinics, private school,
garages, workshops etc.
10-20%
3. Industrial 20-30%
4. Public use Public buildings (town hall,
jail, schools, street washing,
public toilets, gardens)+fire
fighting
10-20%
5. Unaccounted
for
Loss of water through leaks,
unauthorized connections
10-15%
For Lahore >50%

Lecture # 0807-March-2016 1Engr. Gul-E-Hina, IEER, UET Lahore
Typical Water requirements for non domestic
purposes
Water Consumption-Introduction
Purposes Water Requirement
Schools 15-30 liters per student per day
Hospitals 220-300 liters per bed
Hotels 80-120 liters per resident
Restaurants 65-90 liters per seat
Mosques 25-40 liters per visitor
Offices 25-40 liters per person
Cinemas 10-15 liters per seat
Livestock 10-25 liters per head

Lecture # 0807-March-2016 1Engr. Gul-E-Hina, IEER, UET Lahore
Per capita demand distribution for various part of
Punjab
Water Consumption-Introduction
Use Demand
Domestic 135 liters per capita per day
Industrial 40 liters per capita per day
Public 25 liters per capita per day
Fire Demand 15 liters per capita per day
Losses/Theft 55 liters per capita per day
Total = 270 Lpcd

Lecture # 0807-March-2016 1Engr. Gul-E-Hina, IEER, UET Lahore
Definitions
Average Daily Consumption:
• It is the average amount of water consumed by a
community in one day divided by the number of
people served.
Introduction

Lecture # 0807-March-2016 1Engr. Gul-E-Hina, IEER, UET Lahore
Maximum Daily Consumption:
• It is the maximum water consumption during any one day
in the year. It is about 150 to 180% of average day
consumption.
Peak Hourly Consumption:
• The peak consumption during any hour of the year,
excluding fire demand, is called peak hourly consumption.
It is around 150% of the maximum daily consumption
& 225% of the average daily demand.
Introduction

Lecture # 0807-March-2016 1Engr. Gul-E-Hina, IEER, UET Lahore
Ratio used in Lahore (WASA)
For design of water distribution system we usually consider
peak hourly flow and maximum daily flow + fire demand
Variation in water demand
1. Monday : Highest
2. Sunday : Lowest
3. June/July : Highest
4. Dec/Jan : Lowest
Introduction

Lecture # 0807-March-2016 1Engr. Gul-E-Hina, IEER, UET Lahore
• Variation in Water Consumption
Water Consumption-Introduction

Lecture # 0807-March-2016 1Engr. Gul-E-Hina, IEER, UET Lahore
Factors affecting Water Consumption
• Climate
If temperature is more, requirement of water will be more & vice versa.
• Standard of living
More standard of living ,consumption of water will be more.
• Metering
Metering reduces the use and wastage of water because consumer has to
pay and also reduces load on pump etc.
• Quality of Water
If better the quality more will be the consumption of water.
Introduction

Lecture # 0807-March-2016 1Engr. Gul-E-Hina, IEER, UET Lahore
• Size of City
More size more will be the consumption of water.
• Pressure of distribution system
If pressure is high, wastage will be more. System should not be design
for such a high pressure. If system pressure increases from 25-45 psi
,the consumption will increases by 30%.
• Type of Water Supply
If water supply is for 24 hrs, wastage will be more whereas in
intermittent water supply wastage will be less.
• Cost of Water
C = 21 – log Q, where C is the cost in $ per 1000 ft3 of water and Q is
rate of water in 1000 gallon/year
• Level of service
1. Stand post 2.Yard Post 3. Full connection
Introduction

Fire Demand

Lecture # 0807-March-2016 1Engr. Gul-E-Hina, IEER, UET Lahore
The actual amount of water used in a year for fire is very
small, but the rate of flow is large.
Method of Estimation
Where,
F= Fire demand in L/min (F should not exceed 45380 L/min
and should not be less than 1890 L/min)
A=Area of floors in m2
C=A constant, with different values according to construction.
C=1.5 for wood frame construction
C=1.0 for ordinary construction
C= 0.8 for non combustible construction
Fire Demand

Lecture # 0807-March-2016 1Engr. Gul-E-Hina, IEER, UET Lahore
Types :
1. Direct System
2. Mobile System
• Maximum flow required for an individual fire is 45
m3/min
• Fire hydrant serve an area of about 3750 m2.
• Minimum spacing between hydrant should be
approx. 150 m.
Fire Demand

Lecture # 0807-March-2016 1Engr. Gul-E-Hina, IEER, UET Lahore
Storage Requirement for fire fighting
Water storage requirements for fire fighting vary with
the size of city.
Minimum Storage required is for 4 hours.
Maximum Storage required is for 10 hours.

Population Forecasting

Lecture # 0807-March-2016 1Engr. Gul-E-Hina, IEER, UET Lahore
• A community water supply should have available surplus
capacity to account for future population growth and improved
level of service.
• It is self-evident that a large population will use more water
than a small population.
• Water consumption estimates have been historically based on
population projections.
• An analysis of the future demand of a particular community
should always done by considering their present use.
Population Forecasting

Lecture # 0807-March-2016 1Engr. Gul-E-Hina, IEER, UET Lahore
• Consumption should be broken down by classes users (domestic
,commercial, industrial, public), area of city, economic level of the
users, season of the year etc.
• Population forecasting is an important factor for designing water
supply, sewerage and other infrastructural facilities for a city.
• Graphical and Mathematical methods are used for estimating future
population by using past data records that can be obtained from local
census office.
• None of the method is accurate, Engineer has to use his own
judgement for the most applicable method
• Factors such as discovery of oil field, gold mines, industrial
development , migration, epidemics, earth quake may upset all
calculations of future growth
Population Forecasting

Lecture # 0807-March-2016 1Engr. Gul-E-Hina, IEER, UET Lahore
• Water demand is being calculated based on
1. Design Period
2. Present water demand plus 50%
3. Demand based on computed population growth models or
estimates.
Population Growth Factor (table)
Population Forecasting
Design period(Years)
Growth Rate (2%)
Growth Rate (3%)
Growth Rate (4%)
Growth Rate (5%)
10 1.22 1.34 1.48 1.63
15 1.35 1.56 1.80 2.08
20 1.49 1.81 2.19 2.65
Lecture # 0807-March-2016 1Engr. Gul-E-Hina, IEER, UET Lahore
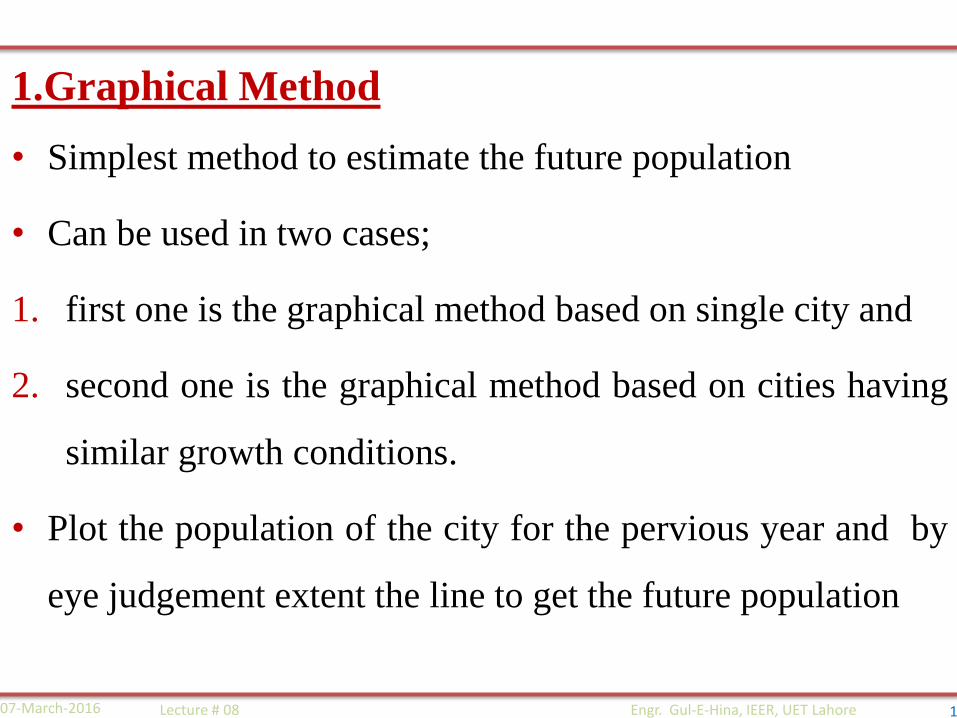
1.Graphical Method
• Simplest method to estimate the future population
• Can be used in two cases;
1. first one is the graphical method based on single city and
2. second one is the graphical method based on cities having
similar growth conditions.
• Plot the population of the city for the pervious year and by
eye judgement extent the line to get the future population

Lecture # 0807-March-2016 1Engr. Gul-E-Hina, IEER, UET Lahore
Graphical method based on a single city:
• In this method, the population of last few decades of existing city is plotted with
respect to time to a suitable scale on graph as shown in a figure below.
• The population curve is smoothly extended for getting future population. This
extension should be done very carefully by considering all factors which effect
population growth in that area and it also requires proper experience and judgment.
• This method is very simple but may not be accurate method for estimating future
population.

Lecture # 0807-March-2016 1Engr. Gul-E-Hina, IEER, UET Lahore
• Graphical method based on similar cities with similar Growth
Pattern
• This technique involves the census populations of cities already developed under
similar conditions are plotted.
• A commonly used variant of this technique includes comparison of the projected
growth of other cities of larger size.
• The cities chosen for comparison should be as similar as possible in terms of
activities ,life styles and culture to some extent with the city being studied.
• This method gives the best estimate of population growth since there is “real-time
analysis” involved.

Lecture # 0807-March-2016 1Engr. Gul-E-Hina, IEER, UET Lahore

Lecture # 0807-March-2016 1Engr. Gul-E-Hina, IEER, UET Lahore
2.Arithmatic Method
• Based on hypothesis that “the rate of growth is constant”.
• A constant increment of growth is added periodically to the
city population.

Lecture # 0807-March-2016 1Engr. Gul-E-Hina, IEER, UET Lahore
2.Arithmatic Method(Contd..)
• Mathematically,
Integrating:
Where,Pf= Future population in year tf
Po = Present Populationto =Present Populationtf =Future Population
𝑲 =𝑷𝟐 − 𝑷𝟏
𝒕𝟐 − 𝒕𝟏P2, P1, t2 & t1 are points on projected population vs time line.

Lecture # 0807-March-2016 1Engr. Gul-E-Hina, IEER, UET Lahore
3.Uniform %age Method or Geometric Growth Method
• Based on hypothesis that “the rate of increase in
population is proportional to the population”.
• Mathematically,

Numericals(Water Demand)

Lecture # 0807-March-2016 1Engr. Gul-E-Hina, IEER, UET Lahore
• Problem 1: Determine the average daily demand of water in cubic meter per
day for a community having a population of 30,000 persons with average
water consumption of 350 lpcd.
• Problem 2: A housing scheme has 50 plots with 5 persons per plot. Per
Capita consumption is assumed to be 550 liter per capita per day. Calculate
total average and maximum demand of scheme?
• Problem 3 :Estimate the peak hourly demand for the population of 68,000
persons, use a total amount of water 7,546,600 m3 during 52 weeks.
• Problem 4: Estimate the average daily rate ,maximum daily rate, and peak
hourly rate for the population of 58,000 persons , use a total amount of
water 9,526,500 m3 during 12 months.
• Problem 5: Calculate maximum daily flow and peak flow of a water use for
a community having 1000 houses , 7 persons per house with an average
water consumption of 350 l/c/d.
• Problem 6: Calculate minimum demand of water for a society having a
population of 29,146 persons with a average water consumption of 400 l/c/d.
Problems-Water Demand & Fire Flow

Lecture # 0807-March-2016 1Engr. Gul-E-Hina, IEER, UET Lahore
Problems-Water Demand & Fire Flow• Problem 7 : City with present population 58000 persons used a total flow
9526600 m3 during last 12 months. On the day of maximum consumption
42000 m3 of water was used .Estimate Qavg, Q max , to be excepted in 10
years when the population is estimated to be 72500 persons.
• Problem 8 : Calculate average daily demand and peak hourly demand for a
city having a 3000 houses, 5 persons per house, 3 schools , 1000 students
per school , 2 commercial building with a floor area of 0.1 hector. The water
consumption is assumed to be 300 L/person/d, 30 L/student/d, and 75
L/m2/d.
• Problem 9: Determine the fire flow required for a three storey building with a
planned area of 700 m2 and wood frame construction. If this building dictates a fire
flow for the community of 78000 persons with the average water consumption of
350 Lpcd. What will be the maximum daily demand including fire flow.
• Problem 10 :Determine the fire flow required for the community of 22000 person
has an average consumption of 600 lpcd. The fire flow is dictated by a building of
ordinary construction with a floor area of 1000 m2 and height of 6 stories. Find total
flow required during the day of fire.

Lecture # 0807-March-2016 1Engr. Gul-E-Hina, IEER, UET Lahore
Problem 11: Determine the Peak hourly requirement of water and total flow for a
community of population 30,000 persons and average consumption of 350 lpcd, during
a peak hour flow , the fire demand flow is maintained for 3 hrs per day for the building
of ordinary construction with floor area of 1000m2 and the height is 3 stories.
Problem 12: A three storey wooden frame building has each floor area : a) 900 m2 b)
700 m2 c) 400 m2 .Determine fire flow and total daily amount of flow for maximum
duration of fire flow.
Problem13: Community with a population of 50000 persons has an average
consumption of 550 lpcd. Fire flow is dedicated by 2 storey building of wooden
structure with a floor area of 1000m2 and 500m2 .Find the total flow required for this
day.
Problem14: Estimate the water requirement for the following communities a) 20000
persons with 150 lpcd b) 55000 persons with 170 lcpd c) 120000 persons with 610
lpcd, having 7 storey building with a)Ordinary construction b)wood construction for
each community (Each floor area=1000 m2. )
Problems-Water Demand & Fire Flow

Lecture # 0807-March-2016 1Engr. Gul-E-Hina, IEER, UET Lahore
Problem 15: Determine the required fire flow for a 3-storey wood frame
building covering 700 m2 which connects with a 5- storey building of
fire resistive construction covering 900 m2.
Problem 16: Calculate the required maximum daily demand , fire flow
and total flow for a society having 5000 single storey houses covering
1000 m2 of area with 500 m2 of basement. Each house contains 10
persons wit average water consumption of 450 lpcd. (C=1)
Problems-Water Demand & Fire Flow

Lecture # 0807-March-2016 1Engr. Gul-E-Hina, IEER, UET Lahore
• Problem 17: Predict the population for the years 1981, 1991, 1994,
and 2001 from the following census figures of a town by different
methods
Problem-Population Forecasting
Year Population:
(thousands)
Arithmetic
Increment per
year(K)
Geometric Increment per
year(K)
1901 60 - -1911 651921 631931 721941 791951 891961 971971 120
Averages -

Lecture # 0807-March-2016 1Engr. Gul-E-Hina, IEER, UET Lahore
Problem 18: A city had a population of 210000 in 1991 and 240000 in
2001.If the city is assumed to follow arithmetic rate of growth find the
population of the city in 2018
Problem 19: Present (2015) population of city is 1350000 and it is
expected to grow at a uniform rate of 3% per annum. Find its population
in 2033.
Problem 20:A community has experienced the growth in population and
water use as shown in table. Estimate the population ,per-capita water
use and average daily water demand in the year 2030
Problem-Population Forecasting
year 1979 1980 1990 2000 2010 2030
population 8000 8990 11300 14600 18400 ?
WC(m3/d) 2270 2720 3630 4970 6600 ?

Lecture # 0807-March-2016 1Engr. Gul-E-Hina, IEER, UET Lahore
Problem 21:A community is expected to reach a population of 35000 in
20 yrs. It has present population of 28000 with average water
consumption of 16x106 lit/day. The existing water treatment plant has a
design capacity of 19000 m3/day.
Assume an arithmetic rate of population growth. Determine in which
year the existing plant will reach its design capacity.
Assume the plant to be designed on max. daily consumption.

Population Vs time(Prob – 20)
0
2000
4000
6000
8000
10000
12000
14000
16000
18000
20000
1965 1970 1975 1980 1985 1990 1995 2000 2005 2010 2015
Population
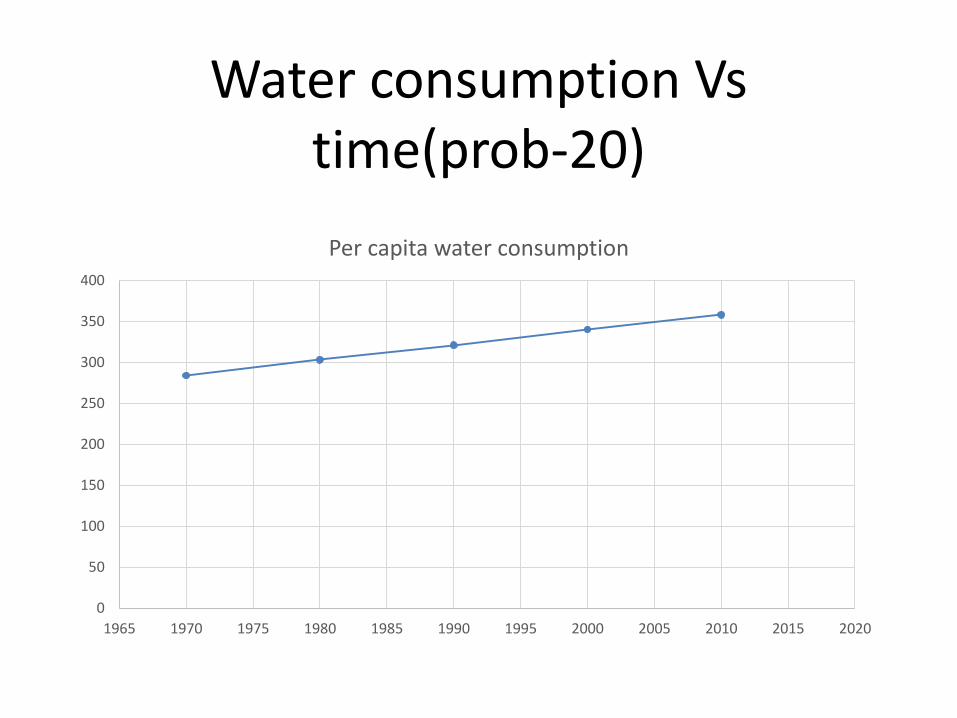
Water consumption Vs time(prob-20)
0
50
100
150
200
250
300
350
400
1965 1970 1975 1980 1985 1990 1995 2000 2005 2010 2015 2020
Per capita water consumption