introduction to biostatistics (pubhlth 540) multiple random variables
DESCRIPTION
Introduction to Biostatistics (PUBHLTH 540) Multiple Random Variables. Multiple Random Variables. Linear Combinations of Random Variables Expected Value Variance Stochastic Models Covariance of two Random Variables Independence Correlation. An Example. - PowerPoint PPT PresentationTRANSCRIPT

11
Introduction to Biostatistics (PUBHLTH 540)Introduction to Biostatistics (PUBHLTH 540) Multiple Random Multiple Random
VariablesVariables

22
Multiple Random VariablesMultiple Random Variables
Linear Combinations of Linear Combinations of Random VariablesRandom Variables– Expected ValueExpected Value– VarianceVariance
Stochastic ModelsStochastic Models Covariance of two Random Covariance of two Random
VariablesVariables IndependenceIndependence CorrelationCorrelation

33SPH&HS, UMASS AmherstSPH&HS, UMASS Amherst 33
An ExampleAn Example Choose a Simple Random Sample with Replacement of size Choose a Simple Random Sample with Replacement of size
n=2 from a Population of N=3n=2 from a Population of N=3 Observe:Observe:
– 1 Response (i.e. Age) on each Subject in the Sample1 Response (i.e. Age) on each Subject in the Sample Question: Question:
– What is the average age of subjects in the population?What is the average age of subjects in the population?
Use the sample mean to estimate the Population Average Use the sample mean to estimate the Population Average AgeAge
Daisy Lily Rose
Introducing….

44SPH&HS, UMASS AmherstSPH&HS, UMASS Amherst 44
PopulationPopulation

55
Population of N=3Population of N=3
Note: Note: Population meanPopulation mean
Variance.Variance.
ID ID (s)(s)
SubjectSubject Response Response (Age)(Age)
11 DaisyDaisy 2525
22 LilyLily 3232
33 RoseRose 3333
22
1
1 3812.67
3
N
ii
xN

66
Pick SRS with Replacement of Pick SRS with Replacement of n=2n=2
a random variable representing a random variable representing the 1the 1stst selection selection
ID (s)ID (s) SubjectSubject ResponsResponsee
11 DaisyDaisy 2525
22 LilyLily 3232
33 RoseRose 3333
1Y
i=1,…,n=2
2Ya random variable representing a random variable representing
the 2nd selectionthe 2nd selection

77
Use as an Estimator: Sample Use as an Estimator: Sample MeanMean
1
1 2
1
1 1 1...
n
ii
n
Y Yn
Y Y Yn n n
A Linear Estimator- a sum of random variables
When n=2,1 2
1
2
1 1
2 2
1 1
2 2
Y Y Y
Y
Y
c Y
11 1
2c
1
2
Y
Y
Y
11
12
c

88
Linear Combination of Random VariablesLinear Combination of Random Variables Example: Sample Mean Example: Sample Mean
1
1 2
1
2
1
1 1 1...
11 1 1
n
ii
n
n
Y Yn
Y Y Yn n n
Y
Y
n
Y
c Y
1nn
c 1
1 2 nY Y Y Y

99
Models for ResponseModels for Response
2 32y
3 3 (=N)(=N)
22
11
ID (s)ID (s)
LilyLily
RoseRose
DaisyDaisy
ResponsResponsee
SubjectSubject
1 25y
3 33y
s sy s
30 5
23
3030
s sy Non-Stochastic model (Deterministic)
i iY E Stochastic model

1010SPH&HS, UMASS AmherstSPH&HS, UMASS Amherst 1010
Finite PopulationFinite Population
i iY E
1i 2i
1Y
2Y
Pick a SRS with replacement of size n=2
1E 2E
Stochastic model

1111SPH&HS, UMASS AmherstSPH&HS, UMASS Amherst 1111
Finite PopulationFinite Population
i iY E
1i 2i
1Y
with replacement
1 1y
1E 2Y 2E
Stochastic model

1212SPH&HS, UMASS AmherstSPH&HS, UMASS Amherst 1212
Finite PopulationFinite Population
i iY E
1i 2i
with replacement
1 1y
2Y 2E
2 2y
Stochastic model

1313SPH&HS, UMASS AmherstSPH&HS, UMASS Amherst 1313
Sampling- n=2Sampling- n=2
1 1Y E 1i 2i
with replacement
2 2Y E
Random Variables
1
1 n
ii
Y Yn
c Y
Linear Combination of Random Variables
Stochastic model

1414SPH&HS, UMASS AmherstSPH&HS, UMASS Amherst 1414
Sampling- n=2Sampling- n=2
1i 2i
with replacement
1 1Y y
1 1 y Realized Values
2 2Y y
2 2 y

1515SPH&HS, UMASS AmherstSPH&HS, UMASS Amherst 1515
Other Possible SamplesOther Possible Samples
1i 2i
with replacement
1 1 y 2 2 y

1616SPH&HS, UMASS AmherstSPH&HS, UMASS Amherst 1616
Other Possible SamplesOther Possible Samples
1i 2i
with replacement
1 1 y 2 2 y

1717
Sample (t) Probability
1 1/9 25 25
2 1/9 25 32
3 1/9 25 33
4 1/9 32 25
5 1/9 32 32
6 1/9 32 33
7 1/9 33 25
8 1/9 33 32
All Possible Samples
1 1Y y 2 2Y y

1818
Sample (t) Probability
1 1/9 25 25 2.78 2.78
2 1/9 25 32 2.78 3.56
3 1/9 25 33 2.78 3.67
4 1/9 32 25 3.56 2.78
5 1/9 32 32 3.56 3.56
6 1/9 32 33 3.56 3.67
7 1/9 33 25 3.67 2.78
8 1/9 33 32 3.67 3.56
9 1/9 33 33 3.67 3.67
1 1Y y 2 2Y y 1 1 1P Y y y 2 2 2P Y y y
1 30E Y 2 30E Y
1
T
i i i it
E Y P Y y y
Expected Values

1919
Sample (t) Probability
1 1/9 25 -5 25
2 1/9 25 -5 25
3 1/9 25 -5 25
4 1/9 32 2 4
5 1/9 32 2 4
6 1/9 32 2 4
7 1/9 33 3 9
8 1/9 33 3 9
9 1/9 33 3 9
0.00 12.67
1 1Y y
2
1
varT
i i i it
Y P Y y y
iy 2
iy
1var Y

2020
2 2Y y
2
1
varT
i i i it
Y P Y y y
iy 2
iy
2var YSample
(t) Probability
1 1/9 25 -5 25
2 1/9 32 2 4
3 1/9 33 3 9
4 1/9 25 -5 25
5 1/9 32 2 4
6 1/9 33 3 9
7 1/9 25 -5 25
8 1/9 32 2 4
9 1/9 33 3 9
0.00 12.67

2121
1 2 1 1 2 2 1 1 2 21
cov , ;T
t
Y Y P Y y Y y y E Y y E Y
Covariance of Two Random Variables
1
cov , ;T
t
Y Z P Y y Z z y E Y z E Z

2222
Sample (t) Probability
1 1/9 25 25 -5 -5 25
2 1/9 25 32 -5 2 -10
3 1/9 25 33 -5 3 -15
4 1/9 32 25 2 -5 -10
5 1/9 32 32 2 2 4
6 1/9 32 33 2 3 6
7 1/9 33 25 3 -5 -15
8 1/9 33 32 3 2 6
9 1/9 33 33 3 3 9
1 2 1 1 2 2 1 1 2 21
cov , ;T
t
Y Y P Y y Y y y E Y y E Y
1 1Y y 2 2Y y 1y 2y 1 2y y
1 2cov , 0Y Y
Based on simple random sampling with replacement

2323
Variance MatrixVariance Matrix
When n=2, and SRS with replacement:When n=2, and SRS with replacement:
1 1 21
1 2 22
var cov ,var
cov , var
Y Y YY
Y Y YY
21
22
2
0var
0
1 0
0 1
Y
Y
2
1 0
0 1
I
Identity Matrix

2424
Variance Matrix for n Random Variance Matrix for n Random VariablesVariables
1 1 1 2 1
2 1 2 2 2
1 2
var cov , cov ,
cov , var cov ,var
cov , cov , var
n
n
n n n n
Y Y Y Y Y Y
Y Y Y Y Y Y
Y Y Y Y Y Y

2525
Covariance of Random Variables When SRS Covariance of Random Variables When SRS without Replacment (n=2)without Replacment (n=2)
1 2 1 1 2 2 1 1 2 21
cov , ;T
t
Y Y P Y y Y y y E Y y E Y
Sample
(t) Probability
1 1/6 25 32 -5 2 -10
2 1/6 25 33 -5 3 -15
3 1/6 32 25 2 -5 -10
4 1/6 32 33 2 3 6
5 1/6 33 25 3 -5 -15
6 1/6 33 32 3 2 6
1 1Y y 2 2Y y 1y 2y 1 2y y
1 2cov , 6.33Y Y

2626
Covariance of two random variables when Covariance of two random variables when sampling without replacementsampling without replacement
2
cov ,1i jY Y
N
1
2 2
1 11
1 11 1
1var 1 1
1 11
1 1
n
N NY
YN N
Y
N N
2727
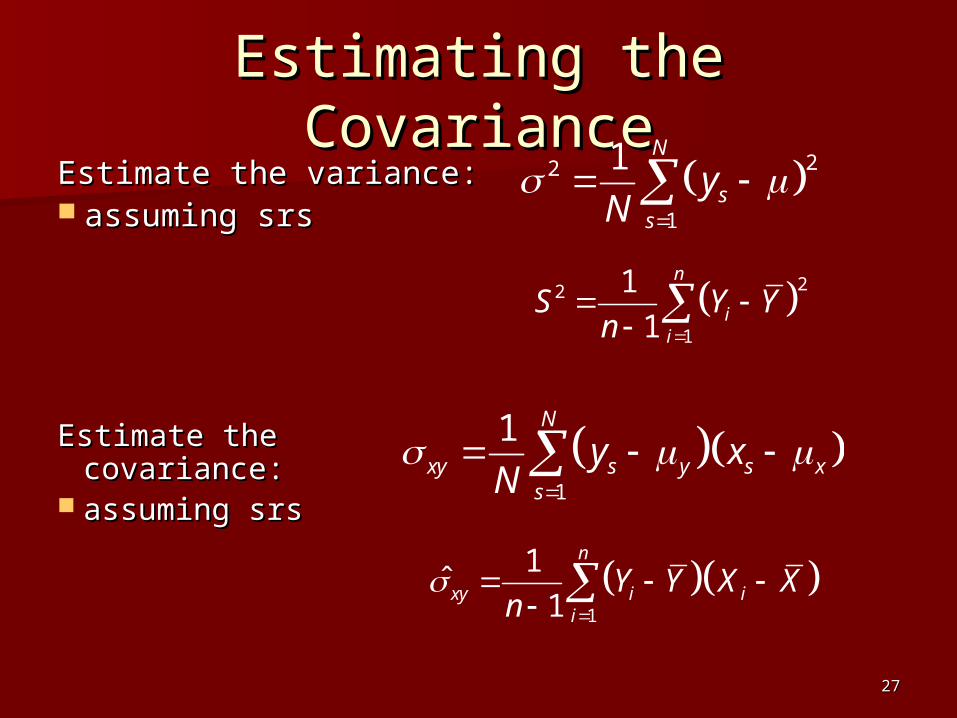
Estimating the CovarianceEstimating the CovarianceEstimate the variance: Estimate the variance: assuming srsassuming srs
22
1
1 N
ss
yN
22
1
1
1
n
ii
S Y Yn
Estimate the Estimate the covariance: covariance:
assuming srsassuming srs
1
1 N
xy s y s xs
y xN
1
1ˆ
1
n
xy i ii
Y Y X Xn

2828
IndependenceIndependence
Two random variables, Y and Z are Two random variables, Y and Z are independent ifindependent if
P(Y=y|Z=z)=P(Y=y)P(Y=y|Z=z)=P(Y=y)
P(Y=y|Z=z) means the probability that Y P(Y=y|Z=z) means the probability that Y has a value of y, given Z has a value of has a value of y, given Z has a value of zz
(see Text, sections 6.1 and 6.2) (see Text, sections 6.1 and 6.2)

2929
Example: SRS with rep n=2Example: SRS with rep n=2
AreAre 2Yandand independent?independent?
2 2 1 1 2 2|P Y y Y y P Y y DoesDoes ??
ID (s)ID (s) SubjectSubject ResponsResponsee
11 DaisyDaisy 2525
22 LilyLily 3232
33 RoseRose 3333
1Y

3030SPH&HS, UMASS AmherstSPH&HS, UMASS Amherst 3030
Sampling n=2 (with rep)Sampling n=2 (with rep)
1i 2i
1 1y
1 1Y E
1 1 1/ 3Y yP 1 1 1/ 3P Y y 1 1 1/ 3Y yP
2 2Y E
2 2 1/ 3Y yP 2 2 1/ 3P Y y 2 2 1/ 3Y yP
2 2 1 1|P Y y Y y
AreAre 2Yandand independent?independent?1Y
2 2 1 1| 1 / 3P y yY Y 2 2 1 1| ?P Y y Y y YesYes

3131SPH&HS, UMASS AmherstSPH&HS, UMASS Amherst 3131
Sampling n=2 (with rep)Sampling n=2 (with rep)
1i 2i
1 1y
1 1Y E
1 1 1/ 3Y yP 1 1 1/ 3P Y y 1 1 1/ 3Y yP
2 2Y E
2 2 1/ 3Y yP 2 2 1/ 3P Y y 2 2 1/ 3Y yP
2 2 1 1|P Y y Y y
AreAre 2Yandand independent?independent?1Y
2 2 1 1| 1 / 3P y yY Y 2 2 1 1| ?P Y y Y y YesYes

3232SPH&HS, UMASS AmherstSPH&HS, UMASS Amherst 3232
Sampling n=2 (with rep)Sampling n=2 (with rep)
1i 2i
1 1y
1 1Y E
1 1 1/ 3Y yP 1 1 1/ 3P Y y 1 1 1/ 3Y yP
2 2Y E
2 2 1/ 3Y yP 2 2 1/ 3P Y y 2 2 1/ 3Y yP
2 2 1 1|P Y y Y y
AreAre 2Yandand independent?independent?1Y
2 2 1 1| 1 / 3P y yY Y 2 2 1 1| ?P Y y Y y YesYes

3333
Example: SRS without rep Example: SRS without rep n=2n=2
AreAre 2Yandand independent?independent?
2 2 1 1 2 2|P Y y Y y P Y y DoesDoes ??
ID (s)ID (s) SubjectSubject ResponsResponsee
11 DaisyDaisy 2525
22 LilyLily 3232
33 RoseRose 3333
1Y

3434SPH&HS, UMASS AmherstSPH&HS, UMASS Amherst 3434
Sampling n=2 (without replacement)Sampling n=2 (without replacement)
1i 2i
1 1y
1 1Y E
1 1 1/ 3Y yP 1 1 1/ 3P Y y 1 1 1/ 3Y yP
2 2Y E
2 2 1/ 3Y yP 2 2 1/ 3P Y y 2 2 1/ 3Y yP
2 2 1 1|P Y y Y y
AreAre 2Yandand independent?independent?1Y
2 2 1 1| 0P Y Yy y 2 2 1 1| ?P Y y Y y NoNo

3535SPH&HS, UMASS AmherstSPH&HS, UMASS Amherst 3535
1i 2i
1 1y
1 1Y E
1 1 1/ 3Y yP 1 1 1/ 3P Y y 1 1 1/ 3Y yP
2 2Y E
2 2 1/ 3Y yP 2 2 1/ 3P Y y 2 2 1/ 3Y yP
2 2 1 1|P Y y Y y
AreAre 2Yandand independent?independent?1Y
2 2 1 1| 1 / 2P y yY Y 2 2 1 1| ?P Y y Y y NoNo
Sampling n=2 (without replacement)Sampling n=2 (without replacement)

3636SPH&HS, UMASS AmherstSPH&HS, UMASS Amherst 3636
Sampling n=2 (without replacement)Sampling n=2 (without replacement)
1i 2i
1 1y
1 1Y E
1 1 1/ 3Y yP 1 1 1/ 3P Y y 1 1 1/ 3Y yP
2 2Y E
2 2 1/ 3Y yP 2 2 1/ 3P Y y 2 2 1/ 3Y yP
2 2 1 1|P Y y Y y
AreAre 2Yandand independent?independent?1Y
2 2 1 1| 1 / 2P y yY Y 2 2 1 1| ?P Y y Y y NoNo

3737
Relationship between Relationship between Independence and CovarianceIndependence and Covariance
If two random variables are If two random variables are independent, then their covariance is independent, then their covariance is 0.0.
If the covariance of two random If the covariance of two random variables is zero, the two may (or variables is zero, the two may (or may not) be independentmay not) be independent

3838
Expected Value of a Linear Combination of Expected Value of a Linear Combination of Random VariablesRandom Variables
Write linear combinations using vector notationWrite linear combinations using vector notation..
1
1
2
1
11 1 1
n
ii
n
Y Yn
Y
Y
n
Y
c Y
1
nn c 1
1 2 nY Y Y Y
Constants
Random variables

3939
E Y E
E
c Y
c Y
1 2 nE E Y E Y E Y Y where
Example: SRS of size n:
1
111 1 1
11 1 1
n
E Y E
E Y
E Y
n
E Y
n
c Y

4040
Example 2: Suppose two independent SRS w/o replacement are selected from populations of boy and girl babies, and the weight recorded. Let us represent the boy weight by Y and the girl weight by X. Suppose sample results are given as follows:
BoysBoys
n=25n=25GirlsGirls
n=40n=40Sample Sample MeanMean
VariancVariancee
Y X
2y 2
x
An estimate is wanted of the average birth weight in Europe, where for every 1000 births, 485 are girls, while 515 are boys.
Write a linear combination that can be used to construct an estimator.
0.485 0.515
0.485 0.515
Z X Y
X
Y

4141
Variance of a Linear Combination of Variance of a Linear Combination of Random VariablesRandom Variables
var var c Y c Y c
2
1
2 c 1 1 2Y Y Y
Constants Random variables
Example: Sample mean, n=2 srs with replacement
1
2
2
2
11 1var 1 1 var
12 2
1011 1
14 0
Y
Y
c Y

4242
Matrix MultiplicationMatrix Multiplication
1 2 1 2 1 2
a bc c c a c d c b c e
d e
2
2
2 2
2
2
101var 1 1
14 0
11
14
12
4
2
c YHence
4343
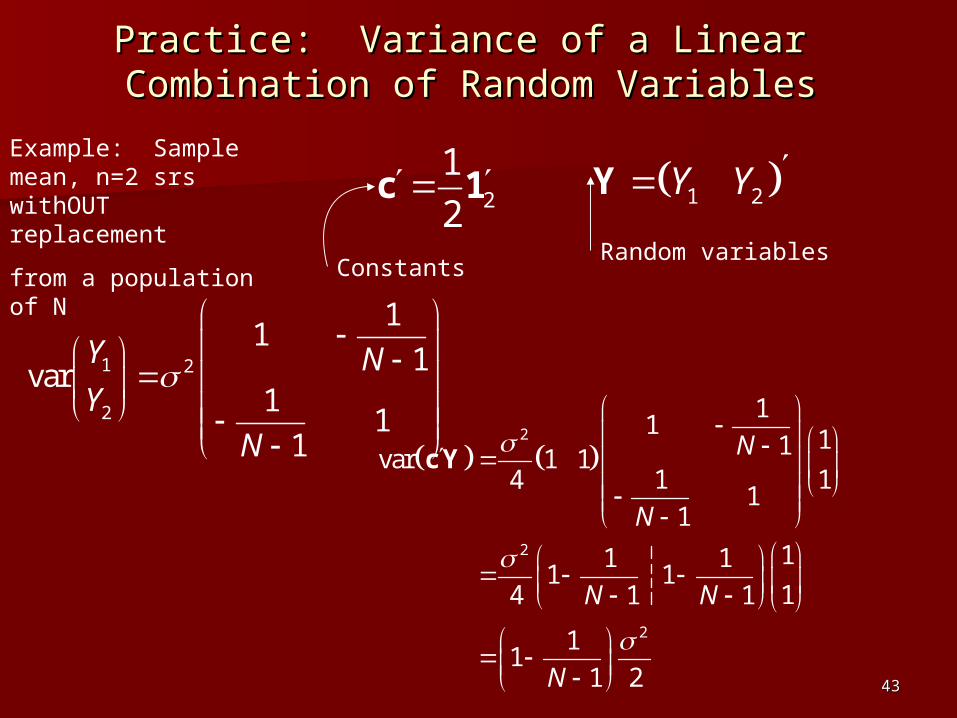
Practice: Variance of a Linear Combination Practice: Variance of a Linear Combination of Random Variablesof Random Variables
2
1
2 c 1 1 2Y Y Y
ConstantsRandom variables
Example: Sample mean, n=2 srs withOUT replacement
from a population of N
2
2
2
11
11var 1 11 14
11
11 11 1
14 1 1
11
1 2
N
N
N N
N
c Y
1 2
2
11
1var1
11
Y NY
N

4444
Correlation (see 17.1, 17.2 in text)Correlation (see 17.1, 17.2 in text)
The correlation between two random The correlation between two random variables is defined as variables is defined as
cov ,
var var
X Y
X Y
Based on a simple random sample, Based on a simple random sample, we estimate the correlation by we estimate the correlation by
2 2
ˆ xy
x y
rS S
1
1ˆ
1
n
xy i ii
X X Y Yn
22
1
1
1
n
x ii
S X Xn
22
1
1
1
n
y ii
S Y Yn