introduction to biostatistics
TRANSCRIPT

INTRODUCTION TO BIOSTATISTICS

Oleg Devinyak, UzhNU
Common statistical terms
Data Measurements or observations of a variable
Variable A characteristic that is observed or manipulated Can take on different values
Oleg Devinyak, UzhNU
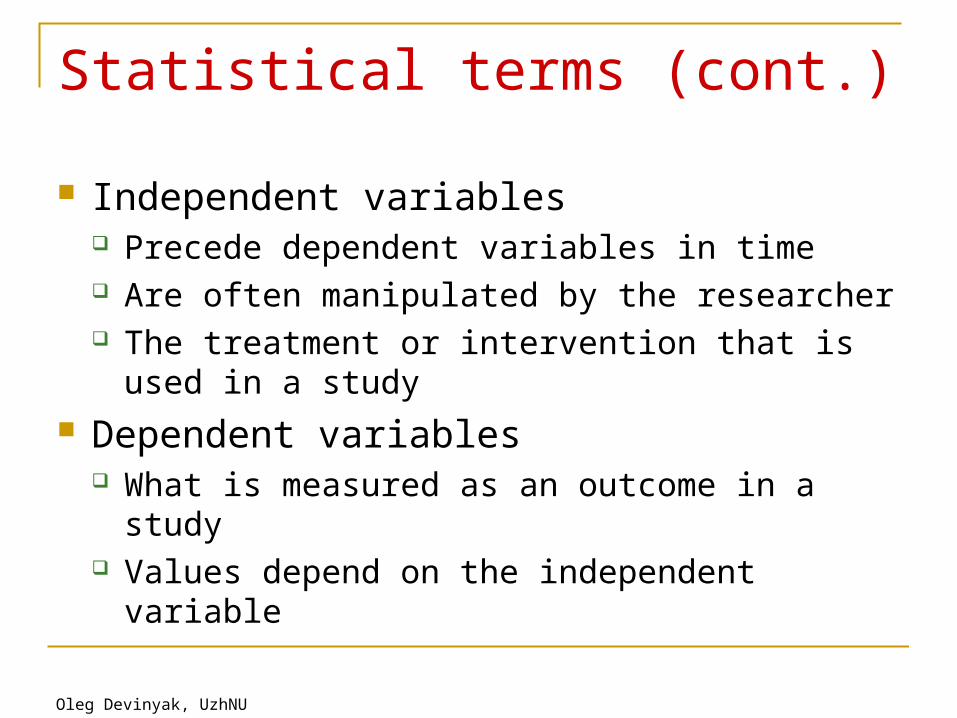
Statistical terms (cont.)
Independent variables Precede dependent variables in time Are often manipulated by the researcher The treatment or intervention that is used in a
study Dependent variables
What is measured as an outcome in a study Values depend on the independent variable

Oleg Devinyak, UzhNU
Population and parameters
Population (statistical aggregate, statistical totality) A group of individuals that we would like to know something
about Parameter
A characteristic of the population in which we have a particular interest Often denoted with Greek letters (μ, σ, ρ) Examples:
The proportion of the population that would respond to a certain drug
The association between a risk factor and a disease in a population
Oleg Devinyak, UzhNU
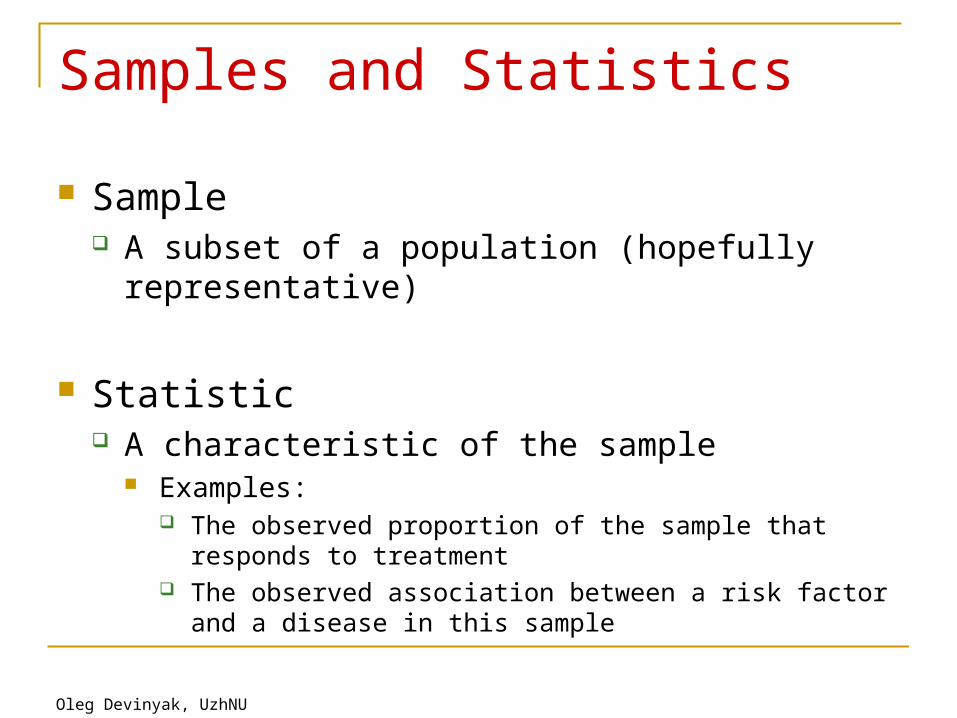
Samples and Statistics
Sample A subset of a population (hopefully representative)
Statistic A characteristic of the sample
Examples: The observed proportion of the sample that responds to
treatment The observed association between a risk factor and a
disease in this sample
Oleg Devinyak, UzhNU
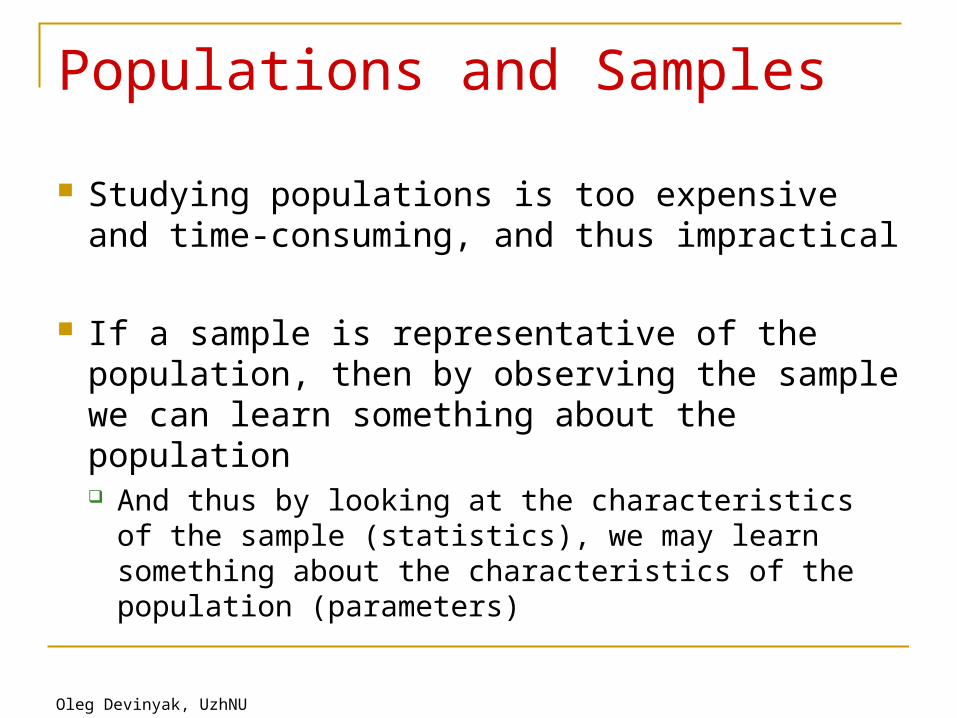
Populations and Samples
Studying populations is too expensive and time-consuming, and thus impractical
If a sample is representative of the population, then by observing the sample we can learn something about the population And thus by looking at the characteristics of the
sample (statistics), we may learn something about the characteristics of the population (parameters)

Oleg Devinyak, UzhNU
Random samples
Subjects are selected from a population so that each individual has an equal chance of being selected
Random samples are representative of the source population
Non-random samples are not representative May be biased regarding age, severity of the
condition, socioeconomic status etc.
Oleg Devinyak, UzhNU
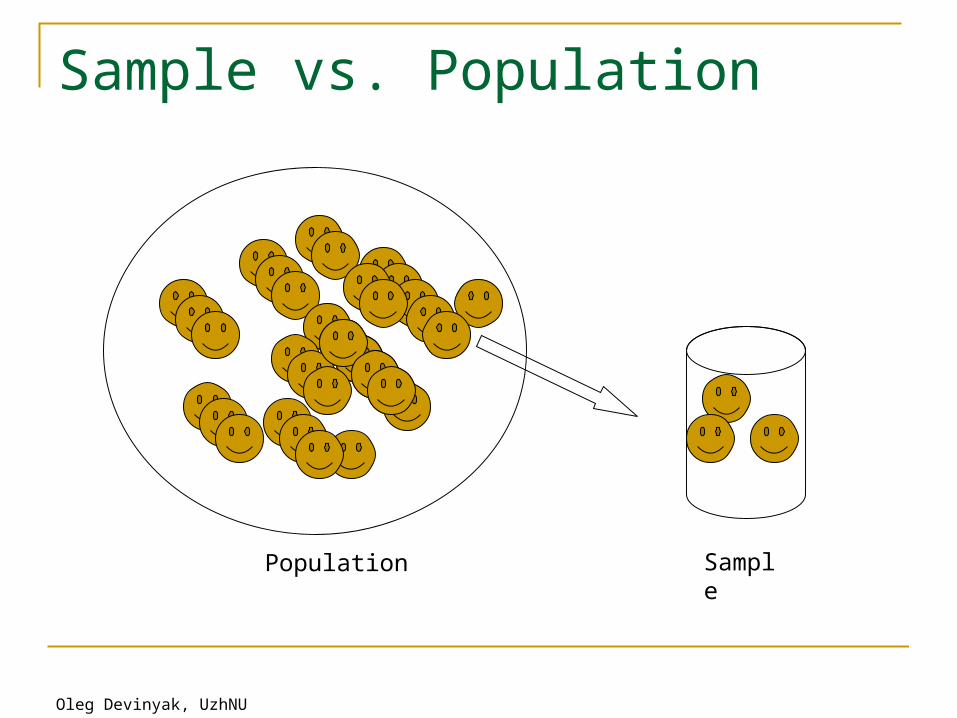
Sample vs. Population
Population Sample
Oleg Devinyak, UzhNU
Statistical Analyses
Two steps Descriptive Statistics
Describe the sample Inference
Make inferences about the population using what is observed in the sample
Primarily performed in two ways: Hypothesis testing Estimation
Oleg Devinyak, UzhNU
Issues
Samples are random If we had chosen a different sample, then we
would obtain different statistics (sampling variation or random variation) However, note that we are trying to estimate the same
(constant) population parameters

Oleg Devinyak, UzhNU
Descriptive Statistics
Describe the Sample Begin one variable at a time Describe important variables in your analyses
(e.g., endpoints, demographics, confounders, etc.)
Oleg Devinyak, UzhNU
Types of Data
Several types of data Nominal Ordinal Discrete Continuous Time-to-event with censoring
The type of data influences the analysis methods to be employed

Oleg Devinyak, UzhNU
Nominal Data
Mutually exclusive unordered categories
Examples Sex (male, female) Race/ethnicity (white, black, latino, asian, native american,
etc.) Site
Can summarize in: Tables – using counts and percentages Bar chart/graph
Oleg Devinyak, UzhNU
Ordinal Data
Ordered Categories
Examples Adverse events
Mild, moderate, severe, life-threatening, death Income
Low, medium, high
Oleg Devinyak, UzhNU
Discrete Data
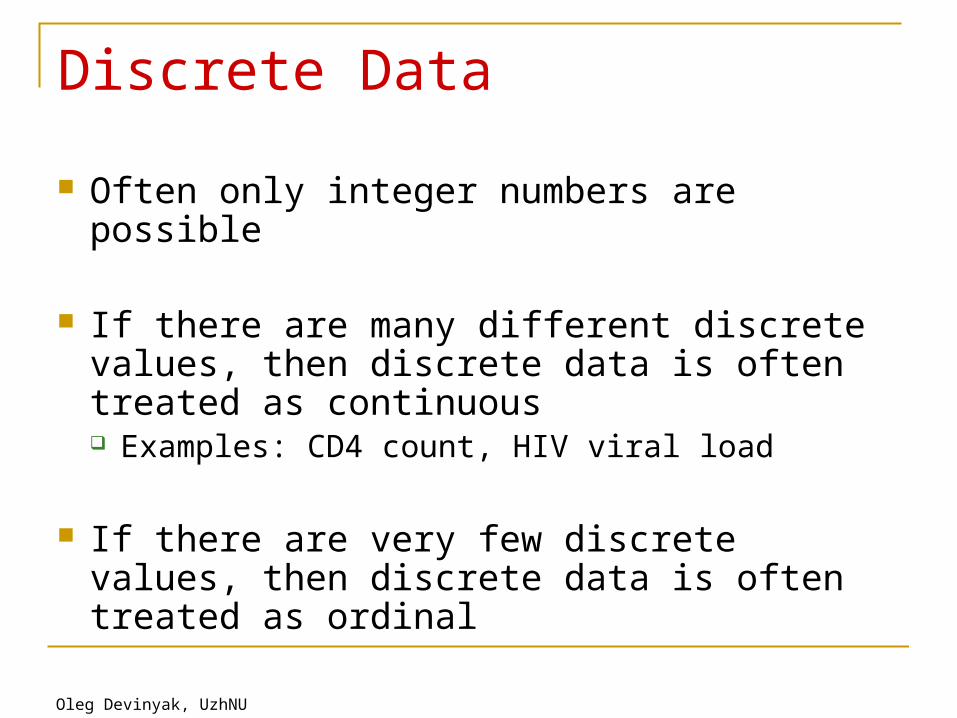
Often only integer numbers are possible
If there are many different discrete values, then discrete data is often treated as continuous Examples: CD4 count, HIV viral load
If there are very few discrete values, then discrete data is often treated as ordinal

Oleg Devinyak, UzhNU
Continuous Data
Any value on the continuum is possible (even fractions or decimals)
Examples: Height Weight Many “discrete” variables are often treated as
continuous Examples: CD4 count, viral load
Oleg Devinyak, UzhNU
Survival Data
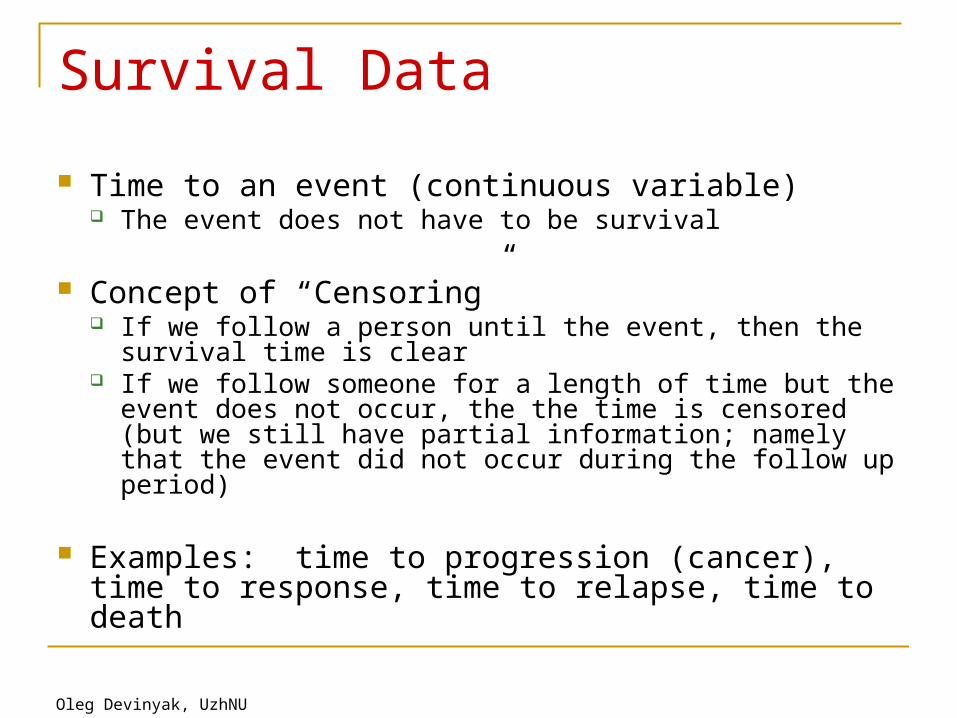
Time to an event (continuous variable) The event does not have to be survival
Concept of “Censoring” If we follow a person until the event, then the survival time
is clear If we follow someone for a length of time but the event
does not occur, the the time is censored (but we still have partial information; namely that the event did not occur during the follow up period)
Examples: time to progression (cancer), time to response, time to relapse, time to death
Oleg Devinyak, UzhNU
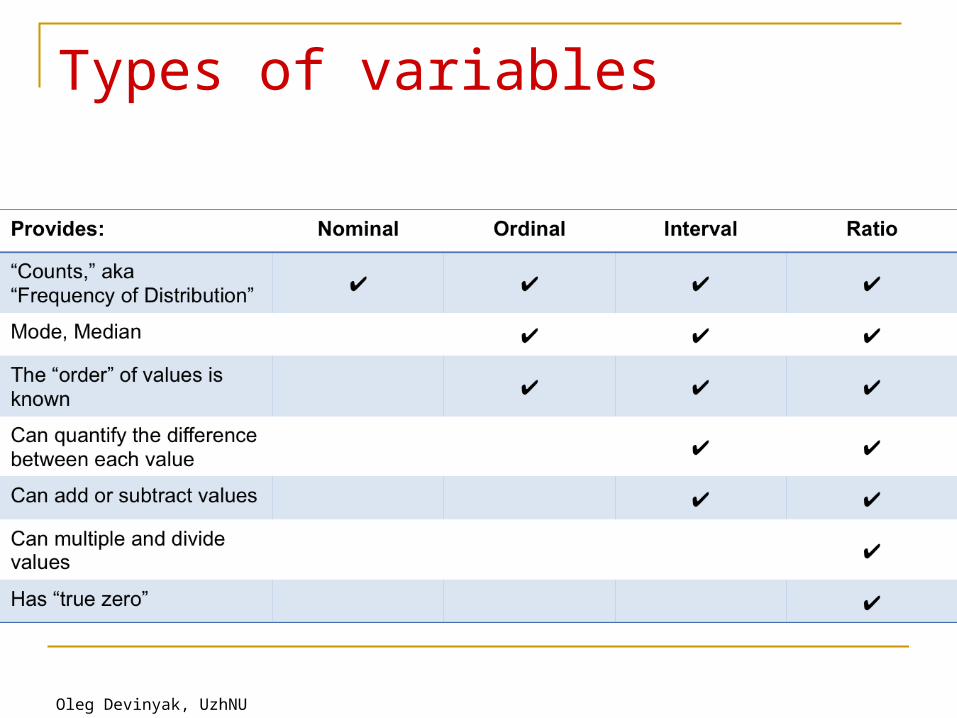
Types of variables
Oleg Devinyak, UzhNU
Dataset Structure
Think of data as a rectangular matrix of rows and columns
Simplest structure Rows represent the “experimental unit” (e.g., person)
Each row is an independent observation Columns represent “variables” measured on the
experimental unit
More complex structures Multiple rows per person (e.g., multiple timepoints)
Oleg Devinyak, UzhNU
Visual Data Summaries
Some visual ways to summarize data (one variable at a time): Tables Graphs
Bar charts Histograms Box plots
Oleg Devinyak, UzhNU
Frequency Tables
Summarizes a variable with counts and percentages
The variable is categorical (e.g., nominal or ordinal)

Oleg Devinyak, UzhNU
Example: Serum Cholesterol Levels
Frequencies of serum cholesterol levels Cumulative Cholesterol level Cumulative Relative Relative (mg/100 ml) Frequency Frequency Frequency (%) Frequency (%) _______________________________________________________________ 80-119 13 13 1.2 1.2 120-159 150 163 14.1 15.3 160-199 442 605 41.4 56.7 200-239 299 904 28.0 84.7 240-279 115 1019 10.8 95.5 280-319 34 1053 3.2 98.7 320-360 9 1062 0.8 99.5 360-399 5 1067 0.5 100.0 _______________________________________________________________ Total 1067 100.0 Note. The choice of intervals (and “cut-off” values) in a frequency table is very important. However, there are no established rules for determining them.
Oleg Devinyak, UzhNU
Graphical Summaries
Bar Graphs Nominal data
No order to horizontal axis
Histograms Continuous or ordinal data on horizontal axis
Box Plots Continuous data

Oleg Devinyak, UzhNU
Bar Chart – Cause of Death
Cause of Death
Motor Vehicle Drowning House Fire Homicide Other
0
20
40
60
Oleg Devinyak, UzhNU
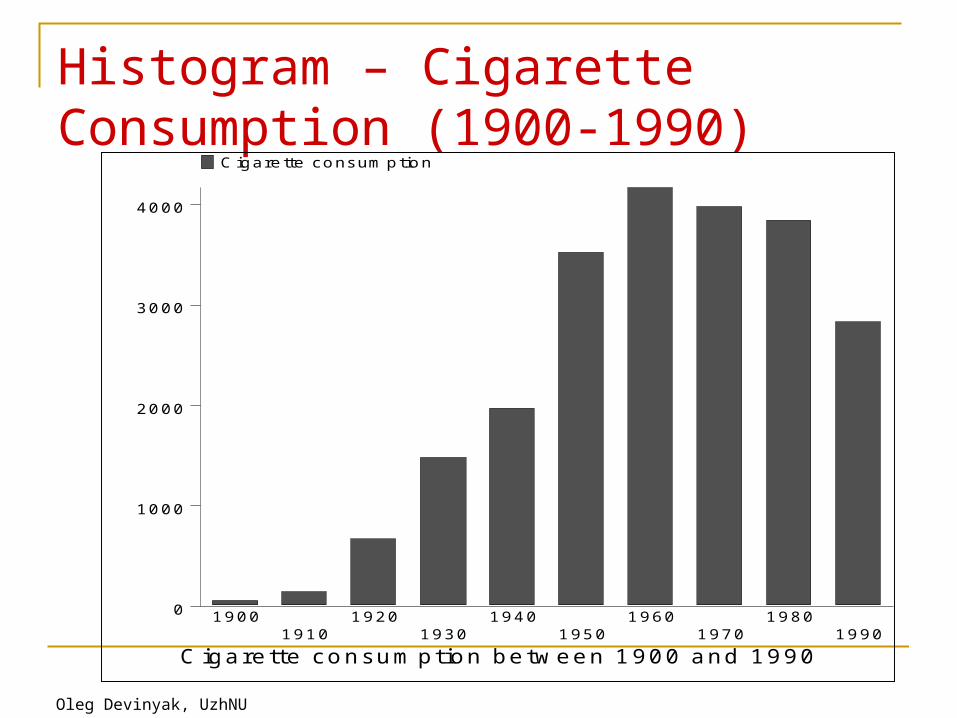
Histogram – Cigarette Consumption (1900-1990)
Cigarette consum ption between 1900 and 1990
0
1000
2000
3000
4000
C igare tte consum ption
19001910
19201930
19401950
19601970
19801990
Oleg Devinyak, UzhNU
Oleg Devinyak, UzhNU
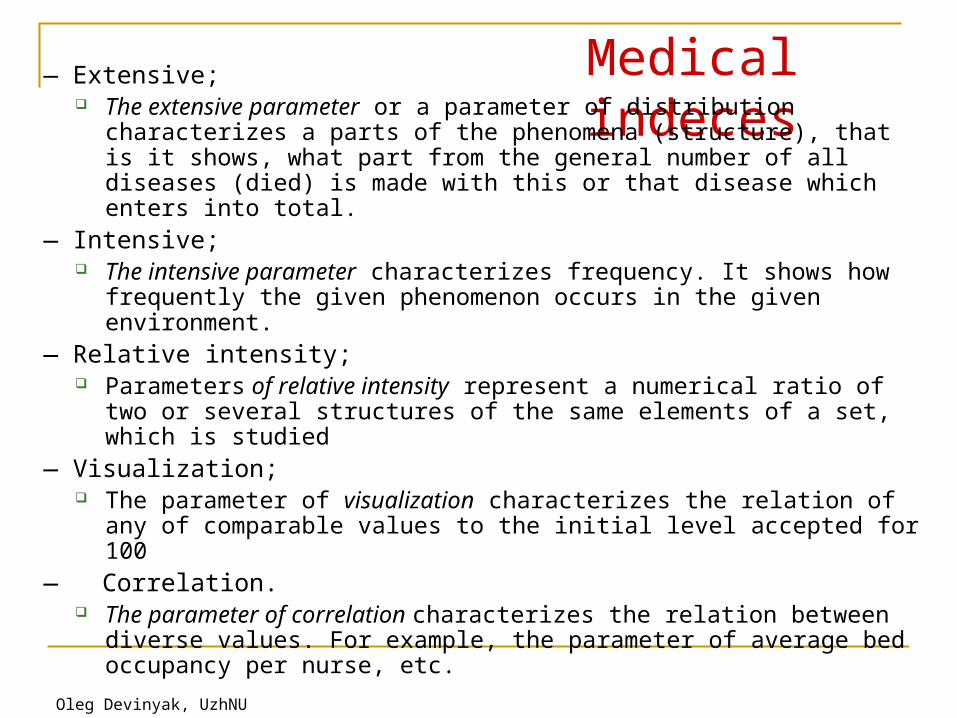
Medical indeces
— Extensive; The extensive parameter or a parameter of distribution characterizes
a parts of the phenomena (structure), that is it shows, what part from the general number of all diseases (died) is made with this or that disease which enters into total.
— Intensive; The intensive parameter characterizes frequency. It shows how
frequently the given phenomenon occurs in the given environment.— Relative intensity;
Parameters of relative intensity represent a numerical ratio of two or several structures of the same elements of a set, which is studied
— Visualization; The parameter of visualization characterizes the relation of any of
comparable values to the initial level accepted for 100— Correlation.
The parameter of correlation characterizes the relation between diverse values. For example, the parameter of average bed occupancy per nurse, etc.

Oleg Devinyak, UzhNU
HOMEWORK
Count all your grades (marks get at exams) and create the corresponding frequency table. Write the table to your copybooks.